energy efficient modernisation of housing: a uk … efficient modernisation of housing: a uk case...
TRANSCRIPT

1
Energy efficient modernisation of housing: A UK Case study.
Malcolm Bell and Robert LoweFaculty of Health and Environment, Leeds Metropolitan University, Calverley Street,
Leeds, LS1 3HE, UK.
Abstract
This paper sets out the results of the York Energy Demonstration Project anddiscusses its implications for the modernisation of low rise housing in the UK. Theproject consisted of three schemes which were carried out in the early to mid 90s andmonitored over a two year period. Results indicate that modernisation schemes have avery important part to play in reducing CO2 emissions and that improvements in theregion of 50% can be achieved at modest cost using well proven (early 1980’s)technology. The possibility of additional improvements are also identified which couldsee emissions fall by a further 30% to 40%. In addition, the project identifiesdifficulties posed by, often small, variations in dwelling construction, which can have adisproportionate impact on costs, and by the design and use of mixed heating systemswhich can reduce overall heating efficiencies. The paper also discusses the impact ofthe demonstration project on the dissemination of good energy efficient practice withinthe Local Authority and highlights the lessons learned for implementation in futuremodernisation schemes.
Keywords: Existing housing; Energy efficiency; Retrofit; York.
1. Introduction
In the last ten to fifteen years the majority of governments around the world havecome to accept the importance of reducing greenhouse gases and since the Kyotoprotocol, signed in December 1997, have intensified their search for ways of makinglarge reductions in emissions. At the heart of many policies is the quest for moreefficient use of energy in all economic sectors. In most countries housing is a majorconsumer of energy and is responsible for a large fraction of national carbon dioxide(CO2 ) emissions. Figures for 1996 show that, in the UK, housing accounted for 28%of national CO2 emissions and was the largest single contributor followed by industryat 27% and transport at 25% [1]. Although the majority of research into energyefficiency improvements in housing has been conducted in the context of newdwellings, it is clear that improvements in the design of the new stock will have onlymarginal effect in the short to medium term. In the UK, demolition rates are low withnew construction adding to, rather than replacing, the dwelling stock. Figures forGreat Britain indicate a net gain of almost 200,000 dwellings per annum and a simplelinear projection of this trend suggests that by the year 2050 the dwelling stock mayhave risen by over 9.5 million dwellings of which the post 2000 stock would constituteonly 30% [2]. Although it is likely that replacement rates may increase, theimprovement of the energy efficiency of existing housing provides an importantopportunity to achieve significant reductions in CO2 emissions over a much shortertime scale than can be achieved by the construction of new dwellings. In addition, if

2
such improvements are carried out at the same time as more general modernisation andrepair works, there are important cost advantages to be gained.
In the early to mid 90s the UK government funded a series of demonstration projectsin local authority housing designed to implement a wide range of energy savingmeasures which could be incorporated into modernisation programmes. Thisprogramme (the Greenhouse Programme) ran from 1991 to 1994 and funded some183 schemes (over 50,000 dwellings) of which the York project was one [3]& [4].
In common with many energy demonstration projects over the last ten years, the YorkProject had two main aims. The first was to confirm that the application of readilyavailable technology could deliver significant energy benefits within the context of aroutine local authority housing modernisation programme. The second was to extractlessons for the operation of future energy conscious modernisation schemes. Thispaper sets out to report the results of the project both in terms of the measured energyand CO2 reductions and the lessons which were learned, together with their impact onfuture modernisation policy.
Figure 1 Typical house type
2. Project description
Housing in the City of York is predominantly low-rise (two and three storey) singlefamily houses of terraced, semi-detached or detached types and is typical of a largeproportion of housing in the UK. The York area has about 75,000 dwellings, the vastmajority of which (73%) are owner occupied. Some 9,500 are owned by the LocalAuthority (15%) and the remainder rented either from private landlords or from ahousing association. The demonstration project involved around 230 local authoritydwellings which were in need of modernisation. The construction of the houses wastypical of about 75% of the local authority stock and about 60% of the stock in Yorkas a whole. Figure 1 shows a house which is representative of those used in theproject. The general form of construction is summarised in table 1.

3
Characteristic Description
House type Three and two bedroom, semidetached and terracedhouses the majority constructed in the 1930s or 1950s.
Construction Load-bearing cavity brickwork with a pitched tile roof.Ground floor constructions - a mixture of solid andsuspended timber. Floor area range; 75m² to 95 m²
Condition Sound structural condition and good general repair;internal fixtures, fittings and heating systems in need ofreplacement; electric wiring in good condition; roofrenewals previously carried out in the 4 house and 200house schemes (see table 2 for scheme descriptions).
Existing Insulation Existing thickness of loft insulation varied from 25mm to100mm fitted in the early 1970s. No other added insulation
Heating & HotWater
Most houses were heated by a gas fire in the main livingroom and hot water provided by an immersion heater fittedto a lagged cylinder. A small number of houses had electricstorage heaters (installed in the 1970s) and an electric firein the main living room. Hot water was provided from aninsulated storage cylinder and heated by an immersionheater designed to operate on an off-peak electricity tariff.
Table 1 General construction of dwellings
The project was made up of three related schemes with different standards of energyefficiency and monitoring arrangements. All houses were taken from the Authority’smodernisation programme which included an internal refit of kitchens and bathroomstogether with internal repairs as necessary. All external fabric was in good conditionand no external replacement works were necessary. The energy efficiency works andmonitoring arrangements for each scheme are summarised in table 2.
The 4 house scheme was designed to modernise a small number of properties to ashigh a standard as possible within a number of practical and financial constraints and tocontrast the use of four different heating arrangements; two based on gas and two onelectricity. Although it was recognised at the time that the inclusion of electricitywould result in higher CO2 emissions in the electric houses, the Authority were keen toexplore the steps which could be taken to minimise emissions where tenants wished tohave electric systems installed. The small number of houses enabled a more detailedmonitoring regime to be adopted than was possible in the other schemes. The fabricinsulation standard achieved was some 25% higher than the Building Regulations forEngland and Wales 1990 (the standard in force at the time) and overall energyperformance was similar to the Regulations currently in force (Building Regulations forEngland and Wales 1995 [5]).
The 30 house scheme sought to improve the energy efficiency of 30 houses as part of alarger modernisation scheme in an attempt to demonstrate the impact of energyefficiency works when compared with “normal” modernisation work. In order to make

4
the comparison, monitoring was carried out in both the energy efficient (experimental)group and a control group of houses from the rest of the scheme. The principaldifference in overall energy standard between this scheme and the 4 house scheme wasthat windows were not replaced and therefore glazing U-values were not improved.This resulted in an envelope standard some 25% to 30 % below that achieved in the 4house scheme. Condensing gas boilers were installed in all dwellings together with agas fire in the main living room. This arrangement resulted in an overall heatingefficiency which was potentially lower (depending on gas fire usage) than that in thecondensing boiler house in the 4 house scheme (see discussion in section 4.3 below).
Scheme Energy Efficiency works Monitoring
4 Housescheme
Fabric improvements200mm. loft insulation, cavity wall insulation1, 20mmlow emissivity double glazing - new timber windowand door frames with draught proofing.Heating systems4 systems: Gas systems - condensing boiler centralsystem and gas unit heater system. Electric systems -Off-peak electric boiler system and air-air heat pumpwith resistance heating back-up.Ventilation systemsGas schemes; intermittent mechanical extract (fan inkitchen and bathroom) with trickle vents in newwindow frames.Electric schemes; balanced mechanical ventilation withheat recovery (MVHR) which in Electric House B wasintegrated with the heat pump and resistance ductheaters to provide whole house heating.
Short termco-heating2 andpressurisation testsbefore and afterimprovements.Long terminternal temperaturesand energyconsumption - May92 to May 93.Energy flowsdisaggregated.Measured valuescompared withestimates of “before”consumption3.
30 Housescheme
200 mm loft insulation, blown fibre cavity wallinsulation4, draught-proofing to existing windows anddoors. Central heating system with gas condensingboiler and a gas fire (tenant choice) as a secondary heatsource. Ventilation; as 4 House scheme - gas houses.
Internal temperaturesand gross energyconsumption for theperiod Nov. 1992 toMarch 1994.
200Housescheme
Fabric improvements as the 4 house scheme; mosthouses were fitted with gas boilers (a mixture ofcondensing and non condensing boilers) and a gas fire(tenant choice). Some houses had one non-cavity wallwhich was not insulated. Ventilation; as 4 Housescheme - gas houses
Internal temperaturesand gross energyconsumption weremonitored in a sampleof 10 houses - April1993 to March 1995.
Notes:1. Blown fibre in gas houses, polyurethane foam in electric houses.2. Co-heating tests give an estimate of the heat loss coefficient of a dwelling - see [6] & [7].3. Energy modelling calculations throughout the project were done using a computer programme (NHERevaluator) which incorporates the UK Building Research Establishment’s Domestic Energy Model [8].4. Dwellings in this scheme had a complex mix of cavity, solid and timber frame walls, each requiringdifferent treatment.

5
Table 2 Energy efficiency works and monitoring arrangementsThe 200 house scheme was carried out some twelve months after the other twoschemes and sought to apply the 4 house standard to a full modernisation scheme. Thisscheme was monitored using a sample of 10 houses over a 12 month period.
Monitoring data for the 4 house scheme was recorded (with the exception of electricityconsumption in the two gas houses which was read manually) using data loggers withdata downloaded at monthly intervals. Sub-meters enabled energy inputs to bedisaggregated and, in Gas House A, the heat output form the condensing boiler wasmetered to enable its efficiency to be established. Internal temperatures in all schemeswere logged at three points (living room, kitchen and main bedroom) using 2kΩthermistors in conventional room thermostat housings. Monitoring in the 30 and 200house schemes was done using 4 channel temperature loggers and energy utility metersread manually (at approximately monthly intervals). Energy consumption was alsocross-referenced with energy utility billing data. Further details are contained inreference [9].
Part of the function of a demonstration project is to look at the processes involved inimplementation as well as the technology. A decision was taken very early in theproject to seek to employ as much of the Authority’s existing modernisationcontracting procedures as possible. This was done partly for pragmatic reasons andpartly to assess their effectiveness in delivering energy efficient improvements. In Yorkthese procedures involved small contractors working closely with the authority and thetenant in order to provide a considerable element of choice over such things asbathroom and kitchen fittings and a secondary room heater (usually a gas fire in themain living room). The houses chosen for the 4 house scheme were vacant at the timeof modernisation and all fixtures, fittings and heating systems were specified by theproject team with no tenant involvement. In the 30 house scheme all tenants wererequired to accept a condensing boiler but had a free choice as to a secondary gas fire.The 200 house scheme provided a wider choice of heating system and although amajority of tenants chose to have a condensing boiler this was not always the case and,particularly where tenants requested a gas fire with an integral heating boiler (forwhich condensing versions where not available), a non condensing boiler withoptimiser was fitted. As in the 30 house scheme a free choice of secondary heating wasavailable to all tenants. The results from each scheme are presented below.
3. The 4 house scheme
The results from the short term monitoring on this scheme demonstrated considerableimprovement in air-tightness and overall thermal performance of the house envelope.Tables 3 and 4 set out the before and after measurements of air-tightness and overallheat loss1.
In the case of air-tightness there was a 2.5 to 3 fold improvement which was achievedby improved performance of windows and doors, sealing of suspended timber ground
1 The error ranges shown in tables 3 and 4 show the error relating to the regression line through theraw data (goodness of fit). They do not include measurement error in the raw data itself. The errorsquoted therefore, underestimate the true value.

6
floors where necessary and the repair of defects in the plaster work around windowframes. Figure 2 compares the air-tightness results with a data base of 385 UKdwellings. The leakage rates before modernisation were higher than the UK average ofabout 12 to 14 ac/h @ 50 Pa but after the works the houses were among the mostairtight in the UK. Observations at the time of the tests (such as gaps round the edgeof the floor sealing) suggested that air-tightness could have been improved evenfurther with modest additional effort, offering the prospect of air-tightness of 3 ac/h@50 Pa or better, a level which approaches current Swedish standards for newhousing (about 2.4 ac/h in these houses) [10].
Air leakage rates from blower door tests (ac/h @ 50 Pa.)
Dwelling tested Before After Percentage reduction
Gas house B 19.3±1 7.5±0.4 61%
Electric house A 16.9±1 4.9±0.3 71%
Electric house B - 6.8±0.3 -
Table 3 Air-tightness before and after improvements.
We have argued elsewhere [11] that savings in ventilation-related heating requirementsof around 30% could be achieved, if an airtightness target of 10 ac/h @50 Pa could beenforced in new UK dwellings2. The evidence from the study reported here clearlyindicates that significant sectors of the existing stock have the potential for rates wellbelow this level3. It has also been estimated [13] that at leakage rates of 2 to 3 ac/h@50 Pa, coupled with continuous mechanical extract ventilation, a further 30% to40% reduction could be achieved compared with dwellings with a leakage of 10 ac/h@50 Pa.
Heat loss coefficients from co-heating tests (W/K)
Dwelling tested Before After Percentage reduction
Gas house B
Measured 218±3 133±1 39%
Calculated 266 146 45%
Electric house A
Measured 229±4 121±4 47%
Calculated 300 125 58%
2 At this level of airtightness a continuous mechanical ventilation system would not be necessary.3 This is, of course, dependant on initial construction and renovation techniques. The majority of theexisting UK housing stock has wet plastered walls (as in the case of the York houses) which areintrinsically airtight [12], however the practice of replacing defective plaster in renovation works witha plasterboard on dabs dry-lining system is likely to reduce airtightness and make subsequent sealingworks very difficult indeed [13].

7
Table 4 Heat-loss coefficients before and after improvements.
Co-heating tests (see notes to table 2) were carried out on two of the houses (one gasand one electric). The overall heat loss coefficients clearly demonstrate the impact ofthe improvements made to the house envelope with measured reductions of 47%(electric house) and 39% (gas house) being observed. These reductions were broadlyin line with the difference which was predicted before works were carried out (acalculated improvement of 58% in the electric house and 45% in the gas house).However the agreement between measured and calculated values was significantlybetter in the after case (differences of 9% in Gas house B and 3% in Electric house A)than in the before case (differences of 18% and 24%).
0
10
20
30
40
50
60
0 2 4 6 8 10 12 14 16 18 20 22 24 26 28 30
Leakage @ 50Pa (ac/h)
Num
ber
of d
wel
lings
York beforeYork after
Figure 2 UK Pressurisation test data (after [14])
Element Before After
Mean % Mean %
Floor 25 11% 25 17%
Wall 83 37% 37 25%
Windows & doors 47 21% 40 28%
Roof 20 9% 9 6%
Fabric heat loss coefficient 175 78% 111 77%
Ventilation heat loss coefficient 50 22% 34 23%
Total heat loss coefficient 225 100% 145 100%

8
Table 5 Heat loss coefficient (W/K) broken down by element4
Table 5 sets out a breakdown of the heat loss coefficient for the two co-heating testdwellings. These data illustrate the importance of both fabric and airtightness measuresin efficiency improvements with each being reduced by about the same proportion(37% - fabric, 32% ventilation).
Following occupation, the houses were monitored in use for a further 12 months.Energy consumption and heating season internal temperatures (October to April) areset out in table 6. Since the dwellings were vacant immediately before and during theworks, it was not possible to obtain measured data in the 12 months prior tomodernisation and therefore the measured consumption after modernisation wascompared with an estimate of consumption prior to works. The houses performedbroadly as predicted with total delivered energy consumption falling by 49% in GasHouse A, 54% in Gas House B, and 51% in Electric House A. The exception wasElectric House B where, although delivered energy was reduced in line with the otherhouses (50%), the expected reductions associated with the application of the heatpump did not to materialise. The measured consumption of almost 12,300 kWh/y inElectric House B compares with a predicted value of just under 9,900 kWh/y (some24% greater than predicted). This was principally because significant problems withthe heat pump installation were experienced both in design and use. As a result, themajority of heating was provided by backup electric resistance heaters.
Scheme Heatingsystem
Before After
Gas Elec.2 CO21 Gas Elec. CO2
1 Int.temp.
kWh kWh te. kWh kWh te º C
Gashouse A
Cond’singboiler
23900 4300 6.73 13160 1209 3.12 17.3
Gashouse B
Gas unitheaters
11535 1524 2.97 16.9
Electrichouse A
Off-peakelectricity
- 24800 12.64 - 12225 6.23 19.6
Electrichouse B
Air-to-airheat pump
- - 12296 6.27 -
notes:
4 Figures in table 5 are the mean of the two houses (Gas B and Electric A). The fabric coefficient wasdetermined by subtracting a ventilation term (estimated from the pressurisation measurements in table3) from the results of the co-heating tests. The in-use ventilation heat loss coefficient was calculatedbased on the pressurisation tests plus an allowance for user behaviour (window opening and theoperation of fans). This additional term was calculated in accordance with the UK Government’sStandard Assessment Procedure [15] Viz.: VHL= 0.5+[(IR*SF)2*0.5] where IR = the infiltration derivedfrom the pressurisation test (L50/20) and an allowance for extract fans (10 m3/hr per fan - 2*10/vol),and SF = a shelter factor (0.85 for these houses). The envelope elemental breakdown was allocated inproportion to calculated fabric U values and areas (U values were not measured directly).

9
1. The carbon coefficients used in this table are taken from the UK Standard AssessmentProcedure for the energy assessment of dwellings [15]: Gas - 0.19 kg(CO2 )/kWh, Electricity(UK) - 0.51 kg(CO2)/kWh
2. Electricity consumption before improvements included on-peak water heating which afterimprovement was heated by the gas in the gas houses and off-peak electricity in the electrichouses.
Table 6 Long term monitoring results - 4 House scheme
Reliable internal temperature data was available for the two gas houses and ElectricHouse A. Average temperatures in the gas houses (17.3ºC in A and 16.9ºC in B) werebroadly in line with temperatures observed on other schemes in the project (17.6ºC -30 house scheme, 18.8ºC - 200 house scheme), with other UK energy modernisationschemes (see for example [16] & [17]) and with a UK average (1990 – 1996) of17.2ºC for centrally heated dwellings [18].5 The average temperature in Electric HouseA (19.6ºC) was high by UK standards and compares with 18.4ºC in the Pennylandnew build scheme at approximately the same level of insulation [21].
As would be expected, the reductions in CO2 were of the same order of magnitude asenergy reductions. However, reductions in the gas houses were influenced by anelement of fuel switching from electric to gas water heating. Overall, CO2 from theelectric houses remains much larger than the gas houses, reflecting the current largediscrepancy between the carbon intensity of the two fuels (see coefficients in the notesto table 6).
Of particular interest in the 4 house scheme was the performance of the differentheating systems and the way they were understood and operated by the occupants andlocal authority staff. Prior to the demonstration project, the vast majority of tenantschose hydronic gas central heating systems. A few electric storage systems wereinstalled where a tenant expressed a particular preference for electricity. Notsurprisingly, the systems which presented the fewest problems for installers and tenantswere the conventional gas-fired hydronic and storage electric heating systems.Generally, these systems performed as expected and tenants were clear as to theirmode of operation. In the case of Gas House A, the mean annual boiler efficiency was89% with very little variation regardless of mean daily load. From the tenant’s point ofview the system was little different from any other gas central heating system andoperation was easy to understand. In Gas House B, the unit heater system was capableof central timing control but this was never used by the tenant, whose previousexperience (a single solid fuel fire) and general uncertainty about heating costs, led herto switch heaters on and off individually. Although the house was designed to beheated with three heaters, the tenant, as a matter of convenience, chose to use onlytwo (one on the ground floor and one on the first floor landing). Some discomfort 5 We are grateful to one of the referees for reminding us that the UK average in the Domestic EnergyFact File [18] is not measured directly but inferred from energy calculations on the stock. The onlysource of measured data on the stock as a whole comes from the English House Condition Survey[19]. This survey recorded average spot temperatures of 19.5°C and 18.3°C in living room and hallrespectively. Although there is some evidence that the hall temperature may be a good guide to wholehouse temperature at the time of measurement [20], these data are spot measurements (taken indaytime, in mild weather) and do not provide a reliable guide to whole house average heating seasontemperatures.

10
problems were experienced by the tenant which appear to have been caused by anuneven heat distribution resulting from the placement of individual heaters. The maindifficulty was the inability of the system to provide enough heat to the entrance halland stairway, a problem which could be solved by the siting of an additional heater inthe entrance hall, and by improving the airtightness and U value of the external door(external doors which were fitted were a significant source of air leakage, and had Uvalues between 3 and 4 W/m2K). Despite these design problems the schemedemonstrated a potential, at least in small dwelling modernisation, for unit heaterschemes at a cost considerably less than that of a full hydronic central heating system.
The systems in the electric houses presented much greater problems. In common withthe gas systems, the electric storage boiler system in Electric House A was easy tounderstand and presented few problems for the tenant. However, the use of theMVHR system was less than optimal. This house was the most airtight of the 4 housesand was sufficiently air-tight to require continuous mechanical ventilation. Althoughthe monitoring data are not conclusive, it would appear that use of the system wasvery intermittent. This suggests that the introduction of unfamiliar systems requiresconsiderable attention to tenant advice and the training of local authority managers.Evidence from elsewhere [13] indicates, however, that the effective use of MVHRsystems by occupants is achievable through appropriate design and occupant advice.The study by Lowe and Johnston (reference [13]) also demonstrated the potential CO2
benefits of efficient MVHR systems over continuous mechanical extract at all levels ofair-leakage but particularly at levels below 3 ac/h @ 50 Pa.
Monitoring of the air-to-air heat pump system in Electric House B indicated that itcontributed only a very small fraction of the space heating requirement. Problemsincluded, the frequent cutting out of the heat pump condenser due to excessivecondensing temperatures (suggesting inadequate air flow), an inability of the system tomaintain adequate temperatures, particularly in the first floor area and difficultiesexperienced by the occupant in understanding the rather complex control system. It isdifficult to be certain about the precise nature of all of the technical problems, but it isclear that the system was not well suited to the needs of the tenants, and that it wouldhave required a further 2-3-fold reduction in design heat load to operate satisfactorily.This is not to say that the various problems cannot be overcome but more research andtrial activity would be required in order to build up the necessary experience in theconditions encountered in modernisation work in the UK.
4. The 30 house scheme
This scheme presented an opportunity to monitor energy efficiency improvementsagainst a control group of dwellings in the same modernisation scheme but with noadditional energy efficiency works. Good monitoring data was available for 21experimental houses and 11 control houses and the monitoring period (from theautumn of 1992 to the summer of 1994) included data from two heating seasons. Table7 sets out the energy characteristics of the two groups, under standard occupancyconditions, both before modernisation and on the assumption that they were improvedto the authority’s normal modernisation standard. The two groups were remarkablywell matched in terms of their energy characteristics, with the expected total energyconsumption varying by only 2% before modernisation and less than 1% if both groups

11
were modernised to the normal standard. This analysis would suggest that physicaldifferences in the dwellings are not likely to have had a significant influence on themonitoring results. It was not possible to control directly for occupancy or userbehaviour, however a simple occupancy comparison indicates a broadly similar profilein both groups with an average of 3.1 persons per household in the experimental group(1.86 adults and 1.24 children) and 3.36 in the control group (2.0 adults and 1.36children). Despite the similarity, occupancy and user behaviour are likely to be animportant source of extraneous variability.
Group Before Improvement Improvement to Tenant's ChoiceStandard
Gas Elec. Total Gas Elec. Total
kWh kWh kWh kWh kWh kWh
Experimental 26946 7944 34890 27864 3246 31110
Control 26290 7818 34109 27851 3081 30932
Difference 656 126 781 13 165 178
Table 7 Energy characteristics of 30 House study groups
4.1 Internal temperatures and energy consumptionContinuous monitoring of internal temperatures and energy consumption was carriedout in both groups of houses (see Table 2) and the results compared. Figure 3 showsaverage internal temperatures against external temperatures for both groups over thewhole of the monitoring period. Despite the difference in levels of insulation, bothgroups maintained similar internal temperatures. As external temperatures rise into thesummer period the amount of scatter is reduced as internal temperatures become morea function of external temperature and incidental gains rather than levels of heating.Average heating season internal temperatures of 17.9ºC in the experimental group and17.4ºC in the control group were recorded. In energy terms, the half degree differencewould amount to something in the region of 1360 kWh over a full heating season. Thesmall temperature difference suggests that the majority of the benefits of the energyefficiency measures were taken in real energy savings rather than in highertemperatures.

12
0.00
5.00
10.00
15.00
20.00
25.00
0.00 2.00 4.00 6.00 8.00 10.00 12.00 14.00 16.00
External temperature (ºC)
Inte
rnal
tem
pera
ture
(ºC
)
EXP. GROUP (monthly) AVERAGE.
CONT. GROUP (monthly) AVERAGE
Figure 3 Internal temperatures
Measured annual consumption Gas Elec. Total
kWh kWh kWh
Experimental 19313(SD = 4367)
3138(SD = 1375)
22451
Control 23092(SD = 5565)
3529(SD=893)
26621
Difference 3779 391 4170
Temp. Adjusted Difference 5145 391 5536
Predicted annual consumption
Experimental 16671 3104 19775
Control 27851 3081 30932
Difference 11180 -24 11157
Table 8 Energy consumption - 30 house scheme
The results of the energy monitoring together with energy modelling predictions areset out in table 8. Since the houses were heated by gas, the impact of the insulation andefficiency measures would be expected to result in a significant difference in the gasconsumption of the two groups. As can be seen from table 8, such a difference wasobserved which was statistically significant. 6 The probability of this difference
6 A one tailed t test was used to test the significance of difference in mean energy consumptionbetween the two groups.

13
occurring by chance is less than 3% (P=0.022). The difference in electricityconsumption is not significant (P=0.201). Although a significant difference in gasconsumption exists, it is considerably smaller than that predicted by energy modelling.This suggests that there are important variations in use which obscure the effects of theenergy efficiency measures. Some of these issues are discussed in section 4.3 below.
4.2 Cost and pay-back issuesThe marginal cost of the energy efficiency works averaged some £1,450, at the timethe works were carried out in 1992, giving a simple pay-back time of around 17 yearsbased on measured consumption or about 8 years if predicted consumption is used.This contrasts with marginal costs for Gas House A (condensing boiler system) in the4 house scheme of about £1,000 and energy cost savings of £174 over those measuredin the control group with a simple pay-back period of between 5 and 6 years. Thiswide variation in pay-back was largely a function of constructional differences in thehouse types. Figure 4 illustrates the most expensive house type (house type C) whichhad three types of wall construction, cavity masonry for main walls, a timber framemansard wall/roof and solid masonry below bay windows and to separating wallsbetween the main house and attached (unheated) outhouses. Although the solid andtimber walls covered only 13% of the total wall area the costs of insulation (mainlydry-lining work) constituted just over 85% of the costs of wall insulation (£920 out ofa total of £1070). Some of this extra cost could be reduced in future schemes withincreased volumes and familiarisation with the techniques on the part of contractorsbut costs are unlikely to fall to anywhere near the £150 for blown fibre cavity fill. Thisexperience highlights the potential benefits of identifying potential upgrade paths at thedesign stage, particularly in the light of an increasing need to continually reduce theenvironmental impact of buildings in general.
Figure 4 House type C
The likely cost effectiveness of each measure in this house type was established bycalculation and the results set out in figure 5. The incremental impact of each insulationmeasure was modelled by removing it from the total package and the resulting increase

14
in energy consumption related to the capital cost of the measure. In the case of thecondensing boiler the measure was added before any insulation. Using this approach,the greatest impact of each measure was determined. It is clear from the analysis thatthe various dry-lining works were much less cost-effective than cavity wall insulation,loft insulation and improved boiler efficiency. It is estimated that the omission of dry-lining alone in this house type would reduce the pay-back times by about half, from 17years to about 8 years based on measured consumption or from 8 to 4 years ifcalculated consumption data is used. Although the cost-effectiveness of certaininsulation works is poor, their inclusion on comfort or construction grounds (reducingthe risk of condensation) may be justified.
0.00
0.10
0.20
0.30
0.40
0.50
0.60
0.70
0.80
0.90
1.00
Efficiency Measure
Cos
t per
kW
h sa
ved
(£/k
Wh)
0
10
20
30
40
50
60
70
Pay-
back
tim
e (£
/yr)
Cost per kWh savedPay-back time
Cav
ity
C b
oile
r
Loft
Man
sard
D.p
roof
DL-
util
DL-
bay
Figure 5 Cost effectiveness of individual measures in house type C7
The wide variation in energy efficient modernisation costs illustrates one of theparticular difficulties which is faced by housing modernisation schemes. The variationstems not only from differences in house construction, as in the case discussed above,but also from some of the design choices made. In particular, the choice of a gas unitheater scheme in one of the 4 house gas schemes resulted in an overall heating systemcost of about £780 less than the condensing boiler scheme and some £480 less than a
7 The capital cost data used in figure 5 (taken from contractors invoices) is as follows: cavity wallinsulation - £150, condensing boiler (marginal cost) - £300, loft insulation - £210, timber mansardroof/wall insulation - £309, draught sealing to windows/doors - £182, dry-lining to utility room - £339and dry-lining below the bay window - £274. The energy cost used to determine pay-back time wasbased on the gas tariff (excluding standing charges) during the monitoring period which was 1.595pence per kWh (including value-added tax at 8%). A detailed breakdown of cost and energy data forthis house is given in reference [9]. Since the completion of the schemes UK energy prices have fallen(in absolute as well as real terms) as have some of the capital costs. For example, the currentequivalent gas tariff is in the region of 1.46 pence per kWh (including value-added tax at 5%) and, by1998, cavity wall insulation costs for larger contracts in York had fallen to £100 for similar dwellings.Although these price movements change the detail, the overall picture remains unchanged (cost issuesare discussed further in section 6).

15
typical heating system in a normal modernisation scheme. If this cost saving were takeninto account, the net capital cost of the unit heater scheme would be about £280 with apay back of less than 2 years.
4.3 User issuesLarge variations in consumption between houses of the same level of energy efficiencyare commonly observed in housing energy field trials (see [22] ch. 7). This is mainlydue to variations in the way houses are used and is likely to go some way to explainthe difference between predicted and measured energy consumption observed in thisproject. A detailed investigation of use was not part of the project, however, in orderto gain an insight into the likely impact of use, an open ended interview was carriedout with the occupants of one of the experimental houses. The house exhibited anenergy consumption some 40% above the predictions of the modelling program despiteinternal temperatures similar to those which were predicted by the model. At least part ofthe discrepancy would appear to relate to the use of the gas fire. As already indicated,modernisation procedures in York provide tenants with a choice of gas fire in addition to afull central heating system (this choice was maintained in the energy project for all but the 4house scheme). In the case investigated, the fire chosen by the tenant was an enclosed gasflame fire with an efficiency which varied between 59% at high output and 47% atminimum output. The interview indicated that the gas fire was operating on its low settingfrom about 2:00 in the afternoon to 11:00 in the evening on most days in the heating seasonand was also on for about an hour in the morning. The gas fire was used even during thetimed heating periods. Since the lounge radiator was fitted with a thermostatic radiatorvalve, the heat from the gas fire would turn the radiator off for long periods, especiallyduring mild weather. This means that most of the lounge heat would be provided by the firerunning at about 47% efficiency, compared with the condensing boiler at an efficiencybetween 85% and 90%. A crude assessment of this effect would suggest that the operationof the fire could account for just under half the difference between measured and predictedlevels of consumption. A broader analysis of the gas fire choices in the experimental andcontrol houses indicates choices of fire which are similar to that in the above example.
Given the larger efficiency differential between primary and secondary systems in theexperimental group, gas fire usage would have a much greater impact in this group than thecontrol group. If, for example, a gas fire was providing 20% of the heating, the increase inconsumption would be 14% in the experimental group but only 4% in the control group.
The issue of gas fire choice and use has been discussed in some detail in order to illustratethe potential impact of use on consumption and also to highlight the need for the provisionof guidance to tenants and social landlords on both the choice of fire (if any) and its use,particularly in houses fitted with condensing boilers. This need for advice is furtherreinforced by the findings of a satisfaction survey in both groups which showed that a veryhigh proportion of tenants (80%) used some combination of gas fire and central heating.One particular fire choice (a decorative open gas flame type) presents a particular problem,not only because it is only 42% efficient at all settings but also because the open chimneyincreases ventilation losses even when the fire is not in use8. In contrast, the gas houses
8 It would be a considerable achievement on the part of the manufacturers to produce natural gas-firedheating systems that emit more carbon dioxide than electric resistance heating in a fossil fuel fired

16
from the 4 house scheme, on the advice of the monitoring team, did not include focal pointfires and a much closer match between predicted and measured energy consumption wasobserved. Other aspects of use in the case investigated related to the opening of windows inbed rooms, hot water consumption and thermostat settings, most of which would tend toincrease consumption in this particular case.
The variation could be further explained by the difficulties of estimating heat losses(both fabric and ventilation). Since (unlike the 4 house scheme) the properties were notpressure tested, it is not possible to assess the likely variation in ventilation heat lossesbetween the two groups. In the case of fabric heat loss, difficulties in estimating theimpacts of thermal bridging in existing properties may have contributed to thediscrepancy between calculated and observed performance. Evidence from the 4house scheme, where it was possible to extract a reasonable estimate of the fabric heatloss coefficient (see table 5) from co-heating and pressurisation tests on two of thehouses, gives some support to this possibility. A comparison of this estimate with thatfrom the modelling software indicates that in the before case the calculations over-estimated fabric heat loss by 27% but after improvements the corresponding figure wasa 9% under-estimate.
The U value calculator in the Evaluator program uses the proportional areas method[23] and ignores thermal bridging around windows and at other junctions. Given thedifference in insulation levels (particularly in walls) between the two groups, it ispossible that the thermal bridges would have a more marked effect in the experimentalgroup than the control group (as is indicated by the data from the 4 house scheme).We have argued elsewhere, in the context of building regulation [24] that U valuecalculation methods used in the UK need to take much greater account of thermalbridging and that suitable methods are needed for the design of new dwellings.However, although it would be possible to apply methods designed for newconstruction to existing dwellings, there are likely to be significant practical problemsin establishing construction details with sufficient precision. Internal temperatureassumptions are another possible source of discrepancy. The worse the dwellinginsulation, the larger the spatial variation in internal temperature. Temperatures basedon the average of three point values may therefore not have been a good guide toactual mean whole house temperature in any of the 30 house group, but particularly inthe houses before improvement.
5. The 200 house scheme
This scheme sought to achieve a standard of energy efficiency similar to that of the 4house scheme. However budgetary priorities and tenant choices meant that thestandard achieved was somewhere between that of the 30 house and 4 house schemes.The main differences included non condensing boilers in a number of houses, poorefficiency focal point fires, small areas (about 12 m2) of solid wall adjacent to coveredpassage ways between houses which were not insulated and no attempt to improveairtightness by sealing suspended ground floors.
grid. Nevertheless, against the background of generation efficiencies of modern, combined cycle gas-fired power stations, these fires probably succeed!

17
Good monitoring data was available from 10 houses, one of which was heatedelectrically. The mean delivered energy consumption in the gas heated houses was18,600 kWh (16700 kWh - gas, 1900 kWh - electricity). However internaltemperatures were, on average, higher in the 200 house scheme than any of the otherschemes. The average temperature in the houses monitored was 18.8ºC. This compareswith 17.1ºC in the 4 house gas houses, 17.9ºC in the experimental group (30 housescheme) and 17.4ºC in the 30 house scheme control group. Normalising energyconsumption against the average temperature observed in the 30 house schemeexperimental group, the equivalent consumption would be in the region of 17,200 kWh(15300 kWh gas, 1900 kWh electricity).
0
5000
10000
15000
20000
25000
4 House (Gas) 200 house 30 House NormalImprovement
Standard of Improvement
kWh/
year
Figure 6 Comparison of gas consumption - all schemes
6. Discussion
The objective of the demonstration project was to show the extent to which theapplication of readily available and well understood technology, as part of housingmodernisation, could reduce energy consumption and CO2. The data from the schemesdemonstrate a clear relationship between the level of efficiency work and energyconsumption. Figures 6 and 7 compare the mean energy consumption (temperaturecorrected) and CO2 in each the four schemes.9 As expected, overall energyconsumption and CO2 declines as the level of energy efficiency increases. Incomparison with the normal modernisation standard adopted by the authority at thetime of the project, reductions in total energy consumption of 20% (30 houseexperimental group), 39% (200 house scheme) and 47% (4 house scheme - gas
9 The comparisons across the different schemes is presented to provide a broad overview of thestandards achieved. However, they must be treated with some caution as there are importantdifferences between the various groups, particularly in the numbers of dwellings involved. The onlygroups which were matched with respect to their energy characteristics are those in the 30 housescheme.

18
systems) are apparent. In addition to confirming the extent of reduced energyconsumption the monitoring team were also interested in gaining an understanding ofthe practical implementation problems and how these can be overcome in futureschemes.
0
500
1000
1500
2000
2500
3000
3500
4000
4500
5000
4 House(Gas)
200 house 30 House NormalImprovement
Standard of Improvement
kg (C
O2)
Figure 7 CO2 emissions (measured gas consumption) - all schemes
6.1 Cost effectivenessCost is often cited as a barrier to the addition of energy efficiency work tomodernisation work programmes. The cost evidence from this demonstration projectsuggests that although costs and energy savings can result in short pay-back times, thisis highly dependent on the house types involved and on the detailed design of schemes.The large variation in capital cost between the relatively simple constructionencountered in the 4 house scheme and the more complicated wall arrangement inhouse type C (30 house scheme) clearly illustrates the difficulties which can arise evenin an apparently homogeneous housing estate. In strict economic terms applying cost-effectiveness criteria, together with predicted energy savings, can help to strike abalance between capital cost and reduced energy use costs but this is likely tooversimplify the problem particularly in social housing. House types which areexpensive to insulate are often mixed with those which are relatively inexpensive andraise ethical questions of fairness and equality of treatment for tenants especially whenaffordable warmth [25] is an important objective. It is also arguable that, on technicalgrounds, large gaps in the insulation of the thermal envelope could cause problems ofcondensation and reduced comfort.
The design of schemes is another area with an important impact on cost-effectiveness.Two examples from the York project illustrate some of the potential issues. Firstly; thedesign of a gas unit heater scheme in one of the gas houses from the 4 house schemesaved about £780 on the cost of a normal hydronic central heating system and reduced

19
the overall cost of the scheme to only a few hundred pounds above the costs of thenormal modernisation standard. However, since the completion of the demonstrationproject there has been a reluctance on the part both of tenants and council officials tofollow this example. Such reluctance would appear to be based on long standingexpectations about what constitutes an adequate central heating system. The secondexample concerns maintenance decisions and the way they relate to modernisationcycles. It is self evident that the cost-effectiveness of efficiency works is enhanced ifdone at marginal cost during other replacement and repair works. However,constraints on the availability of capital often present a dilemma to managers, and leadto results that can only be described as economically perverse. In the 30 house scheme,funds were not available to replace existing window frames and although replacementcould be justified on long term maintenance grounds, a decision was taken not toreplace but to seek a marginal improvement in comfort and energy consumption by theapplication of draught sealing. This added some £180 to the cost but with a pay-backtime of over 20 years. This can be contrasted with the 4 house scheme wherereplacement windows with integral draught seals were installed with a marginal pay-back time of around 5 or 6 years.
It is arguable that the use of a simple, single dimension, criterion such as pay-back (oreven the more sophisticated discounting techniques) are at best crude and at worstmiss the point completely. In a review of energy efficient retrofitting Nilsson et.al.point out that energy efficiency, even in the majority of energy demonstration projects,is not the prime objective of housing modernisation schemes [26]. In most cases theconcerns are about the creation of a high quality internal environment which fulfils theneeds of tenants or prospective purchasers, a situation which also pertained to theYork schemes. The vast bulk of modernisation expenditure is not spent on energyefficiency measures but on new kitchens, new bathrooms, the installation of a centralheating system and general repairs and replacements. All of these items are carried outfor their amenity value not for reasons of cost effective pay-back. The critical point inthe context of the need to create a sustainable housing stock is that the required levelof amenity and comfort can be achieved in an energy efficient way or an energyprofligate way. As was demonstrated in the 30 house scheme the control groupmaintained similar internal temperatures to the experimental group because theirheating systems had a heat output which was able to counteract the greater heat lossand tenants were able to afford the energy costs involved. Few would argue that thecreation of a high standard of comfort should not remain an important target but it iscertainly arguable that any extra cost incurred in achieving it in an efficient way shouldbe seen as providing benefits which are wider than the annual fuel bill savings. In orderto achieve a more sustainable housing stock policy makers need to embrace thesewider issues. In any case, it is likely that many of the additional capital costs will fall inthe longer term as energy efficient technology becomes mainstream.
6.2 Design and buildability issuesIn broad terms the additional energy efficiency works presented few problems forcontractors and modernisation management processes. However, the discussion of usefactors emerging from the 30 house scheme suggest that considerable care should betaken in the specification of secondary heating appliances particularly when a highefficiency main system is installed. In the context of the provision of choice for tenantsthis would suggest a strong case for restricting system choice to ensure that overall

20
efficiencies are not jeopardised. This is also an example of where expenditure has beenincurred which, although satisfying a perceived tenant “need” (largely an aestheticone), may well have acted to increase energy consumption rather than reduce it.Advice to tenants may also help to reduce the problem but given the difficulties ofproviding such advice, it is likely to have only marginal impact [27].
The design of heating systems generally was a matter of some concern in the earlystages of the project, with a tendency for individual designers, used to poorly insulateddwellings, to consistently oversize condensing boilers. Although the impact ofoversizing on boiler efficiency was very small (see [9] pg. 25) the impact on capitalcost was considerable. This indicates a need for industry wide training and educationwhich would enable designers and installers in the domestic sector to respond to therequirements of a more highly insulated housing stock. Detailed analysis of the heatingsystem in Gas House A (4 house scheme) indicated that mean daily boiler load did notrise above 4kW with a boiler rated at 9.1kW and that the boiler was operating at fullcapacity for only a few days per year [9]. Continuous operation of the boiler in verycold weather could have enabled a significantly lower boiler rating with the potentialfor significant cost savings. The difficulty with this however, is that there are nocondensing boilers available on the UK market with a rating lower than 9kW [27]. Ifthere is to be a more rigorous approach to the sizing of boilers in moderniseddwellings and in new dwellings, where the opportunities for higher insulation standardsare much greater, manufacturers need to bring to the market systems which are muchbetter matched to actual design heat loads in typical new and refurbished dwellings.But, perhaps more importantly, the artificial price premium for condensing over non-condensing boilers should be sharply reduced.
6.3 Impact of the demonstration project.The objective of demonstration projects is to encourage the widespread adoption ofthe technologies being demonstrated and, given adequate follow up and disseminationwork, they can have an important impact on subsequent practice [29]. At a nationallevel the York project has played its part along with other schemes in the GreenhouseProgramme [3]&[4] in raising the profile of energy efficient modernisation in socialhousing. However, its greatest impact has been within the host local authority. Thepositive impacts have included the instigation by the local authority of a mass cavitywall insulation programme which began even before monitoring work had beencompleted and saw all cavity walled dwellings owned by the Authority insulated by themiddle of 1997. The impact on local authority policy making also resulted in theestablishment of a 5 year strategy to improve the efficiency of the local authority stockoverall. Modernisation options were widened to include the addition of condensingboilers, additional roof insulation and window replacements with low emissivity doubleglazing. Although the demonstration project has been successful in influencingmodernisation policy, barriers remain to the whole-hearted adoption of condensingboilers. Problems include budgetary arrangements which militate against the choice ofa condensing boiler by the tenant (each dwelling has a small budget for “extras” whichcan be chosen by the tenant and the additional cost of a condensing boiler is takenfrom this budget) and a residual scepticism on the part of some surveyors and installersas to their cost effectiveness and long term performance and reliability. In addition, theaesthetic requirement for a secondary heating appliance (usually a gas fire) has beenmaintained and very few systems are installed which do not include this element. As

21
already discussed, this adds to capital cost and energy consumption, and may haveadverse health effects [30]. However, the findings of the project have persuaded theAuthority to restrict the choice of fire types so as to eliminate those with very lowefficiencies.
The project was also very successful in developing (from a low base) the energyexpertise of the technical and management staff in the Authority and also of thecontractors involved in carrying out the work. Given that the modernisation team atYork is typical of many local authorities in the UK, the incorporation of energyefficiency into the modernisation of social housing requires the maintenance of a highlevel of training and staff development. Without such a development programme, manyopportunities to reduce emissions from existing housing will be lost.
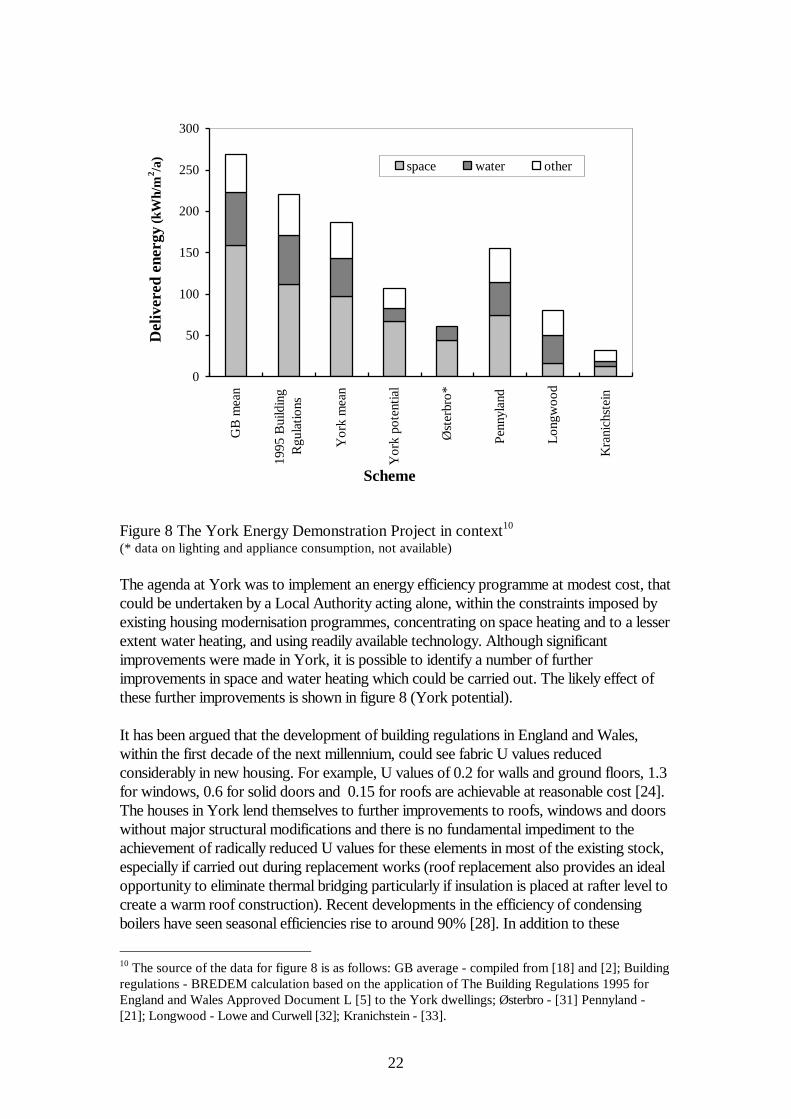
7.0 The project in context - a conclusion
The York project has clearly demonstrated that there is considerable scope for theimprovement of single family housing through the application of well established (early1980’s) technology and that existing modernisation procedures are capable ofdelivering these improvements. This has been demonstrated through the monitoringresults and through the subsequent experience of the authority in implementing thelessons learned. However, if the contribution of this type of modernisation work to thedevelopment of a sustainable housing stock is to be understood, it is also important toplace the results into the context of other schemes. Figure 8 shows how the higheststandard achieved in York compares with the energy efficiency of British housingoverall (existing and the current new-build standard implied by the BuildingRegulations), a European retrofit project (Østerbro) and three low energy new-buildhousing projects. The Østerbro scheme [31] is one of the most efficient of recent largescale improvement projects , the Pennyland houses [21] represent the best of the UK lowenergy projects of the 1970's and 1980's, the Longwood House [32] represents one of themost energy efficient UK schemes of the 1990's, and the Passivhaus project at Kranichsteinin Germany represents the best of the low energy housing projects undertaken in Europe todate [33]. Pennyland and Longwood addressed the concerns of the 1970's, which were theexhaustion of fossil fuels and security of supply, with the technology of the 1970s and early1980’s. Kranichstein addresses the much more demanding agenda of the 1990's, thestabilisation of atmospheric CO2 concentration, with the technology of the 1990’s. As canbe seen, the best of the houses at York outperform the British average by over 30%, arecomparable with the current standard for new UK housing and approach the level achievedin the Pennyland scheme. They do, however, fall some way short of the level set byLongwood and the energy retrofit scheme at Østerbro and do not begin to achieve theperformance of the Passive Houses at Kranichstein.
22
0
50
100
150
200
250
300
GB
mea
n
1995
Bui
ldin
gR
gula
tions
Yor
k m
ean
Yor
k po
tent
ial
Øst
erbr
o*
Penn
ylan
d
Long
woo
d
Kra
nich
stei
n
Scheme
Del
iver
ed e
nerg
y (k
Wh/
m2 /a
)space water other
Figure 8 The York Energy Demonstration Project in context10
(* data on lighting and appliance consumption, not available)
The agenda at York was to implement an energy efficiency programme at modest cost, thatcould be undertaken by a Local Authority acting alone, within the constraints imposed byexisting housing modernisation programmes, concentrating on space heating and to a lesserextent water heating, and using readily available technology. Although significantimprovements were made in York, it is possible to identify a number of furtherimprovements in space and water heating which could be carried out. The likely effect ofthese further improvements is shown in figure 8 (York potential).
It has been argued that the development of building regulations in England and Wales,within the first decade of the next millennium, could see fabric U values reducedconsiderably in new housing. For example, U values of 0.2 for walls and ground floors, 1.3for windows, 0.6 for solid doors and 0.15 for roofs are achievable at reasonable cost [24].The houses in York lend themselves to further improvements to roofs, windows and doorswithout major structural modifications and there is no fundamental impediment to theachievement of radically reduced U values for these elements in most of the existing stock,especially if carried out during replacement works (roof replacement also provides an idealopportunity to eliminate thermal bridging particularly if insulation is placed at rafter level tocreate a warm roof construction). Recent developments in the efficiency of condensingboilers have seen seasonal efficiencies rise to around 90% [28]. In addition to these
10 The source of the data for figure 8 is as follows: GB average - compiled from [18] and [2]; Buildingregulations - BREDEM calculation based on the application of The Building Regulations 1995 forEngland and Wales Approved Document L [5] to the York dwellings; Østerbro - [31] Pennyland -[21]; Longwood - Lowe and Curwell [32]; Kranichstein - [33].

23
improvements with respect to space heating, savings in water heating could be achieved bythe application of active solar systems, improvements in storage tank insulation and pipeinsulation and the adoption of water saving measures such as aerating taps and showers.Improvements in domestic appliances also offer the prospect of savings in the consumptionof electricity for lights and appliances. The net effect of such improvements would be toreduce overall consumption in houses similar to those in York to around 110 kWh/m2/a, anoverall reduction of 60% with respect to the British average and a level which has beensurpassed by only a small number of new houses in the UK to date[34]. The differencebetween the actual and potential performance of the 4 house retrofit at York hasimplications for policy, since significant opportunity costs are incurred by applying readilyavailable technology which, almost by definition, is below the performance of the best. It isfor example, unlikely that the windows actually installed at York, whose U value exceedsthe current state-of-the-art by a factor of at least 2, will be replaced for another 4 decades.It is reasonable to suppose that if such opportunity costs were considered alongside initialcapital cost the adoption of higher performance technology would be more widespread.
The Østerbro scheme (figure 8) illustrates the impact of a more technologically innovativeapproach to retrofit. This scheme of improvement to a five storey apartment block in,Copenhagen was able to achieve a consumption of 61 kWh/m2 for space and water heatingin a retrofit which included a range of passive solar measures such as an innovative solarwall (incorporation transparent insulation) and active solar water heating as well asinsulation and window improvements [31]. This is considerably lower (57%) than thatactually achieved in York (143 kWh/m2/a). However, our assessment of the potential forfurther improvement in the York houses (83 kWh/m2/a for space and water heating)suggests that the achievement at Østerbro could be emulated in dwellings similar to thoseencountered in York. The economics are, of course vastly different with a 33 year pay-backtime in the Østerbro scheme (caused mainly by the solar wall ) compared with around 5years in the 4 House Scheme in York.11
Although this project has been able to demonstrate that the technology can be successfullyapplied and that it is well within the capacity of existing technology and constructionpractice, the major problem facing the UK and many other countries is the transfer of suchimprovements into the housing stock as a whole. In the UK the existence of a highproportion of owner occupied dwellings (some 67% of all tenures) make this a particularlydifficult task, for it will require policies which encourage and enable millions of individualsto make the required investment. This is a problem which goes far beyond thedemonstration of appropriate energy efficient technology.
References
[1] Department of the Environment Transport and the Regions (1998). Digest ofEnvironmental Statistics No. 20 1998. London, The Stationery Office.
[2] Department of the Environment Transport and the Regions (1998). Housing andConstruction Statistics 1986-1996: Great Britain. 1998, London, The StationeryOffice.
11 See reference [25] for details of a wide range of energy efficient renovation schemes in Sweden, theNetherlands, the UK and the USA.

24
[3] Department of the Environment (1994). Energy Efficiency in Council HousingExemplary Project Guide: Green House Programme, In, Energy Efficiency inCouncil Housing, edited by the Department of the Environment, London,Department of the Environment.
[4] Department of the Environment (1995). Green House: Final Report 1995,London, Department of the Environment.
[5] Department of the Environment & Welsh Office (1994). Building RegulationsApproved Document L (1995): Conservation of Fuel and Power. London,HMSO.
[6] Everett, R. (1985). Rapid Thermal Calibration of Houses. Milton Keynes, UK:Open University Energy Research Group ERG 055.
[7] Lowe, R.J. & Gibbons, C.J. (1988) Passive Solar Houses: Availability ofWeather Suitable for Calibration in the UK. Building Services EngineeringResearch & Technology vol. 9 (3).
[8] Anderson B.R., Clark A.J., Baldwin R. And Milbank N.O. (1985). BREDEM-BRE Domestic Energy Model: Background, Phliosophy and Description.Building Research Establishment Report BR 66, Building ResearchEstablishment, Watford, UK.
[9] Bell, M. & Lowe, R.J. (1998) The York Energy Demonstration Project: FinalReport. CeBE report no. 3. Centre for the Built Environment, LeedsMetropolitan University, Leeds, UK.
[10] Swedish Board for Housing, Building and Planning (1995) Building RegulationsBBR 94, BFS 1993:57 with amendments BFS 1995:17 & BFS 1995: 65,Stockholm.
[11] Lowe, R.J, Johnston, D.K. and Bell, M. (in press) A review of possibleimplications of an airtightness standard for new dwellings in the UK. BuildingServices Engineering Research and Technology (BSERT).
[12] Lowe, R.J., Curwell, S.R., Bell, M. and Ahmad, A. (1994) Airtightness inMasonry Dwellings: Laboratory and Field Experience. Building ServicesEngineering Research and Technology (BSERT), vol. 15 (3).
[13] Lowe, R.J and Johnston, D.K. (1997) Mechanical ventilation with heat recoveryin local authority, low rise housing: Final report on the Derwentside field trial.CeBE Report no.6 Centre for the Built Environment, Leeds MetropolitanUniversity, Leeds, UK.
[14] Perera, E. & Parkins, L. (1992) Airtightness of UK Buildings: Status andFuture Possibilities. Environmental Policy and Practice vol. 2 (2).
[15] BRECSU (1998) The Government’s Standard Assessment Procedure for Energyrating of Dwellings: 1998 edition, London, Department of the EnvironmentTransport and the Regions.
[16] BRECSU (1993a) Cardonaldmill, Glasgow - Good Practice Case Study 65,Energy Efficiency in Housing, Best Practice Programme, January 1993, Watford,UK, Building Research Establishment.
[17] BRECSU (1993b) Lauder, Kirkcaldy - Good Practice Case Study 168, EnergyEfficiency in Housing, Best Practice Programme, January 1993, Watford, UK,Building Research Establishment.
[18] Shorrock, L. D. and Walters, G. A. (1998) Domestic Energy Fact File. BREReport 354, Garston, Watford, Building Research Establishment.
[19] Department of the Environment (1996) English House Condition Survey:Energy Report, London, The Stationery Office.

25
[20] Hunt and Gidman, M.I. (1982) A National Field Survey of House Temperatures,Building and Environment, vol. 17 (2).
[21] Lowe, R.J. Chapman, J. And Everett, R.C. (1985) The Pennyland Project.Open University Energy Research Group, ERG 053/ETSU-S-1046, MiltonKeynes, UK.
[22] Bell, M., Lowe, R.J. and Roberts, P. (1996) Energy Efficiency in Housing.Aldershot, UK: Avebury.
[23] CIBSE (1980) CIBSE Guide A - Section A3 Thermal properties of buildingstructures, Chartered Institution of Building Services Engineers, London.
[24] Lowe, R.J. and Bell, M. (1998) Towards Sustainable Housing: buildingregulation for the 21st. Century. A report for the Joseph Rowntree Foundation,York. Leeds, Leeds Metropolitan University.
[25] Boardman, B. (1991) Fuel Poverty, London, Belhaven Press.[26] Nilsson, P-E, Aronsson, S. and Gustén, J. (1996). Learning form Experiences
With Energy Efficient Retrofitting of Residential Buildings, CADDET Analysisseries No. 18, Sittard, The Netherlands, Centre for the Analysis andDissemination of Demonstrated Technologies.
[27] Walker, J. and Oseland, N. (1997) Energy Advice to Tenants - Does it Work?,London, Institute of Housing.
[28] SEDBUK (1999) Seasonal Efficiency of Domestic Boilers in the UK(SEDBUK) [Internet] Available from <http://www.sedbuk.com> [accessed 18October 1999].
[29] Buijs, A. and Silvester, S. (1996). Demonstration Projects and SustainableHousing, Building Research and Information, Vol. 24, No. 4 1996.
[30] Walker, E. & Hay, A. (1999) Carbon monoxide poisoning is still anunderrecognised problem. British Medical Journal Vol 319 pp 1082-1083.
[31] CADDET (1999) Building Retrofit saves 51% of district heating consumption,Result 333, DK 99.503/3A.R03, Sittard, The Netherlands, Centre for theAnalysis and Dissemination of Demonstrated Energy Technologies
[32] Lowe, R.J. and Curwell, S.R. (1996) Case study 2: The Longwood Low EnergyHouse. In Energy Efficiency in Housing. by M Bell, R.J. Lowe and P. Roberts.Aldershot, UK: Avebury.
[33] Feist, W. (1994) 95% Heizenergieeinsparung im Passivhaus. das Bauzentrum,4/94.
[34] Olivier, D. & Willoughby, J. (1996) Review of Ultra-low-energy Homes: TenUK Profiles in Detail. BRECSU, General Information Report 39. Watford, UK,Building Research Establishment.
Acknowledgements
We are grateful for the support of the City of York Council and the Department of theEnvironment Transport and the Regions in carrying out this project. In particular, wewould like to thank the staff of the York maintenance section and the tenants for theirinvaluable assistance. We would also like to acknowledge the contribution of the refereeswho made some very detailed and useful comments. Any remaining errors or omissions arethe responsibility of the authors.