energy efficiency why now and how? - puc.state.pa.us€¦ · energy efficiency why now and how ......
TRANSCRIPT

Energy EfficiencyEnergy EfficiencyWhy Now and How?Why Now and How?
Mike OldakMike OldakSr. Dir., State Competitive & Regulatory PoliciesSr. Dir., State Competitive & Regulatory Policies
Edison Electric InstituteEdison Electric InstituteDemand Side Working Group
Harrisburg, PAJanuary 19, 2007
[email protected] 202-508-5523

What is What is ““The Regulatory Bargain?The Regulatory Bargain?””Balance consumer and investor interests
Investments dedicated to the public interest• Return of investment• Return on investment commensurate with the risks
Rates allow company to• Operate successfully• Maintain its financial integrity• Attract capital• Compensate investors for the risks assumed
Federal Power Commission vs. Hope Natural Gas Co.U.S. Supreme Court, 1943

Yes61%
Don't Know16%
No23%
““Are We In An Energy Crisis?Are We In An Energy Crisis?Consumer SurveyConsumer Survey
Source: EEI’s National Public Opinion Monitor Q2 2006 Results
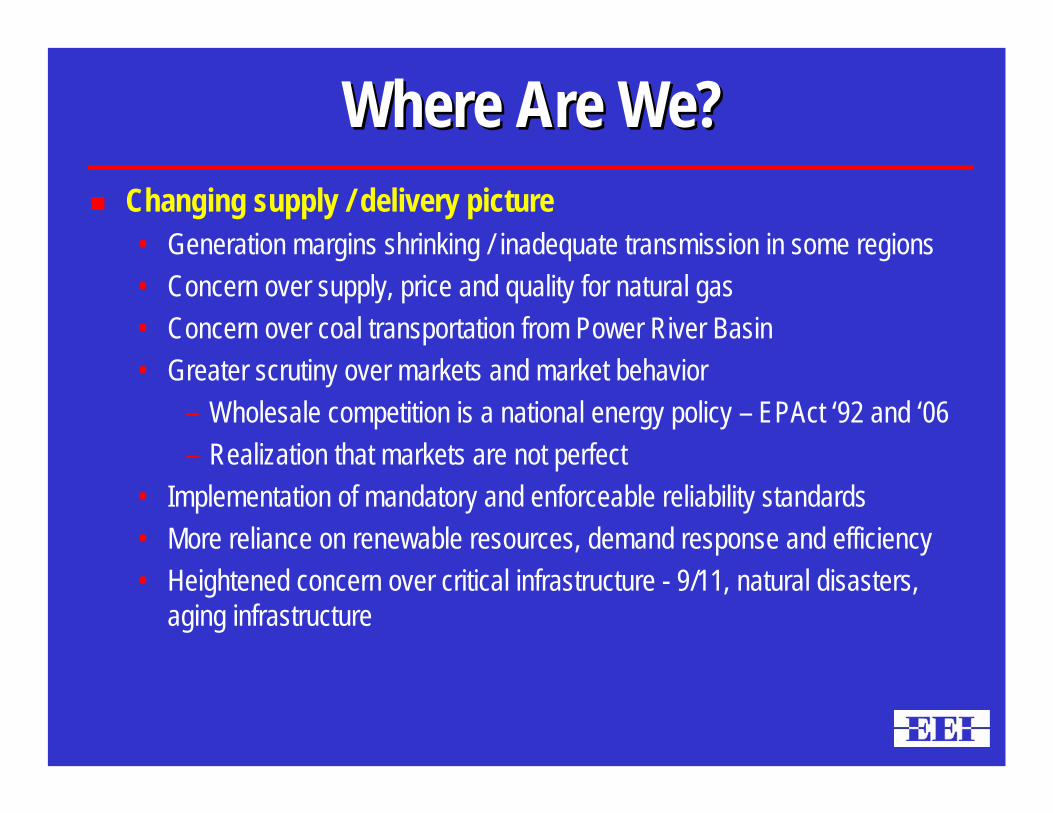
Where Are We?Where Are We?Changing supply / delivery picture• Generation margins shrinking / inadequate transmission in some regions• Concern over supply, price and quality for natural gas • Concern over coal transportation from Power River Basin• Greater scrutiny over markets and market behavior
– Wholesale competition is a national energy policy – EPAct ‘92 and ‘06– Realization that markets are not perfect
• Implementation of mandatory and enforceable reliability standards • More reliance on renewable resources, demand response and efficiency• Heightened concern over critical infrastructure - 9/11, natural disasters,
aging infrastructure

0
1
2
3
4
5
6
7
8
9
1019
85
1987
1989
1991
1993
1995
1997
1999
2001
2003
2005
cent
s / k
Wh
Non-Restructured States
Restructured States
Source: EIA Form 861, EIA Monthly Energy Review March 2006.
Pre-Restructuring Post-Restructuring
Rates Rising In Many StatesRates Rising In Many States
~35% higher Similar increases

Urgent Need For Infrastructure Urgent Need For Infrastructure ExpansionExpansion
SourceSource: : NERCNERC’’ss 2006 Long Term 2006 Long Term Reliability AssessmentReliability Assessment

The Perfect Storm of Energy The Perfect Storm of Energy ChallengesChallenges
Keeping energy demand and supply in balance• Projected doubling (or more) of energy use by 2030
Providing energy security and availability• Geological and geopolitical realities of fuel supply
Harmonizing energy use and the environment• Greenhouse gas emissions and climate change
The Key QuestionThe Key QuestionCan we develop the right mix of supply Can we develop the right mix of supply
and demand side options?and demand side options?

WhatWhat’’s Driving s Driving Today and TomorrowToday and Tomorrow’’ss
Electricity Prices?Electricity Prices?

Generation Options Generation Options ––Affected By Public PolicyAffected By Public Policy
New Generation Capacity By Fuel Since 1950New Generation Capacity By Fuel Since 1950
Source: Henwood Energy Consulting
0
10,000
20,000
30,000
40,000
50,000
60,000
70,000
CAA 1970
The Oil Embargo1973-1974
PURPA1978 CAA Amendments
1990
EPACT1992
RTO NOPR1999
Credit Crash2001
Vertically Integrated UtilitiesPURPA QF
EraEWGs
Cap
acity
Inst
alla
tions
(MW
)
Coal Hydro Renewables Uranium
Fuel Oil Natural Gas
Rise of the Merchant
20061998199019821974196619581950

Fuel Costs Increasing DramaticallyFuel Costs Increasing Dramatically
0
50
100
150
200
250
300
350
400
Coal Residual Oil Natural GasSource: U.S. DOE/Energy Information Agency & U.S. DOL/Bureau of Labor Statistics
(January 2006)
Percentage increase 1999 – 2005
400%400%
300%300%
150%150%

Needed Generation InvestmentNeeded Generation Investment$300 billion needed for new capacity Conservation and other measures reduced need by 60%
Projected Capacity Additions
0
20
40
60
80
100
120
2005 - 2009 2010 - 2014 2015 - 2019 2020 - 2024 2025 - 2030
Time Period
Cap
acity
Add
ition
s (G
W)
Coal Steam Combined Cycle Nuclear CTs Renewables
Source: EIA Annual Energy Outlook 2006.
CoalNuclearRenewables

““Is Global Warming Really Happening?Is Global Warming Really Happening?””Consumer SurveyConsumer Survey
Yes72%
Don't Know10%
No18%
Source: EEI’s National Public Opinion Monitor Q2 2006 Results

Environmental Costs IncreasingEnvironmental Costs Increasing$24 Billion on compliance with federal environmental laws (2004-2005)$47 Billion projected 2007-2025 for Nitrogen oxides, sulfur dioxides and mercury$14 Billion in scrubber upgrades being contemplatedSince 1980, companies reduced air emissions while increasing electric production by 75%

Needed Renewable InvestmentsNeeded Renewable InvestmentsRenewables (wind, solar, geothermal, and biomass) will become a bigger part of the nation’s fuel mix – “20% by 2020”
Current and future challenges • Geographic limitations• Intermittent nature• Transmission availability• Expiration of production tax credit
Wind and solar require more back-up capacity because their power output is intermittent
Renewable technologies face high initial capital costs

8,3548,2387,9066,964
5,8034,8174,4304,217
4,8974,323
0
1,000
2,000
3,000
4,000
5,000
6,000
7,000
8,000
9,000
2000 2001 2002 2003 2004 2005 2006 2007 2008 2009
mill
ions
of d
olla
rs (R
eal (
$ 20
05))
Note: In 2004 and 2005, the industry exceeded investment projections in their transmission capital budgets. The Handy-Whitman Index of Public Utility Construction Costs used to adjust for inflation from year to year. Data represents both vertically integrated and stand-alone transmission companies. *Planned total industry expenditures are preliminary and estimated from 90% response rate to EEI’s Electric Transmission Capital Budget & Forecast Survey. Actual expenditures from EEI’s Annual Property & Plant Capital Investment Survey & Form 1s.
Planned*Actual
Needed Transmission InvestmentNeeded Transmission Investment$31.5 Billion planned

Needed Distribution InvestmentNeeded Distribution InvestmentAverage of $13 billion per year over next 10 years
Replace aging infrastructure
Modernize system management and control $0
$2,000$4,000$6,000$8,000
$10,000$12,000$14,000$16,000
1975
1980
1985
1990
1995
2000
2005
Distribution Investment (Nominal)Distribution Investment (Real)

Rate Caps EndingRate Caps EndingRestructuring legislation reduced and froze rates from 2-10 years but actual costs were increasing!
0
2
4
6
8
10
12
14
16
Date 2002 2003 2004 2005 2006 2007 2008 2009 2010 2011
Rate
Fre
ezes
End
ing

Other Factors Impacting RatesOther Factors Impacting RatesCritical Infrastructure Protection / Post 9-11 realities• Secure infrastructure
Regional Transmission Organization (RTO) costs• Enables efficient, competitive markets for customers
Pension funding and rising health care costs• Critical, highly technical industry must recruit / retain the
very bestDisaster recovery• Enables swift future restoration efforts

Which Way Which Way Will We Wander?Will We Wander?

Energy EfficiencyEnergy Efficiency
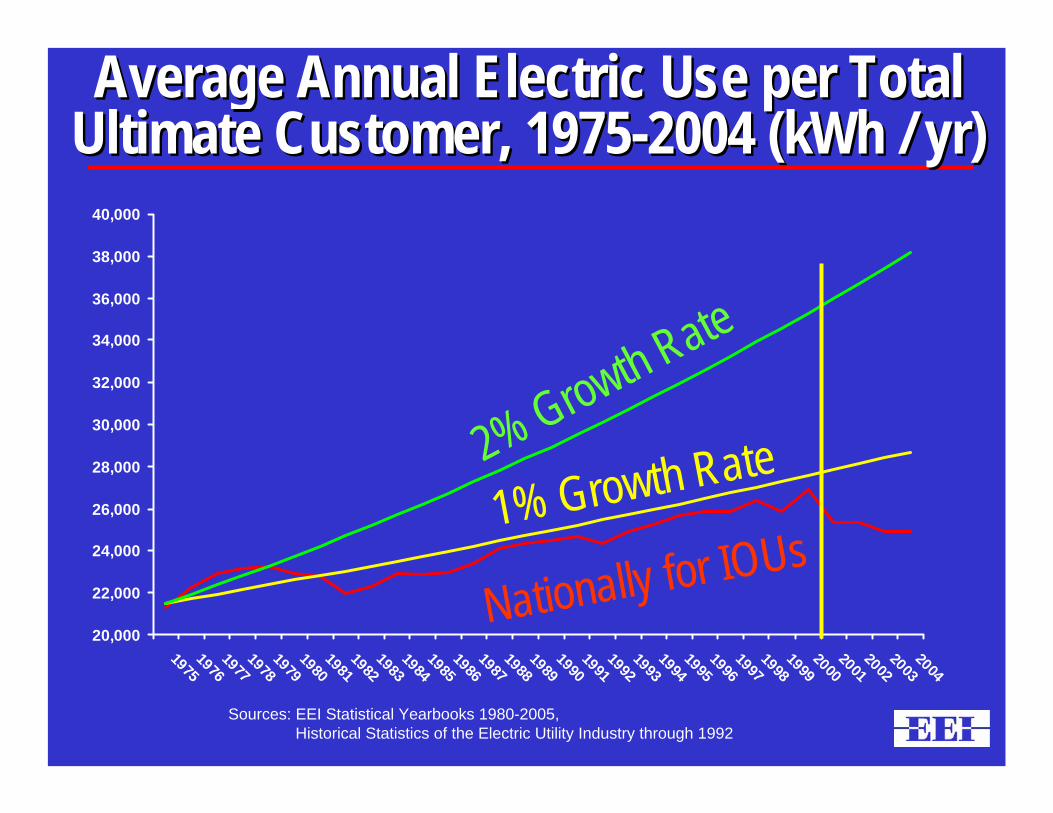
Average Annual Electric Use per Total Average Annual Electric Use per Total Ultimate Customer, 1975Ultimate Customer, 1975--2004 (kWh / yr)2004 (kWh / yr)
20,000
22,000
24,000
26,000
28,000
30,000
32,000
34,000
36,000
38,000
40,000
197519761977197819791980198119821983198419851986198719881989199019911992199319941995199619971998199920002001200220032004
Sources: EEI Statistical Yearbooks 1980-2005,Historical Statistics of the Electric Utility Industry through 1992
1% Growth Rate 2% Growth Rate
Nationally for IOUs
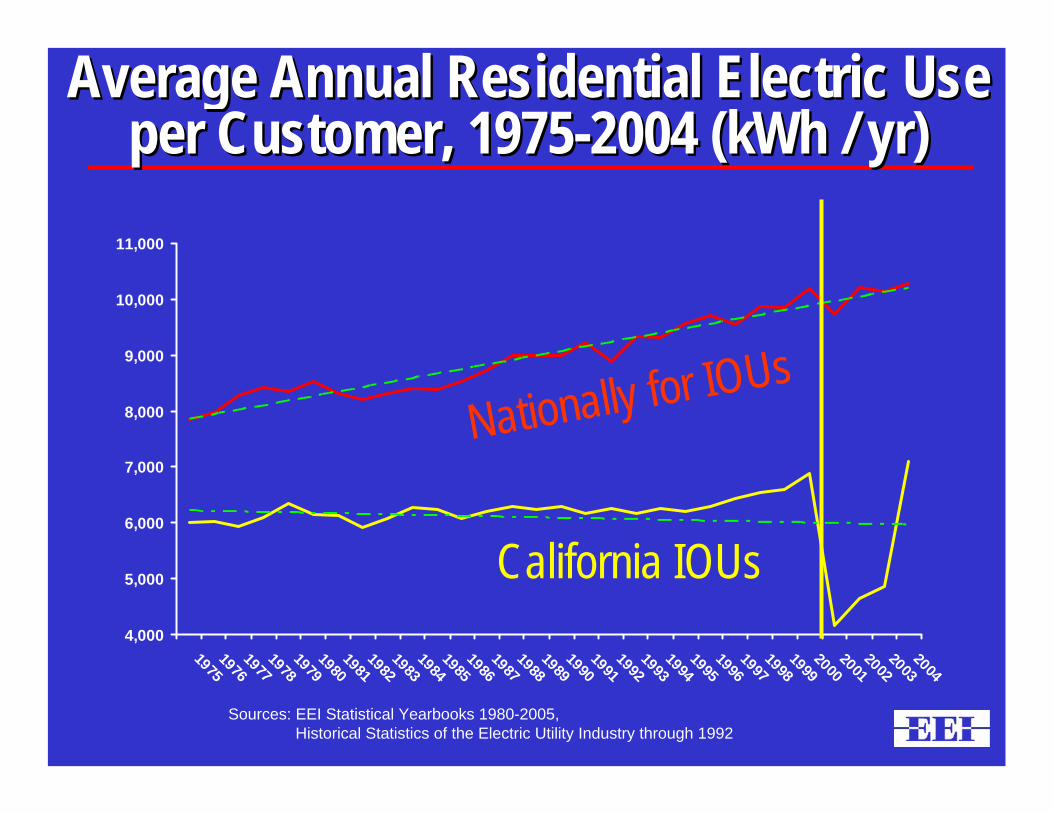
Average Annual Residential Electric Use Average Annual Residential Electric Use per Customer, 1975per Customer, 1975--2004 (kWh / yr)2004 (kWh / yr)
4,000
5,000
6,000
7,000
8,000
9,000
10,000
11,000
197519761977197819791980198119821983198419851986198719881989199019911992199319941995199619971998199920002001200220032004
Sources: EEI Statistical Yearbooks 1980-2005,Historical Statistics of the Electric Utility Industry through 1992
California IOUs
Nationally for IOUs

Utility Demand Side Management Utility Demand Side Management Program Expenditures IncreasingProgram Expenditures Increasing
0
3000
6000
9000
12000
15000
18000
21000
24000
27000
1989
1990
1991
1992
1993
1994
1995
1996
1997
1998
1999
2000
2001
2002
2003
Source: Energy Information Administration. Some utilities were spending money on DSM as early as 1976. National data is not available for expenditures from 1976-1988.
19891989--2003 (Million $)2003 (Million $)

Energy Savings Substantial Energy Savings Substantial
0
100000
200000
300000
400000
500000
600000
700000
1989
1990
1991
1992
1993
1994
1995
1996
1997
1998
1999
2000
2001
2002
2003
Source: Energy Information Administration
Utility DSM ProgramsUtility DSM Programs19891989--2003 (Million kWh)2003 (Million kWh)
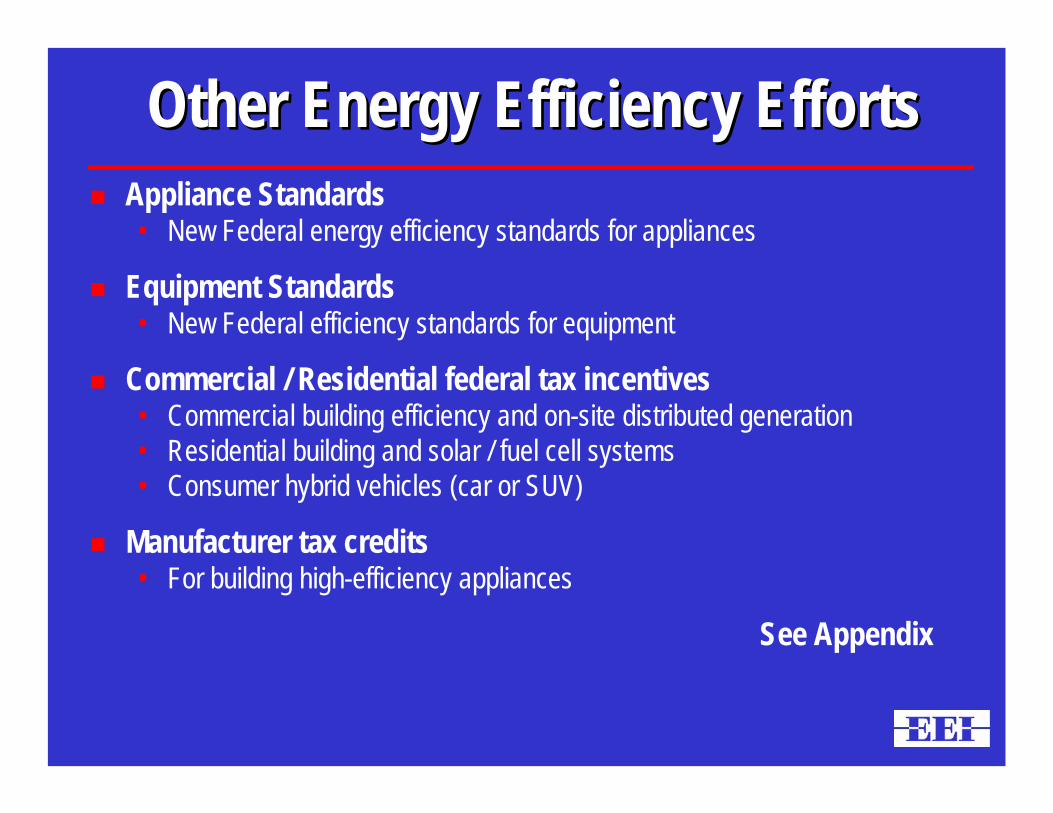
Other Energy Efficiency EffortsOther Energy Efficiency EffortsAppliance Standards• New Federal energy efficiency standards for appliances
Equipment Standards• New Federal efficiency standards for equipment
Commercial / Residential federal tax incentives • Commercial building efficiency and on-site distributed generation• Residential building and solar / fuel cell systems• Consumer hybrid vehicles (car or SUV)
Manufacturer tax credits • For building high-efficiency appliances
See Appendix

Where Does This Leave Utilities?Where Does This Leave Utilities?Utilities are uniquely positioned to increase end-use efficiency, develop new demand-responsive loads• Unique position to use economies of scope and scale• Knowledge of customers’ loads & processes• Knowledge of wholesale market rules & needs• Provide rates, metering, billing
But there are challenges
Options• Rate structure reform – proper pricing signals
– Appropriate customer charges, standby-rates, avoided costs• Broad revenue decoupling or true up mechanism• Contract demand

Where Does This Leave Utilities?Where Does This Leave Utilities?It Depends?It Depends?
Is full recovery dependent upon meeting sales expectations?• Has the PUC anticipated / compensated the utility for the reduction in sales?• Are rates designed to recover fixed costs regardless of thru-put?
Is there some financial flexibility to maintain the system and meet growth?
Is there a “true-up” mechanism or is a new rate case required?
This is important! • A 10% reduction in sales can lead to bankruptcy for a wires only company• Adds a critical risk factor to credit ratings increasing cost of capital• Increases revenue volatility• Undermines authorized revenue recovery between rate cases

True Up For Lost RevenuesTrue Up For Lost RevenuesDecoupling Decoupling -- Why and HowWhy and How
Many different techniques – some not as good as others• Basic decoupling – adjustments to maintain constant revenues year to year• Full decoupling
– ROE adjusted to interest rates– Operating costs tied to price indicies– Rate base adjusted reflects forecasted capital expenditures
Revenue Surety• Ensures consistent collection of revenues between rate cases to recover
costs and earn its allowed return
Revenue Stability• Reduce earnings volatility and eliminate most if not all incentives to
maximize energy sales or throughput
“[S]tabilized utility’s financial position, lowered … cost of capital, provided low-cost protection against reduced profitability” NRRI

National Regulatory Research Institute National Regulatory Research Institute NRRI 94-14 September 1994
“… break[s] the linkage between sales, revenues and profits by precluding the utility from retaining any revenues that exceed the revenue requirement
Utility has no “incentive to pursue sales opportunities beyond those contained in the forecast”
Makes “the utility whole”
Put DSM on a “more equal footing with supply-side energy sources because the utility is protected against reduced profitability as a result of the promotion of DSM”
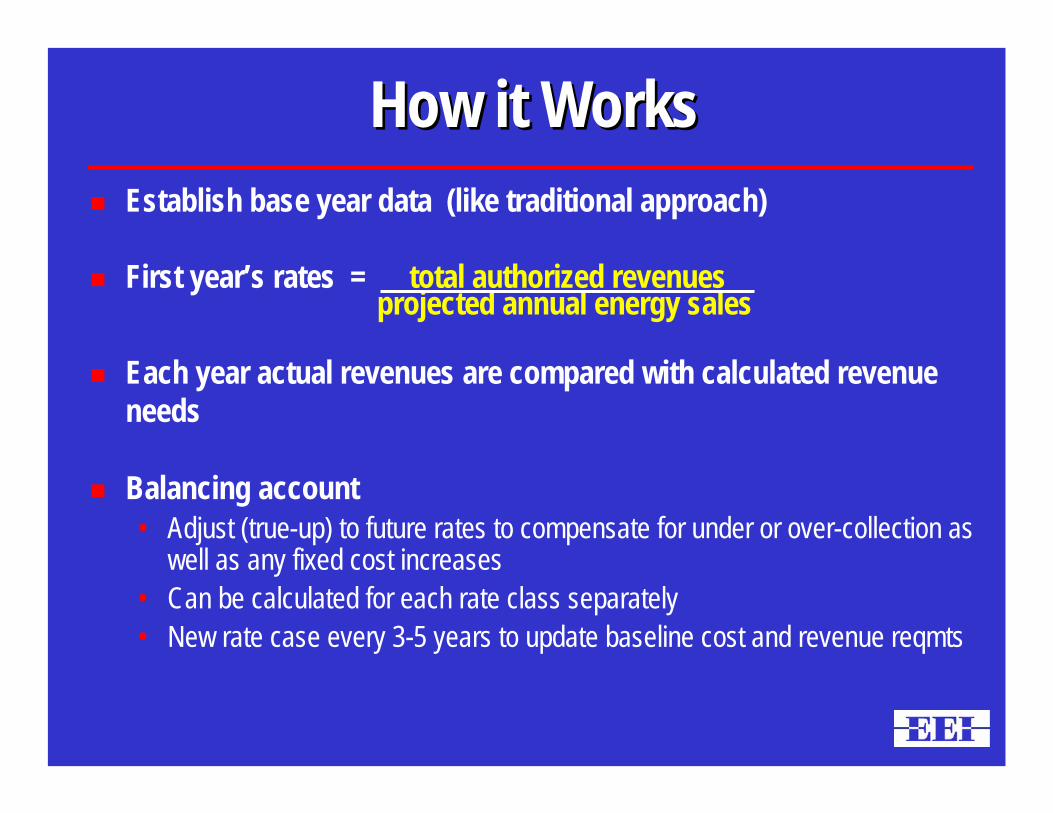
How it WorksHow it WorksEstablish base year data (like traditional approach)
First year’s rates = total authorized revenuesprojected annual energy sales
Each year actual revenues are compared with calculated revenue needs
Balancing account • Adjust (true-up) to future rates to compensate for under or over-collection as
well as any fixed cost increases• Can be calculated for each rate class separately• New rate case every 3-5 years to update baseline cost and revenue reqmts

Electric Decoupling Electric Decoupling ––ExampleExample
Regulators establish an electricity sales forecast (e.g., 100 kWh)
Determine an authorized revenue requirement • Fixed costs of production (e.g., $6.00)• Variable costs of production (e.g., 4¢ / kWh)• Total revenue requirement $10 ($6.00 + (100 kWh * 4¢ / kWh))
Rate per kWh = total revenue requirement = $10 = 10¢ / kWhsales forecast 100 kWh

Below Forecast ExampleBelow Forecast ExampleIf actual sales fall short (efficiency / conservation programs work)• Forecasted 100 kWh Actual only 95 kWh
Actual Costs• Variable cost = 4¢ / kWh x 95 kWh = $3.80• Fixed cost = $6.00• Actual cost = $3.80 + $6 = $9.80
Actual revenues • 95 kWh x 10¢ / kWh = $9.50
Utility under-collects its fixed costs by $0.30

Above Forecast ExampleAbove Forecast ExampleIf actual sales exceed forecast • Forecasted 100 kWh Actual 105 kWh
Actual Costs• Variable cost = 4¢ / kWh x 105 kWh = $4.20• Fixed cost = $6.00• Actual cost = $4.20 + $6 = $10.20
Actual revenues • 105 kWh x 10¢ / kWh = $10.50
Utility over-collects its fixed costs by $0.30

The PG&E ExperienceThe PG&E ExperienceElectric Revenue Adjustment Mechanism (ERAM) for non-fuel costs • (O&M, A&G, depreciation, taxes, and return)
Energy Cost Adjustment Clause (ECAC) for fuel / fuel-related costs
Attrition Rate Adjustment (ARA) to allow utility to earn authorized return in attrition year• Annual ARA mechanism recovers cost increases from customer
growth, inflation, aging facility replacement• PG&E position
– ARA essential for successful functioning of ERAM

PG&E DetailsPG&E DetailsPreparation• Costs are segregated by type (non-fuel, fuel)• Target revenues are set and authorized by regulators
Operation• Actual revenues matched with authorized revenues• Difference reflects difference between actual / forecast sales
– Weather, economy, conservation, energy efficiency, and rate design• Difference, plus interest, tracked and refunded to or recovered from,
ratepayers in future rates
Result• Earnings not affected by sales fluctuations, so no disincentives for energy
efficiency or conservation
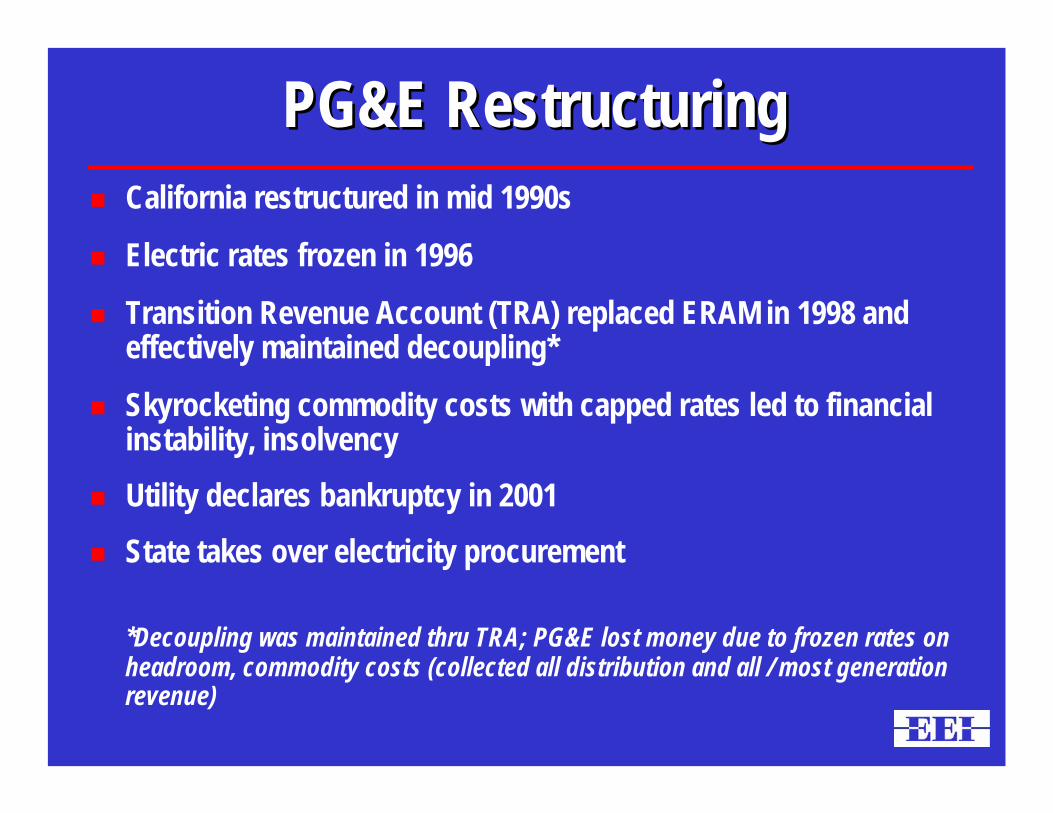
PG&E RestructuringPG&E RestructuringCalifornia restructured in mid 1990s
Electric rates frozen in 1996
Transition Revenue Account (TRA) replaced ERAM in 1998 and effectively maintained decoupling*
Skyrocketing commodity costs with capped rates led to financial instability, insolvencyUtility declares bankruptcy in 2001State takes over electricity procurement
*Decoupling was maintained thru TRA; PG&E lost money due to frozen rates on headroom, commodity costs (collected all distribution and all / most generation revenue)

PG&E Decoupling II PG&E Decoupling II –– Post BankruptcyPost BankruptcyRevenue adjustment mechanisms reinstituted in basically pre-restructuring format
One difference: further segregation of costs
Current cost categories include:• Energy resource costs (ERRA) (fuel, fuel-related)• Electric distribution costs (DRAM)• Retained utility generation costs (UGBA)• Public Purpose Program costs (PPPRAM)• Nuclear Decommissioning costs (NDAM)

PG&E Decoupling II PG&E Decoupling II –– The LawThe LawDecoupling provision added to state law April 2001
Public Utilities Code Section 739.10:• “The Commission shall ensure that errors in estimates of
demand elasticity or sales to not result in material over or undercollections of the electrical corporations.”
Interpreted as requiring comprehensive application of revenue adjustment mechanisms
All but about 6% of PG&E’s electric revenues are now decoupled (exception: transmission)

San Diego Gas & ElectricSan Diego Gas & ElectricIn 2004 switched to a rate indexing mechanism that includes decoupling
Base revenues increase annually by increase in CPI within limits• Share base revenues that exceed authorized Rate of Return plus 50 basis
points• If 175 basis points up or down, anyone can file for suspension of program• If 300 basis points up or down, automatic suspension• Formula-based performance measures for customer service, safety,
reliability

Lawrence Berkley Lab ReportLawrence Berkley Lab ReportDecoupling . . .• “has had a negligible effect on rate levels and has, for PG&E,
actually reduced rate volatility” and
• “the clearing of ERAM balances has accounted for only a small portion of total change in revenue requirements between 1983-1993”

Other StatesOther StatesNY – Rejected because of negative impact on rate stability
ME – Discontinued after 2 yrs due to large deferrals
OR – Denied PGE proposal (2002) (Goals achievable in other ways)
FL – Discontinued (~1997) moved to a rate cap and revenue sharing mechanism
MT – Discontinued (~1997) with advent of restructuring

A New Regulatory Bargain?A New Regulatory Bargain?Not really! Still . . .• Recovery of investments dedicated to the public interest• Return on investments commensurate with the risks
Decoupling helps to reduce utility risks• Without decoupling
– Utilities must file for new rates reflecting lower usage– Rate cases worry investors, increase cost of capital – Consumer costs pay for increased risk
• With decoupling – Utilities need not file– Revenues stabilized, risks reduced– Consumers benefit
Requires regulator commitment to proper application
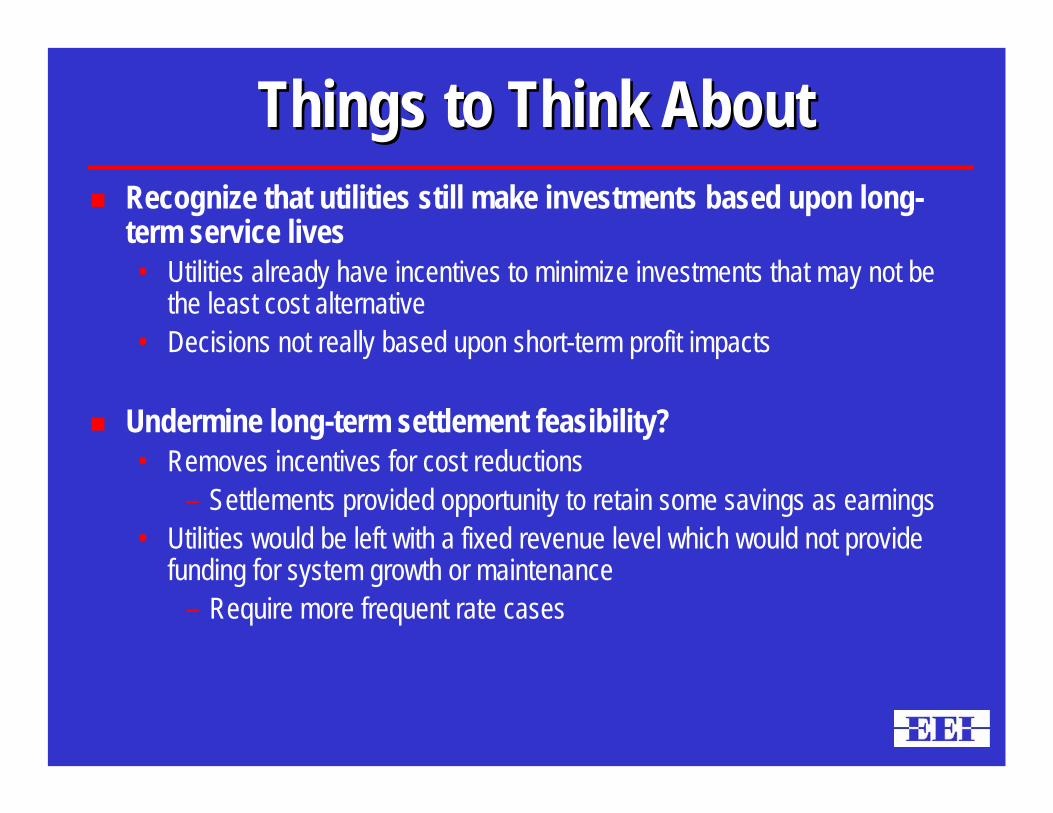
Things to Think AboutThings to Think AboutRecognize that utilities still make investments based upon long-term service lives• Utilities already have incentives to minimize investments that may not be
the least cost alternative• Decisions not really based upon short-term profit impacts
Undermine long-term settlement feasibility?• Removes incentives for cost reductions
– Settlements provided opportunity to retain some savings as earnings• Utilities would be left with a fixed revenue level which would not provide
funding for system growth or maintenance– Require more frequent rate cases

Things to Think AboutThings to Think AboutRate stability• How long between adjustments to avoid passing through large deferrals• Can deferral be recovered within 2 years per GAAP or will utility be
pressured to write-off decoupling related deferrals?
Reliability• Holding revenues fixed without regard to customer / demand growth and
need to replace aging infrastructure would limit cash flow available for delivery system infrastructure investments
• Absent rate base adjustments for forecasted capital expenditures
Rate Design• Is proper rate design the first step before decoupling?• Does decoupling reduce incentive for more efficient rate design?

More?More?Only have half the answer!
Decoupling eliminates disincentive to pursue load reducing programs – energy efficiency, conservation, etc.
Decoupling does not provide an incentive • Performance bonus examples
– Annual Energy Efficiency / DSM performance incentive (AZ)– Incentive payments (CT,MA, NH, NY, RI)– Shared savings DSM (MN)– 5% incentive over allowed ROE (NV) – Restores ROE on DSM investments to overall return (WI)

Alternative RegulationAlternative RegulationEarnings / Revenue Sharing / IncentivesEarnings / Revenue Sharing / Incentives
Revenue / Earnings sharing – most used• File if ROE below certain level or require refunds if above • Sharing above or below deadband
– Deadband around ROE– Deadband around revenues
Less used• Variable sharing
– Savings above level split 90% R/Ps 10% S/Hs– Costs split 90% deferral account 10% R/Ps
• Distribution reliability – Replace “reward / penalty” with incentives based on portion of
distribution budget spent, unspent amount credited to R/Ps• S/Hs share first to offset AFUDC, then depreciation
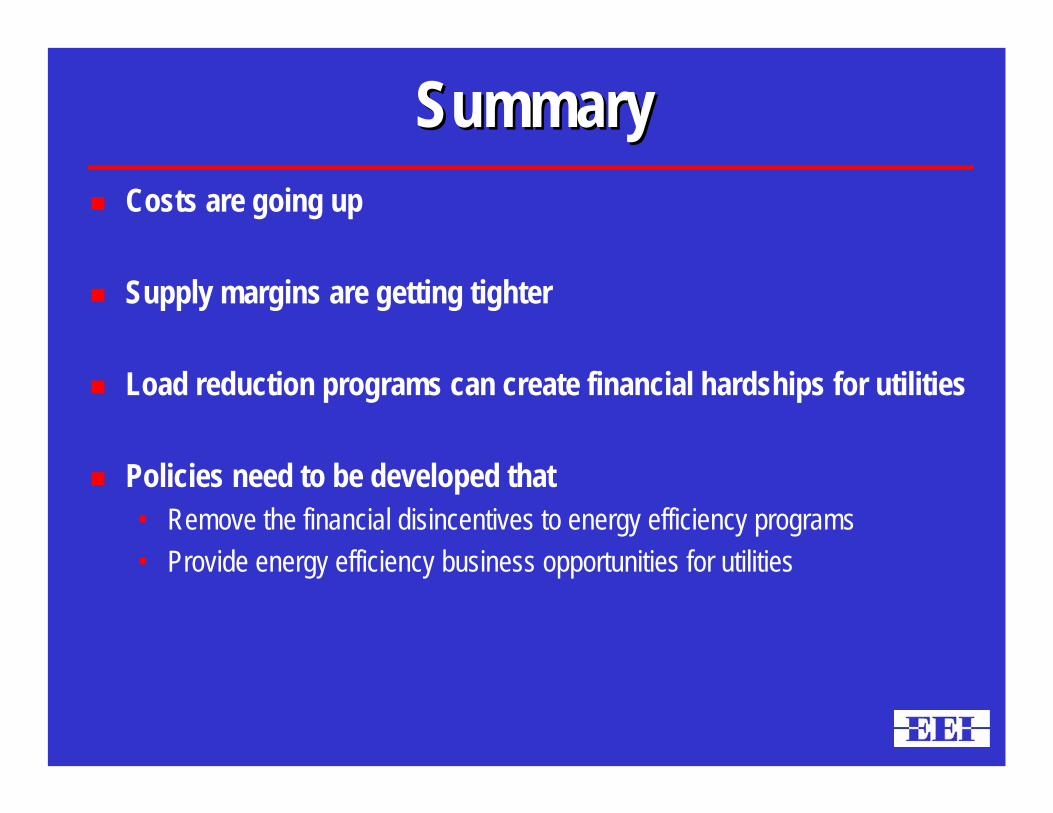
SummarySummaryCosts are going up
Supply margins are getting tighter
Load reduction programs can create financial hardships for utilities
Policies need to be developed that • Remove the financial disincentives to energy efficiency programs• Provide energy efficiency business opportunities for utilities

Appendix Appendix
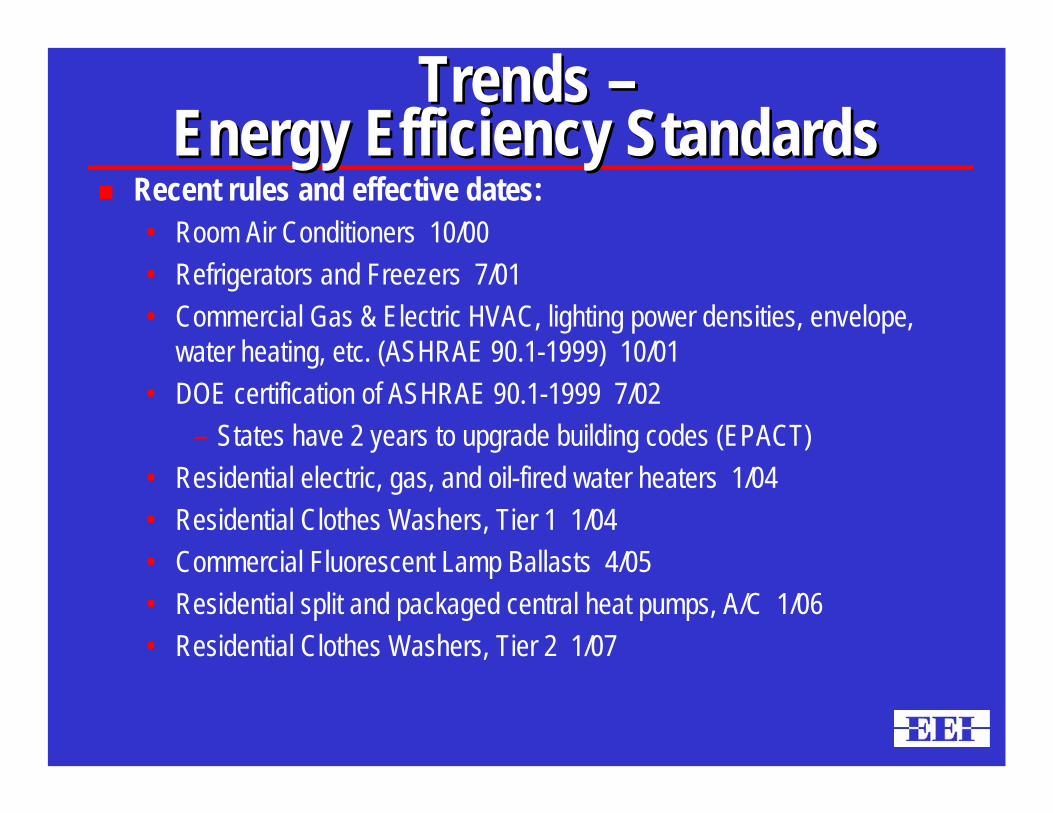
Trends Trends ––Energy Efficiency StandardsEnergy Efficiency Standards
Recent rules and effective dates:• Room Air Conditioners 10/00• Refrigerators and Freezers 7/01• Commercial Gas & Electric HVAC, lighting power densities, envelope,
water heating, etc. (ASHRAE 90.1-1999) 10/01• DOE certification of ASHRAE 90.1-1999 7/02
– States have 2 years to upgrade building codes (EPACT)• Residential electric, gas, and oil-fired water heaters 1/04• Residential Clothes Washers, Tier 1 1/04• Commercial Fluorescent Lamp Ballasts 4/05• Residential split and packaged central heat pumps, A/C 1/06• Residential Clothes Washers, Tier 2 1/07

EPAct 2005 Mandated National EPAct 2005 Mandated National Equipment Efficiency StandardsEquipment Efficiency Standards
Lighting (exit signs, fluorescent & mercury vapor ballast)Commercial Refrigerators and FreezersRooftop Packaged Air Conditioners and Heat PumpsDry-Type TransformersCommercial Ice MakersRefrigerated Beverage Vending MachinesCommercial Clothes WashersCommercial Pre-Rinse Spray Valves (for dishwashers)Compact Fluorescent LampsTorchiere lighting fixturesCeiling FansCeiling Fan Light KitsDehumidifiersBattery ChargersExternal Power Supplies (“wall packs”) Unit Heaters (Only GAS product and No Oil products)

EPAct 2005 Commercial Tax EPAct 2005 Commercial Tax Incentives / StrategiesIncentives / Strategies
Summary:• Tax deduction for exceeding efficiency baseline by 50%
– $1.80 per square foot for commercial buildings that exceed the energy efficiency of a “baseline” building in ASHRAE 90.1-2001 Building Code by 50%.
• Tax deductions for increasing efficiency by 50%– “Sub systems” that increase efficiency by 50%, up to $0.60 per
square foot.
• Tax credits for on-site distributed generation systems– Must meet certain efficiency requirements
NOTE: The window of opportunity for these tax credits and deductions opened on 1/1/06 and closes on 12/31/07

EPAct 2005 Consumer Tax Incentives EPAct 2005 Consumer Tax Incentives --SummarySummary
Tax credits in 2006 and 2007 for:• New High-Efficiency Heating / Cooling Systems• New High-Efficiency Water Heating System• Upgrades to your Envelope (insulation, windows)• Solar Energy and Fuel Cell systems• Hybrid vehicle (car or SUV)
Due to manufacturer tax credits, prices should be coming down for• High-efficiency dishwashers• Clothes washers• Refrigerators
Builders get tax credits for high-efficiency new homes