energy & efficiency managementcbip.org/25262017conferencebatraji/presentation/4.eems.pdf · a...
TRANSCRIPT


Definitions
Heat Rate :There are several different definitions of heat rate that are used. Each definition is valid and useful when properly applied and clearly explained to anyone who could come across it. Unfortunately, too often only the term “heat rate” is used, and it is not always clear exactly which “heat rate” is being used. It is very important that additional terms be used so that it is perfectly clear what is meant.
Unit Heat Rate :A “unit” heat rate includes all heat input to the boiler. The heat input to the boiler should include all forms of chemical energy supplied and the “gross” electrical generation. For most functions (daily/monthly/annual reporting, comparison/ benchmarking of units) unit or plant heat rate should be used.
Net Unit Heat Rate :A “unit” heat rate includes all heat input to the boiler. The heat input to the boiler should include all forms of chemical energy supplied and the “net” electrical generation i.e., auxiliary power is to be subtracted from gross electrical energy.
Actual Unit Heat Rate The true heat rate of a unit is usually calculated from the amount of fuel (all fuel, coal, oil, gas, etc.) burned during theperiod, the gross calorific value of the fuel, and the generation for the period. The integrated readings of fuel burned andgeneration are (i.e. daily, weekly, or monthly) used to calculate the actual heat rate. Actual heat rate includes fuel burned during startups, and includes the negative net generation during off-line periods.
Definitions

Design Unit Heat Rate The heat rate on a unit varies with both load and ambient conditions (air and cooling water temperature). However, one “design” heat rate number is frequently published for a unit. It is the heat rate the designer anticipates will occur at thedesign condenser pressure and a certain load. Whenever it is given, the unit condition should also be specified (such as “maximum continuous rating” (MCR) or the load when the turbine valves are wide open (VWO), etc.).
Reference Unit Heat Rate This is the heat rate the unit is capable of obtaining, based on the initial design configuration. It is usually derived from the turbo generator and boiler performance guarantee or acceptance test results.
Expected Unit Heat Rate The heat rate that the unit should be capable of obtaining based on the present design configuration. It is calculated by adjusting the reference heat rate for the effects of permanent modifications to the unit.
Gross Turbine Cycle Heat Rate (GTCHR) A “ Gross Turbine Cycle” heat rate includes only heat input to the turbine cycle. GTCHR is the ratio of total heat input to the turbine cycle and the gross generator output.
Target Unit Heat Rate The heat rate i.e. set as a goal. This is usually based on historical performance along with anticipated changes resulting from improvement activities and uncorrected degradation.
Definitions
On-Line Test Performance testing of unit or equipment with the use of on line instruments and with the use of additional test instruments as applicable such as APH test.
Performance testing with Off- line Instrument Performance testing of unit or equipment with the use of off-line test instruments installed prior to the test along with the use of online unit data as the case may be.
Unit Auxiliary power Consumption total electrical power consumed to operate the generating unit’s auxiliary equipment.
Cleanliness factorRatio of the actual thermal transmittance to the transmittance at 100% clean condition
Condenser air-in-leakageLeakage of air into the condenser steam side
Condenser BackpressureAbsolute pressure on the steam side of the condenser above the tube bundles. It is sometimes referred to as condenser vacuum when referenced to atmospheric pressure. It may not be the same as turbine exhaust pressure.
Definitions

Continuous monitoringMonitoring conducted on a uniform continuous basis, using automated data collection
Correction factorsFactors to be applied to test results to correct for off design or non-standard conditions
Data validationProcess to ensure that the collected data satisfies statistical criteria and complies with the physical laws (thermodynamics,fluid dynamics, etc.) of the process.
Enthalpy-drop testA test conducted to determine the turbine efficiency based on the energy used by a turbine section
Exhaust lossthose losses associated with the steam exiting the low-pressure turbine as a result of kinetic energy changes and pressure drops. They are usually characterized in the thermal kit provided by the turbine manufacturer.
Feed water heater drain cooler approach (DCA)The difference between the shell side drain outlet and the feed water inlet temperatures.
Definitions

Gross generationTotal electrical output from the generator terminals
Heat balance diagramA diagram expressing temperature, pressure, enthalpy, and flow values throughout the cycle for a given set of conditions.
HP-IP turbine shaft leakageThe steam leakage from the HP turbine to the IP turbine through the shaft seals of a combined HP-IP element.
Make-up waterWater added to the cycle to replace losses
Maximum continuous rating (MCR)The contractual maximum continuous rating (MCR) output from a s team generator
Micro foulingFouling of the condenser tube surface due to microbiological growth, deposits or corrosion. This inhibits heat transfer through the tube walls.
Net generationDifference between the electrical generator output and the auxiliary electrical power
Definitions

Performance parametersThose variables in a cycle, which can be measured or calculated which are indicative of the level of performance of a component or system
Reheater pressure dropPressure drop encountered in the reheat section of the boiler including piping
Sequential valve (partial arc control)The operation by which the steam flow arc control into a turbine is governed by opening one or more control valves sequentially
Single valve (full arc control)The operation by which the steam flow into a turbine is governed by opening all control valves simultaneously
Steam path auditAn audit of the turbine steam path that is used to quantify associated performance losses for each nonstandard condition. These performance losses are determined by taking detailed physical measurements of the steam path during a turbine outage.
Definitions

Sub coolingThe temperature reduction of the fluid below its saturation temperature
Terminal temperature difference (TTD)The difference between the saturation temperature of the heating fluid at shell inlet pressure and the outlet temperature of the heated fluid
Thermal kitA compendium of performance information, generally provided by the turbine – generator manufacturer. These include heat balances of the turbine cycle and correction curves to heat rate and load for deviations from rated values of selected performance parameters.
Main steam flowS/H steam flow at the HP turbine inlet
Turbine choke pointthe operating condition at which further reductions in pressure at the turbine exhaust flange result in no increase in turbine output for a given set of upstream conditions
Turbine efficiencyThe ratio of the actual enthalpy change in the turbine to the isentropic enthalpy change
Definitions

Turbine exhaust pressureThe LP turbine exit pressure measured at the exhaust flange. It may not be the same as the condenser backpressure.
Valve pointThe valve position just before the succeeding valve starts to open
Valve point loadingThe technique of loading a unit at its valve points to maximize its efficiency
Valves Wide Open (VWO)The valve setting, which correspond to all turbine control valves full open.
Variable pressure operationAn operating method in which the load is changed by varying throttle pressure for a fixed valve position (Multiple combinations of valve position may be utilized)
The first Law of ThermodynamicsThe first law of thermodynamics is nothing more than a restatement of the law of the conservation of energy for the special case involving energy transfer across a system boundary in the form of work or heat. According to the principle of conservation of energy, whenever there is any net transfer of energy inward across the boundary of a system, the stored energy of the system increases by an amount equal to the net energy transferred. Conversely, if there is a net transfer of energy out of a system during any process, the stored energy of the system decreases by an amount equal to the net energy removed. It is said that in a thermodynamic process, energy can neither be created nor destroyed i.e.; the total energy remains constant.
Definitions

The first Law of ThermodynamicsThe first law of thermodynamics is nothing more than a restatement of the law of the conservation of energy for the special case involving energy transfer across a system boundary in the form of work or heat. According to the principle of conservation of energy, whenever there is any net transfer of energy inward across the boundary of a system, the stored energy of the system increases by an amount equal to the net energy transferred. Conversely, if there is a net transfer of energy out of a system during any process, the stored energy of the system decreases by an amount equal to the net energy removed. It is said that in a thermodynamic process, energy can neither be created nor destroyed i.e.; the total energy remains constant.
The second law of thermodynamicsThe second law of thermodynamics deals with the feasibility of certain occurrences. The second law denies the possibility of completely converting into work all the heat supplied to a system operating in a cycle, no matter how perfectly designed or skillfully made the machine may be.
A rotating flywheel is brought to rest by friction in its bearing. The temperature of the bearing rises. The increase in the internal energy is equal to the original kinetic energy of the flywheel.
Can the flywheel in the second example start rotating as the bearing cools down until the bearing temperature is restored to its original value and the flywheel once again has its original kinetic energy? Again, the answer obviously is no.
The second law of thermodynamics states that it is impossible to construct a device that will operate in a cycle and produce no effect other than the abstraction of heat form a single reservoir and performance of an equivalent amount of work
Definitions

Entropy
It is not enough to know an amount of heat transferred; when we consider how much work might be done with that amount of heat, we must also know the temperature at which it is transferred. We see that for certain amount of heat transferred, the ability of that heat to do work is dependent upon the temperature at which it is transferred. Entropy is a measure of the amount of energy that is not usable and unlike energy, entropy can not be conserved. Work and mechanical energy are fully useable and therefore have no associated entropy. Processes that generate entropy are irreversible. Entropy associated with heat transfer to or from a heat source or heat sink at a temperature T is,
dS = dQ/Tabs
dS = Change in EntropydQ = Change in EnthalpyTabs = Temperature at which heat is transferred.
The value of entropy decreases as the temperature at which the heat is transferred increases. A low value of entropy means that, for a given amount of heat transferred, more work is able to be done than if the entropy were higher.
Definitions

Example :Initial Enthalpy in the teapot = 200 kjInitial Teapot Temperature = 373 K (100º C)Final Teapot Temperature = 293 K (20º C) Mean Teapot Temperature = (373+293)/2 = 333 K (66º C) Final Enthalpy of Teapot = 40 kjEnthalpy delivered by the teapot to its surroundings = 200-40 = 160 kjEntropy delivered by the teapot to its surroundings = 160 kj/333K Entropy delivered by the teapot to its surroundings = -0.48 kj/K Mean Temperature of air = 293 K (20º C) Entropy received by the air = 160 kj/293K Entropy received by the air = +0.546 kj/293K The overhaul change in entropy of the teapot and surroundings = -0.48 + 0.546 kj/K = + 0.066kj/k
For this reason entropy is sometimes referred to as a measure of the inability to do work for a given amount of heat transferred.
Definitions

Baseline for Comparison

Baseline for Comparison
Design
One baseline that the current performance of the unit could be compared to is the“design” heat rate. From the point of view of setting up the tracking system, this isthe easiest baseline to obtain. However, there are several problems with thismethod:
The actual initial performance of the unit may have never reached the design, or even ifit did, the performance of some areas may have been better, while others were worse.
The “design” heat rate is based on some ambient conditions that vary during the year.Frequently the design heat rate is calculated at some design condenser pressure (or inletwater temperature). During some parts of the year, the condenser pressure should belower than the design; therefore the heat rate should be lower than the design.
Over time, as changes are made to the plant, the “original design” may not represent the “current design” performance of each parameter or the overall heat rate
Performance Guarantee Test
A better baseline to use would be the performance guarantee (acceptance) testresults. It represents the performance level that was achieved when the unit wasnew, and as such, it is a level that should be achievable. (It may not be economicallyfeasible to return all equipment to this level, but it is possible.) There are threeproblems with this method
While the results of the acceptance test are achievable, they may not be the best possible.For example, the vendor is usually only interested in demonstrating that the guarantee canbe met. Sometimes, the performance can be improved by minor adjustments to operatingset points, to achieve even better performance.
The operating conditions under which the acceptance tests were run may not be possiblefor everyday operation, as acceptance tests are run with the makeup isolated, no sootblowing, no sluicing, etc.
Over time, as changes are made to the plant, the “original design” may not represent the“current design” performance of each parameter or the overall heat rate.
PG Test are not done for all units of a stations and PG test data for very old units may not be available
Baseline for Comparison

Baseline for Comparison
Historical Operating Test Data
Sometimes, a unit did not have an acceptance test. For those units, historicaloperating/test data, taken from a certain time period when the unit operation wasconsidered to be “good”, can be reviewed to determine what level of performance ispossible. A large amount of data should be collected when the unit is operating at steadystate conditions, and using some “engineering judgment” a curve can be drawn throughthe “better” points. There are two primary problems with this method:
The available operating data may not represent the best achievable performance
The “best” data for one parameter (which occurred at one point of time), whencombined with the “best” data for another parameter (which occurred at a different point oftime), may not be achievable together, or may not result in the best overall unit performance.For example, for some load, at some time, the amount of combustible matter in the fly ashmay have been very low. At some other time the amount of excess air at the same load mayhave been low. However these two levels cannot occur at the same time.

Benchmarking Of Similar Units
A fourth method that can be used is similar to the previous method but, instead of looking at theperformance of a particular unit, all similar units in the utility or in the industry are surveyed.Then operating or test data from the better or best performing unit(s) is reviewed and used toset expected levels. Potential problems with this method include the two problems mentionedabove. Also, care must be taken when picking units to use. Just because the design of a unit isthe same as another, other factors can cause differences in their performance. An obviousexample would be the type of coal being burned and ash characteristics. A low ash fusiontemperature coal will be fired differently, and the expected exit gas temperatures, total air, etc.,for the two should be different. Another example is the condenser cooling water source at onelocation may allow that plant to maintain a certain cleanliness factor, whereas the water atanother location may cause faster fouling and a lower average cleanliness factor.
Baseline for Comparison

Baseline for ComparisonExpected” Performance
The last method, and the one that is recommended, is to compare the actual currentperformance to an “expected” value. Design heat rate is taken as reference.
Expected Boiler efficiency: In design, boiler efficiency projections, OEM has generally consideredvery high margin of unburnt loss and most of the stations are achieving unburnt carbon lossmuch less than the design projections. In order to make it more realistic, expected boilerefficiency is calculated by considering expected Unburnt loss (%) , based on best achievedvalue of the units. Expected Dry Flue gas Loss is also calculated using expected Unburnt loss.
Expected Unit Heat rate = Design GTCHR*100/Expected Blr. Effy
Test Corrected Boiler efficiency of a unit is corrected to design coal and design A/H air inlettemperature to arrive at Corrected Boiler Efficiency, which can be compared with expectedboiler efficiency.
Test gross turbine cycle heat rate of unit is corrected to design cooling water inlet temperatureto arrive at corrected GTCHR.
Test corrected Unit Heat rate = Test Corrected GTCHR*100/Test Corrected Blr. Effy.

Heat rate Assessment

Heat rate AssessmentMONITORING OF PRIMARY PROCESS INDICATORSPurposeHeat rate monitoring is focused on identifying heat rate gaps and then identifying and implementing corrective actions to eliminate the efficiency loss. In this approach, heat rate deviations from expected or design levels are identified and quantified. Then using fault trees or other resources the cause(s) of such gaps are identified. This method is useful, but the fact is, the heat rate should not be allowed to deteriorate to the point that unexpected or unknown deviations exist.
The personnel operating or maintaining the equipment should be aware of equipment deterioration and suitable corrective action should be taken prior to the point that it significantly impacts the heat rate. By following good O&M practices and proactive action, heat rate deteriorations can be avoided (or at least accounted for) before they are reflected in the overall performance statistics.
This pro-active approach is accomplished by identifying key “primary process indicators”, monitoring them and taking corrective actions immediately as indicated. If this is done, the improvement in higher-level performance parameters (heat rate, availability, etc.) will follow.
A secondary purpose for monitoring primary process indicators is to assist data validation/instrument drift and its calibration need. By closely monitoring critical instruments, drifts or irregularities can be quickly identified and the instrument can be calibrated or replaced.

Heat rate AssessmentDefinition of Primary Process IndicatorsIt is the information to be monitored, measured, or tracked that will give an indication that the process is in trouble and needs corrective action (or that there has been a change in the process) prior to seeing adverse impacts to a higher indicator, such as a heat rate deviation.
Some indicators are also “parameters” used to calculate heat rate deviations, such as hot reheat steam temperature. However, most indicators are at a much lower level, such as mill outlet temperature. Normally, heat rate deviations are not calculated for mill outlet temperature, even though it affects the thermal performance (and other characteristics) of the unit. Another example of a primary process indicator is condenser water box differential pressure. If it increases (due to fouling of the inlet tube sheet, for example), it can reduce the condenser circulating water flow, resulting in a higher condenser back pressure and a higher heat rate. Monitoring this differential pressure will immediately show when a change has occurred, and signal for corrective action to be taken, before it adversely affects the unit heat rate.
Each system in the power plant (fuel supply, combustion, feed water, condenser, circulating water, etc.) has multiple Primary Process Indicators that can be used to determine whether the process is functioning as designed, (or if there has been a change to the process).
There are several available sources that can be used to help develop a list of indicators, such as original equipment manufacturers manuals, heat rate deviation fault trees, etc. List of indicators enclosed is considered to be useful in identifying problem in initial stage.

Heat rate AssessmentData Collection and Analysis MethodsThe second step is to determine the data collection methodology for each indicator. Some Primary Process Indicators may be monitored continuously via a computer system or a recorder or indicator in the unit control room. Others may have a site/auxiliary control room/local board indication that is only periodically checked, or only measured during routine or special tests.
List of Primary Process IndicatorsThe following is a partial list of Primary Process Indicators that should be monitored. Because each unit has different designs, this list is only a guide, and items should be added or deleted as necessary. Items marked “(H)” should be given the highest priority, and should be control charted/trend charted on all units. Items marked “(M)” are a medium priority and should be control charted/trend charted wherever practical. Items marked “(L)” are the lowest priority and should be control charted/trend charted where these points are available on a DAS and/or if there are known problems. There are certain parameters which are applicable for the new station only.

Heat rate Assessment
Feed water (Heaters and Feed Pump)d) Feed water temperature at HPH outlet (H)e) � T at Top HPH FW outlet / FW temp after bypass junction (M)f) Heater level (L)g) Heater vent positions (L)
Boiler Feed Pump & TD BFPa) BFP balancing drum leak off (BDLO) pressure (H)b) Ratio of pump amps to feed water flow through the pump (M)c) % of total FW flow carried by each pump (L)d) Recirculation V/V passing (H)e) Steam Flow to TD BFP (M)

Heat rate Assessment
Turbinea) MS pressure (H)b) Pressure ratioi. HPT - First Stage / HPT exhaust (H)ii. IP - inlet / outlet (H)iii. LP - inlet / last extraction (M)c) Ratio of corrected first stage pressure to corrected flow (H)d) Section efficiencies * (M)Feed water (Heaters and Feed Pump)a) Terminal Temperature Differences * (TTD) (M)a) Drain Cooler Approaches * (DCA) (L)b) Water side pressure drop (L)c) Pressure drop in extraction piping (L)

Condensera) Condenser CW Flow (H)b) Air In leakage (H) c) Water box Differential Pressure (H)d) Terminal Temperature Difference (M)e) Temperature Rise (M)f) Deviation from expected Condenser Back Pressure (H)g) Pressure drop across trash rack/traveling water screens (M)h) Condensate sub cooling (L)i) Air steam mixture sub cooling (L) j) Tube Cleanliness factor (M)
Heat rate Assessment
HEAT RATE DEVIATION TRENDING• “Heat Rate parameters” are operating data or calculated values from operating data for which heat rate
deviations can be calculated. • By calculating actual heat rate and comparing the actual heat rate to some “baseline” and trending the
deviation, we can determine if the performance of the unit is improving or deteriorating. One advantage of this method is that the cost of the overall performance deterioration can be calculated
• The magnitude (heat rate deviation) of each problem area can be determined. On an individual unit, the problem areas can be ranked, and the most costly can be prioritized and addressed first.
• The heat rate deviation can be readily converted to a cost. When a corrective action is determined, the cost/benefit of the action can be calculated.
• Trade-off between parameters can be calculated. For example, if a unit is having problems maintaining steam temperatures, a temporary solution might be to increase the air flow to the boiler. Unless you can calculate the heat rate deviation for the low steam temperature and compare it to the heat rate deviation due to the additional airflow, you cannot determine if it is more economical to run at reduced temperature or at higher air flows.
Heat rate Assessment

HEAT RATE DEVIATION TRENDING• Problems at different units can be compared and ranked. By doing this, the problems areas at multiple units
of a plant or over an entire system can be ranked. For example, a 200 MW unit might have a condenser pressure 25 mmHg higher than the “expected” value; a 500 MW unit might have an exit gas temperature 25 0C higher than expected. Unless the impacts of both problems are converted to a heat rate deviation (then cost), which problem should be addressed first cannot be determined.
• Once the heat rate deviations for each parameter are known, they can be summed to give a “accountable” heat rate deviation. Usually this value is smaller than the total heat rate deviation. The difference is the “unaccountable” heat rate deviation, and represents problems areas that are not tracked by a parameter (for example LP turbine efficiency, cycle isolation problems, etc.)
Heat rate Assessment

PARAMETERS TO BE TRACKED• There are two methods to track Heat rate deviation.• First, deviations could be assigned to each equipment, i.e., a heat rate deviation would be computed for the
high pressure turbine, the air pre heater, the boiler, the feed water heaters, the BFP, the condenser, the CW pumps, etc. There are definite advantages to this method, in that it would be known precisely which equipment is not operating or maintained properly. However, the overall performance of most equipment is not continuously monitored, but instead the steam/air/flue gas conditions around the equipment are monitored. For example, if the steam temperature at the intercept valve is low, it is relatively easy to calculate a heat rate deviation for it. It is much time taking to routinely determine the equipment that is causing the deviation, it could be the attemperator valve leaking, the reheater could be fouled or slagged, the gas recirculating fans or high pressure feed water heaters could be out of service, etc.
• The second method of tracking heat rate deviations would then be by steam/air/flue gas conditions, i.e., a heat rate deviation would be computed for the MS temperature, the HRH steam temperature at the intercept valve, the condenser pressure, the flue gas temperature leaving the AH, the flow rate to the APH coils, etc.
• The combination of these two methods is a better way of calculating actual heat rate deviation. Heat rate deviations are calculated for some equipment (i.e., the turbine sections), but most losses are calculated from the conditions of the steam/air or flue gas at various locations (i.e. Main Steam Throttle pressure, condenser pressure, AH exit gas temperature). If one of the steam/air/flue gas conditions is causing a significant deviation, then the next level of analysis is performed to determine the root cause.
Heat rate Assessment

Turbine CycleCondenser Back PressureCondenser back pressure is usually one of the largest heat rate deviations at a plant. As the back pressure in the condenser rises, the amount of energy extracted from each kilogram of steam is reduced. Approximately 1% of the output of the IP/LP turbine will be lost for every 6 mm Hg increase in condenser pressure. Usually a heat rate deviation is calculated due to the difference between the expected and actual condenser pressure. Expected condenser pressure is the pressure arrived after correcting the same for design CW inlet temperature. Condenser performance problems can generally be grouped into three areas: circulating water flow problems, air in-leakage/air removal problems, or poor heat transfer (fouling) problems. For closed-loop cooling systems, the controllable circulating water inlet temperature should also be considered a potential problem area.The first step in diagnosing condenser problems is to pinpoint the area of the problem. It is important to check for corroborating symptoms and to periodically trend the condenser data to identify incipient problems. Most heat transfer (fouling) problems, associated with high backpressure in the condenser, tend to develop slowly. If high backpressure occurs quickly, a problem is suspected with air-in leakage/air removal or circulating water flow.
Heat rate Assessment
Low Circulating Water FlowLow circulating water flow through the condenser tubes results in an increase in the average circulating water temperature. Since a decrease in flow also results in a decrease in water velocity through the tubes, the water has more residence time in the tubes and absorbs more heat. Therefore, the average water temperature increases and the temperature of the circulating water leaving the condenser also rises. Low Circulating water flow may be due to:Circulating Water System/Equipment Problems –• Proper number of circulating water pumps in not service• Pumps are not operating properly • Discharge valves or valves in the system not fully open Plugging—One of the causes of insufficient circulating water flow is tube plugging. Plugging shares symptoms with both low flow and fouling. Plugging problems are typically indicated by a high circulating water temperature rise, high pump discharge pressure, and high differential pressure across the water boxes. If plugging is found, the condenser tube sheet should be cleaned of debris and the source of the material located.Low Water box Level—Another low flow problem involves inadequate venting of the condenser’s water boxes. If
a portion of the tubes do not have circulating water flowing through them, they do not transfer heat and the effective surface area of the condenser is reduced results in higher backpressure. Air in the water boxes shares most of the symptoms of tube sheet plugging. Whenever tube sheet plugging is suspected, water box level and/or the air evacuation system should be visually checked.
Heat rate Assessment
High Circulating Water FlowHigh Circulating water flow may sometimes lead to increase in turbine leaving losses, affect condenserperformance and reduce plant efficiency. These problems are usually associated with very low cold watertemperature creating low condenser back pressure.Choked Flow at the turbine exhaust can occur at high load with low backpressure. Excessive circulation waterflow helps to lower backpressure and may lead to a choked flow condition.
Excessive Pump Power is another high flow problem. Placing an additional pump in service increases circulatingwater flow and reduces backpressure. However, the additional pump power affects the net plant output. There isa trade-off between low backpressure and increased pump power that varies with load and seasonal conditions.A trade-off analysis should be performed to determine the optimum point to start an additional pump or removeone from service.
Subcooling of the condensate can occur when there is excessive circulating water flow. Excessive flow of cold,circulating water cools the condensate further. It is not uncommon to have a condenser with several degrees ofsubcooling, especially at reduced loads. Subcooling can also occur when condenser backpressure is high.Subcooling occurs near the tube bundle and is minimized by the reheat function of the condenser. Anythingwhich interferes with the turbine exhaust steam coming into contact with falling condensate (baffling or airpockets) can result in both high back pressure and subcooling of the condensate.
Heat rate Assessment
Air In-Leakage/Air Removal Problems• Most of the heat transfer problems associated with high backpressure in the condenser tend to develop
slowly. If a high backpressure problem develops quickly, air in-leakage or a failure of air removal equipment is suspected. air in-leakage/air removal problems can be caused by: vacuum leaks through various components, inadequate air removal due to vacuum pump problems, and inadequate air removal due to excessive moisture loading of the air removal system
• Besides raising backpressure, air in-leakage/removal problems allow oxygen to accumulate inside the turbine cycle. Because oxygen is a universal corrosive agent, this provides a mechanism for corrosion that can result in serious degradation problems in the feedwater and boiler systems. High levels of dissolved oxygen in the condensate leaving the condenser are expected in the case of air in-leakage/removal problems.
• Air Ingress—Air in-leakage can occur through gland seals or leaks in the piping or through any equipment / valves under vacuum. The vacuum pump air flow meters should be checked. If rotatmeter indicates greater than normal airflow, the cause of the high turbine backpressure is most likely an air leakage problem. Vacuum pump seal leakage can result in a significant amount of airflow. Therefore, the observed airflow may not be indicative of air in-leakage into the condenser. Placing another vacuum pump in service increases the capacity of the air removal system and should help reduce condenser backpressure.
Heat rate Assessment
• Another indication of excessive air leakage or inadequate air removal is subcooling of the condensate. Thisoccurs because air pockets form on the steam side of the condenser tube bundles interfere in the contact areabetween the incoming steam and the condensate drips. Common causes for air leakage include:
• Inadequate turbine shaft sealing (low seal steam or water pressure)• Vacuum breaker leaks• Air leaking in expansion joints• Leakage through various components under vacuum• Leakage around pressure relief diaphragm• Seal steam pressure at the shaft seals• Air Removal Problems indicate operating problems with the air removal system if air pockets are
suspected and there is no indication of excessive in-leakage. Most air removal systems are designed to pump anearly constant volume of air/non-condensable and water vapor. The volume is constant at the suctionconditions of the air removal system. As backpressure decreases, air removal system capacity also decreases. Ifan additional vacuum pump improves condenser backpressure, the original vacuum pump should be removedfrom service. A problem with a single vacuum pump may or may not affect the remainder of the air removalequipment, depending on system configuration.
• Moisture Loading in the air cooler section of the condenser is another area that can cause airleakage/removal problems. If too many air cooler tubes are plugged or the air cooler does not functionproperly for any reason, the air removal system is forced to pump a higher percentage of water vapor. Thisdisplaces the air/non-condensable and has the same impact as high air in-leakage.
Heat rate Assessment
• Heat Transfer (Fouling) Problems• High condenser backpressure is also a result of the inability of the condenser tubes to effectively transfer
heat from the exhaust steam to the circulating water. Fouling problems are difficult to diagnose since they share many of the symptoms of air in leakage/air removal problems, and if plugging occurs, with low flow problems. Thus, fouling is often diagnosed by eliminating other possible causes of high backpressure or by a positive response to some sort of cleaning process.
• The cleanliness of the tubes in the condenser has a significant impact on the condenser’s ability to transfer heat from the exhaust steam to the circulating water. Increasing terminal temperature difference (TTD) indicates heat transfer impairment. If efforts to remove the fouling or debris are unsuccessful while the unit is on-line, the removal of a section of the condenser for mechanical cleaning should be considered.
• Organic Fouling attaching to the circulating waterside of the condenser tubes or silt deposits usually causes tube fouling. On cooling systems with chlorine treatment, the chlorination system is designed to prevent organic slime or algae growth from occurring in the first place.
• Tube Sheet Plugging can occur in closed cooling water systems when cooling tower fill make its way to the condenser water boxes and lodges on the tube sheet and in the tubes. This results in a reduction in circulating water flow and an increase in backpressure. This may occur slowly or rapidly, depending on the size and quantity of the debris. Silt deposits within the tubes may also result in reduced heat transfer and slowly increasing backpressure. Corrosion product from CW duct also causes plugging.
Heat rate Assessment

High Circulating Water Temperature : Even with a perfectly clean condenser, high backpressure results from a high circulating water inlet temperature. The rate of heat rejection is directly related to the difference in temperature between the steam and the circulating water. If the circulating water inlet temperature rises, the temperature of the steam exiting the turbine must also rise (and so will the backpressure) to re-establish the required temperature difference.
• Cooling Tower Operation affects circulating water temperature. If the circulating water temperature is higher than normal, consideration should be given to placing additional cooling tower fans in service. As with circulating water pumps, the optimum number of cooling tower fans to have in service is a trade-off between auxiliary power and condenser backpressure.
• The circulating water pump inlet screens should be checked to ensure they are clean and the suction of the circulating water pumps is free of debris.
• Other items to watch for during cooling tower operation that effect cooling tower efficiency are fill damage, silting of the collecting basin and plugging of the tower distribution nozzles.
High Heat Load : Condenser backpressure varies with heat loading. While this may not seem like a problem, unanticipated heat loads can give the appearance of high backpressure for a given unit load. For example, if the feedwater heater emergency drains are routed back to the condenser, instead of cascading from one heater to the next, the heat load on the condenser is slightly higher than anticipated. Likewise, if the condensate low flow recirculation valve remains open at higher loads, the condenser’s heat load is higher than normal. Although most of these additional heat loads are small, compared to the heat in the main turbine exhaust steam, they can accumulate. The condenser is the waste heat collector for the turbine cycle. Anything that reduces turbine cycle efficiency (turbine fouling or deposits, excessive reheat sprays, etc.) increases the heat loading on the condenser and effects condenser backpressure for a given unit electrical load.
Heat rate Assessment

Final Feed water Temperature & High Pressure Heaters BypassedThere are three ways of calculating deviations due to the feed water performance. First, a deviation can be calculated due to the final feed water temperature being lower than expected. Second, a deviation can be calculated from the amount of time a heater or a string of heaters are bypassed. Third, both methods can be combined, where the final feed water temperature deviation is used when all heaters are in service and the deviation for heaters being bypassed is used (and the final feed water temperature is ignored) when one or more heaters is bypassed. The reason the final feed water temperature cannot be used alone is two fold. First, the heat rate deviation for the top heater being bypassed is different from the deviation that would be calculated based on the resulting final feed water temperature. Second, if a lower pressure heater is bypassed, the final feed water temperature may not change, but there is a heat rate deviation due to the higher extraction flow to higher-pressure heaters.
Makeup• Makeup is the quantity of water that is lost from the cycle during operation. It is not simply the water supplied
to a unit, as water is also supplied for boiler hydrostatic tests, chemical cleanings, etc. Water supplied for these purposes should be excluded. The heat rate deviation for makeup is an approximation, as the location in the cycle of each loss is not known, therefore the exact heat rate deviation is not known. Losses from main steam are the most expensive, because so much energy has been added to it.Losses from LP heaters are relatively inexpensive. Typically, an assumption is made that the loss is from the boiler drum, half at saturated liquid condition and half at saturated vapour.
Heat rate Assessment

• Turbine Efficiency : The loss due to reduced turbine section efficiency is calculated for each turbine that operates entirely in the superheated steam region. This can be done by continuously calculating each section’s efficiency (from station temperatures and pressures) and comparing to an “expected” value. However, it is more common to periodically test the turbines (usually at valves wide open) and to compare that efficiency to the expected VWO efficiency, and to assume that the heat rate deviation is constant over the load range. The heat rate correction factors for turbine efficiency are usually obtained from the manufacturer, or they can be calculated with the use of a thermodynamic model of the plant. The actual deviation can be due to various factors, depending on the cause of the efficiency loss. If the steam path is worn or rough, the exhaust temperature increases, so less energy per kilogram of steam flow is converted to mechanical work. In the HP turbine this loss is partially offset because less energy will be required to be added in the reheater. This small gain can also be lost if the amount of reheat attemperation must be increased. If the stage pressures are also affected, then there are additional effects due to change in extraction flow rates. Usually heat rate deviations are calculated for the following sections:
• High Pressure Section Efficiency• Intermediate Pressure Section Efficiency
Heat rate Assessment
Heat rate Assessment
Auxiliary Steam Usage
• Several auxiliary equipment present in the plants that are supplied with steam. The steam that isused may be main steam, from a turbine extraction, from the CRH, or some other location.Regardless of the source of the steam, its use comes at some price. If the auxiliary equipmentdoes not use the steam, it would flow through the turbine, producing kilowatts. Therefore theuse (or excessive use) of this steam causes a heat rate deviation. It is worthwhile to monitor theflow rate of steam to each auxiliary but taking total usage is also useful. The flow rate may bemeasured with orifice plates, nozzles,. Or the flow may be derived from a pressure reading.Some equipment, such as SCAPH, has a relatively constant steam flow, and only the number ofhours of use is tracked. Some potential auxiliary steam users are:
• SCAPH• TDBFP• Steam Jet Air Ejectors (SJAE)• Steam supplied to/received from other units• Misc. auxiliary steam headers

Heat rate Assessment
• Main Steam Pressure before ESV : If the unit is operating at a pressure at the stop valves different from the“expected”, there is a heat rate penalty. This is due to the fact that the higher the pressure the higher theavailable energy. For a unit operating under “Rated Pressure”, the “Expected” value will be same as “Design”pressure of the unit. (Occasionally a unit may permanently lower its Main steam pressure due to reliabilityissues, and then their “expected” value would be some value less than the “design” value.) For a unitoperating under “Variable Pressure”, the “expected” value will vary as a function of the steam flow to theturbine.
• Main Steam Temperature before ESV : As with the Main steam pressure, this is measured just before theturbine stop valves. If there are multiple lines between the super heater outlet and the turbine, thetemperature should be measured in each location, as there can be differences pipe to pipe.
• Hot Reheat Steam Temperature before IV : Because there is usually some small temperature drop betweenthe hot reheat outlet and the turbine, this temperature should be measured as close to the IV valves aspossible. As stated for Main steam temperature, it should be measured in each pipe.
• Reheat Attemperation : Reheat attemperation temperature, is normally determined by measuring thepressure drop across a flow orifice. This flow rate is then divided by the feed water or main steam flow andexpressed as a percentage. Reheat attemperation affects the unit heat rate in two ways. First, the quantityof FW used for RH spray did not pass through HP turbine. Secondly in some of the units the heat picks upthrough HP heater does not take place as the spray is taken before HPH

Heat rate Assessment• Superheat Attemperation : Superheat attemperation, is normally determined by measuring the pressure drop
across a flow orifice. This flow rate is then divided by the feed water or main steam flow and expressed as apercentage. If the flow is taken downstream of the high-pressure heaters, the heat rate deviation is negligible.If the flow is taken from the BFP discharge, then there is a heat rate deviation because the flow bypasses thehigh-pressure feed water heaters
• Start-up Fuel : Normally, the reported heat rate of a unit is calculated using the entire quantity of fuel that issupplied to the unit during the time in question (this includes fuel burned when on-line, as well as fuel burnedduring startups & shutdowns). In order to account for the heat rate deviation due to fuel burned prior tosynchronization, the quantity of fuel burned before the unit is synchronized is measured. If this deviation andthe deviation for “Station Service (Prorated) - Idle” are subtracted from the actual heat rate, the result is the“operating” heat rate.
• Auxiliary and Station Power : The heat rate deviation due to auxiliary power usage is divided into three areas:unit auxiliary power, station service-operation, and station service-idle.
• Unit Auxiliary Power : This is the deviation due to higher than expected unit (auxiliary) power usage. Thissource of power only applies during the time when the unit is on line. This is the power supplied directly tomajor auxiliaries for a single unit.
• Station Service - Operating : This second deviation is due to prorata station service power usage while the unitis on line. This includes power used by the coal and ash handling equipment, makeup water plant, office andmaintenance shops, etc.
• Station Service – Idle :The third deviation is due to prorated station service power usage while the unit is offline. The running auxiliaries for the unit in idle condition need to be monitored.

Heat rate Assessment• Unaccountable Loss• The last category of losses is called “unaccountable Loss.” It is the loss which are generally not measured with
the available system or equipments. However some of the losses may be measured with special tests but efforts involved in assessment are much more than the actual benefits derived. “Unaccountable” heat rate loss is defined as the deference between the corrected test heat rate based on test and the sum of the expected heat rate and all “accountable” heat rate deviations.
• There are two types of problems that contribute to this area. • First, it is true losses that are not able to be measured, such as low pressure turbine efficiency, cycle isolation,
radiation losses, low pressure feed water heater performance, etc. • The second types of problems are errors. All errors end up in the unaccountable heat rate deviation group.
Examples of such errors are coal heating value measurements; any instrument errors that are measuring parameters such as Main steam temperature, condenser pressure or boiler outlet O2,Feed flow/steam flow, MW etc.
• Other types of, errors include calculation procedure errors, i.e. the calculated heat rate deviation of a 2% point change in HP turbine efficiency could be different from the true heat rate deviation.
METHODOLOGY OF HEAT RATE DEVIATION CALCULATION
• Data Collection Methodology
Heat rate deviations are calculated on the basis of parameter having direct
impact on Heat Rate. For arriving at best possible deviation value, duration of
data collection and frequency of data collection plays vital role. Heat rate
deviation calculation on daily basis should be based on 24 hrs daily average
value. And for daily heat rate deviation calculation correction for load and
other boundary conditions are to be applied.
METHODOLOGY OF HEAT RATE DEVIATION CALCULATION

METHODOLOGY OF HEAT RATE DEVIATION CALCULATION
Deviation Calculation MethodologyLoadDaily average load based on 24 hr gross energy meter reading is to be taken forcalculation. This average value of Load is to be compared with Full load capacity of unit.The difference of Load will be taken for Heat rate deviation calculation. The heat ratedeviation is to be derived from Load Vs HR deviation curve. Customized/OEM
correction curves are to be used.
Sample Calculation (Column wise w.r.t Daily HR Deviation Report)
Design Full Load = 210 MWExpected Load = 210 MWActual Load = 168 MWVariance (Exp. Load - Act. Load) = 42 MWTurbine HR Deviation = 45 kcal/kWh
(From Curve)Design Boiler = 86.8 %HR Deviation = (45/(86.8/100))= 51.8 kcal/kWh

Main Steam PressureMS Pressure before ESV – Day average of 24 hr is to be taken for calculation. This
average value of actual pressure will be compared with expected pressure (Expected
pressure = Design pressure) required. The difference of Pressure will be taken for Heat
rate deviation calculation based on customized correction curves. Customized/OEM
correction curves are to be used.Sample Calculation (Column wise w.r.t Daily HR Deviation Report)
Design Pressure = 151 kg/cm2 (abs)Expected Pressure = 151 kg/cm2 (abs)Actual Pressure = 149 kg/cm2 (abs)Variance (Exp.Press- Act. Press) = 2 kg/cm2 (abs)Turbine HR Correction Factor = 0.999 from CurveDesign Turbine HR = 2000 Kcal/kWhDesign Boiler = 86.8 %
HR Deviation = 2000/(86.8/100)*(1-0.999)= 2.3 kcal/kWh

Main Steam TemperatureMain steam temperature before ESV- Day average of 24 hrs of all the available
temperature points located before ESV is to be taken for calculation. This average value of
temperature is to be compared with expected temperature. (Expected temperature =
Design Temperature). The difference will be taken for Heat rate deviation calculation based
on customized correction curves. Customized/OEM correction curves are to be used.
Sample calculation (Column wise w.r.t Daily HR Deviation Report)
Design M.S Temperature = 537 0CExpected M.S Temperature = 537 0CActual M.S Temperature = 529.5 0CVariance (Exp. - Act. M.S Temp) = -7.52 0CTurbine HR Correction Factor = 0.998 From CurveDesign Turbine HR = 2000 Kcal/kWhDesign Boiler = 86.8 %
HR Deviation = (2000/(86.8/100))*(1-0.998)= 4.6 kcal/kWh
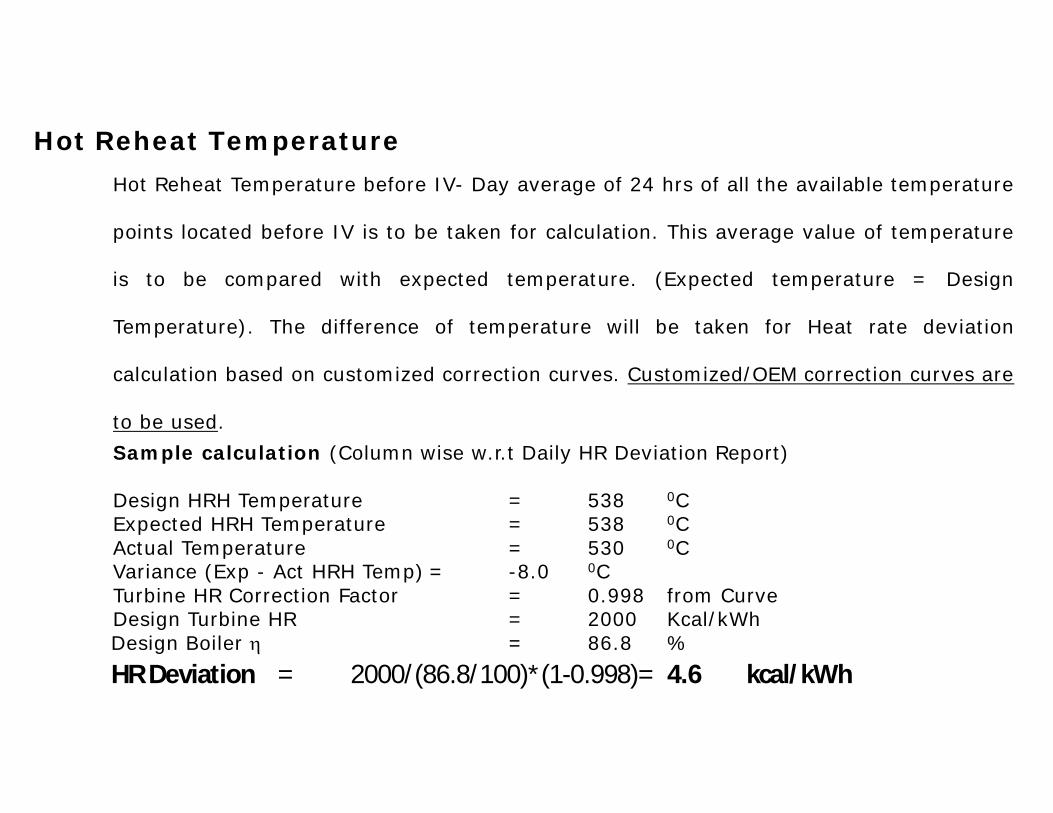
Hot Reheat TemperatureHot Reheat Temperature before IV- Day average of 24 hrs of all the available temperature
points located before IV is to be taken for calculation. This average value of temperature
is to be compared with expected temperature. (Expected temperature = Design
Temperature). The difference of temperature will be taken for Heat rate deviation
calculation based on customized correction curves. Customized/OEM correction curves are
to be used.Sample calculation (Column wise w.r.t Daily HR Deviation Report)
Design HRH Temperature = 538 0CExpected HRH Temperature = 538 0CActual Temperature = 530 0CVariance (Exp - Act HRH Temp) = -8.0 0CTurbine HR Correction Factor = 0.998 from CurveDesign Turbine HR = 2000 Kcal/kWhDesign Boiler = 86.8 %HR Deviation = 2000/(86.8/100)*(1-0.998)= 4.6 kcal/kWh

Superheat AttemperationS/H attemperation to the boiler – Day average of 24 hrs is to be taken for calculation. This average value
of S/H attemperation to be compared with expected S/H attemperation. (Expected S/H attemperation =
Value corresponding to actual load is to be derived using Load vs superheat attemperation curve). Load vs
superheat attemperation curve, if not available, may be developed from design data of Boiler. The
difference of average value of day and expected value of S/H attemperation is to be taken for Heat rate
deviation calculation based on customized correction curves. Customized/OEM correction curves are to be
used. Corrections for S/H spray is to be applied in case tapping of S/H Spray is taken from the location
before HP heater.Sample calculation (Column wise w.r.t Daily HR Deviation Report)Design S/H Attemperation = 0 t/hrExpected S/H Attemperation = 16 t/hrActual S/H Attemperation = 46 t/hrVariance (Exp. – Act. Attemp) = -30 t/hr = -5 % of Main Steam FlowTurbine HR Correction Factor = 0.999 From CurveDesign Turbine HR = 2000 Kcal/kWhDesign Tested Boiler = 86.8 %
HR Deviation = 2000/(86.8/100)*(1-0.999)= 2.3 kcal/kWh

Reheat Attemperation
R/H attemperation to the boiler – day average of 24 hrs is to be taken for calculation. This
average value of R/H attemperation to be compared with expected R/H attemperation
(Expected R/H attemperation = Value corresponding to actual load is to be derived using
Load vs reheat attemperation curve). Load vs reheat attemperation curve, if not available,
may be developed from design data of Boiler. The difference of average value of day and
expected value of R/H attemperation is to be taken for Heat rate deviation calculation based
on customized correction curves. Customized/OEM correction curves are to be used.
Sample calculation (Column wise w.r.t Daily HR Deviation Report)Design R/H Attemperation = 0 t/hrExpected R/H Attemperation = 6 t/hrActual R/H Attemperation = 18 t/hrVariance (Exp. – Act. Attemp) = -12 t/hr = -2 % of Main Steam FlowTurbine HR Correction Factor = 0.9968 (From Curve)Design Turbine HR = 2000 Kcal/kWhDesign Boiler = 86.8 %HR Deviation = 2000/(86.8/100)*(1-0.997)= 7.4 kcal/kWh
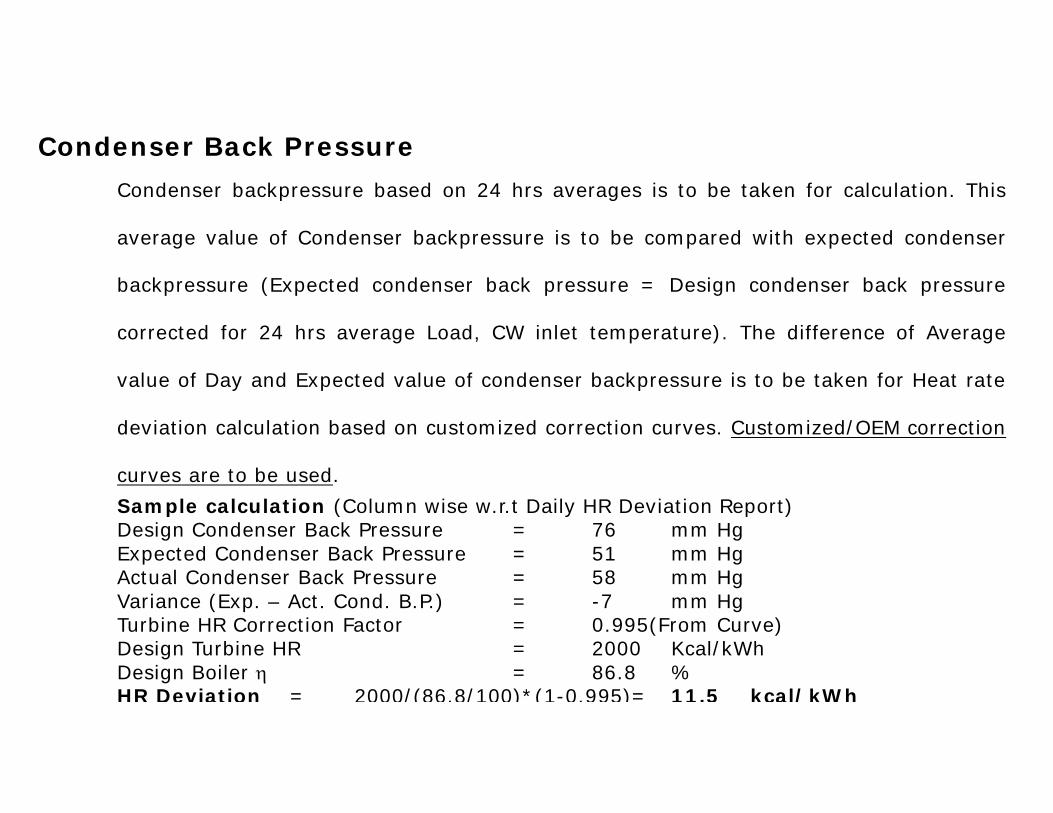
Condenser Back PressureCondenser backpressure based on 24 hrs averages is to be taken for calculation. This
average value of Condenser backpressure is to be compared with expected condenser
backpressure (Expected condenser back pressure = Design condenser back pressure
corrected for 24 hrs average Load, CW inlet temperature). The difference of Average
value of Day and Expected value of condenser backpressure is to be taken for Heat rate
deviation calculation based on customized correction curves. Customized/OEM correction
curves are to be used.Sample calculation (Column wise w.r.t Daily HR Deviation Report)Design Condenser Back Pressure = 76 mm HgExpected Condenser Back Pressure = 51 mm HgActual Condenser Back Pressure = 58 mm HgVariance (Exp. – Act. Cond. B.P.) = -7 mm HgTurbine HR Correction Factor = 0.995(From Curve)Design Turbine HR = 2000 Kcal/kWhDesign Boiler = 86.8 %HR Deviation = 2000/(86.8/100)*(1-0.995)= 11.5 kcal/kWh

CW inlet temperature
CW inlet temperature based on 24 hrs average is to be taken for calculation. This average value of
CW inlet temperature is to be compared with expected CW inlet temperature. (Expected CW inlet
temp= Design CW inlet temperature). Condenser backpressure deviation is to be calculated due
to difference of average value of day and expected value of CW inlet temperature. Heat rate
deviation is to be calculated based on customized correction curves prepared by station for CW
inlet temperature vs Condenser backpressure. Customized/OEM correction curves are to be used.
Sample calculation (Column wise w.r.t Daily HR Deviation Report)Design CW Inlet Temperature = 30 0CExpected CW Inlet Temperature = 30 0CActual CW Inlet Temperature = 25 0CVariance (Exp. – Act. CW Temp) = -5 0CChange In Back Pressure. = 16.5 mm HgTurbine HR Correction Factor = 0.99 (From Curve)Design Turbine HR = 2000 Kcal/kWhDesign Boiler = 86.8 %HR Deviation = (2000/(86.8/100))*(1-0.99) = 23.0 kcal/kWh

DM Makeup WaterTotal DM Make up to the boiler in a unit is to be taken for calculation of % DM makeup. This is
be taken from individual flow meter installed in the unit for make up reading. This average value
of DM make up to be compared with 0 % DM makeup as PG test is carried out with make up
isolated condition. For comparing Heat rate loss due to DM make up, it can be divided into 50
ratio as 50 % steam side leakage and 50 % water leakage of total % of DM makeup. DM make
after boiler light up is to be considered for calculation in case the unit has come after shutdown
or tripping.Heat Value of make up, H (Dev)= 0.5*(H1 - H2) + 0.5* (H3 - H2)HR (Dev) = MU(Act) *H(Dev)*1000 / (GG)Where
Daily DM Makeup = MU[Act] tonesMS enthalpy = H1 kcal/kgMakeup water enthalpy = H2 kcal/kgFeed water enthalpy = H3 kcal/kgGross generation = GG kWhHeat Rate Deviation = HR (Dev) kcal/kWh

DM MAKE UP WATER
Sample Calculation (Column wise w.r.t Daily HR Deviation Report)
Design DM Make Up = 0 %Expected DM Make Up = 0 %Actual DM Make Up-MU (Act) = 100 tonesVariance (Exp. – Act. Makeup) = -100 tones
MS enthalpy H1 = 850 kcal/kgMakeup water enthalpy H2 = 40 kcal/kgFeed water enthalpy H3 = 250 kcal/kgGross generation GG = 4.032x1000000 kWhH (Dev) = 0.5*(850-40)+0.5*(250-40)
HR Deviation = (100*510*1000)/4.032/1000000= 12.6 kcal/kWh

Feed Water TemperatureFeed water temperature at top HPH outlet after joining of HPH bypass line, based on daily 24 hrs
averages is to be taken for calculation. This average value of Feed water temperature is to
compared with the expected value of Feed water temperature (Expected FW temperature = Feed
water temperature corrected for load, derived from curve between feed water temperature
load). The difference of Average value of Day and Expected value of Feed water temperature is
be taken for Heat rate deviation calculation based on customized correction curves
Customized/OEM correction curves are to be used.Sample calculation (Column wise w.r.t Daily HR Deviation Report)Design FW Temperature = 248 0CExpected FW Temperature = 236 0CActual FW Temperature = 234 0CVariance (Exp. – Act. FW Temp) = 2 0CTurbine HR Corr. Factor at 236 0C = 0.996 From CurveTurbine HR Corr. Factor at 234 0C = 0.995 From CurveDesign Turbine HR = 2000 Kcal/kWhDesign Boiler = 86.8 %HR Deviation = (2000/(86.8/100))*(0.996-.995) = 2.3 kcal/kWh
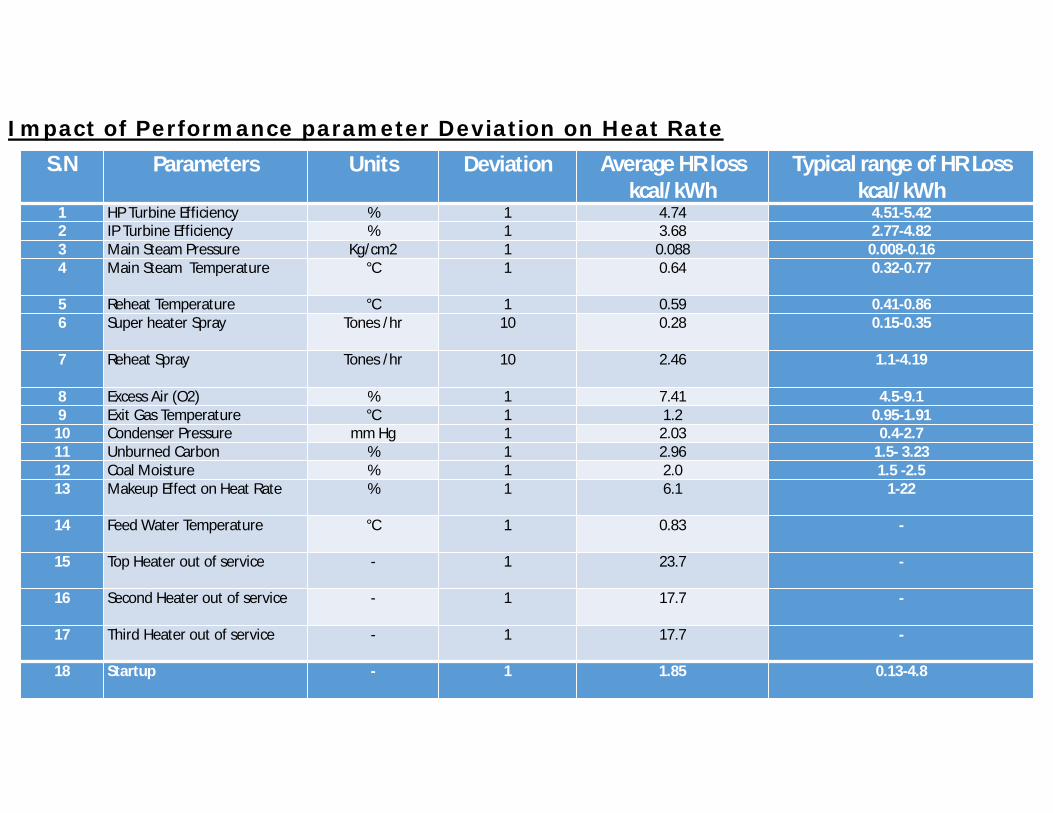
S.N Parameters Units Deviation Average HR loss kcal/kWh
Typical range of HR Loss kcal/kWh
1 HP Turbine Efficiency % 1 4.74 4.51-5.422 IP Turbine Efficiency % 1 3.68 2.77-4.823 Main Steam Pressure Kg/cm2 1 0.088 0.008-0.164 Main Steam Temperature °C 1 0.64 0.32-0.77
5 Reheat Temperature °C 1 0.59 0.41-0.866 Super heater Spray Tones /hr 10 0.28 0.15-0.35
7 Reheat Spray Tones /hr 10 2.46 1.1-4.19
8 Excess Air (O2) % 1 7.41 4.5-9.19 Exit Gas Temperature °C 1 1.2 0.95-1.91
10 Condenser Pressure mm Hg 1 2.03 0.4-2.711 Unburned Carbon % 1 2.96 1.5- 3.2312 Coal Moisture % 1 2.0 1.5 -2.513 Makeup Effect on Heat Rate % 1 6.1 1-22
14 Feed Water Temperature °C 1 0.83 -
15 Top Heater out of service - 1 23.7 -
16 Second Heater out of service - 1 17.7 -
17 Third Heater out of service - 1 17.7 -
18 Startup - 1 1.85 0.13-4.8
Impact of Performance parameter Deviation on Heat Rate

PERIODIC TESTING WITH ONLINE INSTRUMENT
PERIODIC TESTING WITH ONLINE INSTRUMENTIntroductionThere are several methods available to assess the condition of equipment (to determine if correctiveactions are necessary) in a power plant. One method is to periodically “open and inspect” equipmenton some schedule. There are several disadvantages to this. First, many times the equipment isinspected, at some expense, when it is not required (and unfortunately sometimes equipment isdamaged as a result of the inspection). Second, if a problem occurs just after an inspection, it maynot be detected for a long time. During operation with such problem, additional damage is done, andthe equipment does not operate efficiently.A second method is to use station instruments to provide data for calculation of equipment condition.While this method is useful for trending the performance pattern and calculating deviations on thebasis of this. But there is one significant drawback i.e. the accuracy of station instruments, which, inmost cases, is not high enough to provide reliable information. So, it is difficult to take crucialdecisions, which will have large costs and outage time.But once trend of deterioration is visible from online instrument, then extent of deterioration can beknown through performance testing with off line high accuracy instrumentation.Tests with on line instruments are done to compare the current performance with expectedperformance and to assess performance degradation. Design / Expected performance can be used asthe baseline, or the initial periodic test, conducted after an overhaul can be used to know degradationafter the annual overhaul.
In summary, the periodic performance tests are conducted to: Compare the current performance with expected performance Evaluate the effectiveness of maintenance work Determine the most efficient operating regime for equipment and system Account for heat rate losses

Types of TestsHP / IP Turbine Enthalpy Drop Efficiency Test
Purpose
The purpose of HP/IP Turbine Enthalpy Drop Test is to determine the efficiency of HP and IPsections of the turbine, trend their performance and generate data to pinpoint the probablecause of degradation. The trends can then be used for determination of the optimum pointat which the costs incurred due to performance degradation exceed the cost to be incurredfor restoration of equipment.
Frequency
Time based, typically 6 monthly, but the other triggers can take precedence:
Before and after turbine overhauls
Change in pressure ratio of first stage to HP exhaust or HRH at Intercept Valve to IP Exhaust
Increase in Steam flow, at constant valve position
Abnormal first stage pressure• High extraction temperatures

Condenser Performance Test
PurposeCondenser tests are done to assess the thermal and hydraulic performance of thecondenser in terms of tube fouling, air-in-leakage and to optimize condenser-cleaningschedules. It is also used to trend the performance parameters and generate data topinpoint the probable cause of degradation. The trends can then be used for deciding thefuture course of action like tube cleaning schedules, attending air-in-leakage, andadequacy of CW flow.
Note: The condensate temperature can be used from time to time as saturationtemperature and back pressure can be calculated from steam tables to check the accuracyof the condenser back pressure readings and its calibration requirement
FrequencyTime based, typically every month, but other triggers can take precedence:
High condenser back pressure
Pre and post condenser tube cleaning
High water box dP
Excessive CW temperature rise

Feed water Heater Performance TestPurpose
The purpose of Feed water heater tests is to assess the current performance and toprovide data to assist in optimization of normal operation of the heater. Calculating andmonitoring Terminal Temperature difference (TTD), Drain Cooler Approach (DCA), thepressure drop on the feed waterside and the temperature rise across the heater, cananalyze heater performance. These parameters are trended over time for identificationof abnormal changes in heater performance and to determine whether corrective actionis required to maintain optimum performance.
Frequency
Time based, typically every month, but the other triggers can take precedence:
High TTD
High DCA
High drain temperature
Low FW temperature
Excessive tube bundle pressure drop
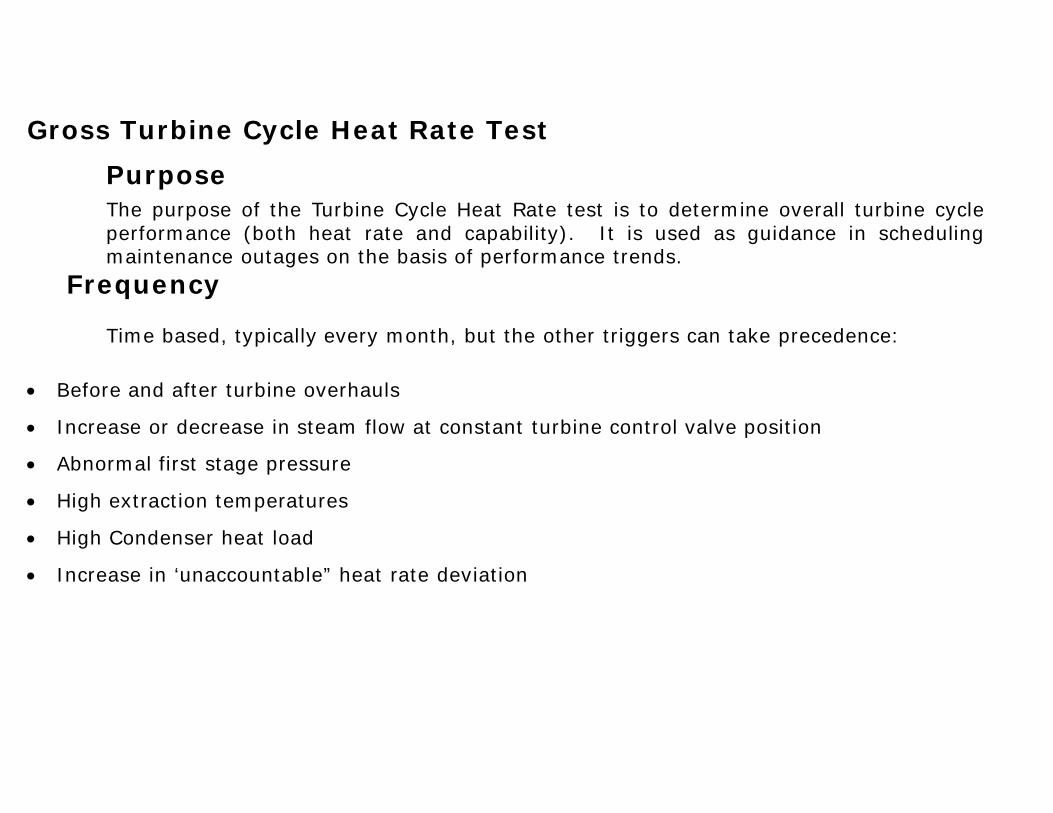
Gross Turbine Cycle Heat Rate TestPurposeThe purpose of the Turbine Cycle Heat Rate test is to determine overall turbine cycleperformance (both heat rate and capability). It is used as guidance in schedulingmaintenance outages on the basis of performance trends.
Frequency
Time based, typically every month, but the other triggers can take precedence:
Before and after turbine overhauls
Increase or decrease in steam flow at constant turbine control valve position
Abnormal first stage pressure
High extraction temperatures
High Condenser heat load
Increase in ‘unaccountable” heat rate deviation
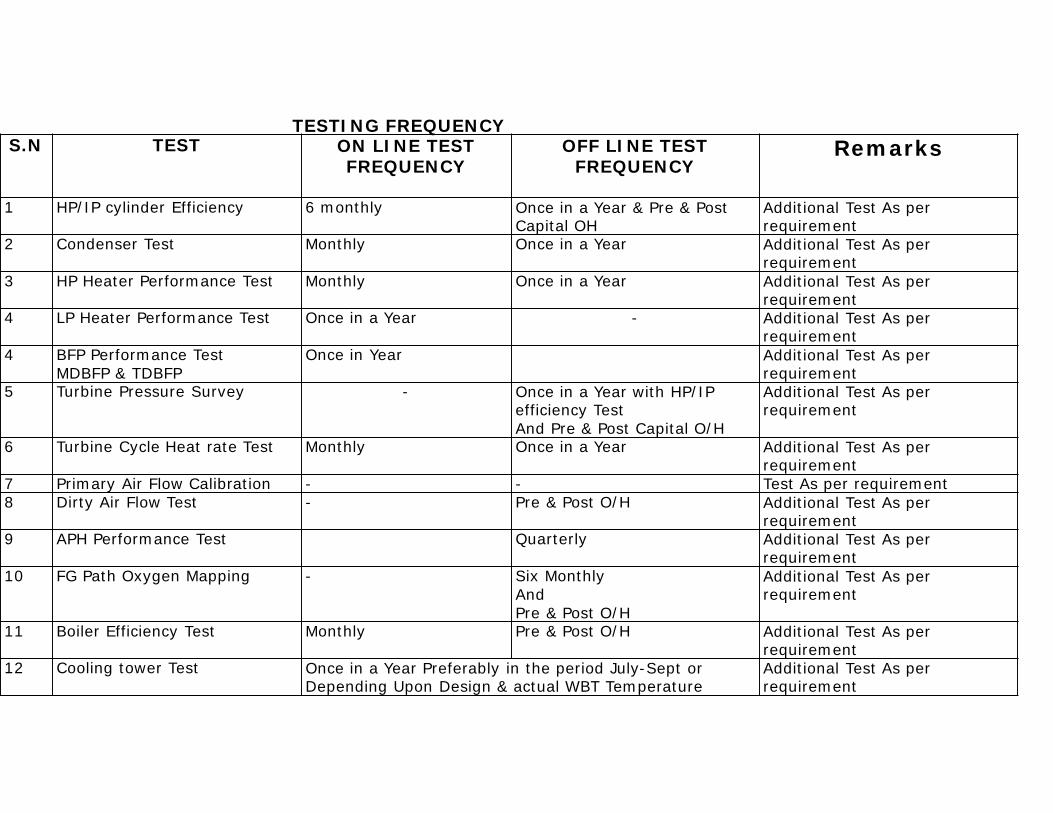
S.N TEST ON LINE TEST FREQUENCY
OFF LINE TEST FREQUENCY
Remarks
1 HP/IP cylinder Efficiency 6 monthly Once in a Year & Pre & Post Capital OH
Additional Test As per requirement
2 Condenser Test Monthly Once in a Year Additional Test As per requirement
3 HP Heater Performance Test Monthly Once in a Year Additional Test As per requirement
4 LP Heater Performance Test Once in a Year - Additional Test As per requirement
4 BFP Performance TestMDBFP & TDBFP
Once in Year Additional Test As per requirement
5 Turbine Pressure Survey - Once in a Year with HP/IP efficiency TestAnd Pre & Post Capital O/H
Additional Test As per requirement
6 Turbine Cycle Heat rate Test Monthly Once in a Year Additional Test As per requirement
7 Primary Air Flow Calibration - - Test As per requirement8 Dirty Air Flow Test - Pre & Post O/H Additional Test As per
requirement9 APH Performance Test Quarterly Additional Test As per
requirement10 FG Path Oxygen Mapping - Six Monthly
AndPre & Post O/H
Additional Test As per requirement
11 Boiler Efficiency Test Monthly Pre & Post O/H Additional Test As per requirement
12 Cooling tower Test Once in a Year Preferably in the period July-Sept or Depending Upon Design & actual WBT Temperature
Additional Test As per requirement
TESTING FREQUENCY

Preparation of Heat rate action Plan
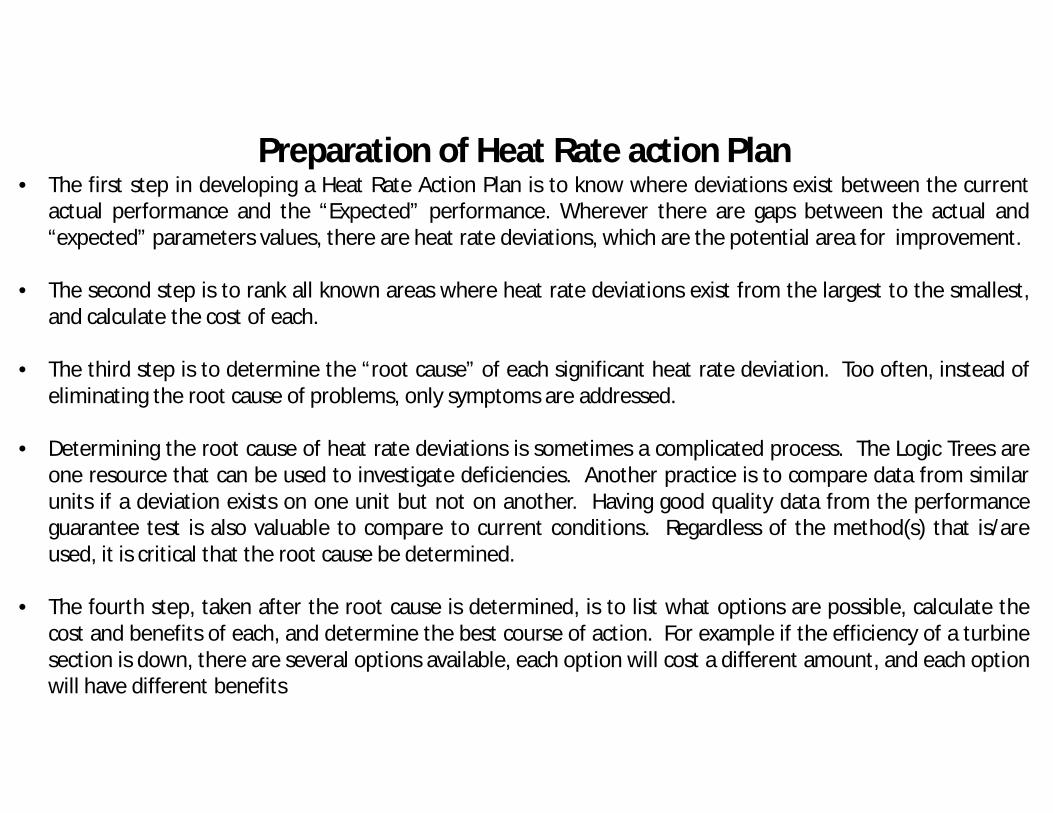
Preparation of Heat Rate action Plan• The first step in developing a Heat Rate Action Plan is to know where deviations exist between the current
actual performance and the “Expected” performance. Wherever there are gaps between the actual and“expected” parameters values, there are heat rate deviations, which are the potential area for improvement.
• The second step is to rank all known areas where heat rate deviations exist from the largest to the smallest,and calculate the cost of each.
• The third step is to determine the “root cause” of each significant heat rate deviation. Too often, instead ofeliminating the root cause of problems, only symptoms are addressed.
• Determining the root cause of heat rate deviations is sometimes a complicated process. The Logic Trees areone resource that can be used to investigate deficiencies. Another practice is to compare data from similarunits if a deviation exists on one unit but not on another. Having good quality data from the performanceguarantee test is also valuable to compare to current conditions. Regardless of the method(s) that is/areused, it is critical that the root cause be determined.
• The fourth step, taken after the root cause is determined, is to list what options are possible, calculate thecost and benefits of each, and determine the best course of action. For example if the efficiency of a turbinesection is down, there are several options available, each option will cost a different amount, and each optionwill have different benefits

Under each parameter for which heat rate deviations are calculated, each planned activity that will affect that parameter should be listed. For example, under “Exit Flue Gas Temperature,” the activities “Replace Air Heater Seals, and Set to Design Clearances,”
In addition to the description of the activity, a measurable process indicator should be listed with its current value, the anticipated change or target value, and the method of verification. For example, for the activity “Replace Air Heater Seals, and Set to Design Clearances,” the process indicator might be “Air Heater Leakage.” The current value might be 20% and the target (post replacement) value might be 12%, and this would be verified by a post outage test. Anticipated heat rate improvement is to be included.
Each activity must also list a schedule i.e. as a minimum a start date and a completion date. Each activity should list a single individual who is “responsible” for ensuring that the activity is carried out, and the results verified. Action Plan should include following information for its completeness• Material requirement• Procurement status• Delivery schedule• Work Contract status• Expected recovery• Expected Expenditure• Expected Completion Schedule
Preparation of Heat Rate action Plan

Reporting System & Formats

Gross Turbine Cycle HR (GTCHR) (kcal/kWh)U-1 U-2 U-3 U-4 U-5 U-6
Test DateDesign Test GTCHRCorrected Test GTCHR3
HR Deviation (Design - Corrected) Accountable Loss Unaccountable Loss Gross Unit HR (kcal/kWh)
U-1 U-2 U-3 U-4 U-5 U-6Test DateDesign Expected4
Corrected Test HR5
HR Deviation (Expected-Corrected)Accountable Loss Unaccountable Loss 3. Test GTCHR Corrected for design CW inlet temperature4. Expected Unit Heat rate = Design GTCHR*100/Expected Boiler Efficiency.5. Corrected Test Unit Heat rate = Corrected Test GTCHR*100/
Corrected Test Boiler Efficiency.
Reporting System & Formats

Reporting System & FormatsRH Spray
Design U -1 U - 2 U - 3 Design U - 4 U - 5 U - 6Test DateTest RH Spray (T/hr)Loss in HR (kcal/kWh)
Condenser
Design Stage-I Design Stage-IIU -1 U - 2 U - 3 U - 4 U - 5 U - 6
Test DateCondenser Back Pressure (mm Hga)CW inlet temperature (deg.C)Loss in HR (kcal/kWh)Loss due to Tube Fouling / Air ingress (kcal/kWh)Loss due To CW Flow / Heat Load (kcal/kWh)Loss Due To CW Inlet Temp (kcal/kWh)Strategy /Action plan for recovery
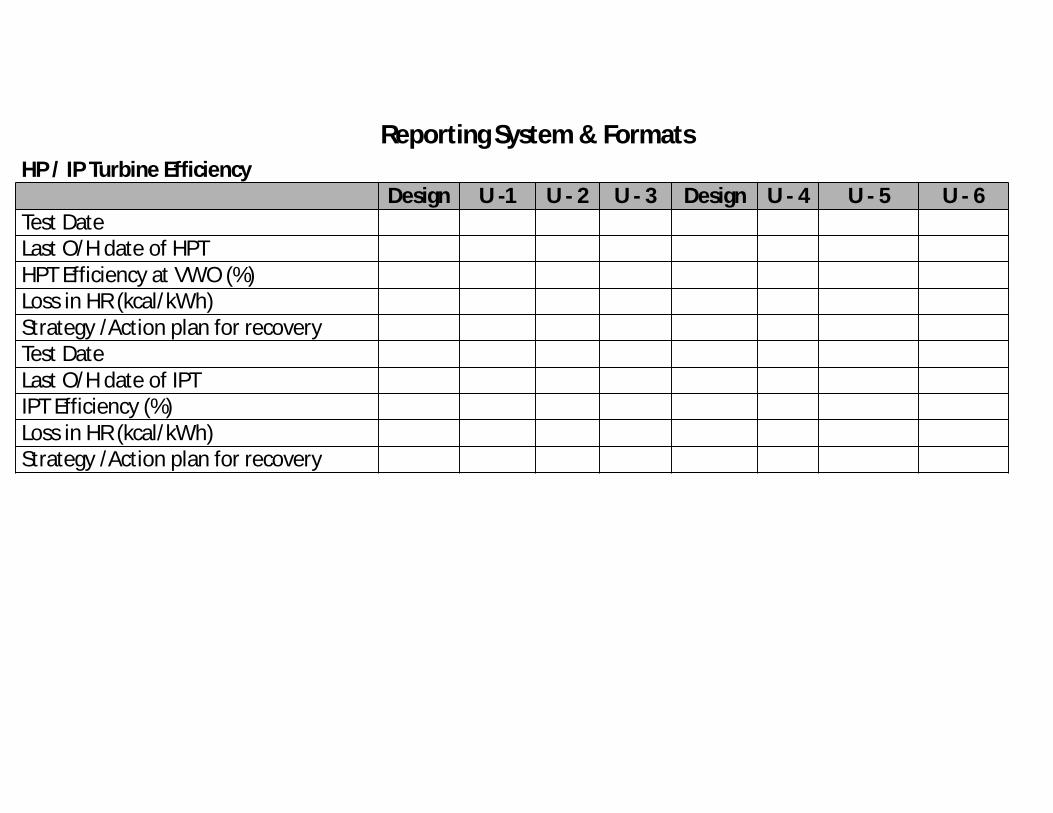
HP / IP Turbine EfficiencyDesign U -1 U - 2 U - 3 Design U - 4 U - 5 U - 6
Test DateLast O/H date of HPTHPT Efficiency at VWO (%)Loss in HR (kcal/kWh)Strategy /Action plan for recoveryTest DateLast O/H date of IPTIPT Efficiency (%)Loss in HR (kcal/kWh)Strategy /Action plan for recovery
Reporting System & Formats

Miscellaneous* (Other Major Accountable Losses)
Design U -1 U - 2 U - 3 Design U - 4 U - 5 U - 6Test DateMS Temperature (deg.C)MS-Loss in HR (kcal/kWh)HRH Temperature (deg.C)HRH-Loss in HR (kcal/kWh)Feed Water Temp.(deg.C)HPH TTD (deg.C)HPH DCA (deg.C)HPH-Loss in HR (kcal/kWh)Strategy /Action plan for recovery* More process Parameters can be added by station depending upon operating condition
Reporting System & Formats

R/H Spray Status & Completion ScheduleS.No Reasons/Actions U-1 U-2 U-3 U-4
1 % of Boiler MCR at Full Load 1
2 Water Wall Heat absorbation Level (S/H Spray Design Vs Actual Spray) a) Water wall cleaning during outage 2
b) Water wall Soot blowing Availability/Effectiveness 3
3 S/H Section Heat Obsorptiona) Cleaning of S/H Section during outage 2
b) LRSB operation 4
4 Boiler Operationa) Boiler Operation at Optimum Regime 5
b) Left - right temp difference; one side requiring spray 6c) Burner tilt operation Auto/Manual 6
d) Proper setting of Gas Bypass Damper 6
5 RH spray because of metal temperature excursiona) Metal Temperature Monitoring 7
b) Material Upgradation/Replacement 8
6 Spray Valve/ Nozzles Problema) Repair / Replacement of passing Spray Control Valve b) Replacement of Broken Spray Nozzle
1 Whether Boiler load is high due to turbine Problem 2 Methodology used for boiler cleaning.3 Indicate status of Soot blowing effectiveness,Availability & Optimisation along with action & Schedule4 Availability / Operation of LRSB5 Unit Optimum regime has been established after O/H or not. If not then indicate the schedule.6 If R/H spray is due to this reason indicate action planwith schedule to overcome this.7 If non availability of Metal temperatue information is causing high spray then indicate plan for proper temperature monitoring system.8 If Metal temperature limitations is causing high spray then indicate plan for upgradation /replacement of R/H Tubes
Reporting System & Formats

CONDENSER COMPLETION SCHEDULES.N Reasons/Actions U-1 U-2 U-3 U-4
1 High CW inlet Temperature (Actual Vs Design)a) If shortfall in cooling water temperature is due to CT problem Action Plan to be given
b) Increased Heat Loada) Low Turbine Efficiencyb) High Energy Drain V/V Passing (Details to be given in respective sheet)c) Problem of Cascaded Drain
2 Air In Leakage(Actual Depression in temperature)a) Detection of Source of air Ingress 1b) Attending Air Ingress Points (Schedule)c) Date from which more than one vacuum Pump / Ejector is in servicec) Recification of Vacuum Pump / Ejector Problem
3 Tube Dirtinessa) On Line Tube Cleaning System availability 2b) Effective cleaning during O/Hc) Part Load Cleaning 3
d) Tube Thick ness Survey4 Low Circulating water Flow
a) Healtinness of Travelling water Screenb) Availability of CW Pump c) CW Duct Siltingd) Poor CW Pump Performance 4
1 Date of dection of leakage point with Online Detection System Or Off line detection system2 COLTS is available or not , if not indicate programme of Installation and if installed, whether it is kept in service ?.What is the effectiveness
3 Cleaning Based on opportunity4 Pump Flow measured or not , indicate flow measurement plan.

HPT EFFICIENCY COMPLETION SCHEDULES.N Reasons / Actions U-1 U-2 U-3 U-4
Detoriation in HP Efficiency 1 Accurate Measurement of Efficiency with Off line Instrument2 Replacement of Nozzle Box3 Repair/Replacement of Turbine Rotor4 Repair/Replacement of Diaphram5 Replacement of Gland Seals6 Replacement of Inter Stage Seals7 Repair/Replacement of Strip Seals8 Cleaning of Turbine Internals9 Checking Of Stainer
10 Inter Cylinder Seals Replacement11 Steam Path audit
Reporting System & Formats
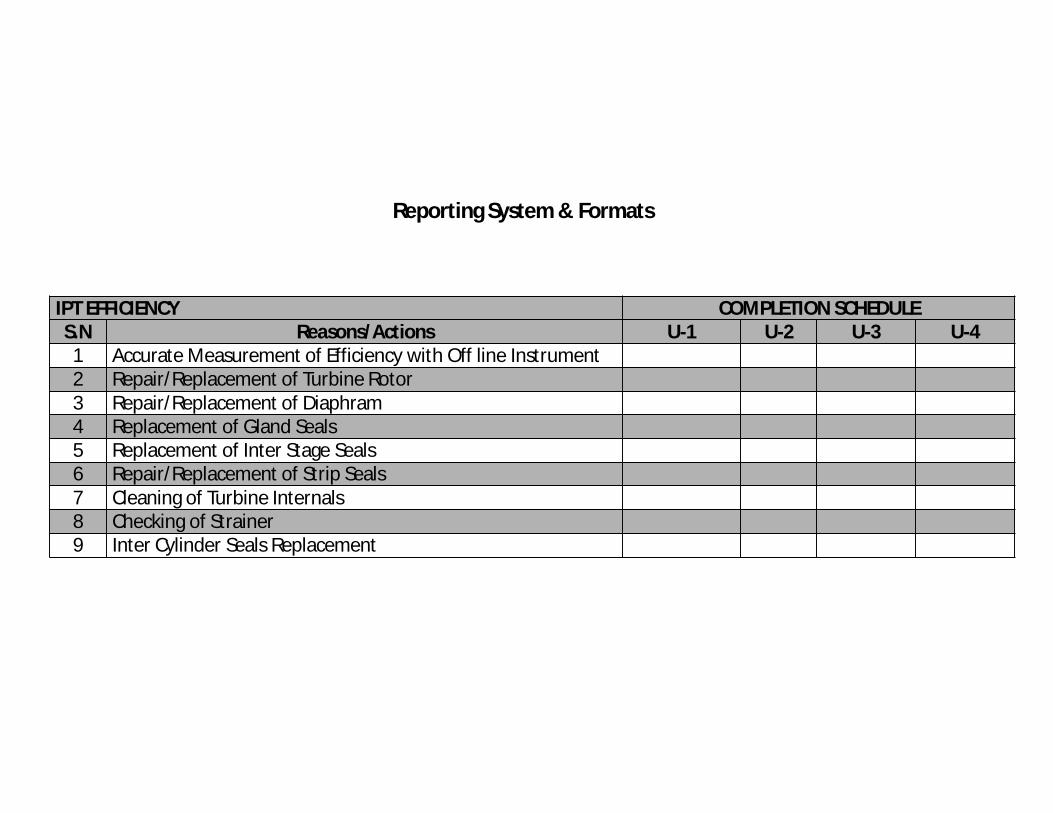
IPT EFFICIENCY COMPLETION SCHEDULES.N Reasons/Actions U-1 U-2 U-3 U-41 Accurate Measurement of Efficiency with Off line Instrument2 Repair/Replacement of Turbine Rotor3 Repair/Replacement of Diaphram4 Replacement of Gland Seals5 Replacement of Inter Stage Seals6 Repair/Replacement of Strip Seals7 Cleaning of Turbine Internals8 Checking of Strainer9 Inter Cylinder Seals Replacement
Reporting System & Formats

High Energy Drain Valves PassingS.N Unit Valve
DescriptionTag No Down Stream temp(deg.C)*
U-1
U-2
U-3
U-4
Reporting System & Formats

PRE & POST OH Gross Turbine Cycle Heat Rate
Station: Unit: Date of Test: S.N PARAMETER UNIT Design Pre OH Post OH1 Unit Load MW 2 First Stage Pressure kg/cm2(a) 3 MS Pressure Before ESV kg/cm2(a) 4 MS Temperature Before ESV 0C 5 HRH Press at IP Turbine Inlet kg/cm2(a) 6 HRH Temp at IP Turbine Inlet 0C 7 HP Turbine Exhaust Pressure kg/cm2(a) 8 HP Turbine Exhaust Temperature 0C 9 FW Temp at Eco Inlet 0C 10 Feed Flow t/hr 11 S/H Attemperation Flow t/hr 12 R/H Attemperation Flow t/hr 13 Condenser CW inlet temperature 0C 14 Condenser back Pressure mm Hga 14 Test GTCHR kcal/kWh 15 Corrected Test GTCHR
(Corrected for Design CW inlet temperature)
kcal/kWh
16 Design GTCGR kcal/kWh
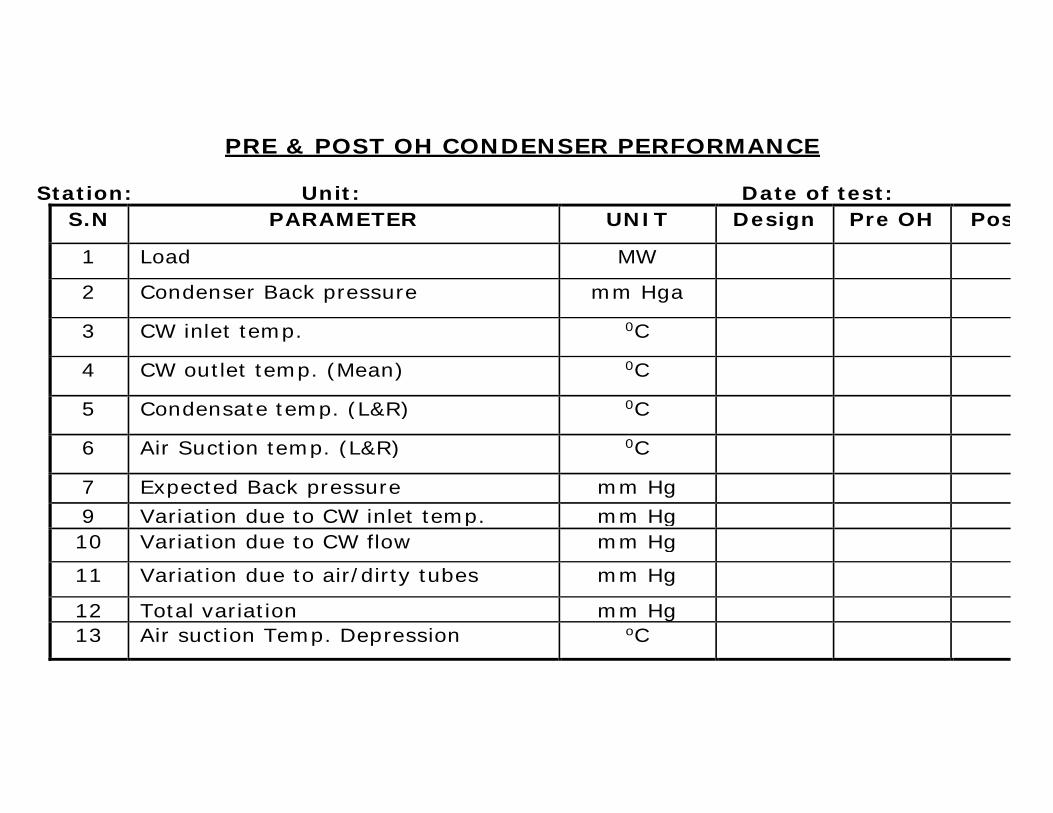
PRE & POST OH CONDENSER PERFORMANCE Station: Unit: Date of test:
S.N PARAMETER UNIT Design Pre OH Post OH
1 Load MW
2 Condenser Back pressure
mm Hga
3 CW inlet temp.
0C
4 CW outlet temp. (Mean)
0C
5 Condensate temp. (L&R)
0C
6 Air Suction temp. (L&R)
0C
7 Expected Back pressure mm Hg 9 Variation due to CW inlet temp.
mm Hg
10 Variation due to CW flow
mm Hg
11 Variation due to air/dirty tubes
mm Hg
12 Total variation mm Hg 13 Air suction Temp. Depression oC
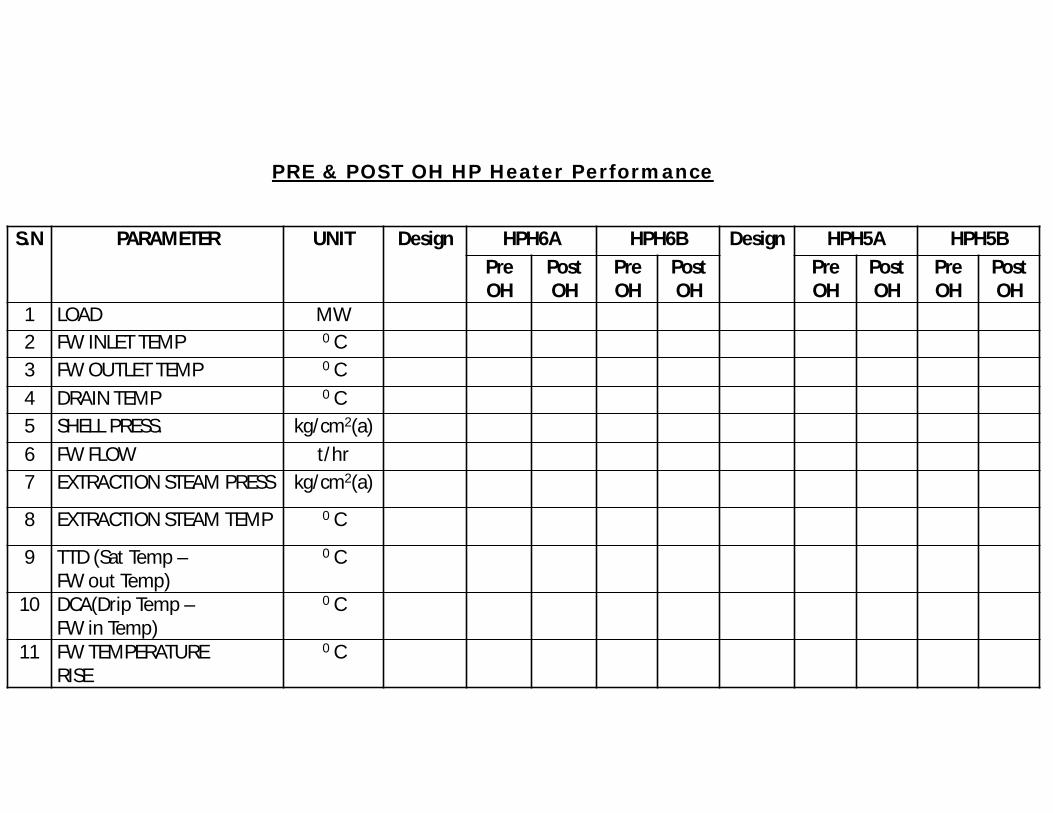
S.N PARAMETER UNIT Design HPH6A HPH6B Design HPH5A HPH5BPreOH
Post OH
PreOH
PostOH
PreOH
PostOH
PreOH
PostOH
1 LOAD MW2 FW INLET TEMP 0 C3 FW OUTLET TEMP 0 C4 DRAIN TEMP 0 C5 SHELL PRESS. kg/cm2(a)6 FW FLOW t/hr7 EXTRACTION STEAM PRESS kg/cm2(a)
8 EXTRACTION STEAM TEMP 0 C
9 TTD (Sat Temp –FW out Temp)
0 C
10 DCA(Drip Temp –FW in Temp)
0 C
11 FW TEMPERATURERISE
0 C
PRE & POST OH HP Heater Performance

Un accountable Heat rate Loss
Introduction
It is the losses which are generally not measured with the available system or equipments.However some of the losses may be measured with special tests but efforts involved in assessment is much more than the actual benefits derived. “Unaccountable” heat rate loss is defined as the deference between the corrected test heat rate based on test and the sum of the expected heat rate and all “accountable” heat rate deviations.
It has been experienced that passing of high energy drains and drains which are normally kept open contribute significantly to the unaccountable losses in the unit. However the quantification of unaccountable losses due to passing of drains/drip is difficult.
In order to operate unit efficiently, the operators must have reliable and accurate information of the unit. Small errors in sensors can result in large “unaccountable” heat rate deviations. For example, if the unit is “expected” to operate at 538C main steam temperature at the turbine stop valves, but the instrumentation is indicating 3C higher than the actual temperature, the unit will operate with the steam temperature 3C low thus resulting in a heat rate deviation of around 2.5kcal/kWh. For high temperature thermocouples, 3C drift is not unusual. Even if just a few key instruments are in error, the unit could have a large heat rate deviation. As per ASME –PTC 6 table 5.2, total inaccuracy on account of instruments (using test grade high accuracy instruments) is 0.474%. When online instruments is used for heat rate testing the inaccuracy on account of instruments can be taken as 1%.
Un accountable Heat rate Loss

A very rough rule-of-thumb is that the heat rate deviation for unaccountable should be less than 25 kcal/kWh.
However problems that contributes to this area are, of three types First is actual losses that are not able to be measured, such as
a. Low pressure turbine efficiencyb. Cycle isolationc. Radiation lossesd. Low pressure feed water heater performance, etc. e. Gland seal flow of turbine
The second types of problems are errors/measurement accuracy. All errors end up in the unaccountable heat rate deviation group. Examples of such errors are
a. Instrument errors for measuring parameters such as • Main steam temperature• Condenser pressure • Economizer outlet O2• Feed Flow• Steam Flow• MW, etc
Other types of problems include calculation procedure errors, i.e. the calculated heat rate deviation of a 2% point change in HP turbine efficiency could be different from the true heat rate deviation. Similar may be the case for heat rate deviations calculated on the basis of thumb rule or with the help of manufacturer’s curves, which may have some in built margins.
Un accountable Heat rate Loss
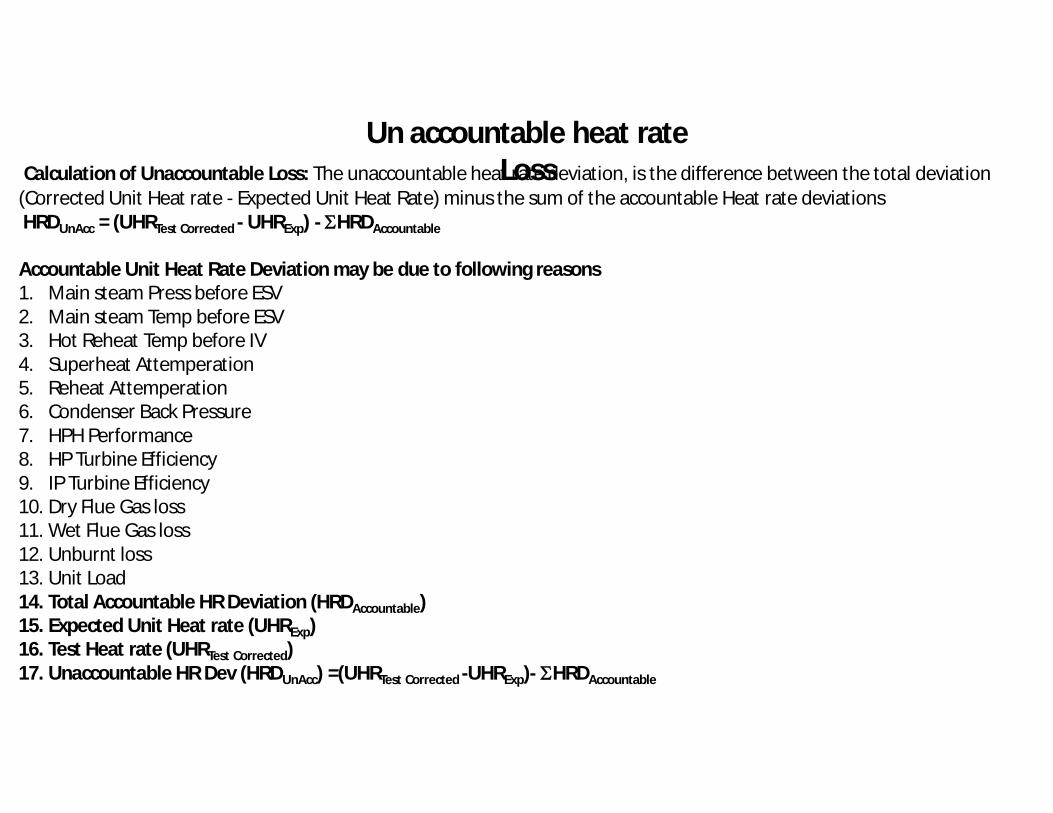
Calculation of Unaccountable Loss: The unaccountable heat rate deviation, is the difference between the total deviation (Corrected Unit Heat rate - Expected Unit Heat Rate) minus the sum of the accountable Heat rate deviationsHRDUnAcc = (UHRTest Corrected - UHRExp) - HRDAccountable
Accountable Unit Heat Rate Deviation may be due to following reasons1. Main steam Press before ESV2. Main steam Temp before ESV3. Hot Reheat Temp before IV4. Superheat Attemperation5. Reheat Attemperation6. Condenser Back Pressure 7. HPH Performance 8. HP Turbine Efficiency9. IP Turbine Efficiency10. Dry Flue Gas loss 11. Wet Flue Gas loss12. Unburnt loss13. Unit Load14. Total Accountable HR Deviation (HRDAccountable)15. Expected Unit Heat rate (UHRExp)16. Test Heat rate (UHRTest Corrected)17. Unaccountable HR Dev (HRDUnAcc) =(UHRTest Corrected -UHRExp)- HRDAccountable
Un accountable heat rate Loss

Sample Calculations:
Expected Unit Heat rate (UHRExp) : 2471 kcal/kWh
Test Corrected Heat rate (UHRTest Corrected) : 2654 kcal/kWh
Accountable HR Deviation(HRDAcc) : 156 kcal/kWh
Unaccountable HR Dev (HRDUnAcc)
= (UHRTest Corrected - UHRExp) - HRDAccountable
= (2654kcal/kWh - 2471 kcal/kWh) - (156 kcal/kWh)
= 183.0kcal/kWh - 156.0kcal/kWh
= 27.0kcal/kWh
Un accountable Heat rate Loss
Unaccounted Losses & its reduction Instrument Accuracy : Parameter uncertainty• Uncertainty level of parameters used for Boiler & Turbine HR calculation to be accessed• Impact on HR due to parameter uncertainty to be quantified
Improving accuracy of Instruments• Plan to be prepared for replacing the instruments with better accuracy instruments in a phased manner
Redundant / Duplicate measurement• Provide duplicate measurement points for pressure & temperature measurements.• PG test points to be revived, if required and same may be used for testing.• Measurement location and representative sampling error need to be corrected.
FW flow validation• For assessment of deterioration of Primary Sensor element, FW flow element condition assessment to be done during the
shutdown for the units which has run for longer period.• Flow Validations can also be done with ultrasonic flow meter.
Accuracy of Generator Energy Meter, CT & PT • Meters, CT, PT may be upgraded to 0.2 class accuracy
Un accountable Heat Rate Loss

Calibration of instruments • There should be a regular calibration of measurement devices & sensors.• Calibration records for the instruments should be maintained as permanent records.High Energy Drains• Listing of all high energy drains with specific valve Nos. • Routine checking of temperatures down stream of valve by laser gun measurement.• Provision for on-line temperature measurement for indication to be available at Control room.• Prioritizing the valves and action plan for replacing the valves with better quality valves in a phased mannerHPH Performance • Analysis of TTD & DCA and arriving at optimum heater level• HPH Vent line loss evaluation. • Action plan for checking of vent line orifice condition and replacement as per need.System Modifications• Effect of Site specific System modifications carried out if any • on HR to be analyzedTest Conditions• Test to be carried out as per EEMG guidelines.• D/A level drop to be monitored during the test• Equivalent DM make-up to be calculated and HR loss on this account to be accounted for.
Un accountable Heat Rate Loss
Gland Steam Cooler• Steam flow Assessment for Sealing Steam flow to Gland Steam Cooler by heat balance of Gland Steam Cooler• Instruments required for the same to be provided if required
Insulation• Heat loss due to poor insulation to be assessed and quantified.
LP Turbine Efficiency• Deterioration can be assessed with the help of Math model software.• Opening & Closing Steam path audit of LP turbine.• Restoration of LPT efficiency.
LP Heater Performance• Deterioration can be assessed with Heater TTD calculation based on test.
TD BFP Performance• Deterioration can be assessed with quantification of extra steam consumption of BFP.
Temperature drop from boiler outlet to Turbine inlet
Un accountable Heat rateLoss