energy efficiency masterclass for industry -...
TRANSCRIPT

Energy Efficiency Masterclass
for Industry
2Government of South Australia
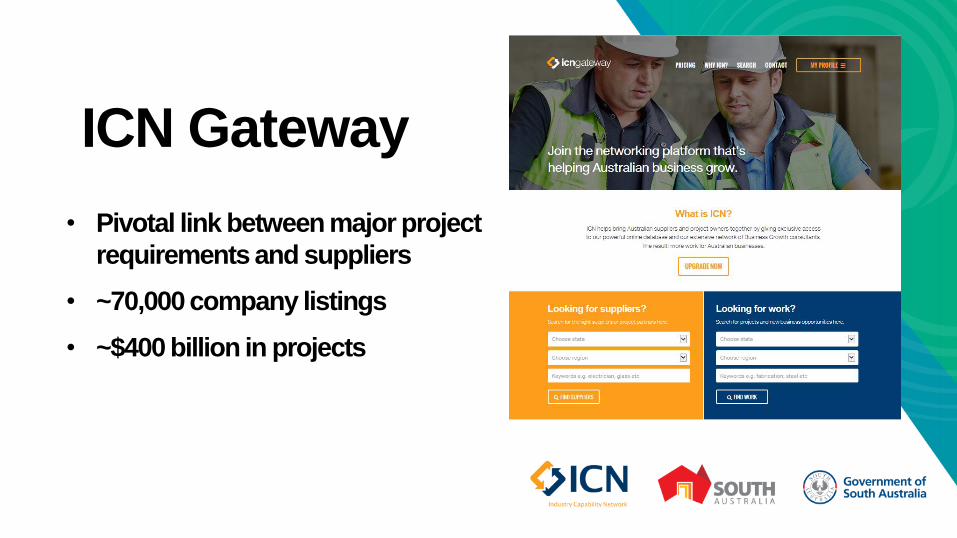
ICN Gateway
• Pivotal link between major project
requirements and suppliers
• ~70,000 company listings
• ~$400 billion in projects
Setting the Scene
Industry and Energy Efficiency
• Competitive Business Environment
• Industry Productivity
• Energy Prices
• Industry Response
Industry Response
• Focused Assessments (AS/NZS 3598.2)
• Type 1 Audit - to identify key opportunities
• Type 3 Audit – focusing on key areas only
• Business Case for Investment
• Competes with other industry investments
• Finance for implementation

Aim
Participants will leave this session with a clear
understanding of key energy efficiency
improvements that can be implemented within their
organisations.
Objectives
Masterclass Objectives address three themes:
• Financial
• Practical
• Technical
Kevin JonesBranch Manager, CAPS
SUBHEADING
ENERGY EFFICIENT COMPRESSED AIR SYSTEMSPresented by Kevin Jones, CAPS Australia
1. Why Compressed Air?
2. 5 x Facts About Compressed Air
3. Review Maintenance & Managing Leaks
4. Compressed Air Energy Auditing
5. Case Studies & Upgrading Equipment
AGENDA
MOST INDUSTRIES DEPENDHEAVILY ON COMPRESSED AIR.
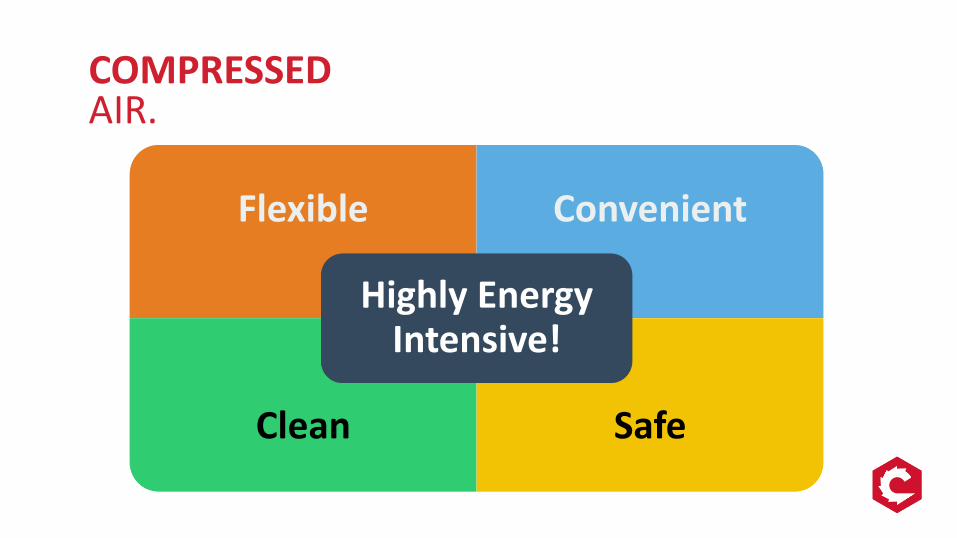
COMPRESSEDAIR.
Flexible Convenient
Clean Safe
Highly Energy Intensive!
5 FACTS ABOUTCOMPRESSED AIR.
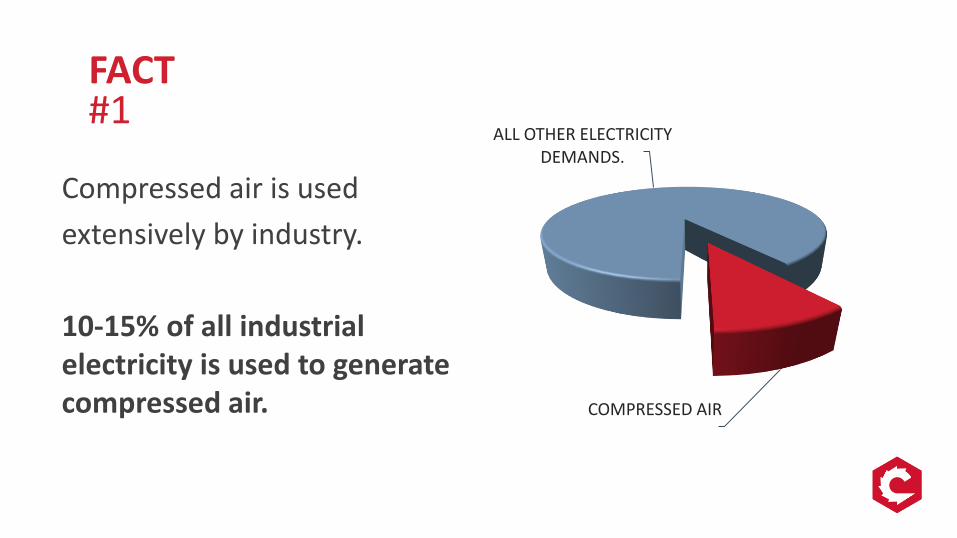
FACT#1
Compressed air is used
extensively by industry.
10-15% of all industrial electricity is used to generate compressed air.
ALL OTHER ELECTRICITY DEMANDS.
COMPRESSED AIR
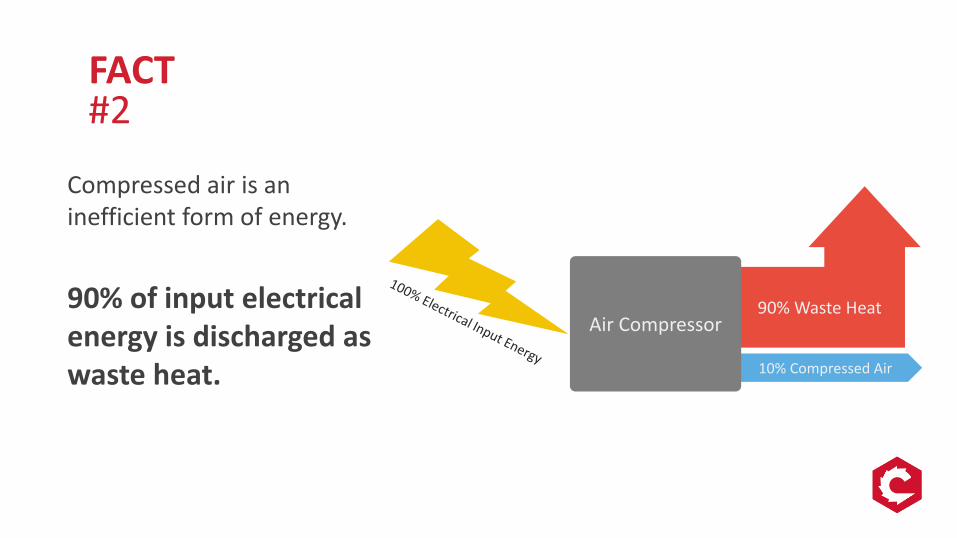
FACT#2
Compressed air is an inefficient form of energy.
90% of input electrical energy is discharged as waste heat. 10% Compressed Air
90% Waste HeatAir Compressor
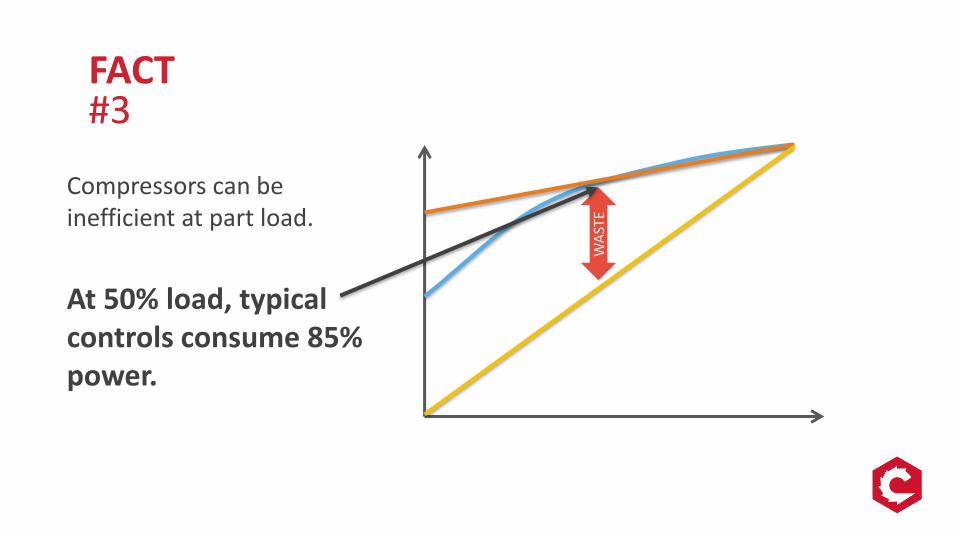
FACT#3
Compressors can be inefficient at part load.
At 50% load, typical controls consume 85% power.
WA
STE
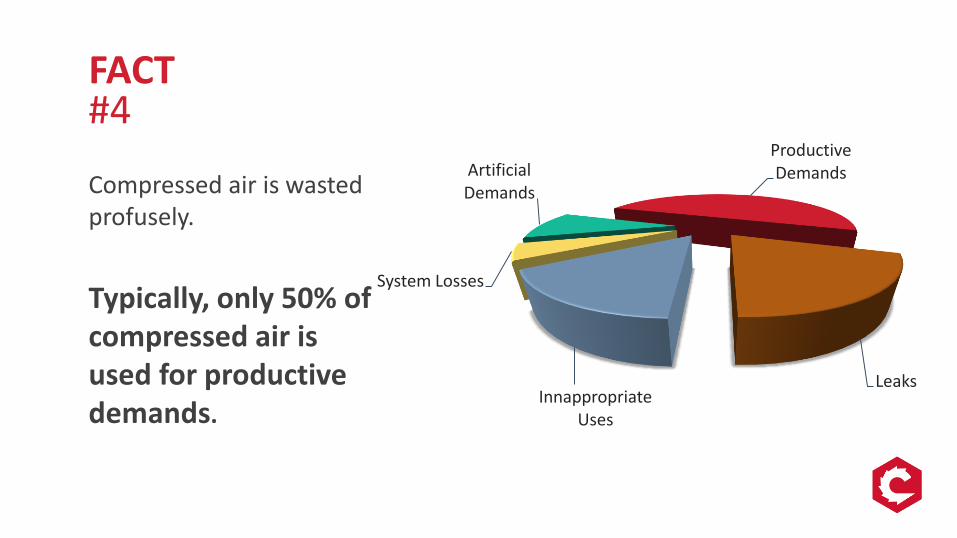
FACT#4
Compressed air is wasted profusely.
Typically, only 50% of compressed air is used for productive demands.
Productive Demands
LeaksInnappropriate
Uses
System Losses
Artificial Demands
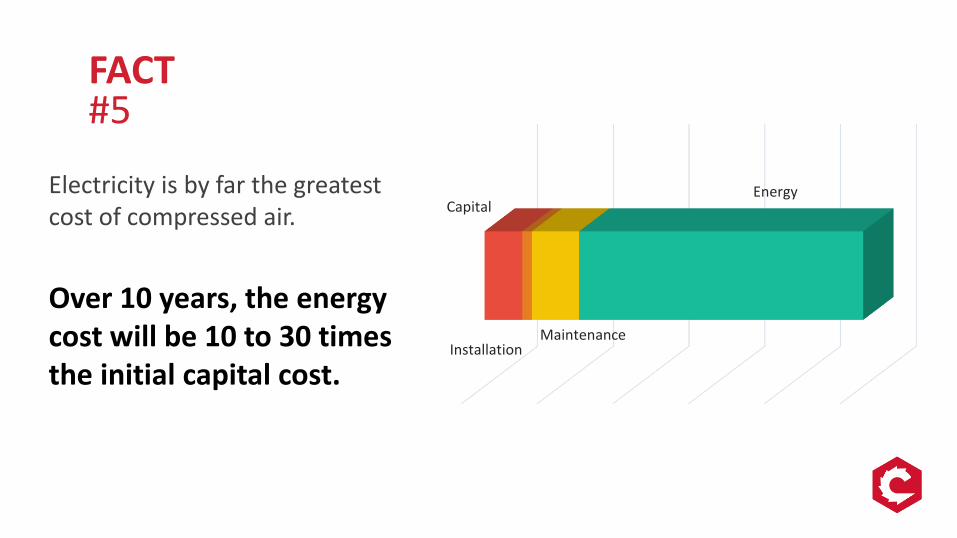
FACT#5
Electricity is by far the greatest cost of compressed air.
Over 10 years, the energy cost will be 10 to 30 times the initial capital cost.
Capital
InstallationMaintenance
Energy
REVIEW &MAINTENANCE.
Why servicing pays.
• Less prone to breakdown
• Efficiency drops
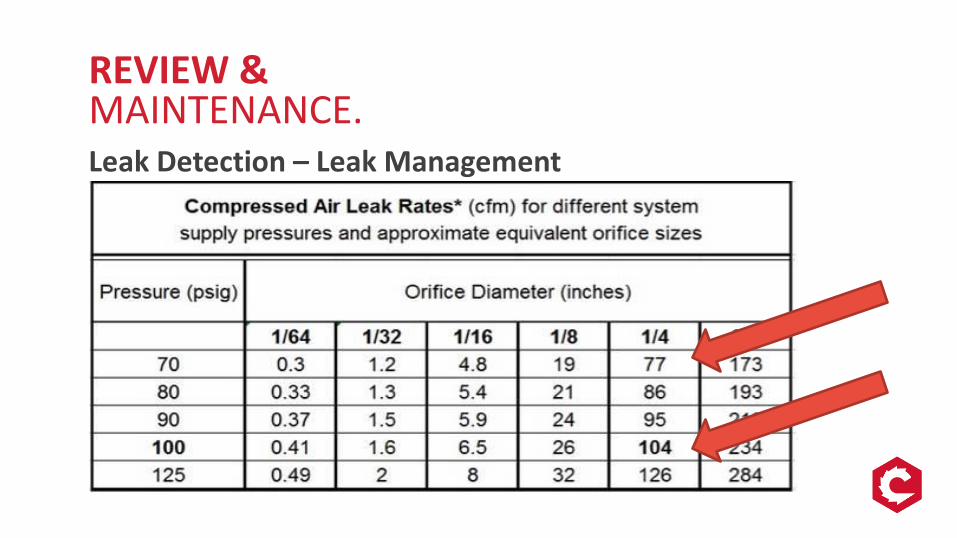
REVIEW &MAINTENANCE.Leak Detection – Leak Management
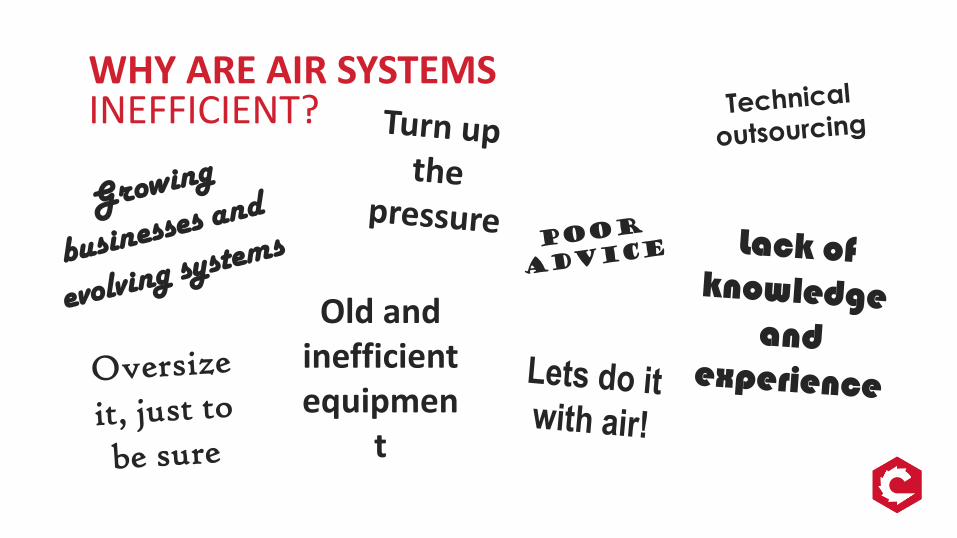
WHY ARE AIR SYSTEMSINEFFICIENT?
Old and inefficient equipmen
t

HOW CAN THEYBE IMPROVED?
8kW LossesH
igh
Eff
icie
ncy
Var
iab
le S
pee
d
Air
Co
mp
ress
or
Op
erat
ing
at 5
0%
Lo
ad
70
kW
Inp
ut
Elec
tric
ity
60
kW
Load
ed P
ow
er
Typ
ical
Air
Co
mp
ress
or
Op
erat
ing
at 5
0%
Lo
ad
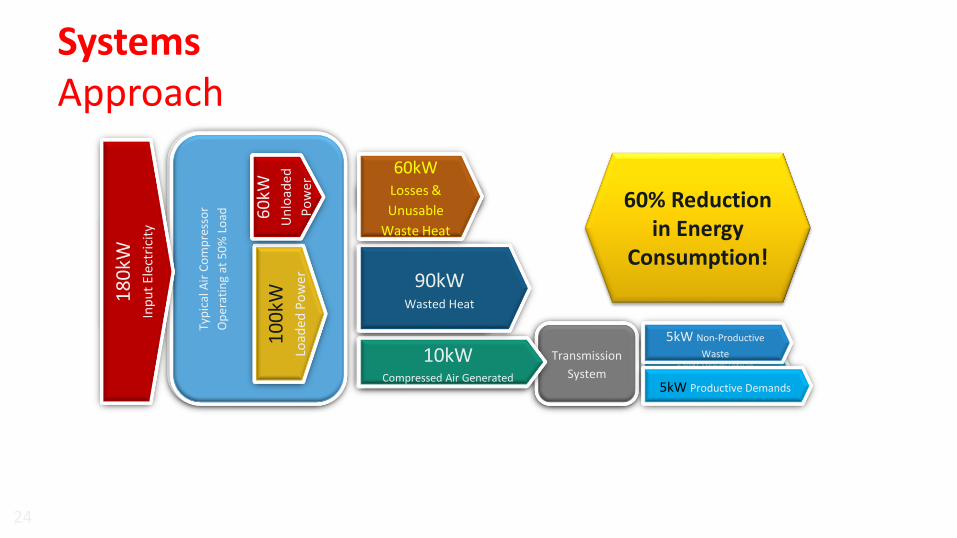
Systems Approach
24
46kW
Heat Recovery System
Transmission
System
1kW Non-Productive Waste
5kW Productive
Demands
10
0kW
Load
ed P
ow
er
6kW
Compressed Air Generated
Transmission
System
5kW Non-Productive
Waste
5kW Productive Demands
18
0kW
Inp
ut
Elec
tric
ity
10kWCompressed Air Generated
90kWWasted Heat
60% Reduction in Energy
Consumption!6
0kW
Un
load
ed
Po
wer
60kWLosses &
Unusable
Waste Heat
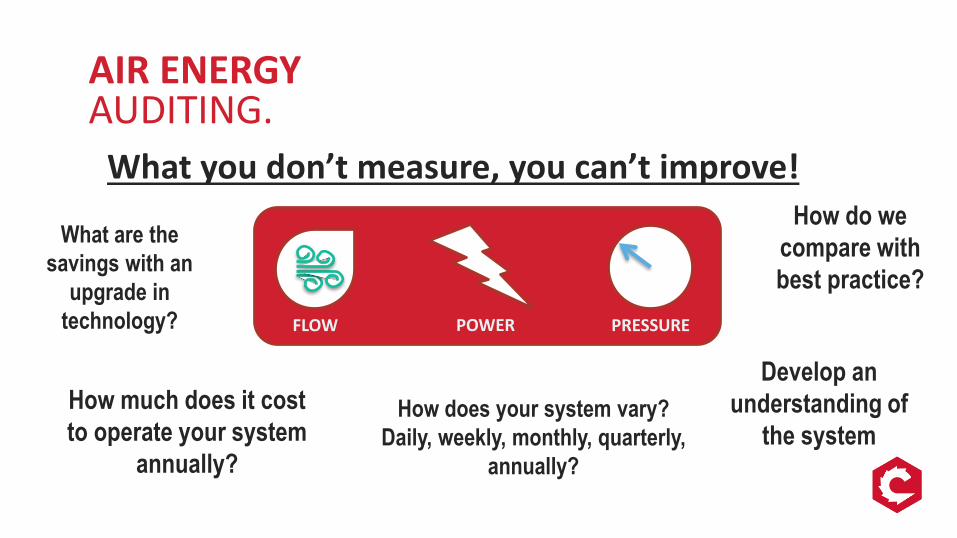
AIR ENERGYAUDITING.
FLOW POWER PRESSURE
What you don’t measure, you can’t improve!
What are the
savings with an
upgrade in
technology?
How much does it cost
to operate your system
annually?
How does your system vary?
Daily, weekly, monthly, quarterly,
annually?
Develop an
understanding of
the system
How do we
compare with
best practice?
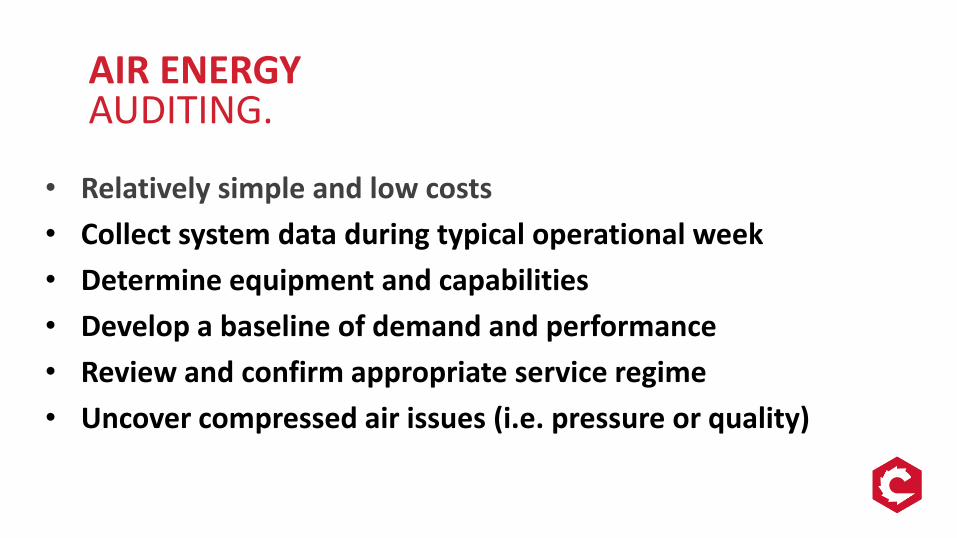
AIR ENERGYAUDITING.
• Relatively simple and low costs
• Collect system data during typical operational week
• Determine equipment and capabilities
• Develop a baseline of demand and performance
• Review and confirm appropriate service regime
• Uncover compressed air issues (i.e. pressure or quality)
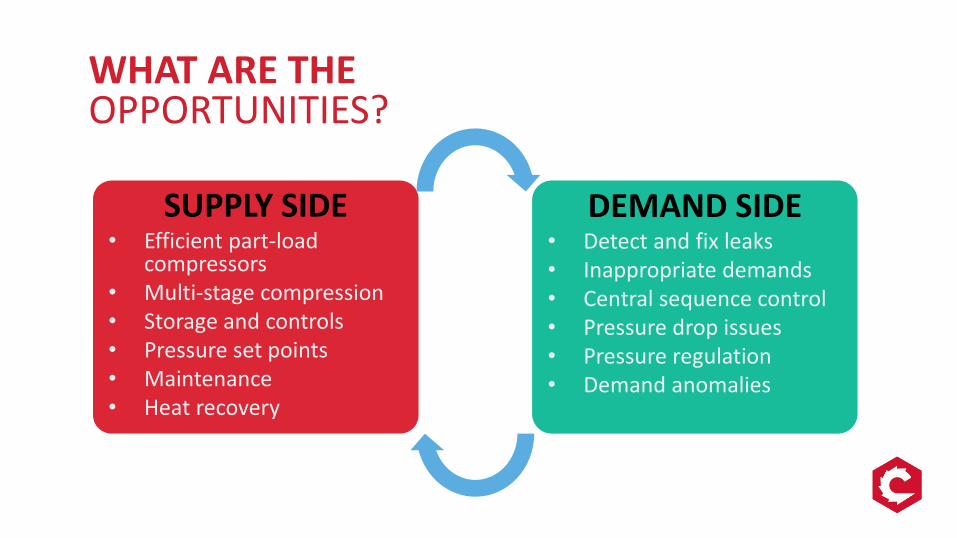
WHAT ARE THEOPPORTUNITIES?
SUPPLY SIDE• Efficient part-load
compressors• Multi-stage compression• Storage and controls• Pressure set points• Maintenance• Heat recovery
DEMAND SIDE• Detect and fix leaks• Inappropriate demands• Central sequence control• Pressure drop issues• Pressure regulation• Demand anomalies
CASE STUDY #1SIMPLE MANUFACTURING APPLICATION.
• Manufacturing facility seeking energy savings opportunities
• Only one compressor in operation
• Data logging and analysis undertaken
• Along with a demand-side review
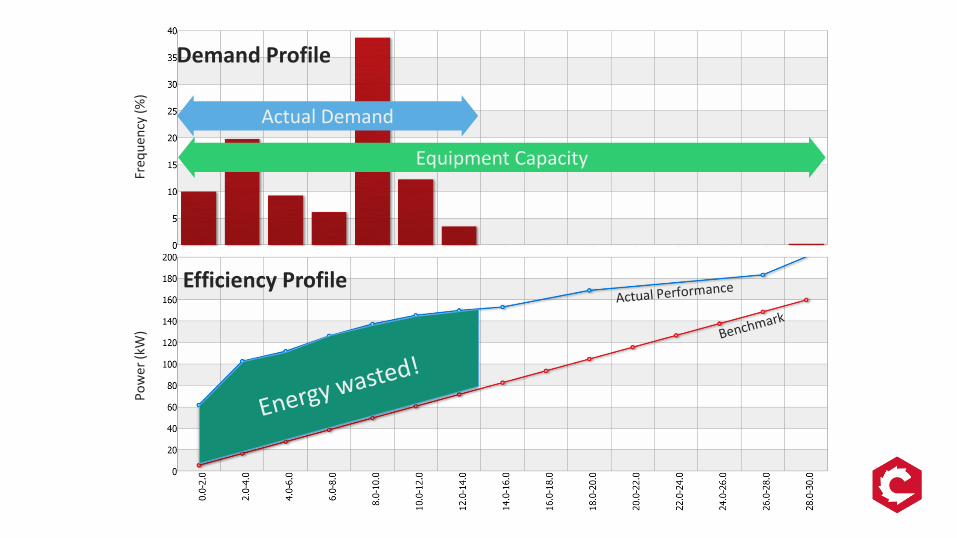
Freq
uen
cy (
%)
Demand Profile
Po
we
r (k
W)
Efficiency Profile
Actual Demand
Equipment Capacity
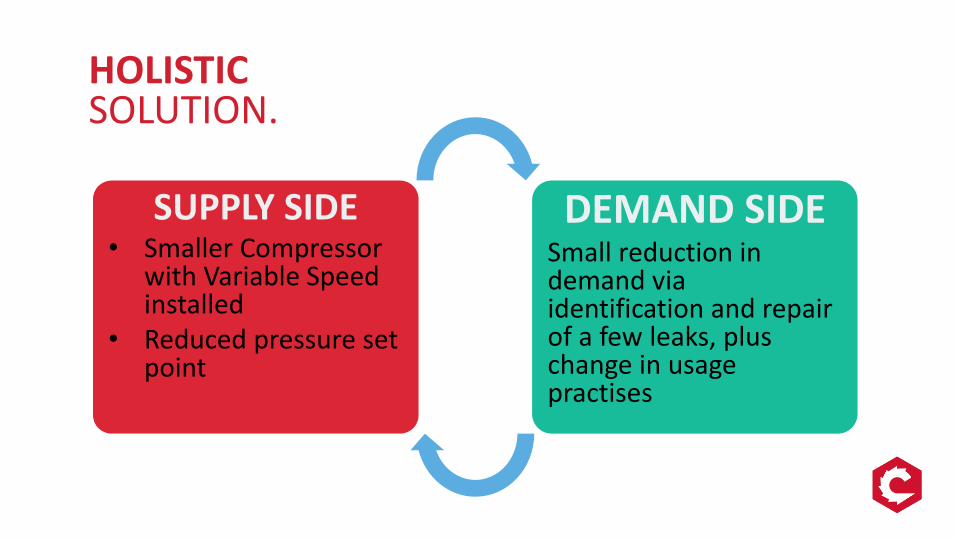
HOLISTICSOLUTION.
SUPPLY SIDE• Smaller Compressor
with Variable Speed installed
• Reduced pressure set point
DEMAND SIDESmall reduction in demand via identification and repair of a few leaks, plus change in usage practises
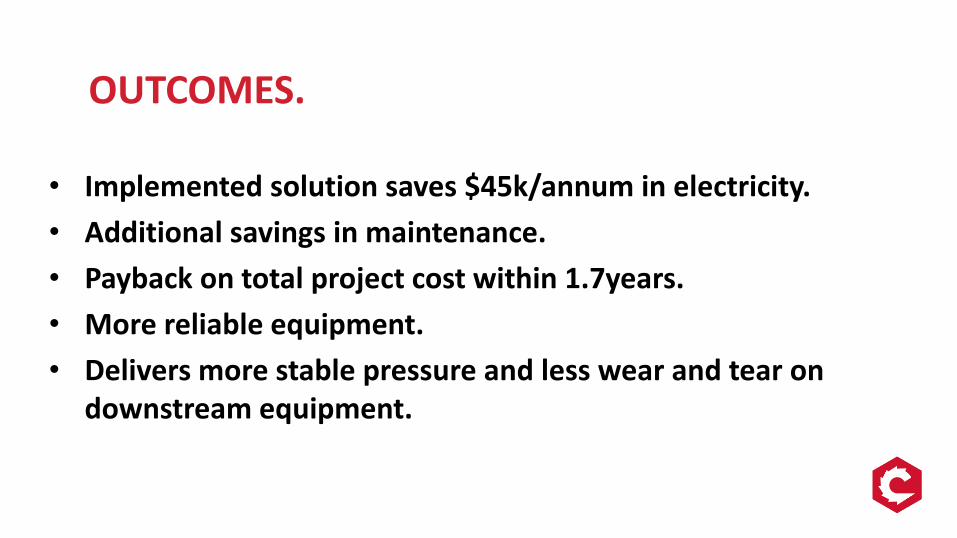
OUTCOMES.
• Implemented solution saves $45k/annum in electricity.
• Additional savings in maintenance.
• Payback on total project cost within 1.7years.
• More reliable equipment.
• Delivers more stable pressure and less wear and tear on downstream equipment.
CASE STUDY #2KILCOY PASTORAL.
• Abattoir seeking compressor upgrade with energy savings
• Three compressors in operation (3 constant speed unloading)
• Data logging and analysis undertaken
• Project recommendations undertaken by client
• One new large VSD compressor with two existing compressors
• Data logging for verification purposes confirmed savings
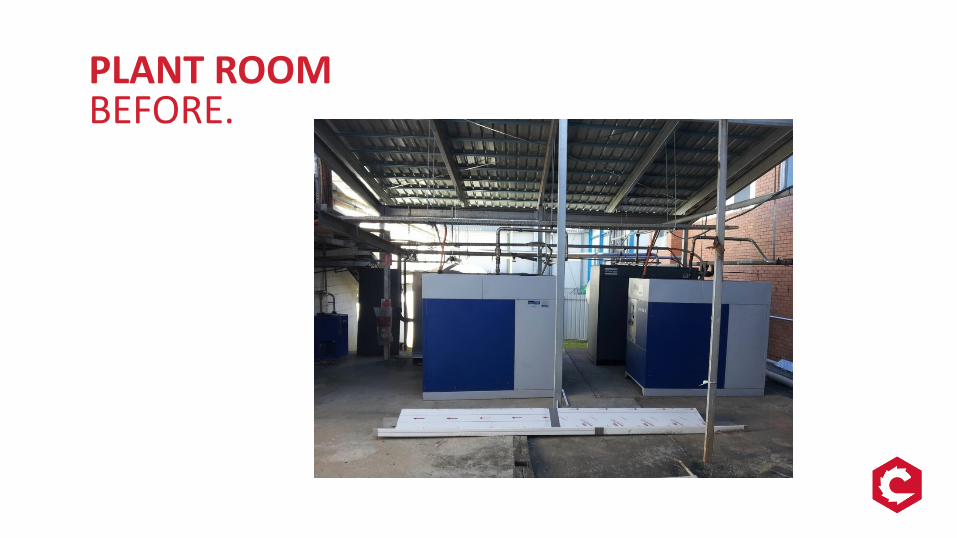
PLANT ROOMBEFORE.
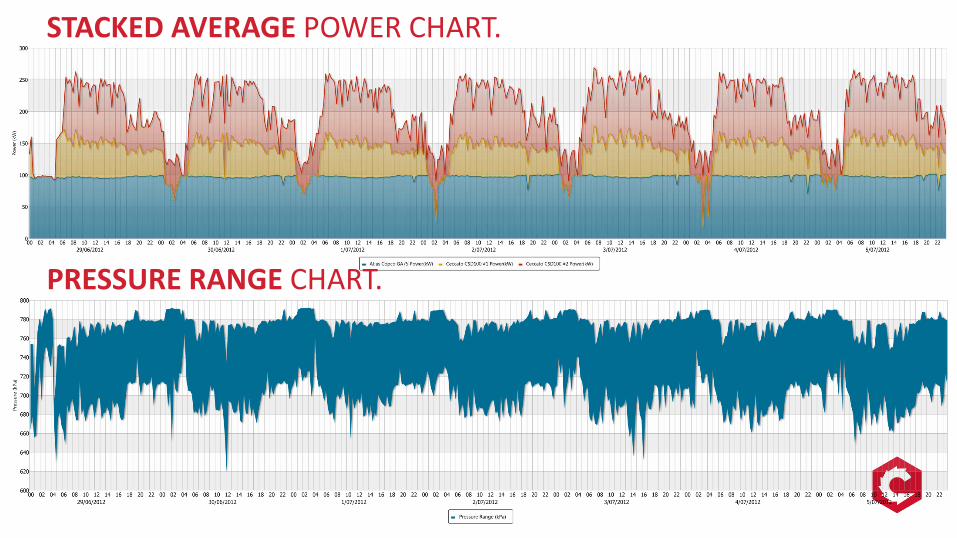
STACKED AVERAGE POWER CHART.
PRESSURE RANGE CHART.
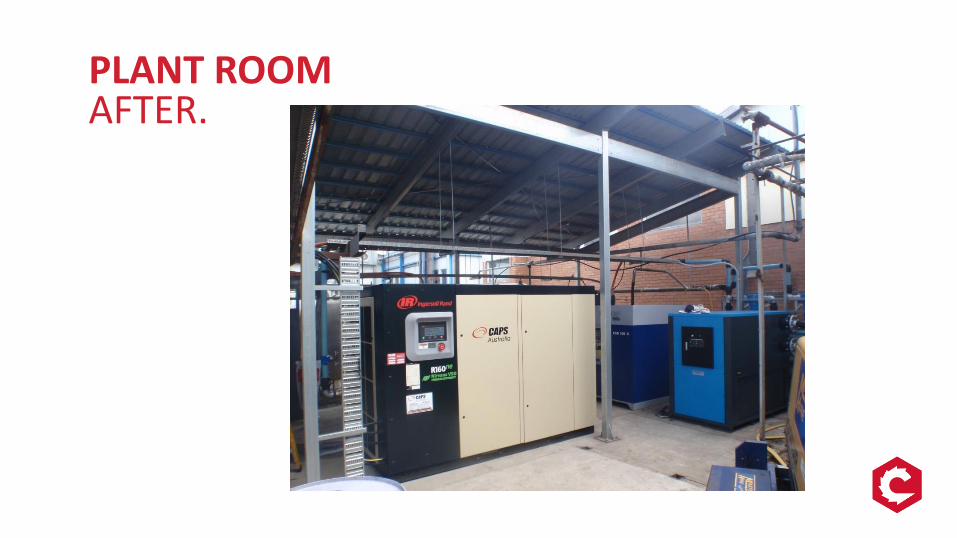
PLANT ROOMAFTER.
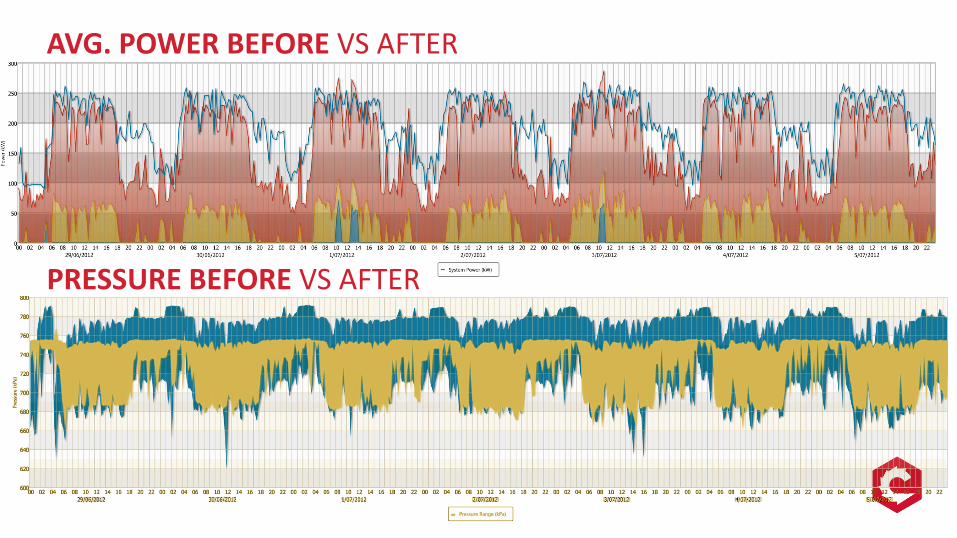
AVG. POWER BEFORE VS AFTER
PRESSURE BEFORE VS AFTER
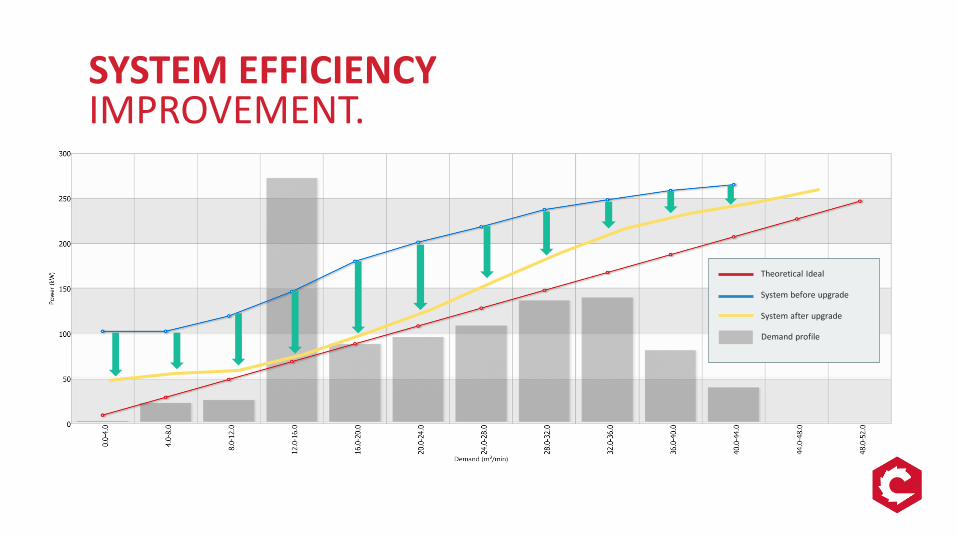
SYSTEM EFFICIENCYIMPROVEMENT.
Theoretical Ideal
System before upgrade
System after upgrade
Demand profile
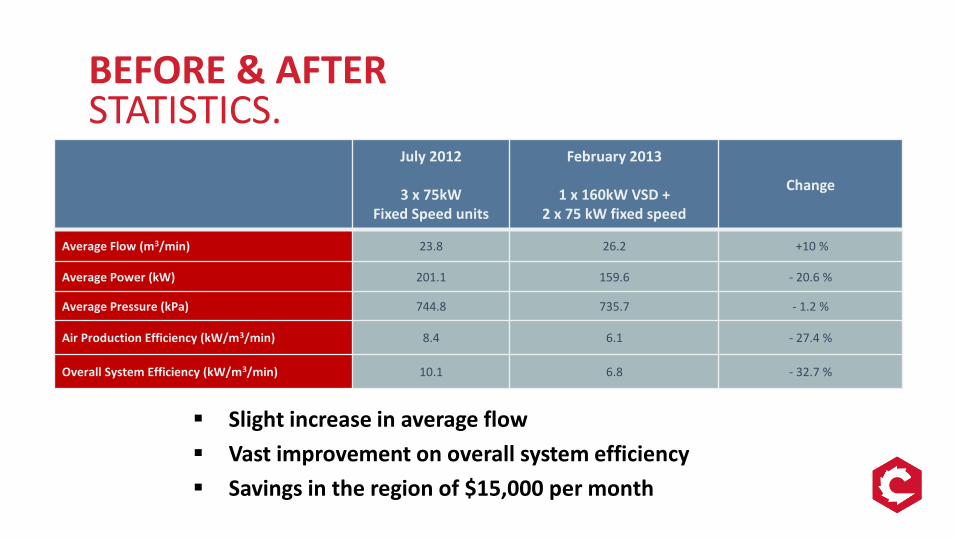
BEFORE & AFTERSTATISTICS.
July 2012
3 x 75kWFixed Speed units
February 2013
1 x 160kW VSD +2 x 75 kW fixed speed
Change
Average Flow (m3/min) 23.8 26.2 +10 %
Average Power (kW) 201.1 159.6 - 20.6 %
Average Pressure (kPa) 744.8 735.7 - 1.2 %
Air Production Efficiency (kW/m3/min) 8.4 6.1 - 27.4 %
Overall System Efficiency (kW/m3/min) 10.1 6.8 - 32.7 %
▪ Slight increase in average flow
▪ Vast improvement on overall system efficiency
▪ Savings in the region of $15,000 per month
OUTCOMES.
• Implemented solution saves $15k/month in electricity
• Additional savings in maintenance
• Payback on capital cost within 2 years
• More reliable equipment
• Delivering more stable pressure and less wear and tear on downstream equipment
IN CLOSING.
• Compressed air a very costly ‘invisible’ energy.
• Significant opportunities exist for substantial cost savings with fast payback on solutions.
• Seek assistance from specialised professional services providers

THANK YOU
Craig DurrheimBusiness Development Manager, Danfoss Drives
43 | Danfoss Drives
Electrical Motor ControlsEnergy Efficiency Expo22nd August 2018
Craig Durrheim
BDM SA / NT
Overview1) Developments in motor technology2) Considerations when using VSDs3) Enhancements in VSD technology
45 | Danfoss Drives
46 | Danfoss Drives
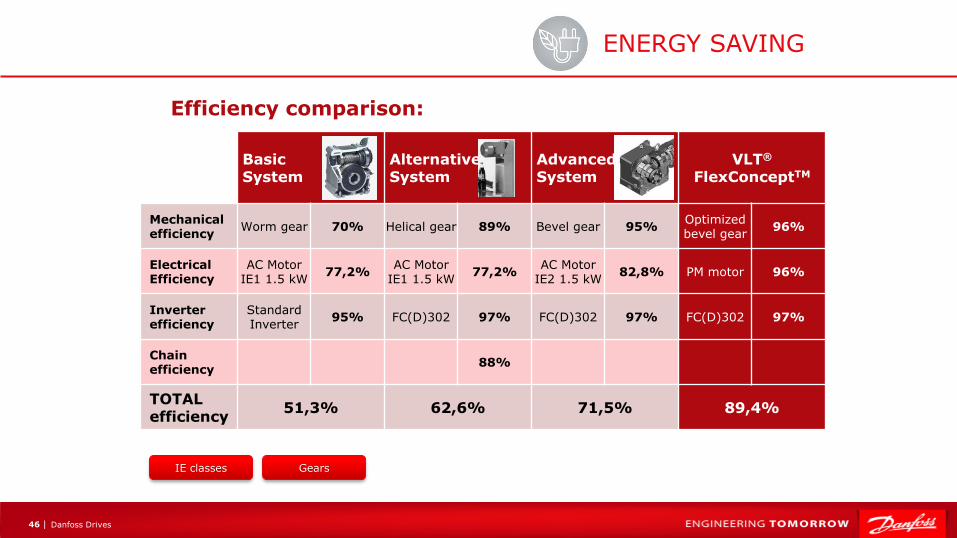
BasicSystem
AlternativeSystem
AdvancedSystem
VLT®
FlexConceptTM
Mechanicalefficiency
Worm gear 70% Helical gear 89% Bevel gear 95%Optimized bevel gear
96%
Electrical Efficiency
AC MotorIE1 1.5 kW
77,2%AC Motor
IE1 1.5 kW77,2%
AC MotorIE2 1.5 kW
82,8% PM motor 96%
Inverterefficiency
StandardInverter
95% FC(D)302 97% FC(D)302 97% FC(D)302 97%
Chain efficiency
88%
TOTALefficiency
51,3% 62,6% 71,5% 89,4%
ENERGY SAVING
Efficiency comparison:
IE classes Gears
47 | Danfoss Drives
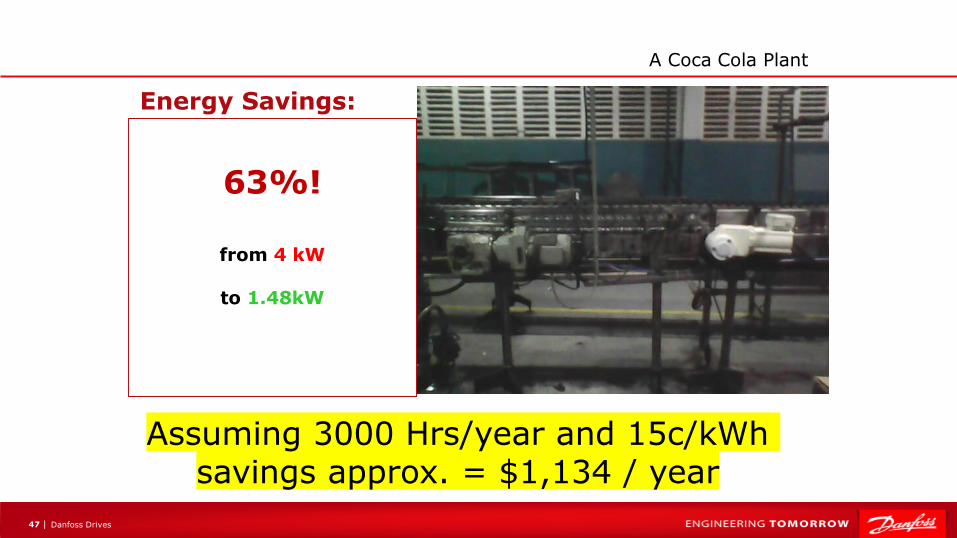
Energy Savings:
63%!
from 4 kW
to 1.48kW
Assuming 3000 Hrs/year and 15c/kWh savings approx. = $1,134 / year
A Coca Cola Plant
48 | Danfoss Drives
Considerations when utilising Variable Speed Drives
50 | Danfoss Drives
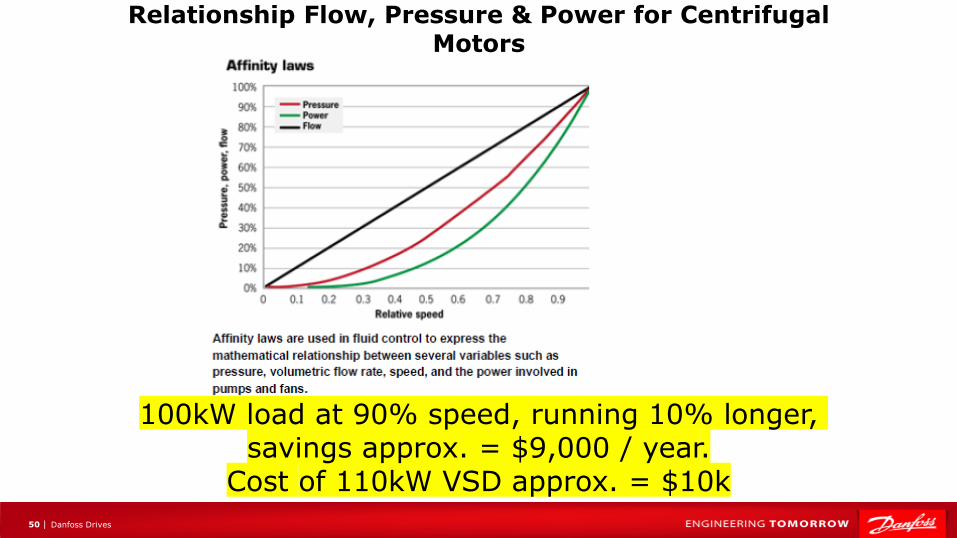
Relationship Flow, Pressure & Power for Centrifugal Motors
100kW load at 90% speed, running 10% longer, savings approx. = $9,000 / year.
Cost of 110kW VSD approx. = $10k
51 | Danfoss Drives
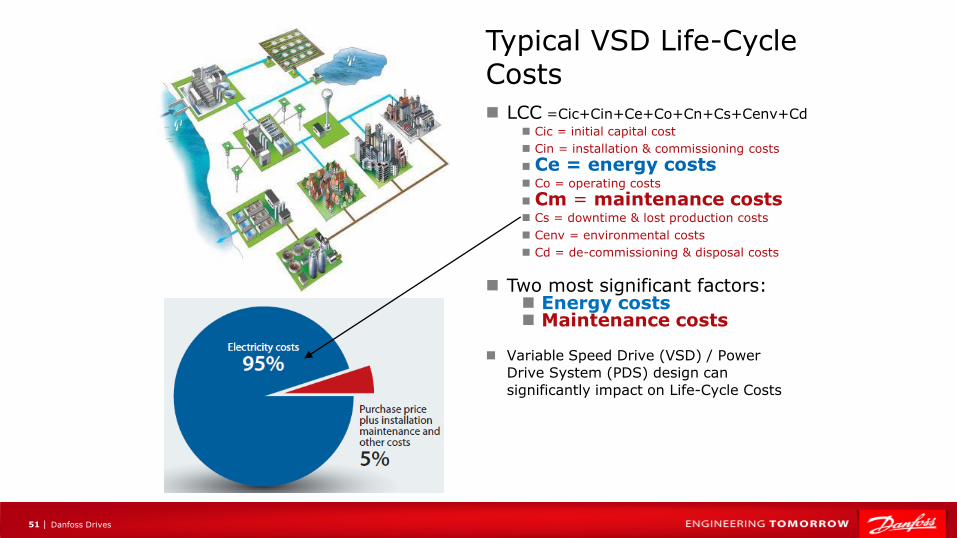
LCC =Cic+Cin+Ce+Co+Cn+Cs+Cenv+Cd Cic = initial capital cost
Cin = installation & commissioning costs
Ce = energy costs Co = operating costs
Cm = maintenance costs Cs = downtime & lost production costs
Cenv = environmental costs
Cd = de-commissioning & disposal costs
Two most significant factors: Energy costs Maintenance costs
Variable Speed Drive (VSD) / Power
Drive System (PDS) design can
significantly impact on Life-Cycle Costs
Typical VSD Life-Cycle Costs
52 | Danfoss Drives
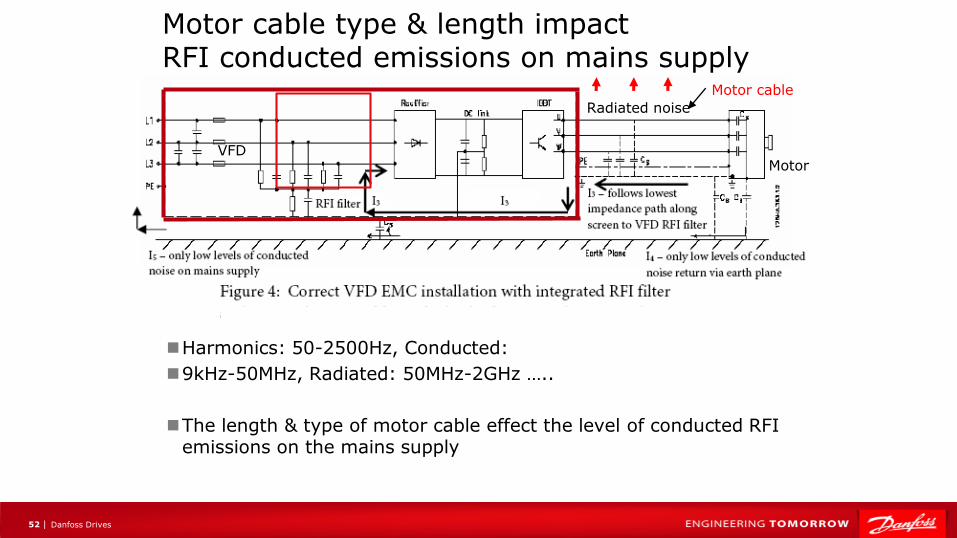
Radiated noise
Motor cable
VFD Motor
Motor cable type & length impact RFI conducted emissions on mains supply
Harmonics: 50-2500Hz, Conducted:
9kHz-50MHz, Radiated: 50MHz-2GHz …..
The length & type of motor cable effect the level of conducted RFI emissions on the mains supply
53 | Danfoss Drives
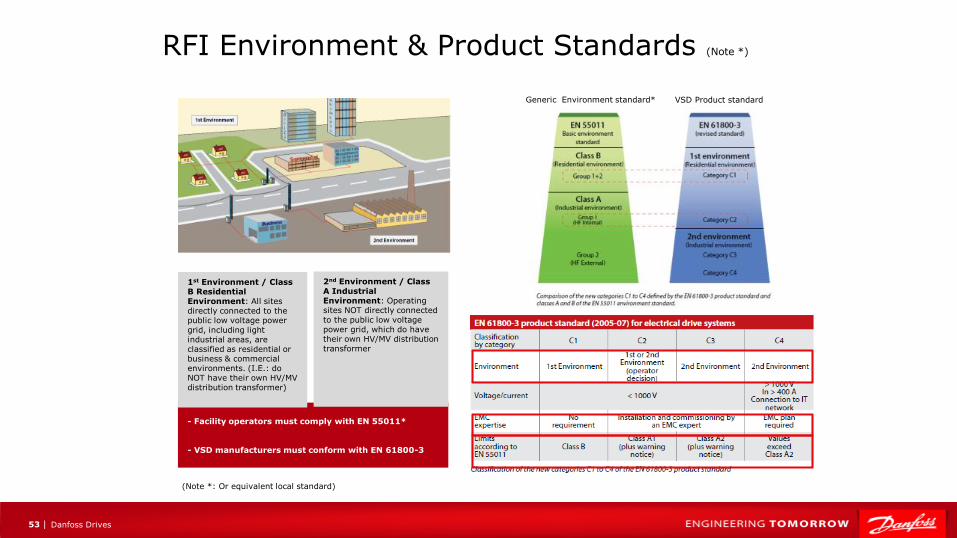
RFI Environment & Product Standards (Note *)
(Note *: Or equivalent local standard)
Generic Environment standard* VSD Product standard
- Facility operators must comply with EN 55011*
- VSD manufacturers must conform with EN 61800-3
1st Environment / Class B Residential Environment: All sites directly connected to the public low voltage power grid, including light industrial areas, are classified as residential or business & commercial environments. (I.E.: do NOT have their own HV/MV distribution transformer)
2nd Environment / Class A Industrial Environment: Operating sites NOT directly connected to the public low voltage power grid, which do have their own HV/MV distribution transformer
54 | Danfoss Drives
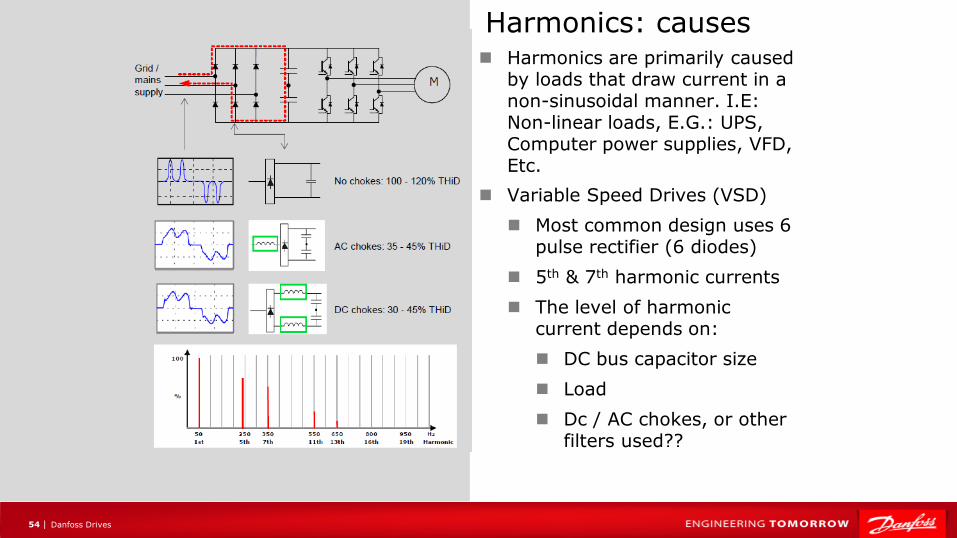
Harmonics: causes Harmonics are primarily caused
by loads that draw current in a non-sinusoidal manner. I.E: Non-linear loads, E.G.: UPS, Computer power supplies, VFD, Etc.
Variable Speed Drives (VSD)
Most common design uses 6 pulse rectifier (6 diodes)
5th & 7th harmonic currents
The level of harmonic current depends on:
DC bus capacitor size
Load
Dc / AC chokes, or other filters used??
55 | Danfoss Drives
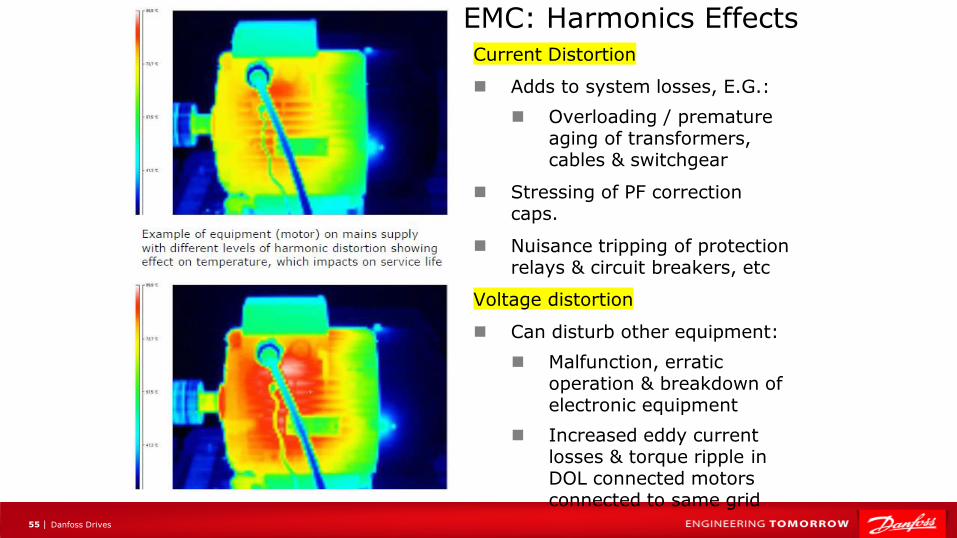
EMC: Harmonics EffectsCurrent Distortion
Adds to system losses, E.G.:
Overloading / premature aging of transformers, cables & switchgear
Stressing of PF correction caps.
Nuisance tripping of protection relays & circuit breakers, etc
Voltage distortion
Can disturb other equipment:
Malfunction, erratic operation & breakdown of electronic equipment
Increased eddy current losses & torque ripple in DOL connected motors connected to same grid
56 | Danfoss Drives
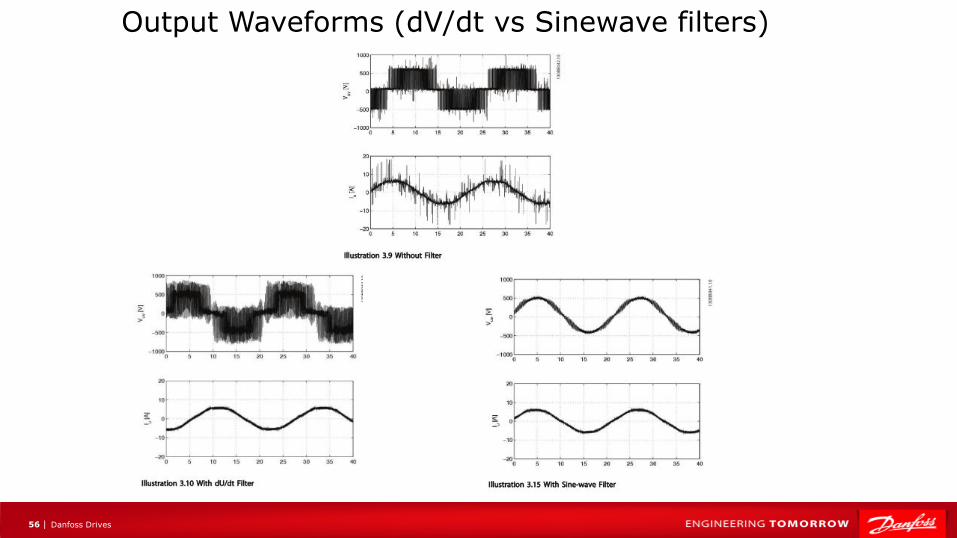
Output Waveforms (dV/dt vs Sinewave filters)
57 | Danfoss Drives
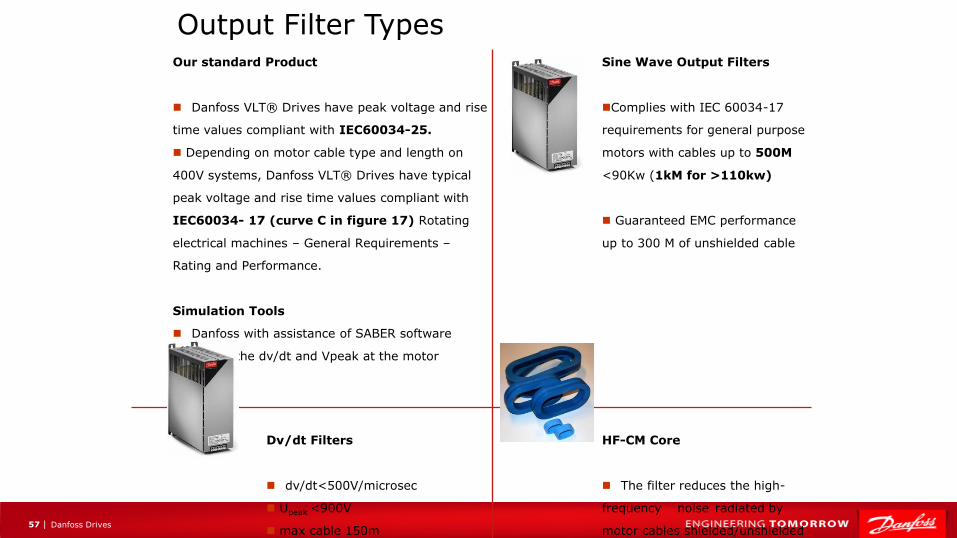
Our standard Product
Danfoss VLT® Drives have peak voltage and rise
time values compliant with IEC60034-25.
Depending on motor cable type and length on
400V systems, Danfoss VLT® Drives have typical
peak voltage and rise time values compliant with
IEC60034- 17 (curve C in figure 17) Rotating
electrical machines – General Requirements –
Rating and Performance.
Simulation Tools
Danfoss with assistance of SABER software
estimates the dv/dt and Vpeak at the motor
terminals.
Sine Wave Output Filters
Complies with IEC 60034-17
requirements for general purpose
motors with cables up to 500M
<90Kw (1kM for >110kw)
Guaranteed EMC performance
up to 300 M of unshielded cable
Dv/dt Filters
dv/dt<500V/microsec
Upeak <900V
max cable 150m
HF-CM Core
The filter reduces the high-
frequency noise radiated by
motor cables shielded/unshielded
Output Filter Types
58 | Danfoss Drives
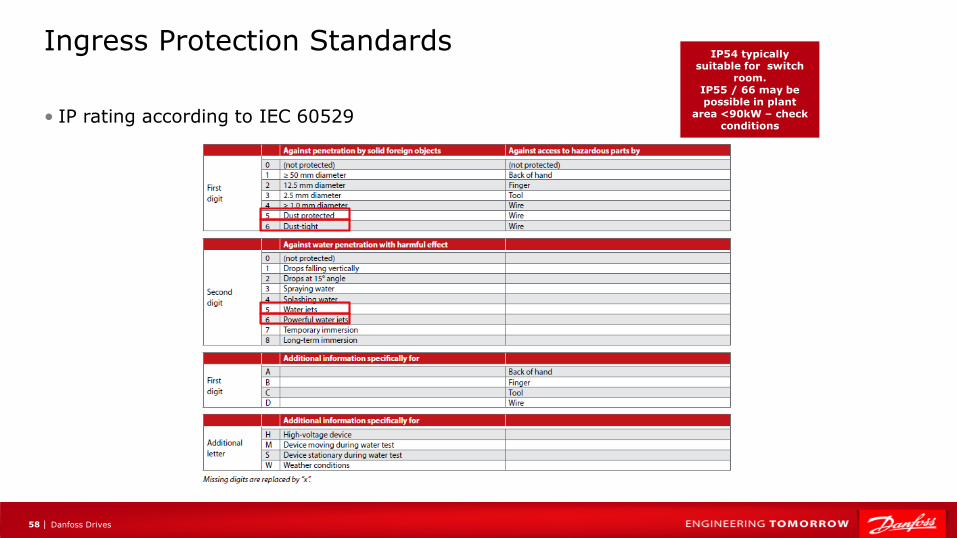
Ingress Protection Standards
• IP rating according to IEC 60529
IP54 typically suitable for switch
room. IP55 / 66 may be possible in plant
area <90kW – check conditions
59 | Danfoss Drives
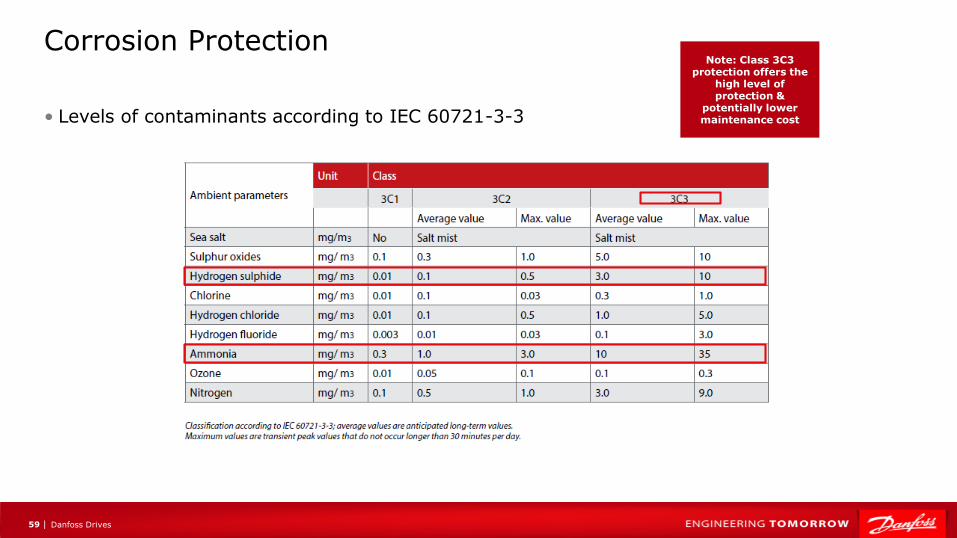
Corrosion Protection
• Levels of contaminants according to IEC 60721-3-3
Note: Class 3C3 protection offers the
high level of protection &
potentially lower maintenance cost
Enhancements in VSD technology
61 | Danfoss Drives
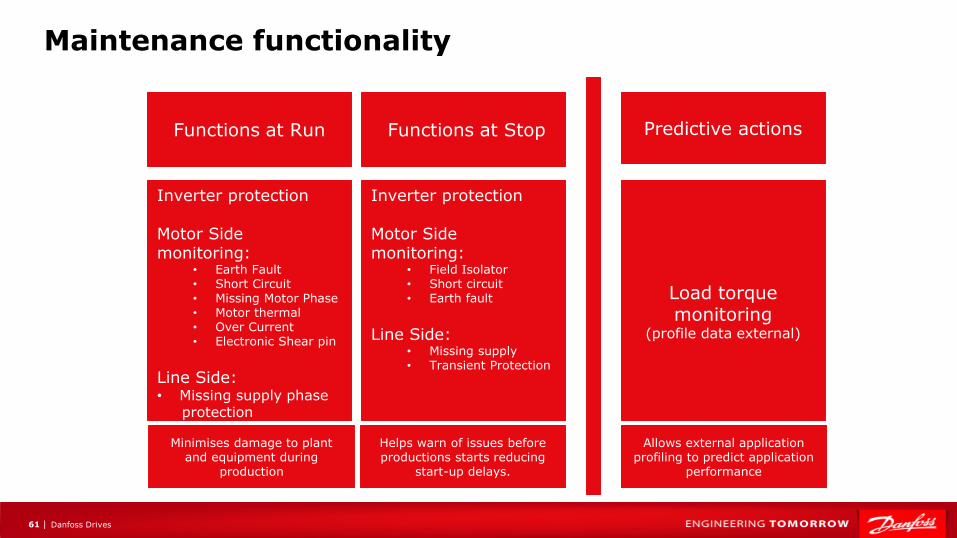
Maintenance functionality
Inverter protection
Motor Side monitoring:
• Earth Fault• Short Circuit• Missing Motor Phase• Motor thermal • Over Current• Electronic Shear pin
Line Side:• Missing supply phase
protection • Transient Protection
Inverter protection
Motor Side monitoring:
• Field Isolator • Short circuit• Earth fault
Line Side:• Missing supply • Transient Protection
Load torque monitoring
(profile data external)
Functions at Run Predictive actionsFunctions at Stop
Helps warn of issues before productions starts reducing
start-up delays.
Minimises damage to plant and equipment during
production
Allows external application profiling to predict application
performance
62 | Danfoss Drives
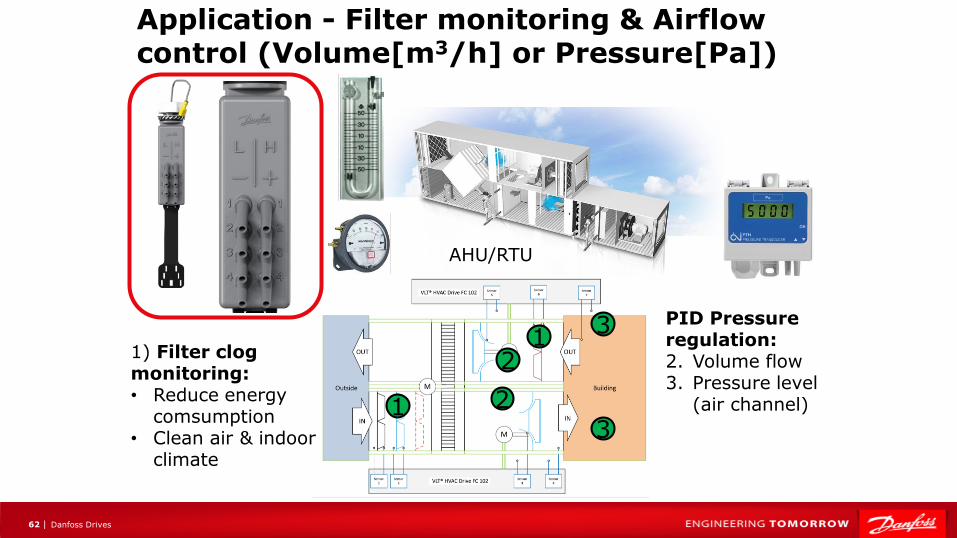
Application - Filter monitoring & Airflow control (Volume[m3/h] or Pressure[Pa])
1) Filter clog monitoring:• Reduce energy
comsumption• Clean air & indoor
climate
PID Pressure regulation:2. Volume flow3. Pressure level
(air channel)1 2
3
2
31
AHU/RTU
63 | Danfoss Drives
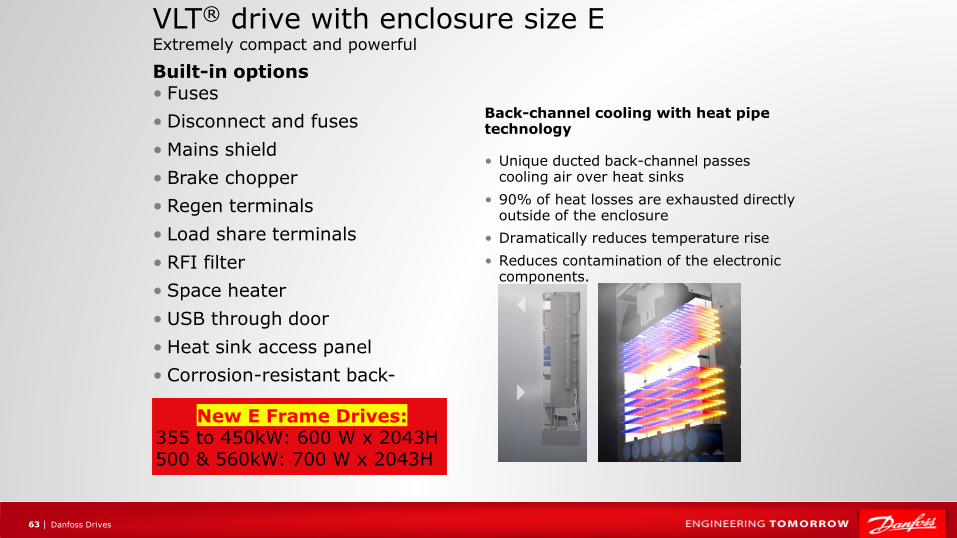
VLT® drive with enclosure size EExtremely compact and powerful
Back-channel cooling with heat pipe technology
• Unique ducted back-channel passes cooling air over heat sinks
• 90% of heat losses are exhausted directly outside of the enclosure
• Dramatically reduces temperature rise
• Reduces contamination of the electroniccomponents.
Built-in options• Fuses
• Disconnect and fuses
• Mains shield
• Brake chopper
• Regen terminals
• Load share terminals
• RFI filter
• Space heater
• USB through door
• Heat sink access panel
• Corrosion-resistant back-
New E Frame Drives:355 to 450kW: 600 W x 2043H500 & 560kW: 700 W x 2043H
64 | Danfoss Drives
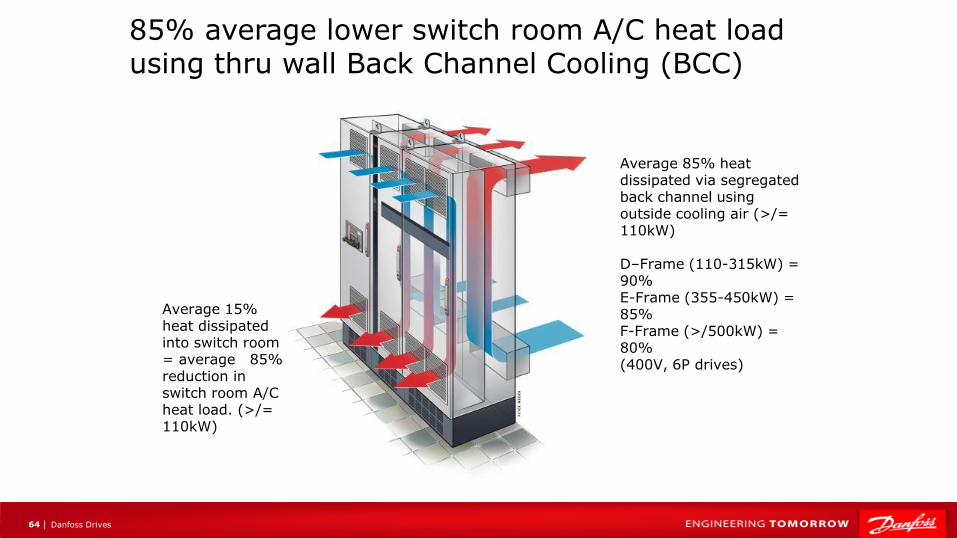
Average 85% heat dissipated via segregated back channel using outside cooling air (>/= 110kW)
D–Frame (110-315kW) = 90%E-Frame (355-450kW) = 85%F-Frame (>/500kW) = 80%(400V, 6P drives)
Average 15% heat dissipated into switch room = average 85% reduction in switch room A/C heat load. (>/= 110kW)
85% average lower switch room A/C heat load using thru wall Back Channel Cooling (BCC)
65 | Danfoss Drives
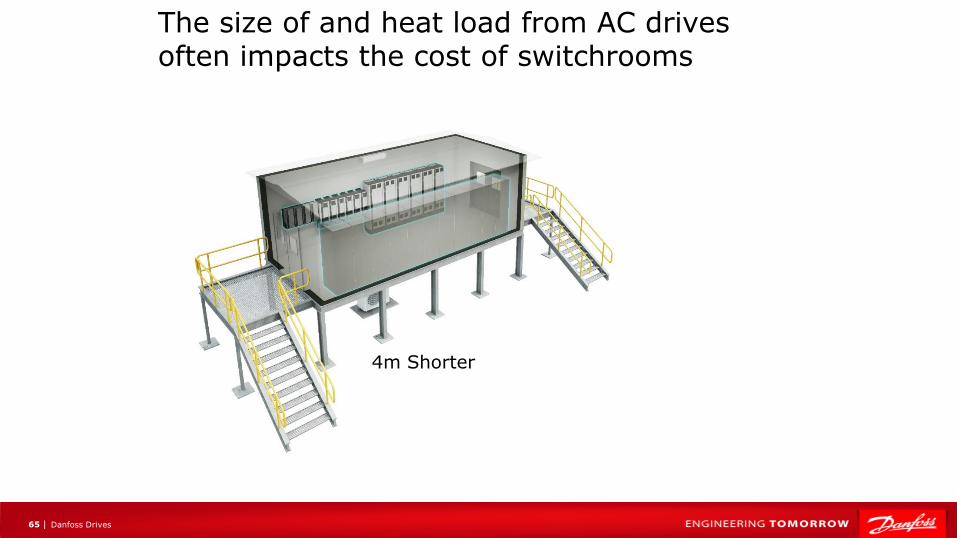
The size of and heat load from AC drives often impacts the cost of switchrooms
4m Shorter
66 | Danfoss Drives
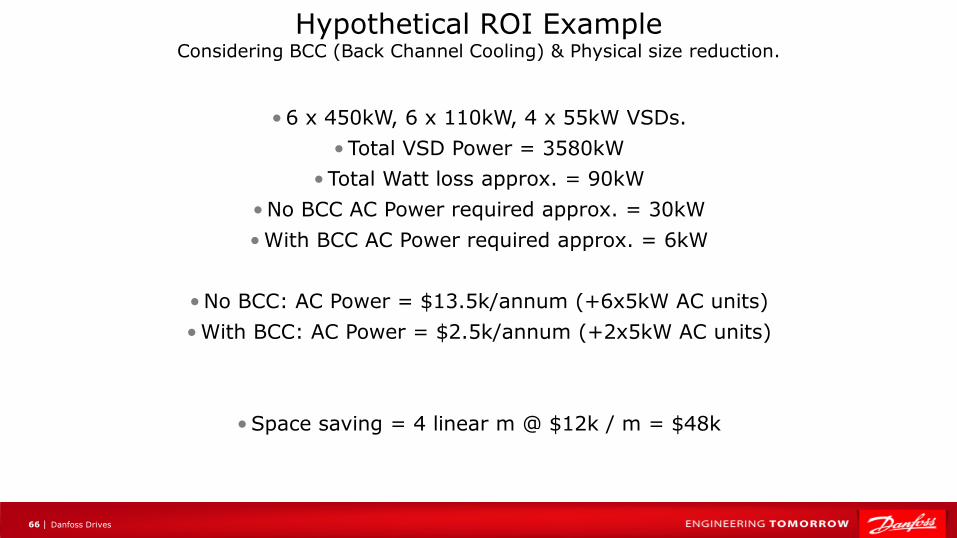
Hypothetical ROI ExampleConsidering BCC (Back Channel Cooling) & Physical size reduction.
• 6 x 450kW, 6 x 110kW, 4 x 55kW VSDs.
•Total VSD Power = 3580kW
•Total Watt loss approx. = 90kW
•No BCC AC Power required approx. = 30kW
•With BCC AC Power required approx. = 6kW
•No BCC: AC Power = $13.5k/annum (+6x5kW AC units)
•With BCC: AC Power = $2.5k/annum (+2x5kW AC units)
•Space saving = 4 linear m @ $12k / m = $48k
67 | Danfoss Drives
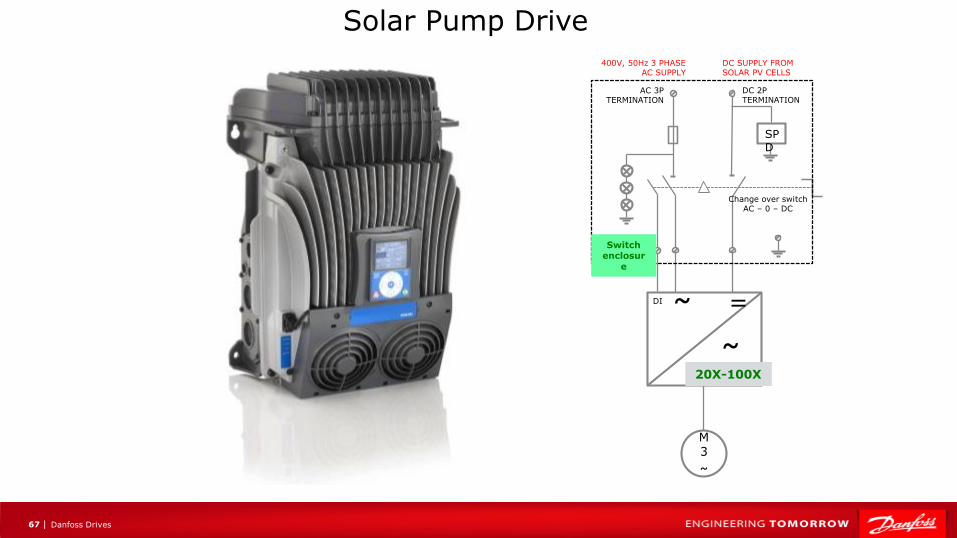
Solar Pump Drive
AC 3P TERMINATION
Change over switchAC – 0 – DC
M3
˜
400V, 50Hz 3 PHASEAC SUPPLY
˜
˜
=
DC SUPPLY FROM SOLAR PV CELLS
DC 2P TERMINATION
SPD
DI
20X-100X
Switch enclosur
e

Driven by Drives
Vikram KenjleEnergy Manager, University of Adelaide

Vikram Kenjle – Energy ManagerThe University of Adelaide
2018 Energy Efficiency Expo and Seminar

Cogeneration & Heat Recovery
Topic -
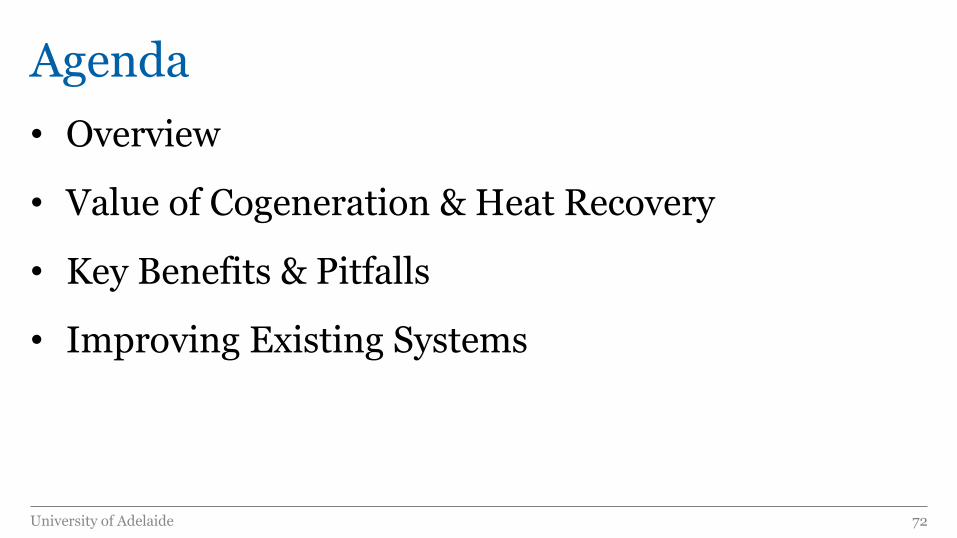
Agenda
• Overview
• Value of Cogeneration & Heat Recovery
• Key Benefits & Pitfalls
• Improving Existing Systems
University of Adelaide 72

What is Cogeneration / CHP?
University of Adelaide 73
Source: Carbon Trust UK, 2012
(80%) ....OVERALL EFFICIENCY…. (55%)
Cogeneration or Combined Heat &Power (CHP) is the simultaneousproduction and use of electricity andheat energy to provide high energyefficiencies (> 80%)
Efficiency can be further boosted(~90%) by adding an absorptionchiller to form a Tri-generation unitor Combined Cooling, Heat & Power(CCHP)
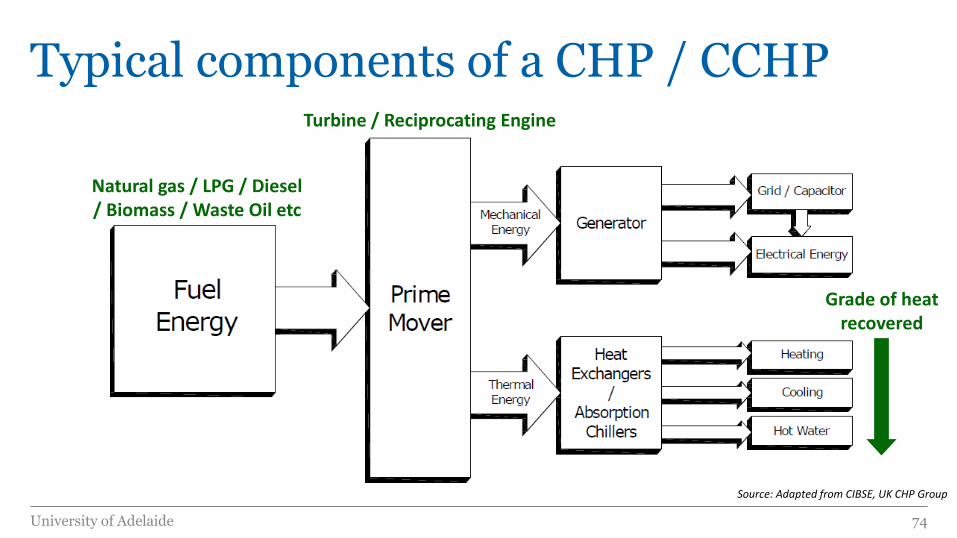
Typical components of a CHP / CCHP
University of Adelaide 74
Source: Adapted from CIBSE, UK CHP Group
Natural gas / LPG / Diesel / Biomass / Waste Oil etc
Turbine / Reciprocating Engine
Grade of heat recovered
Value proposition of CHP / CCHP
University of Adelaide 75
If sized and used appropriately, CHP / CCHP can deliver:
• Reduced energy costs – extract more value from input fuel • Reduced network costs – peak demand management• Improved energy security – island mode (may not be for
whole site)• Improved environmental footprint – depending on choice of
input fuel• Semi-dispatchable power plant – user controlled and not
depended on intermittent sources
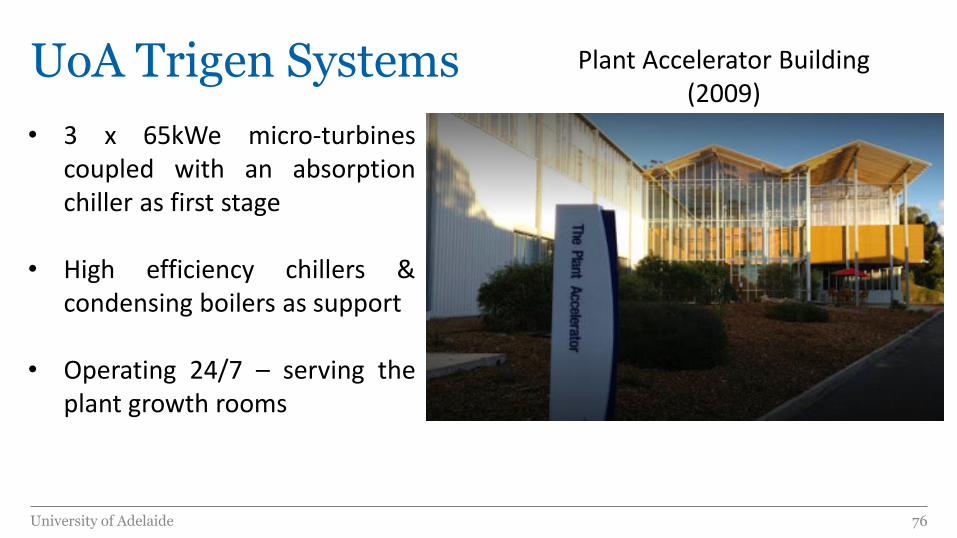
UoA Trigen Systems
University of Adelaide 76
Plant Accelerator Building (2009)
• 3 x 65kWe micro-turbinescoupled with an absorptionchiller as first stage
• High efficiency chillers &condensing boilers as support
• Operating 24/7 – serving theplant growth rooms
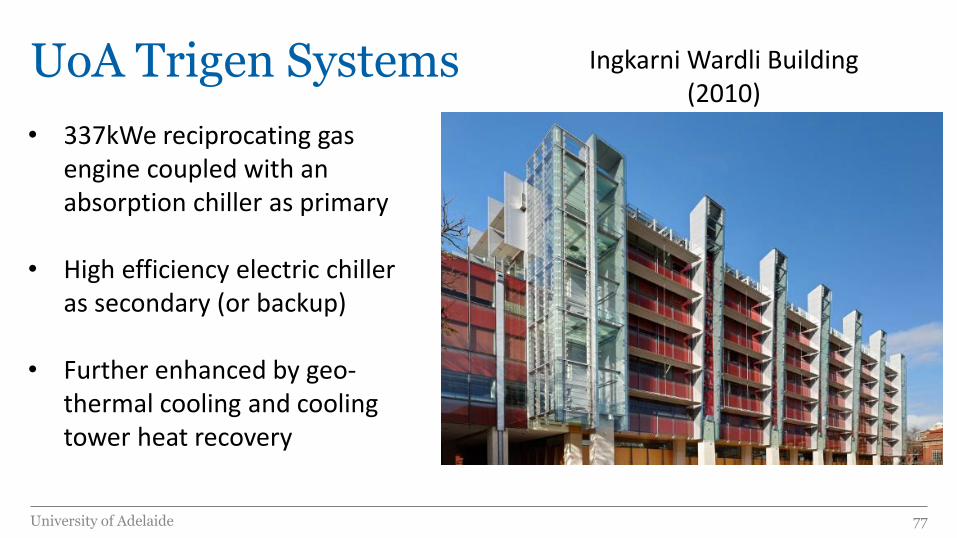
UoA Trigen Systems
University of Adelaide 77
Ingkarni Wardli Building (2010)
• 337kWe reciprocating gas engine coupled with an absorption chiller as primary
• High efficiency electric chiller as secondary (or backup)
• Further enhanced by geo-thermal cooling and cooling tower heat recovery
Potentials pitfalls of CHP / CCHP
• Under utilisation due to changes to business operations– Staged system can provide some flexibility, but can add upfront cost
– Shared system (Industrial Parks)
• Grid connection complexity and cost – Early engagement SAPN can save a lot $$$ downstream
• Variation to supply / price of input fuel
– Multi-fuel system can provide flexibility, but comes at a cost
University of Adelaide 78
Heat Recovery
Opportunities:
• Boiler flue losses and blowdowns
• Cooling Towers
• Air compressors
• Ventilation systems
• Heat stored in products leaving the process
• Heat in cooling hydraulic oil systems
• Heat emitted by Data Centres / Communication rooms
University of Adelaide 79
Heat Recovery
Economics:
• Understand quantity and quality of waste heat
• Identify heat demands in your facility and assess if these can be met directly (or as pre-heat)
• Identify if supply & demand are coincident, as adding storage can prove costly
University of Adelaide 80
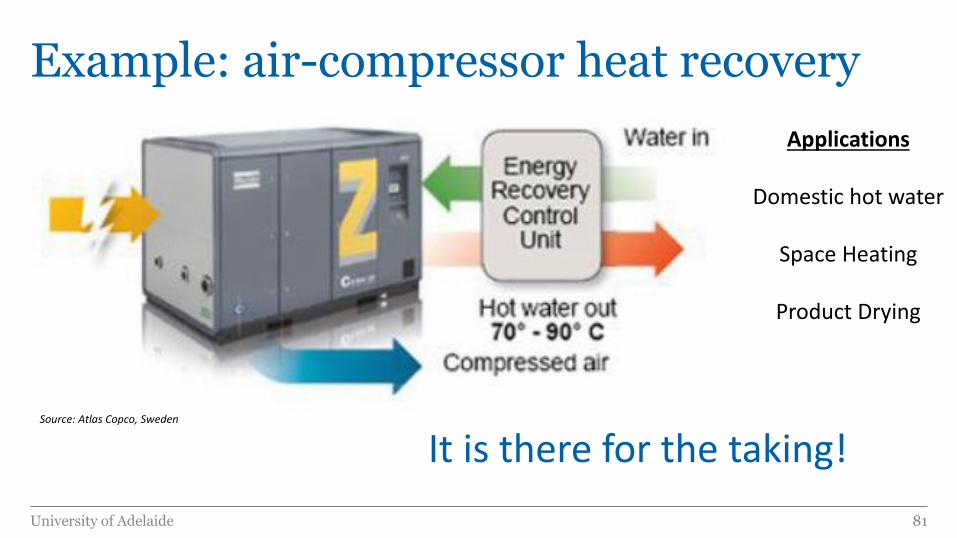
Example: air-compressor heat recovery
University of Adelaide 81
Source: Atlas Copco, Sweden
Applications
Domestic hot water
Space Heating
Product Drying
It is there for the taking!

Microgrids, Storage and Smart Technologies
Topic -
Agenda
• Overview
• Establishing Microgrids
• Energy Storage Systems
• Benefits for Early Adopters
University of Adelaide 83
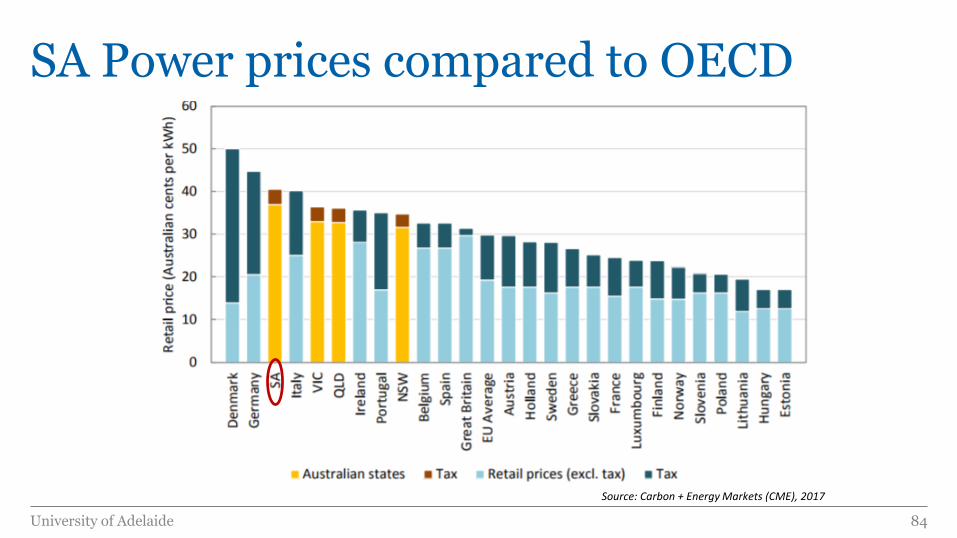
SA Power prices compared to OECD
University of Adelaide 84
Source: Carbon + Energy Markets (CME), 2017
0.00
5.00
10.00
15.00
20.00
25.00
30.00
0
10
20
30
40
50
60
Ave
rage
wei
ghte
d r
ate
(ce
nts
/kW
h)
Tota
l co
nsu
mp
tio
n (
kWh
/ye
ar)
Mill
ion
s
Year
TOTAL (kWh) AVERAGE WEIGHTED RATE (c/kWh)
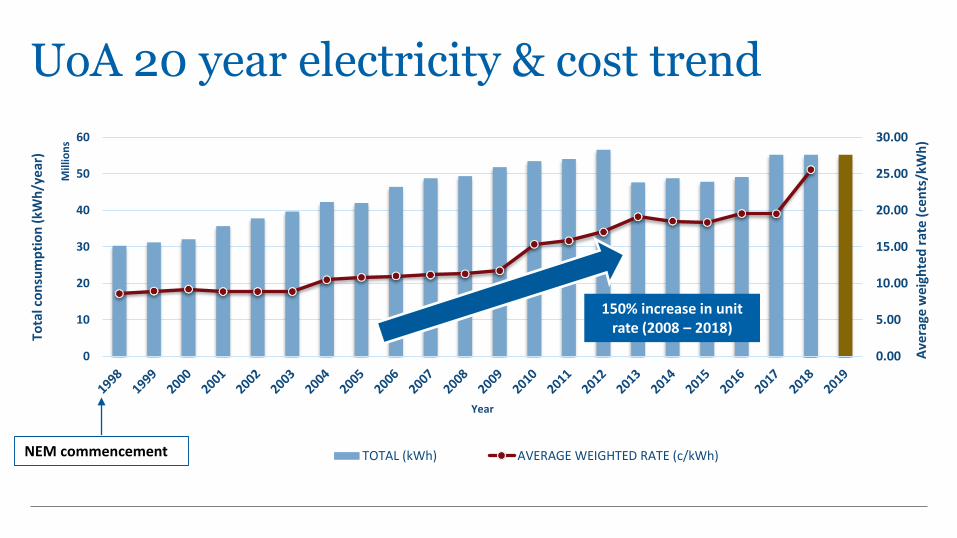
UoA 20 year electricity & cost trend
NEM commencement
150% increase in unit rate (2008 – 2018)
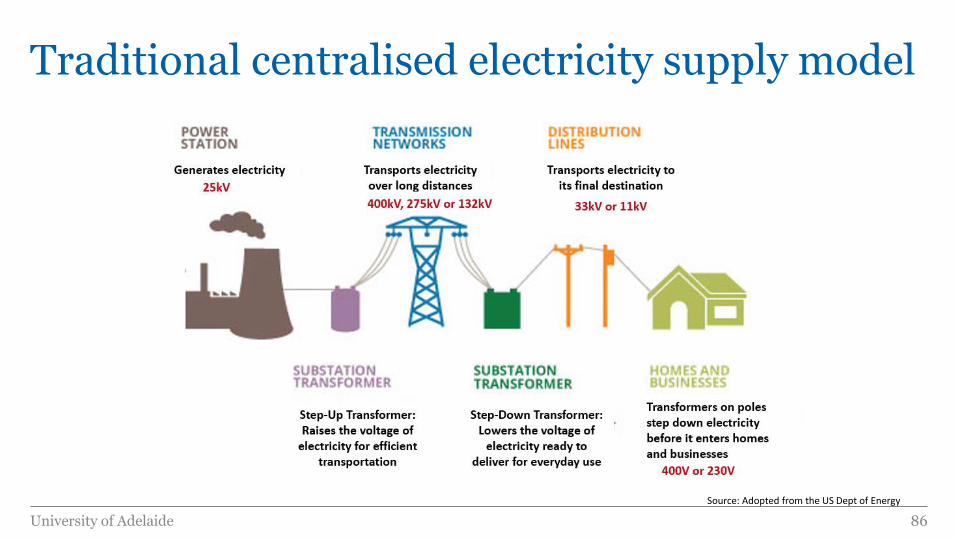
Traditional centralised electricity supply model
University of Adelaide 86
Source: Adopted from the US Dept of Energy
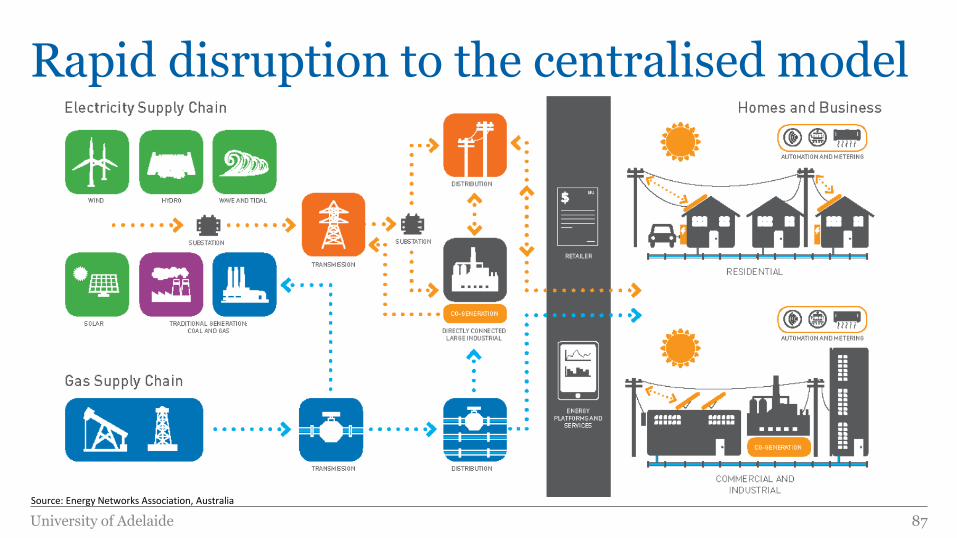
Rapid disruption to the centralised model
University of Adelaide 87
Source: Energy Networks Association, Australia
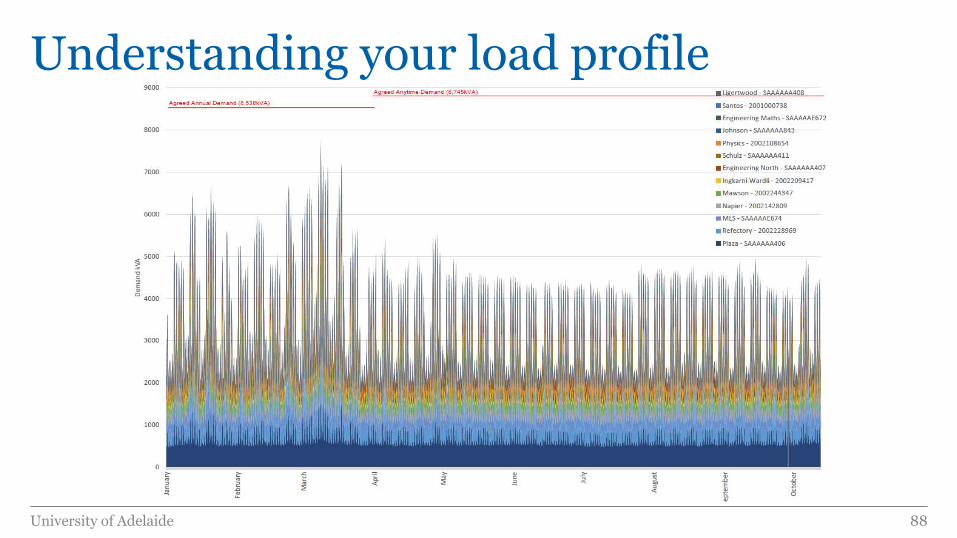
Understanding your load profile
University of Adelaide 88
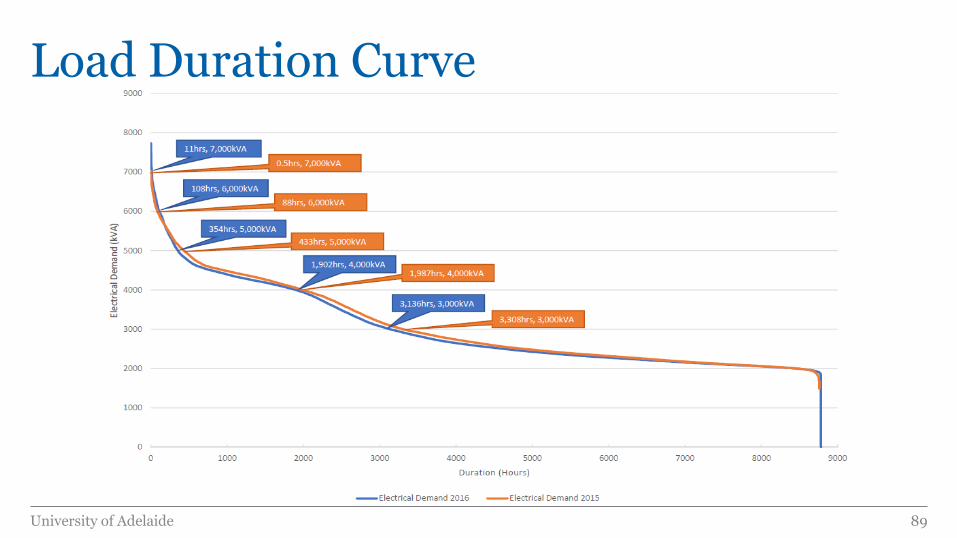
Load Duration Curve
University of Adelaide 89
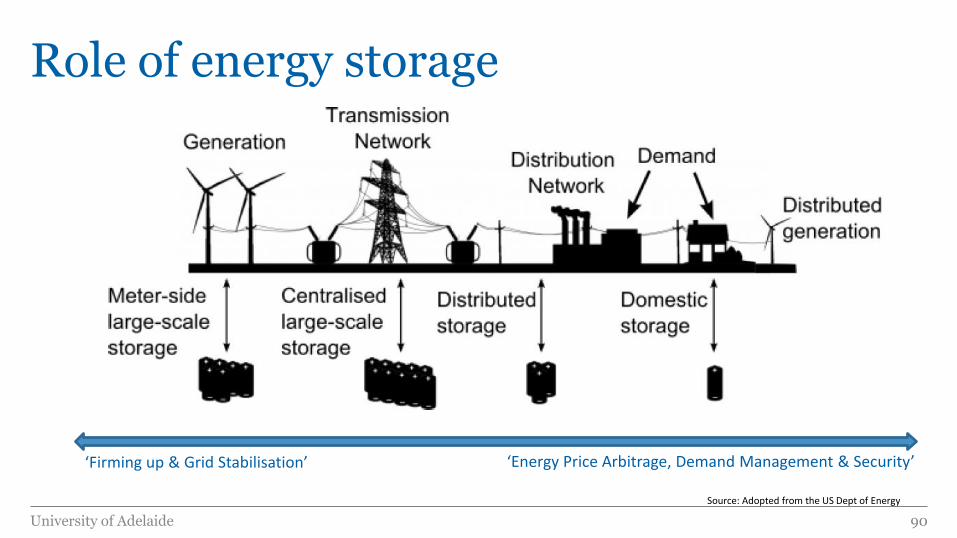
Role of energy storage
University of Adelaide 90
Source: Adopted from the US Dept of Energy
‘Firming up & Grid Stabilisation’ ‘Energy Price Arbitrage, Demand Management & Security’
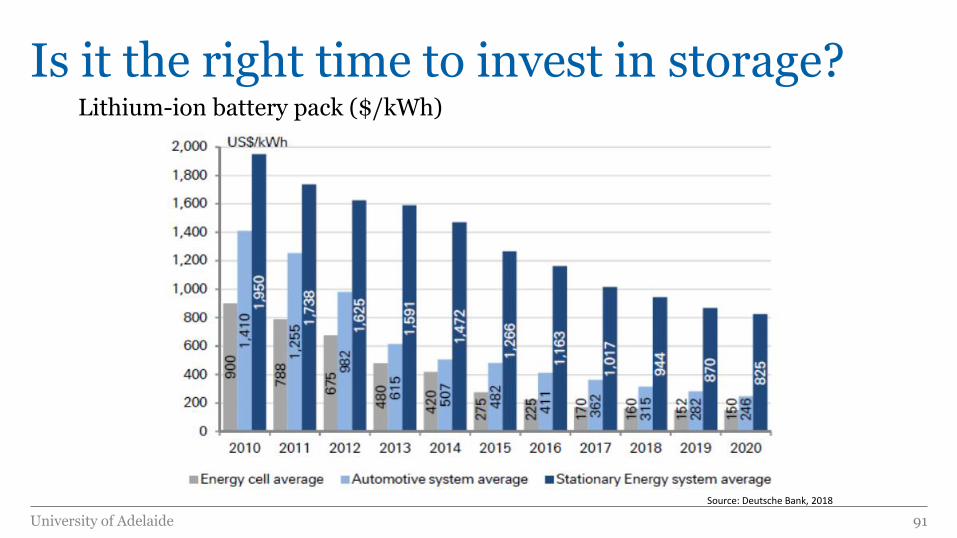
Is it the right time to invest in storage?Lithium-ion battery pack ($/kWh)
University of Adelaide 91
Source: Deutsche Bank, 2018
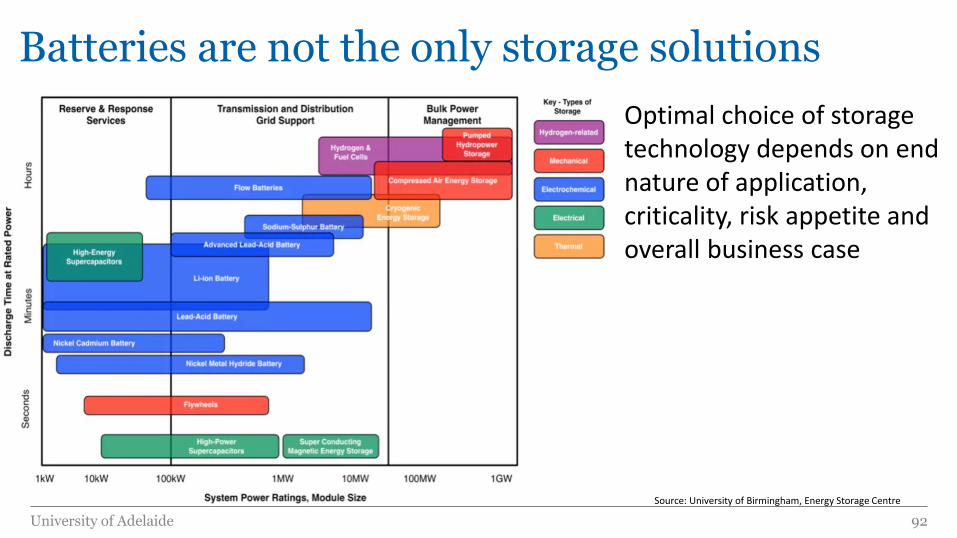
Batteries are not the only storage solutions
University of Adelaide 92
Source: University of Birmingham, Energy Storage Centre
Optimal choice of storage technology depends on end nature of application, criticality, risk appetite and overall business case
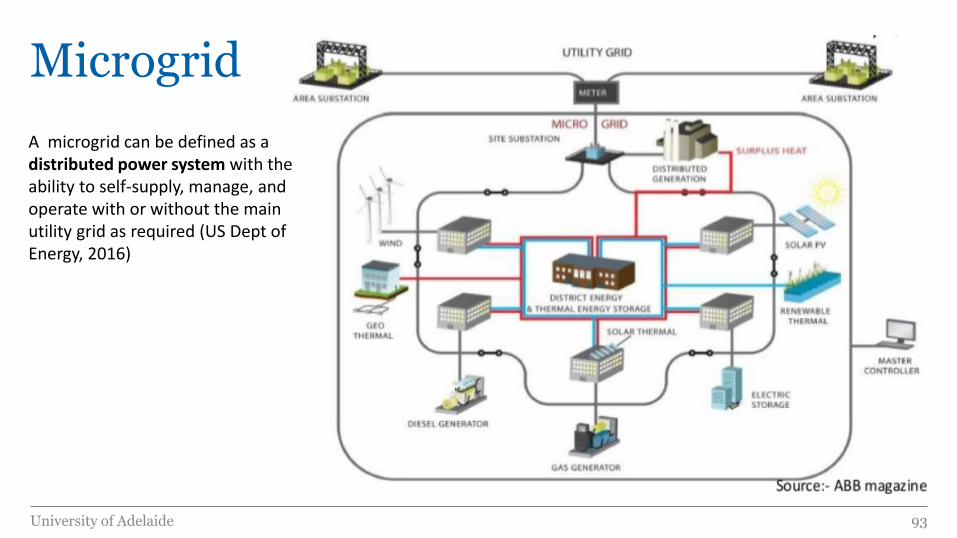
Microgrid
University of Adelaide 93
A microgrid can be defined as a distributed power system with the ability to self-supply, manage, and operate with or without the main utility grid as required (US Dept of Energy, 2016)
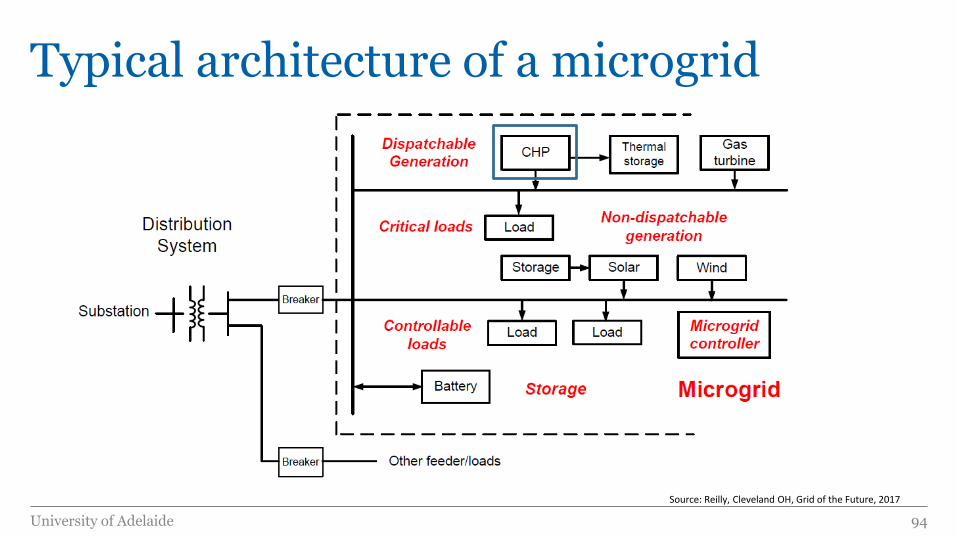
Typical architecture of a microgrid
University of Adelaide 94
Source: Reilly, Cleveland OH, Grid of the Future, 2017
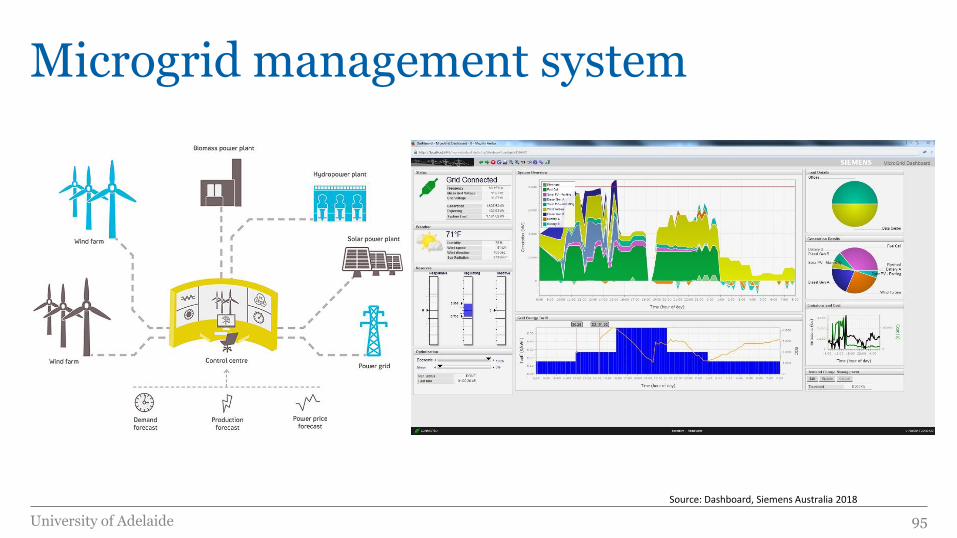
Microgrid management system
University of Adelaide 95
Source: Dashboard, Siemens Australia 2018
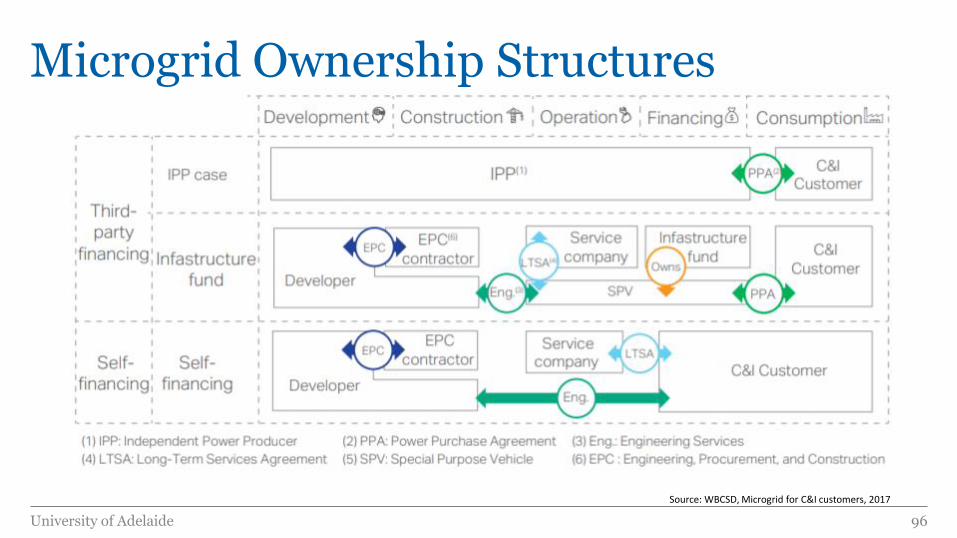
Microgrid Ownership Structures
University of Adelaide 96
Source: WBCSD, Microgrid for C&I customers, 2017
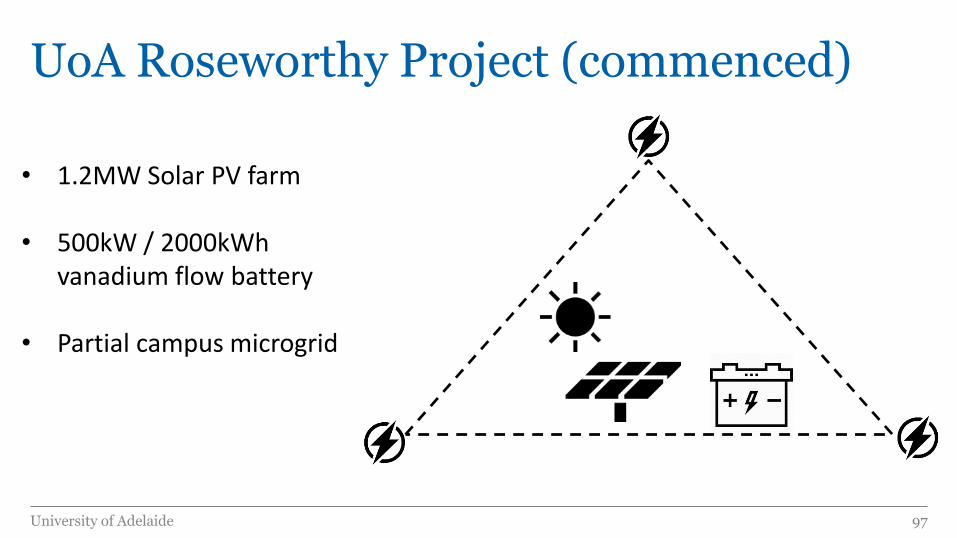
UoA Roseworthy Project (commenced)
University of Adelaide 97
• 1.2MW Solar PV farm
• 500kW / 2000kWh vanadium flow battery
• Partial campus microgrid
Benefits
- Demand Management (and hence lower network costs)
- Reduced electricity cost (load shift during high price event)
- Island mode (increased resilience & faster recovery)
- Lower carbon footprint (depending on choice of DERs)
- Increased cybersecurity (for defence sector)
University of Adelaide 98
Early Adopters – Risk versus Reward
• Potential risk
– Higher upfront cost
– Technical issues and disruptions
– Microgrid standardisation still under works
• Potential rewards
– Possible grants from various government agencies
– Potential cost subsidisation from Tier 1 suppliers to demonstrate proof-of-concept as well as gain market leadership
– Easier network connections due to interest and will from grid operators to learn from pilot projects
– Improved energy security and price fluctuations
University of Adelaide 99

THANK YOU
University of Adelaide 100
Vikram Kenjle
Energy Manager - The University of Adelaide
Email: [email protected]
Tel: (08) 8313 5556


Thank You for AttendingPlease ensure you have filled in the evaluation form and
leave face down on the table.