energy efficiency indicator -...
TRANSCRIPT
2010 North America Results
Findings Summary
Energy Efficiency Indicator
April 19, 2010

Agenda
� What is the Energy Efficiency Indicator?
� Who did we survey?
� What are their priorities and concerns?� What are their priorities and concerns?
� What are their investment plans and financial criteria for
making energy efficiency investments?
� What practices and technologies are most common?
2 Energy Efficiency Indicator – North America 2010
Copyright 2010 Johnson Controls, Inc.

What is the Energy Efficiency Indicator?
� A global survey of decision makers responsible for commercial
buildings and their energy use
� Examines trends in energy efficiency priorities and practices
� Founded by Johnson Controls and the International Facility
Management Association (IFMA) in 2007
� 4th annual survey completed for North America in March 2010
� Additional surveys underway in China, France, Germany, India,
Poland, Spain, and the United Kingdom, with results to be
released at events throughout the summer of 2010
3 Energy Efficiency Indicator – North America 2010
Copyright 2010 Johnson Controls, Inc.

RESPONDENT PROFILEEnergy Efficiency Indicator
2010 North America Results
4 Energy Efficiency Indicator – North America 2010
Copyright 2010 Johnson Controls, Inc.

Who we surveyed: 2 qualifying criteria
1. Must have capital- or operations budget
responsibility for their organization’s
facilities.
2. Job responsibilities must include reviewing
or monitoring energy usage,
and/or
proposing or approving initiatives to make
organization’s facilities more efficient.
Energy Efficiency Indicator – North America 2010
Copyright 2010 Johnson Controls, Inc.
5

Who we surveyed
By Role By Region
By Industry Sector
C-level Executives
30%Facility
Owner/ Proprietors
11%
14351435 total respondents in North America
6
9%8%
16%
4%
8%4% 14%
13%
5%
19%
VPs and GMs32%
Facility Managers
27%Healthcare
20%
Consulting/Legal9%
Manufacturing7%
Finance7%
Government6%
Retail5%
Service5%
IT/Telcom4%
Media/ entertainment
4%
Other33%

Who we surveyed
14351435 total respondents in North America
11%
21%
8%
19%
10%
25%
30%
28%
500,000 to 999,999 sf
100,000 to 499,999 sf
50,000 to 99,999 sf
Less than 50,000 sf
Owner/ Proprietors
Facility Managers
VPs and GMs
C-level Executives
RolesRoles
Area ofResponsibility
Area ofResponsibility
Energy Efficiency Indicator – North America 2010
Copyright 2010 Johnson Controls, Inc.
7
33%
4%
4%
5%
5%
6%
6%
7%
9%
20%
9%
0 100 200 300 400 500
Other
Media/ entertainment
IT/Telcom
Service
Retail
Government
Finance
Manufacturing
Consulting/Legal
Healthcare
More than 1 million sf
Number of Respondents
Industry Sector
Industry Sector
PRIORITIES AND CONCERNSEnergy Efficiency Indicator
2010 North America Results
8 Energy Efficiency Indicator – North America 2010
Copyright 2010 Johnson Controls, Inc.

Energy efficiency remains a strong business priority
65%... 65%... are paying more attention to energy
efficiency than last year
84%... 84%... Say energy efficiency is a priority for
new construction and retrofit projects
9 Energy Efficiency Indicator – North America 2010
Copyright 2010 Johnson Controls, Inc.

Energy management more important to larger
organizations and varies by sector
44%43%
40%
38%
45%
45%34% 29%
39% 36%33%
47%
36%
40%
60%
80%
100%Not at all important
Not very important
Somewhat important
How important is energy management to your company/organization?
10
15%9% 10%
19% 23%15% 17% 22%
8%17%
37%
27%
41%
44%43%
40% 39%40%
32%
42%
0%
20%
40%Very important
Extremely important
Energy Efficiency Indicator – North America 2010
Copyright 2010 Johnson Controls, Inc.

Importance of efficiency has decreased since 2009, but
remains quite high in light of the economic climate
77%
88%93%
84%
57% 58%60%
70%
80%
90%
100%
11
51%
57% 58%
52%
40%
50%
60%
2007 2008 2009 2010
Consider energy efficiency a priority in current/planned construction or retrofit projects
Energy management is extremely or very important to our organization
Energy Efficiency Indicator – North America 2010
Copyright 2010 Johnson Controls, Inc.

Reducing energy costs remains the key driver
Public imaged is also notably high
0% 20% 40% 60% 80% 100%
Energy cost savings
Enhanced public image
Government/utility incentives
Greenhouse gas reduction
How significant an influence are the following in your organization's energy efficiency decisions?
12
40%
Attracting, retaining customers
Anticipated regulation
Existing legislation
Attracting, retaining employees
Investor reporting demands
Attracting tenants
Extremely significant Very significant Somewhat significant
Not very significant Not at all significant Not Applicable
Energy Efficiency Indicator – North America 2010
Copyright 2010 Johnson Controls, Inc.

Incentives drop in importance while carbon emission
concerns become stronger
37%36%
14%12%
16%
8% 5%
9%
3% 4%12%
60%
80%
100%Don't know
Not at all significant
Not very significant
How influential are government/utility incentives in your organization's
energy efficiency decisions?
21%23%
17%11%
5% 4%
60%
80%
100%Don't know
Not at all significant
Not very significant
How significant are greenhouse gas emission reductions in your organization's energy
efficiency decisions?
13
12% 13% 9%
26%30%
22%
37%
31%
0%
20%
40%
2008 2009 2010
significant
Somewhat significant
Very significant
Extremely significant 7% 5%
15% 20%
35%37%
0%
20%
40%
2009 2010
significant
Somewhat significant
Very significant
Extremely significant
Energy Efficiency Indicator – North America 2010
Copyright 2010 Johnson Controls, Inc.

Real estate leaders believe energy prices
will climb significantly this year
Average expected change in energy prices
over next 12 months = 7% increase
80%
100%
Cum
ula
tive D
istr
ibution
Do you believe the combined price of the energy that your facilities use will. . .
64% believe prices will increase
14
0%
20%
40%
60%
Cum
ula
tive D
istr
ibution
64% believe prices will increase over the next 12 months
Energy Efficiency Indicator – North America 2010
Copyright 2010 Johnson Controls, Inc.

Climate legislation is viewed as both a risk
and a business growth opportunity
An equal risk and opportunity
A slightly greater opportunity
Primarily an opportunity
46%
9%
7%
Is climate change legislation a risk or a growth opportunity for your organization?
15
0%20%
40%60%
Primarily a risk
A slightly greater risk
An equal risk and opportunity
19%
19%
46%
Energy Efficiency Indicator – North America 2010
Copyright 2010 Johnson Controls, Inc.

Despite lowered legislation expectations,
more organizations setting carbon goals
34%
60%
80%
100%
Somewhat
How likely is significant legislation mandating energy efficiency and/or
carbon reduction within the next 2 years?
76%
85%
75%
14%
13%
14%
15%
16%
Does your company/organization have a publicly stated carbon-reduction goal?
16
11% 16%9%
28%
35%
27%
37% 38%
0%
20%
40%
60%
2008 2009 2010
Somewhat likely
Very likely
Extremely likely
11%
12% 12%
8%
9%
10%
11%
12%
13%
2007 2008 2009 2010
Energy Efficiency Indicator – North America 2010
Copyright 2010 Johnson Controls, Inc.

Many lack carbon strategies; those with strategies
choosing building efficiency first
2%
3%
4%
4%
5%
38%
Alternative transportation fuels
Energy efficiency in vehicle fleet
Renewable power purchases
Onsite renewable energy
Telecommuting, virtual meetings
Energy efficiency in buildings
What is your organization's top strategy to reduce its carbon emissions?
1%
1%
1%
2%
0% 5% 10% 15% 20% 25% 30% 35% 40% 45%
Supply chain carbon reductions
Carbon offset purchases
Real estate portfolio consolidation
Alternative transportation fuels
40% either don’t know or have not
yet prioritized among strategies
Energy Efficiency Indicator – North America 2010
Copyright 2010 Johnson Controls, Inc.
17

73% select building efficiency as one of
their top six strategies
10%
20%
12%
15%
23%
35%
2%
3%
4%
4%
5%
38%
Alternative transportation fuels
Energy efficiency in vehicle fleet
Renewable power purchases
Onsite renewable energy
Telecommuting, virtual meetings
Energy efficiency in buildings
Top Strategy
Other Strategies (up to 5)
What are your organization's top strategies for reducing its carbon emissions?
23%
16%
8%
3%
6%
10%
26%
15%
1%
1%
1%
2%
0% 10% 20% 30% 40% 50%
No prioritization amongst strategies
Don't know
Supply chain carbon reductions
Carbon offset purchases
Real estate portfolio consolidation
Alternative transportation fuels
Energy Efficiency Indicator – North America 2010
Copyright 2010 Johnson Controls, Inc.
18

INVESTMENT PLANS & INVESTMENT PLANS &
FINANCIAL CRITERIAEnergy Efficiency Indicator
2010 North America Results
19 Energy Efficiency Indicator – North America 2010
Copyright 2010 Johnson Controls, Inc.
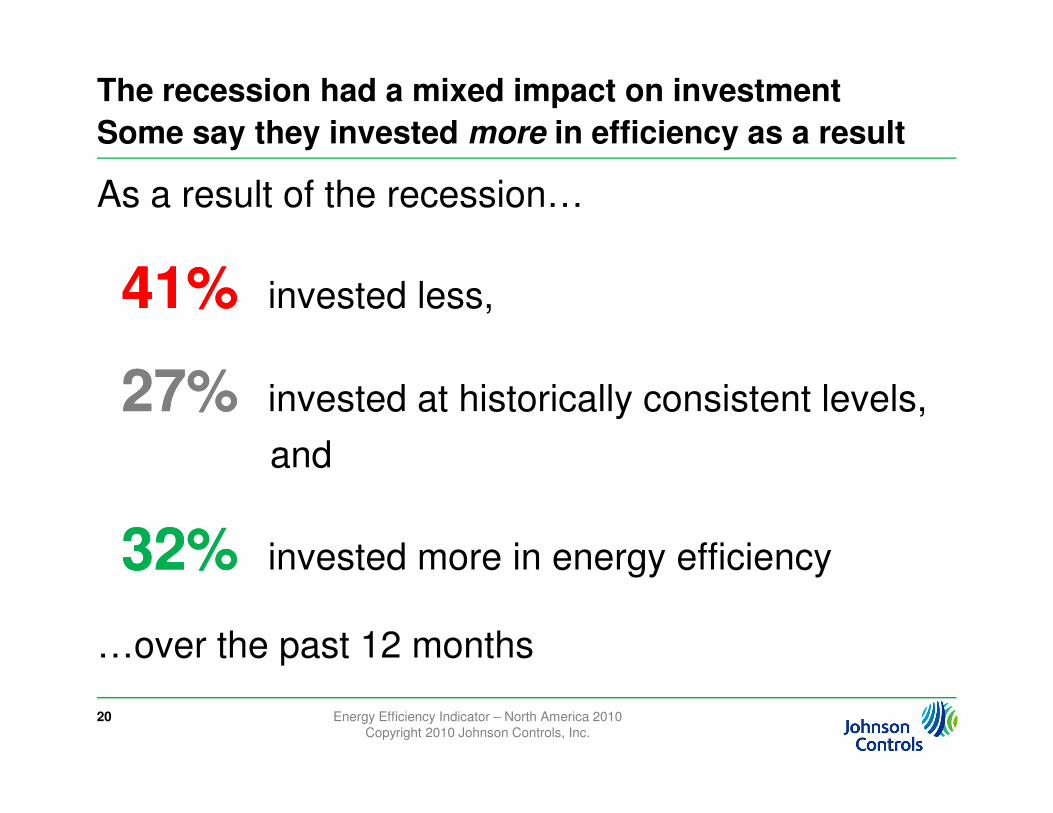
The recession had a mixed impact on investment
Some say they invested more in efficiency as a result
As a result of the recession…
41% 41% invested less,
27% 27% invested at historically consistent levels,
20
27% 27% invested at historically consistent levels,
and
32% 32% invested more in energy efficiency
…over the past 12 months
Energy Efficiency Indicator – North America 2010
Copyright 2010 Johnson Controls, Inc.

Energy efficiency spending to rebound in 2010
64%
80%capital expenditures operating expenditures
Percentage planning to make energy efficiency investments over the next 12 months with…
21
57%56%
46%
52%
64%
61%
55%
60%
40%
60%
2007 2008 2009 2010
Energy Efficiency Indicator – North America 2010
Copyright 2010 Johnson Controls, Inc.

Construction and retrofit starts plans are also
increasing among those surveyed
22%22%
30%
20%
25%
30%
35%
40%new construction retrofits
Percentage currently undergoing or planning to undergo
over the next 12 months
22
16%
0%
5%
10%
15%
20%
2009 2010
Energy Efficiency Indicator – North America 2010
Copyright 2010 Johnson Controls, Inc.

Large and public organizations are most
likely to invest in efficiency; Retail sector lags
30%
47%
31%
25%
14%
27% 19%
23%
49%
21%
18%28%
19% 15%7%
14% 19%6%
26%
11%
60%
80%
100%
Don't Know
No
Do you expect your organization to make energy efficiency improvements financed with capital expenditures over the next 12 months
23 Energy Efficiency Indicator – North America 2010
Copyright 2010 Johnson Controls, Inc.
52%
25%
50%60%
79%
59% 62%71%
26%
67%
47%
0%
20%
40%
Yes

Capital budgets and incentives are primary
funding source; Use of financing is rare
52%
20%
14%
9%
0% 20% 40% 60%
Facilities capital budget
Grants or tax credits
Energy savings performance contract
Energy or climate set-asides in capital budget
Which options will your organization consider to pay for energy efficiency and renewable energy projects over the next 12 months? (Select all that apply)?
N = 1427
24 Energy Efficiency Indicator – North America 2010
Copyright 2010 Johnson Controls, Inc.
9%
8%
7%
5%
3%
3%
1%
1%
Energy or climate set-asides in capital budget
Power purchase agreement (PPA)
Traditional debt financing
Shared savings agreement
Utility on-bill financing (OBF)
Capital or municipal lease
PACE/tax lien financing
Energy efficient mortgage

Budget levels and expected impact remain consistent
7.3%
8.2%7.6% 7.8%
8%
10%
12%
capital budget
What percentage of your facilities-related budgets will be invested in
energy efficiency over next 12 months?
60%
80%
100%
Don't know
More than 10%
By how much do you expect energy improvements put in place over the
next 12 months to reduce your energy consumption?
25
5.2%6.2%
5.5% 5.5%
0%
2%
4%
6%
2007 2008 2009 2010
budget
operating budget
Energy Efficiency Indicator – North America 2010
Copyright 2010 Johnson Controls, Inc.
0%
20%
40%
60%
2007 2008 2009 2010
5% to 9%
1% to 4%
Less than 1%

Investment criteria also holds steady;
44% require less than 3 year payback
83% 83%87%
60%
80%
100%
Less than 10 years
What is the longest payback period you would allow for a significant energy
efficiency investment?
14%
27%
60%
80%
100%
How does that compare to what would have been allowed 5 years ago?
Don’t Know
Allowed longer payback 5 years ago
26
43% 44% 44%
5% 6% 4%
0%
20%
40%
60%
2008 2009 2010
Less than 3 years
Less than 1 year
Energy Efficiency Indicator – North America 2010
Copyright 2010 Johnson Controls, Inc.
15%
44%
14%
0%
20%
40%
60%
2008 2009 2010
Allowed longer payback 5 years ago
Allowable payback hasn’t changed
Will allow longer payback today

Limited internal capital is the greatest
barrier to energy efficiency
3.23.2Average maximum
6%
16%
21%
38%
Technical expertise
Uncertainty of savings/ROI
Insufficient payback/ROI
Lack of capital budget
What is the top barrier to capturing energy savings for your organization?
27
Average maximum payback period for energy efficiency
44% require a 3 year payback or less
3%
3%
4%
5%
5%
0% 10% 20% 30% 40%
Other (specify)
Inability to finance (credit rating, collateral, balance sheet)
Dedicated attention, ownership
Buy-in from senior leaders
Landlord/tenant split incentives
Energy Efficiency Indicator – North America 2010
Copyright 2010 Johnson Controls, Inc.

PRACTICES & TECHNOLOGIESEnergy Efficiency Indicator
2010 North America Results
28 Energy Efficiency Indicator – North America 2010
Copyright 2010 Johnson Controls, Inc.

Most popular efficiency measures are
lighting retrofits and operational changes
72%
63%
61%
56%
40%
36%
0% 10% 20% 30% 40% 50% 60% 70% 80%
Switched to energy efficient lamps, ballasts, or fixtures
Educated facilities operations staff
Educated building occupants
Adjusted controls to reduce time that heating/AC runs
Installed occupancy or daylight sensors
Replaced inefficient equipment before end of useful life
Upgraded existing building management system
Which measures has your company adopted to reduce energy costs?
33%
30%
29%
28%
27%
25%
25%
19%
19%
Upgraded existing building management system
Increased frequency of monitoring consumption
Negotiated energy contracts with suppliers
Attended or sent staff to energy management seminars
Installed or adjusted lighting timers
Increased preventive maintenance schedules
Installed variable speed/variable frequency drives …
Installed energy-saving glass in windows
Participated in demand response programs
Note: The 15 most popular measures of 33 included in the survey are listed above
Energy Efficiency Indicator – North America 2010
Copyright 2010 Johnson Controls, Inc.
29

Green buildings are accumulating;
Renewable energy on the radar
33% 33% seeking green building certification for new
construction projects
12% 12% have at least one green certified building, up
from 8%8% in 2009from 8%8% in 2009
31% 31% considering solar PV, 20% 20% considering
solar thermal, 14% 14% considering geothermal in
new construction and retrofit projects
30 Energy Efficiency Indicator – North America 2010
Copyright 2010 Johnson Controls, Inc.

Green building goals staying constant
45%
12% 14% 13%18% 16% 20%
5%3% 2%
3% 3% 2%
60%
80%
100%
don't know
no goal for green buildings
What are your goals with respect to green buildings?
New Construction Retrofit Projects
31
34% 38%33%
20% 17% 18%
48% 45% 52%
59% 64% 60%
0%
20%
40%
60%
2008 2009 2010 2008 2009 2010
green elements, but not certified
certified to a recognized green standard
Energy Efficiency Indicator – North America 2010
Copyright 2010 Johnson Controls, Inc.

Consideration levels for renewable
energy technologies fall in 2010
31%30%
35%
40%
45%
50%
2008 2009 2010
Which renewable energy technologies is your organization considering or utilizing in construction or retrofit projects?
32 Energy Efficiency Indicator – North America 2010
Copyright 2010 Johnson Controls, Inc.
20%
14%13%
7%5%
0%
5%
10%
15%
20%
25%
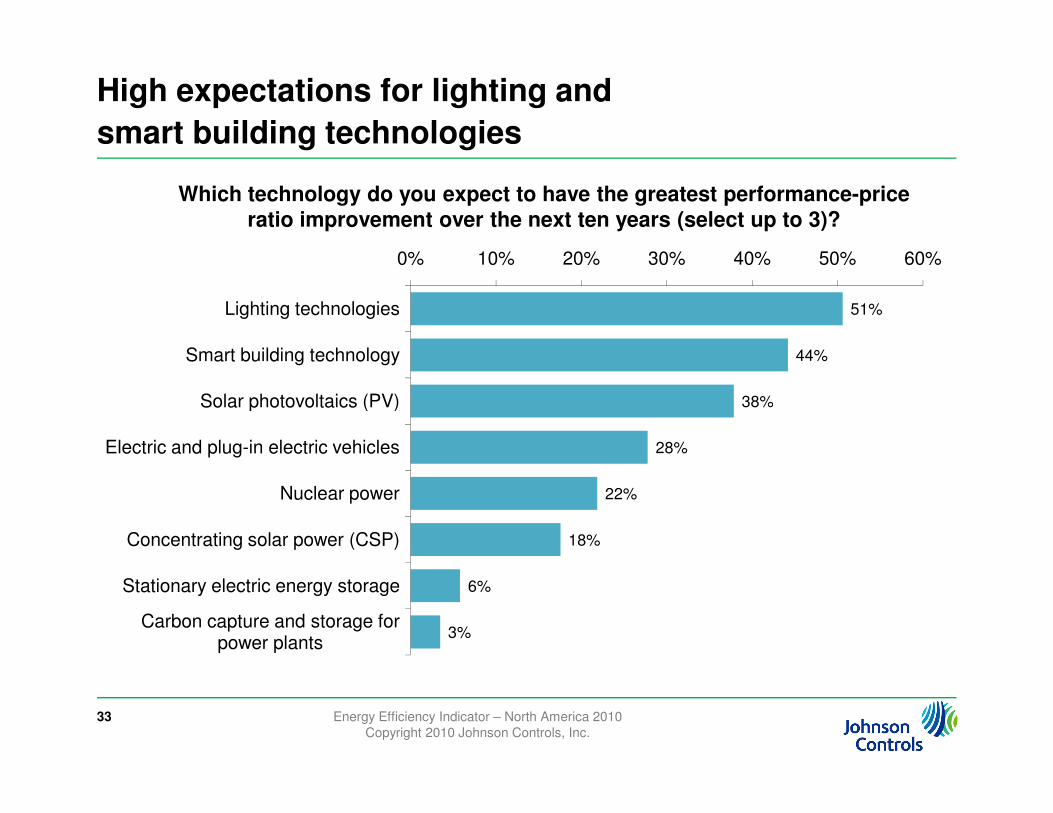
High expectations for lighting and
smart building technologies
51%
44%
38%
0% 10% 20% 30% 40% 50% 60%
Lighting technologies
Smart building technology
Solar photovoltaics (PV)
Which technology do you expect to have the greatest performance-price ratio improvement over the next ten years (select up to 3)?
33 Energy Efficiency Indicator – North America 2010
Copyright 2010 Johnson Controls, Inc.
38%
28%
22%
18%
6%
3%
Solar photovoltaics (PV)
Electric and plug-in electric vehicles
Nuclear power
Concentrating solar power (CSP)
Stationary electric energy storage
Carbon capture and storage for power plants

Observations & Conclusions
� Efficiency investment remains strongEnergy cost concerns, public image, and climate leadership
goals are driving investment. Larger organizations are more
likely to make efficiency investments.
� Buildings efficiency is top carbon strategy � Buildings efficiency is top carbon strategy Despite lowered legislation expectations,
more organizations setting voluntary GHG goals
� Capital availability remains a strong barrierOrganizations rely primarily on internal capital budgets for
efficiency & renewable energy investments rather than seeking
external financing
34 Energy Efficiency Indicator – North America 2010
Copyright 2010 Johnson Controls, Inc.

For more complete EEI results
see online press kit
Go to johnsoncontrols.com
� media
� press materials
� press kits
� Building Efficiency
� 2010 Energy Efficiency Indicator
35
http://johnsoncontrols.mediaroom.com/index.php?s=112
Includes
link to
webcast
archive
Energy Efficiency Indicator – North America 2010
Copyright 2010 Johnson Controls, Inc.

Energy Efficiency Indicator – North America 2010
Energy Efficiency Indicator – North America 2010
Copyright 2010 Johnson Controls, Inc.
36