energy efficiency audit report budafok, hungary
TRANSCRIPT

ENERGY EFFICIENCY AUDIT REPORT BUSZESZ YEAST AND ALCOHOZ FACTORY
BUDAFOK, HUNGARY
APRIL 1992
?REPARED BY: RCG/HAGLER, BAILLY, INC. ~rlington, VA
and
EGI CONTRACTING/ENGINEERING Budapest, Hungary
U.S. EMERGENCY ENERGY PROGRAM FOR EASTERN AND CENTRAL EUROPE
U.S. AGENCY F8R INTXRNATIONAL DEVELOPMENT BUREAU FOR EUROPE WASHINGTON, B.C. 20253

ENERGY EFFICIENCY AUDIT REPORT BUBZESZ YEAST AND ALCOHOL FACTORY
BUDAFOK, HUNaARY
APRIL 1992
PREPARED BY: RCG/HAGLER, BAILLY, INC. 1530 Wilson Boulevard Suite 900 Arlington, VA 22209 (703) 351-0300
and
EGI CONTRACTING/ENGINEEkING H-1027 Budapest, Bern rkp. 33-34 Hungary (361) 201-6417
U.S. EMERGENCY ENERGY PROGRAM FOR EASTERN AND CENTRAL EUROPE
U.S. AGENCY FOR INTERNATIONAL DEVELOPMENT BUREAU FOR EUROPE OFFICE OF DEVELOPMENT RESOURCES ENERGY & 1NF.RASTRUCTURE DIVISION WASHINGTON, D.C. 20253
USAID Contract EUR-0015-C-00-1007-00
DISCLAIMER
The contents of this report are offered as guidance. RCG/Hagler, Bailly, Inc., Enpro Engineers Bureau Ltd. and the United States Agency for International Development, and all technical sources referenced in this report do not (a) make any warranty or representation, express or implied, with respect to the accuracy, completeness, or usefulness of the information, apparatus, method, or process disclosed in this report may not infringe upon privately owned rights; (b) assume any liabilities with respect to the use of, or for damages resulting from, any information, apparatus, method or process disclosed in this report. This report does not reflect official views or policies of the above named institutions. Mention of trade names or commercial products does not constitute endorsement or recommendation for exclusive use.
QUALIa ASSURANCE STATEMENTS
The contents of this report include recommendations based on data provided by the client plant, measurements made on site, calculations, and engineering judgement. The conclusions reached were based on a limited engagement of only about one week's duration in the plant, and not an exhaustive engineering analysis. RCG/Hagler, Bailly, Znc. certifies that this report conforms to the 'level of best commercial practice for inf~ustrial energy audits of similar level of effort, as conducted in the United States. This report has been prepared under the guidance of a registerod Professional Engineer, licensed to practice in the United States.

BP82B8Sf YEAST AND ALCOHOL P.ACTORY - EWRGY AUDIT TABLE OF CONTENT8
I EXECUTIVE SUMMARY
11. INTRODUCTION TO THE PLANT
2 . 1 Description of the Plant and Activities 2.2 Plant Management and Staff 2.3 Energy Usage and ~istorical Data Analysis
111. RECOMMENDATIONS FOR ENERGY EFFICIENCY IMPROVEEiENT
3 . 1 Energy Management Improvement 3 . 2 Low cost and short term energy efficiency improvement
actions 3 . 3 Investment intensive or long tern energy efficiency
improvement actions
ZV. PRESENTATION OF PROJUCTB FORM8
Action A.1: Improve the Energy Management information and control system
Action A.2: Steam management task force to reduce steam demand
Action A.3: Electricity management task force
Action A.4: Qptimize boilers operation
Action A.5: Operate the most efficient feed water pump in priority.
Action A.6: Transfer as much as possible steam use fron night hours to day and peak hours.
Action A. 7: 0ptimii:;e electric tariff
Action 8.1: Xnstall new molasses circulating pumps
Action 8 . 2 : Revise the buildin3 heating system
Action 8 . 3 : Boiler efficiency and control system improvement
Action 8 . 4 : Install desuperheaters on the ma,n letdown valves (priority)
Action 8.5: Higher efficiency feedwater pump procurement
RCG/nrgLrr, Bai 1 Ly, Inc.

BU8ZESZ YCA8T AND ALCOHOL FACTORY - ENERGY AUDIT Action B.6: Move the intake of boilers air fan to the top of
the boilerhouse and install a venturi to measure the air flow
Action B.7: Install inclinators at the inlet of induced draft fans in the boilergouse
Action C.l: Short- and Mid-tern Strategy plan for the development of the steam and power plant.
Action C . 2 : Improvement of the instrumentation and control system of the boilers
Action C.3: Energy conservation in the alcohol distillation plant.
Action C.4: Optimize operation of the yeast drier
APPENDIX
APPENDIX 1 LIST OF DATA PROVIDED BY THE PLANT APPENDIX 2 ENERGY MODEL OF THE STEAM AND POWER PLANT APPENDIX 3 REGRESSION ANALYSIS OF ENERGY CONSUMPTION VERSUS
PRODUCTION

BUSZES2 YEAST AND ALCOHOL FACTORY - ENERGY AUDIT 1
ACKNOWLEDGEMENT
Mr. Mr. Mr. Mrs Mr. Mr. Mr. Mr.
FOLLATH SZABO NIKLECZP PAYER HOLLOSI KIRINOVICS BARTA ROSZA
General Director Technical Director Head of Energy Department Chief Accountant Boilerhouse manager Boilerhouse manager Electr ic manager Head of instrumentation & control dept

BBSZESZ YEAST AND ALCOHOL FACTORY - ENERGY AUDIT 2
I. EXECUTIVE 8UHMARY
This report is a result of a preliminary energy audit carried out by a team of engineers from RCG/Hagler,Bailly and EGI - Institute for Energetics between March 5 and March 12, 1991 at the Budafok Yeast and Alcohol Factory (BVSZESZ).
In addition to the team, RCG/Hagler,Bailly provided a complete set of portable instruments to conduct on site measurements. EGI prov: ied all facilities for logistic s . -;port, including meeting arrangement and translation services.
Given the scope of the assignment and resources available, it was decided to focus the audit on sectors and subject considered as a priority by the plant management. This means that extensive and thorough efforts were developed by the audit team to reach visible and short-term implementable results relating to the goals of the audit. All activities and analyses of the preliminary energy audit were covered by the audit team. In addition, the approach and methodology were adapted to provide continuous training to counterparts of the audit team in the plant.
The areas of focus of the energy audit were (1) the energy efficiency of the power plant and (2) energy management improvement.
In 1990, BUSZESZ purchased an amount of energy equivalent to 23,700 tons of oil equivalect, expressed in primary energy. 80% of that primary energy demand consists of gas, the remaining 203, consists of electricity.
If that energy was to be imported to Hungary at the international market price ($20 per barrel of oil), the cost would be about 3.3 million US$ in hard currency. Using the current price of energy (March 1991) , the actual energy bill paid by BUSZESZ is worth 290 million Forints.
The potential for energy savings is at least 5% of the gas energy used in the steam and power plant, and 15% to 20% of the steam energy demand in the process area and associated buildings. Electric energy savings of 20% of the electric eriergy used in the steam and powerplant were achieved during the audit by modifying the operating strategy of the boiler feedwater pumps. The potential electric energy cost savings in the process area and associated buildings is at least 10%.
The power plant is over-sized in comparison to the in-plant heat demand. The only justification for this is the selling of energy under the form of steam to outside clients. However the outlook of this market looks gloom. The major clients of BUSZESZ have
RCG/Hrgler, B8i l ly, Inc.

BU82E89 YEAST AND ALCOHOL EtACT(OR!I - EWERGY AUDIT 3
decided to invest in their own boilerhouse. BUSZESZ management believes that two main reasons may have prevailed: first the I1hFghl1 price of heat, second the 'nlow" quality of service. In any case, these reasons provide to BUSZESZ guidelines for a reconquest of this market: ('1) translast@ into the tariff of heat the benefit of cogeneration which should bring the price of heat to a lower level than the cost of raising steam in a non- cogenerative plant (2) improve the quality of service: high reliability of supply, stable condition of steam in pressure and temper-ture, and limited heat loss through the supply lines.
List of candidate equipment which could be procured by USAID as part of the Emergency Efficiency Program
Action Equipment Cost in US$
Priority list
A.l steam meters 35,000 A.4 flue gas analyzer 3,500 A. 1 computer equipment 7,000
RCG/Hagler, Oai 1 ly, lnc.

BU82EBZ YEABT AND ALCOHOL FACTORY - ENERGY AUDIT 4
11. INTRODUCTION TO THE PIANT
2.1 Description of the Plant and activities
Buszesz is an alcohol and yeast production plant using molasses as raw material. BUSZESZ also dehydrates alcohol received from various sources. Buszesz transforms sugar in molasses into alcohol through a fermentation a.nd distillation process. The production of yeast has developed as an important activity of the plant. The plant employs about 250 workers.
Buszesz is part of a trust consisting of several plants. Other plants produce soft Arinks, wine, vodka, and other beverages. The plant located in Budafok is the largest energy user.
2.1.1 Process areas
o Production of yeast
Yeast can be produced under the form of pressed or dried yeast. Pressed yeast is perishable and has a life duration of a few days. Dry yeast production is more steam energlp intensive, but the product has a long life duration suitable for storage and export.
Yeast production consists of growing yeast under controlled temperature. A low level of alcohol in the fermentation tank maintained by temperature control and residence time is critical in the production. The yeast production is a batch process (7 tanks)
o Farmontation
Vessel sterilization is prepared from a growth culture and inoculation with yeast. The alcohol production facility is a continuous operation. The holding time is about 6 days. The output goes to distillation.
o Alcohol Production
There are two alcohol production systems in operation, one makes 969; alcohol using its own internal yeast fermentation process and the second one produces 100% alcchol by distilling purchased 96% alcohol. Specific energy consumption for each process (see Process Plant Energy Balance table) is within generally accepted values for these distillation systems although plant operators claim that specific, and therefore total energy consumption, could be reduced if more reliable electricity from the power station were available. Power loss during distillation requires that the entire operation be shut down and then restarted when power again becomes available. For example, a goal of 0.69 GJ/hl
RCG/HrgLer, l a i L Ly, tnc.

BUSZESZ YEAST AND ALCOHOL FACTORY - ENERGY AUDIT 5
(hl = hectoliter, 100 liters) of 100% alcohol and 0.75 GJ/hl of 96% alcohol have been attained when power outages do not occur.
With more reliable power plant operation an estimated 6% reduction of alcohol plant annual steam use (to 179,000 GJ) would be possible.
96% Alcohol Production
This system produces a hioh quality alcohol-water mixture from continuous molasses fermentation although the distillation process appears unique. An obvious design goal for the installation, built by Krupp in 1987, was heat integration to conserve as much thermal energy as possible. It appears to be well-operated. For exampls, cooling water when used for condensation is properly returned as boiler feed or is sent to the paper mill and then returned. There appears little opportunity to change this process for the purpose of conserving energy.
The alcohol distillation process is potentially the largest steam user of the plant. This plant was completely rebuilt in 1987 through a West German contractor (Kroght) . The new installation has a consumption of 220 kg steam per hectoliter (100 liters) of alcc,hol versus 500-550 kg/hl for the previous installation.
100% Alcohol
This system is a commcn, two-column, distillation process using a benzene-toluene mixture to separate alcohol and water from a purchased 96% alcohol mixture. Because the heed stock is almost all alcohol, two parallel dehydration colv.mns are required. The output of these columns is 100% alcohol. A second column removes the water fronr the feed. Both columns are heated by steam at 1.8 bar.
The water producing column is heated by direct steam injection which is efficient for heat transfer purposes but the column bottoms, consisting of injected steam and the small amount of water removed from the feed are sewered. The reason offered for this practice is that the lOOC bottom water is contaminated and cannot be reused anywhere.
The two dehydration columns are each fed purchased feed stock directly from storage at about 15 C with no preheating. These columns are each heated indirectly with about 100 kg/h of 1.8 bar steam. Condensate from these heat exchangers is returned to the boiler. The 100% alcohol product from these columns at about 67 C is collected wich no heat recovery.

BU8ZE8Z YEAST AND ALCOHOL FACTORY - ENERGY AUDIT 6
It is recommended that two projects be undertaken in this process area to reducn steam consumption:
1. Use alcohol bottoms from the dehydration columns to preheat feed. Savinys of about 900 kg/h are possible.
2. Heat the water column with indirect steam return the condensate as boiler feed.
o Cattle feed base
Spillage of distillation is sold as a milk for cattle feed.
2 . 1 . 2 Ut i l i ty section
Buszesz is provided with a large steam and power station which consists of three fuel gas fired boilers (20 t/h, 20 t/h and 30 t/h) and one 3 MWturbogenerator. This installation is oversized given the in-plant energy demand, but was also designed to supply heat in the form of steam to nearby industrial facilities. The equipment in the boilerhouse is very old and is operating at a lower efficiency than the original design. Sooner or later the equipment will have to be refurbished or replaced. Because of the huge investment involved and the uncertainty of the future steam market, the plant management has so far only accepted to refurbish boiler No3. The work was performed in 1990. The Plant Management is now seeking for a strategy to refurbish or replace the other equipment, at minimum risk given the uncertainty of steam demand.
2 . 2 Plant Hanagemsnt and Btaff
The plant is manage? by a general manager. There are two main directorates under the general manager: the technical/production division and financial/administrative division.
The Technical/production division is divided into the following departments :
- Technical department - Yeast department - Alcohol department - Energy department
2 . 3 Enorgy usago and historia81 data analysis
According to plant management, energy at current price accounts for 20% of the production cost, which is fairly high according to U.S. or West European standards. This situation is enough to establish energy conservation as a priority in the! plant.
Historical data was provi,ded on total energy consumption for

BUBZE82 YEAST AND ALCOHOL FACTORY - ENERGY AUDIT 7
1990, and detailed daily data was provided far two typical sample months, October 1990 and January 1991. These data are provided in Appendix 1.
Total primary energy use of BUSZESZ was 23,700 tons of oil equivalent in 1990. This primary energy use has been computed by RCG/Hagler,Bailly using ti-le following conversion factors. These conversion factors represent the average efficiency of energy conversion equipment in Hungary. For example, the electricity conversion factor includes the efficiency of fuel f i r e d power p l a n t p l u s a u x i l i a r y , t r a n s p o r t a t i o n and d i s t r i b u t i o n losses.
Energy unit kg of oil equivalent
electricity kwh 0.426 natural gas GJ 23.92 steam/hot water GJ 28.15 compressed air 000Nm3 47.31
The following table shows the breakdown of primary energy use:
tons of percent of oil eauivalent total enerav
Total primary energy use 23,700 100 %
Fuel/steam Electricity
Findings are the followings:
o Fuel gas is the largest energy used in BUSZESZ with 80% of the primary energy use.
o The above primary energy use accounts for both activities of BUSZSESZ plant, i .e. yeast and alcohol production on one side and heat supply activity on the other. The following table gives a breakdown of heat use in Buszesz:
Total fi at/steam generated
Self consumption of powerplant in-plant energy use Sale of steam

BU88E8Z YEAST AND ALCOHOL FACTORY - ENERGY AUDIT 8
Based on the year 1990 energy consumption record and current energy price (March 1991), the energy bill including electricity, gas, steam, is evaluated at 290 million Forint which breaks into the following items:
million in % of FT/vear total cos,
Purchased energy cost 290 100 %
Denand charge (fixed cost) 4 5 15 % Energy charge (variable cost) 245 85 %
Sale of steam revenue
Demand charge Energy charge
Gross energy cost Net energy cost
111. RECOMMENDATIONS FOR ENERGY EFFICIENCY IMPROVEMENT
Recommendations developed by RCG/Hagler, Bailly for energy efficiency improvement are sorted for convenience into three categories of action:
o Energy management improvement actions are the first category and have been emphasized by Buszesz as a priority in a fast changing economic environment. Actions which fall in that category are coded by IgAw preceeding the list number. BUSZESZ should be able to implement these measures in the next six months, with assistance from the USAID Emergency Energy Program.
o Low cost and short term implementable actions constitute the second category and are emphasized as action to which USAID might be able to further contribute under its program. Actions in this category are indica.ted with a "B" preceeding a list number.
o High cost or long term actions constitute the third category and consist principally of technology improvement projects. Actions of this group are shown by a "CI1 followed by a list number.
3.1. Energy Management Improvament
3.1.1 Assessment of the existing Energy Management System
The system of management information and control in place at BUSZESZ is typical of most factories in Hungary. Production is based on plans, and management exercises control the process to see that the plan is carried out. These plans set performance targets, which are based on input and output quantities.

BUSZESZ YEAST AND ALCOHOL FACTORY - ENERGY AUDIT 9
A vast amount of data is collected by hand every day, in the form of logs and other records from many different steam, electric and other meters. The data are used to assemble daily reports. The main purpose of these daily reports is to develop monthly cumulative values, so that the monthly reports can be prepared more quickly. The daily reports are internal, in most cases only the monthly reports are submitted to management. The types of information included in the reports are basically raw data, such as total gas consumption, total steam generation, total electric consumption, total electric generation, total steam sales, etc. Ratios or performance indicators are generally not included ir the daily or monthly reports.
The monthly reports have been analyzed by the Chief of Accounts of BUSZESZ and others in the company, and ti1.ei.r analysis indicates that energy consumption is as much as 50% above expected values, based on performance norms for the process equipment.
The Energy Department of Buszesz is essentially in charge of supplying information and justification for energy expenses and usage in the plant. This department keeps record with good precision of the input/output energy and mass balance of the power plant. The energy output is delivered to two kinds of I1clientsu: the clients located outside the plant who pay their energy use in Forint and the Buszesz process divisions which are not subject to invoicing, directly, but are charged by the accounting department.
RCG/Hagler, Bailly observes that the process divisions may not be committed to energy management, since this function is left to the energy department. Therefore, the process divisions do not keep detailed records of their energy use.
However, there is a need, at the level of the cost monitoring department, for an allocation of energy expenses to the various process departments. Since this information does not exist, the chief of accounts (who happens to also be an engineer) estimates the energy consumption of each department using standard specific energy consumption norms developed over the years (derived from design data) in terms of energy use per unit of production. The chief of accounts has used this information along with personal engineering experience to compare the energy demand to the net energy supply (i.e. purchase less sales to outside energy users) to the company and has found an apparent energy loss which is believed to be the result of the transformation operation of the power plant. (see table 1 for the result of this calculation). This method has proven to be good enough for accounting purposes, but is still insufficient to explain the losses as effectively as a proper energy management information system.

8088399 YEAST AND ALCOHClL FACTORY - EAVEROY AUDIT 10
RCG/Hagler, Baillyls assessment of energy management at Buszesz is summarized below:
A. Energy Demand Management
Energy demand management focuses on the energy use of the process departments as a function of production throughput, status of operation, various operating parameters, and other parameters not related to process operations. RCG/Hagler, Bail! - observes that:
o There is not an energy denand management system at Buszesz, as employed in western market-oriented companies.
o The chief of accounts is using standard energy intensities. This method can achieve cost allocatlon, but may not be accurate enough for energy management, or for cost allocation in a market- or competition-oriented economy. The regression analysis presented in appendix 3 indicates that there is not a strong correlation between product throughput and energy consumption. In this regard, energy use is almost independent of the production level, and appears to more closely resemble a fixed cost.
B. Energy Supply Management
Energy supply management focuses on the operations of the steam and power plant which are in charge of supplying energy in various forms to inside and outside users, purchasing natural gas, electric power and water for this purpose. RCG/Hagler, Bailly observes that:
o There is a fairly accurate energy and mass balance carried out by the Energy Department: steam & condensate balance, fuel gas purchase, production/purchase/sale of electricity, production or purchase of water.
o Heat and mass balances are provided separately, but with no analysis of interrelationship between these various balances. For example, electricity generated by the turbogenerator depends on the steam flow through the turbine, and demineralized water supply to the power plant depends on the water losses and steam 6 condensate exchanges.
o No efficiency analysis of critical equipment such as boilers and turbogenerators are performed on a regular basis.
o No cost calculation of utilities supplied by the power plant is performed on a regular basis.

BU82ESZ YEaST AND ALCOHOL FACTORY - ENERGY AUDIT 11
o Energy Department reports are prepared using a Commodore 64 computer system including a central processing unit, a video monitor, an external 5I1i/4 disk drive ar.d a printer. The computer is run using a locally developed early version of a syreadsheet. Compared to a state of the art system, this computer system is obsolete; and hence, can perform only limited record-keeping functions. It cannot perform energy utilization analysis sufficient for energy management.
The consequences of the absence of a real energy management procedure are:
o High variabil.ity of energy consumption is indicated for a given level of production.
To provide control of a process operation, energy is usually released in specific equipment provided with on/off valve on the energy flow and a control device which limits the energy flow to the amount necessary to process operations.
In absence of real pressure to control the quantity of energy used, there are situations where poor state of conditions of the energy using equipment, or on/off valve, or control device still permit process operation but at a higher energy cost. For example, the fouling of a steam heat exchanger can be overcome by increasing the steam pressure (therefore reducing the efficiency) at the end-use equipment. The poor condition of an on/off steam valve will lead the opelator to keep it on (therefore increasing the losses), or th.? failure of the control device will lead to over consumption of energy.
o Maximization of plant safety and reliability condition occurs to the detriment of the energy consumption.
In the absence of real pressure to minimize the quantity of energy used for a given operation, there is a natural tendency of plant operators to maximize operation safety and reliability. In other words, plant operators minimize potential hazards and troubles, including operation supervision from management, by tuning up the equipment towards a higher energy intensity condition. The difference between the ace2ual energy use and the minimal theoretical energy use is known as the necessary "safety margin". At Buszesz, there is no real control or limitation of this safety margin. For example, excess combustion air is necessary at the burner to avoid release of unburnt gas (CO) which could cause an explosion and the destruction of the boiler. Therefore, if there is no

8082882 YEAST AND ALCOHOL FACTORY - ENERGY AUDIT 12
pressure to reduce the excess air to a minimum safe level, the boiler operator will feel more secure with a level of excess air which is higher than the optimum for errerqy management, consistent with safe operation.

BVSZESZ YEAST AND ALCOHOL FACTORY - ENERGY AUDIT 13
3.1.2 Management Improvement Recornendations
Action A.1: Improve the Energy Management information and control systeid
Action A.2: Steam management task force to reduce steam demand
Action A.3: Electricity management task force
3.1.3 Optimization Recommendation
Action A . 4 : Optimize boilers operation
Action A.5: Operate the most efficient feed water pump in priority.
Action A.6: Transfer steam use from night hours to day and peak hours.
Action Optimize electric tariff
3.2. Low Cost and Short Term Energy Efficiency Improvement Actions
Action B.l: Install new molasses circulating pumps
Action Revise the building heating system
Action B.3: Boiler efficiency and control system improvement
Action B.4: Install desuperheaters on the main letdown valves (priority)
Action B.5: Higher efficiency feedwater pump procurement
Action B.6: Move the intake of boilers air fan to the top of the boilerhouse and install a venturi to measure the air flow
Action B.7: Install inclinators at the inlet of induced draft fans in the boilergouae
RCG/Hrglor, I a i l ly, Inc.

BU82E83 YEAST AND ALCOHOL FACTORY - ENERGY AUDIT - 1 4
3 . 3 . Invastment or Long Range Energy Efficiency Improvement Actions
Action C.l: Short- and Mid-term Strategy plan for the development of the steam and power plant.
Action C.2: Improvement of the instrumentation and control system of the boilers
Action C.3: Energy conservation in the alcohol distillation p l a n t .
Action C.4: Optimize operation of the yeast drier

IV. PRESENTATION OF PROJECT FORXS
Each project discussed above is presented in a stand-alone project form which provides all basic information to qualify the project. The data are provided at the llinventoryu level (first order of magnitude approximation), and include the following:
- Description and rationale - Calculation of savings (energy and others) - Implementation cost - Financial analysis limited to the pretax pay-back period - Scheduling - Technical risk and reference - Back-up data and calculations
RCG/Hrglrr, Dr i l ly , Inc.

BUSSES3 YEAST AND ALCOHOL FACTORY - ENERdY AUDIT 16
ACTIQN A* 1
1. PROCESS AREA
PJ. ant management
2. STATEMENT OF RECOMMENDATION
Improve the energy management information and control system by implementing the following tasks:
o Installation of additional steam flow meters o Treat the power plant as a separate profit center o Create an energy demand management procedure o Create an energy supply management procedure o Improve energy management reporting procedures o Procure software and hardware means to support the energy . management improvement effort.
It is recommended that an energy management procedure be instituted according to the following guidelines:
o Installation of additional steam flow motors
In order to improve the energy demand management in the plant, it is necessary to install steam meters on a selection of in- plant low pressure (4.5b) steam loads. These loads are:
o Yeast plant (1 meter) o Vogelbusch fermentation plant (1 meter) o Dehydrater (1 meter) o Self-consumption of power plant (1 meter) o Building heating and domestic hot water (1 meter)
o Troat tho powor plant as a separate profit/cost centor
The power plant should be treated as an entity or cost/profit center like the other process areas in the accounts of Buszesz. Therefore, the energy management system of Buszesz should be split into two parts: (1) demand side management which manages the energy use in the process areas and (2) supply side management which manages the efficiency of operation of the power plant.

BU83E82 YEA8T AND ALCOHOL FACTORY - ENERGY AUDIT 17
o Institute an energy demand management procedurla
Each process uzic should be subjected to a budget procedure specifying standards for energy use according to determining criteria. Such criteria may be:
. production throughput . events such as start-up or shut-down procedure . quality of raw material or finished product . ambient temperature or seasonal variation
. availability of critical process equipment Each energy use will be a simple function of the determinant criteria: usually constant (e.g. X tons per day of steam in winter, Y tons per day of steam in summer), proportional (e.g. Energy = A x Production) or linear (e.g. Energy = A x Production + B). The establishment of such cost functions is one of the primary targets of an energy demand analysis:
(1) The energy cost function inust be as close as possible to the reality; therefore, a statistical analysis may be useful as a first step.
( 2 ) An analysis of the magnitude of each coefficient of the cost functions must be conducted to assess what kind of operating practice it reflects. For instance, in the case of poor efficiency and absence of control the constant coefficient will be high.
(3) The final energy cost function must result in discussion with the manager of each production sector in the plant (i.e. yeast and alcohol). The energy intensity must be realistic ( e . , really achievable) and at the same time encourage efficient energy practices. The production managers must agree with the cost function since the performance of the production sector will be evaluated by comparing the actual energy consumption with the value calculated using the energy cost function. The production managers will have to explain the differences. The purpose of these explanations is not a "personal j~stification~~ but actions to be taken (most often by the maintenance department) to reduce overall consumption.
Data logging must be revised to include the key parameters which are listed in the energy cost functions. Energy consumption may be either metered (a few additional meters might be necessary, see Action A.2), or 'ndirectly evaluated (through heat balance for instance).
The difference between actual and target consumption will be translated into Forint according to marginal costs of utilities
BU8ZE8Z YEA8T AND ALCOHOL FACTORY - ENERGY AUDIT 18
calculated by the Energy Department. The summation of all these differences will give an indication of the status of energy savings or overall consumption. This can be easily displayed as a trend graph.
o Institute an energy supply management procedure
The steam and power plant should be managed according to a simulation and optimization model similar to the one elaborated by RCG/Hagler, Bailly during the course of the audit (see appendix 2). This model links together the balance of various forms rf energy such as gas, steam, electricity and water. In additi-: it calculates the efficiency of key equipment (e.g. boilers, turboalternator) and allows comparison with the expected efficiency. In many respects, operating limits as experienced by plant operators are as important as efficiency in the search for optimal operation. These actual operating limits must be compared with design operating limits.
Every year, the model can be used as support for negotiating the target performance of the power plant to be written in the next year's budget. For example the boilers1 efficiency will be determined by target temperature and excess air of stack gas. As well, the turboalternator efficiency will be determined by target superheat temperature of steam and isentropic efficiency of each stage of the turbine.
The energy supply management model will calculate on a daily basis the marginal cost of steam and condensate and the total operating cast of the power plant as well.
The first basis of energy management is the awareness by any energy user of the true cost of energy. Usually this true cost is defined on a marginal basis. The marginal cost of steam indicates how much energy is saved (or purchased) by the power plant if the end user reduce (or increase) its consumption by 1 unit (tonne/hr or GJ/hr). This marginal cost may vary with the configuration of the power plant. For example, when the turbogenerator orboiler 3 is shut-down, steam is more expensive. Also, the marginal cost will vary with the period of the day. Because the steam is expanded through the turbine, thereby avoiding purchase of power from BFEM and because of BFEM (MVMT) time-of-day tariff structure, the cost of steam will be higher at night than during day or peak time.
A plant manager who knows the true cost of steam is in a better position to anticipate or delay steam use during a period when steam is expensive. For example, heating molasses in the storage tanks may be able to be rescheduled, resulting in lower cost. As another example, it is clearly worthwhile reducing the steam consumption when the turbogenerator is shut-down because of the higher cost of steam at this time.

BU82E88 YEAB!P AND ALCOHOL FACTORY - ENERGY AUDIT 19
The energy model established by the audit team during the course of the audit calculates marginal cost of steam (see appendix 2).
o Improve the energy management reporting procedure
Report performance monitoring report
It is recommended that a monthly energy monitoring report be prepared and submitted to the General Director which shows in a very simple way the status and trend of energy performance of the p l a t. This r e p o r t should have on ly one page, and would d i s p l a y principally the following graphs:
, Energy demand efficiency graph which displays the ratio of actual process energy demand to budgeted energy demand in process areas.
. Energy supply efficiency graph which displays the ratio of actual energy purchase to expected energy purchase (on a Forint basis).
. Trend of the monthly energy purchase by the plant and net energy cost ta the plant (energy purchased minus sales).
Report 2: Daily Enargy pricing raport
The energy department should distribute to the process department a report indicating the price of utility for the next week, It is expected that the process managers will modulate their steam demand in function of the price of steam.
o Means for tha Enargy Managameat System
It is not reconmended to designate a full time energy manager at the level of production departments. Once the energy demand management pracedure is shaped, it can be operated by the existing cost control managers in each production department. In case of specific problems related to energy use, it is recommended that the production departments seek the assistance of the energy department.
A computer-based management information system (M.I.S.) must be installed to provide the information necessary for energy management. This system must have hardware and software designed to calculate tlhe necessary performance ratios and to present information to management in an easily-understandable form. It was proven during the audit that adequate computer +.ools and state-of-the-art software permit the design of a valuable information andl control system which is going far beyond the capability of the existing in-plant managex~nt system.

BU82E82 YEAST AND ALCOHOL FACTORY - ENERGY AUDIT 20
4. BENEFITS
4.1 Energy savings
RCG/Hagler, Bailly, Inc. estimates that an improved energy management system, together with specific management actions to control operational efficiency, can achieve energy savings in the amount of 5% at the power plant level and 10 to 15% at the process area level. The expected value of the energy savings is:
Gas - steam management control reduction of plant-wide base demand: 55 GJ/day
330 days/year = 18,000 GJ/yr (1990 purchased gas energy = 778,585 G3
energy savings estimate = 2.3%) annual benefit estimate = Ft 4,700,000 per yr
Electric - electricity management control reduction of plant-wide base demand: 1.9 MWh/day
330 days/year = 620 MWh/yr (1990 electric energy:
net purchased = 11,597,108 kwh generated = 5,602,800 kwh consumption = 17,199,908 kwh energy savings estimate = 3.6%)
annual benefit estimate = Ft 2,000,000 per yr
4.2 Othar banefits
Additional savings, such as reduced use of raw material, reduced generation of scrap yeast, improved operating rate on capacity of the distillation plant are likely to result from the improved management5 control system. Potential benefits of these additional savings are not taken into account in the assessment of profitability of this action.

BUBZEBZ YEABT AND ALCOHOL FACTORY - ENERGY AUDIT 21
5. IMPLEMENTATION COST
5.1 Steam meters
List of equipment number unit cost (Ft)
One set of steam flow meter: 1 400,000
Total cost is estimated at 2,000,000 Ft for 5 sets of steam flow meters.
5.2 co!aputer equipment
Persona2 computers (IBM compatible): (1) 386, VGA, 4 MB RAM, 40 MB disk for energy dept (1) 24-pin dot matrix wi,de carriage printers total estimated cost $3,000
Software development: local contract - Ft 2,000,000
Staff training: local contract - Ft 400,000
Total development cost (Ft 70 = $1.00) - Ft 2,600,000 6 . PAY-BACK
Payback period = capital cost/net annual cost savings
Internal rate of return
This Action has been agreed by the Plant Director during the 28/3/91 meeting for immediate implementation. Three components were identified to implement this action:
BU8ZESZ YEA8T AND ALCOHOL FACTORY - ENERGY AUDIT 22
Component 1: Procurement of the additional meterinq e w i ~ m e n t
Task 1 - completion date: April 10, 1991 BUSZESZ prepares and address to EGI specification of steam meters.
Task 2 - completion date: May 10, 1991 BUSZESZ gets quotations from local suppliers. HBI g e t s q u o t a t i o n s from U S m a n u f a c t u r e r s
Task 3 - Completion date: May 15, 1991 BUSZESZ reviews offers, finalizes specification and makes recommendation for selection of supplier.
Task 4 - Completion date: May 22, 1991 USAID gives clearance for equipment procurement based on HBI financial and economic study and evaluation of quotation.
Task 5 - Completion date: May 23, 1991 HBI sends purchase orders for equipment.
Task 6 - completion data: August 1, 1991 Shipment of equipment arrives in Hungary BUSZESZ completes a flowsheet displaying existing and new steam meters BUSZESZ prepares installation drawings of steam meters including supporting and linkage.
Task 7 - cornplation dnta:August 30, 1991
Installation works by BUSZESZ
Task 8 - cornplation data: Baptembor 1, 1991
Daily readings of new steam meters reported in the energy management system
Task 9 - completion date: October 1, 1991 BUSZESZ assigns target to steam consumption monitored by existing and newly installed steam meters and monitors achievement as part of the energy management system.
RCWlkgLer, k i t t y , In.

BU82E82 YEAST AND ALCOHOL FACTORY - ENERQY AUDIT 23
Other tasks to be completed inalude:
o bdSZESZ prepare a one line diagram showing the localization of the electricity meters.
Component 2: Desicrn of the enercrv manaament svstena and reports
Task 1 - completion date: April 15, 1991 B U S Z E S Z d e f i n e s a g l o b a l e n e r g y :f f i c i e n c y p e r f o r m a n c e ind . -x a n d start monitoring its trend on a daily basis.
Task 2 - completion date: May 15, 1991 BUSZESZ establishes scope of work fox a computerized energy manacement system based on HBI1s recommendation. Scope of work will be broken down in functional areas and tasks.
Task 3 - completion date: May 30, 1991 BUSZESZ gets proposal from local engineering service companies to implement the above scope of work
Task 4 - completion date: June 6, 1991 or July 30, 1991 BUSZESZ reviews proposals, assigns a service company to complete scope of work according to work plan milestone and deadlines for deliveries.
Nota: BUSZESZ requests that this task be implemented after completion of the procurement of computer equipment (see component 3, task 7, scheduled for July 30). This request postpones the completion of this component by about 2 months.
Task 5 - completion data: August IS, 1991 (or October 15) The service company completes its work.
Task 6 - aomplation data: 8aptember 1, 1991 (or Novambar 1)
The first energy monitoring report (showing trends of efficiency) is sent to the upper management of BUSZESZ.
Task 7 - complation data: October 15, 1991 (or Dacamber 15) BUSZESZ prepares 1992 energy budget based on the new energy management system.
RCG/Hrglu, b i l l y , Inc.

BUSZE83 YEAST AND ALCOHOL FACTORY - ENERaY AUDIT 24
Com~onent 3: Procurement of computer euui~ment
Task 1 - completion date: May 1, 1991 EGI addresses BUSZESZ specification computer
Task 2 - completion date: May 10, 1991 BUSZESZ approves specification
Task 3 - completion date: May 24, 1991 EGI gets quotations from local suppliers HBI gets quotations from US manufacturers EGI addresses to BUSZESZ an evaluation of collected quotations
Task 4 - completion date: May 31, 1991 BUSZESZ reviews offers, finalizes specification and makes recommendation for selection of supplier.
Task 5 - Completion date: June 7, 1991 USAID gives clearance for equipment procurement based on HBI financial and economic study and evaluation of quotation.
Task 6 - completion data: June 10, 1991 HBI sends purchase orders for equipment.
equipment
Task 6 - complation data: July 15, 1991 Shipment of equipment arrives in Hungary. BUSZESZ procures accessories and installation plans for computer equipment.
Task 7 - completion data: July 30, 1991 Delivery and installation of computer equipment at BUSZESZ
Tark 8 - aomplation data: August 30, 1991 Installation of Energy Management software
Task 9 - complmtion data: Saptmmber 1, 1991 First energy management report delivered to BUSZESZ upper management.

BU82E82 YEAST AND AlrCOHOL FACTORY - ENERGY AUDIT 25
8 . TECHNICAL RISK AND REFERENCE
o Technical level of plant staff
The technical level of plant staff is very high and is definitely not an obstacle to an improved energy management system. Plant staff has proven to be very receptive to energy management concepts demonstrated during the course of the audit. The insufficiencies of the existing energy management system reflect more a probl-em of organization and equipment (hardware and software) than of technical capability of staff.
9. SPECIFICATION OF EQUIPMENT
9.1 STEAM METERS
9.1.1 Mechanical description
Orifice plate type round
Prosauro differential transmitter
8t.818 pressure transmitter
Temperature transmitter
Circular chart rocorder number of pens 3 (flow, temperature, pressure) disc speed one round per day scale logarythmic scale for steam flow housing weatherproof access to disc door with window extreme ambient temperature -30.C to +50eC power available 220 V 50Hz
Accossorias steam traps temperature indicator steam pressure indicator
Equipment procurod by tho plant (BU82E82) calibrated steam pipes (2x3m) supporting
Rm/I.glu, h i l l y , Inc.

BU88E88 YEAST AND ALCOHOL FACTORY - ENERaY AUDIT 26
Normal operating conditions normal pressure bar g 4.8 normal temperature "C 170-220 normal flciw t /h 0-8
Dimension s i z e of steam pipe mm 200 standard DIN
9.1.3 Yeast 2 (Vogelbusch)
Normal Operating conditions normal pressure bar g 4.8 normal te:.~perature " C 170-220 normal flow t / h . . 0-5
Dimansion s i z e of steam pipe mm 125 standard DIN
9.1.4 Dahydration plant + alcohol) Normal Opmrating conditions normal pressure bar g 1.8 normal temperature " C 160-200 normal flow t / h 3-12
Dimension s i z e of steam pipe mm 400 standard DIN
9.1.5 Building hoating and domestic hot watmr
Normal Opmrating conditions normal pressure bar g 4.8 normal temperature a C 170-220 normal flow t / h 0.5-4
Dimmasion s i z e of steam pipe mm 80 standard DIN

B U 8 2 C 8 9 YEAST AND ALCOHOL FACTORY - BNERGY AUDIT 27
9.1.6 Power plant self consumption
Normal operating conditions normal pressure bg 4.8 normal temperature " C 170-220 normal flow t/h 1-6
Dimension size of steam pipe mm 150 standart DIN
9.2 COMPUTER EQUIPMENT
o computer central unit IBM PC compatible (Microsoft DOS 3.3 minimum) 386 microprocessor 4 MB RAM 40 MB hard disk 3"1/2 floppy disk 5111/4 floppy disk 1MB serial and parallel communication port Hungarian characters EPROM (CWI)
o display monitor VGA 14 " color
o koyboard Hungarian keyboard
o printer 24 pin dot matrix wide carriage (142 col) Hungarian characters EPROM (CWI)
o Boftwara spreadsheet: option 1 LOTUS 123 + ALLWAYS or IMPRESS in Hungarian option 2 QUATTRO PRO in Hungarian
word processor: to be defined user manual in Hungarian
- --
KWhalw, Irilly, In.

ANNUAL ENERGY CONSUMPTION 1990
Electricity
Gas
Steam Water drinking water industrial water well water
Total Demand charge electricity gas
in-plant use of which utility
pfocesa administration
sale loss
in-plant use of which utility
pro== administration
sale transformation 108s
Water
in-plant use of which utility
pr-= administration
sale IoWunaff ected

PROCESS PLANT ENERGY BALANCE
ALCOHOL PlANT 96% ALCOHOL 181,000 0.80 11.6 5.9 100% ALCOHOL 61,700 0.73 2.1 5.9
YEAST PLANT PRESSEDYEAST 21,377 4.6 427 180.5 DRIED YEAST 31 4 18.9 2,574 31 5.9
PROCESS AREA ALCOHOL PUNT 9696 ALCOHOL 100% ALCOHOL
TOTAL ALCOHOL
YEAST PUNT PRESSEDYEAST DRIED YEAST
TOTAL YEAST
TOTAL PUNT

BUSZESZ YEAST AND ALCOHOL FACTORY - ENEROY AUDIT 28
ACTION A. 2
1. PROCESS AREA
Energy Department
2. STATEMENT OF RECOMMENDATION
Institute a steam management task force which will investigate steam losses and establish an action plan and budget estimate which will address at least the following issues:
o steam trap improvement and steam leak reduction o insulation improvement of steam lines o improve the quality of steam supply to the outside customers o condensate return to the boilerhouse. o reduce steam demand of molasse tanks o improve the building heating system
A steam management task force has been recently created to meet the directive of the General Manager to reduce steam losses in the process areas. This team has been headed by the energy department. This team has conducted several surveys throughout the plant to identify the major losses. The team found that the major source of steam losses is not the condition of equipment (as expected initially) but some low efficiency or wasteful practices such as direct heating of molasses in the trucks before unloading operations.
During the inspection of process plant operations, a number of steam conservation projects were identified:
o lack of steam traps on some procoss voss8ls
o improvo atoam and condonsatm pipos insulation
Existing piping insulation is largely not maintained.
Despite the high superheat temperature at the power station, steam quality at the user point may be lower because of deteriorated insulation on long steam lines. For example, the steam supply line to the paper mill (diameter 300 mm, length 600 to 700 m including one underground passage under the road) seems to be insufficiently insulated as the users report the delivery of a mixture of hot water and saturated steam at the point of use. In another example, the No 2 internal 4.5b steam pipe has deteriorated insulation, which sheuld be rsplaead.
W M l e r , k i l l y , Inc.

BU8ZE8Z YEAST AND ALCOHOL FACTORY - ENEROY AUDIT 29
o lack of uniform condensate return from process operations.
In general there is poor control of condensed steam for heating operations (used mainly for tank sterilization purposes in fermentation) in the yeast plant. Steam for heating air used to dry pressed yeast is presently sewered and not returned to tho boiler house.
In addition, condensate return piping from many process units does not exist.
o improve buildhi heating system
Building heating is virtually uncontrolled. There are no automatic controls for building steam and the condensate is sewered. The totality of steam traps are disc traps which are not appropriate for this service (thermostatic traps tuned-up to flush undercooled condensate would'be more appropriate). As a result, buildings are largely overheated.
o Portable instruments for the steam task force
The steam management task force could benefit from the acquisition and use of instruments t.o measure the amount of steam consumed (steam meters) and control devices (mainly steam traps and thermostatic valves) where no controls or inapropriate controls currently exist. In addition, hand-held temperature probes (thermocouples) are needed for spot checks of stream temperatures from process vessels where such capability is currently not available.
4. BENEFITS
4.1 Energy savings
The energy savings consists of the achievement of a reduction of steam demand as a target for the steam management task force.
The target is to keep steam demand inside the plant (for process and building heating use) as low as 18 t/h, instead of a current 23 t/h. Therefore, the energy saving in about 5 tons of steam per hour.

BUSZE88 YEAST AND ALCOHOL FACTORY - ENERGY AUDIT 30
List of equipment
5 - IMPLEMENTATION COST
number
steam traps steam meters electronic temperature probes insulation 1200 m
unit cost (Ft)
6 . PAY-BACK
This action was agreed by the plant director during the 3/28/91 meeting. An action program and budget estimate will be ready by the end of April.
8. TECHNICAL RIBK AND REFERENCE
9. BACK-UP DATA AND CALCULATION
9.1 8to(am trap tachnology in us. at Busaass
Buszesz is using various kind of steam traps most of them imported from West Germany (Gestra) :
o Disc traps (Geotra) o Thermostatic traps: bimetallic traps manufactured by Gestra and membrane traps manufactured by Kipszer o Float traps (Duna, Hungarian manufacturer)

BU82E82 YEAST AND ALCOHOL FACTORY - ENERQY AUDIT 31
ACTION Ae 3
1. PROCE88 AREA
Plant Management
2. STATEMENT OF RECOMMENDATION
Electricity Management task force to investigate the following action:
o Check motor temperature and Clean air cooling intakes o Improve power factor (cos phi) by surveying Motor Load and
Efficiency, and exising capacitors o Check the u,sefulness of electric power consumption o Check the mechanical power efficiency of rotating equipment
and pressure drop through exchanger (because of fouling) or through throttle valve (because of overdesign head) based on regular sunrey of mctor load.
o Rehabilitate Power Factor Correction System for Use when Turbine-Generator is not available
o Existing Conditions
BUSZESZ has nearly 1,000 electric motors installed in the plant, for pumping (water and process flows) , ventilation (fans) , material procesaing, and material handling. These motors are sized according. to what is available from inventory, not necessarily according to the size needed to do the job.
o Findings
RCG/Hagler, Bailly, Inc. conducted spot checks of two motors - which drive the boiler feedwater pump #3 and the FD fan for boiler #I. Of these, the boiler feedwater pump was found to be oversized (or otllerwise inefficient). During the course of the audit, RCG/Haglc!r, Bailly asssisted BUSZESZ to change its operating procedure so that pump #3 is used as standby and the older, properly sized pumps #1 and # 2 are used normally. The result was a reduction of 100 kW, or 700 MWh per year, a cost savings of Ft 2,200,000 per year, actually achieved by the audit. BUSZESZ needs to repair the leaks on pump 12 and continue to maintain pumps #l and # 2 so that this savings can continue.
Based on interviews with key plant electrical staff, RCG/Hagler, Bailly expects that many other such opportunities exist in the plant.

BUSXESX YEAST AND ALCOHOL FACTORY - ENERGY AUDIT 32
RCG/Hagler, Bailly recommends that BUSZESZ form an Electric Motor Team. Personnel for this team should be largely drawn from BUSZESZ staff, as this exercise should become a continuous part of plant operations and maintenance.
The Electric Motor Team should have the following specific tasks:
Make a complete inventory of all motors, whi.h identifies the motor number, . ze , location, load, and expected annual energy consumption.
Carry out an electric motor load survey. The load and the efficiency of all motors over 1 kW should be checked using a systematic procedure.
As part of the survey, electrical connections should be checked and tightened if necessary. The housing and ventilation air intake on all motors should be cleaned to improve cooling and efficiency.
As underloaded motors are identified by the survey, they should be changed for motors appropriately sized for the job. The inventory (developed above) should serve as the basis for moving motors from one location to another within the plant to match sizes to loads.
Existing Conditions:
The turbine generator at BUSZESZ is aging and its reliability is deteriorating. When the turbine-generator is running, it is operated at a leading power factor (capacitive cosine phi), thus compensating for the inductive loads in the plant. When the turbine is out of service, all power must be purchased from BFEM. On March 8, 1991 the turbine was down due to an oil leak at the main lubricating pump, and observations by RCG/Hagler, Bailly indicated that 2.1 MW of power was being obtained at a power factor of 0.80 (inductive cosine phi).
Findings :
Further investigations on March 8 revealed the presence of an automated power factor correction system, some 20 years old and taken out of service. Many capacitors were worn out and some voltage regulators were missing.
Based on advice from RCG/Hagler, Bailly, a BUSZESZ senior electrician was able to cannibalize the system to assemble one working capacitor bank of 100 kVAR. This bank was brought on line, reducing current to the yeast plant by 70 amps per phase (46 kVA). Plant power factor was improved from 0.80 to 0.85 by

BUBZE83 YEABT AND ALCOHOL FACTORY - ENERGY AUDIT 33
this system, as measured by BUSZESZ meters. This represents a savings of about 2% of electrical cost, or 130 Ft per hour, at no cost. On an annual basis, RCG/Hagler, Bailly estimates that turbine-generator availability is about 60%, so manual operation and use of these existing capacitors can save about Ft 350,000 per year.
Recommendation:
Rehabilitation of the power factor control system can reduce BUSZESZ 2ne rgy costs.
4. BENEFITS
4.1 Energy savings
RCG/Hagler, Bailly estimates that the potential savings of this program is 5% of the electric energy used by motor-driven equipment, or 700 MWh per year or Ft 2,200,000 per year. This does not include the savings already achieved at the boiler feedwater pump.
Savings of 5% of electric energy costs during period when turbine is not available (40% of factory hours). Assuming an average load of 2 MW and a marginal cost of 3.23 Ft/kWh:
4.2 Other benefits: Improvement in power factor
5 . IMPLEMENTATION COST
Equipment required: Electric motor survey instruments:
(1) Power demand analyzer (Dranetz 808 or Esterline Angus Miniservo) (1) Digital strobe tachometer (1) Digital multimeter with current clamp (1) Power factor meter total estimated cost $8,000
Consulting and advisory services (EGI or other): local contract - Ft 700,000
Additional staff (if required) electrician(s) - Ft 700,000 per year
Incidental equipment and repairs budget Ft 70,000 per year
Total cost (Ft 70 = $1.00) - Ft 1,190,000 plus ongoing labor and maintenance cost of Ft 770,000 per year
I c w H . ~ l u , Bailly, Inc.

BUSZESZ YEAST AND ALCOHOL FACTORY - ENERGY AUDIT 34
6. PAY-BACK
Payback period (including investments by both USAID and BUSZESZ) = capital cost/net annual cost savings
Ft 1,260t000/(Pt 2,200,000 - Ft 770,000) = 0.9 year
This project should begin immediately with procurement, followed by a survey conducted in the plant. The survey should be carried out over a six month period.
8. TECHNICAL R I B K AND REFERENCE
9. BACK-UP DATA AND CALCULATION On March 8, 1991, ~ ~ 6 / ~ a ~ l e r , Bailly, Inc. carried out a spot- check assessment of power demand on the BUSZESZ electrical system. On this day, the backpressure steam turbine-generator was out of service due to an oil leak at the main lubricating pump. During this same time, tests were being carried out to improve boiler efficiency. Thus BUSZESZ had three boilers in operation instead of only two. Otherwise, this day WZLS representative of the factory operating condition.
Incoming power at 10 kV: March 8 - purchasing all from BFEM (Budapest Electric Co.) = 1.7 to 2.1 MW over the course of the past 24 hours (strip chart in use) plus 1.1 MVAR (inductive cosine phi).
March 11, with turbine in operation, turbine load varied depending on steam demand (1.0 MW at 0500 hours up to 2.0 MW at 1100 hours) and BFEM varied correspondingly (1.2 MW at 0500 to 0.2 MW at 1100).
Primarl- Consumption:
Powerhouse 500 kW Factory 1.5 MW, power factor 0.8 (cosine phi inductive)
Powerhouse consumption (500 kW, 900 amps):
Boiler feedwater pump #3: 390 amps, 220 kW Boiler #3 FD fan & controls: 72 amps, 40 kW Boiler #3 ID fan: 104 amps, 57 kW Boiler #2 FD fan, ID fan & controls: 130 amps, 71 kW Boiler f l FD fan, ID fan & controls: 128 amps, 70 kW Condensate pump: 32 amps, 17 kW

BUSZESZ YEAST AND ALCOHOL FACTORY - ENERGY A U D I T 35
Lighting, battery charging: 28 amps, 15 kW Workers dormitory: 5 amps, 3 kW
Factory consumption (three main transformers)
Transformer #1 (550 kW, 1000 amps, power factor 0.80):
New yeast factory feed #2: 430 amps, 240 kW Wogelbush machine: 220 amps, 120 kW Krupp Torony alcohol distillation: 205 amps, 110 kW Water well VI: 5 0 amps, 28 kW Water well VII: 10 amps, 6 kW Tapso Oldo dissolver: 6 amps, 3 kW TMK, maintenance shop: 6 amps, 3 kW VSM, electrical shop: 3 amps, 2 kW
Transformer # 2 (270 kW, 700 amps, power factor 0.60)
New yeast feedpoint #1: 400 amps, 160 kW Water well 11: 95 amps, 40 kW Water well I: 75 amps, 30 .kW Water well V: 70 amps, 28 kW
Transformer # 3 (230 kW, 500 amps, power factor 0.7)
Alcohol plant 2nd floor: 190 amps, 95 kW Alcohol plant ground floor: 100 amps, 50 kW Plant lighting (office & outside); 120 amps, 60 kW Yeast packing plant: 20 amps, 10 kW Mill building: 10 amps, 5 kW

BU8ZE8X YEAST AND ALCOHOL FACTORY - ENERGY AUDIT 36
ACTION A w 4
1 w FROCE88 AREA
Power plant
2. STATEMENT OF RECOMMENDATION
Optimization of boilers operation:
o R e p o r t f l u e g a s t e m p e r a t u r e and Oxygen c o n c s n t ( a t t h e same point, at the outlet of the air preheater) on the data log sheets and monitor boilers efficiency in the daily report.
o Report Oxygen and carbon monoxyde content in combustion gas at the top of the firebox and monitor combustion excess air in %he daily report.
o Dispatch boilers to operate the highest efficiency boiler available.
o Purchase a portable combustion gas analyser
This project consists of monitoring boilers efficiency by assessing heat content of flue gas. This requires only oxygen content measurement and temperature measurement at the same point in the flue gas duct after the air preheater. Existing temperature indicator can be used for temperature measurement. Oxygen content must be measured by a portable unit to be procured. This measurement requires a minimum of expertise since oxygen content reading may widely vary with the deepness of the sample point of the gas duct, because of possible air leakage.
Based on this measurement two different actions must be taken to reduce operating cost:
o operate the most efficient boiler in priority o reduce excess air
For this second action, it is necessary to find out where the excess air comes fr3m: from excess air at the burner, or air infiltration through boiler's brickwall or air leakage through the air preheater.
Oxygen content and CO content in combustion gas at the top of the firebox give a good indication of the status of combustion excess air and of the possible margin for excess air reduction.
RWHaglw, ki 1 ly, trr .

BUBZESZ YEAST AND ALCOHOL FACTORY - ENERGY AUDIT 37
40 BENEFITB
4.1 Energy savings
Based on measurements conducted during the audit, the efficiency of boiler was calculated by the audit team. Results are:
overall thermal best natural gas efficiency ( % ) boiler to steam ratio
base 100 (GJ/ton) 1/
Boiler 1 81.6 110 Boiler 2 85.0 105 Boiler 3 89.8 100
Note 1: enthalpy of steam is different for each boiler.
It was found that boiler 1 uses 10% more gas than boiler 3 for the same steam load (at identical enthalpy). Boiler 2 uses 5% more gas than boiler 3; therefore, boiler 3 must be used in priority.
Total savings is 5% of annual gas consumption.
5. IMPLEMENTATION COST
List of equipment number unit cost (Ft)
portable electronic combustion gas analyzer 1
portable chemical (Fyrite) gas analyzer 1
Total cost is estimated at
60 PAY-BACK
This action has been approved by the Plant's General Manager during the 28/3/91 meeting for immediate implementation:
Task 1 - completion data: April 1, 1991
Based on the audit report findings, assign boiler 3 as best efficient boiler for plant base load.
Taak 2 - complation data: April 3 0 , 1991
HBI prepares and address to BUSZESZ specification of a portable gas analyzer.

BUSZESZ YEAST AND ALCOHOL FACTORY - ENERGY AUDIT 38
Task 3 - completion date: May 7, 1991 HBI gets quotations from US manufacturers
Task 4 - Completion date: May 14, 1991 BUSZESZ reviews offers, finalizes specification and makes recommendation for selection of supplier.
Task 5 - Completion date: May 20, 2991 USAID gives clearance for equipment procurement based on HBI financial and economic study and evaluation of quotation.
Task 6 - Completion date: May 21, 1991 HBI sends purchase orders for equipment.
Task 7 - completion date: June 15, 1991 Shipment of equipment arrives in Hungary.
BUSZESZ completes an operating procedure for the use of the portable gas analyzer including where should it be stored, who would use it, frequency of use, etc...
Task 8 - completion date: July 1, 1991 Daily readings from portable oxygen analyzer reported on boiler data log sheets and processed in the energy management system.
Task 9 -.cornplation data: Septambar 1, 1991
BUSZESZ assigns target for boilers efficiency and combustion excess air and monitors achievement as part of the energy management system.
8 . TECHNICAL RISK AND REFERENCE
To avoid any disruption in,daily combustion gas monitoring procedure, it is recommended to purchase two gas analyzer:
o 1 friendly-user electrochemical analyzer, with CO measurement capability for boiler excess air tune-up. However, this equipment must be used with care and requires maintenance (replacement of electrochemical cells).
o 1 Fyrite kit analyzer. This low-cost kit will prove useful to check the accuracy of the measurement of the electrochemical unit and also to replace the first unit when unavailable for maintenance reason.

BUSZESZ YEAST AND ALCOHOL FACTORY - ENERGY AUDIT 39
9. BACK-UP DATA AND CALCULATION
10. SPECIFICATION OF EQUIPMENT
10.1 ELECTROCHEMICAL PORTABLE GAS ANALYZER
o Physical description: case insure protection against choc
and dust probe high temperature probe
o Electrical: battery AC
6V, rechargeable, quick recharge 220V 50Hz
o Display: LCD with backlight
o Measured Parameters
Ambiant temperature Stack temperature Oxygen sensor
Nitrogen oxide
Carbon monoxide
Combustion gases
Draft
o Computed parametess:
Excess air Combustion efficiency Carbon dioxyde Emissions (CO, NOx)
o Printer:
o Miscellaneous:
Fuels
Messages
Calibration
o Parts Oxygen cell CO cell paper for printer
0-150 "C 0-1100°C 0025%~ electrochemical cell, life > 1 year 0-2000ppm, electrochemical cell, life > 2 years 0-2000ppm, electrochemical cell, life > 2 years 0-2.5%, semiconductor sensor, life > 5 years piezoresistive sensor
built-in thermal printer with form feed and line feed buttons
3 or more fuel in memory + custom fuel diagnostic and help messages in engl ish Optional autozero on start-up
BUSZE89 YEAST AND ALCOHOL FACTORY - ENERGY AUDIT 40
10 .2 CHEMICAL GAS ANALYZER
Specification: Bacharach FYRITE combustion test kit for measuring carbon dioxide (C02) and Oxygen (02).
Scale C02 02
R e f !-11 kit

BUSZESZ YEAST AND ALCOHOL FACTORY - ENERGY AUDIT 41
ACTION Am 5
1m PROCESS AREA:
Power plant
2m STATEMENT OF RECOMMENDATION:
o Operate the most efficient feedwater pump in priority
Existing Conditions:
BUSZESZ has three electric-motor driven boiler feedwater pumps, any one of which is capable of handling the load of the three boilers, under most conditions. Feedwater pumps #1 and # 2 are each 30 years old, pump #3 is only about 5 years old. When pump #3 was installed, BUSZESZ received a pump which was available, whereas pumps #1 and # 2 have the head and flow characteristics properly sized to match the conditions.
Findings :
RCG/Hagler, Bailly, Inc. conducted a power demand survey of the boiler feedwater pumps, using a strip-chart recording kW, kVAR meter, true RMS digital multimeter, and a strobe tachometer. The load on pump #3 was measured continuously from March 8-11, 1991 and the load was found to be typically 250 kW, continuous within 5% of this value responding to water demand, at a power factor (cosine phi) of 0.93. A spot check of the pump current using a digital multimeter showed 410 amps per phase (near full load current of 440 amps) and the speed was 2976 rpm (very near full load speed of 2975 rpm). The water pumping load was 40 tons per hour.
On March 11, pump #l was started and the water flow rate was rebalanced so that pump #l carried 40 tons per hour. The load on pump #1 was 240 amps per phase at a power factor of 0.92 (150 kW). Pump #2 was brought on line and indicated a load of 260 amps (165 kW), and a fairly severe water leak at the pump. The load was returned to pump #1 and a recording was made of electrical load overnight (March 11-12). The load was fairly steady at about 150 kW, varying within 5% in response to pumping demand.
Recommendation:
RCG/Hagler, Bailly concludes that boiler feedwater pump #3 is oversized (or otherwise inefficient). During the course of the audit, RCG/Hagler, Bailly consulted with BUSZESZ management in the electrical room to demonstrate the savings and to discuss

BUBZESZ YEA8T AND ALCOHOL FACTORY - ENERGY AUDIT 42
changing operating procedure so that pump # 3 is used as standby and the older, properly sized pumps #1 and # 2 are used normally. This was agreed by BUSZESZ.
4 . BENEFITS
4.1 Energy savings
The result was a reduction of 100 kW, or 700 MWh per year, a cost savings of Ft 2,200,000 per year, actually achieved by the audit. BUSZESZ needs to repair the leaks on pump ~2 and must continue to maintain pumps #1 and # 2 so that this savings can continue. An incidental equipment and repairs budget to maintain pumps #1 and # 2 of about Ft 400,000 per year should be set aside (net savings Ft 1,800,000 per year.
4.2 Other benefits
5. IMPLEMENTATION COST
There was no capital cost for the project, but BUSZESZ should maintain a budget of Ft 400,000 per year to rehabilitate pumps, replace if needed, repair leaks etc., so that the most efficient pumps can be available for operation.
6. PAY-BACK
7 . PLANNING
8. TECHNICAL RISK AND REFERENCE
9. BACK-UP DATA AND CALCULATION

BU8ZES3 YEAST AND ALCOHOL FACTORY - ENERGY AUDIT 43
ACTION Am 6
la PROCES8 AREA
Production departments (yeast and alcohol)
2. STATEMENT OF RECOMgENDATION
Optimization: Transfer steam use from night hours to day and peak hours as much as possible.
It was found that production cost of pr0ces.i steam varies on time of the day basis according to the electrical tariff structure. Each additional ton of steam used in process area requires additional gas and will produce additional kWh through the turbogenerator, therefore reducingthe purchase of electric power from the grid. The production cost of this additional ton of steam is roughly the cost of gas minus the cost of avoided electricity purchase. Therefore, higher electricity price (e.g. during peak hours) correlates with lower generation cost of steam. The fol,lowing table shows the variation of marginal cost of 1.8b steam according to the time of the day:
Marginal Cost of 1.8b steam Ft/GJ Ft/t base 100
Night hours 291 803 110 Day hours 264 728 100 Peak hours 264 728 100
As a result, one ton of steam cost 10% more at night than during day or peak hours. It is recommended to investigate two actions:
o Make sure that the usual morning peak steam demand happens after 6:00 a.m.
o Any steam demand which could be delayed should be delayed or anticipated, i.e., molasses heating must be forbidden during night time.
4a BENEFITS
4.1 Energy savings

BUSZESZ YEAST AND ALCOHOL FACTORY - ENERGY AUDIT 44
Optimization:
ACTION Am7
1. PROCE0S AREA
2 . STATEMENT OF RECOMMENDATION
Optimize electric tariff
During the course of this Energy Efficiency Emergency Program, it was found that different industrial plants in the Budapest area may select different electricity tariffs for the 10 kV power supply. In particular two tariffs would apply to BUSZESZ:
.Tariff A Tariff B
Demand charge in Ft/kW/year Peak 2340 4220 Day 4800 2220 ------ ------ total 7140 6440
Electricity charge in Ft/kWh Peak ( @ 3 h/d) 3.6 4.7 Day ( @ 13 h/d) 3.6 3.2 Night ( @ 8 h/d) 2.5 2.35
----..II- .II-----
daily average 3.23 3.1
BUSZESZ is currently charged according to Tariff A. However, Tariff B appears to be much better with a lower demand charge (10% lower) and a lower kwh charge ( 4 % lower). By selecting Tariff B, BUSZESZ would have a 5% reduction of its electricity bill. Unless there is any obstacle that we didn't see, it is recommended that BUSZESZ switch its tariff as soon as possible.
4. BENEFITS
4.1 Energy savings
4.2 Other benefits

BU8ZESZ YEAST ANID ALCOHOL FACTORY - ENERGY AUDIT 45
ACTION B 1
1. PROCESS AREA
Molasse storage tank farms
2. STATEMENT OF RECOMMENDATION
Installation of new molasses pumps
Molasse for alcohol production by fermentation is stored in two tank farms, one consists of 6 tanks (20tDx60tH) and the other of 2 tanks (30tDx80tH). Tanks are filled by pumping from tank car through unheated flexible lines. The storage temperature is maintained at 35/40eC year round using steam in coils in each tank. The 6 tank farm is supplied with 1.8 bar steam and the 2 tank farm with 2.5 ba steam. Steam flow is not metered.
Temperature in each tank is manuaiy controlled with on/off steam valves based on temperature readings to avoid overheating and freezing. There is no steam trap or any other control, and the steam supply is flashed to atmospheric pressure through the steam heating coil. Condensate from the coils drains to a pit surrounding the tank and is not returned as bo.iler feedwater due to concern for molasse leakage into condensed steam.
The 1.5 bar steam supply has a capacity of 5 t/h and the 2.5 bar supply has a capaczity of 2 t/h.
Estimate of steam required for the coldest winter condition are 0.5 t/h for the tank system and 0.3 t/h for the 2 tank farm, well below the supply capacity.
On an annual average basis estimates of steam requirements for tank heating are 4!900 GJ/y for the C tank farm and 3100 GJ/y for the 2 tank farm.
Because steam for tank heating is not metered, it was assumed that steam actually supplied was at line capacity for each set of tanks. This i.s probably exagerated but will be modified later. Based on this assumption, it is estimated that 96,000 GJ/year are supplisd to the 6 tank farm and 38,500 GJ/y to the 2 tank farm.
Several options were considered to reduce steam consumption:
o Option 1: install a steam control valve up-stream in each tank which opening is controled by a temperature control loop; Install a steam trap at the outlet of the steam coil. This system presents 2 major risks: (1) due to the low heating
WWmler k i l l y , Irr .

BU8ZESZ YEAST AND ALCOHOL FACTORY - ENERGY AUDIT 46
temperature, it may happen that the steam coil pressure be at vacuum or at a pressure lower than the molasse thus inducing possible molasse leaks into the steam coil which will condust sooner or later to the blockage of the steam trap (2) the possii~le vacuum pressure will provoke air ingress into the condensate piping system which will in turn provoke severe corrosion.
o option 2: install a hot water loop in each tank farm consisting of one heat exchanger to preheat the hot water using steam, an expansion vessel located at the top of the storage tank height, 2 circulating pumps, and a temperature control valve at the outlet of each tank.
o option 3: suppress the need for steam use, by replacing molasses pumps with new pumps designed for higher viscosity, lower temperature molasses.
After discussion with BUSZESZ plant management, it was decided that option 3 should be implemented.
4. BENEFITS
4.1 Energy savings
Estimated steam savings based on the marginal cost calculated by the model of the power plant are shown below.
The energy savings must take into account the increased electricity consumption of pumps.
4.2 Othsr benefits
Reduced maintenance cost as a result of the diminution of the risk of corrosion and risk of pollution by molasse.
5 . IMPLEMENTATION COST
6. PAY-BACK
7 . SCHEDULE
This action was approved by the plant director during the 3/28/91 meeting.
The energy department will submit quotations for the new pumps by May 15, 3991.

BU8ZE8Z YEA8T AND ALCOHOL FACTORY - ENERGY AUDIT 47
8 . TECHNICAL RISK AND REFERENCE
o risk of frozen molasses. in winter
It is probable that by freezing temperature some steam will still be needed to maintain molasses temperature above the freezing point.
9 . BACK-UP DATA AND CALCULATION
.ee attached spreadsheet

BU8ZE88 YEAST AND ALCOHOL FACTORY - ENERGY AUDIT 48
1. PROCESS AREA
Energy department
2. STATEMENT OF RECOMMENDATION
Revise the building heating system:
o prepare drawings of existing building heating system o install steam pressure reducer valves at the inlet of each
building o install under-cooling thermostatic steam traps on steam
heated radiators in replacement of existing disc traps. o switch from an existing direct steam heating system to a
system using circulating hot water in three buildings (main office building, annex office building, residential building)
o discontinue building heating in storage areas.
Building heating is virtually uncontrolled. There are no automatic controls for building steam and the condensate is sewered. The totality of steam traps are disc traps which are not appropriate for this service (thermostatic traps tuned-up to flush undercooled condensate would be more appropriate). As a result, buildings are largely overheated.
4 . BENEFITS
4.1 ~ n a r ~ ~ savings 4.2 Other banefits
5. IMPLEMENTATION COST
6. PAY-BACK
7 . PLANNING
8. TECHNICAL RISK AND REFERENCE
9. BACK-UP DATA AND CALCULATION
-- - -
RWHrgler, ki l ly , inc.

BU8ZE8Z YEABT AND ALCOHOL FACTORY - ENERGY AUDIT 49
ACTION B e 3
1. PROCESS AREA
Steam and Power plant
2. STATEMENT OF RECOMMENDATION
Boiler efficiency and contrcl system improvement:
o Install automatic draft control G E boilers;
o Install a combined Oxygen and CO meter on boilers 3 and 2 to monitor the excess air of combustion (measurement at the top of the furnace) ;
o Add three columns on the hoilers. ,log sheet: pressure (in mmWG) at the top of the firebox, 02 (in % ) at the top of the furnace, CO (in ppm) at the top of the furnace, 02 (in %) at the exit of the air preheater.
3.1 Automatic draft control system
Measurements performed on the boilers showed a large increase of oxygen content of flue gas between the firebox and the outlet of the air preheater, thus revealing a heavy infiltration of air through the openings of the brickwalls of boilers. Air infiltration is increased by the negative pressure of combustion gas inside the boiler. To limit infiltration, it is recommended to control the pressure of gas at a setpoint close to - 2 mm (water gauge) WG at the top of the firebox.
Currently, pressure in the firebox is measured at an intermediate level of the furnace height (not at the top). A damper is located at the outlet of the boiler and up-stream the ID fan to adjust ths pressure of flue gas in the boiler.
It is recommended that an automatic draft control system be installed on the boilers.
3.2 In situ oxygen analyser
Given the type of boiler in operation at BUSZESZ power plant, the level of combustion excess air is not determined with the position of the air damper for a position of the fuel gas valve through a mechanical link. The following factors may influence the excess air:
a the draft in the boiler: the higher is the draft, the higher will be the combustion excess air.
RCWHaglrr, b i l l y , Im.

BUSZESO YEAST AND ALCOHOL FACTORY - ENERGY AUDIT SO
o the status of air leakage through the air preheater which may aggravate along the time, thus diverting more and more from the burner and reducing the excess air.
Therefore, for a safe and efficient operation of boilers, it is recommended to monitor on a continuous basis both oxygen and CO in combustion gas as close as possible of the burner, i.e. at the top of the firebox. We agree with the boilerhouse manager that the operation of boilers at low excess air could be very dangerous, if not properly monitored by a continuous CO and 02 a r . ~ l y z e r . Anyway, p r o v i d e d t h a t t e m p e r a t u r e of s t a c k g a s e s a r e low enough, Itvery lowl1 combustion excess air is not requested, and a 3% 02 at the top of the firebox would be enough.
40 BENEFITS
4.1 Energy savings
4 . 2 Other benefits
5. IMPLEMENTATION C08T
6. PAY-BACK
70 PLANNING
8. TECHNICAL RISK AND REFERENCE
9 . BACK-UP DATA AND CALCULATION

BUSZESZ YEAST AND ALCOHOL FACTORY - ENERGY AUDIT 51
ACTION 0. 4
1. PROCESS AREA
Steam and Power Plant
2. STATEMENT OF RECOMMENDATION
Install desuperheater on the main 15b/4.5 letdown valve.
There is no control. of steam temperature in the power plant. Low pressure steam superheat temperature may vary in a large range. This has several consequences:
o Mass balance of steam system is difficult to achieve based on flow meter readings since it must be corrected by the actual and variable superheat temperature.
o There are situations where the maximum calculation temperature of steam pipe is exceeded, inducing excessive strain in piping and fittings. This situation favorizes steam leaks and blockage of valves. Superheat steam damage the interior mechanism of thermostatic steam-traps.
o Excessive superheat temperature increases thermal losses through steam pipes.
It is recommended to install a low pressure steam aesuperheater down stream the 15b/4.5b expansion valve and the exhaust of the steam turbine which superheat temperature is also excessive given the low efficiency of the turbine.
4. BENEFITS 4.1 Enargy savings
4.2 Othar bonaf i t s
5 . IMPLEMENTATION COST
List of equipment
Desuperheater by water in j ection
number
6. PAY-BACK 7 PLANNINO
8. TECHNICAL RISK AND REFERENCE 9. BACK-UP DATA AND CALCULATION
unit cost (Ft)
2 , 0 0 0 , 0 0 0

BU88E88 YEAST AND ALCOHOL FACTORY - ENERaY AUDIT 52
ACTION B.5
1. PROCESS AREA
Steam and Power Plant
2. STATEMENT OF RECOMMENDATION
Higher efficiency boiler feedwater pumps procurement
3. DESCRI . 'ION/RATIONALE
Based on the actual flow and head of feedwater pumps on one hand, and electrical power consumption on the other hand, it was found that the efficiency of the feedwater pumps are very low at arond 40%, versus an expected 65% for a new pump. Therefore, electric consumption of feedwater pumps could be reduced by 40% with new pumps. It is recommended to change the aging and low efficient feedwater pumps for new ones.
4. BENEFITS
4.1 Energy savings
4.2 Other benefits
Reduction of maintenance cost should be included in the calculation of benefits.
5 . IMPLEMENTATION COST 6. PAY-BACK 7 . PLANNINa
8. TECHNICAL R I S K AND REFERENCE 9 . BACK-UP DATA AND CALCULATION

BU8ZE8Z YEAST AND ALCOHOL FACTORY - ENERGY AUDIT 53
ACTION C 1
1. PROCESS AREA
Steam and Power Plant
2 . STATEMENT OF RECOMMENDATION
Short/Mid term strategy plan for the development of steam and power plant.
It is clear that the survival of the power plant is conditioned to a drastic improvement of its efficiency. The cogeneration efficiency (i.e. total useful energy output divided by total energy input) should be increased from a current 76-78% up to 85%.
So far, BUSZESZ has been successful in translating low efficiency production costs into the price of steam (the average price of steam is even slightly higher than the average production cost). The result is that the clients of BUSZESZ for heat (including the paper plant which is part of this USAID funded "Energy Efficiency Emergency Programw) ars very unsatisfied. They make a simple calculation: marginal price of natural gas is 264 Ft/GJ, assuming that they have a 88% efficiency boiler, the cost of generating low pressure steam is 300 Ft/GJ (315 Ft/GJ at maximum, taking into account the cost of demineralized water). They pay steam to BUSZESZ at a marginal price of 412 Ft/GJ. If we consider that they have to pay for transportation heat losses (evaluated at a minimum of 5% of heat content of steam), the actual price is about 412/.95 = 433 Ft/GJI i.e,. 37% higher than their own production cost. Therefore, BUSZESZ clients, when equipped with boilers tend to use their own boilers at maximum capacity and ~archase steam from BUSZESZ just for peak load. Furthermore, whoever is purchasing steam from BUSZESZ with a constant demand is considering to install new boil2rs.
However, BUSZESZ should be able to develop steam sale at a Lower price than its clients1 production cost owing to its turboalternator: marginal production cost of steam with no cogeneration capability is around 315 Ft/GJ like at BUSZESZ clients. A turboalternator would reduce the marginal cost of steam in a range of 285 Ft/GJ to 255 Ft/GJ. Therefore, there is an opportunity fox BUSZESZ to sell steam at an wacceptablel@ and "unbeatable1' price to its clients and still make a significant profit. This is the "best case" scenario where the power plant would become an important profit center of BUSZESZ.
The "worst caseu scenario is the probable dismantling of the power plant and energy department as it is now: If no steps are

BUSZESZ YEAST AND ALCOHOL FACTORY - ENERGY AUDIT 5 4
taken to increase the power plant efficiency and reduce the cost of heat, it is likely that all of BUSZESZ clients will discontinue steam purchase. BUSZESZ will have to support alone the cost of its oversized power plant, with very little chance that a retrofit progrcm plan prove profitable. In that Itworse casett scenario, it is probable that BUSZESZ will find financially more attractive to stop operation of the power plant and build two small low pressure package boilers, fully automatized.
To give a chance to the Itbest casev scenario, it is highly time that:
o BUSZESZ negotiates with its clients to stop any project of installing local boilers.
o BUSZESZ prepares a strategic plan for the future retrofit of its power plant with various scenarios:
1. Steam sale development scenario, where steam would be proposed at a price lower than production cost at clients1 boilerhouse. In that scenario, it could be expected to get the financial support of clients and government for a mutually beneficial project.
2. Status quo scenario, where steam would be proposed at a price slightly higher than its clients1 production cost but low enough to make unprofitable any project of boiler and/or power plant at clientst plants.
3. Giving-up steam sale scenario, where BUSZESZ would stop selling steam, and would determine the most profitable structure for the steam and boiler house:
3.1 refurbish turbogenerator 3.2 install a new turbogenerator 3.3 install low pressure package boilers
For each scenario, BUSZESZ will develop a tariff structure for steam.
o BUSZESZ negotiates this strategic plan with its clients to determine a commitment for a scenario, based on future tariff options.
o BUSZESZ determines together with possible financing third- party which scenario would be implemented on a cost/benefit basis.
4. BENEFITS 4 . 1 Energy savings
4.2 Othor bonefits
RCWnrglrr, I r i l l y , In.

BU8ZESZ YEAST AND ALCOHOL FACTORY - ENERGY AUDIT 55
ACTION C 2
1. PROCESS AREA
Steam and Power Plant
2. STATEMENT OF RECOMMENDATION
Improvement of the instrumentation and control systems of boilers:
o Automatic load control systems o Automatic water level control system
Install natural gas meters on each boiler o Install additional steam meter o Move air intake for F.D. fans at the top of the boilerhouse
4. BENEFITS 4.1 Energy savings 4.2 Other benefits
5. IMPLEMENTATION COST List of equipment number Total cost is estimated at
6. PAY-BACK
7 . PLANNING
8. TECHNICAL RISK AND REFERENCE
9. BACK-UP DATA AND CALCULATION
unit cost (Ft)
RWW.BLer, k i l l y , I n c .

BUSZESZ YEAST AND ALCOHOL FACTORY - ENERGY AUDIT 56
ACTION C 3
1. PROCESS AREA
100% Alcohol Distillation System
2 . STATEMENT OF RECOMMENDATION8
o Preheat feed stock with alcohol column bottoms product and with condensed steam used to reboil column material.
o Replace direct steam injection used to reboil water coluinn contents with an indirect system and return condensate to the boiler house.
(a) Each of two dewatering columns are now heated indirectly with 900kg/h of 1.8 bar steam. The condensate is returned to the boiler house and the 78 C alcohol bottom product is sent directly to storage with no heat recovery. It is recommended that a heat integration program be instituted consisting of two heat exchangers one of which will be used to partially preheat the feed stock with the alcohol column bottoms followed by a second heat exchanger used to continue preheating (and partially vaporize) with condensed steam from the columr? reboiler (see attached flow diagram) . (b) The water column is currently heated with about 200kg/h of 1.8 bar steam directly injected into the column. The column bottoms product, which includes condensed injection steam, is currently sewered. It is recommended that a heat exchanger be purchased so as to indirectly heat the water column. The column bottoms, in much smaller quantity than with direct injection, can be sewered while the hot steam condensate can be used for heating and then returned to the boiler house.
4- BENEFITS
4 . 1 ENERaY SAVINGS
For the alcohol feed preheater, estimated steam savings appear to be 100 kg/h.
For the water column there are no direct steam savings.
4.2 Othar Banef i t s
o There is the possibility that adding heat to the feed might reduce the steam requirements fur the distillation.

BV88E82 YEAST A N D ALCOHOL FACTORY - ENERGY AUDIT - 57
o Reduction of water pollution by reducing the quantity of bottoms product sewered.
o Increased condensate return to boil.er house.
5 . IMPLEMENTATION COSTS
List of equipment
NUMBER tubular heat exchanger (liquid-to-!.lquid) 1 boiler (96% alcohol vaporizer) 1 tubular heat exchanger (steam to-boiling liquid) 1 piping 50 meters insulation 50 meters pumps 3
A careful assessment must be miide of the dehydration column performance. It was presumed for this recommendation that heat input into the column through the reboiler (as is now done) could be transferred to the feed (by preheating) without disturbing concentration profiles of alcolnol and water throughout the column. This must be thoroughly checked with detailed calculations before implementation. Note also that no more than half the reboiler steam heat was assumed transferred for preheating for the very purpose of avoiding significant column upsets.
RcG/lrglr, h i l l y , Ire.

BUSZESZ YEAST AND ALCOHOL FACTORY - ENERGY AUDIT 58
ACTION C . 4
1. PROCESS AREA
Dried yeast plant
2. STATEMENT OF RECOMMENDATIONS
Optimize operations of the yeast drier
o Ra.ise the air moisture content to the drier inlet o Recycle more moist air from drier exit
All yeast produced for sale is made in the same fermentation equipment. Currently, 7 batch vessels are used to produce about 22,000 tons of yeast. All yeast produced is pressed to remove some water and then sold. Dried yeast is made by further drying pressed yeast. This is done in a spray drier which processes 140 kg/h. Production of dried yeast was 314 tons in 1990 (compared to almost 21,700 tons of pressed yeast) and production is expected to increase because of the greater value of the dried product.
Producing the spray dried material consumes far greater energy than pressed yeast. Specific energy consumption for dried yeast is 18.9 G J / t of thermal energy compared with 4.6 GJ/t for pressed yeast and about 2,600 kWh/t of electricity compared with 472 kWh/t for pressed yeast. On an annual basis the dried yeast plant consumes about 6% of all thermal energy and 8% of electricityused in the yeast plant but only produces 1.4% of the total yeast made. As more emphasis is placed on dried yeast production, energy consumption will drastically increase.
For example, even if total yeast production remains constant at 22,00Otons/year, changing the distribution of pressed and dried yeast by increasing dried yeast production by a factor of 5 will require about a 40% increase inthe yeast plant total thermal energy requirement and a 60% increase in total electricity usage. Although increasing the energy efficiency of the boiler plant and the steam turbine will help, careful planning of energy costs and availability must be undertaken before producton increases are ordered. Fortunately there are process changes in the production of dried yeast which will also help.
Electricity is mainly used in the packaging of dried yeast although a considerable amount is used in the drying process for cooling and delivering air to the spray drier. As currently practiced, ambient air is cooled to about 1-2 C with a mechanical (freon) cooler and then heated with 6 bar steam to raise the
BUSZESZ YEAST AND ALCOHOL FACTORY - ENERGY AUDIT 59
temperature to 85-90 C prior to entering the drier. This combination of cooling and heating reduces the moisture content of the drying air and provides heat for the drying process. The final dried yeast contains 4-6% moisture and the air from the drier, at 40 C, con.tains 12017% moisture. About 1/3 of the drier exit air is recyc1,ed to the drier for efficient operation. The drier operates wit:h an 18 kW blower and provides air at a rated 10,000 kg/h.
3.1 Changing drier conditions
Several current drying practices were considered fixed, based on the present equipment used ?nd the nature of the material being dried.
o The air now delivered to the yeast spray drier must be maintained at its present flow .,in order to provide good circulation for proper drying.
o Because of sensitivity of yeast to temperature, the drier inlet temperature now used, 88-90 C, cannot be exceeded.
With these imposed conditions, the only strategy possible is to change the parameters used to condition air for drying and to increase air reci~rculation in the drier. T k s e changes are described below and should lead to modest savings of steam and electricity.
o Raise the temperature out of the air cooler to 15 C from the presently maintained 1-2 C. The saturation moisture content at this temperature is high but should be sufficient for yeast drying.
o Reduce the pressure of steam used to heat the drying air from 6 bar to available 1.8 bar steam. Steam at 3 bars condenses at 131 C which should be sufficient to heat air from 15 C , at the cooler exit, to 30 C. Also, the air heater is not insulated; it should be.
o Recycle more air from the drier exit to the inlet while maintaining the drier exit temperature at 40 C. As a rough estimate, it might be possible to recycle as much as 40-50% of exit air.
o Consider inst-illing an air-air heat exchanger in which 15 C air out of the cooler can be preheated with exit drier air.
o The spray dryer currently used is massive and probably requires considerable preheating in order to reach operating conditions. Even at the relatively lowoperating temperatures, 40-90 C, heat losses through the wa;ls occur. The spray drier should be insulated.
- - ~p
RCWHagler, b i l l y , Inc.

BUSZESZ YEAST AND ALCOHOL FACTORY - ENERGY AUDIT 60
4. BENEFIT8
4.1 Energy savings
Steam consumption for drying, as currently practiced, is about 7 GJ/t of yeast dried and electricity about 130 kwh/t, considering blower energy only. A rough estimate of steam saved is 30% of present consumption which would lead to a cost benefit of about 200,000 Ft/y at present production capacity.
This examination of thermal energy saving used to produce dri i yeast is restricted by the need to consider some drying conditions as mandatory with the presently configured system. What is really required is a thorough reexamination of the entire drying process, includingthe proposals made above. Consideration should be given to reducing the air flow through the drier, although the electric energy savings would be modest compared to electricity used for packaging. Any reduction in air flow in a redesigned system could further reduce thermal energy requirements.
As an alternative to the present method of drying, the use of heated vacuum cylinders, of a design similar to the equipment now used to produce pressed yeast, is possible and could lead to significant energy savings. Temperature control at the cylinder surface and the temperature sensitivity of the yeast would determine if this an appropriate drying method.
4.2 Other benefi ts
Replacement of high energy 6 bar steam with lower energy steam
S. IMPLEMENTATION COST
insulation piping heat exchanger (air-to-air) instrumentation
6. PAYBACK
7. PLANNING
TECHNICAL
Despite its appearance of feasibility, this project should not be undertaken without careful examination of possible harmful effects on the drying process and the dried product.
RWHaoler, k i l l y , Inc.

BU8ZEBZ YEAST AND ALCOHOL FACTORY - ENERGY AUDIT 6 1
APPENDIX 1: L i s t o f data provided by t h e p l a n t
As part of the preliminary energy audit (PEA), RCG/Hagler, Bailly reviewed a number of standard BUSZESZ reports. Because of the limitations on time and level of effort for the PEA, only selected data was used. In this section, we summarize the types of reports used at BUSZESZ.
o Steam production monthly report:
T h i s r e p o r t p r e s e n t s the s t e a m and t-2ndensate l l a n c e a t t h e boiler house, per 10 day periods. The repoi shows a mass balance (tonnes) and a heat balance (kcal). The items of the balance are the following:
Soft water Condensate return Feed water to boiler 1
boiler 2 boiler 3 total
Steam raised at boiler 1 boiler 2 boiler 3 total
Steam consumption through: turbogenerator 35/15 by-pass valve
Steam use breakdown gland steam condensate tank medium pressure extraction low pressure exhaust
Reducing valve medium pressure 35/15 Low pressure 15/4.5
Blowdown Self consumption
at the steam turbine power station heating deaerator heating total
Steam reducers LP steam 1 & 3 self consumption
Steam output M? steam LP steam total

BU8ZE8Z YEAST AND ALCOHOL FACTORY - ENERGY AUDIT 62
o Daily production/sale/purchase and operation report
PRODUCTION/SALE/PUHCHASE OF ENERGY
~roduction sale purchase
steam in GJ daily cumulative
electricity kwh daily cumulative
Well Water m3 daily hour average cumulative
Other water m3 city daily river daily
Total water m3 Electricity balance kwh
BOILEg FEEDWATER QUALITY (by shift and boiler)
hardness alcalinity
COMMENTS ON OPERATION
1. type of fuel fired 2. trip out report
MAINTENANCE OPERATION
1. Maintenance staff 2. Description of maintenance operations
WELL WATER PRODUCTION
by well, total daily in m3 and peak demand in m3/h comment water temperature to desalination plant
o Puel gas use monthly report
each month is divided into 10 day periods. meter readings starting
ending difference
quantity in Nm3 low heating value of .;as (monthly) Heat output from boilers in GJ assuming a 83% fuel-to-steam

BUBZE82 YEABT AND ALCOHOL BACTORY - ENERQY AUDIT -- 63 --- --.- .
thermal sfficioncy
o Breakdown of aalos per meter
reading starting ending difference
quantity in tons average pressure average temperature correctio~ factor corrected steam flow in tons Enthalpy in kcal/kg total heat supplied in kcal
in CJ
Note: the invoicing is based on total enthalpy of steam
Clients are:
Budacolor 1 Paper factory Internal 15.5b steam No 2 pipeline 4.5 bars No3 pipeline 4.5 bars Hungarovin (on a monthly basis) Military barracks (lump-sum) Budacolor 2 (meter out of order, based on last year, same period) Vegyepszer (small shop, lump-sum) Water pumping station (monthly) Zim factory (no longer a buyer) Paper mill 2 (monthly basis) Poultry food (monthly basis)
RCWHmlw, h i l l y , Im.

BU8aEBB YEAST AND ALCOHOL FACTORY - ENERGY AUDIT 64
APPENDIX 2: Energy model o f t h e steam and power plant
W H r g l e r , h i l l y , Inc.

BUSZESZ - POWER PLANT Overall Thermal Efficiency
input output
rn gas , electricity condensate process steam vA sale of steam

BUSZESZ - POWER PLANT Fixed cost s t ructure ( ~ ~ t / y e a r )
maintenance (1 5)
konstant energy (48)

BUSZESZ - POWER PLANT Operatir,g Cost versus Revenue
Supplied heat in GJlh
-It cost -t-- revenue
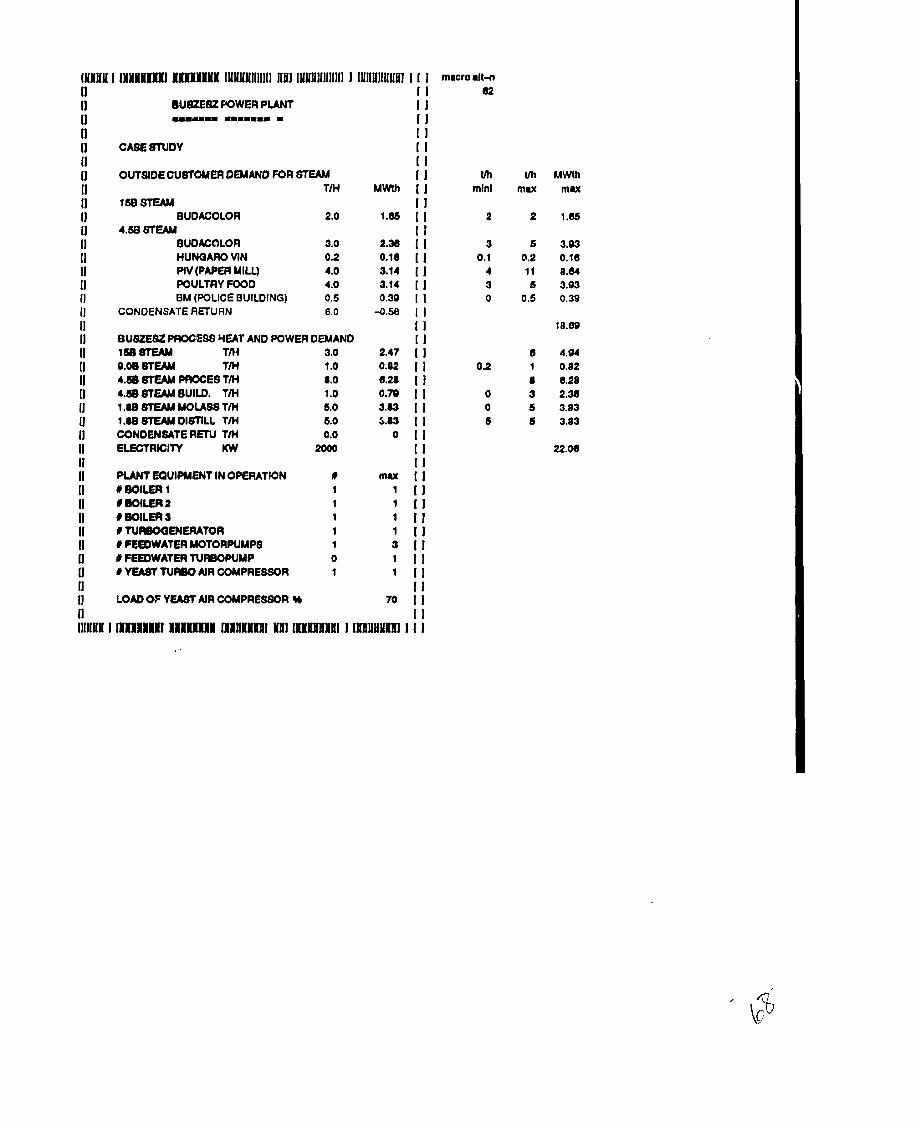
IIIIIIIU I IYWIIII~YIII M~YIIYYYY IUNUUIIIIIII 11111 IHIIIIIIIIIIIII I IIIIIIIIIIIIIIII I I I I1 1 1 11 BUfKEBt POWER PLANT 1 I O -=I m I I = I I I = I I I1 I I 11 CASESTUDY 1 1 II I I [I OltTslDE CUSTOMER DEMAND FOR STEAM 1 I 11 TM MWth 1 1 (1 laesTEAM I I II BUDAGOLOR 2.0 1-65 II 11 4.58 STEAM I I II BUOACOLOR 3.0 2.33 I 1 11 HUNOAAO VIN 0.2 0.18 I 1 11 PIV (PAPER MILL) 4.0 3.14 1 1 11 POULTRY FOOD 4.0 3.14 1 1 11 BM (POLICE BUILDING) 0.5 0.39 1 1 (1 CONDENSATE RETURN 6.0 -0.Se 1 I 11 I I 11 BUSZESZ PROCESS YEAT AND POWER DEMAND 1 I 11 1~~ TM 3.0 2.47 [ 1 11 0.08 STEAM TM 1 .o 0.92 1 1 11 4.m s ~ ~ ~ s l l PROCES TM 8.0 8.28 1 j 11 4 . s e ~ ~ w ~UILD. TM 1 .o 0.m I I 11 1.~8TEAMMOLASBTM 6.0 3-83 1 1 11 l.OB8TEAUDIBTILL TM 6.0 5.03 1 1 I] CONDENSATE R R U TM 0.0 0 1 1 11 E L r n l C l T Y KW 2000 I 1 II I I 11 PIANT EOUIPMENT IN OPERATION # m u 1 I 11 r WILER i 1 1 I 1 11 # DOlLER2 1 1 1 1 11 ~WILERJ 1 1 1 1 11 #TlJReoaENEFUrOR 1 1 1 1 11 PFE€DWATERMOTORWMPS 1 3 1 1 11 r ~ D W A T E A ~ U R ~ ~ W M P o 1 I 1 [I #YEAST TUReo AIR COMPRESSOR 1 1 1 1 11 I I I1 LOAD OF YEAST AIR COMPRESrnR W 70 1 1 II I I IIIIIIIII I rm111m1n 111111111 IIIUIIYYPWI 1111 I~M~~IMYHI I IIIIIUHNUHI I I I
macro dt-n 02
tm mlnl
MWth man

IIIIIIIII I l I 1 1 1 1 1 U 11111111 IYYYlllHlll 11111 llIllllllllllll1 I llllllllllllllll 1 1 1 11 I I 11 RESULT8 - FUEUHEAT USE 1 I !I 1111111 1111111 11 1- I I 11 mrrwrod crlculrtod [ 1 1) P ~ r c h a d R J o I ~ ~ Nma!h 3478 I 1 11 QJh 137 1 1 I1 Rnl 38234 I 1 1) S.kd@tum th 13.7 ( 1 11 Q J h 39.0 I 1 11 Ftnl l a 7 2 [ 1 [I Nonr.tumodcond.nrlm 7.7 1 1 11 Frnl 308 I 1 11 I I [I NET FUEUHEAT GOST Rm lea64 I I [ I I I llIlIlIlI I llIlllIlllIlIlIl ll111l1I11111111 llIlllIlIlllIlll lllll lIllI31111Il1111 I llIlIlllIlIlIlIl I I I
l1l111III 1 IIIINIUYUI YYUUUII1IY IUl!!!lliIll'l lllll 1311131113111111 1 1313111311131111 1 1 1 I1 I I 11 RESULTS - ELECTRIC POWER BALANCE 1 1 11 1111111 1111111 11 1111111 11 I I I1 mrrurrod c.lculrtod 1 1 I) Purctuwdparm kW 1.1 11 Rm 2580 I 1 11 WParnr k W 0 1 1 II Ftnl 0 I 1 11 I 1 [I NmPOWERC08T Fth 2580 I I I1 I I III1IUN 1 lY111111111 11111YH1 lY1111Y1l 1Nl IIUlIIIII1IIIl 1 l1I1111111111111 1 I 1
IUllllU 1 lN1YYlY1l Y1N111P1 IPYUIIIIPI 11111 IYUIIIIUIIIII 1 lIl1lII1IU11U1 1 I 11 I 11 RESULTS - WATER BALANCE I I1 1111111 1111111 11 -11 I I1 muwrod crlculatod I (1 ~ i n u d i w d w r t u tm 33.1 [ [I Rm 1178 I [I R H W U U tm 40 I 11 Ftnl 120 1 I1 I IYIIN# 1 11111111111 111111111 I11111111 111 I11111111 1 I1IIII1I11WI 1 I

IINUY I 11rn11r1 Imwrmr IY~Y~II I I I I I I 11111 IUIIIIIIIIIIIII I IIIIIIIIIIIIIUI I I I n 1 1 11 OVERALL THERMAL EFFICIENCY 1 I
Ha! Input Natural gu W*lly condmute
H a t output u k d a t r u n procow atrun WWHy
unlt NmS kwh t
w btoW
Overall cogeneralion efficiency I1 1 1 IIUUII 1 IUUYUYYYI YYEYYUUY IllUYllllNNl UlIl IYHIIIIII1I~!I I llllIlllllIlllIl I I I
IlYNY I I111NYHYl lPYPPPYY llUUUURYl Ylll IIN1IIlII1I111 I I1IIIIIUIIlIUI I I I I1 I I 11 RESULTS - INTERNAL VARIABLES 1 1 I1 111111= 1111111 11 1111111 I I 11 mawrod dcul.1.d 1 1 I] burrmlodon: I I I1 bdkr 1 41 56 1 1 11 bdkr 2 W 52 I 1 11 bdkr 3 W 1 1 (1 w k d a t ~ th 13.7 ( 1 I1 -wpnwu- tm 23 1 1 I] atounralrd tm 4 . 1 I I m *-wpplkd th a.7 1 1 u - ~alodlu.m ~ p p l w rat10 1.178 1 1 fi T t 3 m d m l w l o n th 43 40.3 I I I1 Tabys l l r th n/r 1.8 1 1 11 exlnetbnatrun th 10.7 [ I I] l 8 b a t u m t o p m w r t m @.a I I [I LPatym todurr . tm 5.0 I I 11 k W 1- I 1 n 1 1 INllUlI 1 111111111 IIXll l lYlI lNIlllP1Yl YUl lI1NllYlll 1 lIUYllI11l I I I

111 1 lllI1111111 1 I#1HIII1 I IPIIHI I I I 1 1 1 1 lII11111l I llI11111ll UI 111111111 1111UII UIIIIIII I 11111 I1 11 I1 mz- WZ- WZ- nt- m-wpno [I 11 ,a t8t t8t w -WL U 11 La SBZ 00t IU mQO'b (1 11 ta e~ ~LZ a2 ~~~lrm a 11 ta CLZ CU w un4-1 11 I1 *LC 1 LC 1 LC ZLC wzac I1 I1 11 11 PDN PDN rD& M)M 11 fl @JnOr( #JnOr( @Jnq &JHI 11 I1 8LlblU Amp m Alllrp I1 I1 I1 11 wz- 8- 00.1- 0 91') ct'e WJ.8-m I1 I1 CLZ WL OLO'L 0 OL' 9lP ZP'C -rwr I1 I1 *LZ SU OIO'L 0 arm PO'C -r qs.* I1 II OLZ LZB 0~0.1 0 Z)'LP- f3.C -m I1 I1 a~z ~m orwr o WLP- CO' c -WL 11 11 ZlE 006 OLO'L 0 ZVL- EO'E -9PE 11 I1 I1 I1 rolu vu w VIIM~ VVM~ vro I1 I] PO3 PU~~NUI J@18M -I. 3.1. l@'u 11 11 mulump PPI prrmqDJncl 11 I1 11-11 -1 11111m1 11 11 61503 lVAN3WY3NI 11 I1 11 111 I 11111111111 I IIIIIIIIIII I IIIIIIIIIII I I I I I I I IIIHIIIIIIIIIII I III~IIIIIIIIIII lnlt IHH~II~~~HI rurlnrna lnnnrnrn I nunnr
I I IIIIIIIIIII I IIIIIIIIIII I IIIIIIIIIII I I I I I I I IIIIIIIIIIIIIIII I IIIIIIIIIII~I~I IIIII IJI~IINIIHHI nnnNannn nrnnnrrlu I lrlrnnl I I I1 I I 0'88 L'C~ MoyWru~pe 11 11 2 <<=l.= EL/$& UMOPIBI : 0's c.m wlu! 01 11 I I : 0's i'oi uo!)9ullxe DL I1 I I 0's 1 L'OL uolllslyte 01 I1 I I O'SC 0.a wnwx@ 01 ti 11 11 11 N0113V : lulu rXru mnlrvr SUW~N~~NHSL 11 I I 11 I I : 0.0 rn13.lJ.md .=I3 11 I I 0'1 (rmrr) rmDd dn-8- I1 I I O'L 8.0 .MW J- oy3 I1 I I 2.9 L I'OL ~l~wunrr- 11 I I CP L'IE WW lrnl 11 11 plnuop I1 11 N0113V : !UP lmu .nW lNnlV~lN03 11 I I 11111111 -1 I1 11 SANIWlSN03 11 I I fl I I 11111111111 I 111~111111 I 11111111111 I I I I I I I IIIIIIIIIIIIIIII I IIIIIIIIIIIIIIII IIIII II~IIII~IIHHI HIIHHIII~ IUIUIII I ~IIIIII

COW STRUCTURE EQUATION
I1 11-1111 mm =11.111 11 11 11 damlne 11 11 ruel elm water toW I1 11 QJm kWhm m3m Nh 11 I1 11 1) VulrbkHutcrwt 130.7 -2342 31.3 28042 11 I] VUI.M.EIWCOU 2000 6468. 11 [I C o n ~ t c o r l 8.0 1140 1.8 5491. 11 11 I1 11 137.3 791 33.1 39990 11 I1 I1 (1 ToW mrfrble Heat cod Nh 28042 61% 11 I] Total heat supplied G J h 101.8 [ I (1 Unit coa FUG J 275 It 11 I1 (1 TaWvui.M.EloccoU Nh a07 1396 11 I] TaW Ekc upplied kWhh 2000 11 [I U n i t d RlkWh 3.23 11 I1 11 I1 Pawwdommdchuge Rm 2038 11 I1 I1 11 Coclunthut loa MI 6482 11 [I FUd g.8 d.m.nd chuw Rm 6014 11 [I H ~ t ~ o n C u r t c ~ a Rm 10408 2196 11 1) W m u m hutd.m.nd MWth 40.1 11 11 U n i t d FMAHlthm 258 11 11 FWMWmonlh 187992 11 I1 I1 I] TaWllredamtlorhut 11 I1 Wuy MNVru 20 11 I1 maintenance M W 1s 11 I1 lh0rm.l M W 73 I1 11 1d.I M m 101 11 I1 m 12360 25% I1 [I Unit- FMAWthh 303 I1 11 FVMUlthlm~nth 221318 11 I1 11 (1 T a W ~ d + V u i r M . 11 11 O P r r d W a Fth -2 100% 11 I1 I1 IIIYYY I IIIIIIII~II ~IIJIIII~Y IIIINIIIIBII 111 1111111111 I 1~111111111 I I 1 I I I I IYIIYII I IIIIIIII~I I 11

11 BREAK-FEN #)INT I I 11 1111111 -111191 1 1 11 actual marltot 1 I 11 c d price I 1 11 En.rgychug0 WQJ 276 1 2 1 1 11 Domandchugo FTIMWIhh 303 146 1 1 I1 1 1 I] Mulm~ritDommd MWth 41 I 1 11 Bmk+mnpdnt QJ/h 47 1 1 11 1 1 IJ Cumtdunmd QJh 102 I I 11 ~ol l t mugln ~m 7616 I I I1 WQJ 74 I I 11 1 I IlIlllIll 1 lII11I1111111111 1131111111111131 1111111111111111 11111 111Il11111111111 1 llllIlllIl1lllll I 1 I IllI11l1I 1 IUUUlIUUUl UlllllllllllIll lUlllllllllIlll 11111 llllllllllllllll 1 lll11lllllI11111 1 1 I I I I 1 11llI1I1lIl 1 IIlllIlllIl 1 11 11 I1 fl ENERGY PURCHASE PRICES 11 11 1111111 11 1111111 1 11 11 hlol bdkr elm. 11 I1 gao krdwator onorgy I1 11 W Q J RA fllkwh 11 I1 I1 1) Puk hour0 la-21 h 264 36.6 3.8 11 [J Day-1Ul la-22h 284 36.6 3.8 11 11 N b h t m 264 36.6 2.6 11 I1 11 11 d . Y f Y m W 284 36.6 3.23 11 I1 11 11 k W W t h kFfIMWa MWo 11 [I monthly -and chug. 11 11 ~~ 83.06 fM 2.6 11 [I baak-up 11 82.4 11 I1 11 IIIIIIIII I I N ~ H W U I nnn~nr~ I ~ Y ~ Y Y U Y I 111 InnN11wn1 I IIIIII~IIWYUI I 1 I I I I I I I I I I ~ ~ I I I 11111111111 1 11
INYYW I 111111111 lnnnnn 111111111 111 rnnnn~ I I n n n I n n w I I I I I I I I U ~ N U H I IIIIIIIIIII I 11 I1 11 11 ENERdY W N Q PACES 11 I1 - u n11-1= n ~ n I1 I1 rko. roturnod I1 11 awn mugy condonuto 11 I1 ~ H Y wdl Frikwh m 11 11 11 I1 [I PwlrhawrlUI-31h 3 412 4.6 40 11 11 myat-1chiah-m 15 41 P 2.7 40 11 11 Nlg)11- 8 412 2 40 11 I1 11 11 m W . m g Y m 412 2 . 8 40.06 11 I1 I1 11 kRlMURh 11 I1 -ydrmmdohug, 106 I1 I1 11 I I I ~ I 1nnm111 1111nn11 l n n n n l rn rrrrrrrrl I r r w w r r r r l I I I r I I I rttrrrn r lrllntinl I 11
noto 1: t h r n i r r ~ k r m y o u l J d . o l l m ( w h o ~ r n o t mum amdon- to B u a a

CHARACTERISTIC8 OF FLUIDS -- - -------- -- -- -- -- -
, . a . . . . . : uturated : laentropic Equlp : : No : : : : actual : condltlon : letdown ID No : LIBELLE DES PARAMETRES unltr : Inotrum. : : : : value : vapor : Ilquid : 1 : 2 :
: 36BSTEAM prouurr b u 9 tomporaturr C .n*.lpy thn h u t content 11 a JR
: 158 STEAM AT BOILER PLANT preseure bar g lemperature C onthrlpy thR
: 15B STEAM A7 THE USER POINT pronur. b u 9 trmporaturo C .nm.lpy thn h u t cmtmt 11 QJR
: 88 STEAM prouur* b.r 9 tomprtaturo C amdPY tM h u t m t m t 11 QJR
: 4.68 8TEAM AT T HE BOILER PUNT prowur* b u g tomprr.(uro C .~M.~PY thn
: 4.68 STEAM AT THE USER POINT pronure b u g tompu.tur0 C .nWPY m h u t cartent 11 QJR
: 1.OB STEAM p r o u r * bug tompurtun C WlhrJPY tM h a m t m l 11 QJR
: BOILERS 8YUM DRUM prourre b u g tompurhrr* C
thR : DUERATED FEEDWATER
m n b u g wnpurhrn C -PY thR w diadvad d ld PPm
: CONDEN8ATE RENRN pnun h a tempamtun C ~ P Y IM h a omtent 11 QJR
noto 1: h a I contmt ol U.m In bJ lo bawd on th. taW mthalpy d aturn

CHARACTER18TIC8 OF FLUIDS -- -- - -------- - -- - I- - . . . . . . . . : orturated : loentraplo . . . Equlp : : No . . . : actual : condlllon : letdown ID No : LIBELLE DEB PARAMETRES unlte : indrum. : : : : value : vapor : Ilquid : 1 : 2 : ~p . . , . . . . . . . . . : DEMINERMISED WATER . . . .
. . . . prruure brrg : . . , . temperature enulalpy
: AMBIANTAIR preowre
. . , . . . . . . . . . b u g : . . , .
FUEL GAS
-- -- - - ~
. . a . . . , . . . . . Equlp : : No . . . . ID No : LIBELLE DE8 PARAMETRES unite : inuum. : : : : Valaur :
9bvd Wvd Wvd Wvd Wvd Wvd Wvd Wvd PIvd 9bvd

BOILER HEAT BALANCE - - A -- -- - - 8 -- ---
. . . a . . * a
Equlp : : No , , # , , . . ,
ID No : LIBELLE DEB PARAMFTRES unltr : Inotrum. : : : : In : out : In : out : in : out : - ------ --- . a , . , , . , , . : BOILER 1 . # ,
. , a
, # , . . . : 20 , a 8 . . # : 33 . , . . . , : 41 , , , . . , : 386 , . . , . . : 780.8 . . , a , , : 7 , . ,
, .
: Mulmum dorm rr lwd : Strrrn prowurr
tnl bar g bar g C thR Vh
: HP a r rm cnthrlpy : Mlnlmum &cam rr lwd
BASIC DATA - I cST
: Sterm now : Furl gar now . Economlwr : Focdwrtrr ddr : Trmpmrrture : flomrtr : Rurgr rddo : Trmpmrrlure
: motor : : motor N.O. :
lnl thh
: meter :
: 174.8 :
28 : 70 : 5.973 : 18.06 :
: 10.83 : 257.3 :
: 131 : 174.8 : 47.43 : 36.53 :
: 0.8 : : nla : : 44 : : 20.89 : : 21.12 : : 0.271 :
: Trmpmrrture : enthrlpy : combucllm r l r law : hrr t rxchmgod : Fluegar dde : Trmporrture meawrod
: to(rl mxoew df : t d r l d r law : lluagrrllowr : l w gar rprclk h u t : C02 : mbuc l lon excau r l r : Blawdarm toW dl- d i d : Blawdarm rate 11 : Othw w r t u l ~ ~ low : Fixadhaatlow : Blawdorm mthdpy
note 1: m m l a d mry 4 hour@ by lab.

OOlLGR8 H W T BALANCe (WNT.) -- - --- --- --- - . -- ---
equip : plant ID No : LlOELLE DEO PAAAMFTRPQ 14nlte inMr~tm. - . - - ...................... - - - ................ , . . . .
. . . . . .
. . . : VARIATION OF TOTAL EXCEQO AIR , . .
. . . : Threhdd . . .
: Low pdnt : rtumIlauf : a o e u r l r
. , . , . .
VARIATION 01: STACK CIA? TEMPEIIATUFIE
: temperature : Lower pdnt
: H M T BALANCE EQUATION : Cl(x4*a+wygtO+Xl*Ek.TFg(X2+X3'EA))
xo X l x2 X3 Xc) W
. . a
. a . . . . : EQUATION FUEL GAGISTEAM FLOW . . .
. . . : hrdwatu llaw tnl . a . . . . : Told r x ~ w rlr U 96 . . . : Ur h a t o tnl : 8lroktmpwelurr TF C : Fudgar C tOWll :
NmWh : : Fwl gar lod PI : Qar to awn ratlo ,th&
C i JR : EMokncy on LHV Ui
: if1 : 0411 : 111 : O l l t Ill : O l l t

BOILERS CONTINUOUS BLOWDOWN
. . a . . . . . . . . . : No . . . . ~ n l t : indrum. : : : : In : out :
- - -- - -------- -- - . . . . . . . . . . . . : UquM . . . . : flowrate Uh : : : : 0.882 : 0.810 :
96 uurncr : . , . . . . . . : 71.86 : : rnU1rlpy thR . . . . : : 256.7 : 105 : : flash arm . . a . . . . . . . . . : pnuure b u g : . . . . : 0.2 : : taW d l u o b d rdld PPm . . a .
. . a . . . . . . . . . : Uomate Uh : 0.242 : . . . . 46 flash : . . . . : 28.13 : . . . . enthelpy thn . . . : 840.8 .
STEAM LEIDOWN - - - -- -
. . a .
. . a .
Eql~ip : : No . . . . m e . .
ID No : IT EM unit : inrtrurn. : : : : In : out : - - - -------- -- - . . . . . . . . . . . . : 36WlW . . . . . . . . : a m . . . . . . . : ( Iwrte ~h . : 1 . 8 ~ : 2 : . . . . . . . . : tmp@rahrre C
: mthdpy thn : : : : 7m.3 : 709.6 : . . . . : DmupuhuUng water . . . . : h a t e tm : : : : 0,151 : . . . . . . 96 : 8.180 :
: m w p y : lW4.5B : awn : (lam-
: tm,pu.pun : m w p y . . . . . . . . . . . MI . : 0.063 :
96 : : : : 5.823 : thn : : : : 100:

Equip : ID No : ITEM
. . . . : No . . a .
unit : InWum. : : : : In : out :
: tomporaturo : onthalpy
. . . .
. . a . . . . tnl . . . : 4.080 : 4.2 :
: Dawporhutlng watrr . , a . . . . . : nowrate tnl : : : :O:l18:
'46 : : : : 2.924 : : enthalpy thR : 1 0 0 :
WATER BAUNCE - - - -------- -- - . . . . . . . . . . . . Equip : : No . . , . ID No : ITEM unit : lnrhum. : : : : In : out :
-
: watu l o u r 8
: r m d b h d a r m : low3sb : k.drratu turbopump : h r r l m k d l : othu Wlor houw
: bdkrr low : Towlow : S t a m to proccu planVaxport : 15buoUll : Obu.un : 4.5buoun : l.8b u a m : condu~wtr return
: : : : . . . . - 9 . . . . . . tnl . . . . : 0.618 :
tnl . . a . . . . . : 0.5 : . . . . tnl . . . . : 0.6 : . . . . tnl . . . . : 0.2 : . . . . tnl . . . . : 0.8 : . . . . Vh . . . . : 0.1 : . . . . tnl . . . . : 0 :
tnl
tnl tnl Vh Vh tnl
: d.minudid watr tor R tnl : : : : 3 3 . 1 1 : . . . . . . . . . . . . : wuu trmbrmt b.l.nc. . . . . . . . . : deminudiodwuer Vh . . . . : 33.11 :
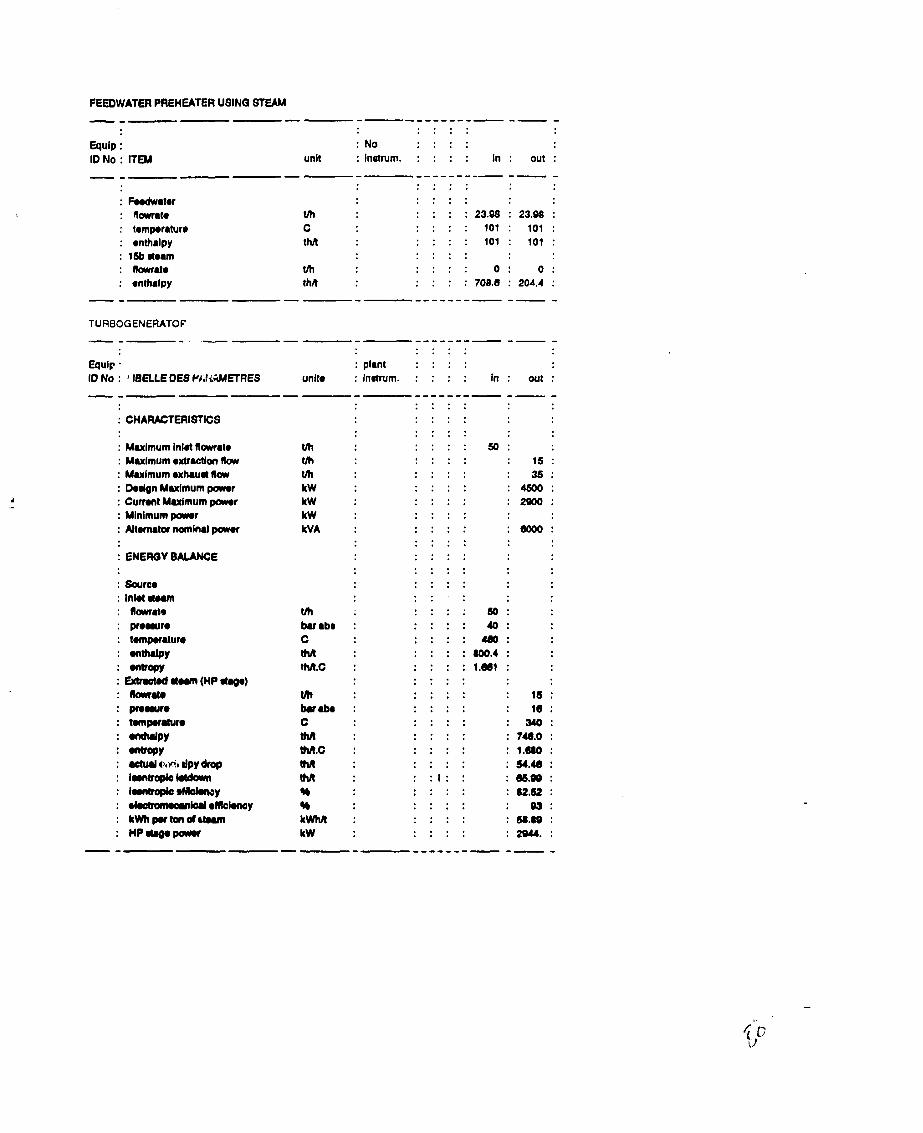
FEEDWATER PREHEATER USING STEAM
Equip : ID No : ITEM
. . . . : No . . . . unit : inotrurn. : : : : in : out :
- - - -..--------- -- - . . . . . . . . . . . . : Feodwrtrr . . . . : namrte m : : : : 23.98 : 23.08 : : lrmprrrturo C : : : : 101 : 101 : . . . . . . . . : enthrlpy thn 101 : 101 : . . . . : lf5bltr.m . . . . : nowrat* : enthrlpy
TURBOGENERATOF
Equip : plant : : : : 10 No : I IBELLE OES PJd.i44ETRES unite : inarum. : : : : in : out :
- - - - - - -
: CHARACTERISTICS
: Maximum inlot (lomrlr : Maximum axtraction low : Maximum rxhruu llowr : B d g n Mufmum uowar : C u m t Mdmum p a n r : Minimum pawrr : AHunrtor nominal p a n r
: Sour- : Ink( uoun : lomrt. : prewure : tomporrtun : rcrthdpy : wtropy : Exbdrd U w n (HP Urge) : (lamate : p n r u r e : tempurtun : -PY : .nbooY : mtud csrit llpy drw : i a n ~ k ( d a * m
: im(rapb-y : . ( r a b o m r o u l M e m o h y : kwhprrt0ndrk.m : H P U g . p a m
th b u r b r C thn tM.c thn tM W W k W kW

TURBOQENERATOR
Equip : : plant : : : : ID No : LIBELLE DEB PARAMETRES unitr : Inrtrum. : : : : in : out :
. . . . : Exhauu uram (LP drgm) . . . . . . . . : namrrm Vh . . . . : 3s: : prmuurr : twnpraturr : rnthrlpy : rnbapy
buabr : . . a . . . . . : 6.5 : . . . . C . . . . : 230 : . . . . tM . . . . : 6G6.7 : . . . . thR.C : . . . . : 1.706 : . . . . : whrd rnthaipy drop tM . . . . : 49.33 : . . . . : iwnrropic lofdawn thR . . . . : 62.03 : . . . . : isentropic efficiency % . . . . : 79.52 : . . . . : eleclromecrnical efficiency % . . . . : 93 : . . . . : kwh por ton of dram kWhR : . . . . : 53.34 : . . . . : LP urge power k W . . . . : 1867. :
TURBOQENERATOR (CONT'D) - - - -------- -- - . . . . . . . . Equip : : plant : : : : ID No : LlBELLE DE8 PARAMETRES unlta : inatrum. : : : : in : out :
: HP+LP(Llgll : rchrd mthdpy drop : kWh p u ton d l t r rm
: STEAM FLOWMWER EQUATION
: High prmrrurm urge : pomr luoa rn~ ra t i o kwhn : : nobadlow 9t m u . n :
kwh : inanmrnwpamr kHmR :
: 59.88 : : 18.92 : : d o : : 70.W :
. . a . . . . . . . a . . . . . . . . . k W M : . . . . : 53.34 : . . . . # m u . n : . . . . : 21.12 : . . . . kwh . . a . : m : . . . . kwhn : . . . . : 67.03 : . . . . . . . .
: No load IaaccrmCknt kwh . . . . . . a . : 1100 :

CORRECTION OF THE EQUATION STEAM FLOWIPOWER IN FUNCTION OF INLET ENTHMPY - - - -------- -- - . . . .
. . a .
Equip : : plant : : : : ID No : PARAMETERS unite : indrum. : : : : Demign : Actual : - - - ..- - -------- -- - . . . . . . . . . . . . : H!QH PRESSURE STAQE . . . .
: prerrre b a b e : : : : : 40: 3 4 : : temperature : 10.cillcgraviIy : anthrlpy : e~tropy : prerrrre matraction
. . . . temperature extraction C . 340 : 283 .
enthelpy extractton thR : : I : : 748.0 : 724.5 : : actual enthalpy drop IhR : : : : 54.48 : 33.8 : . . . : iontropic letdown t M : 65.88: 52 : . . . . . . : imtroplc elllr.iency 96 . . : 82.52 : 65 : : nolodlow 96 . . a : 16.92 : 18.92 : . . . . . . . : pawrr wrraction corHlcimnt . 1:0.020: : awrg.powmr kWhR : . . . . : : 9.89 : 30.55 : : muglnalpomr k W M : . . . . : : 70.89 : 43.98 : : nolordlow kWh : : : : 800 : 372.3 :
LOW PRESSURE STAQE pnmn tomprature . n thdP~ .nbopY p r r r r r e extraction t.mp.rrture extraction .nth.lpy extrruon r W rnthrlpy drop Imtropic kldom,
11 b u abm C UIR 1M.C b u abm C UIR m m
: TQ EQUATION : HPUg.corMcknt : LPUg.carmcht : CQImtMt : audliuymaYrm : tcaactodIwm : Erh.url#un : awratodparrr
not@ 1 : 2 wh.rlr w e rmKmd on the law prmuun a g e

AUXILIARY TURBINES - - - ---------- - . . . . . a , .
Equip : : plant : : : : ID No : PARAMRERS unite : inotrurn. : : : : in : out : - - - -------- -- - . . . . . . . . . . . . : YEAST AIR COMPRESSOR . . . .
: number In operation : lord : Stemqudlty : muimum llaw : minlmum (law
: F : oquaUon
proportional coefficient . constant : #term now . . . . . . . . : m.ccmiulpawar k W : 106 : . . . . . . . .
. . . . : FEEDWATER TURBOPUMP . . . . : numbw in og.rrtlon : : : : 0 : : u e m qurlity : muimum (law
: minimum Row : parm

AUXILIARY MOTORS
Equip : ID No : PARAMRERS
: plant : : : : unltr : inetrum. : : : : Valuo :
- - - -------- - . . . . . . . . . . . . : FEEDWATER MOTORPUMPS . . . . : numbor of motorpumpr : number in oprrrtion : nominal llowrrtr m3h : : trmporrturr C : drnrity : h u d m : ~Hiciencv 9b
nornlra :ewer kW : powerlflow equation W= f(QW) : constant : propoctionnal cool. : quadrrtk cool. : 1 ~ r t u l l o w r . t r : foodwrtr to bdlrrr : drwporhrrling wrtrr : Ioldawn366/1~ : ktdawnl6%J4.W : tow : k rdwr tu Raw por pump : pamrP.rPumP : toW rkcbic powor
: BOILER FANS : n u r n k r d h n r : nominal pamr por boilor : nominal dumllaw : ~ I u a l H r r m l l a w : mochmiul poworon &rR : to ( . l~b lcpawrr

AUXILIMIY MOTORS - -
Equip : ID No : PARAMmERS
. . . . . . a .
: plant : : : : unite : indrum. : : : : Value :
- - -- - -------- - . . . . . . . . . . . . : MAKE-UP FEEDWATER . . . . : nomkr : : : : 1 : : nominal nowrate QV m3h : : : : : 8 0 : : temporahrre C : : : : 1 0 : : dandly : : : : 1 : . . . . : h a d mWG : . . . 8 0 : : efkiency w : : : : 0 . 0 8 : : nominal powor W kW : : : : 25.64 :
powerlflow equation W = ffQW) conutant
: proportionnal cool. : quadratic cool. : make-up water flaw : ekctkrpawnr
: OTHER AUXILIARIES : lightinglbrttery chuging : miwliuuaur
: TOTAL AUXIUARIES
-- - -------- --- . . . . . . . . Equip : : plant : : : : ID No : PARAMETERS unite : i n m m . : : : : in : out :
: u l c u ~ ( k n a t m : m w Y
: MAKE-UP WATER PREHEAtlNa :F..dmslldd8 : IkmY : ~ p w r h m :8krrdorm : lkrn*
tRl tha

Equlp : ID NO : PARAMETERS
. . . . . . . . : plant : : : :
unlto : Inotrum. : : : : In : w t :
: FEEDWATER INLET DEAERATOR : Mrho-upwrtor Vh
enthrlpy thR : condrnutr lSb Itormlfoedwrtor pro Vh
rnthrlpy t M : blowdown R r l h urnm Vh
rnthrlpy thR : condonutr return Vh
enthalpy thR : Water lnlet deaorator : flaw~rlr Vh : rnthalpy thR
1.8B STEAM BAUNCE - - - ----------- . . . . . . . . Equip : : plant : : : : ID No : PARAMETERS unltr : indrum. : : : : In : out : - - - - - - - . --- -- - . . . .
. , . a
: turbo drcomprruor rxhrud tm : : : : 5 . 8 : : l d d m 4.Wl .8b Ilh : : : : 4 . 2 : : <<== : l.8b I tmm drmrnd Vh . . . . . . , . : 10 : : Itmm wnt tm . . . a
. . , . : 0 :
4 . a STEAM BALANCE - - - -------- --- . . . . . . . . Equip : : plant : : : : ID No : PARAMnERS unit* : indrum. : : : : In : out :
: d.ur.tor : I w l d l t m k : 0th.r bdk rha rw : not 4.m @urn mmilablr : t o e u d r d a : to Hungarian wino : to plp.r all : t o P a r ~ b o d : to buiMlngm W n g
. . . . . . . . . . . . . . . . . . . . . . . . : rnotrr : : : : . . . . . . . . . . . . . . . . : rnrtrr : : : : : mrtmr : : : : . . . . . . , .
: to in plant p m a r urn Ih : mrtrr : : : : : 12.08 : mini maxi . . . . : drrhkh 4.Wl.8 Idarm Ilh . . , . : 4.080 : W@ dlaillrry 0lh.r urn

98 STEAM BALANCE
Equip : ID No : PARAMETERS
a * . . . a , .
: plant : : : : unlto : Inatrum. : : : : In : out :
- --- - ----------- . . . , . . : 1- Iddown valvo tm . . . . . , . . 1 : . . . . : dry paat Vh . . . . : 1 :
1- STEAM BALANCE - - - -------- -- -
. , . a a , . .
Equlp : : plant : : : ID No ' PARAMETERS unito : instrum. , , : In ' out :
: TQ rrtraollon : W l 5 b lr ldom valve : to h.dwrtrr prrhrrtor : to Bud.cdor : to l W 4 . B Iddown valw : n d l5b atrun available : of whlch to l6b/Db valve
to lWl.Ob turbine I0 dhu u w
: meter
: meter : meter : meter
368 STEAM BAUNCE
Equlp : ID No : PARAMETERS
: plant : : : : unite : inatrum. : : : : In : out :
: Slrrm to TQ : of whkh oxlr.ction : exhrurl : exh. loam : 3W/l6bktdarmvdva : hrdwur turbopump : lowrr : TaWHPUrun
: atom gowud
: mrter : : : : : 40.20 : . . . . . . . . : 10.74 : . . . . . . . . : 29.02 : . . . . . . , . : 0.6 :

ELECTRICITY BALANCE - - - -------- -- - . . . ,
. . a .
Equip : : plant : : : : ID No : PARAMETER8 unlte : inatrum. : : : : In : out :
: auxlllrrler conoumptlon kW . . . . : 494.3 : . . , . . . . . . . . .
: Procru plant powor demand kW . . . . : 2000 : . . . . . . . . , . , .
: Purchawd power kW . . . . : : 707.9 : : Sold pamr kW . . . . : 0 : . . . .

MACRO
\b (orlcul)
'- .It m Macro dm orlcul do8 cwta marglnaux CI 137.2804 WI 207.0482 WJ 0 fll 33.11080
\m (let CI,C:value) .u (let WI,ViN:vnluo) .u
(let WJ.WX:vrluo) - (Id RI,R:valua) (lot E,E+l:vrlue) .u
(orlcul) (let HPC.(C-CI):vrlua) - (I.( HPW,WN-WI:vrlua) .u
(1.1 HPX.-WX+WJ:vrlue) ., (lot HPR.R-RI:vrlue) - (let E.F-1:vrlue) - (lot F,F+l:vrlue) - (cdcul) (id MPC,(C-CI):vnlus) - (1.1 MPW,WN-WI:vrlua) - (I.( MPX-WX*WJ:wlue} .u
(I.( MPR,RRI:vrlue) - (I.( F,F-1:vrlue) - (I.( Q,Q+l:vrlu.) ," (alaul) (I.( BPC,(C-CI):VIIU@} N (lot BPW .YN-WI:vrlue) - (kt BPX.-WX+WJ:Wue) - (Iu 8PR.R-RI:wIur) w
(kt Q,Q-1:nlue) - (lot H,H+l:vdue)- (CrJCul) (lot tBPC,(C-CI)xalue) - (kc fBPW.WN-WI.Wu@) - (kc fBPX-WX+WJxalu@) (kc fBrn,Rdl~w) - (M H.LI-~MIw) - (k( WNb.C0ND+lO~r lur ) - (OJaul) (M CONDC,(CCl~lOnnlue) w
(M WNDW,(WN-Wl)/lOnnlurJ .u
(W CONOX.(-WX+W@lOnnlw) .u
(104 CONDR,(R-R~~~ON~U@) - (kc COND,COND-1O:value) - ( U u l )
Stockago vnlour combultlblo Stockago valour oloctricita
Stockage valeur eau domino
] Sauvogarde ) desvaleura
1 initlalea +1 Uh our la HP
1 Afflchrgo cwta 1 mrrginrux de Ir
+1 Uh our Ir MP
1 Affichago cwta 1 mrrglnrux do Ir
1 Affichage ooutr 1 mrrglnrux de la

orloul (kt BPHP,P:vrluo) - (kt ECHMAX,ECHAPMAX:vrlua) I. (bf lQ,l,3,l4BQ) Erl~rlllbrago du hllrn vapour
tact1 (If dm@mmu+. l ) (hrrnoh tust3) * Tost rdml88lon QTA (lot ECHMAX,ECHMAXdADM-A3MMAx):vaIuo) - (far I0,1,2,1,BO) (brmoh Iaotl) Raoqulllbrngo du bllan vapour
rant2 (If BPHPd.OIOWodm>-sdmmuc-. 1) (brrnoh 10813) I. Opllmlcatlon blparao GTAI admlaclon (I.( BPHP,QPHP-@msx((rdmmnw-rdm)'.O1,.06):valuo) .u admltalon non nnt~~rdo, tlbtonlo ouvorto (lut BPHP,@muc(BPHP,2):vrlue) I. (brrnoh teatl) -
tart3 (for l~1,1,3,1,~0) (RETURN) Alflnago do la aonvorgo,ioo
BQ ( f r IZ,l,3,1,l$Z) (let QE.QC:vrIua) N
€32 (lot ZP.ZC,V~IIJ~) .U
'-- .It n Mroro dm geulon du progrrmmo par monu M ~ r o en odlula M I 0 3 0
\n (MENUCALL Manup) (BRANCH \n)
I Douoloo do oonvorgenao du bllnn vnpour
I
Monup
(
MAJPA (
cmonu
IMP (

ENT 707.25OO Rylrerrlon Output: 770.1 167 ConMan4 MO.607O
'747.8336 @d Err of Y El( 0.281 128 742 12 R .?-!lrrrnd 0 QQP005
730 3.1 No 1 1 Ob~ervat~orla 5
Dogroor of Freedom 3
X C~ffloiml(8) 0.663220 8td Err of Coal. 0,003104

ini t idin Sol* Sw result Mrrglnal c Print Slw Quit l~i i t i r i iui io Convorgrn Vdr irr re Cricul d r r lmprerdo Sluwgard netour r n mode READY 123 {HOME) {GOTOJc {QOTO)rr (G0TO)c (IMP) {HOME} {QUIT) {QUIT) {BRANCH (QUIT! {BRINCH \m) IFS- R
MENUDRANCH unmul )
Bdierr Water T u b g e n r T urbinrr Motorr Bdmcer Quit CnracterlU Water Luir Caroctclrllt T~rrbiner r MMrurr Biirnr vrp iklwr r u menu principal { a o r o ) ~ (aoro)~ (acTo)gt ( a o ~ o ) t u {QOTO)m (QOT0)bilmr- {QUIT) {QUIT) {QUIT) {QUIT) {QUIT) (QUiT)
All Quit Impredo War r u menu prlncipd lPpr Al.YlZ06- 94
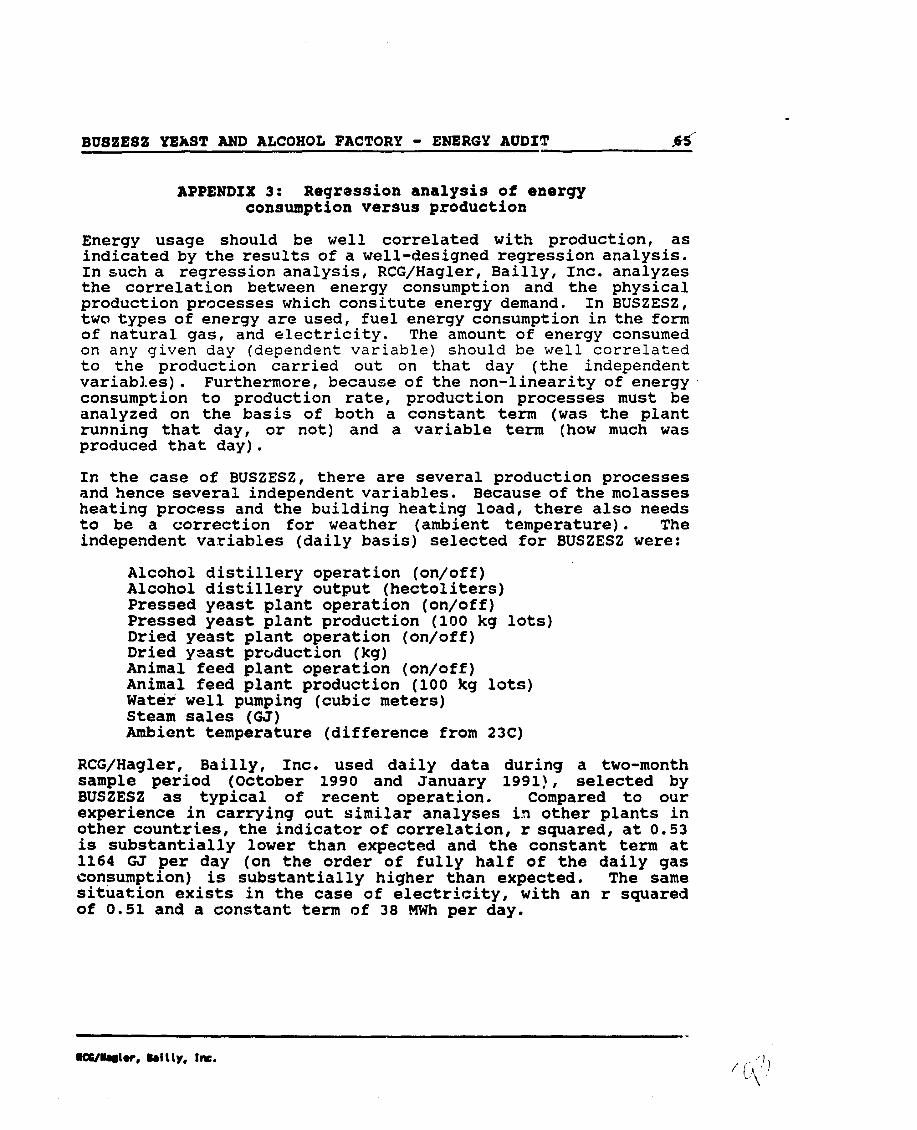
BU82E82 YEAST AND ALCOHOL FACTORY - ENERGY AUDIT 6. - APPENDIX 3: Regression analysis of energy
consumption versus production
Energy usage should be well correlated with production, as indicated by the results of a well-designed regression analysis. In such a regression analysis, RCG/Hagler, Bailly, Inc. analyzes the correlation between energy consumption and the physical production processes which consitute energy demand. In BUSZESZ, two types of energy are used, fuel energy consumption in the form of natural gas, and electricity. The amount of energy consumed on any given day (dependent variable) should be well correlated to the production carried out on that day (the independent variables) . Furthermore, because of the non-linearity of energy consumption to production rate, production processes must be analyzed on the basis of both a constant term (was the plant running that day, or not) and a variable term (how much was produced that day).
In the case of BUSZESZ, there are several production processes and hence several independent variables. Because of the molasses heating process and the building heating load, there also needs to be a correction for weather (ambient temperature). The independent variables (daily basis) selected for BUSZESZ were:
Alcohol distillery operation (on/off) Alcohol distillery output (hectoliters) Pressed yeast plant operation (on/off) Pressed yeast plant production (100 kg lots) Dried yeast plant operation (on/off) Dried yzast production (kg) Animal feed plant operation (on/off) Animal feed plant production (100 kg lots) Water well pumping (cubic meters) Steam sales (GJ) Ambient temperature (difference from 23C)
RCG/Hagler, Bailly, Inc. used daily data during a two-month sample period (October 1990 and January 1991!, selected by BUSZESZ as typical of recent operation. Compared to our experience in carrying out similar analyses in other plants in other countries, the indicator of correlation, r squared, at 0.53 is substantially lower than expected and the constant term at 1164 GJ per day (on the order of fully half of the daily gas consumption) is substantially higher than expected. The same situation exists in the case of electricity, with an r squared of 0.51 and a constant term of 38 MWh per day.

BUSZESS YEAST AND ALCOHOL FACTORY - ENERGY AUDIT 66
This analysis indicates that (1) energy consumption is highly variable for any given level of production, and (2) energy consumption at BUSZESZ more closely approximates a fixed cost than a variable cost.
The details of the results of the regression are shown below.
Gas Regression Output: Constant 1164 GJ/day Std Err of Y Est 3 3 3 R Squaced 0.53 No. of Observations 62 Degrees of Freedom 51
Electric Regression Output: ' . Constant 38 MWh/day Std Err of Y Est 12 R Squared 0.51 No. of Observations 62 Degrees of Freedom 51
In the short-term, such as on a daily basis, the plant operates as an "open loop1' control system. The vast quantity of data that is collected is not organized, analyzed and presented to management on a daily basis. For example, performance ratios such as energy per unit of production are not developed on a daily basis, although they could be calculated from the available meters and data collected. Because management does not have a good picture of how well the process is running on a daily basis, management cannot exert short-run control actions which would improve efficiency. By the time management receives the monthly report, it is too late to exercise the control function. Thus the plant runs open-loop against a reference value, the production target. This open-loop situation is also in use not only for energy, but also for other important parameters, such as raw material and generation of scrap or low quality material. The only parameter which is under closed-loop management control on a daily basis is production quantity of alcohol and yeast.
RCG/Hagler, Bailly, Inc. believes that the use of the open-loop system accounts for the increased variability in energy consumption and the high constant energy consumption observed in the regression analysis.