energy-efficiency and renewable energy options for risk management
TRANSCRIPT
LBNL-41432
Energy-Efficiency and Renewable Energy Options
For Risk Management and Insurance Loss Reduction:
An Inventory of Technologies, Research Capabilities, and Research
Facilities at the U.S. Department of Energy’s National Laboratories
Edward Vine, Evan Mills, and Allan Chen
Environmental Energy Technologies DivisionErnest Orlando Lawrence Berkeley National Laboratory
Berkeley, CA 94720 USA
August 1998
This work was supported by the Assistant Secretary for Energy Efficiency andRenewable Energy of the U.S. Department of Energy under Contract No. DE-AC03-76SF00098.

ii
Table of Contents
Acronyms and Abbreviations............................................................................................. v
Executive Summary............................................................................................................. vi
Chapter 1. Introduction .........................................................................................................1
1.1. Objectives of Report .........................................................................................................1
1.2. Research Methodology.....................................................................................................2
1.3. Organization of Report.....................................................................................................4
Chapter 2. Energy-Efficiency and Renewable Energy Technologies.............................6
2.1. Avoided Insurance Losses..................................................................................................6
2.1.1. Boiler and machinery risk .................................................................................... 10
2.1.2. Builder’s risk ....................................................................................................... 11
2.1.3. Business interruption coverage .............................................................................. 12
2.1.4. Commercial property insurance............................................................................. 12
2.1.5. Completed operations liability ............................................................................ 13
2.1.6. Comprehensive general liability.......................................................................... 14
2.1.7. Contractors liability ............................................................................................ 14
2.1.8. Environmental liability ....................................................................................... 15
2.1.9. Health/life insurance (commercial)...................................................................... 16
2.1.10. Product liability................................................................................................. 16
2.1.11. Professional liability ......................................................................................... 17
2.1.12. Service interruption coverage.............................................................................. 17
2.1.13. Workers compensation ........................................................................................ 18
2.1.14. Health/life insurance (residential) and personal liability .................................. 19
2.1.15. Homeowners insurance ........................................................................................ 20
2.1.16. Summary............................................................................................................ 20
2.2. Inventory Overview....................................................................................................... 21
2.3. Research Facilities at the National Laboratories ........................................................... 36
2.4. Developing a National Insurance Loss Reduction and Risk Management
Research Agenda for the National Laboratories ............................................................ 45
2.5. National Laboratory Collaborations with the Insurance Industry.................................... 46
2.6. Research from the Insurance Industry.............................................................................. 49
2.7. Risk Factors Associated with Energy-Efficiency and Renewable Energy Technologies....... 52

iii
Chapter 3. The Insurance Value of Energy-Efficient and RenewableEnergy Technologies ........................................................................................54
Chapter 4. Next Steps in Supporting Research Efforts..................................................60
Acknowledgments.................................................................................................................63
References................................................................................................................................64
Technical Appendices (bound under separate cover)
Appendix A. Survey Questionnaire and Instructions.
Appendix B. Explanations of Insurance Terms and Coverages.
Appendix C. National Laboratory Projects.
i v
List of Tables
Table ES-1. Frequency of Loss-Prevention Benefits for Energy-Efficiency andRenewable Energy Technologies and Strategies .............................................vii
Table 1. National Laboratories in Insurance Inventory ..................................................3
Table 2. Insurance Terms and Coverage.............................................................................7
Table 3. Physical Perils and Insurance Coverage Addressed by Energy-Efficiencyand Renewable Energy Technologies and Strategies ........................................8
Table 4. Overview of Lab Projects and Avoided Insurance Losses .............................22
Table 5. Research Facilities at the National Laboratories..............................................37
Table 6. Examples of Insured Property Losses that Can be Reduced by ProperApplication of Energy-Efficiency and Indoor-Environmental-QualityTechnologies and Practices ......................................................................................55
Table 7. Examples of Insured Health and Life Losses that Can be Reducedby ProperApplication of Energy-Efficiency and Indoor-Environmental-Quality Technologies and Practices........................................................................ 58

v
Acronyms and Abbreviations
ANL Argonne National LaboratoryBI Business InterruptionBM Boiler and MachineryBNL Brookhaven National LaboratoryB R Builder’s RiskCGL Comprehensive General LiabilityCLC Contractors Liability CoverageCO Completed OperationsCPI Commercial Property InsuranceCRADA Cooperative Research and Development AgreementDOE U.S. Department of EnergyEL Environmental LiabilityEPA U.S. Environmental Protection AgencyGIS Geographic Information SystemH Health/LifeHO HomeownersIBHS Institute for Business and Home SafetyIPMVP International Performance Measurement and Verification
ProtocolsINEEL Idaho National Engineering and Environmental LaboratoryLBNL Lawrence Berkeley National LaboratoryLiab Third-party liabilityLLNL Lawrence Livermore National LaboratoryNREL National Renewable Energy LaboratoryORNL Oak Ridge National LaboratoryPD Property DamagePFL Professional LiabilityPI Personal InjuryPL Personal LinePLC Product Liability CoveragePNNL Pacific Northwest National LaboratoryPV PhotovoltaicRI Refrigeration InsuranceRICOWI Roofing Industry Committee on Wind IssuesSI Service InterruptionSNL Sandia National LaboratoriesWC Workers Compensation

v i
Executive Summary
The promotion of technologies and services for insurance loss reduction and lossprevention is as old as the fields of insurance and risk management. This reportaddresses a new category of risk management opportunity involving technologiesand procedures that use energy more efficiently or supply renewable energy. Whilethe economic benefits of these measures are of interest to energy consumers seekingto reduce their energy expenditures, we have found that they also offer a novel andlargely untapped pathway for achieving traditional risk management objectives.
Most of the technologies described in this report were supported by government-sponsored RD&D programs over many years of effort. These technologies havemany benefits, including insurance loss reduction and prevention. The insuranceand risk management communities could take advantage of these technologies,either independently or in cost-sharing partnerships with existing R&D programs.
In this report, we present a compilation of energy-efficiency and renewable energyprojects (e.g., energy-efficient halogen torchiere replacements) and techniques (e.g.,infrared cameras to detect fire hazards) that are currently being investigated at theU.S. Department of Energy’s national laboratories and which the insurance and riskmanagement communities could encourage their customers to use to address theirshort-term and long-term needs. Once the loss-prevention benefits of thesetechnologies and techniques (many of which are not yet available in themarketplace) are sufficiently demonstrated, insurers can promote their use throughinformational programs and perhaps financial incentives (e.g., risk-adjustedinsurance premium schemes) through the insurance regulatory and rate-makingprocesses.
We identified 78 technologies and techniques being investigated by nine nationallaboratories which can help to reduce insurance losses and manage risks, especiallythose associated with power failures, fire and wind damage, and home or workplaceindoor air quality hazards (Table ES-1). All help to reduce insurance losses in one ormore of the following categories: boiler and machinery, builder’s risk, businessinterruption, commercial property insurance, completed operations liability,comprehensive general liability, contractors liability, environmental liability,
vii
product liability, professional liability, service interruption, workers’ compensation,health/life insurance, and homeowners insurance.
We identify examples of existing collaborations between the national laboratoriesand the insurance industry, and indicate research activities being conducted by theinsurance and risk management communities that would benefit from the work ofthe national laboratories. We also describe some of the risk factors associated withenergy-efficient and renewable energy technologies.
For the future, significant progress could be made through interdisciplinarycollaborative applied research (i.e., integrating the actuarial sciences with the“physical” or “engineering” sciences). This collaboration could be sponsored jointlyby the U.S. Department of Energy and the insurance and risk managementcommunities (as well as working through the insurance regulatory and rate-makingprocesses).

viii
Table ES-1. Physical Perils and Insurance Coverage Addressed by Energy-Efficiency
and Renewable Energy Technologies & Strategies
Number ofmeasures offering
benefit1
Physical PerilsExtreme Temperature Episodes 16Fire & Wind Damage 38Home or Workplace Indoor Air Quality Hazards 38Home or Workplace Safety Hazards 21Ice & Water Damage 17Outdoor Pollution or Other Environmental Hazard 172
Power Failures 35Theft and Burglary 6
Insurance Coverage — Commercial LinesBoiler & Machinery 15Builder’s Risk 4Business Interruption 21Commercial Property Insurance 36Completed Operations Liability 14Comprehensive General Liability 45Contractors Liability 14Environmental Liability 12Health/Life Insurance 39Product Liability 5Professional Liability 19Service Interruption 21Workers’ Compensation 35
Insurance Coverage — Personal LinesHealth/Life Insurance 35Homeowners Insurance 26
1The numbers in this column refer to unique technologies and covers all (i.e., including non-nationallaboratory) technologies in Table 4. For example, if two national laboratories are conducting researchon fuel cells, this is “counted” only once under Service Interruption in Table ES-1.
2The environmental benefits of improving the outdoor air and reducing greenhouse gases by renewableenergy resources (e.g., solar, wind, etc.) are not included in this table.
1
Chapter 1. Introduction
1.1. Objectives of Report
The promotion of technologies and services for insurance loss reduction and lossprevention is as old as the fields of insurance and risk management. Examplesinclude the early fire departments established by insurance companies, the creationof the almost century-old Underwriters Laboratories, and more than 160 years ofproperty loss prevention experience by the Factory Mutual Research Corporation.Today, automotive air bags, sophisticated security systems, fire sprinklers andalarms, and environmental monitoring equipment are familiar risk managementtechnologies promoted by insurers. In some cases, insurers are involved with thefundamental research and development of such technologies.
This report addresses a new category of risk management opportunity involvingtechnologies and procedures that use energy more efficiently or supply renewableenergy (Mills 1996; Mills 1997; Mills and Knoepfel 1997; Mills et al. 1998). While theeconomic benefits of these measures are of interest to energy consumers seeking toreduce their energy expenditures, we have found that they also offer a novel andlargely untapped pathway for achieving traditional risk management objectives. Forexample, some of the technologies discussed in our report might make a marginalrisk acceptable to insurers, given acceptable controls or monitoring: from high valuerisks where machinery and equipment monitoring devices are critical in affectingloss performance, to homes with proper monitoring equipment that can preventfires from furnaces or wood stoves.
In this report, we present a compilation of energy-efficiency and renewable energyprojects (e.g., energy-efficient halogen torchiere replacements) and techniques (e.g.,infrared cameras to detect fire hazards) that are currently being investigated at theU.S. Department of Energy’s (DOE’s) national laboratories and which the insuranceand risk management communities could encourage their customers to use toaddress their short-term and long-term needs. Once the loss-prevention benefits ofthese technologies and techniques (many of which are not yet available in themarketplace) are sufficiently demonstrated, insurers can promote their use throughinformational programs and perhaps financial incentives (e.g., risk-adjusted
2
insurance premium schemes) through the insurance regulatory and rate-makingprocesses.
The audience for this report comprises three groups: (1) the insurance and riskmanagement communities (in particular, insurers), (2) the research community atthe national laboratories and within the insurance industry, and (3) policymakers atDOE and at the U.S. Environmental Protection Agency (EPA) that are interested i nworking with the insurance and risk management communities to promote energyefficiency and renewable energy technologies. We realize that other stakeholdershave critical roles and responsibilities for reducing insurance losses (e.g., insuranceregulatory authorities, code officials, government agencies (local, state and federal),contractors, builders and tradesmen, and property owners and managers), and wehope that this entire community will become more involved in promoting thetechnologies and services described in this report.
In addition to Appendix C, these projects and techniques are also available on theWorld Wide Web at http://eetd.lbl.gov/CBS/Climate-Insurance/welcome.html,and they will be updated periodically at this site.
1.2. Research Methodology
In this report, we describe energy-efficiency and renewable energy technologies thatare primarily funded by DOE’s Office of Energy Efficiency and Renewable Energy(EERE) and that are studied at DOE’s national laboratories. As an indicator of thelevel of current activity in this field, DOE’s FY 1998 budget for energy efficiency andrenewable energy R&D is approximately $900 million. Due to resource constraints,we limited the scope of work to technologies and services that affected energy use i nthe residential and nonresidential sectors, and did not examine technologies i ndetail in other sectors (e.g., transportation and agriculture).
We first contacted EERE’s Deputy Assistant Secretaries and their staff in the Office ofBuilding Technologies and State and Community Programs, Office of UtilityTechnologies, and the Office of Industrial Technologies, and solicited the names ofprojects and researchers at the national laboratories. We then contacted the nationallaboratories (Table 1) and asked each project manager to complete a survey form ontheir project (Appendix A contains a copy of the survey form and survey
3
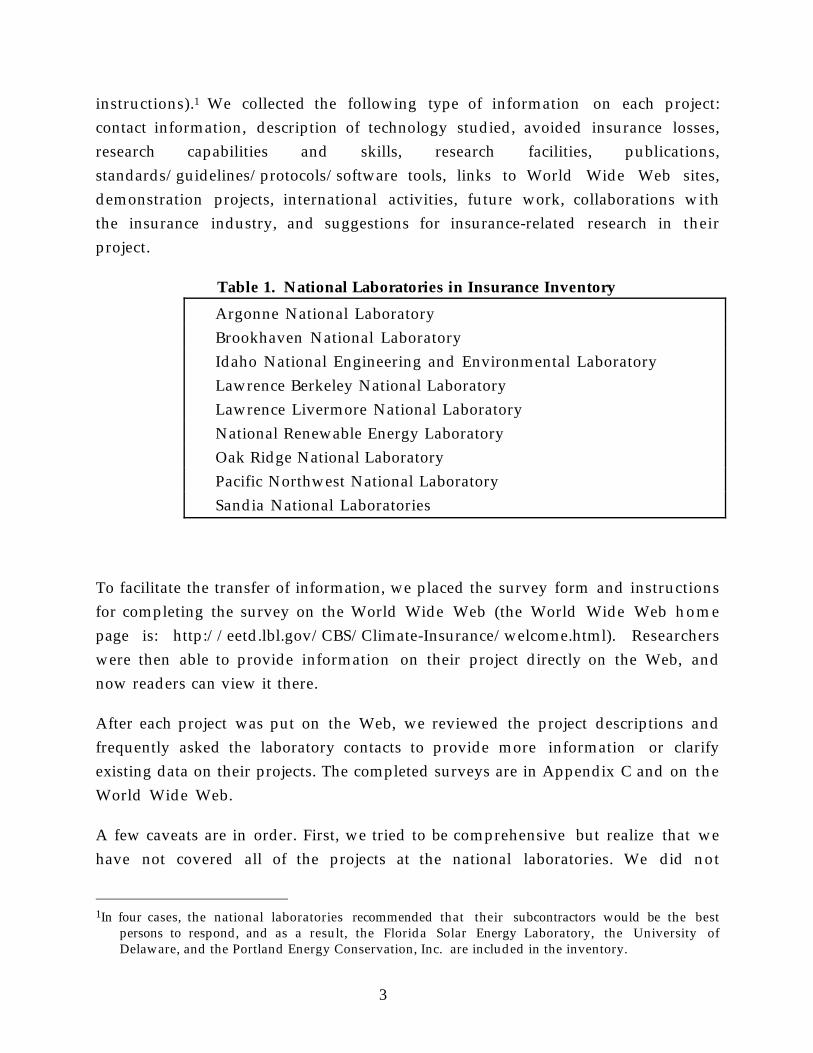
instructions).1 We collected the following type of information on each project:contact information, description of technology studied, avoided insurance losses,research capabilities and skills, research facilities, publications,standards/guidelines/protocols/software tools, links to World Wide Web sites,demonstration projects, international activities, future work, collaborations withthe insurance industry, and suggestions for insurance-related research in theirproject.
Table 1. National Laboratories in Insurance Inventory
Argonne National LaboratoryBrookhaven National LaboratoryIdaho National Engineering and Environmental LaboratoryLawrence Berkeley National LaboratoryLawrence Livermore National LaboratoryNational Renewable Energy LaboratoryOak Ridge National LaboratoryPacific Northwest National LaboratorySandia National Laboratories
To facilitate the transfer of information, we placed the survey form and instructionsfor completing the survey on the World Wide Web (the World Wide Web homepage is: http://eetd.lbl.gov/CBS/Climate-Insurance/welcome.html). Researcherswere then able to provide information on their project directly on the Web, andnow readers can view it there.
After each project was put on the Web, we reviewed the project descriptions andfrequently asked the laboratory contacts to provide more information or clarifyexisting data on their projects. The completed surveys are in Appendix C and on theWorld Wide Web.
A few caveats are in order. First, we tried to be comprehensive but realize that wehave not covered all of the projects at the national laboratories. We did not
1In four cases, the national laboratories recommended that their subcontractors would be the best
persons to respond, and as a result, the Florida Solar Energy Laboratory, the University ofDelaware, and the Portland Energy Conservation, Inc. are included in the inventory.

4
interview all of the staff at DOE (due to resource limitations), and not all of ournational laboratory contacts were able to complete the survey (due to timeconstraints and other priorities). Second, the insurance and risk managementcommunities have yet to systematically quantify the types of losses considered here.We present some examples from several countries of losses that are partly associatedwith energy-using equipment, however, potential losses need to becomprehensively identified and analyzed. Third, because the concept of avoidedinsurance losses via energy-efficiency and renewable energy technologies isrelatively new, most of the national laboratory researchers had never consideredhow their technologies would reduce insurance losses and, therefore, most analysesof insurance losses are qualitative. Fourth, due to resource limitations, we focusedour research on the residential, commercial and industrial sectors and did not lookat other sectors, such as agriculture and transportation. And fifth, we have tried tobe nonrestrictive if we thought a research project could be useful for reducinginsurance losses: we have eliminated purely speculative cases, however, muchresearch still needs to be undertaken for many products and services to illustratetheir usefulness to the insurance industry.
1.3. Organization of Report
In Chapter 2, we present an overview of the types of avoided insurance losses thatare addressed in this report. For each insurance loss, we provide examples of howenergy-efficiency and renewable energy technologies that are included in theinventory help to reduce insurance losses or manage risks. We also present adetailed listing of all the energy-efficiency and renewable energy technologies andservices in the inventory and their links to risk management and reduced insurancelosses. We provide a listing of facilities at the national laboratories that are availableto the insurance and risk management communities for conducting insurance-related research on particular technologies and services. We also suggest someresearch topics as a first step in developing a national research agenda for thenational laboratories. We identify selected examples of collaborations between thenational laboratories and the insurance industry and indicate areas of researchactivities being conducted by the insurance community that would benefit the workof the national laboratories. We conclude this chapter by describing some of the riskfactors associated with energy-efficient and renewable energy technologies.
5
In Chapter 3, we present examples from several countries of property and healthlosses that are partly associated with energy-using equipment. In the last chapter(Chapter 4), we describe the opportunities for conducting collaborative appliedresearch between the national laboratories and the insurance and risk managementcommunities and a process for promoting this collaboration.

6
Chapter 2. Energy-Efficiency and Renewable Energy Technologies
In this chapter, we present an overview of the types of avoided insurance losses thatare addressed in this report. For each insurance loss, we provide examples of howenergy-efficiency and renewable energy technologies that are included in theinventory help to reduce insurance losses. We then present a detailed listing of allthe energy-efficiency and renewable energy technologies and services in theinventory and their links to risk management and reduced insurance losses. W ealso provide a listing of research facilities at the national laboratories and suggestsome research topics as a first step in developing a national research agenda for thenational laboratories. We then identify selected examples of collaborations betweenthe national laboratories and the insurance industry and indicating areas of researchactivities being conducted by the insurance and risk management communities thatwould benefit the work of the national laboratories. We conclude this chapter bydescribing some of the risk factors associated with energy-efficient and renewableenergy technologies.
2.1. Avoided Insurance Losses
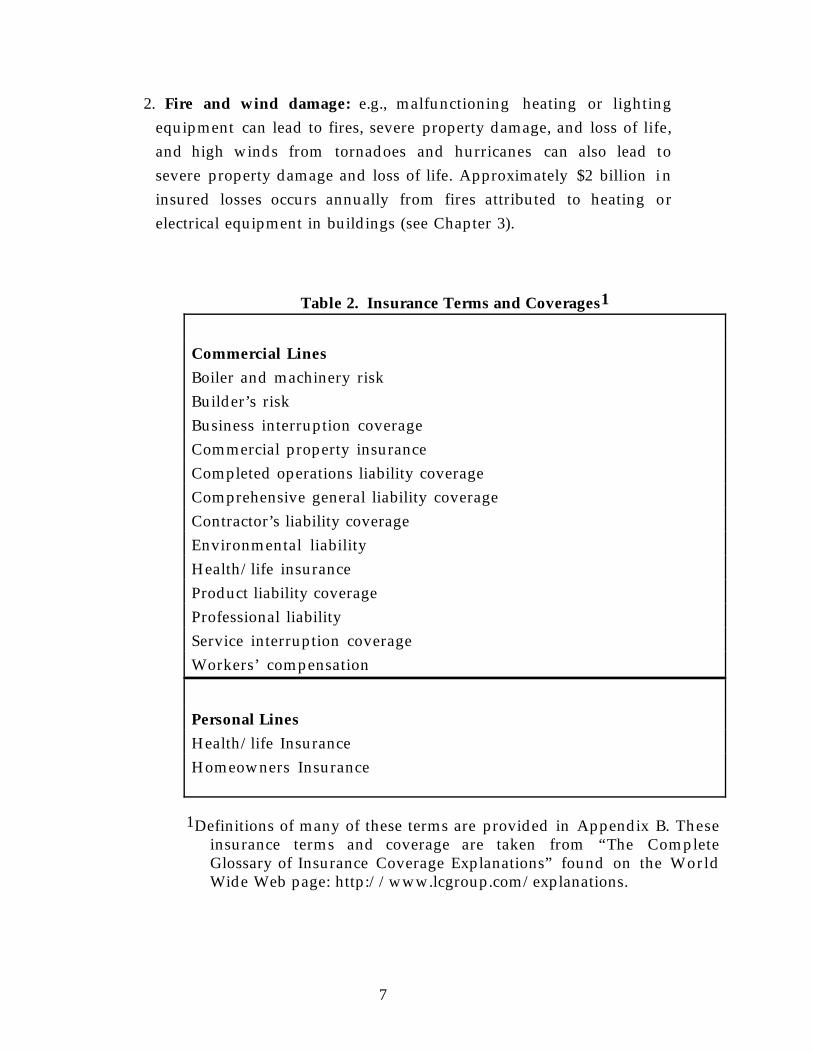
Energy-efficiency and renewable energy technologies have the potential of reducinginsurance losses involving property, health, life, or liability in the residential andnonresidential sectors. A list of insurance categories is presented in Table 2; thesecategories are defined in greater detail in Appendix B. In Table 3, we summarize theenergy-efficiency and renewable energy technologies that are in the inventory andthat reduce these losses. In this section, we present examples of these technologies.
We relate insurance losses to eight types of physical perils (hazards) in our report:
1. Extreme temperature episodes: e.g., freezing temperatures can resultin broken water pipes, while very hot temperatures can lead to“urban heat catastrophes” and loss of life. As an example, over 5,300summer heat deaths have occurred from a dozen urban heat stormsin U.S. cities (Whitman et al. 1997).
7
2. Fire and wind damage: e.g., malfunctioning heating or lightingequipment can lead to fires, severe property damage, and loss of life,and high winds from tornadoes and hurricanes can also lead tosevere property damage and loss of life. Approximately $2 billion i ninsured losses occurs annually from fires attributed to heating orelectrical equipment in buildings (see Chapter 3).
Table 2. Insurance Terms and Coverages1
Commercial Lines
Boiler and machinery riskBuilder’s riskBusiness interruption coverageCommercial property insuranceCompleted operations liability coverageComprehensive general liability coverageContractor’s liability coverageEnvironmental liabilityHealth/life insuranceProduct liability coverageProfessional liabilityService interruption coverageWorkers’ compensation
Personal Lines
Health/life InsuranceHomeowners Insurance
1Definitions of many of these terms are provided in Appendix B. Theseinsurance terms and coverage are taken from “The CompleteGlossary of Insurance Coverage Explanations” found on the WorldWide Web page: http://www.lcgroup.com/explanations.

8
Table 3. Physical Perils and Insurance Coverage Addressed by Energy-Efficiency and Renewable Energy Technologies & Strategies
Number ofmeasures offering
benefit1
Physical PerilsExtreme Temperature Episodes 16Fire & Wind Damage 38Home or Workplace Indoor Air Quality Hazards 38Home or Workplace Safety Hazards 21Ice & Water Damage 17Outdoor Pollution or Other Environmental Hazard 172
Power Failures 35Theft and Burglary 6
Insurance Coverage — Commercial LinesBoiler & Machinery 15Builder’s Risk 4Business Interruption 21Commercial Property Insurance 36Completed Operations Liability 14Comprehensive General Liability 45Contractors Liability 14Environmental Liability 12Health/Life Insurance 39Product Liability 5Professional Liability 19Service Interruption 21Workers’ Compensation 35
Insurance Coverage — Personal LinesHealth/Life Insurance 35Homeowners Insurance 26
1The numbers in this column refer to unique technologies and covers all (i.e., including non-nationallaboratory) technologies in Table 4. For example, if two national laboratories are conducting researchon fuel cells, this is “counted” only once under Service Interruption in Table 3.
2The environmental benefits of improving the outdoor air and reducing greenhouse gases by renewableenergy resources (e.g., solar, wind, etc.) are not included in this table.

9
3. Home or workplace indoor air quality hazards: e.g., carbon monoxidefrom improperly installed ducts and malfunctioning appliances cancause illness or death. Each year, about 1,500 deaths result from COpoisonings in the U.S.
4. Home or workplace safety hazards: e.g., energy-efficient lightingoften leads to less fixtures being installed as well as fewer changes i nfixtures and lamps, thus reducing the safety hazards associated withlamp and fixture replacement. As an example, compact fluorescentlamps last ten times as long as incandescent bulbs, and LED exit lightsare known to last much longer than incandescent exit lights.
5. Ice and water damage: e.g., repeated melting and re-freezing of snowcan cause the formation of icicles and ice dams on roof eaves. Meltingwater tends to pond on the rooftop, behind the ice dam, oftendamaging the roof and the building interior. As an example, lossesfrom frozen water pipes in the U.S. resulted in losses of $450million/year during 1985-95 (Tharpe 1996). These losses occur duringaverage seasonal temperatures (differentiating this physical perilfrom the first hazard associated with extreme temperatures).
6. Outdoor pollution or other environmental hazards: e.g., oil fromtransformers, mercury from lamps, and heavy metals from metalprocessing can harm both the environment as well as the workershandling these materials. In the steel industry, approximately $150million is spent each year for environmental compliance.
7. Power failures: e.g., when power service is disrupted due to storms orother events, service interruptions often result. Losses from serviceinterruptions can account for 20-40% of total insured losses.
8. Theft and burglary: e.g., poorly designed windows can facilitate theftand burglary in homes.1
1 Theft involves the taking of personal property from an individual, and burglary is the felonious
breaking and entering of a building.

10
As seen in Table 3, the most common physical perils were those associated withpower failures, fire and wind damage, and home or workplace indoor air qualityhazards. More examples of the potential value of avoided losses are presented i nChapter 3.
Given our understanding of these perils, we examine the types of risk associatedwith these perils and the types of energy-efficiency and renewable energytechnologies and services that could reduce insurance losses associated with theserisks (this is not an exhaustive list of technologies and services, just exemplary).Some of these links are strong and have been demonstrated in practice, while othersare weaker and need to be examined in greater detail.
2.1.1. Boiler and machinery risk
This form of insurance provides important mechanical breakdown coveragegenerally not available under any other insurance policy. A Boiler and Machinerypolicy can protect an insured against the effects of catastrophic property loss, such assteam boiler explosion or an expensive breakdown of machinery and equipment.Mechanical breakdown coverage encompasses much more than just boilers andpressure vessels. It also can include refrigeration equipment, air-conditioningequipment, various types of piping, turbines, engines, pumps, compressors, blowers,gearing, shafting, electric motors, generators, transformers and assorted other typesof mechanical and electrical equipment. In fact, many policies are written forinsureds who do not own or operate boilers or pressure vessels, but yet have sizablemechanical and electrical exposures.
One of the best ways of avoiding mechanical breakdowns is making sure theequipment is designed and installed properly and that any equipment is i ncompliance with existing standards or guidelines, the focus of building codedevelopment and compliance (see LBNL-6 and PNNL-1).
Once a building has been constructed and the equipment is operating, integratedinformation technologies are needed to assure building performance by carefullyexamining the process by which buildings are designed, built, commissioned, andoperated (LBNL-22). The key elements of integrated information technology aresoftware tools, building commissioning protocols, data, and energy management

11
and control systems, i.e., products and services that can be used in buildings toreduce insurance losses. These elements will collect, document, and communicateimportant information about the building’s design, the state of its operations, and itsintended and actual performance. These tools will also allow their users to detectand diagnose discrepancies between intended and actual performance, and feedlessons back to building designers about design and operations problems.
Key integrated information technologies in the inventory include: energymanagement and control systems (EMCS), building commissioning, architecturaland infrastructure surety, and measurement and verification protocols. EMCScontrol energy use, building comfort and other factors and can be used to optimizefactors that affect the energy use and productivity of employees in commercialbuildings (LBNL-21). Building commissioning is a process by which a building’senergy service systems are tested and calibrated to make sure the building system isin full working order (LBNL-5, ORNL-10, PNNL-3). The principles of architecturaland infrastructure surety (SNL-3) can be used to avoid mechanical breakdowns byapplying risk management approaches to facility designs through the process ofidentifying, assessing, analyzing and mitigating risks in residential and commercialequipment. And measurement and verification protocols provide a uniformmethod of determining how much energy is saved by energy-efficiency measures(LBNL-9). These protocols encourage that the equipment is installed properly andthat the building will be constructed as designed.
The insurance inventory contains other tools that can help to reduce these kinds oflosses. For example, infrared thermography is a tool that is used by some insurancecompanies to detect leaks in working fluids in refrigeration systems (LBNL-27). Andexplosion prevention technologies can prevent significant damage to property andbuildings (ORNL-4).
2.1.2. Builder’s risk
Builder’s risk insurance indemnifies for loss of, or damage to, a building underconstruction. Insurance is normally written for a specified amount on the buildingand applies only in the course of construction. Coverage customarily includes fire,extended coverage, vandalism, and malicious mischief. One of the best ways for
12
reducing builder’s risk is through building code development and compliance(LBNL-6 and PNNL-1), as well as many of the integrated information technologiesdescribed in Section 2.1.1: integrated information technology (LBNL-21), energymanagement and control systems (LBNL-21), building commissioning (LBNL-5,ORNL-10, PNNL-3), architectural and infrastructure surety (SNL-3), andmeasurement and verification protocols (LBNL-9).
2.1.3. Business interruption coverage
This form of insurance provides loss of income coverage for a business by replacingoperating income during the period when damage to the premises or other propertyprevents income from being earned. It is by means of the operating income that abusiness meets its expenses of payroll, light, heat, advertising, telephone service,etc., and from which a profit is derived. If business interruption is suffered and onehas to close for several months or operate at a reduced pace because of fire or otherperils, this income will cease or be reduced. The business interruptions are due tofire, lightning, water damage, etc. If the business interruption is due to aninterruption in “incoming services” (e.g., electricity and gas), then this is classified asservice interruption (see Section 2.1.12).
Several technologies covered in this can be used to reduce insurance losses frombusiness interruptions. Explosion prevention technologies can prevent significantdamage to property and buildings, avoiding business interruptions (ORNL-4).Ultraviolet water purification (LBNL-3) can produce emergency potable waterduring disaster situations, so that businesses can still operate. Refractories in glassproduction furnaces can maximize the service life and minimize the down time ofthese kinds of furnaces (ORNL-11). Similarly, the reduction of cracking in recoveryboilers in pulp and paper mills will also maximize the service life and minimize thedown time of these mills (ORNL-12).
2.1.4. Commercial property insurance
Commercial property insurance policies provide indemnification to thepolicyholder for direct damage to insured structures and business personal property

13
(Lecomte 1998). Direct damage to insured structures and business personal propertyincludes payment for the repair or replacement of the damaged property.
Many of the integrated information technologies and services described in Section2.1.1 help to reduce commercial property insurance: e.g., integrated informationtechnology (LBNL-21), energy management and control systems (LBNL-21), buildingcommissioning (LBNL-5), architectural and infrastructure surety (SNL-3), andmeasurement and verification protocols (LBNL-9). Other examples of energy-efficient technologies that can reduce commercial property insurance include:efficient duct systems (LBNL-4), light-colored roofs (LBNL-7), energy-efficienttorchieres (LBNL-1), explosion prevention technologies (ORNL-4), wind-resistantbuilding envelopes (ORNL-5), durable roof coating materials (ORNL-6), and efficientmotors (LBNL-26 and ORNL-14).
As an example, halogen floor lamps (torchieres) are extremely energy intensive (300Watts) and operate at very high temperatures (~1000 °F), creating a significant firehazard in homes and dormitories (LBNL-1). About 100 fires occurred at U.S. collegesand universities in 1996 and 1997. A safer, energy-efficient torchiere has recentlybeen developed and can be used as a replacement for the halogen floor lamp basedon compact fluorescent technology. This replacement lamp consumes only 60-80Watts to provide the same amount of light output, and operates at significantlylower temperatures (only 100 °F), limiting or decreasing the risk of fire hazards.
2.1.5. Completed operations liability
This form of liability insurance provides coverage for bodily injury and propertydamage arising from completed or abandoned operations, provided the incidentoccurs away from premises owned or rented by the insured. The best way ofavoiding these problems is making sure the equipment is designed and installedproperly, the focus of building code development and compliance (LBNL-6 andPNNL-1) as well as standard measurement and verification protocols (LBNL-9).Furthermore, once a building has been constructed and the equipment is operating,several of the integrated information technologies described in Section 2.1.1 canensure that equipment will not result in bodily injury or property damage:

14
integrated information technology (LBNL-21), energy management and controlsystems (LBNL-21), and building commissioning (LBNL-5, ORNL-10, PNNL-3).
Because indoor air quality illnesses can result in large insurance losses (see Chenand Vine 1998; Fisk and Rosenfeld 1997), reducing the strength of indoor pollutantsources is commonly the best (i.e., the simplest, most effective and economical)method to reduce indoor air pollution (LBNL-10). For example, radon is a naturallyoccurring radioactive gas that is responsible for about 12,000 deaths annually in theUnited States. Radon-resistant housing reduces the liability of the builder and thereal estate owner from exposing occupants to high levels of indoor radon (LBNL-19).
2.1.6. Comprehensive general liability
Under this form of insurance, the insurance company will pay all sums the insuredbecomes legally obligated to pay as damages due to bodily injury and propertydamage. Comprehensive general liability provides coverage for damages incurred bythird parties (individuals, companies, firms, corporations, etc.) when the insured islegally liable, but does not cover property damage in commercial buildings to theinsured (see commercial property insurance, Section 2.1.4). The technologiesincluded under commercial property insurance are also good examples for this typeof insurance (see Section 2.1.4).
2.1.7. Contractors liability
Contractors are liable for damages resulting from bodily injury and/or propertydamage caused by an insured peril and arising out of the ownership, maintenance,or use of premises and operations in progress. They are also liable for bodily injuryand/or property damage after their work is completed and they have left the job site.This type of insurance covers people who are working on a particular constructionsite, in contrast to professionals (e.g., architects and engineers) who may not be at theconstruction site (see Professional Liability).
Many of the integrated information technologies and services described in Section2.1.1 help to reduce contractors liability (e.g., building code development and

15
compliance (LBNL-6 and PNNL-1), measurement and verification protocols (LBNL-9), energy management and control systems (LBNL-21), building commissioning(LBNL-5, ORNL-10, PNNL-3)), as well as reduction of indoor air pollution (LBNL-10), and radon-resistant housing (LBNL-19). In the area of combustion (oil or gas),appliance installation, repair and sizing are important: improper sizing andspecification, improper installation, negligence, improper maintenance proceduresduring service, etc. can lead to carbon monoxide poisoning. As more and morevent-free (unvented) gas heaters enter the market (sales approaching a million/yearin the U.S.), the long-term safety of these appliances is problematic, since they do notvent their combustion products outside of the living space. Carbon monoxidesensors (LBNL-17) would help warn people about safety problems with theseappliances.
Geographic information systems (GIS) (LBNL-8, ORNL-13) can also be used to makecontractors aware of certain types of risk (e.g., water-pipe freeze damage or ice damformation in insufficiently insulated roofs). Finally, the principles of architecturaland infrastructure surety (SNL-3) can be used by applying risk managementapproaches to facility designs through the process of identifying, assessing, analyzingand mitigating risks in residential and commercial construction.
2.1.8. Environmental liability
Several energy-efficiency technologies and services help to reduce environmentalliability risks. For example, by replacing oil-filled transformers withsuperconducting transformers, there may be fewer liability concerns with thehandling and leakage of oil, as well as problems with transformers that are cooledwith oil (ORNL-2). Similarly, the replacement of chlorofluorocarbons (CFCs) byadvanced thermal insulation (e.g., evacuated panel superinsulations and non-HCFC-blown plastic foam insulation) will reduce potential liability claims related tothe handling and/or leakage of CFCs in buildings (ORNL-3). Recovering zinc fromgalvanized scrap metal results in cleaner scrap metal that can be recycled, purifiedzinc that can be resold, and a reduction in the amount of heavy metals and causticsolutions that need to be handled and disposed (ANL-2). Installing composite wallsystems reduces the exposure of children to lead poisoning hazards in residentialhousing (ANL/ORNL-1). Finally, sulfur lamps do not use mercury, thereby

16
eliminating insurance claims related to the handling or disposal of mercury (LBNL-12).
2.1.9. Health/Life insurance (Commercial)
Examples of technologies and services that reduce losses under health/lifeinsurance include the following: building commissioning and building codeenforcement (LBNL-5, LBNL-6, PNNL-1), light-colored roofs and surfaces (LBNL-7),daylighting (LBNL-28, ORNL-7), technologies for clean rooms (LBNL-14), radonresistant housing (LBNL-19), composite walls (ANL/ORNL-1), and energy-efficienttorchieres (LBNL-1). Other technologies not previously described include theimprovement of oil-fired combustion systems, including the reduction of foulingand corrosion of heat exchangers (BNL-1), as well as the training and certification ofoil-fired heating system service personnel to make sure the equipment is operatingas designed (BNL-4).
2.1.10. Product liability
Product liability is the liability for bodily injury or property damage incurred by amerchant or manufacturer as a consequence of some defect in the product sold ormanufactured, or the liability incurred by a contractor after he has completed a job asa result of improperly performed work.
Building commissioning is a process that should reduce product liability claims bymaking sure that equipment (and the building) is operating as designed (LBNL-5,ORNL-10, PNNL-3). Energy-efficient torchieres (instead of halogen torchieres)represent a specific technology that will significantly reduce product liability claims,since halogen torchieres account for about 10% of residential lighting use in theUnited States (LBNL-1). As noted in Section 2.1.4, halogen torchieres create asignificant fire hazard in homes and dormitories. In addition to the 100 fires thatoccurred at U.S. colleges and universities in 1996 and 1997, halogen torchieres areone of the primary causes of lighting-related fires in homes: 189 fires have beenreported since 1991. A safer, energy-efficient torchiere has recently been developedand can be used as a replacement for the halogen floor lamp based on compact
17
fluorescent technology. This replacement lamp consumes only 60-80 Watts toprovide the same amount of light output, and operates at significantly lowertemperatures (only 100 °F), limiting or decreasing the risk of fire hazards.
2.1.11. Professional liability
Professional liability insurance is coverage for liability resulting from errors oromissions in the performance of professional duties. This is applicable as a generalrule to professional business activities, typically not at the construction site (seeContractors Liability, Section 2.1.7).
In addition to the integrated information technologies described in Section 2.1.1(e.g., integrated information technology (LBNL-21), energy management and controlsystems (LBNL-21), building commissioning (LBNL-5, ORNL-10, PNNL-3),architectural and infrastructure surety (SNL-3), and measurement and verificationprotocols (LBNL-9)), several energy-efficiency technologies and services help toreduce contractors liability: reduction of indoor air pollution (LBNL-10), radon-resistant housing (LBNL-19), and geographic information systems (LBNL-8, ORNL-13).
2.1.12. Service interruption coverage
Similar to business interruption coverage, this form of insurance provides loss ofincome coverage for a business by replacing operating income during the periodwhen damage to the premises or other property prevents income from beingearned. It is by means of the operating income that a business meets its expenses ofpayroll, light, heat, advertising, telephone service, etc., and from which a profit isderived. If business interruption is suffered and one has to close for several monthsor operate at a reduced pace because of fire or other perils, this income will cease orbe reduced. The service interruption is due to an interruption in “incomingservices” (e.g., electricity and gas). If the interruptions are due to fire, lightning,water damage, etc., then this is classified as business interruption (see Section 2.1.3).
18
Energy-efficient technologies consume less energy than their counterparts and,therefore, can operate more effectively under minimum power conditions, reducingthe negative impacts of business interruptions. For example, light-colored roofs(LBNL-7) reduce air-conditioning use during peak power periods lessening the riskof power failures. Similarly, cool storage systems (LBNL-30 and ORNL-8) are used i ncommercial buildings to shift the cooling load of a building to offpeak periodsduring the day; if a building’s chiller or refrigeration system were to fail and thestorage system could provide more than 12 hours of air conditioning without chilleroperation, this would provide time for the chiller to be repaired or for alternativecooling arrangements to be completed. Any insured losses associated with buildingoperation might be avoided. If the storage system provides less than 12 hours of airconditioning without chiller operation, benefits would still accrue, as uninsured orself-insured losses would be less.
Renewable energy technologies can provide power to a building when powerservice is disrupted: examples in our inventory include flywheel storage (ANL-4,INEEL-3, LLNL-1, and ORNL-15), fuel cells (ANL-6, INEEL-1, LBNL-23, and LLNL-2),advanced batteries (ANL-3, LBNL-29), photovoltaic (PV) systems (NREL-3, NREL-5,NREL-6, and SNL-4), parabolic troughs for solar electric power (NREL-2), and,where available and appropriate, wind, geothermal, and biomass (NREL-7, SNL-1).For example, fuel cells can convert the chemical energy of nonpetroleum fuels (e.g.,hydrogen, methanol or ethanol) to electricity with little or no pollution and withgreater efficiency than heat engines and can provide this power continuously andreliably. Solar heating and cooling technologies (SNL-1 and SNL-2) also reduce abuilding’s reliance on the conventional power grid, reducing the impact of businessinterruptions when power service is down.
2.1.13. Worker’s compensation
Workers compensation insurance protects the employee and the employer from theexpenses and liabilities associated with a work-related accident. The legalrequirements for obtaining this insurance vary widely from state to state, withwages paid or hours worked usually the defining item.
19
Many energy-efficiency technologies and services help to reduce worker’scompensation claims: for example, building commissioning and energymanagement and control systems ensure that equipment is operating as designed(LBNL-5, ORNL-10, PNNL-3, and LBNL-21). The reduction of indoor pollutantsources should reduce worker’s compensation claims by improving the indoor airquality and health of workers (LBNL-10). Specific technologies also should reducethis type of insurance claims. For example, a lightweight vest intended for workersin spray booths and walk-in fume hoods reduces a worker’s exposure to paint fumesand should result in fewer worker’s compensation and health insurance claims(LBNL-11). Similarly, technologies for clean rooms can be used to control particles i ncleanrooms (which are used extensively in the manufacturing of integrated circuits,in the biological and pharmaceutical industries, and in medical facilities), keepingcontaminants to a minimum (LBNL-14); the air quality may be the same, but withlower energy use, or air quality could improve, but with higher energy use. The useof organic coatings may prevent the onset of explosions in the metals castingindustry which can lead to the loss of lives and serious injuries (ORNL-4).Recovering zinc from galvanized scrap metal results in a reduction in the amountof time that people are in contact with heavy metals and caustic solutions (ANL-2).
2.1.14. Health/life insurance and personal liability (Residential)
Many of the energy efficiency technologies and services that reduce commerciallines of coverage also reduce exposures under personal lines of coverage, especiallywith respect to health and life insurance and personal liability. Examples include thefollowing technologies and services: building commissioning and building codeenforcement (LBNL-5, LBNL-6, PNNL-1), light-colored roofs and surfaces (LBNL-7),daylighting (LBNL-28, ORNL-7), technologies for clean rooms (LBNL-14) (see section2.1.12), radon resistant housing (LBNL-19), composite walls (ANL/ORNL-1), energy-efficient torchieres (LBNL-1), the improvement of oil-fired combustion systems,including the reduction of fouling and corrosion of heat exchangers (BNL-1).
20
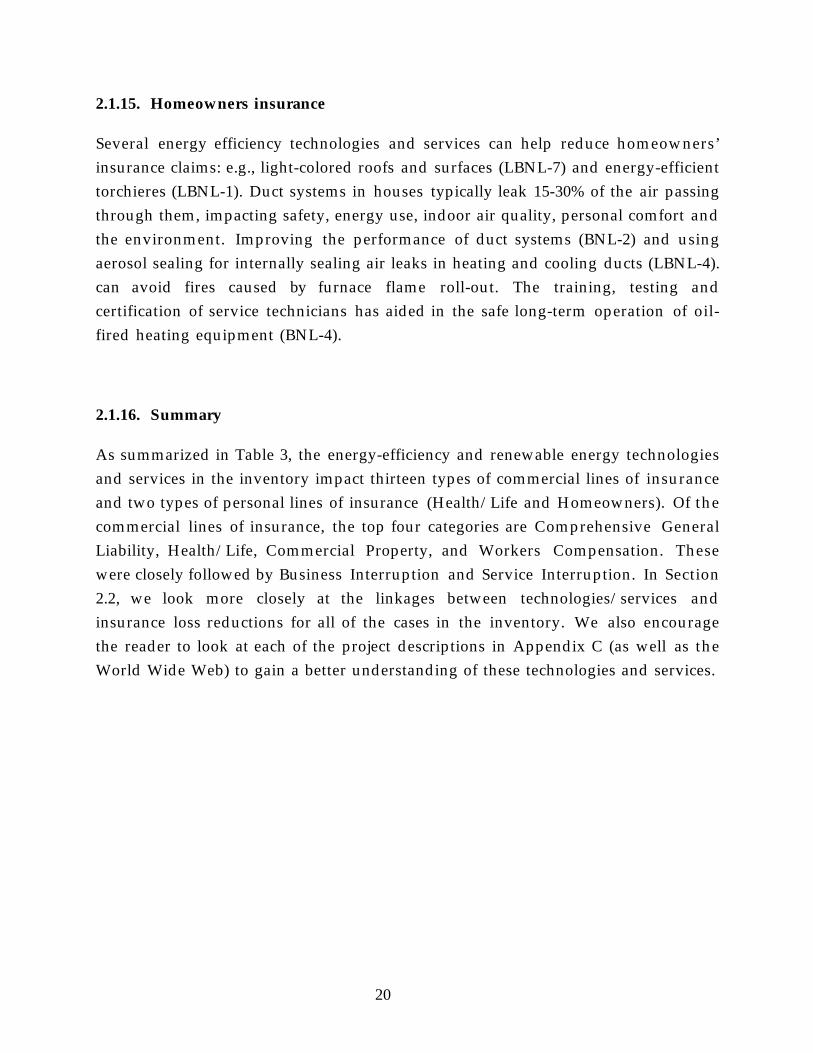
2.1.15. Homeowners insurance
Several energy efficiency technologies and services can help reduce homeowners’insurance claims: e.g., light-colored roofs and surfaces (LBNL-7) and energy-efficienttorchieres (LBNL-1). Duct systems in houses typically leak 15-30% of the air passingthrough them, impacting safety, energy use, indoor air quality, personal comfort andthe environment. Improving the performance of duct systems (BNL-2) and usingaerosol sealing for internally sealing air leaks in heating and cooling ducts (LBNL-4).can avoid fires caused by furnace flame roll-out. The training, testing andcertification of service technicians has aided in the safe long-term operation of oil-fired heating equipment (BNL-4).
2.1.16. Summary
As summarized in Table 3, the energy-efficiency and renewable energy technologiesand services in the inventory impact thirteen types of commercial lines of insuranceand two types of personal lines of insurance (Health/Life and Homeowners). Of thecommercial lines of insurance, the top four categories are Comprehensive GeneralLiability, Health/Life, Commercial Property, and Workers Compensation. Thesewere closely followed by Business Interruption and Service Interruption. In Section2.2, we look more closely at the linkages between technologies/services andinsurance loss reductions for all of the cases in the inventory. We also encouragethe reader to look at each of the project descriptions in Appendix C (as well as theWorld Wide Web) to gain a better understanding of these technologies and services.

21
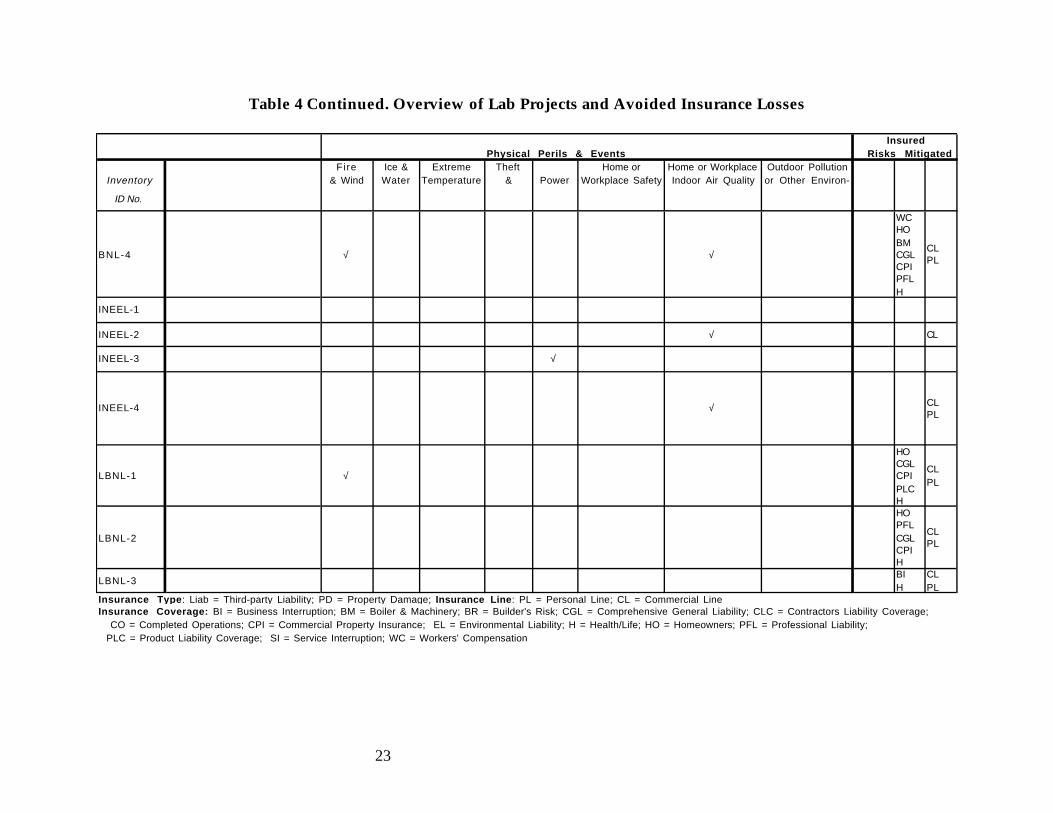
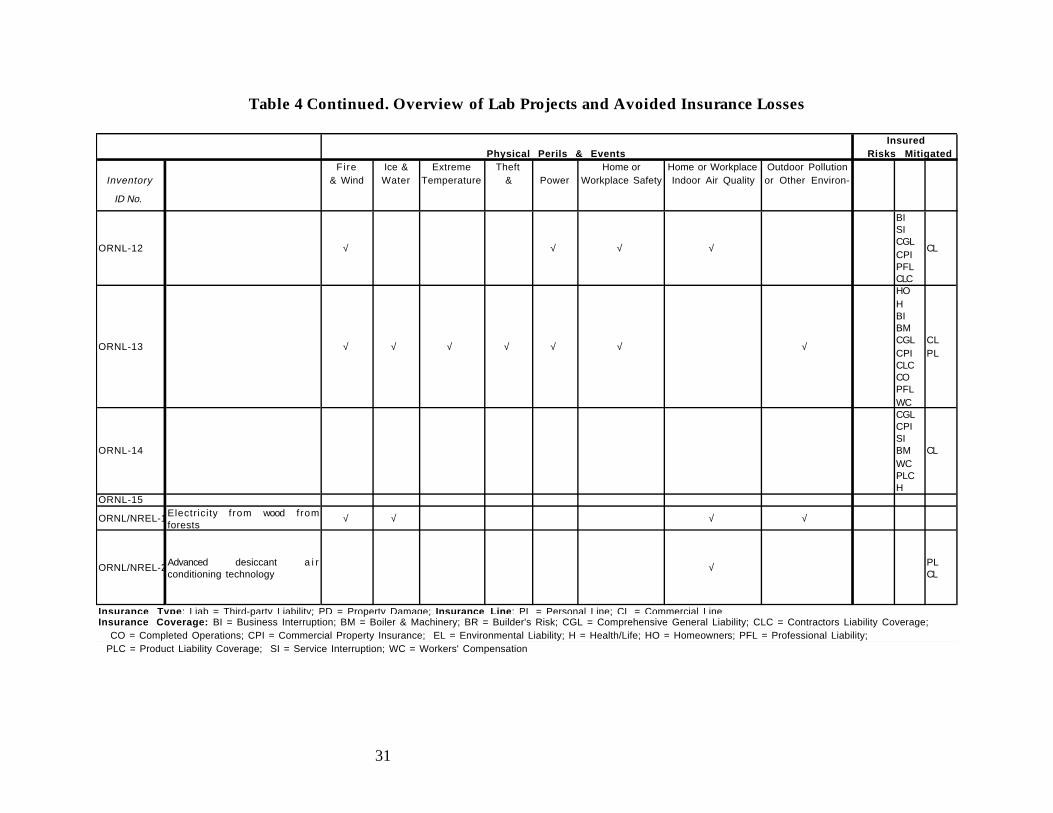
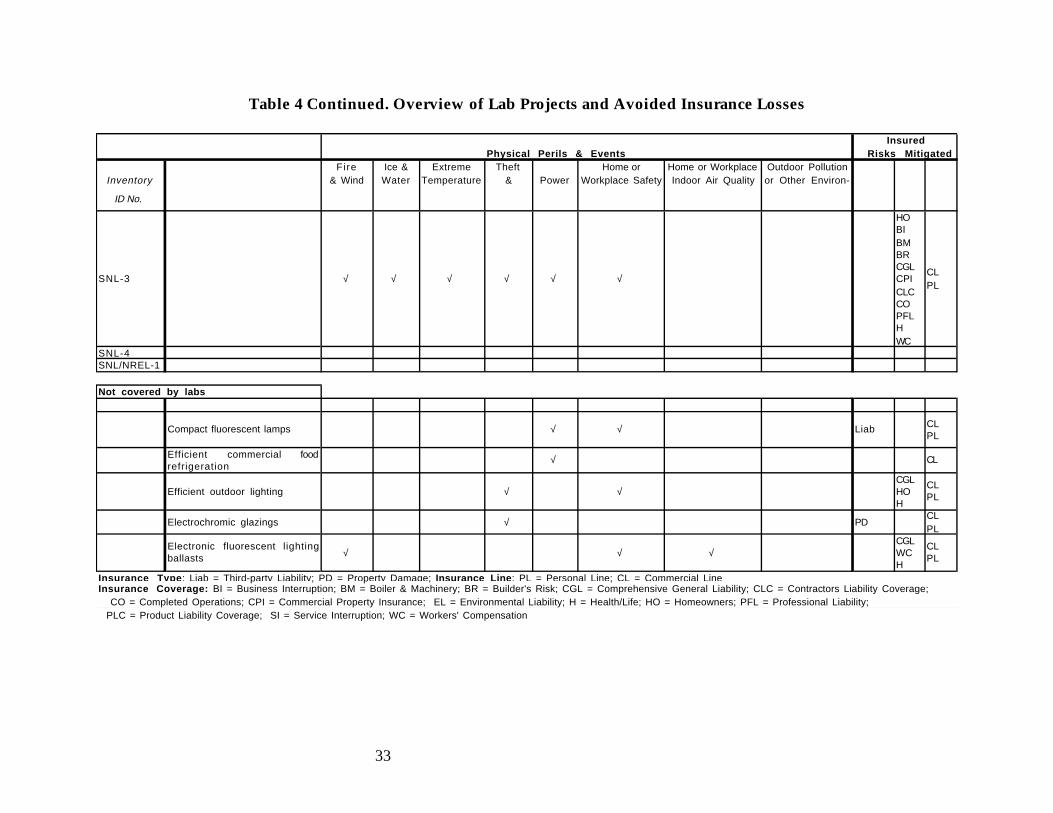
2.2. Inventory Overview
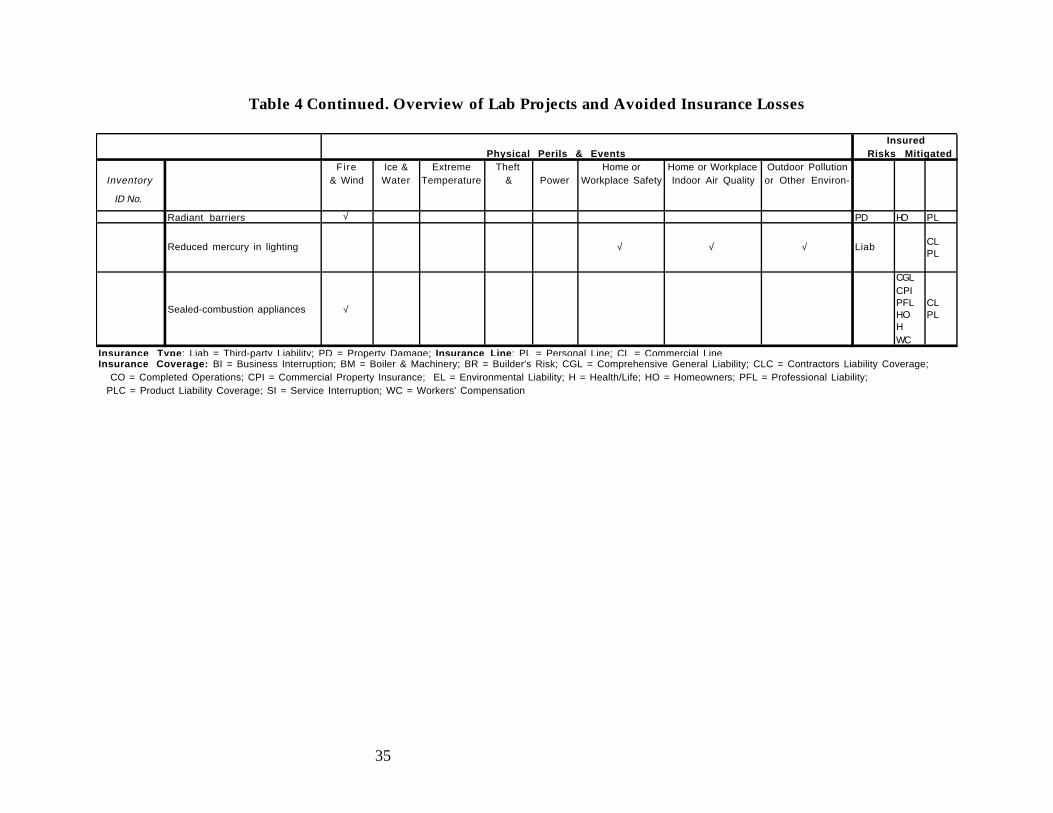
Table 4 presents a detailed listing of the energy-efficiency and renewable energytechnologies and services in the inventory and their links to reduced insurancelosses (based on Mills and Knoepfel 1997). Some of these links are strong and havebeen demonstrated in practice, while others are weaker and need to be examined i ngreater detail. Similarly, some of these technologies are just beginning to beresearched (e.g., advanced batteries, fuel cells, flywheel energy storage), some arebeing actively demonstrated (e.g., ceramicrete, zinc recovery, composite walls), andothers are ready to be commercialized (e.g., IPMVP). Most of the projects in theinventory fall into the first two categories and are not ready to be commercialized.At the end of the table, we have also included several technologies that are notcurrently being researched by the national laboratories but which could be conductedat these institutions.

22
Table 4. Overview of Lab Projects and Avoided Insurance Losses
Insured Physical Perils & Events Risks Mitigated
Fire Ice & Extreme Theft Home or Home or Workplace Outdoor PollutionInventory & Wind Water Temperature & Power Workplace Safety Indoor Air Quality or Other Environ-
ID No. Loss-Prevention Measure Damage Damage Episodes Burglary Failures Hazards Hazards mental Hazards
TOTALS (all entries) 4 4 2 1 2 1 7 4 7 2 6 3 9 1 8TOTALS (unique tech's) 3 8 1 7 1 6 6 3 5 2 1 3 8 1 7
ANL-1EL CGL CPI
CL
ANL-2 √ √ CL
ANL-3ANL-4ANL-5ANL/ORNL-1
BNL-1 √ √
H HO CGL CPI BM
CL PL
BNL-2
HO BM CGL CPI
CL PL
BNL-3 √ √
HO BM CGL CPI H WC
CL PL
Insurance Type: Liab = Third-party Liability; PD = Property Damage; Insurance Line: PL = Personal Line; CL = Commercial LineInsurance Coverage: BI = Business Interruption; BM = Boiler & Machinery; BR = Builder's Risk; CGL = Comprehensive General Liability; CLC = Contractors Liability Coverage; CO = Completed Operations; CPI = Commercial Property Insurance; EL = Environmental Liability; H = Health/Life; HO = Homeowners; PFL = Professional Liability; PLC = Product Liability Coverage; SI = Service Interruption; WC = Workers' Compensation
23
Table 4 Continued. Overview of Lab Projects and Avoided Insurance Losses
Insured Physical Perils & Events Risks Mitigated
Fire Ice & Extreme Theft Home or Home or Workplace Outdoor PollutionInventory & Wind Water Temperature & Power Workplace Safety Indoor Air Quality or Other Environ-
ID No.
BNL-4 √ √
WC HO BM CGL CPI PFL H
CL PL
INEEL-1
INEEL-2 √ CL
INEEL-3 √
INEEL-4 √ CL PL
LBNL-1 √
HO CGL CPI PLC H
CL PL
LBNL-2
HO PFL CGL CPI H
CL PL
LBNL-3BI H
CL PL
Insurance Type: Liab = Third-party Liability; PD = Property Damage; Insurance Line: PL = Personal Line; CL = Commercial LineInsurance Coverage: BI = Business Interruption; BM = Boiler & Machinery; BR = Builder's Risk; CGL = Comprehensive General Liability; CLC = Contractors Liability Coverage; CO = Completed Operations; CPI = Commercial Property Insurance; EL = Environmental Liability; H = Health/Life; HO = Homeowners; PFL = Professional Liability; PLC = Product Liability Coverage; SI = Service Interruption; WC = Workers' Compensation

24
Table 4 Continued. Overview of Lab Projects and Avoided Insurance Losses
Insured Physical Perils & Events Risks Mitigated
Fire Ice & Extreme Theft Home or Home or Workplace Outdoor PollutionInventory & Wind Water Temperature & Power Workplace Safety Indoor Air Quality or Other Environ-
ID No.
LBNL-4 √ √ √
WC PFL HO H CGL CPI BM
CL PL
LBNL-5
WC CGL CPI BR CO CLC BM PFL PLC H
CL
LBNL-6
HO H BI BM CGL CPI CLC CO PFL
CL PL
LBNL-7CL PL
Insurance Type: Liab = Third-party Liability; PD = Property Damage; Insurance Line: PL = Personal Line; CL = Commercial LineInsurance Coverage: BI = Business Interruption; BM = Boiler & Machinery; BR = Builder's Risk; CGL = Comprehensive General Liability; CLC = Contractors Liability Coverage; CO = Completed Operations; CPI = Commercial Property Insurance; EL = Environmental Liability; H = Health/Life; HO = Homeowners; PFL = Professional Liability; PLC = Product Liability Coverage; SI = Service Interruption; WC = Workers' Compensation

25
Table 4 Continued. Overview of Lab Projects and Avoided Insurance Losses
Insured Physical Perils & Events Risks Mitigated
Fire Ice & Extreme Theft Home or Home or Workplace Outdoor PollutionInventory & Wind Water Temperature & Power Workplace Safety Indoor Air Quality or Other Environ-
ID No.
LBNL-8 √ √ √ √ √ √ √ √
HO H BI BM CGL CPI CLC CO PFL WC
CL PL
LBNL-9 √ √ √ √ √
BI BM PFL CLC CO CGL CPI WC BR EL
CL
LBNL-10 CL PL
LBNL-11 CL
LBNL-12 √ √ CL
Insurance Type: Liab = Third-party Liability; PD = Property Damage; Insurance Line: PL = Personal Line; CL = Commercial LineInsurance Coverage: BI = Business Interruption; BM = Boiler & Machinery; BR = Builder's Risk; CGL = Comprehensive General Liability; CLC = Contractors Liability Coverage; CO = Completed Operations; CPI = Commercial Property Insurance; EL = Environmental Liability; H = Health/Life; HO = Homeowners; PFL = Professional Liability; PLC = Product Liability Coverage; SI = Service Interruption; WC = Workers' Compensation

26
Table 4 Continued. Overview of Lab Projects and Avoided Insurance Losses
Insured Physical Perils & Events Risks Mitigated
Fire Ice & Extreme Theft Home or Home or Workplace Outdoor PollutionInventory & Wind Water Temperature & Power Workplace Safety Indoor Air Quality or Other Environ-
ID No.
LBNL-13 CL
LBNL-14
WC H SI CGL CPI
CL
LBNL-15CL PL
LBNL-16 √ √ √ √
LBNL-17 CL PL
LBNL-18 CL PL
LBNL-19 PL
LBNL-20Insurance Type: Liab = Third-party Liability; PD = Property Damage; Insurance Line: PL = Personal Line; CL = Commercial LineInsurance Coverage: BI = Business Interruption; BM = Boiler & Machinery; BR = Builder's Risk; CGL = Comprehensive General Liability; CLC = Contractors Liability Coverage; CO = Completed Operations; CPI = Commercial Property Insurance; EL = Environmental Liability; H = Health/Life; HO = Homeowners; PFL = Professional Liability; PLC = Product Liability Coverage; SI = Service Interruption; WC = Workers' Compensation

27
Table 4 Continued. Overview of Lab Projects and Avoided Insurance Losses
Insured Physical Perils & Events Risks Mitigated
Fire Ice & Extreme Theft Home or Home or Workplace Outdoor PollutionInventory & Wind Water Temperature & Power Workplace Safety Indoor Air Quality or Other Environ-
ID No.
LBNL-21 √ √ √
CGL BM SI WC CLC CO H CGL CPI PFL
CL
LBNL-22 √ √ √ √ √ √
H WC CGL CPI BR CO CLC BM PFL EL
CL
LBNL-23
LBNL-24 √ √ CL
LBNL-25 √ √
HO WC H CGL CPI CO PFL
CL PL
Insurance Type: Liab = Third-party Liability; PD = Property Damage; Insurance Line: PL = Personal Line; CL = Commercial LineInsurance Coverage: BI = Business Interruption; BM = Boiler & Machinery; BR = Builder's Risk; CGL = Comprehensive General Liability; CLC = Contractors Liability Coverage; CO = Completed Operations; CPI = Commercial Property Insurance; EL = Environmental Liability; H = Health/Life; HO = Homeowners; PFL = Professional Liability; PLC = Product Liability Coverage; SI = Service Interruption; WC = Workers' Compensation

28
Table 4 Continued. Overview of Lab Projects and Avoided Insurance Losses
Insured Physical Perils & Events Risks Mitigated
Fire Ice & Extreme Theft Home or Home or Workplace Outdoor PollutionInventory & Wind Water Temperature & Power Workplace Safety Indoor Air Quality or Other Environ-
ID No.
LBNL-26
CGL CPI SI BM WC PLC H
CL
LBNL-27 CL PL
LBNL-28
SI WC H CGL CPI PFL
CL
LBNL-29 CL
LBNL-30 CL
LLNL-1LLNL-2 Zinc-air fuel cell √ √ PD SI CL
NREL-1
H BI SI HO WC CGL CPI
CL PL
NREL-2 √
Insurance Type: Liab = Third-party Liability; PD = Property Damage; Insurance Line: PL = Personal Line; CL = Commercial LineInsurance Coverage: BI = Business Interruption; BM = Boiler & Machinery; BR = Builder's Risk; CGL = Comprehensive General Liability; CLC = Contractors Liability Coverage; CO = Completed Operations; CPI = Commercial Property Insurance; EL = Environmental Liability; H = Health/Life; HO = Homeowners; PFL = Professional Liability; PLC = Product Liability Coverage; SI = Service Interruption; WC = Workers' Compensation

29
Table 4 Continued. Overview of Lab Projects and Avoided Insurance Losses
Insured Physical Perils & Events Risks Mitigated
Fire Ice & Extreme Theft Home or Home or Workplace Outdoor PollutionInventory & Wind Water Temperature & Power Workplace Safety Indoor Air Quality or Other Environ-
ID No.
NREL-3
NREL-4 √ √ √ √
H SI HO WC CGL CPI
CL PL
NREL-5 CL
NREL-6 √
NREL-7
ORNL-1 √ √CL PL
ORNL-2 CL
ORNL-3
ORNL-4
CGL CPI WC BI
CL
ORNL-5 √ CL PL
Insurance Type: Liab = Third-party Liability; PD = Property Damage; Insurance Line: PL = Personal Line; CL = Commercial LineInsurance Coverage: BI = Business Interruption; BM = Boiler & Machinery; BR = Builder's Risk; CGL = Comprehensive General Liability; CLC = Contractors Liability Coverage; CO = Completed Operations; CPI = Commercial Property Insurance; EL = Environmental Liability; H = Health/Life; HO = Homeowners; PFL = Professional Liability; PLC = Product Liability Coverage; SI = Service Interruption; WC = Workers' Compensation

30
Table 4 Continued. Overview of Lab Projects and Avoided Insurance Losses
Insured Physical Perils & Events Risks Mitigated
Fire Ice & Extreme Theft Home or Home or Workplace Outdoor PollutionInventory & Wind Water Temperature & Power Workplace Safety Indoor Air Quality or Other Environ-
ID No.
ORNL-6 CL
ORNL-7
BI SI CGL PFL WC H
CL
ORNL-8 CL
ORNL-9 PL
ORNL-10
WC CGL BR CO CLC BM PFL PLC H
CL
ORNL-11 √ √ √
BI EL CGL CPI
CL
Insurance Type: Liab = Third-party Liability; PD = Property Damage; Insurance Line: PL = Personal Line; CL = Commercial LineInsurance Coverage: BI = Business Interruption; BM = Boiler & Machinery; BR = Builder's Risk; CGL = Comprehensive General Liability; CLC = Contractors Liability Coverage; CO = Completed Operations; CPI = Commercial Property Insurance; EL = Environmental Liability; H = Health/Life; HO = Homeowners; PFL = Professional Liability; PLC = Product Liability Coverage; SI = Service Interruption; WC = Workers' Compensation
31
Table 4 Continued. Overview of Lab Projects and Avoided Insurance Losses
Insured Physical Perils & Events Risks Mitigated
Fire Ice & Extreme Theft Home or Home or Workplace Outdoor PollutionInventory & Wind Water Temperature & Power Workplace Safety Indoor Air Quality or Other Environ-
ID No.
ORNL-12 √ √ √ √
BI SI CGL CPI PFL CLC
CL
ORNL-13 √ √ √ √ √ √ √
HO H BI BM CGL CPI CLC CO PFL WC
CL PL
ORNL-14
CGL CPI SI BM WC PLC H
CL
ORNL-15
ORNL/NREL-1Electricity f rom wood fromforests
√ √ √ √
ORNL/NREL-2Advanced desiccant a i rconditioning technology
√ PL CL
Insurance Type: Liab = Third-party Liability; PD = Property Damage; Insurance Line: PL = Personal Line; CL = Commercial LineInsurance Coverage: BI = Business Interruption; BM = Boiler & Machinery; BR = Builder's Risk; CGL = Comprehensive General Liability; CLC = Contractors Liability Coverage; CO = Completed Operations; CPI = Commercial Property Insurance; EL = Environmental Liability; H = Health/Life; HO = Homeowners; PFL = Professional Liability; PLC = Product Liability Coverage; SI = Service Interruption; WC = Workers' Compensation

32
Table 4 Continued. Overview of Lab Projects and Avoided Insurance Losses
Insured Physical Perils & Events Risks Mitigated
Fire Ice & Extreme Theft Home or Home or Workplace Outdoor PollutionInventory & Wind Water Temperature & Power Workplace Safety Indoor Air Quality or Other Environ-
ID No.
PNNL-1 √ √ √ √
HO H BI BM RI CGL CPI CLC CO PFL
CL PL
PNNL-2 √ √SI BM
CL
PNNL-3
WC CGL CPI BR CO CLC BM PFL PLC H
CL
SNL-1 CL
SNL-2 CL PL
Insurance Type: Liab = Third-party Liability; PD = Property Damage; Insurance Line: PL = Personal Line; CL = Commercial LineInsurance Coverage: BI = Business Interruption; BM = Boiler & Machinery; BR = Builder's Risk; CGL = Comprehensive General Liability; CLC = Contractors Liability Coverage; CO = Completed Operations; CPI = Commercial Property Insurance; EL = Environmental Liability; H = Health/Life; HO = Homeowners; PFL = Professional Liability; PLC = Product Liability Coverage; SI = Service Interruption; WC = Workers' Compensation
33
Table 4 Continued. Overview of Lab Projects and Avoided Insurance Losses
Insured Physical Perils & Events Risks Mitigated
Fire Ice & Extreme Theft Home or Home or Workplace Outdoor PollutionInventory & Wind Water Temperature & Power Workplace Safety Indoor Air Quality or Other Environ-
ID No.
SNL-3 √ √ √ √ √ √
HO BI BM BR CGL CPI CLC CO PFL H WC
CL PL
SNL-4SNL/NREL-1
Not covered by labs
Compact fluorescent lamps √ √ Liab CL PL
Efficient commercial foodrefrigeration
√ CL
Efficient outdoor lighting √ √CGL HO H
CL PL
Electrochromic glazings √ PDCL PL
Electronic fluorescent lightingballasts √ √ √
CGL WC H
CL PL
Insurance Type: Liab = Third-party Liability; PD = Property Damage; Insurance Line: PL = Personal Line; CL = Commercial LineInsurance Coverage: BI = Business Interruption; BM = Boiler & Machinery; BR = Builder's Risk; CGL = Comprehensive General Liability; CLC = Contractors Liability Coverage; CO = Completed Operations; CPI = Commercial Property Insurance; EL = Environmental Liability; H = Health/Life; HO = Homeowners; PFL = Professional Liability; PLC = Product Liability Coverage; SI = Service Interruption; WC = Workers' Compensation

34
Table 4 Continued. Overview of Lab Projects and Avoided Insurance Losses
Insured Physical Perils & Events Risks Mitigated
Fire Ice & Extreme Theft Home or Home or Workplace Outdoor PollutionInventory & Wind Water Temperature & Power Workplace Safety Indoor Air Quality or Other Environ-
ID No.
Energy audits & diagnostics √ √ √
BM BI CGL CPI HO H PFL
CL PL
Extra interior gypsum board √ PDCL PL
Fuel switching from electric togas cooking √ √ √
CL PL
Heat-recovery ventilation √
CGL HO H WC
CL PL
Insulated water pipes √ √
HO CGL CPI BI
CL PL
LED exit signs √ √ Liab CL
Mitigating ice dam formation √ √ √ √HO CGL H
CL PL
Natural ventilation √ √WC BI H
CL PL
Insurance Type: Liab = Third-party Liability; PD = Property Damage; Insurance Line: PL = Personal Line; CL = Commercial LineInsurance Coverage: BI = Business Interruption; BM = Boiler & Machinery; BR = Builder's Risk; CGL = Comprehensive General Liability; CLC = Contractors Liability Coverage; CO = Completed Operations; CPI = Commercial Property Insurance; EL = Environmental Liability; H = Health/Life; HO = Homeowners; PFL = Professional Liability; PLC = Product Liability Coverage; SI = Service Interruption; WC = Workers' Compensation
35
Table 4 Continued. Overview of Lab Projects and Avoided Insurance Losses
Insured Physical Perils & Events Risks Mitigated
Fire Ice & Extreme Theft Home or Home or Workplace Outdoor PollutionInventory & Wind Water Temperature & Power Workplace Safety Indoor Air Quality or Other Environ-
ID No.
Radiant barriers √ PD HO PL
Reduced mercury in lighting √ √ √ Liab CL PL
Sealed-combustion appliances √
CGL CPI PFL HO H WC
CL PL
Insurance Type: Liab = Third-party Liability; PD = Property Damage; Insurance Line: PL = Personal Line; CL = Commercial LineInsurance Coverage: BI = Business Interruption; BM = Boiler & Machinery; BR = Builder's Risk; CGL = Comprehensive General Liability; CLC = Contractors Liability Coverage; CO = Completed Operations; CPI = Commercial Property Insurance; EL = Environmental Liability; H = Health/Life; HO = Homeowners; PFL = Professional Liability; PLC = Product Liability Coverage; SI = Service Interruption; WC = Workers' Compensation

36
2.3. Research Facilities at the National Laboratories
The U.S. Department of Energy’s national laboratories have many facilitiesavailable to the insurance and risk management communities for conductingresearch on energy-efficient and renewable energy technologies. In Table 5, wehave organized the research facilities by type of project. Multiple laboratorylistings are presented under each project and referenced with a projectidentification number (if one is interested in obtaining more information abouta particular research facility, the reader can go to Appendix C or the World WideWeb at http://eetd.lbl.gov/CBS/Climate-Insurance/welcome.html ). We realizethat this is not an exhaustive list of all of the research facilities at the nationallaboratories, since the list was based on the input from researchers whocontributed to this project. However, Table 5 does capture the breadth anddiversity of research facilities available to the insurance and risk managementcommunities.

37
Table 5. Research Facilities at the National Laboratories
Project Research Facility Reference
Composite Wall Systems Envelope research facility ANL/ ORNL-1
Oil-Fired Combustion Systems Extensive laboratory facilities andinstrumentation dedicated to combustion,efficiency, and emission testing of heatingequipment.
BNL-1
Thermal Distribution Systems Extensive laboratory facilities andinstrumentation dedicated to combustion,efficiency, and emission testing of heatingequipment.
BNL-2
Venting Technology Extensive laboratory facilities andinstrumentation dedicated to combustion,efficiency, and emission testing of heatingequipment.
BNL-3
Technical Support for Oil-FiredHeating Systems
Extensive laboratory facilities andinstrumentation dedicated to combustion,efficiency, and emission testing of heatingequipment.
BNL-4
Lighting LBNL lighting laboratory. LBNL-1 LBNL-12
Optical materials & characterization labs,fiber optics R&D labs, Center ofManufacturing Technology, sensors/controlslabs, etc.
ORNL-7
Energy-Efficient Windows Infrared (IR) laboratory: unique facility tomeasure the surface temperatures of windowproducts. MoWitt laboratory: measures fieldperformance of window by measuring heatflow through two side-by-side windowsamples. Coating laboratory: facility tomanufacture and analyze coatings. Opticslaboratory: custom devices are developed tomeasure optical properties of glazings.
LBNL-2
UV Water Purifier LBNL has dedicated research facilities forimproving the UV Waterworks system designand operation.
LBNL-3

38
Table 5 Continued. Research Facilities at the National Laboratories
Project Research Facility Reference
Aerosol-Based Duct SealingTechnology
Duct research laboratory with technologiesfor air flow and pressure measurement.
LBNL-4
Building Commissioning Advanced data visualization tools, databasesystems, and data collection gateways.
LBNL-5
Case study database, library ofcommissioning publications and tools.
ORNL-10PNNL-3
Building Code Compliance LBNL has developed extensive computerprograms to model the behavior of buildingsunder different compliance regimes: e.g.,DOE-2, PEAR, REM, COMMEND, and theHome Energy Saver.
LBNL-6
Light Surfaces and Urban Trees Facilities for studying the solar reflectivityof building and paving materials.
LBNL-7
Geographic Information Systems The GIS Lab consists of SUN workstations,including a SPARC 20 and SPARC 1, as wellas a Calcomp 9500 digitizer, and severaltypes of GIS software, primarily ARC/View,ARC/Info and Earth Resources Data AnalysisSystem. ARC/Info is a vector-based GISprogram produced by the EnvironmentalSystems Research Institute; the ERDAS is araster-based system.
LBNL-8
GIS research and development activities arecarried out by different groups located withinthe Energy, Computational Physics andEngineering, and Environmental SciencesDivisions at ORNL. Each group haslaboratory as well as office space dedicatedto GIS hardware and software operations.Hardware platforms include SUN SPARCand Apple workstations and Windows-basedPCs. Various devices for printing and plottingcolor maps, both large and small, areavailable. Various commercial GIS softwareare in use (e.g. ARC/Info, Intergraph,MapInfo, GisPlus/Transcad, AutoCAD).ORNL staff also develop in-house GIS codewhen required for project specificapplications, working with both vector - andraster-based systems.
ORNL-13

39
Table 5 Continued. Research Facilities at the National Laboratories
Project Research Facility Reference
Indoor Pollutant SourceReduction
Air-chemistry laboratory facility, fullyinstrumented room size stainless-steel linedemissions chamber, mechanical ventilationdiagnosis equipment and laboratory, ductslaboratory, computational and modelingresearch facilities, radon researchlaboratory, full-sized experimental facilityfor interzonal air and pollutant transportunder a variety of indoor environmentalconditions.
LBNL-10
Air Jacket Air-chemistry laboratory facility, fullyinstrumented room-size stainless-steel linedemissions chamber, mechanical ventilationdiagnosis equipment and laboratory, ductslaboratory, computational and modelingresearch facilities, full-sized experimentalfacility for interzonal air and pollutanttransport under a variety of indoorenvironmental conditions.
LBNL-11
Indoor Air Quality-RelatedIllnesses (including CO,environmental tobacco smoke)
Indoor Environment Program researchers usesingle and multi-room environmentalchamber facilities as controlled indoorenvironments to study the behavior of avariety of indoor pollutants ranging fromcigarette smoke to volatile organic compounds(VOCs) from new carpets. The program alsohas laboratories and extensiveinstrumentation for indoor pollutant andventilation rate measurements.
LBNL-15LBNL-17 LBNL-18
Radon Resistant Housing LBNL has substantial research facilities (onand off site) and instrumentation forconducting research on indoor radon.
LBNL-19
Reducing Aerosol Deposition onElectronic Circuits
LBNL has experimental facilities andadvanced instrumentation
LBNL-24
Infrared Thermography The Infrared Thermography Facility atLBNL has been developed to aid solvingtechnical problems related to heat transfer inbuilding envelope components such aswindows and insulation.
LBNL-27

40
Table 5 Continued. Research Facilities at the National Laboratories
Project Research Facility Reference
Daylighting The sky simulator is a 24-foot-diameter domethat researchers use to measure theilluminance levels in building models fittedwith various daylighting systems. By testingthese models, they can determine how well abuilding design or daylighting technologypermits light to enter under conditions ofvarying time of day and season, buildingorientation, or geographic location. Thebidirectional radiometric scanner is a tool foraccurately measuring the solar heat gain ofany window system, which can includeshades, blinds, drapes, and a variety ofglazings, tints, coatings, and glass thickness.Scientists in the Building TechnologiesProgram developed this device to improveresearch on window systems and to develop auniversal rating system for solar heat gainfrom windows.
LBNL-28
Optical materials & characterization labs,fiber optics R&D labs, Center ofManufacturing Technology, sensors/controlslabs, etc.
ORNL-7
Natural Refrigerants andAdvanced Desiccants in U. S.Air Conditioning andRefrigeration Equipment
Roof climate simulator, large-scale wallcalibrated hot box, HVAC system andappliance environmental chambers, heatexchanger test facility/calorimeter, water-to-water heat pump refrigeration and airconditioning equipment test loops, absorptionheat and mass transfer loops, instrumenteddesiccant A/C system test loop, and corrosiontest laboratory.
ORNL-1ORNL/NREL-2
CFC-Free Thermal Insulation Heat flow meter apparatuses. Apparatusesfor measuring total hemispherical emittance,air-flow permeability through permeableinsulation, coefficients of gas diffusionthrough closed-cell foams, permeance of gasesthrough plastic films. Equipment forproducing prototype evacuated panelinsulation. Air-jet grinding mill.
ORNL-3

41
Table 5 Continued. Research Facilities at the National Laboratories
Project Research Facility Reference
Durable Roof Coating Materials The Roof Thermal Research Apparatus(RTRA) is utilized to expose samples of roofcoatings to the environment and to simulateactual applications. The RTRA hassubstantial data acquisition capabilities,including energy, temperature, load, andmeteorological sensors.
ORNL-6
Cool Storage Systems Cool storage test facility. ORNL-8
Microtechnology-BasedAbsorption Heat Pump
PNNL has established the micro thermalsystems and micro chemical systemslaboratories for the development ofminiature energy and chemical systems.These facilities include specializedequipment and instrumentation for thefabrication, assembly and testing ofmicrotechnology based thermal and chemicalsystems and components.
PNNL-2
Architectural and InfrastructureSurety
Relevant laboratory facilities that areavailable at Sandia include: ComponentModeling and Characteristics Laboratory,Microelectronics Development Laboratory,Intelligent Systems and Robotics Center,Materials and Process Diagnosis Facility,and Explosive Components Facility.
SNL-3
Efficient Motor-Driven Systems Motor testing laboratory (NAVLAP)accredited for motor tests up to 500horsepower. Power electronics laboratory fordevelopment of advanced power electronicsand motors.
ORNL-14
Superconducting Transformers Physical properties measurementslaboratories. High temperaturesuperconductivity materials laboratory.Pulsed laser and electron beam depositionfacilities. Superconducting cable testfacility. Cryogenic dielectrics researchlaboratory. High temperature materialslaboratory.
ORNL-2

42
Table 5 Continued. Research Facilities at the National Laboratories
Project Research Facility Reference
Advanced Batteries Battery Analysis and Diagnostic Laboratory ANL-3
High-resolution electron microscopy, scanningtunneling microscopy, synchrotron X-raysource, NMR, inert-atmosphere boxes,computer-controlled cell cycling equipment,electrochemical impedance spectroscopy,FTIR spectroscopy, photothermal deflectionspectroscopy, ellipsometry, porous electrodepreparation facilities, and others.
LBNL-29
Flywheels Two vacuum-chamber apparatuses to test therotational losses of HTS bearings. One is aglass bell-jar test chamber with an oil-diffusion pump. This apparatus is capable oftesting bearings with rotating mass up to ~1kg. The second apparatus is a stainless steelchamber with a turbomolecular vacuum pumpcapable of testing rotating masses of >100 kg.Safely enclosed underground area to activelytest rotating flywheels.
ANL-4
Laboratory capable of testing full-scale,uncontained flywheel systems, electricalloads of up to 100 kW available. Multiple gasgun and x-ray facilities for containmentdevelopment.
LLNL-1
Test facilities are available for safely testinglarge flywheels.
ORNL-15
Fuel Cells Fuel cell testing facility. Synchrotron X-rayfacility to study anode reactions in real time.X-ray spectroscopic facilities.
ANL-5
In the Energy Storage TechnologiesLaboratory, controlled tests examine theperformance of energy storage devices (e.g.,fuel cells). The National Institute ofStandards and Technology's CalibrationLaboratory supports the Energy StorageLaboratory and calibrates test equipmentwithin the Energy Storage Laboratory.
INEEL-1

43
Table 5 Continued. Research Facilities at the National Laboratories
Project Research Facility Reference
Fuel Cells High-resolution electron microscopy, scanningtunneling microscopy, synchrotron X-raysource, NMR, inert-atmosphere boxes,computer-controlled cell cycling equipment,electrochemical impedance spectroscopy,FTIR spectroscopy, photothermal deflectionspectroscopy, ellipsometry, porous electrodepreparation facilities, and others.
LBNL-23
Passive Solar Energy Systems Thermal Test Facility with a variety ofthermal science labs. Large scaleenvironmental chamber. Flow visualizationlab. Wind tunnel. HVAC testing lab. Solarthermal outdoor test lab. Air quality fieldtest lab. Tracer gas field test lab.
NREL-1NREL-4
Photovoltaics Photovoltaics outdoor test lab. NREL-3NREL-5
CEEP has a computer laboratory and PVexperimental facility (Solar One) which itjointly uses with the IEC. There is a PVmanufacturing facility close by (Newark,DE).
NREL-6
Parabolic Troughs Collector testing facilities. NREL-2
Small Wind Turbine System National Wind Technology Center NREL-7
Renewable Energy Projects PV fabrication labs, PV outdoor testfacilities, the National Solar Thermal TestFacility, and a number of indoor labs used forenergy R&D.
SNL-1SNL-2SNL-4
High Flux Solar Furnace SNL/NREL-1
Electricity from Wood Removedfrom Forests to Reduce FuelBuildup
The Alternative Fuels User Facility at NRELincludes a pilot plant for evaluating biofuelstechnologies and supporting laboratoryfacilities. ORNL and NREL have GeographicInformation System facilities for doingspatial analyses.
ORNL/NREL-1

44
Table 5 Continued. Research Facilities at the National Laboratories
Project Research Facility Reference
Explosion Prevention Technology The steam explosion triggering studies (SETS)facility was developed to provide a means fortesting various coated and uncoated surfacesfor their ability to prevent or initiate steamexplosions. This facility permits (at vastlyreduced cost) the study of the initiationprocess without attendant safety issuesinvolved with conventional means.
ORNL-4
Ceramicrete Phosphate Ceramic Double planetary mixer (for 55 gallon drums).Feeder-hopper system. Water line.
ANL-1
Recovering Zinc from GalvanizedScrap
Stripping facilities that contain causticsolutions. 400 gallon tank to performelectrolytic stripping tests.
ANL-2
Refractories Refractory creep testing facilities to 1700°C.Modulus of elasticity and extensometrycapabilities to 1700°C. Catholuminescenceimaging (via subcontract with UM-Rolla).
ORNL-11
Recovery Boilers Transmissions electron microscopy facilities.Neutron and X-ray residual stress facilities.Parallel computing facilities for finiteelement modeling. Thermal mechanicalfatigue facilities. Corrosion laboratory.
ORNL-12

45
2.4. Developing a National Insurance Loss Reduction and Risk Management
Research Agenda for the National Laboratories
During the review of this report, reviewers were asked for suggestions fordeveloping a research agenda for their particular project. We were particularlyinterested in how the work at the national laboratories could be extended toaddress the reduction of insurance losses (we were not interested in simplyexpanding these existing projects). We received suggestions from many (but notall) of the researchers (see project descriptions in Appendix C) and a few generalsuggestions that fell outside of the projects that were in the inventory.
These suggestions are indicative rather than comprehensive. They provide thefirst step in developing a national research agenda for the national laboratories.The suggestions are quite brief but do provide information on where each projectis expected to proceed.
For prioritizing these research areas, as well as for developing new ideas, werecommend that representatives from the insurance and risk managementcommunities, the national laboratories, and the U.S. Department of Energyconvene a meeting to review the projects in the inventory and the suggestednext steps for each project.
In addition to specific project suggestions, some researchers and members of theinsurance and risk management communities offered the following generalsuggestions to consider during the development of a national insurance and riskmanagement research agenda.
1. Continue to quantify the insurance benefits of low-risktechnologies, such as energy efficiency and renewable energy.
2. Conduct an analysis of different policy options to promote energyefficiency and renewables for their value in avoiding insurancelosses (i.e., which policies would have the most effect in avoidingdifferent categories of insurance loss and what would be theactuarial, economic, and environmental value of these avoidedlosses).

46
3. Conduct an economic analysis of the investments for energyefficiency, loss prevention, and insurance under differentscenarios using various deductibles and limits. An under-educated, risk-averse, and short-term oriented public is not likelyto be motivated to make prudent investments. A nunderstanding of consumer behavior could be enhanced bydeveloping a model of consumer behavior from a purelytheoretical standpoint or from an empirical point of view (e.g.,based on consumer surveys).
4. Conduct an analysis of innovative heating appliance designs thatcontinue to provide heat in the event of an electrical outage. Thisstudy would cover a range of designs from inefficient pilot lightsand thermocouple generators, to sophisticated designs ofauxiliary rankine cycle generators, to fuel cells and cogeneration.
2.5. National Laboratory Collaborations with the Insurance Industry
LBNL is leading a national effort to involve the insurance industry as a partnerin the research and implementation of energy-efficient and renewable energytechnologies. The primary emphasis is on the insurance loss prevention benefitsof selected technologies. Core sponsors are DOE and EPA. LBNL has developedpartnerships with five insurance organizations (Institute for Business and HomeSafety, UNEP Insurance Industry Initiative for the Environment, ReinsuranceAssociation of America, American Insurance Association, and the Society ofInsurance Research) and five insurance companies (Arkwright MutualInsurance, Developers Professional Insurance Company, Swiss ReinsuranceCompany, Employers Reinsurance Company, and Factory Mutual). The keyactivities being conducted in this effort are:
• Helping to implement and carry out a Memorandum ofUnderstanding between DOE and the Institute for Business andHome Safety
47
• Conducting an inventory of DOE National Lab capabilitiespotentially transferable to the insurance industry (i.e., thisreport)
• Development of a research agenda based on Inventory task results(preliminary steps have been taken – see Section 2.4 andResearch Agenda items in project descriptions in Appendix C)
• Assembling data that help quantify the “insurance value” of EEREtechnologies (see Chapter 3 of this report)
• Identifying new energy-efficient and renewable energytechnologies that prevent insurance losses
• Evaluating and supporting insurance industry participation i nclimate change deliberations
• Data collection on the insurance industry as a player in real estatemarkets
For example, LBNL conducted a demonstration project and training workshop atNortheastern University with Arkwright Mutual Insurance Company on thebenefits of using energy-efficient torchieres instead of halogen torchieres (LBNL-1). Halogen torchieres account for about 10% of residential lighting use in theU.S., are energy intensive, and operate at very high temperatures, creating asignificant fire hazard in homes and in dormitories. The energy-efficienttorchiere not only saves energy (over 70% energy savings) in providing the sameamount of light output, but also operates at significantly lower temperatures,eliminating the fire hazard. LBNL is planning to conduct similar workshops atother universities with Arkwright.
In support of the Memorandum of Understanding between DOE and theinsurance industry’s Institute for Business and Home Safety (IBHS), LBNL iscollaborating with IBHS to encourage the manufacture and use of U VWaterworks for disaster recovery (LBNL-3). UV Waterworks is a small, simple,inexpensive device that uses ultraviolet light to quickly and cheaply disinfectwater from the viruses and bacteria that cause cholera, typhoid, dysentery andother deadly diarrheal diseases. As a disaster relief technology, UV Waterworkscould shorten periods of business interruptions for affected communities andreduce health care costs by ensuring adequate clean water supply.

48
LBNL is actively discussing the merits of building commissioning with the twolargest U.S. providers of professional liability insurance for architects andengineers (LBNL-5). Building commissioning is a process by which a building’senergy service systems are tested and calibrated to advance the building systemfrom static installation to full working order. Building commissioning couldimprove indoor air quality (leading to reduced health claims and improved laborproductivity), reduces system and equipment design and failure (leading toreduced property damages), and also reduces professional liability claims for allparticipants in the design/build community.
In addition to these technology-specific activities, LBNL has been involved in anumber of support activities for the insurance industry and DOE. LBNL’s Centerfor Building Science recently completed a study on the costs of indoor air qualityillnesses with significant input from the insurance industry (Chen and Vine1998) (LBNL-10 and LBNL-15). LBNL is also assisting DOE in establishing aninsurance industry advisory group for improvements to the InternationalPerformance Measurement and Verification Protocols (IPMVP). The IPMVP is aconsensus document for measuring and verifying energy savings from energy-efficiency projects and is being expanded to include indoor air quality issues(Kromer and Schiller 1996).
We came across only one other example of a national laboratory activelycollaborating with the insurance industry. ORNL has a Cooperative Researchand Development Agreement (CRADA) with the Roofing Industry Committeeon Wind Issues (RICOWI) to investigate the durability of residential andcommercial roofing systems after a major wind event strikes the U.S. (ORNL-5).RICOWI includes all major roofing trade associations in North America andvarious insurance partners (the Institute for Business and Home Safety, StateFarm Insurance, Chubb Insurance and insurance consultants). The aim of thiscost-shared project is to analyze mechanisms of roof failure during severewindstorms and to identify specific ways in which energy-efficiency detailing canenhance roof structural integrity in the face of such storms.

49
2.6. Research from the Insurance Industry
Remarkably little nonproprietary research on the role of energy efficiency andrenewable energy technologies is conducted within the insurance industry. Theinsurance companies are in a very competitive business and are reluctant toshare information. Thus, most of their research is proprietary, in order to keeptheir competitive edge.
Frank Nutter, President of the Reinsurance Association of America, calls for theneed to integrate research from the natural sciences with the actuarial sciences,and indicates the need for more work on energy efficiency measures (Nutter1996). Increased insurance industry research in this area has also beenrecommended by Mills and Knoepfel (1997).
The founding of the Underwriters Laboratory (UL) early in this century stands asa precedent for organizing insurance-sponsored research.1 UL has been involvedrecently in scrutinizing the halogen torchiere light fixtures that have been linkedto many fires in homes and in dormitories (LBNL-1). Their work in redefiningthe safety test procedures for this product is an example of insurance-drivenresearch that also has implications for energy use and efficiency.
Similarly, the work of Factory Mutual Research Corporation (FMRC) has guidedresearch in property loss prevention for over 160 years.2 Owned by three propertyinsurers (Allendale Insurance, Arkwright, and Protection Mutual Insurance),FMRC has the world’s largest scientific complex dedicated solely to property lossprevention testing. Advanced research topics include: fire protection, seismicbracing, building materials, and structural dynamics. FMRC works with
1 The organization that later became UL was founded by William Henry Merrill, a Boston
electrical inspector, with financial backing provided by the insurance industry. Specifically,the Chicago Board of Fire Underwriters and the Western Insurance Association provided fundsto support the Merrill lab, which then became the Underwriter's Electrical Bureau. It was laterrenamed the Electrical Bureau of the National Board of Fire Underwriters when it receivednational support, and then renamed Underwriters Laboratories, Inc. in 1901 when it waschartered in Illinois. Their World Wide Web page is: http://www.ul.com
2 FMRC is a nonprofit scientific organization committed to property loss reduction. For more than160 years, FMRC has evaluated devices, assemblies, materials and services that are designed tohelp prevent and control property losses. Their World Wide Web page is:http://www.factorymutual.com.

50
insurance companies so that they use the technologies and servicesrecommended by FMRC.
We have identified a few examples of insurance-sponsored research in energyefficiency and renewable energy technologies, and these examples aresummarized below. As is the case with the National Laboratory examplesdescribed previously, these span the areas of direct technology development, toprocedural techniques such as inspections, to market-oriented research designedto gather basic statistics.
We reviewed the index of research review articles appearing in the Journal o f
the Society of Insurance Research from 1980 through mid-1996. The articlescover issues including market assessment, demographics, financial analysis,forecasting, market segmentation, health, and risk management.1 Articles byNutter (1996) and Mills (1996) were the only items found which dealt with theissues treated in this report.
An example of joint research between the energy and insurance communities isthe Cooperative Research and Development Agreement (CRADA) with theRoofing Industry Committee on Wind Issues (RICOWI) to investigate thedurability of residential and commercial roofing systems after a major windevent strikes the U.S. (ORNL-5) (see Section 2.5). The aim of this cost-sharedproject is to analyze mechanisms of roof failure during severe windstorms andto identify specific ways in which energy-efficiency detailing can also enhanceroof structural integrity in the face of such storms.
The Institute for Business and Home Safety (IBHS) has conducted or cosponsoredseveral relevant projects. These include participating in the above-mentionedcollaborative effort with the U.S. Department of Energy’s Oak Ridge NationalLaboratory (ORNL-5). IBHS has also investigated losses from frozen water pipes(IIPLR 1996a) and ice dams (IIPLR 1997), both of which have remedies involvingenergy-efficiency measures. Swiss Re has also investigated the dynamics offrozen water pipes, and has tabulated historical losses for two European countries(Swiss Re 1992).
1 This journal is available via http://connectyou.com/sir/subject.htm

51
Arkwright Mutual Insurance Company has worked with Lawrence BerkeleyNational Laboratory to design and execute a field study to assess the potential forenergy savings and risk reduction through the replacement of halogen torchierelight fixtures (LBNL-1) with energy-efficient and fire-safe compact fluorescentvariants. The site was student dormitories at Northeastern University (Avery etal. 1998).
Some engineering-oriented insurers have conducted field studies that, while nottechnical research in the purest sense, serve as an example of empirical studies oftechniques that relate energy and risk management issues. A prime example isthe work by Chubb on the use of infrared (IR) cameras (LBNL-27). Chubb’s aim isto identify risk factors such as otherwise undetectable electrical shortcircuits andrefrigeration equipment problems. Some of their applications have identifiedenergy savings opportunities, such as the repair of previously undetected brokendistrict heating lines and problems involving heating, refrigeration, and air-conditioning systems in buildings.
Another example of applicable techniques is the research being conducted by theprofessional liability division of DPIC Companies on the causes of claims amongits architect and engineering customers (Brady 1995; Thomson 1997). This workhas involved analysis of closed claims, and an assessment of how energy-oriented building commissioning can help avoid these losses (LBNL-5).
Many insurance-sponsored studies involve field inspections (another example oftechniques as distinct from technologies) to determine the causes of losses. Forexample, Hartford Steam Boiler recently examined 200 buildings, and identifieddeferred maintenance as a key cause of fire losses (Prince 1997).
Insurers have also begun to investigate the use of indoor air quality protocols asa means of avoiding related claims (IEQ Strategies Magazine 1997). Theseprotocols are based on indoor air quality studies, similar to those underway at thenational laboratories (e.g., see LBNL-10 and LBNL-15).

52
2.7. Risk Factors Associated with Energy-Efficiency and Renewable Energy
Technologies
Not all energy-efficiency and renewable energy technologies offer insurancebenefits. In fact, some may lead to elevated insurance risks. While we believethat the vast majority of connections are positive, it is important that futureinsurance/energy research activities be tailored to reduce or even eliminate theserisk factors through better design and application of these technologies.
In the past, the sporadic debate between the insurance and energy-efficiencycommunities has often been limited to single applications (lacking a systematicapproach) characterized by misunderstandings. For example, the insuranceindustry was very concerned at an early stage that insulation materials forresidential buildings would increase fire risk. It took many years for thoseconcerns and related misunderstandings to be resolved. Halven (1983) cautionedagainst the use of insulation, asserting that it is a volatile fuel for fire, but wenton to note that it is in fact the improper application of insulation (e.g., too closeto combustion appliances) that is the core problem. Thus, the issue shifts to oneof poor construction practices and code enforcement, rather than energyefficiency per se. In another example, some insurance groups believe that tightbuildings are more vulnerable to pressure build-up and explosion during intensewindstorms, while others are not (IIPLR 1996b). In any event, these potentialitiesmust be identified, analyzed, and mitigated.
Following are some illustrations of legitimate concerns:
1. Vinyl windows (a popular energy efficiency measure owing to thereduced heat loss through the window frame) can easily melt i nthe presence of fire. If the window then falls out, the fire isnourished with additional oxygen.
2. There are cases where substitution of natural gas for electricity isdesirable from an energy cost standpoint, and increased firehazards may result.
3. Improper application of building infiltration controls in theconstruction of building envelopes can lead to moisture damage.
4. Certain phase change materials (used as a thermal storagemedium in certain solar heating designs) are flammable.

53
5. Rooftop solar water heating systems can lead to water damages ifpipes are ruptured due to freeze or earthquake.
While some legitimate problems exist, care should be taken to separate thesefrom poorly reasoned or sensationalized concerns. For example, the popularmedia has fomented public misconceptions about the connection between energyefficiency and indoor air quality problems. The scientific record shows that whilemisapplications of efficient technologies can indeed contribute to indoor airquality (IAQ) problems, this is not a necessary consequence of energy efficiency.In fact, energy-efficiency strategies can also be synonymous with improved IAQ.

54
Chapter 3. The Insurance Value of Energy-Efficient and RenewableEnergy Technologies
The insurance and risk management communities have yet to formally andsystematically quantify the types of losses considered in this report, but a reviewof the energy and insurance literature has uncovered a cross-section of examplesfrom several countries of losses that are partly associated with energy-usingequipment (Tables 6 and 7).
Some notable U.S. examples of property losses from structural fires that might bemitigated partially through energy efficiency include 178,000 fires, 750 deaths, and$1.8 billion in insured losses annually stemming from heating or electricalequipment in buildings. Some relevant U.S. examples for health and lifeinsurance include 6,000 to 18,000 radon-related lung-cancer deaths annually,1,500 carbon monoxide deaths (and 12,000 carbon monoxide-related poisonings),and over 5,300 deaths from the largest urban heat catastrophes from 12 hotsummers in recent history.
Another example of the loss-prevention benefits of energy-saving strategiesconcerns fuel switching in certain residential appliances. For most householdappliances, the loss frequencies (e.g., fires per 1000 homes) vary considerablydepending on the choice of fuel. We find that the prospective combined annualloss reduction achievable by switching between electricity and natural gas forspace heating, water heating, and cooking in U.S. homes amounts to about 30,000fires (22% reduction from the baseline), $300 million in property losses (40%reduction), 2,200 civilian injuries (34% reduction), and 135 civilian deaths (21%reduction).1
1 The avoided losses are computed as the difference of (1) the total losses were all homes to have
the least safe fuel for the end use in question and (2) the total losses were all homes to have thesafer fuel. Thus, some of the savings (typically one-third to one-half) have already implicitlybeen “captured” as a result of existing instances where the safer fuel is used in the housing stock.

55
Table 6. Examples of Insured Property Losses that Can be Reduced byProper Application of Energy-Efficiency and Indoor-Environmental-Quality Technologies and Practices.
Losses from ice damage to roofs (ice dams)• U.S.: $20 to $30 million from one storm in 1995 (total damages, including
ice dams) (Levick 1996).
Losses from frozen water pipes• U.S. (1985-1995): $450 million/year (Tharpe 1996).• Switzerland (1988): US$29 million/year (36 million Swiss francs)--
residential only (this year was not considered a particularly severewinter in terms of freeze damage to buildings) (Swiss Re 1992).
• West Germany (1989): US$84 million/year (141 Million DM)--residentialonly (this year was not considered a particularly severe winter i nterms of freeze damage to buildings) (Swiss Re 1992).
Fires caused by heating equipment• Switzerland (1995): US$14 million (17.8 million Swiss francs) (Swiss Re
1992).• U.S. (1994): 75,100 structural fires (17% of total), 490 fire-related deaths
(14% of total), 1,970 injuries (10% of total), $622 million fire-related losses (14% of total) (Consumer Product SafetyCommission n/d). Residential buildings carry about 80% of theinsured losses, and nearly all of the fires, deaths, and injuries.
• Canada (1994): 5,331 structural fires (8% of total), 17 fire-related deaths(4.5% of total), 219 injuries (6.2% of total), $72 million fire-relatedlosses [$97 million C$] fire-related losses (8.4% of total(Association of Canadian Fire Marshals and Fire Commissioners1994).
Residential structural fires caused by electrical equipment and appliances• U.S. (1994): 178,400 structural fires (40% of total), 750 fire-related deaths
(22% of total), 7,330 injuries (37% of total), $1.2 billion fire-relatedlosses (28% of total) (Consumer Product Safety Commission n/d).Residential buildings carry about two-thirds of the insured losses,and a considerably higher share of number of fires, deaths, andinjuries.

56
Table 6 Continued. Examples of Insured Property Losses that Can beReduced by Proper Application of Energy-Efficiency and Indoor-Environmental-Quality Technologies and Practices.
• U.S. (1994): 8,700 fires, 50 related deaths, and 300 related injuries fromlamps and light fixtures, costing $102 million (Consumer ProductSafety Commission n/d). Nearly 232 reported house fires and 12related deaths from torchiere fixtures (6-year period), and over100 torchiere fires in college dorms during a recent 18-monthperiod. Litigation for the three largest house fires involves over$6 million in claims.
• Canada: At least 10 fires from torchiere light fixtures (Alberta Labour1997).
• United Kingdom (1995): $28 million (£ 46.6 million) from electricalequipment (of which 32% caused by electric lighting) (FirePrevention 1996).
• Switzerland (1995): $57 million (71.1 million Swiss francs) (of which 34%caused by cables/installation, 31% caused by appliances, 24%caused by incorrect use of appliances, 11% others) (VereinigungKantonaler Feuerversicherungen 1995).
• Canada (1994): 8,387 structural fires (13% of total), 17 fire-related deaths(5% of total), 394 injuries (11% of total), US$125 million ($168million $C) fire-related losses (15% of total) (Association ofCanadian Fire Marshals and Fire Commissioners 1994). [Includeselectrical distribution equipment such as wiring; does not includecooking equipment].
• Canada, U.S., United Kingdom (various): Cooking fires were found to befour times more common in homes with electric stoves (238 per100,000 households) than for relatively energy-efficient gas stoves(58 per 100,000 households) (Wijayasinghe and Makey 1997). Thesame ratio was found in a study conducted in the UK(Whittington and Wilson 1980). In the U.S., 104,800 residentialfires (25% of the total) were attributed to cooking equipment, withgas-fueled systems responsible for 85 per 100,000 households andelectric systems for nearly 100 per 100,000 households.
Premature failure of electronic equipment caused by poor indoor airquality
• U.S.: 20% of circuit board failures--$200 million per year in U.S.telephone switching offices (Litvak et al., 1995).
• West Germany (1984): US$80 million computer premiums; US$240million telecommunications and low-voltage equipmentpremium (Swiss Re 1987).
• Switzerland (1984): US$10 million computer premiums (Swiss Re 1987).

57
Table 6 Continued. Examples of Insured Property Losses that Can beReduced by Proper Application of Energy-Efficiency and Indoor-Environmental-Quality Technologies and Practices.
Avoided U.S. Residential Fire Loss es from Fuel Switching BetweenElectricity and Natural Gas 1
• U.S. (1990-1994 average): Avoided space heating fires – 18,019 fires (44%reduction), $132 million in property damage (34%), 356 civilianinjuries 21%), 198 deaths (44%). (Hall 1996; Wenzel et al. 1997)
• U.S. (1990-1994 average): Avoided water heating fires – 7,032 fires (65%),$94 million in property damage (-80%), 720 civilian injuries(92%), 67 deaths (94%). (Hall 1996; Wenzel et al. 1997)
• U.S. (1990-1994 average): Avoided cooking fires – 4,561 fires (5%), $71million in property damage (22%), 1,170 civilian injuries (24%), -130 deaths (71% increase). (Smith and Long n/d; Wenzel et al.1997)
1 Avoided losses are computed as difference of (1) the total losses were all homes to have the least
safe fuel for the end use in question and (2) the total losses were all homes to have the safer fuel.Thus, some of the savings (typically one-third to one-half) have already implicitly been"captured" as a result of existing instances where the safer fuel is used in the housing stock. Basedon a comparison of primary energy use, gas is more energy-efficient for cooking and space heating;electricity is more efficient for water heating based on heat pump water heater technology. Ineach case, the more efficient fuel choices correspond to lower loss rates. Heat pump space heatingis not evaluated here because the losses apply to central as well as room heating, and because theeffect of that particular equipment change on fire rates is not known. Where available, five-yearaverages are used to dampen year-to-year fluctuations in loss frequencies.

58
Table 7. Examples of Insured Health and Life Losses that Can be Reducedby Proper Application of Energy-Efficiency and Indoor-Environmental-Quality Technologies and Practices.
Deaths from extreme temperature episodes• U.S. (various): Over 5,300 summer heat deaths from a dozen urban heat
storms in U.S. cities (Whitman et al. 1997).• U.S. (1995): More than 46 deaths caused by cold waves (Swiss Re 1996).
Deaths or illness from carbon monoxide poisoning in homes ( (Chen 1995)• U.S.: Each year, about 1,500 deaths result from CO poisonings. Of these
about 1,000 are from CO emissions caused by malfunctioning,incorrectly installed, or misused combustion appliances such asfurnaces and gas ranges, by the improper indoor use of outdoorappliances like barbecues, and by operating automobiles orgenerators in garages. Centers for Disease Control in Atlantasuggests that the lifetime risk of unintentional fatal CO poisoningindoors is about one in 3,000. Malfunctioning indoor combustionappliances are the primary cause of CO poisonings.
• U.S. (1993): CO poisonings: More than 12,000 non-fatal carbon monoxidepoisonings were reported to the American Association of PoisonControl Centers in 1993, but the Association believes thisrepresents only a fraction of the actual number of events; often,nonfatal poisonings are often misdiagnosed as flu or otherafflictions.
Deaths or illness from radon gas in homes• U.S.: 4 million homes (6% of the entire housing stock) above US
Environmental Protection Agency safe levels; estimated 6,000 to18,000 lung cancer deaths annually. Associated medical and lifeinsurance costs not quantified.
• Norway: 200 deaths annually (Storebrand 1997).
Workers compensation losses caused by “sick building syndrome” or badindoor air quality
• U.S.: studies report that from 5 to 40% of workers report problems, costestimated at $50 billion annually (Fisk and Rosenfeld 1996).Largest U.S. insurance sick building syndrome claim to date is$29.9 million.

59
Table 7 Continued. Examples of Insured Health and Life Losses that Can beReduced by Proper Application of Energy-Efficiency and Indoor-Environmental-Quality Technologies and Practices.
Litigation costs as a result of “sick building syndrome” or bad indoor airquality
• U.S.: (1) a new Polk County, Florida courthouse was found to cause anumber of cases of sick building syndrome, and the insurancecompany was forced to pay $35 million in damages; (2) acourthouse in Martin County, Florida, experienced indoor airquality problems, and the construction company and threeinsurance companies were forced to pay $13.7 million i ndamages; and (3) respiratory problems experienced by employeesin the U.S. Environmental Protection Agency’s headquartersbuilding resulted in a jury awarding nearly $1 million to fiveplaintiffs (Chen and Vine 1998).
Health insurance costs of asthma (partially related to indo or air quality)• U.S.: $13 billion annually (Fisk and Rosenfeld 1996).• West Germany: About 8 million German citizens suffer from asthma.
Among children the asthma rate is 12 to 15 %, and it is the mostcommon chronic childhood illness. Since the end of World WarII the number of children to suffer from asthma has increasedtenfold. About 6,000 children die each year of asthma in Germany(GERmNews, n/d).
60
Chapter 4. Next Steps in Supporting Research Efforts
In Chapter 2, a number of promising technologies and services were identified,including the development of energy-efficient and fire-resistant windows, lightfixtures, improved indoor air quality monitoring devices, methods to reduceairborne disease transmission in office buildings, building commissioning,energy management control systems, and building code enforcement. While nottechnology development per se, there is a need for improved research on manyfundamental building science issues, such as ice dam formation and mitigation,and the causes of Sick Building Syndrome. Other research opportunities includedefinitive studies on the connections between indoor environmental factors(e.g., air quality, lighting, and thermal comfort) and worker productivity andhealth (Chen and Vine 1998; Fisk and Rosenfeld 1997).
The energy efficiency and renewable energy community and the insurance andrisk management communities (e.g., researchers, insurance companies,government, energy service companies, and utility companies) need to worktogether in the following ways:
1. Participate in strategic research, development and demonstration(RD&D) activities necessary to move new loss-reducingtechnologies into the marketplace.
2. For those energy-efficiency and renewable energy technologiesthat are commercially available, encourage customers to employtechnologies and practices that reduce the likelihood of insuredhealth, property, and liability losses.
The focus of this report has been on the development of new products andservices. But basic market research is also needed on the particular types of lossespotentially addressed by energy-efficient and renewable energy technologies.There is currently a remarkable lack of basic data on specific loss categories ofinterest for these technologies (e.g., fires caused by halogen light fixtures (LBNL-1)). New categories of insurance loss statistics need to be collected, so that it may
61
be easier to quantify the potential loss reductions from the types of measuresdescribed in this report.
Most of the technologies described in this report were supported by government-sponsored RD&D programs over many years of effort. These technologies havemany benefits, including insurance loss reduction and prevention and riskmanagement. The insurance and risk management communities could takeadvantage of these technologies, either independently or in cost-sharingpartnerships with existing R&D programs. Insurance industry support ofstrategic energy-related RD&D has been endorsed by the Reinsurance Associationof America (Nutter 1996).
The cost for conducting research on the technologies and services described i nthis report is significant. Accordingly, we recommend that representatives fromthe insurance and risk management communities, the national laboratories, andthe U.S. Department of Energy convene a meeting to review the projects in theinventory and develop a national insurance research agenda for the nationallaboratories in order to prioritize the type of research that needs to be conductedand to discuss potential collaborations (see Section 2.4).
Past experience in the energy sector could offer a model for interdisciplinaryinsurance industry R&D in this area. The Electric Power Research Institute(EPRI) and the Gas Research Institute (GRI) spend $1 billion a year on technologyand market research for energy utilities (about 1/500th of their members’revenues). They provide a common knowledge base for large and small energycompanies and serve as an interface among the numerous energy utilitycompanies, regulatory bodies, and providers of energy technologies. A researchfund based on 1/10,000th of property casualty premium revenues wouldrepresent a $6 million annual program, which we suggest could be matched bythe U.S. Department of Energy. Insurance regulators would need to approve thisproposal. In the U.S., the insurance industry’s Institute for Business and HomeSafety (IBHS) is one venue where such research could take place. IBHS’s missionis to reduce deaths, injuries, and loss of property resulting from natural disasters.

62
The activities of the Bermuda Biological Station for Research are also worthnoting.1 While this insurer-funded program focuses on global climate changeand natural disasters (rather than on energy issues), this is a good model for howinsurers can pool resources in order to conduct research of strategic importance.
1 The World Wide Web page is: http://www.bbsr.edu.

63
Acknowledgments
This work was supported by the Assistant Secretary for Energy Efficiency andRenewable Energy of the U.S. Department of Energy under Contract No. DE-AC03-76SF00098. We are especially grateful for the individuals who assisted us i nthis effort at the U.S. Department of Energy, the national laboratories, and in theinsurance industry. In particular, we would like to thank Bill Becker, CathyGhandehari, Ann Deering, and Mark Ginsberg for their support and assistance.We would also like to express our appreciation for the following people whoreviewed an earlier draft of this report: Hashem Akbari, Mike Apte, Bill Becker,Mary Breighner, John Byrne, Elton Cairns, Chris Cameron, Jim Cavallo, TerryCooper, Paul Croce, Joan Daisey, Andre Desjarlais, Kevin Drost, Paul Eichamer,David Faulkner, Helmut Feustel, Bill Fisk, Cathy Ghandehari, Steve Greenberg,Brent Griffith, Donna Hawkins, Robert Hawsey, Sue Hock, Greg Kats, Peter Kelly,Do Kim, Ivo Knoepfel, Richard Krajewski, Eugene Lecomte, Jerry Lopes, JimMcMahon, Mark Mehos, Rudolph Matalucci, David Menicucci, Jeff Muhs, MaryAnn Piette, Art Rosenfeld, Jim Russell, Jim Sand, Ray Smith, John Talbott, RusiTaleyarkhan, Frank Tokarz, David Unnewehr, Ken Wilkes, Bill Young, andWarren Zurn.

64
References
Alberta Labour, Fire Commissioner’s Office. 1997. Alberta Fire News. (May).
Association of Canadian Fire Marshals and Fire Commissioners. 1994. Annual
Report: Fire Losses in Canada, p. 22.
Association of Canadian Fire Marshals and Fire Commissioners. 1994. Annual
Report: Fire Losses in Canada, Table 5.
Avery, D, E. Mills, M. Breighner, and J. Naylis. 1998. “Lighting Efficiency Optionsfor Student Residential Living Units: A Study Conducted at NortheasternUniversity,” Arkwright Mutual Insurance Company and LawrenceBerkeley National Laboratory. (Forthcoming).
Brady, R. 1995. “Commissioning Services Can Reduce Professional LiabilityLosses,” Proceedings of the Third National Conference on Building
Commissioning. Portland Energy Conservation Inc., Portland, OR.
Chen, A. 1995. “An Inexpensive CO Sensor,” Center for Building Science N e w s
#6, Spring.
Chen, A. and E. Vine. 1998. “A Scoping Study on the Costs of Indoor Air QualityIllnesses: An Insurance Loss Reduction Perspective,” Report No. 41919.Lawrence Berkeley National Laboratory, Berkeley, CA.
Consumer Product Safety Commission. (n/d). “1994 Residential Fire LossEstimates.” Washington, D.C.
Fire Prevention, Nr. 295 (Dec. 1996), page 35.
Fisk, W.J. and A.H. Rosenfeld. 1996. “Improved Productivity and Health fromBetter Indoor Environments,” Report No. 39596. Lawrence BerkeleyNational Laboratory, Berkeley, CA.

65
Fisk, W.J. and A.H. Rosenfeld. 1997. “Estimates of Improved Productivity andHealth from Better Indoor Environments,” Indoor Air 7:158-172.
GERmNews (German news service), based on an announcement by the Germanasthma association.
Hall, J.R. 1996. U.S. Home Heating Fire Patterns and Trends Through 1994,National Fire Protection Association, Quincy, MA.
Fire Analysis and Research Division, National Fire Protection Association.(October)
Halven, F.C. 1983. “Building Energy Efficiency and the Fire Problem,”Proceedings of the Second International PLEA Conference, Crete, Greece,28 June – 1 July. (Pergamon Press): 811-818, London, UK.
IEQ Strategies Magazine. 1997. “Building Owners May Soon Be Able to Buy IAQInsurance Policy,” pp. 15-16, (October).
Insurance Institute for Property Loss Reduction (now the Institute for Business &Home Safety). 1996a. “Freezing and Bursting Pipes,” Natural Hazard
Mitigation Insights, No. 2, Boston, MA.
Insurance Institute for Property Loss Reduction (now the Institute for Business &Home Safety). 1996b. “Tornadoes,” Natural Hazard Mitigation Insights,No. 3, Boston, MA.
Insurance Institute for Property Loss Reduction (now the Institute for Business &Home Safety). 1997. “Ice Dams,” Natural Hazard Mitigation Insights, No 6.Boston, MA.
Kromer, J. and S. Schiller, 1996. “National Measurement and VerificationProtocols,” Proceedings of the 1996 ACEEE Summer Study, Vol. 5, pp. 141-146. American Council for an Energy-Efficient Economy, Washington, D.C.
Lecomte, E. 1998. Personal communication, April 13, 1998.

66
Levick, D. 1996. “Insurers in State Awash in Claims Related to Water Damage,”The Hartford Courant, Jan. 20, Hartford, CT.
Litvak, A., A. Gadgil, and W.J. Fisk. 1995. “Electronics Reliability and Indoor AirQuality,” (Berkeley CA: Lawrence Berkeley National Laboratory, October)Internal Memorandum.
Mills, E. 1996. “Energy-Efficiency: No-Regrets Climate Change Insurance for theInsurance Industry,” Research Review: Journal of the Society of Insurance
Research, 9(3):21-58.
Mills, E. 1997. “Going Green Reduces Losses,” Reinsurance, 27(12):4..
Mills, E. and I. Knoepfel. 1997. “Energy-Efficiency Options for Insurance LossPrevention,” LBNL Report LBNL-40426, Lawrence Berkeley NationalLaboratory, Berkeley, CA.
Mills, E., A. Deering, and E. Vine. 1998. “Energy Efficiency: Proactive Strategiesfor Risk Managers,” Risk Management 45(3):12-16.
Nutter, F. 1996. “Insurance and the Natural Sciences: Partners in the PublicInterest,” Research Review: Journal of the Society of Insurance Research,9(3):15-19.
Prince, M. 1997. “Study Sparks Inspections,” Business Insurance, (May 12, p. 3).
Smith, L. and K. Long. n/d. 1994 Residential Fire Loss Estimates. ConsumerProducts Safety Commission, Washington, D.C.
Storebrand. 1997. Environmental Annual Report.
Swiss Re. 1996. Sigma 2/1996. “Natural Catastrophes and Major Losses in 1995”,Zurich, Switzerland.
Swiss Re. 1992. “Pipes and Water Damage,” Report No. RD/RM 2500e 9/94,Zurich, Switzerland.
Swiss Re. 1987. “Computer Insurance,” p 24. Report 1000e/9/90, Zurich,Switzerland.

67
Tharpe, G. 1996. “Avoid Chilling Prospect of Frozen Pipes,” The Atlanta
Journal/The Atlanta Constitution, February 19, p. E2, citing statistics fromthe Institute for Business and Home Safety.
Thomson, J. 1997. “Can Commissioning Impact Professional Liability ClaimsMade against Architects and Consulting Engineers?” In the Proceedings o f
the 1997 Building Commissioning Conference., Portland EnergyConservation, Inc., Portland, OR.
Vereinigung Kantonaler Feuerversicherungen: “Auszug aus derSchadenstatistik 1995,” Bern, Switzerland.
Wenzel, T., J. Koomey, G. Rosenquist, M. Sanchez, and J. Hanford. 1997. Energy
Data Sourcebook for the U.S. Residential Sector. LBNL Report 40297,Lawrence Berkeley National Laboratory, Berkeley, CA.
Whitman, S., et al. 1997. “Mortality in Chicago Attributed to the July 1995 HeatWave,” American Journal of Public Health.
Whittington, C. and J.R. Wilson. 1980. “Fat Fires: A Domestic Hazard,” Fires and
Human Behaviour, John Wiley & Sons, Ltd. New York.
Wijayasinghe, M.S. and T. B. Makey. 1997. “Cooking Oil: A Home Fire Hazard i nAlberta, Canada,” Fire Technology Journal. Vol. 33, No. 2.