energy efficienct digital networks networks are the foundation ... • network connections are a...
TRANSCRIPT

Energy Research and Development Div is ion FINAL PROJECT REPORT
ENERGY EFFICIENT DIGITAL NETWORKS
MARCH 2011CEC ‐500 ‐2013 ‐102
Prepared for: California Energy Commission Prepared by: Lawrence Berkeley National Laboratory

PREPARED BY: Primary Author(s): Bruce Nordman Steven Lanzisera Richard Brown Environmental Energy Technologies Division Lawrence Berkeley National Laboratory 1 Cyclotron Road Berkeley, CA 94720 Contract Number: 500-06-022 Prepared for: California Energy Commission Bradley C. Meister, Ph.D., P.E. Contract Manager Virginia Lew Office Manager Energy Efficiency Research Office Laurie ten Hope Deputy Director ENERGY RESEARCH AND DEVELOPMENT DIVISION Robert P. Oglesby Executive Director
DISCLAIMER This report was prepared as the result of work sponsored by the California Energy Commission. It does not necessarily represent the views of the Energy Commission, its employees or the State of California. The Energy Commission, the State of California, its employees, contractors and subcontractors make no warranty, express or implied, and assume no legal liability for the information in this report; nor does any party represent that the uses of this information will not infringe upon privately owned rights. This report has not been approved or disapproved by the California Energy Commission nor has the California Energy Commission passed upon the accuracy or adequacy of the information in this report.

i
DISCLAIMER
The Lawrence Berkeley National Laboratory, a laboratory owned by the United States Department of Energy (DOE), is located at 1 Cyclotron Rd., Berkeley, CA is a national laboratory of the DOE managed by Regents of the University of California for the DOE under Contract Number DE‐AC02‐05CH11231. This report was prepared as an account of work sponsored by the Sponsor and pursuant to an M&O Contract with the DOE. Neither Regents of the University of California, nor the DOE, nor the Sponsor, nor any of their employees, contractors, or subcontractors, makes any warranty, express or implied, or assumes any legal liability or responsibility for the accuracy, completeness, or usefulness of any information, apparatus, product, or process disclosed, or represents that its use would not infringe on privately owned rights. Reference herein to any specific commercial product, process, or service by trade name, trademark, manufacturer, or otherwise, does not necessarily constitute or imply its endorsement, recommendation, or favoring by Regents of the University of California, or the DOE, or the Sponsor. The views and opinions of authors expressed herein do not necessarily state or reflect those of Regents of the University of California, the DOE, or the Sponsor, or any of their employees, or the Government, or any agency thereof, or the State of California. This report has not been approved or disapproved by Regents of the University of California, the DOE, or the Sponsor, nor has Regents of the University of California, the DOE, or the Sponsor passed upon the accuracy or adequacy of the information in this report.

ii
ACKNOWLEDGEMENTS
This work was supported by the Public Interest Energy Research Program (PIER) of the California Energy Commission, under Contract No. 500‐06‐022. The project team at Lawrence Berkeley National Laboratory would like to thank the sponsor, the Public Interest Energy Research Program of the California Energy Commission, and especially the Contract Manager, Brad Meister, and the PIER Buildings Group Program Area Lead, Chris Scruton. Thanks to the following individuals who contributed to this work: • Tom Bolioli (Terra Novum, LLC) • John Nels Fuller • Lawrence Berkeley National Laboratory staff: Michael Bennett, Peter Biermayer, Hoi Y. Cheung, Marla Sanchez, Margarita Kloss, John Busch, and Paula Ashley. • United States Environmental Protection Agency ENERGY STAR staff: Katharine Kaplan and Andrew Fanara. Thanks to the many industry professionals who shared their ideas and feedback on this project.

iii
PREFACE
The California Energy Commission Energy Research and Development Division supports public interest energy research and development that will help improve the quality of life in California by bringing environmentally safe, affordable, and reliable energy services and products to the marketplace.
The Energy Research and Development Division conducts public interest research, development, and demonstration (RD&D) projects to benefit California.
The Energy Research and Development Division strives to conduct the most promising public interest energy research by partnering with RD&D entities, including individuals, businesses, utilities, and public or private research institutions.
Energy Research and Development Division funding efforts are focused on the following RD&D program areas:
• Buildings End‐Use Energy Efficiency
• Energy Innovations Small Grants
• Energy‐Related Environmental Research
• Energy Systems Integration
• Environmentally Preferred Advanced Generation
• Industrial/Agricultural/Water End‐Use Energy Efficiency
• Renewable Energy Technologies
• Transportation
Energy Efficient Digital Networks is the final report for the Energy Efficient Digital Networks project, contract number 500‐06‐022, conducted by Lawrence Berkeley National Laboratory. The information from this project contributes to Energy Research and Development Division’s Buildings End‐Use Energy Efficiency Program.
For more information about the Energy Research and Development Division, please visit the Energy Commission’s website at www.energy.ca.gov/research/ or contact the Energy Commission at 916‐327‐1551.

iv
ABSTRACT
Digital networks are the foundation of information services and play an expanding and indispensable role in our lives via the Internet, email, and mobile phones. These networks consume energy, both through direct energy use of network interfaces and the equipment that comprises the network, and in the effect they have on the operating patterns of devices connected to the network. The purpose of this research was to investigate a variety of technology and policy issues related to the energy use caused by digital networks, and to further develop several energy‐efficiency technologies targeted at networks.
Improving network energy efficiency often requires addressing not just one device but the entire network. For this reason, much of this research focused on influencing the standard protocols and applications that define the network, including:
• Working with the Institute of Electrical and Electronic Engineers, this project supported creating a new technology standard, IEEE 802.3az (“Energy Efficient Ethernet”) to enable most Ethernet link technologies to save energy when lightly used, which is most of the time for most interfaces.
• Partnering with the University of South Florida, Intel Corporation, and others, researchers developed the network connectivity proxying concept. The team then worked with the Ecma International standards organization and its member companies to create a technology standard for network proxying.
• Network connections are a significant driver of set‐top box energy use, and network presence proxying is an important technology for reducing this energy use.
The project demonstrated that targeted investment in research and technology on networks by the energy efficiency community can result in considerable energy savings. The project findings can be applied to help California meet its energy goals in the coming decades, and also to reduce energy use both nationally and globally.
Keywords: Energy Efficient Ethernet, network presence proxying, energy efficiency specifications, network equipment, audio‐video bridging, consumer electronics, inter‐device power control, set‐top box, televisions, hard‐wired equipment, builder‐installed equipment, market transformation for digital networks
Please use the following citation for this report:
Nordman, Bruce, Steven Lanzisera, and Richard Brown (Lawrence Berkeley National Laboratory). 2011. Energy Efficient Digital Networks. California Energy Commission. Publication number: CEC‐500‐2013‐102.

v
TABLE OF CONTENTS
Disclaimer.................................................................................................................................................... i
Acknowledgements ................................................................................................................................. ii
PREFACE .................................................................................................................................................. iii
ABSTRACT .............................................................................................................................................. iv
TABLE OF CONTENTS ........................................................................................................................... v
LIST OF FIGURES ................................................................................................................................... ix
LIST OF TABLES ..................................................................................................................................... ix
EXECUTIVE SUMMARY ........................................................................................................................ 1
Introduction ............................................................................................................................................ 1
Project Purpose ....................................................................................................................................... 1
Project Results ......................................................................................................................................... 2
Benefits to California ............................................................................................................................. 3
CHAPTER 1: Project Goals and Objectives ........................................................................................ 5
1.1 Introduction ................................................................................................................................ 5
1.2 Background ................................................................................................................................. 6
1.2.1 Energy Efficient Ethernet (EEE) ....................................................................................... 7
1.2.2 Network Presence Proxying ............................................................................................. 7
1.2.3 Energy Efficiency Specifications for Network Equipment ........................................... 7
1.2.4 Ethernet Audio/Video Bridging (AVB) Standards ........................................................ 8
1.2.5 Consumer Electronics (CE) Inter‐Device Power Control ............................................. 8
1.2.6 Energy‐Efficient Set‐Top Box ........................................................................................... 8
1.2.7 Reducing Energy Use of Hard‐Wired and Builder‐Installed Miscellaneous Equipment in New Homes ............................................................................................................... 8
1.2.8 Transforming the Markets for Digital Networks ........................................................... 9
1.3 Motivation ................................................................................................................................... 9
CHAPTER 2: Energy Efficient Ethernet .............................................................................................. 12
2.1 Introduction .............................................................................................................................. 12

vi
2.2 Background ............................................................................................................................... 12
2.2.1 Technical Origin ............................................................................................................... 12
2.3 Standards Activities ................................................................................................................. 12
2.3.1 Origin ................................................................................................................................. 12
2.3.2 IEEE 802 Standards Processes ........................................................................................ 13
2.3.3 Control Policy ................................................................................................................... 15
2.4 Technology Issues .................................................................................................................... 15
2.4.1 Latency ............................................................................................................................... 16
2.4.2 Energy Savings ................................................................................................................. 17
2.4.3 Packet Loss ........................................................................................................................ 17
2.5 Project Phases ........................................................................................................................... 18
2.5.1 IEEE 802 Initial Discussions ............................................................................................ 18
2.5.2 Future Issues ..................................................................................................................... 19
2.6 Summary and Next Steps ....................................................................................................... 20
2.6.1 Next Steps: Standards ...................................................................................................... 20
2.6.2 Conclusions ....................................................................................................................... 20
CHAPTER 3: Network Presence Proxying ......................................................................................... 22
3.1 Introduction .............................................................................................................................. 22
3.2 Background ............................................................................................................................... 22
3.3 Energy Savings ......................................................................................................................... 23
3.3.1 How Much Energy Is at Stake? ...................................................................................... 23
3.3.2 Why Are PCs on When No One Is Present? ................................................................. 24
3.4 Technology Issues .................................................................................................................... 26
3.5 Policy Context ........................................................................................................................... 29
3.6 Standards Process and Content .............................................................................................. 30
3.6.1 Link .................................................................................................................................... 32
3.6.2 Network ............................................................................................................................. 32
3.6.3 Application ........................................................................................................................ 32

vii
3.7 Next Steps .................................................................................................................................. 33
3.8 Conclusions ............................................................................................................................... 34
CHAPTER 4: Energy Efficiency Specifications for Network Equipment .................................... 36
4.1 Background ............................................................................................................................... 36
4.2 Energy Consumption ............................................................................................................... 38
4.2.1 Methodology ..................................................................................................................... 38
4.2.2 Use Estimates .................................................................................................................... 38
4.3 Energy Savings Potential ........................................................................................................ 42
4.4 Barriers to Efficiency ................................................................................................................ 44
4.4.1 Residential Equipment .................................................................................................... 44
4.4.2 Enterprise Switches .......................................................................................................... 46
4.5 Testing Network Equipment .................................................................................................. 47
CHAPTER 5: Ethernet Audio‐Video Bridging .................................................................................. 49
5.1 Introduction .............................................................................................................................. 49
5.2 Background ............................................................................................................................... 49
5.2.1 Goals .................................................................................................................................. 49
5.2.2 Approach ........................................................................................................................... 50
5.2.3 Significant Technology Issues Encountered ................................................................. 50
5.2.4 Implications ....................................................................................................................... 50
5.3 Report Background .................................................................................................................. 51
5.3.1 Overview of IEEE P802.3az Energy Efficient Ethernet (EEE) .................................... 51
5.3.2 Overview of Audio‐Video Bridging (AVB) .................................................................. 51
5.3.3 IEEE P802.1AS Timing and Synchronization ............................................................... 52
5.3.4 IEEE P802.1Qat Stream Reservation Protocol .............................................................. 52
5.3.5 IEEE P802.1Qav Forwarding and Queuing Enhancements for Time‐Sensitive Streams 52
5.3.6 IEEE P802.1BA Audio Video Bridging (AVB) Systems .............................................. 53
5.4 Areas of Concern between AVB and EEE............................................................................. 53
5.4.1 Delay While Exiting LPI .................................................................................................. 53

viii
5.4.2 Negotiated Delay ............................................................................................................. 54
5.4.3 When to Assert LPI .......................................................................................................... 54
5.4.4 Completing the Specifications ........................................................................................ 54
5.4.5 Maximizing Power Savings ............................................................................................ 54
5.5 Summary and Recommendations .......................................................................................... 55
CHAPTER 6: Consumer Electronics Inter‐Device Power Control ................................................. 56
6.1 Background ............................................................................................................................... 56
6.2 Potential Solutions ................................................................................................................... 57
6.3 Barriers to Savings ................................................................................................................... 57
6.4 Device Behaviors for Energy Savings ................................................................................... 58
6.5 Implementation ........................................................................................................................ 59
CHAPTER 7: The Energy‐Efficient Set‐Top Box ............................................................................... 61
7.1 Background and Market Status .............................................................................................. 61
7.2 Digital Networks as an Efficiency Tool ................................................................................. 62
7.3 Effect of Digital‐To‐Analog (DTA) Policies on Energy Use ............................................... 62
7.4 Conclusions ............................................................................................................................... 63
CHAPTER 8: Reducing Energy Use of Hard‐Wired and Builder‐Installed Miscellaneous Equipment in New Homes .................................................................................................................... 64
8.1 Background ............................................................................................................................... 64
8.2 Market and Product Assessment ........................................................................................... 64
8.2.1 Background Research ...................................................................................................... 64
8.2.2 Saturations......................................................................................................................... 65
8.2.3 Annual Unit Energy Consumption ............................................................................... 65
8.2.4 Detailed Assessment of Products .................................................................................. 66
8.3 Conclusions ............................................................................................................................... 71
8.4 Future Research Directions ..................................................................................................... 72
CHAPTER 9: Transforming the Market for Digital Networks ...................................................... 73
CHAPTER 10: Conclusions and Recommendations ......................................................................... 75
10.1 Conclusions ............................................................................................................................... 75

ix
10.1.1 Digital Networks Have a Significant Energy Impact and Savings Potential ........... 75
10.1.2 Develop Technologies to Scale Network Energy Use to the Services Delivered .... 75
10.1.3 Technology Standards and Voluntary Programs Are Critical for Energy Savings in Digital Networks .............................................................................................................................. 76
10.2 Recommendations .................................................................................................................... 76
10.3 Benefits to California ............................................................................................................... 77
GLOSSARY .............................................................................................................................................. 79
REFERENCES .......................................................................................................................................... 82
APPENDIX A: Energy Efficient Specifications for Network Equipment Report ..................... A‐1
APPENDIX B: Power Control Implementation Report ................................................................. B‐1
LIST OF FIGURES
Figure 1: Network and Networked Devices ........................................................................................... 6 Figure 2: The Energy Efficient Ethernet Logo ...................................................................................... 13 Figure 3: Structure of the IEEE 802 Entities .......................................................................................... 14 Figure 4: Flow of the IEEE 802 Standards Approval Process ............................................................ 14 Figure 5: Link Performance in Relation to Rate Switching Time ...................................................... 16 Figure 6: Network Switch Power Use in Relation to Number of Connected Devices and Link Speed .......................................................................................................................................................... 17 Figure 7: Energy Use by Power Level for Average Desktop Computer for One Year ................... 23 Figure 8: Proxy Sequence ........................................................................................................................ 26 Figure 9: Host ‐ Proxy ‐ Internet Interaction ........................................................................................ 27 Figure 10: Ecma Logo .............................................................................................................................. 29 Figure 11: Ecma‐393 ................................................................................................................................. 31 Figure 12: Schematic of an Enterprise Network .................................................................................. 37 Figure 13: Breakdown of Energy Use by Major Product Category in 2008 for the World (left) and the U.S. (right) ................................................................................................................................... 41 Figure 14: Switching Product Energy Use over Time ......................................................................... 42 Figure 15: Number of Builder‐installed Products per New Home in Northern California .......... 65 Figure 16: Standby Power Draw and Power Factor for Irrigation Controllers ............................... 68 Figure 17: Garage Door Opener Energy Use by Mode ....................................................................... 69 Figure 18: No‐Load Power Draw for GFCIs ......................................................................................... 70 Figure 19: Standby Power vs. Rated Capacity of Class II Transformers .......................................... 71
LIST OF TABLES
Table 1: Energy Used by Network Equipment in 2008 ......................................................................... 8 Table 2: Annual Global Energy Use of Network Equipment, by Device Type (TWh)................... 39

x
Table 3: Annual U.S. Energy Use of Network Equipment, by Device Type (TWh) ....................... 40 Table 4: Ethernet Low‐Power Idle Characteristics .............................................................................. 51 Table 5: Estimated Energy Consumption for Builder‐Installed Equipment in CA ........................ 66 Table 6: Comparison of Conventional and Smart Controller Energy Consumption .................... 67 Table 7: Transforming the Network for Digital Networks – Highlights .......................................... 74

1
EXECUTIVE SUMMARY
Introduction
Digital networks are the foundation of information services, such as cell phones, e‐mail, and the Internet, and are an expanding and indispensable part of our lives. With the wide availability of these networks, many of the devices and equipment we use in buildings increasingly depend on these networks for the functions they perform. Today, networked devices are mostly electronics, but other types of devices are gaining rich communications ability. While the information services provided by these networks are perceived almost universally as providing a net benefit to society, one drawback is that they increase energy use, both through the direct energy use of the network interfaces and the equipment that comprises the network, and in the effect they have on the operating patterns of devices connected to the network. Until this project began, there was no significant effort to address the energy consequences of networks in order to save energy through improved technologies and policy.
Project Purpose
The purpose of this research was investigating a variety of technology and policy issues related to the energy used by digital networks, and furthering the development of several energy‐efficiency technologies targeted at networks. Several of these technologies have since been introduced to the market, saving energy in California, the United States, and globally. By collecting and compiling technical information about digital networks, this project sought to help improve policy making from the state through the global level. Understanding how these products and technologies affect energy consumption will enable the California Energy Commission and other stakeholders to identify cost-effective energy savings in this area.
Because networks are by their very nature a collection of devices, improving network energy efficiency often requires addressing not just one device but the entire network. In many cases this can only be achieved by influencing the standard protocols and applications that define the network. For this reason, much of the research conducted in this project focused on these network standards.
The project had the following research objectives:
• Advancing the potential for Ethernet technology to save energy through changing behavior at times of low data‐traffic levels.
• Conducting research on network connectivity proxying to allow electronic devices to sleep while still connected to the network, with emphasis on how proxying might be standardized and brought into the market.
• Estimating and documenting the current electricity consumption of network equipment in the United States, and suggesting policy measures to reduce it in the future.
• Assessing how power consumption is addressed in audio‐video network communications technologies such as the Institute of Electrical and Electronic Engineers

2
(IEEE) 1394 audio‐video (AV) standard.
• Reviewing how connected audio‐video devices allow their power state to be managed over the network, and developing strategies for how this capability should evolve in the future by minimizing the time devices are on when not needed and enabling maximum energy savings.
• Understanding key issues about set‐top box energy use, and recommending actions that the Energy Commission can take to reduce this energy use.
• Investigating the energy use of hard‐wired and builder‐installed equipment in new homes, and assessing whether energy‐intensive equipment types have commercially available products that can significantly reduce energy use.
Project Results
Key results from this project included:
• Working with IEEE, this project supported creating a new technology standard, IEEE 802.3az (also known as “Energy Efficient Ethernet”) to enable most Ethernet link technologies to save energy when lightly used, which is most of the time for most interfaces.
• The research team worked with collaborators from the University of South Florida, Intel Corporation, and others to develop the network connectivity proxying concept. The team then worked with the Ecma International standards organization and its member companies to create a technology standard for network proxying.
• The research team created the first national estimate of network equipment energy use. This research also identified policy directions for California to take in reducing the energy use of network equipment.
• Through careful review of draft Ethernet standards, the research team clarified that there was no fundamental conflict between Ethernet Audio/Video Bridging (an emerging networking technology for transmission of audio‐video content) and Energy Efficient Ethernet. The project researchers identified several clarifications to assure maximum compatibility between these two technologies.
• The research team created a generic approach for addressing inter‐device power control of audio‐video products that can be the basis of future technology standards for this industry.
• This research concluded that network connections are a significant driver of set‐top box energy use, and identified network presence proxying as an important technology for reducing this energy use.
This project showed that networks use significant amounts of energy in California, and that reduction measures merit attention and investment. The project also showed that network

3
energy use has been increasing and will continue to do so in the near term. The project demonstrated that targeted investment in research and technology on networks by the energy efficiency community can result in new technology that saves considerable energy. This type of activity will be necessary for California to meet its goals for energy saving in the coming decades, as well as to save energy on national and global scales.
Networks provide a continuing source of increasing energy use, and this project examined potential reduction strategies. An understanding of how network technology affects energy use is essential to choosing how to respond to this challenge. While there is growing interest in the topic nationally and globally, California remains a leader, leveraging its concentration of companies that drive the network industry and electronics in general. The research team’s recommendations included:
• Considering potential network issues in new and updated standards for buildings and equipment, including test procedures.
• Identifying the most promising near‐term technology development options that the Energy Commission should pursue for extending California’s track record of working with industry for the benefit of consumers and energy efficiency.
• Demonstrating proxying technology, with the goal of greatly increasing the share of personal computers on the market with proxying capability and similarly increasing proxy use by customers.
• Assessing how the networking capabilities of smart appliances and smart grid‐enabled equipment will affect these products’ energy use, and identifying ways for reducing the energy impact of these networking capabilities.
Benefits to California
This project had the following short-term, direct benefits to California:
• As a result of the Energy Efficient Ethernet, energy savings for California should eventually reach tens of millions of dollars per year at little or no cost to consumers.
• Hundreds of millions of dollars per year of electricity in California is used by computers that are fully on, but idle. Proxying has the potential to significantly reduce this energy use at very low cost. An increasing number of devices, besides computers, have sophisticated network connectivity and could benefit from the technology as well.
• California now has an accurate and detailed estimate of network equipment energy use, a method for tracking changes in total energy use over time, and policy prescriptions for addressing this growing area of usage.
• The Ethernet technologies for Ethernet Audio/Video Bridging and Energy Efficient Ethernet can be compatibly implemented, making Energy Efficient Ethernet an efficient and viable alternative technology for networking audio and video devices.

4
• Groundwork has been laid for future standards development to make audio‐video devices easier to use and to make power management more transparent and automatic, enabling large savings at virtually no cost.
• California policy makers now have two identified technologies, Energy Efficient Ethernet and network presence proxying, that can reduce set‐top box energy use in the state by 50 percent or more.
5
CHAPTER 1: Project Goals and Objectives This research project explored energy use and potential savings measures for a variety of networking technologies applied to electronic products, including Ethernet, network presence proxying, network equipment, audio‐visual bridging, inter‐device power control, set‐top boxes, and hard‐wired and builder‐installed equipment. The project also took significant steps toward transforming the markets for digital networks.
1.1 Introduction In a universe of diverse devices, digital networks communicate a vast array of types of information. These networks are analogous to the pavement and intersections of the U.S. road systems, which move many different sizes, capacities, and designs of vehicles. Digital networks instead transmit information, in packets of varying size and complexity. These networks are deeply integrated in our lives, making possible e‐mail, cell phones, the Internet, and other information services.
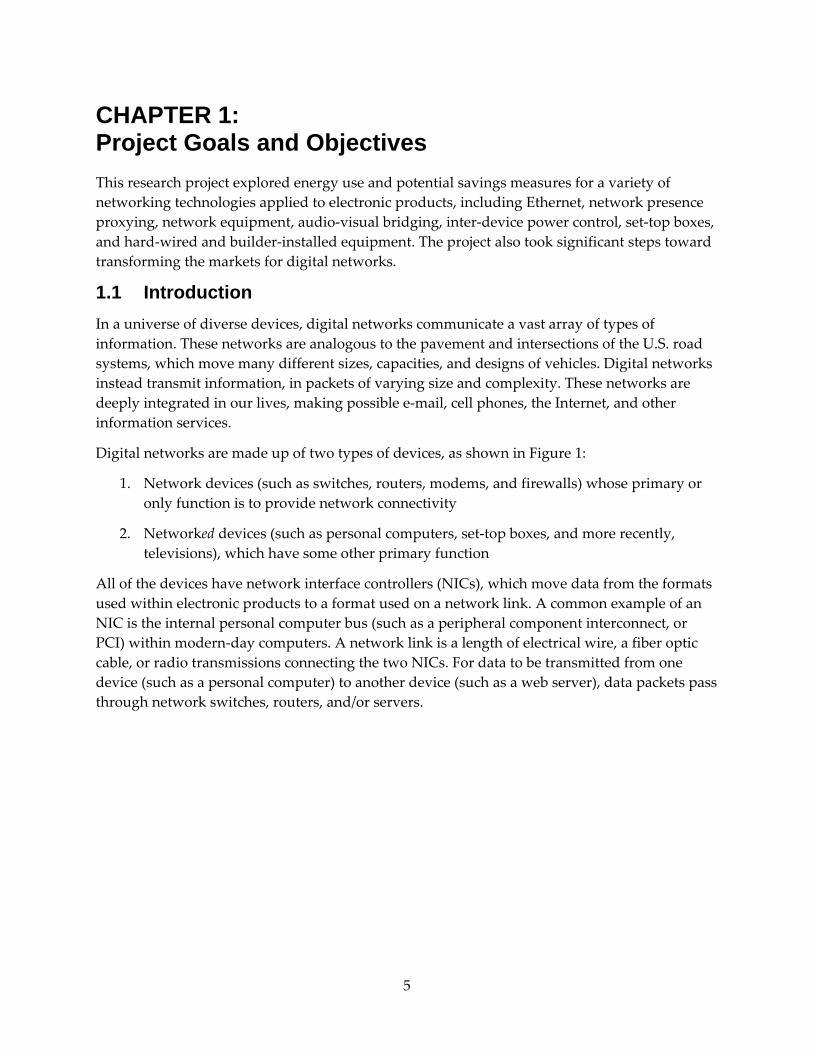
Digital networks are made up of two types of devices, as shown in Figure 1:
1. Network devices (such as switches, routers, modems, and firewalls) whose primary or only function is to provide network connectivity
2. Networked devices (such as personal computers, set‐top boxes, and more recently, televisions), which have some other primary function
All of the devices have network interface controllers (NICs), which move data from the formats used within electronic products to a format used on a network link. A common example of an NIC is the internal personal computer bus (such as a peripheral component interconnect, or PCI) within modern‐day computers. A network link is a length of electrical wire, a fiber optic cable, or radio transmissions connecting the two NICs. For data to be transmitted from one device (such as a personal computer) to another device (such as a web server), data packets pass through network switches, routers, and/or servers.

6
Figure 1: Network and Networked Devices
Source: Authors
Networks affect energy consumption in several ways:
1. The direct consumption of network interface hardware
2. The direct consumption of network products (e.g., switches and modems)
3. The induced consumption of other products (especially PCs and set‐top boxes) by their being in a higher power state than otherwise necessary by virtue of being network‐connected.
Most aspects of how a device interacts with a digital network are determined by (1) the other devices on the network, and (2) the industry standards that define behaviors, and therefore are beyond the individual device’s control. Low power mode savings for products such as PCs and set‐top boxes are possible only with an efficiently operating network. Addressing network standards is the only way to reduce or contain a considerable portion of the energy consumption from electronic devices.
1.2 Background At the launch of the Energy Efficient Digital Networks project, energy professionals were not experts in key network technologies, and energy savings and efficiency were uncharted territory to most network professionals—there was little intersection between these two fields. In general, little attention was paid to energy analysis and efficiency research when designing digital networks. Design priorities instead focused on performance, reliability, protocol sophistication, security, and hardware cost, while energy was a minor concern or completely
7
absent (Christensen, Gunaratne, et al. 2004). In 2006, no entities whose core mission was energy research were involved in developing the standards responsible for most network energy use.
Mobile devices proved to be the exception, where energy efficiency has long been a design priority because they run on battery power. In 2006, examples included cell phones (to maximize time between charges and to increase service provider revenue and user amenities), personal area networks, and sensor networks. Since that time, mobile devices have expanded to include smart phones, tablets, and miscellaneous Wi‐Fi‐enabled devices.
When this project started, digital networks were a major building electricity end use, transmitting over 4000 petabytes (1 petabyte = 1015 bytes) per month, consuming 13,300 gigawatt‐hours per year (GWh/year) and costing U.S. ratepayers over $1.4 billion dollars annually.
The following sections summarize the baseline conditions for the various activities conducted under this project and discuss accomplishments for each of the project areas of concentration.
1.2.1 Energy Efficient Ethernet (EEE) At project launch in 2006, the most common type of Ethernet network interface controller (NIC) had a peak link rate of 1 gigabit per second (Gb/s) but could also operate at 100 megabits per second (Mb/s) and 10 Mb/s (note that less power is used at the lower link speeds than at the higher ones). These NICs could only switch speeds over time scales of a few seconds, which was far too long for most applications. In addition, existing operating systems were not able to facilitate the Adaptive Link Rate (ALR) capabilities for energy savings.
In September 2010, the IEEE Standards Board approved IEEE 802.3az, adopting an active/idle approach, in which a link with low utilization would sleep between packets, thus saving energy. Products meeting this standard are currently reaching the market. The U.S. Environmental Protection Agency’s ENERGY STAR® program will incorporate the standard into its specifications, as feasible. Energy Efficient Ethernet will yield an anticipated $400 million per year in energy bill savings for the current stock of links in the United States, which will translate into more than $1 billion of savings worldwide.
1.2.2 Network Presence Proxying In 2006, most PC energy use occurred when no one was present, and network connectivity was a key barrier to using sleep mode. Proxying can enable network connectivity during sleep mode, but in 2006 proxying was not available on an Ethernet network. In February 2010, the standards group Ecma International approved a standard that defined proxying. ENERGY STAR is ready to incorporate Ecma’s proxying standard into its specifications.
1.2.3 Energy Efficiency Specifications for Network Equipment At the inception of this project, there was a significant range in product efficiencies for network equipment, resulting from a variety of technology and design choices.

8
Table 1 shows the quantities of energy used by network equipment in 2008.

9
Table 1: Energy Used by Network Equipment in 2008
California United States World
Energy Use, in terawatt-hours
2.2 18 51
Annual Growth (%) 6 6 9
Major electricity consumers include residential equipment and enterprise switches; consequently energy test methodologies were developed for these classes of equipment. This work will guide the ENERGY STAR process.
1.2.4 Ethernet Audio/Video Bridging (AVB) Standards In 2006, IEEE 1394 appeared to be the leading audio‐video (AV) standard, but passing real‐time audio and video over Ethernet is now a leading technology in AV networking. This task addressed the need for AVB links to be designed with energy‐efficient features in mind. Although EEE and Ethernet AVB have no inherent conflicts, additional work was needed to ensure that there were no conflicts in practice. A suite of standards, currently in varying stages of development, will enable delivery of audio and video streams with service quality guarantees while still supporting EEE.
1.2.5 Consumer Electronics (CE) Inter-Device Power Control This project started to address the lack of interoperability for power control in devices. Remote controls for different brands and types of devices did not work well together, and emerging and existing networking standards (such as high‐definition multimedia interface, or HDMI) did not require interoperable controls. This project developed a general power control method that all devices can follow to minimize energy use. This set of behaviors was applied to the HDMI 1.3 standard, and a group of commands was proposed to implement control principles.
1.2.6 Energy-Efficient Set-Top Box Set‐top boxes (STB) have proven to be a difficult energy problem to solve because many STBs consume 20 to 30 watts (W), even when off (i.e., the end‐user presses the “off” button). As a result, the typical set‐top box consumes most of its energy when it is not providing any useful function. At project launch, set‐top boxes did not have low‐power operating modes for a number of reasons: (1) energy efficiency was not an important design criterion for the manufacturer, (2) the data network to which the set‐top box was attached required frequent communication with the box to maintain network connectivity, or (3) for content security. In 2010, set‐top boxes used 2.4 terawatt‐hours (TWh) in California, and 20 TWh nationwide. This project surveyed the many types of connections on STBs, how these links affected energy use, and how public policy is influencing STB energy use.
1.2.7 Reducing Energy Use of Hard-Wired and Builder-Installed Miscellaneous Equipment in New Homes Builders install a wide variety of ”miscellaneous“ electrical devices in new homes, such as smoke alarms and garage door openers. The energy use of these devices was not addressed in

10
the Title 24 building code, nor was it addressed through equipment standards such as Title 20 or the federal appliance efficiency standards. For builders who would like to purchase and install more efficient devices, little to no information was available for them to distinguish between the energy use of competing models. In fact, most of these products do not have standard test procedures for measuring their energy use. Only a few categories of builder‐installed devices, mostly consumer electronics devices, are covered by voluntary labeling programs such as ENERGY STAR.
In aggregate, many types of builder‐installed equipment use significant amounts of energy. For this project, researchers conducted laboratory metering of four equipment types:
• Garage door openers
• Irrigation controllers
• Ground fault circuit interrupter (GFCI) outlets
• Doorbell transformers
This studyʹs findings on typical power and energy use of irrigation controllers were presented at the Title 20 hearing.
1.2.8 Transforming the Markets for Digital Networks Over 60 market connection activities were undertaken to accelerate market transformation of energy efficient digital networks. Highlights are presented in Chapter 9, and categorized by function or outlet:
• Internet and Print Publications, Broadcast Media
• Technology Standards Development
• Public Policy
• Speaking Engagements
1.3 Motivation The energy use of electronic devices is increasing rapidly, partly because of the proliferation of these devices, and also because these devices are powered on a significant proportion of the time. Often, this elevated “onʺ time is not due to increased use but simply to maintain communication with other devices. As Mouawad and Galbraith put it in a New York Times article,
“Part of the problem is that many modern gadgets cannot entirely be turned off; even when not in use, they draw electricity while they await a signal from a remote control or wait to record a television program.” (Mouawad and Galbraith 2009)
The ability for electronic products to communicate among themselves (i.e., their networking capability) has become a hindrance to saving energy in these devices. While most components

11
of electronic and other devices can be made more efficient solely within the confines of a single product model, the requirements and capabilities of networks are defined by standard protocols, applications, and other electronic products that are on (or potentially on) the network (Nordman and Christensen 2005). For standards‐based markets, when an energy‐saving feature is absent from the standard, even motivated manufacturers are precluded from incorporating the technology into their products. Also, mandatory energy regulations are problematic for networks, given the fast‐moving nature of the technology and the complex nature of many network standards. While network standards are global, almost all of the standards‐setting activity is in the United States, with a great number of the participating individuals and companies in California.
This project’s overall technical goal was to save significant electricity by bringing a focused energy efficiency effort to a heretofore untapped area—digital networks. This project endeavored to save energy in California homes and businesses by improving efficiency through a number of methods:
• Network interfaces and network links. The plan to increase efficiency involved taking advantage of the fact that, for the great majority of time, data transmission rates usually were a small fraction of the link capacity (Odlyzko 2003).
• Network products. In 2006, energy‐efficiency efforts (e.g., ENERGY STAR, state and utility programs, and international efforts) had generally made no effort to address network products. At that time there were wide variations in the efficiency of products that deliver similar services (Nordman and Christensen 2005). The use of more efficient products could significantly reduce network‐related energy consumption and costs.
• Network protocols. In 2006 there existed many opportunities to modify network protocols (those presently in use or ones in development) to add functionality to reduce energy use or enhance existing functionality. These are present in several of the “layers” of network technology, from the lower electrical levels through to higher level application layers. Many of these efficiency increases can be accomplished solely with changes to software so that there is no incremental manufacturing cost resulting from implementation (Gunaratne et al. 2005).
• Benefits. Energy benefits of this program included savings to California residents and commercial building operators; reduced and more predictable growth in demand for utilities; and the potential for better control of electronic and other devices.
Many companies that manufacture network products are located within California. For network products, there is no distinct California market (except possibly in the case of service‐provider purchased items such as set‐top boxes and broadband modems), and in many cases, no distinct U.S. market. Since manufacturers design products and then ship them to a global market, savings that accrue to California will ultimately accrue to the United States, and even to a global community. For several tasks, the goal was to transform the entire market. In others, the goal was simply to affect most of the market. The implementation of most of these tasks should not increase product purchase price, so 100 percent of the savings should directly benefit customers.

12
For tasks that may have an increased manufacturing cost (such as proxying and efficiency specifications), the payback times are expected to be extremely short; for example, a few months.
13
CHAPTER 2: Energy Efficient Ethernet 2.1 Introduction This section covers the Adaptive Link Rate (ALR) task (formerly “Power‐Efficient Ethernet Links” task) of the Energy Efficient Digital Networks project. The “brand name” for the resulting standard adopted by IEEE is “Energy Efficient Ethernet” (EEE), so that name is primarily used here. The original plan was to lay out possible and recommended approaches for standardizing more efficient Ethernet technology. However, during this project the relevant IEEE process actually began, so the focus shifted from planning to implementation. As expected, progress was principally accomplished through the IEEE standards organization and the individuals participating in that process. It was assisted by the Ethernet Alliance, ENERGY STAR, and Lawrence Berkeley National Laboratory (LBNL). The standards process and the relevant technology issues are key aspects of this work.
2.2 Background 2.2.1 Technical Origin The ALR concept grew out of discussions between Ken Christensen at the University of South Florida (USF) and Bruce Nordman, from LBNL, about network connectivity proxying (see Chapter 3). The issue at hand was whether a PC network interface controller (NIC) would have sufficient power available to power a processor that would implement the proxying functionality. Typical PC implementations had only a few watts of power available to the NIC while the system was asleep. Some notebook PCs on the market at that time lowered their link rate on Ethernet links from 1 Gb/s (1000 Mb/s) to either 100 Mb/s or 10 Mb/s, to reduce energy use and extend battery life. The power saved by doing this could be shifted to a processor that could implement proxying. Recognizing that low utilization was not only a feature of sleep time, but also frequent in normal operation, Christensen and Nordman developed the idea to enable changing the link rate at any time utilization was low, and thus save power when the system was active.
Changing the link rate has always been possible by dropping the link and then renegotiating it at a different rate, but this takes about two seconds. Two seconds is an eternity for networks. This is not acceptable during normal operation, and the key for ALR was to define a way to switch speeds during operation and much more quickly—ideally in some number of milliseconds, rather than seconds.
2.3 Standards Activities 2.3.1 Origin The EEDN ALR work originated in a 2005 plenary presentation to IEEE 802 by Ken Christensen and Bruce Nordman (Nordman and Christensen 2005). The project plan was to further develop technical details of the ALR concept and then present it to IEEE. As industry interest in ALR

14
picked up in 2006, LBNL worked continuously with industry and IEEE to move the process forward.
Once the ALR concept had been hatched, it needed to be brought to the relevant individuals, companies, and the standards organization (IEEE 802). Lawrence Berkeley National Laboratory already had a participant in the IEEE 802.3 working group: Mike Bennett of the Lab’s network group. His presence in the group greatly helped in getting an evening plenary presentation slot on the agenda for the July 2005 IEEE 802 meeting. During that presentation (Nordman and Christensen 2005), Christensen and Nordman laid out the rationale for why electronics—and networks specifically—were important for energy consumption and efficiency, and presented the ALR and proxying topics.
Standards processes are notoriously slow, and IEEE processes are no exception. It was not until the fall of 2006 that LBNL began to work with several industry partners to prepare a Call For Interest (CFI) for IEEE 802.3 (Barrass et al. 2006). A CFI allows creation of a study group within IEEE 802.3. It was presented at the November 2006 IEEE 802.3 meeting, and was successful.
One of the decisions in the CFI process was to use the term “Energy Efficient Ethernet” as a generic goal, rather than the ALR terminology, which implied a specific technical solution. At the Dallas meeting, Glen Kramer (at that time of Teknovus, Inc.) created the EEE logo, shown in Figure 2. It has no official standing within IEEE, but is widely popular within the EEE process.
Figure 2: The Energy Efficient Ethernet Logo
Source: Glen Kramer
2.3.2 IEEE 802 Standards Processes Over the many decades that IEEE has been in existence, and the thirty years that the IEEE 802 group has existed, a large infrastructure of processes and procedures has been developed. This includes considerations such as openness, intellectual property, and antitrust. One aspect of this infrastructure is that creating an IEEE 802 standard requires many individual steps; the following is a brief overview.
Ultimately, all standards within IEEE, as well as proposals for standards projects, are approved by the IEEE Standards Board. Proposals for new projects pass through the New Standards committee, and actual standards (and reaffirmations, withdrawals, etc.) pass through the Review committee. The IEEE 802 sponsor group hosts the Ethernet working group (IEEE 802.3) as well as groups for Wi‐Fi, Bluetooth, ZigBee, WiMax, and others. Figure 3 shows the

15
relationships among these various bodies (Figures 3 and 4 are from EEE Task Force agenda slides, prepared by Mike Bennett).
Figure 3: Structure of the IEEE 802 Entities
Source: IEEE Standards Association, http://standards.ieee.org/
The first formal stage in the process is the Call for Interest (CFI). A successful CFI creates a Study Group on the stated topic area. The Study Group is charged with creating a Project Authorization Request (PAR), as well as listing how the project meets the five criteria that IEEE 802 has established as necessary for a viable project, and objectives that a standard would meet. These documents are then forwarded to the various approval bodies for consideration and possible approval. Figure 4 shows these processes.
Figure 4: Flow of the IEEE 802 Standards Approval Process
Source: IEEE Standards Association, http://standards.ieee.org/
The CFI for EEE was presented and passed in November 2006, with the first Study Group meeting in January 2007. Mike Bennett of LBNL was selected to chair the Study Group. The study group held six meetings, and in July 2007 voted to ask for a PAR for the effort. Both the

16
full IEEE 802 working group and the IEEE Standards board agreed to this in September 2007, and EEE obtained the formal name IEEE 802.3az.
Once a Task Force exists, more detailed proposals are made for methods, technologies, and approaches to use in developing the standard’s content. These elements are discussed and reviewed, with the Task Force eventually selecting some for use in the standard. The Task Force needs to periodically review the PAR and objectives from the Study Group process, to determine if the work is staying within its scope and covering the entire set of objectives outlined. Once sufficient proposals are selected, a project editor is selected to create and edit the actual text for the standard. The editor identifies parts (clauses) of the IEEE 802.3 standard that need amendment and pulls content from the presentations and proposals into the standard in the form of text, tables, and figures. A cycle then begins of the editor circulating a draft, people reviewing it and submitting comments, the editor proposing resolutions to the comments, and the comments and proposed resolutions are reviewed at a meeting and approved or modified. Comments may be technical (changing the meaning of the standard) or editorial (clarifying the presentation).
For the EEE process, Sanjay Kasturia of Teranetics volunteered to be the editor‐in‐chief. For this process, there are also several clause editors, and they implemented the changes agreed to by the Task Force, and Sanjay assembled and produced each draft. The task force produced six drafts before concluding in July 2009 that the standard was ready for wider review.
The next phase of the process is comment and review within the IEEE 802.3 working group. This involves the same cycle of comments and resolution as within the Task Force. Once satisfied, the working group sends it to the IEEE 802 Executive Committee, who verify that the process has been followed and send it to the sponsor (IEEE 802) for another round of balloting and review.
In the course of the standards process, many draft and balloting cycles were completed. The standard won approval from the EEE Task Force, the Ethernet working group, the whole 802 committee, and finally the IEEE Standards Board. This last step occurred in September 2010.
2.3.3 Control Policy Early in the process, it was anticipated that a control policy would be needed for each NIC to decide when to change the transmission speed of the link. It was believed unnecessary to standardize the control policy, but it was recognized as desirable to describe a sample good policy as a reference. Adoption of the Low Power Idle approach significantly reduced the perceived need to have a defined policy. The policy on when to shift the speed up is no longer needed, as the link simply wakes to full speed any time data arrives to be transmitted. The policy indicates that the link should go to sleep if there are no data ready to send.
2.4 Technology Issues Making Ethernet link power consumption more proportional to data traffic brought up several technical issues that needed to be considered, researched, evaluated, and compared. The major

17
issues involved were latency, energy savings, packet loss, signaling mechanisms, and control policy. These topics are reviewed in more detail in published papers.
2.4.1 Latency Usually, networks try to forward packets of data as quickly as possible. There is a minimum time to transmit packets across each link, which usually has a fixed component and a variable one that depends on the packet length (as affected by the link data rate). As packets pass through network devices, and when link rates drop on successive links, there can be contention for access to a link, resulting in additional delay for packets. In any non‐trivial network there is a distribution of delays for packets, which can be assessed using various statistical measures.
All the methods that were considered added some latency (at least on average) as a way to enable energy savings, so there is a trade‐off between the two factors. Because some latency is inherent in all networks, the question is whether the magnitude of the increase in latency is acceptable or not.
Figure 5 shows how performance of a link is affected by the time it takes to switch link rates (Gunaratne and Christensen 2006). As the switching time increases, the average packet delay also increases, and the energy savings (a function of the portion of time spent in the low rate mode) drops.
Figure 5: Link Performance in Relation to Rate Switching Time
Source: Gunaratne and Christensen 2006
Today’s Ethernet links can change data rates (and consequently power use) by dropping a link and renegotiating a new rate, which takes several seconds. The ALR proposal for changing link rates envisioned a rate‐switching interval measured in milliseconds (possibly tens of milliseconds). The Low Power Idle (LPI) approach that was ultimately used adds latencies measured in tens or hundreds of microseconds. While ALR has longer latencies, it should require many fewer transitions than the LPI approach does.
By using the Link Layer Discovery Protocol (LLDP) for IEEE 802.3az, link wakeup times can be increased to enable greater energy savings. Use of this protocol is optional, and its utility is application‐dependent. Also, recent work (Christensen et al. 2010) shows how adding latency

18
can increase energy savings substantially on links with low utilization, with delays that seem readily acceptable for most applications.
2.4.2 Energy Savings Figure 6 shows how power use of a network switch varies with both the number of connected devices and with the speed of the links (Gunaratne et al. 2005). The figure shows how reducing the link rate in response to traffic demand can save energy. Similar findings came from changing the link rate on a PC.
Figure 6: Network Switch Power Use in Relation to Number of Connected Devices and Link Speed
Source: Gunaratne et al. 2005
It is possible to implement an Ethernet standard in different ways with very different power requirements. This has occurred with each Ethernet port physical layer (PHY) over time, as manufacturers create more power‐efficient designs and switch to smaller and lower‐voltage integrated circuit technologies. However, there are physical and technological limits to how much can be accomplished through this method alone.
Each of the technologies evaluated has a different energy‐saving profile. However, at low utilizations (single digits of link capacity), the technologies all enabled large savings. The exact savings that a given standards approach might allow for is dependent on hardware implementation decisions, and so is difficult for a non‐manufacturer to estimate.
2.4.3 Packet Loss One of the core capabilities of Internet technology is resilience to loss of individual packets. That said, designers do try to avoid introducing technologies which inherently lead to packet loss. One of the goals of the EEE process within IEEE was to create a standard that did not diminish the high levels of reliability (i.e., the bit error rate) for the link that Ethernet provides. Loss of packets could occur if introduced latency on EEE links resulted in buffer overflows in some network device between two edge devices on a link (research suggests that a typical packet on the Internet passes through about 15 “hops” between source and destination). Large buffers can reduce packet loss, but at a cost of additional power consumed.

19
2.5 Project Phases The process of going from concept to standard for EEE can be divided into a number of phases: initial idea/analysis, IEEE 802 initial discussions, final standards development, and future issues. Lawrence Berkeley National Laboratory was involved in all of those stages.
2.5.1 IEEE 802 Initial Discussions During preparations for the IEEE 802 Call For Interest, it was decided to shift to the term Energy Efficient Ethernet from Adaptive Link Rate, to be more generic and not predetermine the specific technology approach. This has been proven to be a wise move.
To understand the particular approaches considered and their advantages and disadvantages, it is necessary to know some details about how Ethernet works (at least for the common forms used in homes, offices, and 10 Gb/s wired Ethernet in data centers). A cable with eight wires provides four pairs. The data to be sent are modulated across these four pairs, in both directions. At the speeds that Ethernet operates, the signal is beset by echoes from various points on the wire, and by crosstalk between adjacent wires. The technology has sophisticated means to account for these issues so that a particular link is described by a highly tuned set of parameters about the link that are updated as they evolve over time. The key to a responsive link is to maintain these parameters exactly, or close enough so that they can be refined quickly.
For the initial ALR proposal, the link parameters for each speed being used were remembered at each end of the link, so that when the link shifted to a new speed, the parameters most recently used could be dropped in. To ensure that the saved parameters did not drift too far from reality, it was supposed that occasional shifts to the other speed(s) could be put in to maintain them as correct. This is most important for maintaining high‐speed parameters when operating at a lower speed, since it is desirable to minimize time shifting to the higher speed when traffic picks up. When traffic drops off, the consequences of using more time to shift to the slower speed lessen, since there is less traffic to back up. In the course of discussions, ALR was renamed Rapid PHY Selection (RPS) to clarify that existing PHY layer definitions would be used, not any new modes of operation.
Two additional technologies were proposed in the course of the standards development. A proposal called “Subset PHY” takes advantage of the fact that Ethernet data (on higher speed links) are sent along four parallel paths in each link. Subset PHY involves powering down three of the links when data rates are low and waking them up as needed when traffic picks up. The remaining link operates as normal. This strategy avoids needing to actually change the rate, and potentially avoids transition times for the remaining link. Power consumption can be reduced by approximately 75 percent.
The other new proposal, Low Power Idle (LPI), involves a new sleep mode for links in which the transmitter and receiver are both powered down for periods of time when no data are ready to transmit. This requires a powering‐down transition, a wake transition, and periodic refresh periods in which the link parameters are tested and updated. While one might think that data transmission would be more power‐intensive than listening, on the Ethernet the listener needs

20
to do a large amount of processing to the signal to filter out echoes and crosstalk, and these power needs are also substantial.
It was suggested that LPI would save more power than Subset PHY, although this was not explicitly analyzed. Both would have saved large amounts of energy, and both were good candidates for the standard. In the end, the committee decided that it was easier to write a standard for LPI and to implement LPI in hardware, so this approach was chosen. Because of the nature of the process and the technologies involved, it was not necessary to make detailed estimates of relative energy savings.
2.5.2 Future Issues Networks are designed around layers, and for the lower layers, integrated circuits (or portions of them) can be roughly assigned to layers. Energy Efficient Ethernet directly provides for saving energy in the physical layer (moving bits along the wire), but fairly directly also enables some savings in layer two, the data link layer. In networked systems, whether network equipment or “edge” devices, there is a variety of circuitry associated with a network port between the physical layer interface and the central processor and memory where the data eventually reside. It may be possible to design systems to power down parts of these circuits, to a sleep state, a halt state, or just a lower‐speed active state. There is usually some latency required to bring devices out of these lower performance states to full capacity.
Normally, an Ethernet packet might arrive across a link at any time, so receiving circuitry always needs to be ready. However, when a link is asleep, it is known that any packet transmission will be preceded by a wake event on the link of known duration. Thus, the waking of the other circuits could be done in parallel to the link waking up. If the link takes longer to wake, then all is well. If the link is quicker to wake, then that might preclude powering down the other circuits. With this in mind, a use of the LLDP (Link Layer Discovery Protocol) was defined to enable devices on each end of a link to negotiate longer wake times than the standard requires. If they cannot agree, the default is to use the standard times. Support of LLDP for this purpose is mandatory for 10 Gb/s EEE and optional for 1 Gb/s.
Another issue is the potential for packet coalescing to increase EEE energy savings at modest cost in performance; this is explored in detail in a recent report by Christensen et al. (2010). The key point of this issue is that when many packets are bunched together, the packet transmission time is large compared to the time to wake the link and to put it back to sleep. Since the power used during these transition times is expected to be comparable to or the same as that used during full active mode (not low, like the LPI time), the energy used during transitions is overhead, and so should be minimized.
Considering a starting point of evenly spaced packets that each has its own pair of transitions to a second case in which every other packet is delayed until the following one shows up, the amount of transition energy is cut in half. The more packets that are “coalesced” this way, the less transition energy used, but the benefits for each additional packet included diminish asymptotically, and the average amount of delay goes up. A policy that only coalesced a fixed number of packets could introduce unacceptable delays, so a policy needs to be characterized
21
by a maximum number of packets (or bytes) accumulated and maximum delay for the first packet.
A significant reduction in transition overhead is possible through coalescing without introducing objectionable delays. This approach does not affect the EEE standard itself, but rather is attributable to the system design.
Electronic devices like computers generally can save power at low utilization by reducing their speed and so using less average power when active, or by operating as fast as possible until done, then quickly dropping into a low‐power sleep state. Low‐power idle uses the second approach, but some systems as a whole may use the first. In that case, a facility for “data throttling” (limiting the overall data throughput) could be helpful; the fact that the throughput limiting was occurring would be strictly outside the knowledge of the Ethernet link itself. This approach could be pursued through IEEE 802.1, the “Higher Layer LAN Protocols Working Group.”
2.6 Summary and Next Steps 2.6.1 Next Steps: Standards Within IEEE 802, there has been discussion about extending EEE to other physical layers, particularly for optical links. As yet, it is unclear what this might mean for energy savings, and for latency. For market connection, project researchers have been working with the U.S. Environmental Protection Agency (U.S. EPA) to add a requirement to implement EEE into ENERGY STAR specifications as hardware becomes available on the market. LBNL team researchers have also approached the European Union (EU) Code of Conduct process, as well as other international energy specifications processes, to do the same. Finally, LBNL should explore whether there are other physical layers that could make use of the EEE approach. This would be most suitable to other wired technologies, as wireless ones are more likely to already have energy‐saving features for use by mobile devices. The most likely physical layer to explore is MoCA® (Multimedia over Coax Alliance).
There are efforts within the 802.11 standard to facilitate power management of Wi‐Fi links. So far, these have been independent of the EEE efforts, but they should be monitored and examined for potential synergies.
2.6.2 Conclusions As with most research efforts, the major issues encountered and final result were not readily predictable at the outset. The ALR effort dealt with a variety of technical issues and approaches to the problem at hand. The process was able to be more focused on active standards development than had been envisioned at the outset, and avoided the need for some of the advance work originally outlined in this project. The project focus could then be dedicated to help support the standards process and to work with industry toward the best and speediest outcome. This project demonstrates that the energy efficiency community can collaborate productively and effectively with the technology industry for everyone’s benefit.

22
There is a need to monitor the performance of EEE products as they come onto the market, and to identify any technical or market barriers to successful implementation. There is also a need to assess the potential for methods to increase EEE savings, and to identify any role that energy policy and research can play in accelerating savings. Finally, other physical layers (Ethernet and not) should be investigated for their suitability to the approaches explored here.
The major surprise in the process was that we were able to launch the standards process before doing more detailed technical work. This allowed us to devote more resources to the standards process itself than would have been possible otherwise. There was also an unexpected shift in technology approach during the standards process, from Adaptive Link Rate to low‐power idle, but that was not a problem for the project, nor for saving energy.
Perhaps the major implication of this project, other than the energy saved through EEE itself, is confirmation that the energy efficiency community can actively engage the technology industry to help create and move forward more energy‐efficient technologies, particularly when they are standards‐based. Standards‐based processes are inherently collective, and so can use and leverage public sector resources in a way that is impossible when technology approaches are limited to one or a few companies.

23
CHAPTER 3: Network Presence Proxying 3.1 Introduction This section covers the project’s Proxying work, which pursued the following goals:
• Create a specification that will enable network interface hardware (or network products) to maintain network presence for a sleeping product.
• Develop the framework for any standards necessary to support this technology.
• Work with industry and public organizations to reference these standards in guidelines and requirements.
This project accomplished all of the above, and more. As part of the process we addressed energy savings potentials from the technology by assessing packet traces to understand the protocols involved, and by defining the behavior that a proxy needs to exhibit.
3.2 Background Most PC energy use in the United States occurs when no one is present, and while the PC is fully on but is idling and performing no active tasks. The concept of proxying is to enable such machines to sleep, stay on the network, and be able to wake when needed. A very low power “proxy” acts on behalf of the sleeping machine, as the PC cannot act for itself when asleep.
A proxy is “an entity that acts on behalf of another” (Wikipedia), such as an attorney or ambassador. When active, the proxy is functionally equivalent to the entity being represented, and capable of accomplishing the relevant tasks. One can consider the human brain: while we are asleep, our brain stem maintains critical functions (e.g., breathing and heart beating) and monitors external stimulus. This enables the great majority of our brain to go “offline.” In the PC case, the rest of the network does not know about the existence of the proxy—as far as the network is concerned, the PC is fully present. When a PC is asleep, there is an integrated circuit monitoring the keyboard for activity, so that when a key is hit, this chip can wake the entire system; the keyboard monitoring chip is functionally similar, albeit much simpler than a proxy.
Proxying as a general concept in computer science has a long history, but it first appeared in the context of saving energy in a 1998 paper by Ken Christensen (Christensen and Gulledge 1998) and acknowledged discussions on the topic with Bruce Nordman of LBNL. Bruce and Ken began working together on proxying in October of 2002 to strategize how to refine the concept, take it to demonstration, and ultimately to products.
Proxying was a feature of ENERGY STAR discussions for its computer specification beginning in the fall of 2004. Proxying would not have happened without the support of the California Energy Commission. ENERGY STAR was a key early partner in developing the technology, lent legitimacy, and enabled industry incentives. Proxying has now been developed and standardized to the point where it is ready for wide‐scale acceptance.

24
3.3 Energy Savings 3.3.1 How Much Energy Is at Stake? Saving energy is the primary motivation for pursuing proxying, though for battery‐powered PCs, it also offers improved functionality of products by either (1) extending time on battery by substituting sleep time for idle time, or (2) increasing functionality by enabling network connectivity in sleep mode when it would not be otherwise possible. This aspect that “everyone wins” with proxying also applies to desktop PCs: proxying either increases functionality or saves energy.
To put proxying into context, it is worth noting that “electronics” used at least 290 TWh/year in the United States in 2008 (Nordman 2009)—11 percent of buildings’ electricity—and that figure continues to rise. Televisions comprise the largest component, and personal computers are second. While data centers receive a great deal of attention, they account for well under 20 percent of electronics energy use. Proxying initially targets PCs, and may be extended to other devices with similar characteristics that may yield significant savings, in particular game consoles, IP set‐top boxes, and printers. Printers already stay on the network while asleep, but proxying could enable doing so at lower power. The energy savings will be dramatic for printer “digital front ends” (DFEs) that are effectively PCs or servers that serve the printer’s needs.
Figure 7: Energy Use by Power Level for Average Desktop Computer for One Year
Source: Bruce Nordman, 2008
Figure 7 illustrates the situation for the average desktop PC in the United States. It shows average desktop PC usage for one year, sorted by power level. A small amount of energy goes to active computing. “Off” and “sleep” modes consume low amounts of energy due to their low power levels and unfortunately small shares of annual time in these modes. Some PCs are used most of the time they are on, but many others are on 24/7. Notebooks generally have much lower times of being on while not in use, though with their lower power levels, they constitute a

25
much smaller portion of total PC energy use than desktops. However, as more notebooks are used as replacements for desktops, their idle time is likely to rise.
The amount of potential energy savings shown by the blue box in Figure 7 is not precisely known. The figure is sufficiently large (e.g., more than $1 billion/year for the United States) that it is well worth the effort to gain the savings. We have a fairly good idea what the idle power is for desktops, based on data gathered for the ENERGY STAR program. The lifetime of a PC is usually assumed to be four years on average. This may be slightly high for commercial use, but is likely low for residential, so if anything, it may be an underestimate.
What is most uncertain is usage patterns. Most data are anecdotal, and most show a majority of desktop PCs being fully on when not in use. This is true in Building 90 at LBNL, where we can see that only about 120 PCs leave the network at night even though several times that many people have a desktop PC. In 2009, 1E, a company that sells PC power enabling software, reported, “according to a separate survey conducted in October 2008, 50 percent of employed adults in the U.S. who use a PC at work don’t typically shut down their PCs at the end of the work day.” (1E 2009). 1E estimates that for businesses alone, there is an opportunity to save $2.8 billion by powering down these machines when not in use. This is certainly plausible, as all PCs in the United States use about 80 TWh/year, and cost about $8 billion/year. Monitors use an additional 20 TWh/year.
3.3.2 Why Are PCs on When No One Is Present? When LBNL first looked at this question in 1995, we saw a number of reasons for this, some of which have been mostly or entirely solved in the interim. First, people lacked good alternatives to leaving machines on, given problems with the sleep mode. The “Off” setting was and remains problematic, as rebooting is annoyingly time‐consuming, and one loses application state (i.e., the open files and applications are closed).
The “Sleep” mode had four problems in 1995:
• The user interface for power management was confusing, and the user necessarily had to access system BIOS screens. Also power management used confusing terms like “standby.” User interface concepts were addressed and standardized by IEEE 1621. In addition, Microsoft switched to the term “sleep,” and collected all power management settings in a normal control panel.
• Many PC systems had poor reliability of hardware and software (operating system, application, and device drivers). Industry has essentially solved this problem in the interim.
• PCs often had very long wake times, but over the last fifteen years, this has been consistently reduced to the point where new Windows machines are required to wake in less than two seconds.
• In 1995, PCs would lose network connectivity when going to sleep. This is the problem that proxying can solve.

26
The 1E report surveyed people about PC habits and asked them why they don’t always power down their PC at the end of the day. Answers for the United States were:
• Other people use it: 19 percent
• Automatically goes to sleep: 18 percent
• Takes too long: 14 percent
• I forget: 13 percent
• Overnight software updates: 9 percent
• Company or IT policy: 9 percent
• Remote access: 4 percent
• Other: 13 percent
Proxying addresses many of these reasons for leaving a PC on.
The issue of networks and sleep was recognized by industry early on, and in 1994, a technology called Wake‐on‐LAN (WoL), was created to enable a special network packet to wake a sleeping machine. This approach requires the network to know that the system is asleep and treat it differently from an active one. As others have noted, “existing solutions for sleep‐mode responsiveness such as Wake‐on‐LAN and others … have not proven successful ‘in the wild’ since they rely on infrastructure or application‐level support or manual user action, presenting barriers to deployment and use” (Agarwal et al. 2007). WoL does what it claims to do, but not what most people want or need.
Agarwal et al. conducted an on‐line survey (n=107), with a majority of respondents from the United States, male, young, and in the IT field. The survey was anecdotal; in response to a question about why machines were left on, the main reasons were “remote access,” “quick availability,” and “apps left running.” The primary applications left on included: file sharing and e‐mail/IM; in addition some machines function as network servers.
There is another alternative to proxying, which is to change applications and protocols to understand sleep states and change behavior. This is the most desirable outcome, but the change required is so fundamental that it is unlikely to happen in any foreseeable timeframe, so is not worth considering. For future protocols, we can try to establish the concept of a device being asleep and incorporate it into future functionality (Allman et al. 2007).
The amount of energy used by idle PCs is large enough that many companies sell software to enable power management; examples include Verdiem, 1E, Faronics, BigFIX, LANDesk, Appistry, and others.
An important consideration is how much energy needs to be “invested” in proxy hardware to earn the resulting savings. Power is needed to maintain the network link, and to power a

27
processor to interpret the packets it sees. About one watt is needed to maintain a gigabit Ethernet link, and about one‐tenth of that for slower speeds (adequate for sleeping machines). Gigabit power has been dropping, and use of Energy Efficient Ethernet will bring it down to about the 0.1 W of 100 and 10 Mb/s speeds. Apple now sells two versions of its iMac integrated computer with proxy hardware. In interviews, component manufacturers indicated that the processor for those versions requires about 0.1 W or less.
3.4 Technology Issues To understand the technology issues involved in proxying, it is first helpful to review basic proxy operation. Figure 8 below shows the basic sequence:
1. The PC is awake, it operates normally, and it interacts (exchanges packets) with the Internet. It then becomes idle.
2. The PC transfers the network “presence” to the proxy on going to sleep.
3. The proxy responds to routine network traffic for the sleeping PC.
4. The proxy wakes up the PC as needed; returns presence to the PC.
Figure 8: Proxy Sequence
Source: Nordman and Christensen 2005
Figure 8 shows the proxy as an integrated circuit, which is how an internal proxy is accomplished; these are actually internal to the PC going to sleep. Another alternative is an external proxy, in a network device or another device on the local network. However, the definition of the proxy is independent of its location.
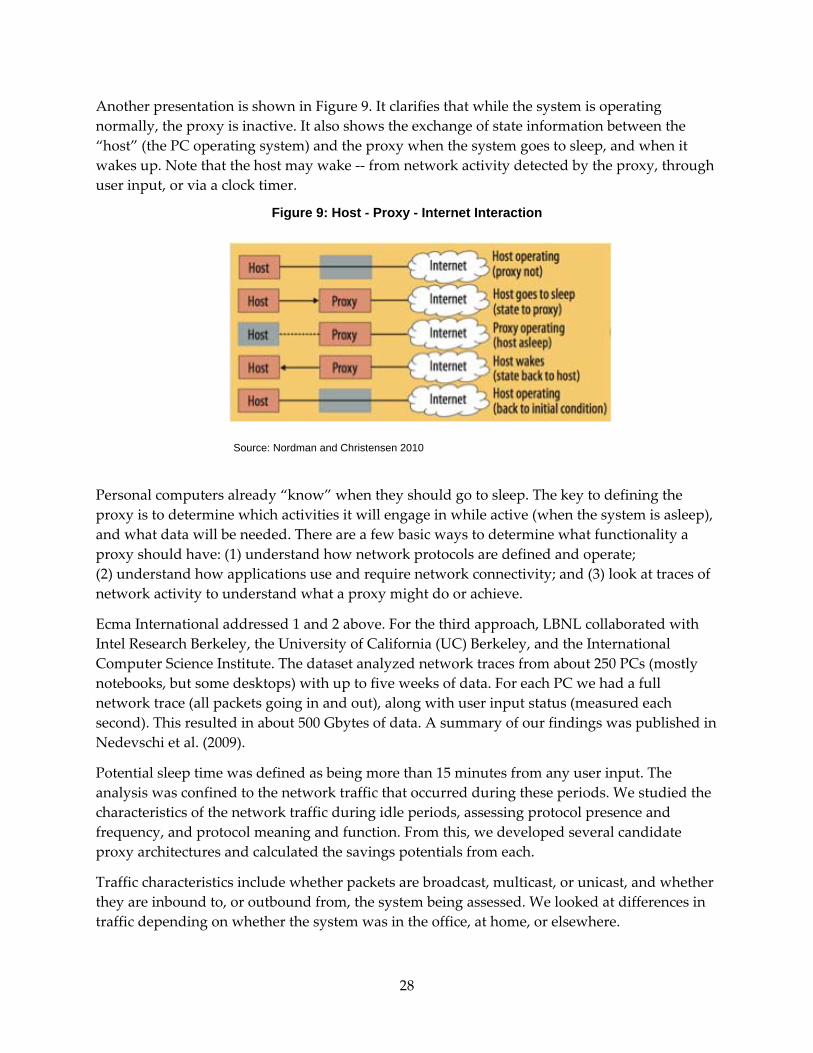
28
Another presentation is shown in Figure 9. It clarifies that while the system is operating normally, the proxy is inactive. It also shows the exchange of state information between the “host” (the PC operating system) and the proxy when the system goes to sleep, and when it wakes up. Note that the host may wake ‐‐ from network activity detected by the proxy, through user input, or via a clock timer.
Figure 9: Host - Proxy - Internet Interaction
Source: Nordman and Christensen 2010
Personal computers already “know” when they should go to sleep. The key to defining the proxy is to determine which activities it will engage in while active (when the system is asleep), and what data will be needed. There are a few basic ways to determine what functionality a proxy should have: (1) understand how network protocols are defined and operate; (2) understand how applications use and require network connectivity; and (3) look at traces of network activity to understand what a proxy might do or achieve.
Ecma International addressed 1 and 2 above. For the third approach, LBNL collaborated with Intel Research Berkeley, the University of California (UC) Berkeley, and the International Computer Science Institute. The dataset analyzed network traces from about 250 PCs (mostly notebooks, but some desktops) with up to five weeks of data. For each PC we had a full network trace (all packets going in and out), along with user input status (measured each second). This resulted in about 500 Gbytes of data. A summary of our findings was published in Nedevschi et al. (2009).
Potential sleep time was defined as being more than 15 minutes from any user input. The analysis was confined to the network traffic that occurred during these periods. We studied the characteristics of the network traffic during idle periods, assessing protocol presence and frequency, and protocol meaning and function. From this, we developed several candidate proxy architectures and calculated the savings potentials from each.
Traffic characteristics include whether packets are broadcast, multicast, or unicast, and whether they are inbound to, or outbound from, the system being assessed. We looked at differences in traffic depending on whether the system was in the office, at home, or elsewhere.

29
The proxy needs to handle less than ten packets per second, which means that the processor doing the work does not need to operate quickly. For a proxy to handle a packet, it does one of three things:
• ignore it (the most common action),
• generate a routine response, or
• cause the system to wake.
The routine responses are commonly constructed from the incoming packet, but can require some state information that the proxy acquires from the system when it goes to sleep. Determining what packets wake the system can also involve state information (e.g., the system is listening to a list of transmission control protocol [TCP] ports, and the system might want to awaken).
Another activity of a proxy is routine packet generation. Most commonly this would be a constant packet at a defined interval, but in principle the packet could vary according to time or information received. This is also in the state information transferred prior to sleep.
Our analysis led to creation of two categories: a “don’t wake” group and a “don’t ignore” group. The first group includes protocols that are so common that waking would destroy most sleep opportunities, so these either needed to be ignored or routine responses dispatched. The second group includes protocols that are critical to network and application functionality, and ignoring them would cause unacceptable failure. So for this group, it was decided that either a routine response would be generated, or the system would wake.
We evaluated four candidate proxy designs and found that even simple proxies save enough energy to be compelling. A key parameter is the number of wakes per day. For example, consider a system that is asleep 15 hours/day, can return to sleep 10 seconds after waking for routine network activity, and is asleep 90 percent of the time during those 15 hours. This implies 540 wakes each day, which seems like a very high amount to occur daily. On the other hand, one wake per hour (for 10 seconds) seems reasonable.
The best approach for traffic (packets) that are not recognized is to simply ignore them. Home and office network environments were found to be significantly different in the network traffic experienced, but it is likely that the home network environment will become more crowded over time as more devices and applications are added.
General design criteria for a proxy include that it should be simple, transparent for the user, not require changes to other hardware or other software, and require only modest changes in PC hardware or software (ideally only the operating system).
Technology requirements for the proxy include:
• The device must maintain all applicable network links. This is already done for Ethernet by PCs; the Ecma Standard (see ʺStandard Process and Content,ʺ below) defines how to do this for Wi‐Fi.

30
• The proxy must have a processor (e.g., memory, codespace) capable of analyzing the packets and responding appropriately.
• The proxy must have the ability to wake the PC when needed, and be notified if the PC wakes itself. The proxy may know that the wake is for a defined purpose of limited time duration, or may be for more indefinite activity. This could help the system return to sleep quickly when possible.
• The proxy must be configurable, as the desired functionality of the proxy may vary as determined by the system’s operating system.
3.5 Policy Context Perhaps the most critical moment in the history of proxying occurred in 2008, when the ENERGY STAR program established a benefit for the technology in the Version 5.0 specification for computers, effective in 2009. The specification defined:
Full Network Connectivity: The ability of the computer to maintain network presence while in sleep and intelligently wake when further processing is required. Maintaining network presence may include obtaining and/or defending an assigned interface or network address, responding to requests from other nodes on the network, or sending periodic network presence messages to the network all while in the sleep state. In this fashion, presence of the computer, its network services and applications, is maintained even though the computer is in sleep.
Further, the specification established that systems which had the proxying capability would be evaluated as using less energy, due to their different operating patterns. This had the effect of stimulating industry interest in the technology. The ENERGY STAR specification also required that to receive credit, proxying ability had to be defined by a “platform independent industry standard” (of which none existed at that time).
Once the ENERGY STAR specification was announced, it was possible for LBNL to arrange creation of a standards committee to work on the topic, and this was accomplished through Ecma International (Figure 10). Ecma was already involved with ENERGY STAR through the standard for measuring PC energy use, and its membership included almost all the companies interested in the proxying topic. In addition, Ecma is known to be considerably more nimble and flexible than most standards organizations, which were advantages in quickly (for a standard) proceeding through the process.
Figure 10: Ecma Logo
Source: Ecma International

31
Once the Ecma standard was complete and approved, the ENERGY STAR program recognized that the standard met the definition of Full Network Connectivity and established a method for systems to gain the proxying credit.
3.6 Standards Process and Content Ecma International is like most standards organizations in having committees that do the core work, with parent committees that loosely supervise their work and create or terminate committees. Proxying was covered by the TC32‐TG21 committee, and was later moved to a different parent and became TC38‐TG4. For additional detail, click to www.ecma‐international.org. Lawrence Berkeley National Laboratory was represented by Bruce Nordman (secretary), and a subcontractor, Tom Bolioli, who served as chair.
Among the issues guiding the standard process is neutrality about implementation choices. This is summarized in the standard’s Introduction which states:
“There are many possible ways to implement proxy functionality, and this Standard seeks to avoid unduly restricting choices in those designs. In particular, it does not specify the location of the proxy, within the host itself or in attached network devices.
The location of the proxy is a critical design choice visible to the user, though other decisions made in the standards process were related to requirements that might either require or prohibit particular implementation choices. Efforts were made to avoid such requirements. LBNL went into the standards process assuming that most or all parts of the standard would be required (“mandatory”). Many of the industry partners insisted that most features would be optional and only the most basic and universal parts would be required. This is helpful in that it enables more products to have some proxying ability sooner, but problematic in that it makes it more complicated to explain the technology to users, as there will be many “flavors” of proxying with differing functionality. Regardless, it was a necessary approach to maintain industry cooperation.
The standards development process began with assembling and refining “use cases” for proxying. Many members of the committee offered up use cases, and most, but not all, were accepted and implemented. Sometimes multiple use cases end up requiring some or all of the same content.
The final product of the committee was an Ecma Standard, number 393 (Figure 11). A summary of what the standard specifies, as well as the standard itself, are now freely available on the Internet.1 The choice of the ProxZzzy name was chiefly driven by the need to find one that was not in previous use by anyone else. Many other names that were more mellifluous or obvious were already claimed. Ecma paid the not inconsiderable cost to trademark ProxZzzy in major regions of the world. The fact that the standard is freely available is helpful, since membership in Ecma itself is quite expensive for ordinary companies.
1 See http://www.ecma‐international.org/publications/ standards/Ecma‐393.htm.
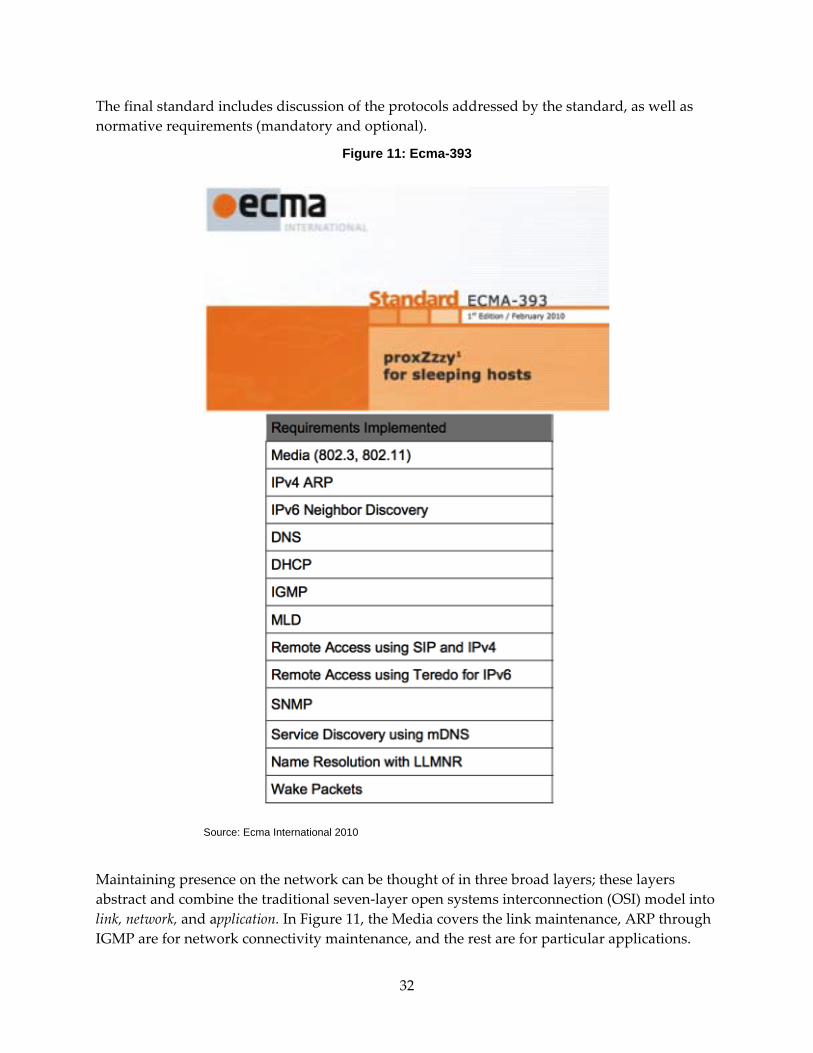
32
The final standard includes discussion of the protocols addressed by the standard, as well as normative requirements (mandatory and optional).
Figure 11: Ecma-393
Source: Ecma International 2010
Maintaining presence on the network can be thought of in three broad layers; these layers abstract and combine the traditional seven‐layer open systems interconnection (OSI) model into link, network, and application. In Figure 11, the Media covers the link maintenance, ARP through IGMP are for network connectivity maintenance, and the rest are for particular applications.

33
This listing is helpful for thinking about the requirements: the technical layer in which particular protocols reside and their function in the use cases does not always match this organization.
3.6.1 Link The requirement for a proxy is to maintain the data link used to communicate with the rest of the network. Today this is done almost entirely with Ethernet (IEEE 802.3) or Wi‐Fi (IEEE 802.11) for the devices in scope. The Ecma standard requires at least one of these to be implemented. The Ethernet requirements are minimal, and maintaining an Ethernet link for a sleeping system has been available for many years; essentially as long as the basic electrical signaling is maintained between the two ends of the wire, the “pipe” can be kept open. However, maintaining a Wi‐Fi link is a new and complicated endeavor. The core issue is that the access point for a sleeping device needs to be assured that the device is still present on a frequent basis, and to be convinced that it is the same device and that the communication channel is secure. This involves exchanging and updating security keys, so that the proxy needs to obtain some of these from the host before the system goes to sleep, and to wake the system periodically to do more extensive coordination with the access point.
3.6.2 Network If a sleeping device only maintains a data link, the sleeping device is “invisible” on the network. For a device to become reachable and discoverable to the network equipment and other devices, it can employ Address Resolution Protocol (ARP) on IPv4, and with Neighbor Discovery (ND) for IPv6. The Ecma standard defines behaviors with respect to these protocols and some ways to wake the system based on packet content. The wake packets at a minimum include wake on TCP SYN and the traditional Magic Packet wake. Having a list of open ports to wake on is an optional part of the TCP SYN wake. A proxy can implement IPv4, IPv6, or both.
The “IPv4 Suite” of protocols enables basic networking for IPv4 devices and is commonly considered to include ARP, DHCP, ICMP, IGMP, UDP, TCP, and DNS. The ARP provides a way to associate hard‐wired MAC addresses with software or network defined IP addresses. There are various ways to do this, and the proxy needs to facilitate all of them; the key is that the proxy does not need to obtain an Internet protocol (IP) address, but only maintain it. In general, if proxy finds itself in a situation it cannot handle, it can always wake the host to deal with the issue.
One of the ways a device gets an IP address is to use DHCP (Dynamic Host Configuration Protocol); this uses a server that maintains a pool of addresses that it allocates to devices that want them. The proxy ensures that a device maintains its DHCP address while asleep. Other basic network protocols include ICMP (Internet Control Message Protocol) and IGMP (Internet Group Management Protocol, for multicast network traffic).
3.6.3 Application The final set of protocols serve the needs of particular applications or devices. For example, the Simple Network Management Protocol (SNMP) is often used by printers to share information with systems that want to use the printers and provides information about job and equipment

34
status. The proxy can provide most such information while the device is asleep, particularly since most characteristics of a printer do not change during the sleep mode.
The standard describes two ways to access (and wake) a system remotely; the IPv4 approach uses the session initiation protocol (SIP), and IPv6 uses a protocol called Teredo. In addition, two protocols for discovery of devices and services on a local network are specified: mDNS and LLMNR. The mDNS protocol is most widely known, as Apple has adopted this for its iTunes system (whether on Apple or Windows systems) and its implementation is also called Bonjour. LLMNR is more Windows oriented. Finally, the ability to wake on a TCP SYN packet (noted above under Network) can also be considered an application‐related function.
The Ecma‐393 standard is organized by the protocols listed above. Implementation requires one of the link technologies, ARP and ND, and wake packets; all others are optional. Regardless of what the proxy supports, the operating system can choose to not use some of the features that the proxy can implement.
3.7 Next Steps At this time, ENERGY STAR has recognized Ecma‐393 as the proxying standard for its computer specification. ENERGY STAR will reconsider the quantitative value proxying receives in the next update for the computer specification, and it could include the standard in other product specifications in the future.
Ecma has forwarded the standard to the International Electrotechnical Commission (IEC) for adoption as ISO/IEC FDIS 16317; that process is in progress. This is helpful in some circumstances; for example, Europe generally wants to derive its activities from international or European‐specific standards. A possible activity within Ecma is to define a standard for a device to communicate with an external proxy. Apple does this today with the mDNS protocol, and adopting that as the approach or an approach for an Ecma standard is certainly a possibility. LBNL tried to initiate a process within the Ecma committee for this but did not get a critical mass of interest from member organizations. A final activity is coordination with the Distributed Management Task Force (DMTF) on proxy management; this has begun, but has not yet resulted in any content.
The other domain for proxying to tackle is implementation. Since December 2009 Apple has implemented select protocols for proxying in its iMac line of computers. In addition, since summer 2009 Apple has implemented select protocols for proxying in many of its products with external proxy functionality (the proxy is an access point, external disk backup system, or another Apple computer, including the very small Apple TV product). Hewlett Packard and Dell have implemented much more limited portions of the Ecma standard as internal proxies for use with the Windows operating system. In addition, the Sleep Server system from UC San Diego implements external proxying, and the ComSleep software does proxying in a server environment.
Case studies are needed involving organizations that have begun to make use of proxying, the benefits (including energy savings) that they have obtained, and any problems encountered.

35
This feedback could be used to fix problems in the standard or products, and to help market the technology more widely. As it is, few people know about the existence of proxying (to some degree understandable, as it is not widely available), so few try it. A key need is to enable systems running different versions of Windows to be able to use an external proxy. The external proxy could be in a computer on each local area network “subnet” or integrated into the network equipment (e.g., Ethernet switch or wireless access point). An interesting line of research would be to determine what sort of proxying for sleeping systems could be done without the knowledge or participation of the system going to sleep. A very basic form of this was demonstrated in the Intel/LBNL collaboration.
Finally, there is a need to spread more awareness within the Internet standards community about the issues raised by systems being asleep, so that new protocols or updates of existing ones could be more “friendly” to sleep states and to proxying. This effort could include being able to better hide sleep states with a proxy, as well as actively exposing sleep states in protocols for both functional and energy benefit.
3.8 Conclusions The effort to develop proxying technology, standardize it, and move it into the market has been a success. Many organizations contributed to this: the California Energy Commission, LBNL, the University of South Florida, the ENERGY STAR program, the Ecma International standards organization, and individuals from many technology companies. There are hardware and software products on the market that implement the technology, and good indication that many companies are working on it internally and will announce products in the future.
While actual energy savings to date from proxying are likely very small, the stage is set for this to increase dramatically in the coming years, particularly if there is some investment to demonstrate and validate its value. The actions of key companies (e.g., Microsoft) will also be critical in determining the amount of progress.
Beyond the specifics of the proxying topic, we have shown that energy‐motivated research and policy can be used to harness the interest and development effort of the technology industry for energy‐saving purposes. This is likely an approach that will be needed many times in the future, particularly as more and more energy‐saving approaches rely on the technology industry for design and/or implementation.
An approach that could be quite valuable is to have PCs that include proxying report their energy‐saving success to systems that can aggregate this information for a large number of devices. This self‐monitoring approach could be highly useful for future verification of energy savings, and could possibly be incorporated into utility rebates, or energy policy.
As noted earlier, proxying could save about half of PC energy use—several billion dollars per year in the United States alone. In addition, it will add functionality for those computer users who do not save energy. Further savings will be found in printers, game consoles, set‐top boxes, and servers.

36
Electronic devices as an end use are fundamentally different from other end uses of energy. Networks pose unique challenges and opportunities for energy use and savings. This topic is not well‐understood and is currently inadequately addressed by energy policy and research.

37
CHAPTER 4: Energy Efficiency Specifications for Network Equipment Network connectivity has become an integral part of daily life, but the energy use, energy savings opportunities, and energy use evaluation of devices that ensure this connectivity are largely unknown. Network equipment consists of devices whose primary purpose is to transport, route, switch, or process network traffic. The vast majority of these use Ethernet and process IP packets. Devices supporting other physical layers and protocols are also considered network equipment, as long as the device either can process IP traffic or support Ethernet. This category includes switches, routers, firewalls, modems (service provider and customer premises equipment), network security appliances, and wireless access points. Devices with a primary purpose to create, manage, store, or display data are not considered network equipment. These devices include computers, phones, and displays, even if they have components (e.g., network interface cards) that process IP traffic.
The goal of this work was to quantify the energy used by network equipment, understand the energy savings opportunities, and develop energy test methodologies.
4.1 Background End uses for electronics include network equipment, as well as endpoint devices such as PCs, servers, IP phones, and printers. Network equipment provides data connections between endpoint devices, and the networks are often structured as a redundant tree where the leaves are the endpoint devices and the trunk is called the network core. Figure 12 shows a graphical representation of the structure (without redundancy).
A key part of understanding network equipment is categorizing and defining equipment types. Switches and routers are used to take data from a source endpoint device and send it to the appropriate endpoint destination. These devices can be standalone units that sit on desktops or in racks, or they can be modular devices configured with line cards selected by the network administrator. Switches and routers are differentiated in that switches have primarily local area network (LAN) functionality while routers have significant wide area network (WAN) functionality.
In an enterprise network, switches are often used in tiers, as shown in Figure 12. The center of the network is the core, the next layer (and sometimes layers) is aggregation, and the last layer closest to the user is distribution. Although some devices are sold for a particular tier in the network, administrators use switches in different locations, depending on the network needs. Note that end devices can be connected at any tier of the network, as there is no fundamental difference between switches at any tier.
Wireless LAN (WLAN) devices are the access points (APs) mounted in buildings to provide Wi‐Fi access. Networks often have standalone security appliances (such as a firewall) that inspect network traffic for malicious data, provide user access control, and support virtual private networks (VPNs). Most networks are connected to a service provider network to

38
provide Internet access using a WAN link. The equipment in the service provider office is called customer access equipment, and the equipment used by the customer is called customer premises equipment. This term is most commonly applied to residential and small business networks rather than large enterprise networks.
Figure 12: Schematic of an Enterprise Network
Source: S. Lanzisera
Network devices have ports, physical connection points where cables can be installed. The ports are available in a variety of speeds and with different physical media. The most common ports use wired Ethernet, copper wires in twisted‐pairs cables, with data transmission at speeds of 10 Mb/s, 100 Mb/s, and 1000 Mb/s. Ports capable of only the first two speeds are often called 10/100 ports, and ports supporting all three are called 10/100/1000 or gigabit Ethernet (GigE) ports. Other common physical connections are fiber optic cable, phone lines, and coaxial cables.
Each port type affects a device’s energy use differently, with faster ports typically consuming more power than slower ports. Commonly, each network end user is connected to a port on the
39
network equipment, and the network equipment ensures that only traffic for that user is sent out over that port. Some networks use shared media, where all traffic is sent on a single medium and the end users filter the data. A Wi‐Fi network is the most common example of this situation, where all users share the same radio frequency (RF) space. Cable high‐speed Internet and passive optical networks (such as Verizon’s FiOS) also use this technique on the WAN side, and power line, phone line, and coaxial cable use this technique in LANs as well.
4.2 Energy Consumption
We estimate that U.S. network equipment used 18 TWh in 2008 and that energy use will grow to 23 TWh in 2012, assuming that energy use per unit remains constant (static efficiency). World usage in 2008 was 51 TWh and is forecast to grow to 67 TWh in 2012.
4.2.1 Methodology
The energy estimates are generated by calculating the product of the stock of equipment in use, the power of the devices, and their usage patterns. For this project, stock estimates were developed using market research data, broadband Internet market data, and interviews with network administrators, home network owners, and retail store floor managers. Power use estimates were developed by measuring the power consumption of devices under varying conditions and combining this with the actual power consumption values (rather than rated power) reported by manufacturers and third‐party test laboratories. The usage patterns for network equipment were developed through a survey of a campus LAN, discussions with manufacturers, and a review of several home networks.
4.2.2 Use Estimates
Tables 2 and 3 show world and U.S. estimates for network energy use in 2007 and 2008, and forecasts for 2009 through 2012. The estimated power per port or device used is for equipment in use in 2008 and is held constant. The 2008 world total of 51 TWh is estimated to grow at a rate of 9 percent annually, and the 2008 U.S. total of 18 TWh—36 percent of the world total—is forecast to grow at 6 percent annually. In 2008, U.S. buildings consumed 2,750 TWh, and network equipment consumed 0.7 percent of this total (U.S. DOE 2009).
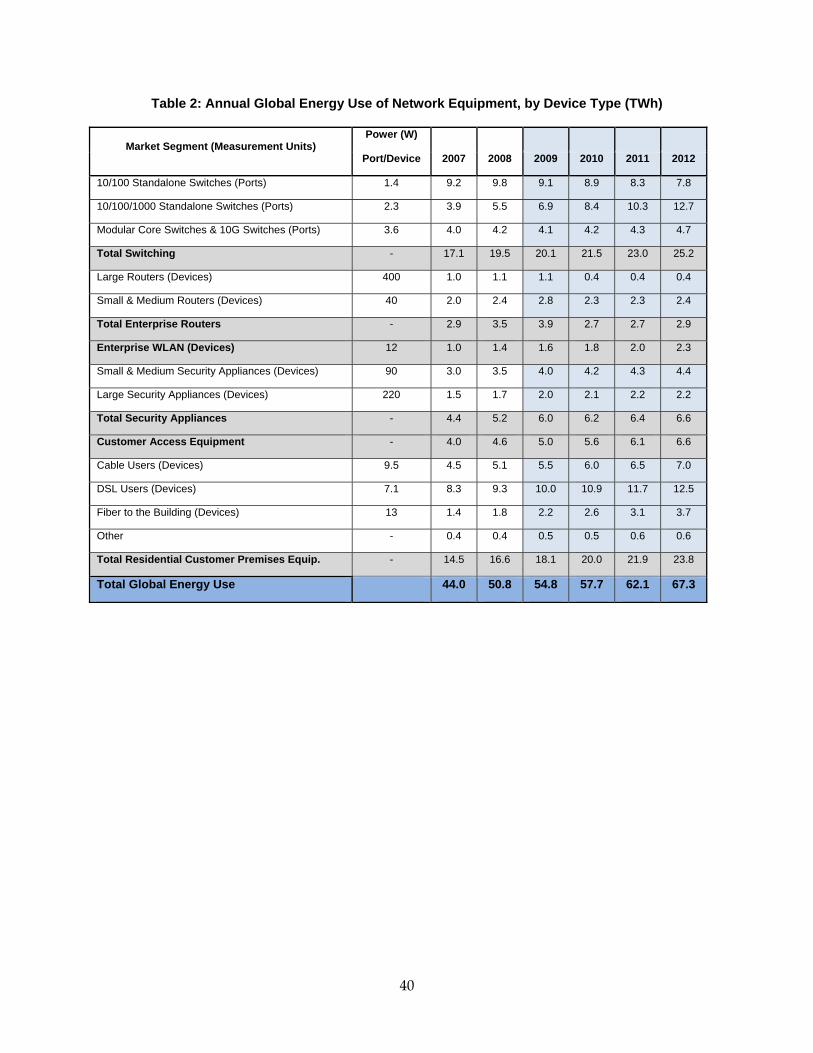
40
Table 2: Annual Global Energy Use of Network Equipment, by Device Type (TWh)
Market Segment (Measurement Units) Power (W)
Port/Device 2007 2008 2009 2010 2011 2012
10/100 Standalone Switches (Ports) 1.4 9.2 9.8 9.1 8.9 8.3 7.8
10/100/1000 Standalone Switches (Ports) 2.3 3.9 5.5 6.9 8.4 10.3 12.7
Modular Core Switches & 10G Switches (Ports) 3.6 4.0 4.2 4.1 4.2 4.3 4.7
Total Switching - 17.1 19.5 20.1 21.5 23.0 25.2
Large Routers (Devices) 400 1.0 1.1 1.1 0.4 0.4 0.4
Small & Medium Routers (Devices) 40 2.0 2.4 2.8 2.3 2.3 2.4
Total Enterprise Routers - 2.9 3.5 3.9 2.7 2.7 2.9
Enterprise WLAN (Devices) 12 1.0 1.4 1.6 1.8 2.0 2.3
Small & Medium Security Appliances (Devices) 90 3.0 3.5 4.0 4.2 4.3 4.4
Large Security Appliances (Devices) 220 1.5 1.7 2.0 2.1 2.2 2.2
Total Security Appliances - 4.4 5.2 6.0 6.2 6.4 6.6
Customer Access Equipment - 4.0 4.6 5.0 5.6 6.1 6.6
Cable Users (Devices) 9.5 4.5 5.1 5.5 6.0 6.5 7.0
DSL Users (Devices) 7.1 8.3 9.3 10.0 10.9 11.7 12.5
Fiber to the Building (Devices) 13 1.4 1.8 2.2 2.6 3.1 3.7
Other - 0.4 0.4 0.5 0.5 0.6 0.6
Total Residential Customer Premises Equip. - 14.5 16.6 18.1 20.0 21.9 23.8
Total Global Energy Use 44.0 50.8 54.8 57.7 62.1 67.3

41
Table 3: Annual U.S. Energy Use of Network Equipment, by Device Type (TWh)
Market Segment (Measurement Unit) Power (W)
Port/Device 2007 2008 2009 2010 2011 2012
10/100 Standalone Switches (Ports) 1.4 3.3 3.3 3.0 2.7 2.4 2.0
10/100/1000 Standalone Switches (Ports) 2.3 1.6 2.1 2.6 3.1 3.7 4.4
Modular Core Switches & 10G Switches (Ports) 3.6 1.7 1.8 1.8 1.8 1.8 2.0
Total Switching - 6.5 7.2 7.4 7.6 7.9 8.4
Large Routers (Devices) 400 0.4 0.4 0.5 0.4 0.4 0.4
Small & Medium Routers (Devices) 40 0.7 0.8 1.0 0.7 0.8 0.8
Total Enterprise Routers - 1.1 1.3 1.4 1.2 1.2 1.3
Enterprise WLAN (Devices) 12 0.4 0.5 0.6 0.6 0.7 0.8
Small & Medium Security Appliances (Devices) 90 1.5 1.6 1.6 1.6 1.6 1.6
Large Security Appliances (Devices) 220 0.7 0.7 0.7 0.8 0.8 0.8
Total Security Appliances - 2.2 2.3 2.3 2.4 2.4 2.4
Customer Access Equipment - 1.1 1.3 1.4 1.6 1.8 1.9
Cable Users (Devices) 9.5 2.9 3.2 3.5 3.8 4.1 4.4
DSL Users (Devices) 7.1 1.7 1.9 2.0 2.2 2.4 2.6
Fiber to the Building (Devices) 13 0.1 0.3 0.4 0.6 0.8 1.1
Other - 0.3 0.3 0.4 0.4 0.5 0.5
Total Residential Customer Premises Equip. - 5.0 5.7 6.3 7.1 7.9 8.6
Total U.S. Energy Use 16.4 18.2 19.4 20.5 21.9 23.4
Figure 13 categorizes annual energy use of network equipment for the world and the United States. It is notable that the United States and world percentages are very similar, suggesting that strategies developed to reduce U.S. energy consumption will directly apply to the rest of the world. The largest categories are switching products and residential customer premises equipment, which together comprise about 70 percent of the total energy use.

42
Figure 13: Breakdown of Energy Use by Major Product Category in 2008 for the World (left) and the U.S. (right)
Source: S. Lanzisera
Figure 14 shows the switching category in more detail over time for the United States. This chart shows a move to higher‐speed equipment. Note that the energy use of 10/100 switching equipment is decreasing, while the use of 10/100/1000 switching equipment is increasing; the result of a shift from 10/100 devices to 10/100/1000 devices. The aggregate energy use of the modular devices, common in core networks and data centers, is much lower than that of standalone switches. Although modular devices each consume a lot of power (up to several kilowatts), there are relatively few of them, and the stock is growing slowly. Standalone switches are found in network and telecom closets of businesses of all sizes, and although they consume less power per device, their vast numbers result in larger aggregate consumption.
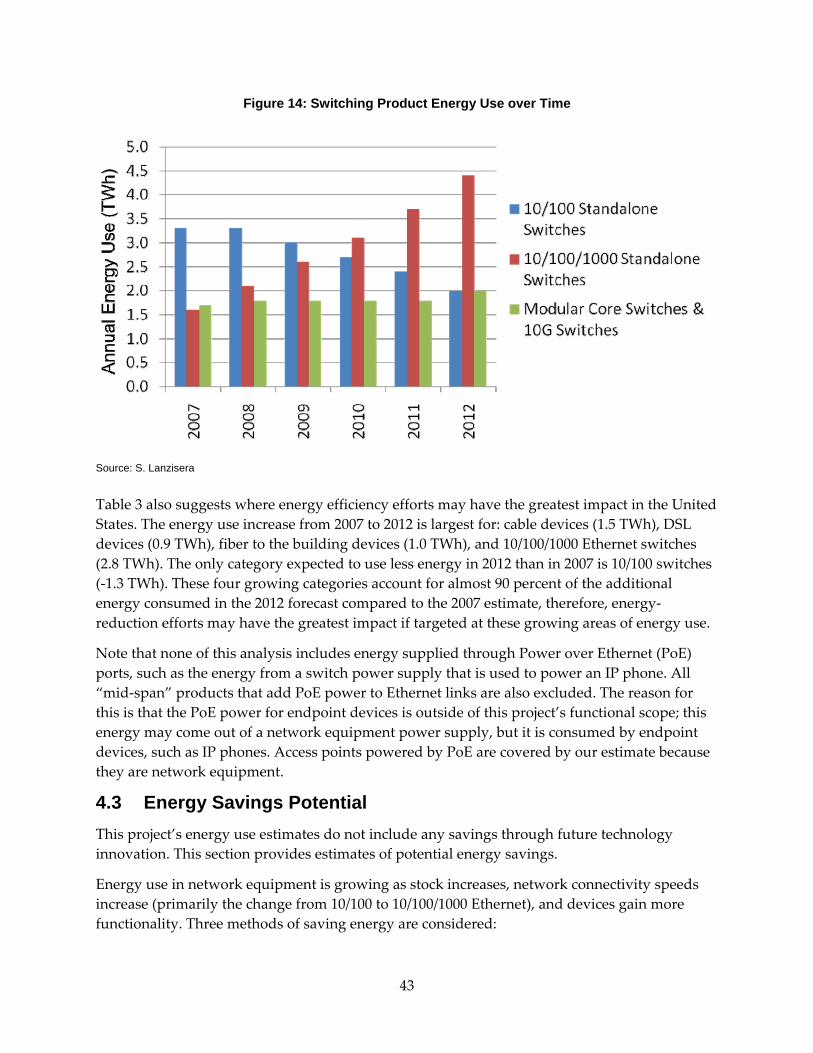
43
Figure 14: Switching Product Energy Use over Time
Source: S. Lanzisera
Table 3 also suggests where energy efficiency efforts may have the greatest impact in the United States. The energy use increase from 2007 to 2012 is largest for: cable devices (1.5 TWh), DSL devices (0.9 TWh), fiber to the building devices (1.0 TWh), and 10/100/1000 Ethernet switches (2.8 TWh). The only category expected to use less energy in 2012 than in 2007 is 10/100 switches (‐1.3 TWh). These four growing categories account for almost 90 percent of the additional energy consumed in the 2012 forecast compared to the 2007 estimate, therefore, energy‐reduction efforts may have the greatest impact if targeted at these growing areas of energy use.
Note that none of this analysis includes energy supplied through Power over Ethernet (PoE) ports, such as the energy from a switch power supply that is used to power an IP phone. All “mid‐span” products that add PoE power to Ethernet links are also excluded. The reason for this is that the PoE power for endpoint devices is outside of this project’s functional scope; this energy may come out of a network equipment power supply, but it is consumed by endpoint devices, such as IP phones. Access points powered by PoE are covered by our estimate because they are network equipment.
4.3 Energy Savings Potential This project’s energy use estimates do not include any savings through future technology innovation. This section provides estimates of potential energy savings.
Energy use in network equipment is growing as stock increases, network connectivity speeds increase (primarily the change from 10/100 to 10/100/1000 Ethernet), and devices gain more functionality. Three methods of saving energy are considered:

44
• Energy Efficient Ethernet
• Improved power supply efficiency
• Improved idle power consumption
This section’s estimates show the magnitude of potential savings, rather than a forecast for 2012, as only half of the current equipment stock will be replaced by the end of 2012, and the technologies discussed here are not widely available, if available at all, in current products. In the estimates below, the terawatt‐hour savings are for the United States.
The move to higher speed is partially addressed by IEEE 802.3az, which is better known as Energy Efficient Ethernet (EEE) (IEEE 2010). Both ends of the link must support EEE to save energy, so broad market adoption should be a priority for policy efforts. Initial estimates suggest that the port physical layer (PHY) can reduce power by 70 percent at low utilization for gigabit Ethernet (Infineon 2009). The PHY consumes about 1.5 W in an assigned and occupied port and 0.8 W in an unoccupied port. Seventy percent savings result in 0.8 W and 0.3 W, or approximately 0.6 W per typical PHY port, compared to 1.1 W per port today (with half of the ports assigned and half unused). Energy Efficient Ethernet also includes provisions to save energy at higher layers, but information on the potential savings here is less certain. An additional savings of 0.2 W/port (less than 50 percent of the PHY savings) is a reasonable estimate. Using EEE on all devices supporting gigabit Ethernet would result in a savings of 2.8 TWh in 2012, or 12 percent. Energy will also be saved in the end devices connected to these products, nearly doubling the overall savings. The savings assume that all of the devices support EEE because if either end of the link does not support EEE, no savings are achieved. Therefore, the full potential will take years to realize.
There are currently no specifications for the efficiency of internal power supplies in network equipment (ENERGY STAR and other programs address external power supplies). A power supply specification similar to that used in the ENERGY STAR computer and server specifications would result in significant savings. There is no comprehensive study of power supply efficiency for network equipment, but computer and server power supplies are a reasonable reference point. Hoelzle and Weihl (2006) stated at the time of their study that typical power supply efficiencies were 60 to 70 percent, with custom‐designed replacement supplies at 90 percent. Limited manufacturer data for high‐end network equipment power supplies suggests that current efficiencies are in the 70 to 80 percent range (Cisco 2010). If current power supplies in enterprise network equipment are 75 percent efficient and are replaced with 85 percent efficient modules, approximately 12 percent of the energy would be saved. This translates to 2.7 TWh of the total annual energy use in 2012.
The current generation of network equipment consumes almost constant power with respect to varying data throughput, but some researchers believe that power could eventually approach linear scaling of power with throughput in future product generations. The techniques discussed here are commonly lumped into the category of “dynamic power savings.” The following paragraphs summarize several ways to move toward this goal.

45
Currently one chip (application‐specific integrated circuit, or ASIC) is responsible for the operation of several (from 4 to 24) ports, and the chip is not designed to eliminate the power used by one port if a cable is unplugged. We estimate that over 50 percent of the ports on network equipment are unused, but these ports are not grouped into blocks. This prevents the equipment from shutting off individual ports and saving energy. Redesigning the chips to have individual power domains for each port would enable individual ports to be put into a very low power mode when not in use. The switch fabric (the hardware responsible for moving packets from port to port) is provisioned to move the maximum number of packets at all times. With 50 percent of the ports unused, this capacity can be reduced by 50 percent and provide the same level of reliability as the switch provides with all ports connected and the fabric capable of full capacity. Redesigning the switch fabric to allow for changes in capacity (through shutting down various blocks or clock frequency and supply voltage scaling) based on throughput utilization and/or port utilization could achieve 25 percent savings for switching products (2 TWh in 2012).
The switch fabric and other components could be designed to dynamically scale with throughput in a manner similar to the way link throughput (and power) scale with EEE. Because most switches operate at average utilizations of 1 to 5 percent, significant savings are possible. It is estimated that switch power could be cut in half using this method, saving approximately 4 TWh in 2012. This method could also be applied to routers, security equipment, and many types of customer premises equipment for total savings of 8.3 TWh per year (36 percent of the total). Some researchers believe that the savings will be larger, but the estimates here are mid‐range.
The three savings techniques are not independent, and they can be adopted together on the same platforms, resulting in interrelated composite savings. A likely scenario includes wide adoption of EEE and improved efficiency in power supplies. This combination would result in savings of 5 TWh (22 percent). The addition of dynamic power savings would save an additional 7 TWh. The total savings would be 12 TWh; 53 percent of the total.
4.4 Barriers to Efficiency 4.4.1 Residential Equipment There are three primary barriers to improving efficiency in residential customer premises equipment:
• Internet Service Providers (ISPs) provide equipment without energy as a consideration.
• Regulators and specifications will be unable to update as quickly as the market evolves.
• The devices are commodity products, where consumersʹ primary consideration is the price when weighing purchase options.
We estimate that almost 60 percent of the energy used by home network equipment in 2008 was consumed by devices supplied to the customer by the ISP. The manufacturers of this equipment meet specifications set by the ISP, and energy has not been raised as an issue by ISPs. As cable Internet access devices (IADs) become more common, the percent of energy consumed by ISP‐provided equipment is expected to grow significantly (estimated to over 70 percent of

46
residential network energy use in 2012). We met with a major manufacturer and supplier of IADs to discuss the market situation for these products. Here is a list of important points from this discussion:
• Equipment manufacturers design to meet minimum specifications set by the service providers and all further specifications are, at best, of secondary importance.
• The service providers have not expressed an interest in the energy use of customer premises equipment.
• Adoption of an efficiency specification will be widespread if service providers require that the specification be met in the products they distribute.
• Energy use is not a major design parameter, due to cost and reliability constraints.
For efficiency improvements to reach consumers, the ISPs must require efficient devices from manufacturers. To this end, we have advised ENERGY STAR to include ISPs in the discussion for the Small Network Equipment (SNE) Specification, and an ISP program similar to that used for STBs is planned for the SNE Tier 2 specification.
The residential equipment market is changing at a rapid pace, and an efficiency specification could become outdated quickly, particularly in the IAD devices. A large number of standards and features are currently being added to IADs because the IAD is intended to be the hub of information flow in the home, and it will interface with as many current and future standards as possible. The following bullets list features currently in IADs, and this list is continually growing and changing.
Wide Area Network Connections
• ADSL2/2+: Standard DSL
• VDSL: High‐speed DSL (used by AT&T’s UVerse network)
• DOCSIS 1.1/2.0/3.0: Cable ISPs standards
• xPON: Passive optical networks (e.g., Verizon’s FiOS)
In Home Wired Local Area Network Connections
• 10/100/1000 BASE‐T Ethernet: The common LAN network cable
• MoCA: Multimedia over Coax Alliance, a new LAN technology
• HPNA (Twisted pair): Home Phoneline Network Alliance, a new LAN technology
• HPNA (Coax): A coax version of HPNA to compete with MoCA
• USB: The Universal Serial Bus commonly used on electronic devices

47
Wireless Local Area Network Connections
• 802.11a: 5 gigahertz (GHz) standard set by the IEEE and the Wi‐Fi Alliance
• 802.11b/g: 2.4 GHz standards set by the IEEE and Wi‐Fi Alliance
• 802.11n: The new 2.4 GHz and 5 GHz standard for high‐speed networking (IEEE and Wi‐Fi Alliance)
Other
• VOIP: Voice over IP in different implementations
• Security features: Including parental security and firewalls
If the ISP requires a device to support a particular standard that prevents specification compliance, the specification will lose impact. This market is quickly changing, and there is concern that the specifications process will be unable to keep up with the rapidly changing market. ENERGY STAR should acknowledge this risk and work to address it with the ISPs and device manufacturers.
Residential network devices are near commodity status, so price often dictates what is purchased. For example, Walmart is a major electronics retailer and there are several other discount stores selling similar products. According to the electronics manager at a local Walmart store, the cheapest products sell at least as well as the more recognized and respected brands. Additional branding (such as the ENERGY STAR label) may be less likely to affect consumer purchases. Consumersʹ choice of the lowest cost devices regardless of branding or features is likely to have a major impact on sales, and the cheapest products are rarely the most efficient.
4.4.2 Enterprise Switches
The primary barriers to efficiency improvements in enterprise Ethernet switches are that power consumption is not a feature of interest to most network administrators, and the energy efficiency metrics under development do not necessarily promote lower energy use.
Network administratorsʹ highest priority is ease of management and reliability. Energy efficiency is not a common criterion for equipment selection. Typically, network administrators are primarily concerned with energy use only as it applies to available cooling capacity for a space. As a result, energy efficiency is rarely used as a marketing point. Energy efficiency is, at best, a tertiary concern. Some data exist to show that there are available enterprise switches with similar capabilities but substantially different overall energy use. Administrators may not be aware of these product differences, and are likely to continue to choose products similar to those already in their networks due to their familiarity with these products, ease of administration, and perceptions about reliability.
The network equipment industry is currently developing metrics for network equipment energy use, but these metrics may not promote lower energy use. The communications standards organization ATIS is developing a metric called the Telecommunications Equipment
48
Efficiency Ratio (TEER) to characterize equipment efficiency. Along with this metric, ATIS is developing a procedure to measure the energy use of Ethernet switches, and it is a good candidate for testing network equipment energy use. The metric is roughly maximum throughput divided by average power, and it is scaled to be a unitless quantity between 0 and 1000, where the higher the TEER, the more efficient the device.
Consider a case where the maximum throughput required2 is 1 Gb/s. A device that meets this specification may consume 100 W and get a TEER value of 100. A device that consumes twice as much power and has three times the throughput will get a TEER of 150. Given that we know equipment power consumption does not reduce significantly when operating below maximum throughput (see Chapter 3), the second device will take twice the energy of the first while delivering the same quantity of data. This is not a more efficient implementation, yet this divided metric hides this reality. The unitless nature of this metric further separates the measurements from the calculation, making it impossible for an individual to even estimate energy use based on the TEER. This metric strategy is not recommended for promoting efficiency.
4.5 Testing Network Equipment The test method for small residential equipment is different than for larger enterprise equipment because the expected performance and form factor are quite different. A complete test procedure for residential equipment was developed based on this work and is being refined for use in the ENERGY STAR Small Network Equipment Specification. The full procedure is included as an attachment to this report. The test method for enterprise switches is based on the procedure ATIS‐0600015.03.2009, with some modifications to account for important quantities.
The procedure for testing small network equipment seeks to capture typical usage conditions: low utilization, with a few different configurations in use. Based on data collected as part of this project, we determined that a single test would be sufficient to determine the relative energy efficiency of products in this class. A single test with the product powered on, supporting appropriate wired network connections, and passing no data provides an excellent single measurement comparison point. We found that supporting one wide area network connection (e.g., cable or DSL), half of the available Ethernet ports, and no other network connections was a reasonable configuration to test equipment.
In the ENERGY STAR procedure, a larger number of tests while passing traffic were included, primarily because industry prefers this more complex test method. In addition, the tests were conducted at low and high traffic rates so that it is possible to determine if equipment power consumption scales with traffic. Scaling does not occur today, but this is expected to change in the future.
2 This example is somewhat simplified, in that network equipment is always overprovisioned to some extent. In addition, there is often some cost increase for higher maximum throughput, but this is not a general rule.

49
Large network equipment testing is similar to small network equipment testing, but power consumption at various traffic levels is more significant. The ATIS procedure tests at low, medium, and high traffic levels, with all ports connected. This is a reasonable test, but we have found that most equipment has roughly half of its ports in use at any given time. Therefore, we recommend that the test procedure for large equipment include a second test with half of the ports connected. This will provide an additional opportunity for saving energy because equipment should be able to reduce energy when fewer ports are in use.

50
CHAPTER 5: Ethernet Audio-Video Bridging 5.1 Introduction This chapter discusses Ethernet Audio‐Video Bridging, an emerging networking technology for transmission of audio‐video content. In parallel to the development of the Energy Efficient Ethernet (EEE) standard by the IEEE 802.3 working group, a second technology called Audio/Video Bridging (AVB) was being developed in the IEEE 802.1 working group. The two working groups realized that EEE technology needs to work well with AVB, because AVB has the potential to be very widely deployed, and incompatibility could result in missing a large energy‐savings opportunity.
As the EEE process neared a major milestone, this part of the EEDN project was launched to evaluate how well EEE and AVB would actually work together. That appraisal resulted in several proposed accommodations that could be implemented in the standards development process. This section summarizes the issues involved.
5.2 Background Energy Efficient Ethernet adds a power‐saving mode called Low Power Idle (LPI) to the Ethernet physical layer (PHY) technologies. Audio/Video Bridging (AVB) is a suite of standards that enable audio and video data streams over a local area network to have a set of quality of service guarantees. The AVB standards address timing and synchronization, a stream reservation protocol, forwarding and queuing enhancements for time‐sensitive streams, and audio‐video bridging systems. The combination of EEE and AVB helps to ensure smooth delivery of audio and video data with minimal energy required. This project identified methods to help ensure reliable operation and recommended language for incorporation into the standards.
5.2.1 Goals This task’s goals were as follows:
• Consult with members of the EEE and AVB committees to determine if the solutions proposed are adequate and appropriate.
• Prepare and present to the appropriate committee(s) a presentation(s) describing the issues and the proposed solutions (as modified in the above step).
• Receive comments on the issues and proposed solutions from the committee(s). If necessary, repeat these steps until a consensus is reached with the committee(s).
• Document any issues that require further attention.
51
5.2.2 Approach John Nels Fuller, the task leader, has been a member of the IEEE 802.1 AVB Task Group since its inception in 2005, and is familiar with its standards projects. He studied the IEEE P802.3az (EEE) drafts and ongoing work in order to understand how it relates to the AVB technology. In this process, he conferred with members of both working groups.
A presentation of the proposed accommodations for the AVB standard was delivered to that committee. After discussions, it was determined that no accommodations were needed in the EEE standard, so no presentations were made to that committee. A detailed review of the existing AVB documents was undertaken to ensure that no inconsistencies with the EEE consensus remained in the AVB documents.
5.2.3 Significant Technology Issues Encountered The following issues were identified as potential problems needing further evaluation. In all cases it was determined that they could be addressed in the IEEE P802.1BA document.
1. The time for EEE to exit low‐power idle may cause AVB to fail to deliver stream data in a timely manner unless care is taken in the implementation of the interface between the physical layer and the data link layer (i.e., between IEEE 802.3 and IEEE 802.1). Solution: Require that the actual packet to be transmitted is not selected until the medium is ready to transmit, as indicated by the CARRIER_SENSE signal.
2. The optional additional wait time on exit from LPI that may be negotiated between the two partners of a physical link will need to be restricted while AVB streams are active, or it could cause AVB to fail to deliver stream data in a timely manner. Solution: Require that the negotiation take into account whether or not streams are reserved on the media, and initiate renegotiation if that changes.
3. Energy Efficient Ethernet does not decide when to enter low power idle but merely provides a management interface to assert or de‐assert the LPI_REQUEST. There is no guidance from EEE to upper layers about when to request LPI. The appropriate guidance may depend upon the operating environment (e.g., home, enterprise, performance venue). Solution: There are separate profiles for each of these environments. For the home environment, LPI should be requested whenever there is no packet ready to transmit.
4. A significant AVB standard, IEEE P802.1BA, was not making progress because it lacked an editor. This document will be the home for most of the fixes to the above issues. Solution: The issue has been resolved by assigning an editor to the project.
5.2.4 Implications None of the significant issues is fatal to the interoperation of EEE and AVB, provided that the AVB document IEEE P802.1BA is completed, and that it incorporates the required information (see Section 10.6). The task group has not objected to these changes, but since the document is still a work in progress, there is no guarantee that they will be incorporated.

52
5.3 Report Background 5.3.1 Overview of IEEE P802.3az Energy Efficient Ethernet (EEE) This overview focuses on those features pertinent to EEE interoperation with the AVB. Energy Efficient Ethernet adds the LPI power‐saving mode to the Ethernet physical path and LPI on the receive path can be viewed as independent.
While the transmit path is asleep, or transitioning into or out of sleep, the link is unable to carry data for the upper layers of the network stack. If the path starts going to sleep and then subsequently data arrives, the transmit path must be given time to wake before the data can be transmitted. This delay varies with the PHY technology, as shown in Table 4.
Table 4: Ethernet Low-Power Idle Characteristics
PHY Technology Speed Media Minimum Delay
100BASE-TX 100 Mb/s Twisted pair cable 30 µsec
1000BASE-T 1 Gb/s Twisted pair cable 16.5 µsec
10GBASE-T 10 Gb/s Twisted pair cable 7.36 µsec
Note: Mb/s = megabits per second, Gb/s = gigabits per second, and µsec = microsecond.
The link partners may negotiate an additional delay in either or both directions to allow even more power savings. This delay is limited by the amount of buffer space the transmitting partner is willing to dedicate to the additional delay in that direction, and by the width of the field communicating the delay (sixteen bits allows for 65 milliseconds). The receiving partner may request this additional delay but must be able to operate correctly if the transmitting partner denies the request.
Note that EEE supports other media technologies (e.g., backplane media), but only these twisted pair types are currently being considered for AVB.
5.3.2 Overview of Audio-Video Bridging (AVB) Audio‐Video Bridging is a suite of standards that enable audio and video streams over the LAN with two quality‐of‐service guarantees. First, it ensures a maximum end‐to‐end latency over seven hops for Class A traffic of two milliseconds. And second, it guarantees that congestion will not cause dropping of stream data packets.
These guarantees enable a live video camera and/or microphone to transmit its stream across the local area network to a video display and/or speaker with only 2 milliseconds (ms) of buffering required.
Four standards are included in the AVB suite: IEEE P802.1AS, IEEE P802.1Qat, IEEE P802.1Qav, and IEEE P802. Each of these standards is briefly described below, focusing on those features that pertain to interoperability with the EEE technology.

53
5.3.3 IEEE P802.1AS Timing and Synchronization This standard, based on IEEE Std. 1588‐2008, synchronizes time‐of‐day clocks on local area network nodes to be within one microsecond of a grand master time‐of‐day clock (for nodes within seven hops of the grand master).
To do this, IEEE P802.1AS requires that the physical layer provide timestamps for the actual transmission time and reception time of certain packets. Using this timestamp capability, IEEE P802.1AS measures the propagation delay on every hop of the network. This measurement is repeated at a default interval of one second. This, along with the residence time of packets within a bridge, allows the synchronization.
There are additional adjustments for the variation in frequency of the local node’s clock versus the grand master’s clock and its nearest neighbor’s clock.
5.3.4 IEEE P802.1Qat Stream Reservation Protocol This standard provides the mechanism by which nodes capable of sourcing an audio or video stream (talkers) announce their offerings, and by which nodes capable of consuming streams (listeners) request those offerings. In addition, this mechanism reserves the resources to carry those streams from the talker to the listener(s) of each stream. The mechanism is called Multiple Stream Reservation Protocol (MSRP) and is based on Multiple Registration Protocol (MRP; defined in IEEE Std. 802.1ak‐2007). MSRP also interacts with another MRP application called Multiple MAC‐Address Registration Protocol (MMRP) if it is present (MMRP is also defined in IEEE Std. 802.1ak‐2007).
When a talker declares a stream, it specifies the stream class, either Class A or Class B, and the stream’s bandwidth requirements. The bandwidth requirements are specified by two numbers: the maximum packet size (before any network overhead added by layer two and below), and the maximum number of packets per class interval. For Class A, the class interval is 125 microseconds; for Class B it is 250 microseconds. This information allows IEEE P802.1Qav to set up its traffic shaping.
5.3.5 IEEE P802.1Qav Forwarding and Queuing Enhancements for Time-Sensitive Streams This standard describes the shaping of stream data for transmission, both at the talker and at intermediate bridges. The standard defines a credit‐based shaper that ensures that stream data does not consume more bandwidth than is reserved for it. At the talker, shaping is both on a per‐stream basis and again on a per‐class basis. At a bridge, shaping is only on a per‐class basis. The shaper determines when the class queue has a data packet available for transmission; that is, it holds back the availability of a data packet until enough credit is accumulated to send it.
Class A traffic has the highest transmission priority when it is available, followed by Class B traffic, and then by all the other levels of priority supported by the bridge or talker. A stream data packet is delayed if a lower priority packet has just started transmission when it becomes available. However, since credits continue to accumulate while that lower priority packet is sent, additional stream packets may become available and freeze out the lower priority queues until the stream queue has caught up.

54
5.3.6 IEEE P802.1BA Audio Video Bridging (AVB) Systems Profiles for AVB systems exist in various markets, such as automotive, consumer, professional A/V, and industrial. Each profile will specify what optional features of various IEEE 802 standards must or must not be implemented; what, if any, changes to default parameter values are required; and other factors. For example, IEEE P802.1Qat and IEEE 802.1Qav will be required, and IEEE Std. 802.3‐2008 Annex 31B (Pause, also known as 802.3x) will be prohibited.
5.4 Areas of Concern between AVB and EEE A number of issues must be addressed to allow AVB and EEE compatibility. The assumption here is that it is desirable to put a link into LPI even for only a very short time. Since AVB usage would provide many such short LPI times, the cumulative total would amount to a worthwhile amount of energy savings. If that is not the case, then AVB and EEE become compatible simply by disallowing EEE operation while streams are active. The following subsections state various problems and their solutions that will allow LPI use even while streams are active on the link.
5.4.1 Delay While Exiting LPI Because AVB is trying to achieve just‐in‐time delivery of stream data packets, it is concerned with anything that may induce a delay. Even without EEE, the timing is tight on 100 Mb/s Ethernet, due primarily to the time it takes to transmit a maximum‐length non‐stream packet of 2000 bytes (1500 bytes of client data plus the maximum 500 bytes of framing and overhead, or about 160 microseconds). This happens if a large non‐stream packet is chosen for transmission just prior to the availability of a stream packet. Other factors that contribute to the delay of forwarding a stream packet are the fixed internal queuing delay of a bridge, and any other stream packets received on other bridge ports for transmission on the same outbound port. The sum of all these sources on a 100 Mb/s link is about 255 to 295 microseconds. Two milliseconds (maximum latency over seven hops) divided by seven is about 285 microseconds per hop.
With EEE involved, if a non‐stream packet is selected for transmission and the link is asleep, the resulting delay can easily break the latency guarantee for the stream. That is, the LPI exit time plus the other sources of delay can be more than the maximum allowable delay per hop. To avoid this we can wake the link when any packet is ready for transmission, but not choose which packet to transmit until the link is fully active. Any available stream packet is transmitted before any non‐stream packet.
This issue of delaying packet transmission selection falls in the gray area between the IEEE 802.3 documents and the IEEE 802.1 documents, as it would be easy for designers to implement the first method without understanding the need for the second method. The easiest way to address this is to put a description of how it should work into IEEE P802.1BA (this is an appropriate place, since IEEE P802.1BA describes the entire AVB system).
For Ethernet speeds above 100 Mb/s, the transmission time for a non‐stream packet of maximum length does not dominate the worst‐case transmission delay calculation, but the above method will optimize the worst‐case delay.

55
5.4.2 Negotiated Delay When there are no reservations for stream traffic over the link, AVB considerations do not limit the negotiated delay after waking. However, if there is at least one reservation for stream traffic over the link, then the total negotiated delay (including the minimum delay for the PHY technology) should be limited to a maximum of 160 microseconds. Thanks to the solution above, the LPI exit delay is never added to a maximum‐length non‐stream packet transmit time at 100 Mb/s, so we may let LPI exit delay grow to that same time.
The IEEE P802.1BA document should specify this requirement on the delay negotiations related to this EEE feature.
5.4.3 When to Assert LPI The EEE document gives no guidance as to when to sleep; it merely provides the controls for others to use. There are many ideas for how to decide when sleep is appropriate.
One view is to wait for a period of inactivity of at least some defined duration, but inactivity is not a very good predictor, especially for AVB streams, which send data every 125 or 250 microseconds.
For the consumer environment, an aggressive approach that sleeps the link whenever there are no packets available for transmission, and then lives with the delay when a packet becomes available, is simple to implement and probably optimal. This is clearly possible even on the slowest AVB‐supported technology (100 Mb/s) because the delay to return to an active link can be constrained to be less than 160 microseconds (the time to transmit a maximum‐length, non‐stream packet that happens to be available just before a stream packet becomes available). When the link becomes active, it transmits packets continuously until there are no more packets available for transmission (available stream packets before non‐stream packets). At that point, the AVB system is again ready to accept a delay of up to 160 microseconds.
The appropriate place to describe this mechanism is in the IEEE P802.1BA document.
5.4.4 Completing the Specifications As mentioned previously, the IEEE P802.1BA document is in the initial development stage. Since there are a number of the above requirements for interoperation with EEE that need to be in that document, it would be wise to monitor its development to ensure that the requested changes are incorporated.
5.4.5 Maximizing Power Savings When there are no streams active over a link, there will still be periodic traffic generated by IEEE P802.1AS and by IEEE P802.1Qat. The shortest period is sending of the time of day by IEEE P802.1AS (default to eight times per second). Participation in IEEE 802.1AS implies that the device will keep its clock running. Additional power savings are possible if the device stops participating in IEEE P802.1AS and turns off its clock. The cost is a long stabilization time (on the order of one or two seconds) when the device again begins to participate in IEEE P802.1AS. For many applications, this cost is acceptable. For example, a video display may take longer than this to bring up its screen. During this stabilization time, the device would be capable of

56
communicating non‐stream data (e.g., stream setup and control) without problems; indeed, it would be able to receive stream data if its changing notion of network time did not make the presentation of the data unacceptable.
5.5 Summary and Recommendations The key issues and conclusions are summarized below:
1. The time for EEE to exit low power idle (LPI) may cause AVB to fail to deliver stream data in a timely manner, unless care is taken in the implementation of the interface between the physical layer and the data link layer (i.e., between IEEE 802.3 and IEEE 802.1). The mechanism described should be incorporated into IEEE P802.1BA.
2. The optional additional wait time on exit from LPI that may be negotiated between the two partners of a physical link will need to be restricted while AVB streams are active, or it will cause AVB to fail to deliver stream data in a timely manner. IEEE P802.1BA should require the negotiated delay to be limited to 160 microseconds when there are active streams on the link.
3. Energy Efficient Ethernet does not decide when to enter LPI, but merely provides a management interface to do this. There is no guidance from EEE to upper layers about when to request LPI. The appropriate guidance may depend upon the operating environment (e.g., home, enterprise, performance venue). For each operating environment profiled in IEEE P802.1BA, that document should describe when the link goes to sleep and wakes. Additionally the Data Center Bridging and Interworking task groups of IEEE 802.1 should be consulted to describe use of LPI in their documents.
4. A significant AVB standard, IEEE P802.1BA, is in the initial stage of development. This document would be the home for fixes to the above issues. The development of IEEE P802.1BA should be monitored to ensure the incorporation of these fixes.
5. None of these issues is fatal to the interoperation of EEE and AVB, provided that the AVB document IEEE P802.1BA is completed and incorporates the required information. These changes have been presented to the AVB task group, which has deemed them reasonable.
57
CHAPTER 6: Consumer Electronics Inter-Device Power Control Consumer electronics (CE) consume a significant amount of energy in homes, and these devices have been networked for many decades. These network connections generally transport content for presentation to the user. The network connections can also pass energy‐ and control‐related information as well; however, network connections are rarely used for control today. Even in cases where control is enabled, CE devices have not been designed with energy efficiency in mind. This task focused on identifying the current status of CE power controls for home entertainment devices and the desired behaviors for future energy‐conscious devices.
6.1 Background A precondition of using home entertainment devices is that they are powered up when needed, and except for displays, doing so is unrelated to their functionality. One approach is to leave the devices on continuously, to ensure that they are available when needed, but most devices are not actively used most of the time, resulting in wasted energy. Products can be powered up and down manually, but this is cumbersome, so often the powering down does not occur. This situation is not optimal for either the user experience or energy consumption.
At one time, the typical TV was not connected to other devices. Today however, most are connected to several affiliated products, with the number rising. These other devices can be powered up and down with manual power switches, with power buttons on remotes, and in limited cases, by other devices to which they are networked (though this usually requires a special configuration or particular products from the same manufacturer and technology base). However, manual control is problematic for several reasons:
• On a practical level, connected entertainment devices are increasingly in closed cabinets, in other rooms, or on the Internet.
• Many users do not know what devices need to be on at any particular time, particularly if they are not adept at managing entertainment networks and/or did not set up the devices involved. It is often not obvious what devices need to be on for a particular function, and today, which devices even are on.
• Activity is increasingly initiated by a device rather than directly by the user (e.g., automated recording of content).
Thus, the traditional model of “manual” power control (whether directly or with a remote control) is becoming obsolete and needs to be replaced. A promising approach is automatic behavior that can be summarized as follows:
“Wake up when you need to; go to sleep when you can.”
Addressing this problem would be easiest if all communications were digital, networked, and used the same protocols. Unfortunately, legacy analog interfaces will likely retain at least the

58
potential for use for many years to come. Other links are digital but not true network links. Finally, there are a large number of partially or fully incompatible protocols in use. These factors are not fatal to the goal; rather, they just make the solution more complicated and slow progress.
6.2 Potential Solutions Although no group is proposing network control solutions with energy savings as the primary focus, there are control methods that can be used in energy‐conscious ways. The cases envisioned, however, offer limited potential savings.
The most common structure is where a device controls the state of other devices through commands. Devices that have a need for services from others will command those others to power up, and when the service is no longer needed, will order them to power back down. This is used by some proprietary technologies, with the TV generally acting as the control device, as it is the most common receiver of content signals. This centralized control method assumes that one device knows what other devices should be doing, and it often results in more devices being awake than required. A common case is that to listen to an audio CD using a DVD player, A/V receiver, and television, the TV is powered on despite not being required.
Another method is to embed the automated command functionality into remote controls. These automated features can be successful in certain contexts, but they have several problems. One is that power commands in existing devices are often a single power command to toggle the power state. If the other device is not in the state that the controlling device expects, it can do the opposite of what is intended. Also, as devices increasingly deliver services to devices other than the primary TV, the TV cannot necessarily determine if a device is providing a function and so lacks the information to make the right decision. Finally, this approach is “brittle,” in that it is easily broken by changes in the set of devices present.
6.3 Barriers to Savings The primary barriers to saving energy using home entertainment controls are legacy connections and a lack of interoperability on newer, digital network connections.
With analog connections, there is no clear way to communicate the power state of the devices at each end of the link. The receiver of the signal, however, can determine if it needs to stay awake by checking to see if there is an input signal. Detecting “loss of signal” is key to improving power control when using legacy connections, and this capability does not exist in most products today. The ENERGY STAR Version 2.0 Audio/Video specification now includes a requirement that devices can detect specific loss of signal conditions, which will start to alleviate this problem.
The lack of interoperability in digital network connections means that devices from different manufacturers (and sometimes different product lines of the same manufacturer) cannot communicate power state or control information. Existing digital network links for home entertainment devices (e.g., HDMI, Zigbee RF4CE) include standard commands and may also include proprietary commands. The standard commands have largely been ignored because

59
they are not required for compliance, and they have been replaced with proprietary controls. Industry representatives admit this helps improve “bundle sales” of TVs, video disc players, and other devices, but they state the real reason behind the lack of interoperability is to avoid undesired behavior.
The leading digital network connection for audio and video devices is HDMI, but it is difficult to influence the standard. HDMI is a closed standard that only HDMI founders (a handful of major consumer electronics manufacturers) can comment on, and only HDMI Adopters (fee‐paying companies that license HDMI technology) can view. The closed nature of the standard has slowed the energy community’s ability to influence the standard in energy‐conscious ways.
6.4 Device Behaviors for Energy Savings The best controls solution is one that embraces device autonomy and self‐control, along with standard behaviors. That is, each device should be aware of what services it is providing, and inform other devices as best it can about relevant services it is using. Since we will long have legacy interfaces that impair such an information exchange, reasonable compromises need to be embedded in device behavior.
An important precedent for this, albeit a much simpler one, is the operation of monitor power management with PCs. The PC signals to the monitor when it should go to sleep by ceasing to send synchronization signals on the data link. It later indicates when the monitor should wake by resupplying these signals. Today, many monitors can sleep at the same power level that they use when off, showing that efficient sleep modes are possible with well‐designed protocols.
Operation of the solution may be best illustrated and understood by a few examples.
• A TV is powered up, and a DVD player is selected as the source; this should cause the DVD player to wake and start its menu sequence. The user then selects “play” and begins watching a DVD.
• The TV is later shifted to broadcast television in the midst of the DVD (which then pauses). The TV stays away from displaying the DVD signal for 15 minutes, at which point the DVD player powers down to sleep.
• Another time, the DVD finishes a movie and shifts to its menu mode. After 15 minutes of being in menu mode with no user input, it goes to sleep; the DVD signals its transition to sleep (or simply ceases to send a display signal to the TV), which causes the TV to also go to sleep (possibly briefly displaying a message to this effect).
• A set‐top box is delivering content to a TV via an analog connection that does not allow it to know the power state of the TV. Four hours pass with no user interaction to the set‐top box, so it overlays a message of imminent power down for five minutes, then goes to sleep. If the TV is not already asleep, it also does so with the lack of signal.
These examples highlight key aspects of the solution:

60
• Expose the power state over the network—that is, whether the device is fully on or asleep (and possibly expose “off”).
• Expose the functional state over the network, e.g., what data streams are actually being consumed, whether a media source (such as a DVD or iPod) is loaded, and the time since the last user input activity.
• Set default device behavior, including time‐delays suitable to human behavior and expectations. These delays should be long enough so that most transitions occur after people are no longer engaged with the product.
• Devices take into account power and functional information from other devices to determine what they should do.
• Devices go into a sleep state rather than “off” as the normal low‐power state.
6.5 Implementation Moving to the comprehensive solution will require a set of interoperability standards that cross multiple data interface types and user interfaces. It requires action on the part of standards organizations, energy policy‐makers, and manufacturers of audio/visual products.
Key actions are as follows:
• Create a “meta‐standard” that defines general approaches, principles, and behaviors that lead to the desired result.
• Implement this scheme in standards for specific interfaces, protocols, and products (e.g., HDMI, universal plug and play (UpnP), and other emerging IP‐based protocols). Some standards already include parts of the needed functionality.
• Explicitly move to a three‐state power model, where “sleep” implies continuous network presence, and “off” does not.
• Develop energy policies that require adoption of standards and other elements of comprehensive solutions as a prerequisite for granting energy efficient status to audio/visual products (initially for voluntary specifications and later for mandatory requirements).
• Manufacturers of audio/visual products must adopt the standards and other elements of comprehensive solutions, both in new products and with software upgrades to some existing products.
• Explain these behaviors to ordinary users of products, particularly with respect to addressing the complications introduced by legacy products.
Accomplishing all of these is not trivial and will take some time, but there are no fundamental barriers to success. In particular, the useful functional advantages interoperable controls offer

61
people may drive manufacturer and consumer acceptance, with the energy savings only a useful side benefit.
Some connected devices, such as PCs, will have principal functions other than audio/visual content. These will also need to implement parts of the proposed system.
It is possible to implement most of the desired behaviors in some existing industry standards. As an example, the HDMI standard includes the capability to provide higher‐level control through the Consumer Electronic Control (CEC) facility. Currently CEC is implemented primarily as a vendor‐specific option, without cross‐vendor interoperability. HDMI consumer electronic control could be used to significantly increase the time that devices spend sleeping (instead of remaining in their active state) by enabling devices to expose power state information to connected devices. The HDMI CEC 1.3a specification includes over 50 commands, but only five of these commands would enable most of the desired behaviors. Three additional commands not included in the specification would enable additional energy‐saving capabilities. Details of the proposed basket of CEC commands required for energy‐saving controls are included in Appendix

62
CHAPTER 7: The Energy-Efficient Set-Top Box Set‐Top Boxes (STBs) have become very common in homes, and these devices can consume large amounts of energy. Energy efficiency efforts have had limited success tackling this problem. This is partially because STBs are a diverse market segment with many different product types and functions, and also because the network connections that make STBs so useful result in devices that do not have low‐power modes equivalent to other devices.
This task’s goals were to identify the market, explain how network connections impact STB energy use, and how policy has affected the energy consumption of a segment of the STB market.
7.1 Background and Market Status We began this project with an investigation of the market and the technologies used in STBs. The main conclusion of the market survey is that the STB market continues to change at an astonishing pace and sometimes in unpredictable directions. New services are regularly being added or enhanced as a result of technical additions or improvements to the STBs. For example, in the last two years an entirely new form of STB has emerged whose sole purpose is to deliver movies to customers over the Internet. This feature is now part of other STBs, further increasing the STB market diversity.
The initial plan was to select a “typical” STB to represent the technologies, functionalities, and features most frequently encountered. Using this STB as a base case, we planned to apply technical improvements and estimate energy savings. Unfortunately the concept of a “typical” box has been undermined by changes in both technologies and business models. In short, no single, typical STB adequately represents the diverse product mix now available; similarly, the energy savings from modifications will have declining relevance to the whole market. Moreover, we believe the energy use of the STB is increasingly determined by the networks and content sources rather than the inherent characteristics of the STB itself.
The surest approach to saving energy in STBs appears to be focusing on the STB network—that is, the STB and its communication links. We consider this the “STB ecosystem,” to reflect the complex interdependencies. It’s not possible to determine which products will make up that ecosystem—although it will almost certainly include one STB and at least one display—but it is certain that they will be exchanging digital information, and possibly even low‐voltage power . We also expect that the energy consumption of the products will depend on the amount of data being transferred between them and the functional state of products in the network as a consequence of this connectivity. For this reason, the communications protocols between the products rise in importance. These protocols need to be designed to encourage the networked products to achieve the lowest possible level of power use for the functions that they are performing at any given time.

63
7.2 Digital Networks as an Efficiency Tool Today, many STBs essentially stay awake all the time because they must maintain a network connection to the Internet and to a service provider. Maintaining these links uses energy. In addition, the STB’s processors and other components must have the ability to receive or transmit data over these links at any time. Two other tasks in the EEDN project generated methodologies that could be applied to reducing the energy use of STBs: Energy Efficient Ethernet and Network Presence Proxying.
The Energy Efficient Ethernet (EEE) work transformed a high‐power, always‐on link and into one that power‐scaled with throughput. The specifics of the work done as part of EEDN only apply to Ethernet, but many STBs now connect to the home network using Ethernet. The ideas behind EEE should be applied to other network links as well. By reducing the energy required to maintain the link, significant energy can be saved across the more than 100 million STBs in the United States. With 15 million STBs in California alone, roughly 100 GWh per year could be saved in the state if all STBs and connected devices used EEE, and this change should not increase the cost of STBs.
Even larger savings are possible if STBs were able to use Network Presence Proxying to reduce energy consumption while not actively being used. Today, STBs stay connected to the service provider at all times in order to receive programming schedules, software updates, account changes, and more. To be able to respond to the service provider’s demands, the STB’s main processor and networking hardware must remain on at all times, in the same way a PC must be on to receive software updates or be backed up.
Proxying enables an STB (or a computer) to go to sleep and transfer its network presence to another entity that could simply be a component inside the STB. There is no need for the entire box to stay awake all the time just so that it is ready to receive program updates or other information. The work on proxying done in EEDN is focused on computers, but many of the principles and techniques also apply to STBs because they also have IP network connections. The other non‐IP connections (e.g., cable to the service provider) would need some adaptation and specific development of proxying for the types of network connections service providers prefer. Proxying in STBs would save roughly 2 TWh in California, or roughly half the total energy consumed by STBs in the state.
There is significant work to be done on the efficiency of STBs moving forward, but it is important to focus on why the boxes stay awake: currently their network connections require that they do. Moving forward, we have developed techniques that enable us to move to a new paradigm where STBs sleep much of the time and are only awake to receive information, record programming, or provide content to users.
7.3 Effect of Digital-To-Analog (DTA) Policies on Energy Use Policy efforts on STB energy use have had mixed success, and a goal of this task was to determine the effectiveness of recent policy efforts. We studied the Digital Television (DTV) Converter Box Coupon Program to determine the energy impact of the policy. The program was

64
administered by the U.S. government to subsidize purchases of DTA converter boxes, with up to two $40 coupons for each eligible household. To qualify as Coupon Eligible Converter Boxes (CECBs), these devices had to meet a number of minimum performance specifications, including energy efficiency standards. The ENERGY STAR Program also established voluntary energy efficiency specifications that are more stringent than the CECB requirements.
This study measured the power and energy consumptions for a sample of 12 CECBs (including six ENERGY STAR labeled models) in‐use in homes and estimated aggregate energy savings produced by the energy efficiency policies. Based on the 35 million coupons redeemed through the end of the program, our analysis indicates that between 2500 and 3700 GWh per year are saved as a result of the energy efficiency policies implemented on digital‐to‐analog converter boxes. The energy savings generated are equivalent to the annual electricity use of 280,000 average U.S. homes. It is worth noting that these federal DTA policies were originally set in motion by California’s Title 20 equipment standards proceedings, so the Energy Commission can take some “credit” for the national energy savings estimated above.
7.4 Conclusions The STB energy use will continue to grow, unless the current designs are significantly altered . Focusing on the network connections in particular will result in significant energy savings. Specifically, network presence proxying stands to significantly reduce the energy use of STBs, and we encourage active research and development in this critical area.

65
CHAPTER 8: Reducing Energy Use of Hard-Wired and Builder-Installed Miscellaneous Equipment in New Homes 8.1 Background New California homes include many hard‐wired and builder‐installed products with electronic components, such as smoke alarms, doorbell transformers, garage door openers and other remotely operated devices. New homes also include service provider‐installed equipment such as security systems and structured wiring components used to provide sound, video, and computer networking capabilities to a home. Previous work by LBNL found that new types of builder‐installed devices, such as structured wiring systems, are significantly increasing the standby energy used by these products.
In addition to consuming energy when actively operating, many builder‐installed devices use energy in low power modes. Low power modes are stages of activity and energy use between “off” and “active;” standby and sleep modes being two such examples. Products that feature low power modes include security systems, microwaves, any remote‐controlled device, or devices having an unswitched transformer used to lower voltage. This research task focuses on the low power mode energy consumption of builder‐installed devices for two reasons:
1. Low power energy consumption often dominates total energy use for builder‐installed devices. Although devices use less power while in low power modes, these modes may still constitute the majority of a product’s annual energy consumption because of the amount of time the product spends in standby, as with doorbells (class 2 transformers) or smoke detectors.
2. Active mode energy consumption has already been tested for many of the devices relevant to this study; however, data on low power mode energy consumption is more often lacking.
This task involved two distinct stages: (1) reviewing the market for hard‐wired and builder‐installed equipment in new homes and estimating their statewide energy use, and (2) conducting detailed energy measurements for four selected products and recommending strategies to reduce energy consumption.
8.2 Market and Product Assessment 8.2.1 Background Research Preliminary research aimed to select for analysis the products that consume the most energy. Selections were based on market information, previous data on product energy use, and field research in new California homes.

66
8.2.2 Saturations To create estimates of saturations for specific products, we used data compiled by Brown et al. (2006), in which inventories of products were taken in 13 new California homes. By recording the number of product types in these 13 homes, we were able to create estimates for average product saturations in new California homes, shown in Figure 15. These averages became the saturation estimates for all devices in this analysis, except in the cases of GFCIs, microwaves, and doorbell transformers, for which more detailed reports were available (listed in Table 5).
Figure 15: Number of Builder-installed Products per New Home in Northern California
Source: Biermayer et al. (2008)
8.2.3 Annual Unit Energy Consumption The same field research by Brown et al. (2006) provided unit energy consumption (UEC) data for many of the products addressed in this plan. Because the Brown et al. report divided energy consumption into different low‐power modes, the wattage for a device in one mode needed to be multiplied by hours spent in that mode to arrive at a kilowatt‐hour figure. Then this process was repeated for each documented power mode and the totals added together to create a yearly UEC estimate for each device. Again, for certain products, such as GFCIs and doorbell transformers, other sources were used when they provided more accurate UEC numbers, and a similar approach created a UEC estimate from the data of other agencies (see Table 5 and Figure 15).

67
Table 5: Estimated Energy Consumption for Builder-Installed Equipment in CA
Device Data Source Units per
Home UEC
(kWh) AEC
(GWh)
Structured Wiring Panel (Brown et al. 2006) 0.8 175 15.0
Microwave (KEMA-XENERGY, Itron, and RoperASW 2004) 0.95 133 13.5
GFCI (Baskette et al. 2006) 10 5 5.6
Security System (TIAX LLC 2006) (1) 0.7 61 4.6
Garage Door Opener (Brown et al. 2006) 1.2 31 4.0
Garbage Disposal (Brown et al. 2006) 1 31 3.3
Irrigation Timer (Brown et al. 2006) 0.9 26 2.5
Broadband Access Devices (TIAX LLC 2006) (2) 0.4 53 2.3
Doorbell (Class 2 Transformer) (Baskette et al. 2006) 1.5 13 2.1
Smoke Detector (Ecos Consulting et al. 2006) (1) 4.8 4 1.8
Gas Demand Water Heater (A. Meier, pers. comm. 2007) (2) 0.06 121 0.8
Number of 2006 CA New Homes: 106,953
Notes: 1. The energy estimates for security systems and smoke detectors are from the listed source, but the
saturation estimates are provided by Brown et al. (2006). 2. Saturation of broadband and gas demand water heaters are based on stock of existing CA homes.
Source: Biermayer et al. (2008)
8.2.4 Detailed Assessment of Products Based on the AEC results and preliminary research on all products, we selected four products for detailed research: GFCI, garage door openers, irrigation timers and door bells. Although some of the products in Table 5 use more energy on a statewide basis, our preliminary research showed that certain products, although present in new homes, were not ideal candidates for builder‐focused solutions. For instance, structured wiring systems contain components that are often installed by service providers or the building occupant (e.g., cable modems or networking switches) and thus may not primarily be “builder installed.” Security systems have a similar situation. For this reason, these products were not selected for further investigation in this study.
For the four selected products, we performed a technical and market assessment to better understand how these products use energy and how purchase decisions are made. We also performed power metering on a sample of products to determine typical power draw in various operating modes.

68
The devices metered were mainly obtained through retail stores and represent the brands and models that are broadly available at hardware and home improvement stores in the Bay Area. In the case of irrigation controllers, we metered products that were on display at water‐conservation demonstration sites operated by water utilities. The study metered a broad cross‐section of products, including models that builders typically buy as well as other models that may be more energy efficient (to get a range of efficiency). All metering was done with a power line meter, which we used to conduct spot measurements (instantaneous readings of power use). The products were all measured as originally configured or as found, without any configuration beyond their current settings. We generally followed the metering methodology used by Roth and McKenney (2007). This methodology allows for the product to be in standby mode for 5 minutes, in order to let the power consumption stabilize, before taking a power measurement. Because hardwired devices do not have a plug‐in power cord, power line metering required attaching a plug. For such hardwired equipment, we only metered purchased products.
8.2.4.1 Metering Results Irrigation controllers contain electronic circuits for scheduling the watering time and duration, as well as circuitry to operate the solenoid valves of irrigation system. Increasingly, controllers have “smart” circuitry, which uses inputs from sensors or the Internet to only irrigate when the landscaping needs the water. We metered 19 irrigation controllers, representing a number of manufacturers, sizes (number of watering “stations”), and presence or absence of smart features. Figure 16 illustrates the range of power levels, and Table 6 summarizes the daily energy consumption for an average controller with an assumed usage pattern. Based on these data it is clear that smart controllers use more standby power, although this should be balanced with the potential for smart controllers to significantly reduce water use. Using typical numbers for embedded energy (for treatment and pumping) in water in California, and typical usage patterns for irrigation controllers, we found that the embedded energy savings from reduced water use can be as much or more than the additional energy used by a smart controller (Biermayer et al. 2008).
Table 6: Comparison of Conventional and Smart Controller Energy Consumption
Controller Type Daily Standby W-hrs
Daily Active W-hrs
Total Daily W-hrs
Percent of Energy Usage in Standby
Conventional 49 6 55 89%
Smart 97 10 106 91%
Source: LBNL

69
Figure 16: Standby Power Draw and Power Factor for Irrigation Controllers
Source: LBNL
Garage door openers contain motors to operate the garage door, lights to illuminate the garage, control systems to sense the remote control, and safety systems to detect an object blocking the garage door. The motors can be either AC or DC powered. Energy consumption of a door opener can be divided into active mode, when the door is being operated and standby or ready mode, when the door is ready to be activated. We metered standby power levels for 10 openers representing three manufacturers, and both AC and DC motors. We were only able to meter active energy for two openers that were installed in homes (not in a retail setting). The standby power ranged from 3W to 9W, with an average of 4.6W for models with AC motors and 7.4W for DC motors. Figure 17 shows the breakdown of annual energy use for an average garage door opener, assuming “typical” operating patterns, which is dominated by the majority of time spent in standby mode.
Irrigation Timers / Controllers
0.00
1.00
2.00
3.00
4.00
5.00
6.00
0 0.1 0.2 0.3 0.4 0.5 0.6Power Factor
Stan
dby
Wat
ts
smart controllers
conventional plus

70
Figure 17: Garage Door Opener Energy Use by Mode
Source: LBNL
Ground‐Fault Circuit‐Interrupters are outlet receptacles that have a safety feature which removes power to a receptacle when current leakage is detected. GFCIs for residential housing are typically rated for 15 or 20 Amps. We metered eight GFCI products from four manufacturers, in both 15A and 20A capacity ratings. Our results show that the no‐load power (with no device plugged into the GFCI) ranges from 0.4W to 1.1W, with an average of 0.7W. Figure 18 shows the significant variation in standby power between manufacturers, but the current rating appears to have no effect.

71
Figure 18: No-Load Power Draw for GFCIs
Source: LBNL
Class II (low‐voltage) transformers have several applications in residential homes, including door bells and chimes, HVAC controls (e.g., thermostats), lighted address signs, and low voltage lighting. Our study focused on transformers used for door bells and chimes. The transformers for doorbells are typically hardwired to 120‐Volt wiring at an electrical junction box. The low voltage side of the transformer is part of a circuit that connects a door bell button to the doorbell. Typical transformer output voltage is 8v, 16v, 24v AC, and the transformer capacity is rated in “Volt‐Amps” (VA). Test data in Figure 19 show that the size of a transformer affects its standby energy consumption. One implication of this finding is that using a larger transformer than necessary uses more energy in standby mode. In addition, we tested a transformer connected to a lighted doorbell and found that the light increases the transformer power draw by about 1W.
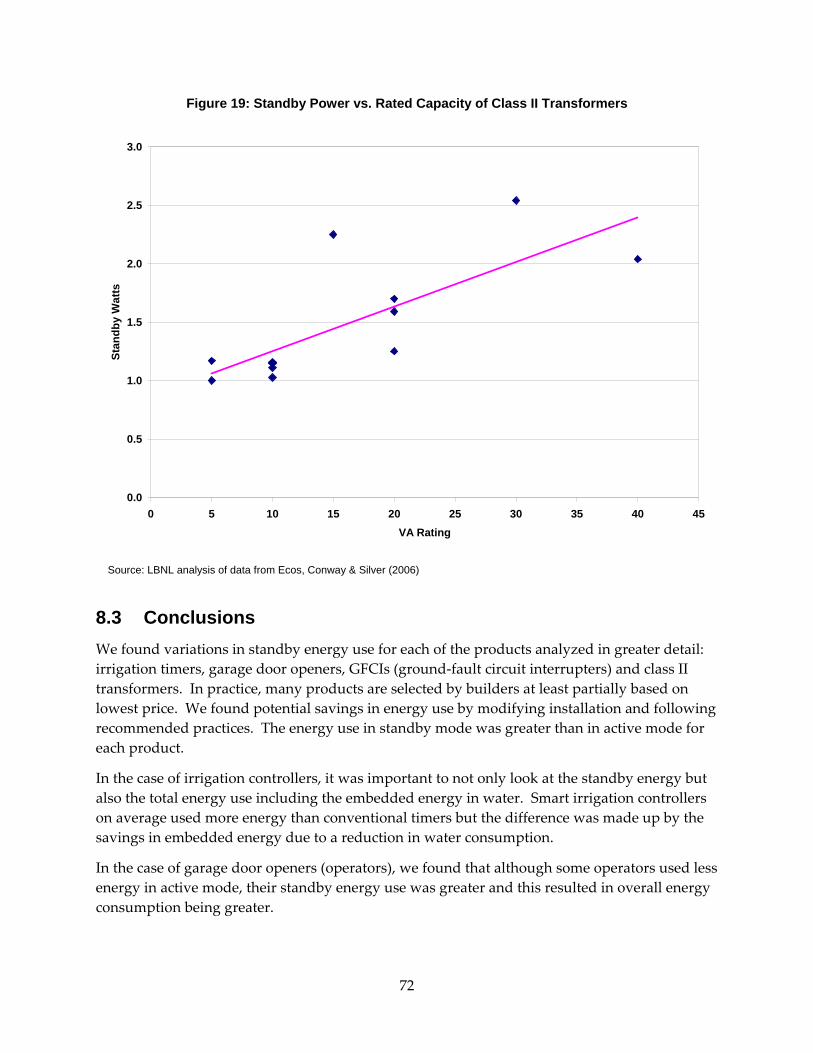
72
Figure 19: Standby Power vs. Rated Capacity of Class II Transformers
Source: LBNL analysis of data from Ecos, Conway & Silver (2006)
8.3 Conclusions We found variations in standby energy use for each of the products analyzed in greater detail: irrigation timers, garage door openers, GFCIs (ground‐fault circuit interrupters) and class II transformers. In practice, many products are selected by builders at least partially based on lowest price. We found potential savings in energy use by modifying installation and following recommended practices. The energy use in standby mode was greater than in active mode for each product.
In the case of irrigation controllers, it was important to not only look at the standby energy but also the total energy use including the embedded energy in water. Smart irrigation controllers on average used more energy than conventional timers but the difference was made up by the savings in embedded energy due to a reduction in water consumption.
In the case of garage door openers (operators), we found that although some operators used less energy in active mode, their standby energy use was greater and this resulted in overall energy consumption being greater.
0.0
0.5
1.0
1.5
2.0
2.5
3.0
0 5 10 15 20 25 30 35 40 45VA Rating
Stan
dby
Wat
ts

73
We found that some GFCIs used twice as much standby energy as others. Additional energy can be saved by using switched receptacles.
We found that variations in doorbell transformer influence energy use. In addition, we found that a lighted doorbell button can use as much energy as the transformer.
From the market analysis of products using standby mode in new homes we found that structured wiring systems have a huge potential for increasing total home standby power consumption. This is a more recent development and the amount of standby power depends on the specific components connected to the structured wiring system. Microwave ovens were the second highest consumers of standby power in new homes, followed by security systems.
8.4 Future Research Directions Three of the top standby‐using products in new homes merit further research: structured wiring systems, microwave ovens, security systems.
Structured wiring refers to wiring installed in new houses that allow audio (music and phone), video, computer and other systems to be interconnected. The wiring itself does not use any energy but the components connected to it do; therefore, the energy used in standby and active modes depends on what and how many components are installed. This is a new and evolving industry ‐‐ the most commonly used components should be tested, and how components interact in a network should also be studied and assessed for their energy use.
Microwave ovens and microwave ovens with integral vent hoods use was the second highest user of standby power in new homes. The DOE is currently undertaking a rulemaking on microwave ovens. The effectiveness of the vent hoods may be another area of research. Product measurements need to be taken.
Security systems where the third highest user of standby power. Further research on this topic is necessary. This would include testing products and interacting with manufacturers.
Future trends and changes in future electrical codes draw attention to other products that may use a substantial amount of standby energy in the future. Arc‐fault circuit interrupters will be required in many more household locations in the next revision of the National Electric Code. Currently, these are only required in bedrooms. Product testing is fairly simple to do but there is a dearth of information on this product.
Products not on the current list that are increasing in market share are ultraviolet lamps in HVAC systems, built‐in house vacuum cleaners, and bathroom exhaust fans. Future building code changes may require bathroom fans in all bathrooms. These come in a variety of energy use, sound level, and effectiveness in moving air. Some are advertised as being much more efficient than others.
Future work may also include research on why some products use more energy than other products with the same functions. Discussions with manufacturers may provide insight as to how to reduce standby power in their products.

74
CHAPTER 9: Transforming the Market for Digital Networks To promote the adoption of energy efficient consumer electronics and IT digital networks, the project team undertook a wide range of market connection activities. We worked through industry groups with the capability to effect market transformation via visioning and strategic planning, standards committees, and industry conferences. Research results were directly provided to the organizations responsible for IT and consumer electronics standards and guidelines, U.S and international entities promoting efficient consumer electronics and IT products, and manufacturers designing both digital network products and the networked end‐use products.
Table 7 presents some highlights of the market transformation activities.

75
Table 7: Transforming the Network for Digital Networks – Highlights

76
CHAPTER 10: Conclusions and Recommendations 10.1 Conclusions The research team developed a broad set of research findings about digital networks through this research project. Several overarching conclusions emerged:
10.1.1 Digital Networks Have a Significant Energy Impact and Savings Potential • Energy Efficient Ethernet could save $400 million/year in energy bills for the current
stock of links in the United States—globally over $1 billion in energy savings.
• The largest energy waste in electronic products is due to time spent in active mode when no one is using the device, often in order to maintain network connections. Proxying can enable network connectivity in sleep mode, and could save about half of PC energy use—several billions of dollars per year in the United States alone. Further savings could be realized in printers, game consoles, set‐top boxes, and servers.
• Network equipment in the United States consumed an estimated 18.2 TWh in 2008 and is projected to grow to 23.4 TWh in 2012. Combining wide adoption of EEE and improved efficiency in power supplies with the addition of dynamic power savings could yield a potential total savings of 12 TWh by 2012.
• Set‐top box energy use is growing rapidly—we estimate that STBs used 2.4 TWh in California in 2010. After assessing the types of network connections that STBs typically have, the research team concluded that improving STB networks (that is, the STB and its communication links) are the key to saving energy.
10.1.2 Develop Technologies to Scale Network Energy Use to the Services Delivered • The energy efficiency community can engage and partner with the technology industry
to develop and create energy‐efficient technologies, such as EEE and network proxying. Energy research and policy can be coupled with the interest and development efforts of the technology industry to achieve energy savings in the future. Such future collaborations will be needed, especially as more and more energy‐saving approaches rely on the technology industry for design and/or implementation.
• Energy use can be made to track utilization; through the use of EEE, Ethernet PHYs (physical layer interfaces) can save up to 90 percent. U.S. EPA ENERGY STAR will add the EEE standard as hardware becomes available on the market.
• Both hardware and software products on the market implement proxying technology, and many companies indicate that they are working on it internally. Apple implements select protocols for proxying in its iMac line of computers internally, and in all of its products since the summer of 2009 with external proxy functionality (the proxy is an access point, external disk backup system, or another Apple computer, including the very small Apple TV product). Hewlett Packard and Dell have implemented much more

77
limited portions of the Ecma International standard as internal proxies for use with the Windows operating system.
• For network equipment, this project investigated three methods of saving energy— Energy Efficient Ethernet, improved power supply efficiency, and improved idle power consumption—and found that when adopted concurrently on the same platform the composite savings are estimated to be 53 percent. Moreover, a single test with the product powered on, supporting appropriate wired network connections, and passing no data provides an excellent single measurement comparison point, and could determine the relative energy efficiency of products in a class.
• The research conducted in this project found that EEE is not inherently in conflict with an emerging standard that will commonly be used to distribute video in homes— Ethernet Audio/Video Bridging—but further work is needed to ensure there is no conflict in practice.
10.1.3 Technology Standards and Voluntary Programs Are Critical for Energy Savings in Digital Networks
• Public sector, academic, research, and industry participation can add vital information and broad perspectives during a standard development process, and help maximize the benefits to be realized throughout the public commons. Developing standards is an inherently collaborative process, with collective results.
• The IEEE standard for EEE was approved in September 2010.
• The Ecma‐393 proxying standard was approved in February 2011 and has since been sent to the International Electrotechnical Commission (IEC) for adoption as ISO/IEC DIS 16317. ENERGY STAR recognized Ecma‐393 as the proxying standard, and will consider including proxying in the next specification update for computers and other products.
• After reviewing many of the available power control standards for consumer electronics, the research team developed a set of power control principles that, if incorporated into industry standards, would lead to significant savings in consumer electronics by allowing them to be in low power mode more often.
10.2 Recommendations • Networks pose unique challenges and opportunities for energy use and savings, and
this topic deserves continued energy research and policy attention.
• EEE: The performance of energy efficient Ethernet products should be monitored as they come onto the market, and any technical or market barriers to their success should be investigated. This approach may be applied to other physical layers (e.g., MoCA® [Multimedia over Coax Alliance], optical link); the feasibility and potential benefits should be explored. Power management in Wi‐Fi links is under review in 802.11; this effort may yield synergies that could result in significant additional energy savings for EEE.

78
• Proxying: The Distributed Management Task Force (DMTF) has begun work on proxy management. Proxying case studies could be used to evaluate the benefits (including energy savings) that have been realized, and to identify any problems encountered. This information could be fed back into the standard or products, and help market the technology more widely. Personal computers could monitor and report the energy savings that result from proxying, and these data could be aggregated over a large number of machines and incorporated into utility rebates or energy policy. It will be critical to educate and inform the Internet standards community so that new protocols or updates can be more friendly to sleep states and to proxying. Future research could investigate proxying for sleeping systems, without the knowledge or participation of the system going to sleep.
• Test procedures for large network equipment should include a second test with half of the ports connected. This approach would provide an additional opportunity for saving energy because equipment should be able to reduce energy when fewer ports are in use.
• Ethernet Audio/Video Bridging: The IEEE 802.1BA spec needs to be completed to ensure that no conflict between EEE and AVB exists in practice. In addition, this type of assessment needs to be conducted for other consumer electronics data links (e.g., MoCA), as well as the higher layer protocols for AVB (IEEE 1722).
• Consumer electronics inter‐device power control: A “meta‐standard” needs to be created that defines general approaches, principles, and behaviors that lead to improved inter‐device power control. This meta‐standard then needs to be implemented in standards for specific interfaces, protocols, and products (e.g., HDMI, UPnP, and other emerging IP‐based protocols). In addition, these standards should explicitly adopt the three‐state power model, where “sleep” implies continuous network presence, and “off” does not. Finally, energy policies should adopt this system as a prerequisite for considering an audio/visual product as efficient, initially for voluntary specifications and later for mandatory requirements.
• Set‐top Boxes: The communications protocols used over STB network links need to be designed to encourage the networked products to achieve the lowest possible level of power use for the functions that they are performing at that instant. In particular, network presence proxying stands to significantly reduce the energy use of STBs, and we encourage active research and development in this critical area.
10.3 Benefits to California The short-term, direct benefits to California include the following:
• For Energy Efficient Ethernet, energy savings for California should eventually reach tens of millions of dollars per year at little or no cost to consumers.
• Hundreds of millions of dollars per year of electricity in California are used by computers that are fully on but idle. Proxying has the potential to reduce this significantly at very low cost. An increasing number of devices, besides computers, have

79
sophisticated network connectivity and so could benefit from the technology.
• California now has an accurate and detailed estimate of network equipment energy use, a method to track changes in the total over time, and policy prescriptions for how to address this growing area of energy use.
• The Ethernet technologies for Ethernet Audio‐Video Bridging and Energy Efficient Ethernet can be compatibly implemented, making Ethernet an efficient and viable alternative technology for networking audio and video devices.
• Groundwork has been laid for future standards development to make audio‐video devices easier to use and to make power management more transparent and automatic, enabling large savings at virtually no cost.
• For set‐top boxes, California policy‐makers now have two identified technologies—Energy Efficient Ethernet and network presence proxying—that can reduce STB energy use in the state by 50 percent or more.

80
GLOSSARY
Specific terms and acronyms used throughout this report are defined as follows:
Acronym Definition
A/V, or AV Audio‐visual
ALR Adaptive Link Rate
AP Access point
ARP Address resolution protocol
ASIC Application‐specific integrated circuit
ATIS Alliance for Telecommunications Industry Solutions
AVB Audio‐video bridging
CE Consumer electronics
CEC Consumer Electronic Control
CECB Coupon Eligible Converter Boxes
CFI Call For Interest
DFE Digital front end
DHCP Dynamic host configuration protocol
DMTF Distributed management task force
DOE U. S. Department of Energy
DSL Digital Subscriber Line
Ecma European Association for Standardizing Information and Communication Systems
EEE Energy Efficient Ethernet
EEDN Energy efficient digital networks
Energy Commission California Energy Commission
EU European Union
Gb Gigabit
Gb/s Gigabits per second

81
Acronym Definition
GFCI Ground fault circuit interrupter
GigE Gigabit Ethernet
GWh Gigawatt‐hour
HDMI High definition multimedia interface
HDTV High definition television
IAD Internet access device
IEEE Institute of Electrical and Electronics Engineers
ICMP Internet control message protocol
IEC International Electrotechnical Commission
IGMP Internet group management protocol
IP Internet protocol
ISP Internet service provider
IT Information Technology
LAN Local area network
LBNL Lawrence Berkeley National Laboratory
LLDP Link layer discovery protocol
LPI Low power idle
MAC Media Access Control
Mb Megabyte
MMRP Multiple MAC‐address registration protocol
MoCA® Multimedia over Coax Alliance
MRP Multiple registration protocol
MSRP Multiple stream reservation protocol
ND Neighbor discovery
NIC Network interface controller
PAC Project Advisory Committee

82
Acronym Definition
PAR Project Authorization Request
PC Personal computer
PCI Peripheral component interconnect
PHY Port physical layer
PIER Public Interest Energy Research
PoE Power over Ethernet
RF Radio frequency
RPS Rapid PHY selection
SNE Small network equipment
SNMP Simple network management protocol
STB Set‐Top Box
TEER Telecommunications equipment efficiency ratio
TV Television
TWh Terawatt‐hours
UEC Unit energy consumption
UPnP Universal plug and play
EPA United States Environmental Protection Agency
USF University of South Florida
VPN Virtual private network
W Watt
WAN Wide area network
Wi‐Fi Wireless Fidelity
WLAN Wireless LAN
WoL Wake on LAN

83
REFERENCES
1E. 2009. PC Energy Report 2009. http://www.1e.com/energycampaign/downloads/PC_EnergyReport2009‐US.pdf (accessed January 11, 2013).
Agarwal, Y., S. Hodges, R. Chandra, J. Scott, V. Bahl, and R. Gupta. 2009. Somniloquy: Augmenting Network Interfaces to Reduce PC Energy Usage. Presented at UseNIX Networked Systems Design and Implementation Conference, Boston, MA, April 23, 2009. www.usenix.org/event/nsdi09/tech/full_papers/agarwal/agarwal_html/ (accessed January 11, 2013).
Allman, M., K. Christensen, B. Nordman, and V. Paxson. 2007. Enabling an Energy‐Efficient Future Internet Through Selectively Connected End Systems. Presented at Sixth Workshop on Hot Topics in Networks (HotNets‐VI), Atlanta, GA, November 14‐15, 2007.
Anand, H., C. Reardon, R. Subramaniyan, and A. George. 2006. Ethernet Adaptive Link Rate (ALR): Analysis of a MAC Handshake Protocol. In Proceedings of the IEEE Conference on Local Computer Networks. 533–534.
Barrass, H., M. Bennett, K. Christensen, H. Frazier, and B. Nordman. 2006. Energy Efficient Ethernet Call For Interest. Presented at IEEE 802.3 Meeting, Dallas, TX, November 14‐15, 2006.
Baskette, Carmen, My K. Ton, Brad Ouderkirk, Lucas Mason, Rick Counihan, Chris Calwell, Suzanne Foster Porter, and Kate Conway. 2006. Hardwired Standby Loads: Class 2 Transformers and Ground Fault Circuit Interrupters, in Codes and Standards Enhancement (CASE) Report. Pacific Gas and Electric Company, San Francisco, CA. Draft.
Beirmayer, P., R. Brown, and M. Griffith. 2008. Hard‐Wired and Builder‐Installed Miscellaneous Equipment in New Homes. Unpublished paper, Lawrence Berkeley National Laboratory, Berkeley, CA.
Bennett, M., K. Christensen, and B. Nordman. 2006. Improving the Energy Efficiency of Ethernet: Adaptive Link Rate Proposal. White Paper, Version 1.0, Ethernet Alliance.
Blanquicet, F., and K. Christensen. 2007. An Initial Performance Evaluation of Rapid PHY Selection (RPS) for Energy Efficient Ethernet. In Proceedings of the IEEE Conference on Local Computer Networks, 223–225.
Brown, Rich, William Rittelmann, Danny Parker, and Gregory Homan. 2006. Appliances, Lighting, Electronics, and Miscellaneous Equipment Electricity Use in New Homes. In En Route to Zero Energy Buildings ‐ 2006 ACEEE Summer Study on Energy Efficiency in Buildings ‐ Proceedings, 9‐37‐48. Asilomar, CA: American Council for an Energy Efficient Economy, http://www.eceee.org/conference_proceedings/ACEEE_buildings/2006/Panel_9/p9_4/paper (accessed January 11, 2013).
84
Christensen, K., P. Gunaratne, B. Nordman, and A. George. 2004. The Next Frontier for Communications Networks: Power Management. Computer Communications 27 (18) (December): 1758–1770.
Christensen, K., and F. Gulledge. 1998. Enabling Power Management for Network‐Attached Computers. International Journal of Network Management 8 (2) (March‐‐April): 120–130.
Christensen, K., B. Nordman, and R. Brown. 2004. Power Management in Networked Devices. IEEE Computer 37 (8) (August): 91–93.
Christensen, K., P. Reviriego, B. Nordman, M. Bennett, M. Mostowfi, and J.A. Maestro. 2010. IEEE 802.3az: The Road to Energy Efficient Ethernet. IEEE Communications 48 (11) (November): 50‐56.
Cisco Systems, Inc. Cisco Product Efficiency Calculator, http://www.cisco.com/cdc_content_elements/flash/dataCenter/eap/(accessed January 11, 2013).
DOE 2009, U.S. Department of Energy. 2009. 1.1.9 Buildings Share of U.S. Electricity Consumption. In Buildings Energy Data Book. http://buildingsdatabook.eren.doe.gov/TableView.aspx?table=1.1.9 (accessed January 11, 2013).
Ecma International. 2010. ProxZzzy for Sleeping Hosts. Ecma‐393, www.ecma‐international.org/publications/standards/Ecma‐393.htm (accessed January 11, 2013).
Ecos Consulting, Conway & Silver, and Energy Associates LLC. 2006. Stakeholder Meeting for Hardwired Standby Loads CASE Study. Pacific Gas and Electric Company, San Francisco, CA.
Gunaratne, C. and K. Christensen. 2006. Ethernet Adaptive Link Rate: System Design and Performance Evaluation. In Proceedings of the IEEE Conference on Local Computer Networks, 28–35.
Gunaratne, C., K. Christensen, and B. Nordman. 2005. Managing Energy Consumption Costs in Desktop PCs and LAN Switches with Proxying, Split TCP Connections, and Scaling of Link Speed. International Journal of Network Management 15 (5) (September‐‐October): 297–310.
Gunaratne, C., K. Christensen, S. Suen, and B. Nordman. 2008. Reducing the Energy Consumption of Ethernet with an Adaptive Link Rate (ALR). IEEE Transactions on Computers 57 (4) (April): 448–461.
Gunaratne, C., K. Christensen, and S. Suen. 2006. Ethernet Adaptive Link Rate (ALR): Analysis of a Buffer Threshold Policy. In Proceedings of IEEE GLOBECOM, 1‐6.
Hoelzle, U. and B. Weihl, 2006, “High‐efficiency power supplies for home computers and servers,” http://services.google.com/blog_resources/PSU_white_paper.pdf (accessed 2009).

85
IEEE, 2010, IEEE 802.3az Energy Efficient Ethernet Task Force, grouper.ieee.org/groups/802/3/az/ (accessed January 11, 2013).
Infineon Technologies. 2009. Infineon Announces World’s First Gigabit PHY Compliant With New Energy Efficient Ethernet Guidelines; XWAY™ PHY11G Reduces Power Consumption by 90 Per Cent and Enables Industry’s Smallest Footprint for Gigabit Applications. www.infineon.com/cms/en/corporate/press/news/releases/2009/INFWLC200908‐072.html (accessed January 11, 2013).
KEMA‐XENERGY, Itron, and RoperASW. 2004. California Statewide Residential Appliance Saturation Study. California Energy Commission. 300‐00‐004. http://www.energy.ca.gov/reports/400‐04‐009/2004‐08‐17_400‐04‐009VOL2B.PDF (accessed January 11, 2013).
Mouawad, J., and K. Galbraith. 2009. “Plugged‐In Age Feeds a Hunger for Electricity.” The New York Times. September 20.
Nedevschi, S., J. Chandrashekar, B. Nordman, S. Ratnasamy, and N. Taft. 2009. Skilled in the Art of Being Idle: Reducing Energy Waste in Networked Systems. Presented at UseNIX Networked Systems Design and Implementation Conference, Boston, MA, April 23, 2009. http://static.usenix.org/events/nsdi09/tech/full_papers/nedevschi/nedevschi.pdf (accessed January 11, 2013).
Nordman, B. 2009. What the Real World Tells Us about Saving Energy in Electronics. Presented at the Symposium on Energy Efficient Electronic Systems (E3S), CITRIS/UCB, Berkeley CA, June 11, 2009. http://nordman.lbl.gov/docs/e3s_nordman.pdf (accessed January 11, 2013).
Nordman, B. and K. Christensen. 2005. Reducing the Energy Consumption of Network Devices. Tutorial, presented in IEEE 802 LAN/MAN Standards Committee Plenary Session. San Francisco, CA, July 19, 2005.
Nordman, B., and K. Christensen. 2010. “Proxying: The Next Step in Reducing IT Energy Use.” (Green IT column) IEEE Computer 43 (1) (January): 91–93.
Odylzko, A. 2003. “Data networks are lightly utilized, and will stay that way.” Review of Network Economics 2 (3) (September): 210–237.
Roth, Kurt W., and Kurtis McKenney. 2007. Energy Consumption by Consumer Electronics in U.S. Residences. TIAX LLC (D5525) for Consumer Electronics Association (CEA), Cambridge MA.
A‐1
APPENDIX A: Energy Efficient Specifications for Network Equipment Report
July, 2011
Steven Lanzisera, Bruce Nordman 1.0 Introduction
The Energy Efficiency Specifications for Network Equipment Report covers the third subtask of the Energy Efficiency Specifications for Network Equipment task. This report includes a description of test procedures and a recommendation for efficiency metrics for small network equipment and standalone enterprise network switches. Most network equipment consumes relatively constant power across varied data throughput, but the power consumed is a function of the capacity (maximum throughput supported). The recommended metrics take into account that power scales with capacity, but we also provide an incentive to have power consumption follow data throughput more closely. As part of this task, we have worked extensively with Energy Star to develop and promote the Small Network Equipment (SNE) specification process, and we provide a status report on both the SNE and Large Network Equipment specifications. A complete test procedure for SNE is available on the Energy Star website (see references). 2.0 Small Network Equipment
Small network equipment is a product category defined by the upcoming Energy Star Small Network Equipment specification. It consists of devices with nine or fewer wired ports that fall into one of the following product types:
● Wired Router: A network device that determines the optimal path along which network traffic should be forwarded. Routers forward packets from one network to another based on network layer information. Wired Routers with Wi-Fi capability as a primary function are either Access Points or Integrated Access Devices.
● Wired Switch: A network device that filters, forwards, and floods frames based on the destination address of each frame. The switch operates at the data link layer of the OSI model. Wired Switches with Wi-Fi capability as a primary function are either Access Points or Integrated Access Devices.
● Access Point: A device that provides IEEE 802.11 (Wi-Fi or WLAN) connectivity.
● Broadband Modem: A device that transmits and receives digitally-modulated analog signals over a wired network.

A‐2
● Integrated Access Device (IAD): A network device that includes the capability of a Broadband Modem, a Wired Router, and/or Wireless Router. IADs may be referred to as Gateways.
● Wi-Fi Extender: A network device that functions to increase the coverage area of a Wi-Fi network by linking to other Wi-Fi devices using only the wireless link. These devices may alternately be classified as Wi-Fi Repeaters.
● Optical Network Termination Device (ONT): A device that converts signals between copper (wired) or wireless connections and an optical fiber connection. ONTs are available in either desktop or building.
This list of devices specifically excludes end point devices where these are devices that function as either an originator or destination for network traffic passed through Network Equipment. Examples of end point devices include computers, servers, set-top boxes, IP-capable televisions, etc. 2.1 Test Procedure Overview
The SNE test procedure was developed as part of the EEDN project and part of the Energy Star SNE specification development with input from the Energy Star team and industry. Although the testing performed at as part of EEDN showed that test under a small number of conditions are sufficient to characterize energy use, the test procedure we developed tests under a wide set of conditions. We believe that data collected from industry using this test procedure will not only verify our belief that a simple test is sufficient, but it will demonstrate how poorly equipment energy use scales with throughput. We intend to reduce the complexity of the procedure after an initial round of data collection to the simplest procedure that characterizes energy use while also allowing devices with new energy efficient features to stand out.
A key portion of the test procedure is the device configuration, and the procedure stresses that the equipment should be tested as shipped from the manufacturer. It is known that most consumers will never change the settings on the device they receive as long as it works out of the box. Therefore, the best estimate of energy use is to test the device with the manufacturer settings. SNE often has several different connection types: wired Ethernet, coaxial cable, telephone line, WiFi etc. The wired connections have physical connectors called ports, and each type of connection can often be used at different link speeds. The power consumption of the device will vary depending on which types of ports are present, which connections are in use, and the speed of those connections.
The configuration section of the procedure provides a clear set of rules to select which connections and at which speed the available connection types will be used. The only wired connections that are to be active during the testing are a single WAN connection (selected according to procedure guidelines), Ethernet connections (as specified in the procedure), and other connections where the connected device and cable are included with the device under test. Although there are other wired connections present on SNE today, the market penetration is relatively small and consumer use is even smaller. Therefore we instruct that these connections should be left unconnected and unused. We also specify how to select the type of WiFi to be used during testing.

A‐3
SNE often have many functions built into a single box, and it is important to test each of these functions to determine how they impact energy use. The test procedure provides four energy tests: an idle test, a wide area network connection test, a wired local area network connection test, and a wireless local area network test. Different SNE devices are tested based on the features they possess, and the test matrix is shown in Table 1.
Idle WAN LAN Wireless LAN
Modem X X
IAD X X X X
Switch/Router X X
Wireless Product X X
Wired/Wireless Product
X X X
The test procedure is greatly simplified by using this test matrix rather than writing a procedure specific to each device type because repetition is eliminated. This method also ensures it is clear that a wired switch and AP with a switch are tested in the same way where there is functional overlap. We believe that the idle test will be sufficient to represent the energy use of today’s devices. The idle test measures the power consumption after setting up the device to have the minimum reasonable number of connections with no data traffic. Today’s devices spend much of their time nearly idle, and power does not change significantly with increased throughput. We hope future devices will reduce power significantly when being lightly used, and this test alone will not represent typical energy use. We have included additional tests to identify devices that demonstrate this sort of efficient operation. The core operational tests vary the connections in use and the data passed over the network. Based on testing performed as part of EEDN, we do not expect to see significant changes in energy use that depend on the data throughput in the device. The most significant contributor to changes in energy use are the result of the number, type, and speed of the connections in use rather than the amount of data passing over those links. The exception to this experience is in the case of WiFi devices where we found the number of connected clients did not impact energy use. The energy use of an AP hosting a single client was approximately the same as the energy use when hosting 400 clients. Therefore, the energy test vary the number of connections in use for Ethernet (the only LAN technology tested), but test only single clients for WiFi. Industrial stakeholders requested that we evaluate performance factors in SNE because they believe that increased performance should warrant additional energy allowances. The two areas where increased capability may increase power consumption are applications in which: a more capable processor is required or more memory must be included. A more capable processor may be used to handle

A‐4
more data traffic because the processor must handle more packets of data in a given period of time. Although this processor may be underutilized much of the time, it will still consume more energy. In order to support a larger table of client devices, the SNE may include more memory to store the parameters for each of these connections. We included three performance tests to allow manufacturers to demonstrate devices with greater capability. SNE manufacturers are asked to report the maximum throughput supported over Ethernet connections, the maximum number of wireless clients supported, and the maximum number of network address translation (NAT) clients supported. 2.2 Energy Efficiency Metrics
The energy efficiency metric recommended for evaluation of SNE is an estimate of annual unit energy consumption (UEC) under typical conditions with some incentives for savings. A first step is to estimate the UEC of the device under typical conditions with a clear understanding of the assumptions made to achieve this UEC. In order to incentivize savings, we must consider the energy used in several common use cases.
In order to calculate annual energy use, one must consider the power consumed by the device while performing a particular function and the time the device spends performing that function in a typical year. We have found that SNE is expected to operate 24 hours a day, 365 days a year, and it is not expected to be turned off or unplugged by the typical user. We can calculate the UEC by measuring the power consumed under all of the use conditions and multiplying it by the time spent under those conditions.
UEC= All functionsPower consumed performing function ×Time performing function (Whr) Testing under all conditions is not practical, however, and we expect SNE will spend most of its time in a state with small amounts of data traffic, a fixed number of wired connections, and, depending on wireless capability, advertising the wireless network and transferring little data traffic. There will be a modest amount of wireless and wired data traffic with few changes to the wired configuration, and this traffic will be a combination of traffic over the internet and over the local network. We expect this to represent about from 0 to 50% of the time, but we have observed that traffic does not impact energy use significantly. Although we have identified two basic operational situations, we must test the device under different configurations to ensure that we incentivize savings where they are available. At the same time, we want to minimize the number of tests to keep the procedure as simple as possible. The UEC formula used is as follows. UECmetric= 8760All functionsPower ×% of time (Whr) The measurements that contribute to estimating the UEC and their percent contribution are given for each product type in Appendix A. The measured UECmetric will be compared to an allowance level for that product based on the product type and product capabilities. This allowance will be calculated using a base + adders method where all products get some small base allowance and select capabilities add some additional allowance to calculate the total allowance. This structure is widely employed in Energy Star standards, and it applies well to the SNE product category. Although we do not have sufficient data at this time to provide base and adder levels for each product type, we are

A‐5
currently collecting these data as part of the Energy Star process. At this time, we have potential capabilities that will have associated adders. These are roughly broken into three categories: physical layer capabilities (hardware), higher level network capabilities (software), and high performance capabilities. Physical layer capabilities would be the number, types and speed of wired LAN ports, number and type of wireless LAN radios, and number and type of WAN connections. Higher level network functionality includes security features (e.g. firewall or packet inspection), network address translation, and virtual network support. We also include the option for manufacturers to test the performance of their devices, and we have three performance tests: the maximum number of simultaneous wireless clients supported, the maximum number of simultaneous network address translation clients supported, and the maximum measured throughput of the wired LAN connections. 3.0 Enterprise Ethernet Switches
Energy Star will be starting a program on Large Network Equipment (LNE), and this specification is undefined in terms of its product coverage. Current discussions only state that the equipment is larger in terms of the number of ports than that covered by the SNE specification. Based on the scoping study done as part of this EEDN project, enterprise Ethernet switches consume about 60% of the energy of all LNE with 75% of this (45% of the total LNE) going to standalone switches rather than modular switches. The standalone switches are also the fastest growing category, and the efficiency and specifications focus should be on these standalone switches. A major advantage is that the standard Energy Star model applies well to standalone switches, whereas the modular switches will be difficult to cover in a meaningful way. We cover standalone switches as the major portion of this section, and we briefly discuss the issues with specifications for modular equipment as well. 3.1 Test Procedure Overview The Alliance for Telecommunications Industry Solutions (ATIS) is an industry group that meets to develop specifications for network equipment to ensure high level interoperability (between service providers and between different tiers in the telecommunications network) as well as test procedures for measuring the performance and energy use of network products. This group is developing a test procedure for Ethernet switches, and they are also developing energy efficiency metrics. ATIS has potential to be a partner in improving the efficiency of devices because all of the major manufacturers and several service providers participate in the organization’s meetings. ATIS has a well-developed test procedure for enterprise Ethernet switches, and we have attended an ATIS specifications meeting on this topic. We intend to work towards a joint ATIS-Energy Star procedure for enterprise network equipment that will provide the data required to evaluate energy efficiency. The test procedure covers both modular and standalone enterprise Ethernet switches, and the standalone switches are tested in the same way as modular products. Metrics are calculated based on a specific configuration of a modular switch, and every configuration requires a new run of the procedure, measurement

A‐6
of power, and calculation of the metric. Given that modular switches have from 4 to dozens of line card slots and dozens of line cards that could be used to populate each slot, it is not feasible to measure every common much less every possible configuration. Standalone equipment is largely classified as “small” in the ATIS procedure in that small equipment has up to a maximum of 50 downlink ports, and standalone switches rarely have more than 48 downlink ports plus a one to four upstream ports. The most relevant Classes of equipment are Access, High Speed Access and Distribution & Aggregation. Core and Data Center switches are typically modular with some limited exceptions. The ATIS test procedure tests the equipment to determine the maximum supported throughput and the energy used under different fractions of this maximum load. These tests are run with all ports active and assigned (with a cable attached to the port and capable of transferring data). The structure for the data links and data traffic is appropriate, and the measurement methodology is similar to that used in Energy Star procedures. The primary limitation of the test procedure itself is that most equipment is operated with approximately half of the ports in use (our scoping study found 40% of ports in use on the LBNL campus). The test procedure should be modified to test a configuration with a reduce number of ports in use. The procedure does not clearly state how results shall be reported, and this should be improved in a future version of the test procedure. 3.2 Energy Efficiency Metrics Industry is currently developing metrics for network equipment energy use, and these metrics may not promote lower energy use. ATIS is developing a metric called the Telecommunications Equipment Efficiency Ratio (TEER) to characterize equipment efficiency. The metric is roughly maximum throughput divided by average power, and it is scaled to be a unitless quantity between 0 and 1000 where the higher the TEER, the more efficient the device. Consider a case where the maximum throughput required 3 is 1Gb/s. A device that meets this spec may consume 100W and get a TEER value of 100. A device that consumes twice as much power and has three times throughput will get a TEER of 150. Given that we know equipment power consumption does not reduce significantly when operating below maximum throughput, the second device will take twice the energy of the first while delivering the same quantity of data. This is not a more efficient implementation, yet this divided metric hides this reality. The unitless nature of this metric further separates the measurements from the calculation making it impossible for an individual to even estimate energy use based on the TEER. This metric strategy is not recommended for promoting efficiency. The ATIS test procedure does result in the data required to estimate annual energy use, and this is a more suitable metric. With the procedure modified to include a reduce number of ports, the proposed weighting power consumed with no data traffic, moderate data traffic, and maximum data traffic in the ATIS procedure is sufficient to encourage efficiency improvements. At this time we have insufficient data to propose qualification levels for these devices.
3 This example is simplified in that network equipment is always over provisioned to some extent. In addition, there is often some cost increase for higher maximum throughput, but this is not a general rule.

A‐7
1 Status of Energy Star Process
Energy Star is in the process of developing the SNE specification and expects to launch the LNE specification process in late 2011. The SNE process has an entirely new test procedure (largely developed through this EEDN task) that is currently with manufacturers for an initial round of data collection. The Energy Star team is also developing the specification document and plans to release a draft without specification levels by June 2010. This corresponds with the time when the initial data collection from manufacturers will be completed using the draft test procedure. Based on the data collected and manufacturer comments, the test procedure will be finalized and draft specification base and adder levels will be determined. The final specification should be completed sometime in late 2011. The LNE process will borrow heavily from this EEDN project because much of the preliminary work was done here. The scope of the tier 1 specification, the development of a test procedure (based on the ATIS procedure), and the capabilities likely to be given adder allowances have all been at least partially if not extensively studied as part of this work.
2 Conclusions and Next Steps
We have met the goals of this task and made more progress than expected in developing the SNE specification with Energy Star. As part of this work, we made some of the most accurate estimates of the energy use of home and enterprise network equipment energy use, and we have clearly identified the types of equipment most in need of efficiency measures. Using this information, we investigated how to test the energy use of these devices and have made significant steps towards efficiency specifications including developing a test procedure for small network equipment, identifying and evaluating a test procedure for large network equipment, and investigating energy efficiency metrics and specification definitions.
We will continue to work as part of the Energy Star Small Network Equipment specification team using available funding from EPA, and we will participate fully in the development of the Large Network Equipment process as well. We are also in communication with members of the ATIS committee responsible for the key large equipment test procedure, and we are encouraging the committee to revisit the procedure with our concerns in mind. 3 References
Energy Star Small Network Equipment Specification Development Information, http://www.energystar.gov/index.cfm?c=new_specs.small_network_equip, April 2010

A‐8
Energy Star Small Network Equipment Test Procedure – Revision 2, http://www.energystar.gov/ia/partners/prod_development/new_specs/downloads/small_network_equip/SNE_Test_Method_Rev_4_Dataset.pdf ATIS STEP Committee, “Energy Efficiency for Telecommunication Equipment: Methodology for Measurement and Reporting – General Requirements,” ATIS-0600015.2009, www.atis.org, February 2009
ATIS STEP Committee, “Energy Efficiency for Telecommunications Equipment: Methodology for Measurement and Reporting for Router and Ethernet Switch Products,” ATIS-0600015.03.2009, www.atis.org, July 2009
Appendix A: Percent Time Weighting Values for Small Network Equipment UEC Metric Calculations Small Network Equipment is expected to be near idle most of the time, and the data show that there is little to no change in power consumption with changes in utilization. Therefore, UEC calculations focus on the condition with no traffic flowing. The method for determining these percentages is roughly as follows.
1 Assign approximately 50% to the idle condition (no data traffic, no extra ports).
2 Assign remaining to tests with half of ports active but unused. For devices with multiple Ethernet ports, the tests utilizing half of the available ports account for half of the energy use. If the half ports configuration isn’t tested, the minimum ports case shall be used instead. Many values are set to 0 here because this simplifies UEC calculation while being a representative energy calculation. Modem Mode %
Idle 50%
WAN 0.5 Mb/s 50%
WAN Max Rate 0% Wired Switch or Wired Router Mode %
Idle 50%
LAN ½ Ports Idle 25%
LAN ½ Ports 1 Mb/s 25%
LAN ½ Ports Max Rate 0%

A‐9
LAN All Ports 1 Mb/s 0% Wireless Router Mode %
Idle 50%
LAN ½ Ports Idle 25%
LAN ½ Ports 1 Mb/s 10%
LAN ½ Ports Max Rate 0%
LAN All Ports 1 Mb/s 0%
Wireless 0.1 Mb/s 20%
Wireless Max Rate 0%
IAD Mode %
Idle 50%
WAN 0.5 Mb/s 10 %
WAN Max Rate 0%
LAN ½ Ports Idle 20%
LAN ½ Ports 1 Mb/s 10%
LAN ½ Ports Max Rate 0%
LAN All Ports 1 Mb/s 0%
Wireless 0.1 Mb/s 10%
Wireless Max Rate 0% Enterprise AP Mode %
Idle 50%
Wireless 0.1 Mb/s 45%
Wireless 1 Mb/s 0%
Wireless Max Rate 5%

B‐1
APPENDIX B: Power Control Implementation Report Steven Lanzisera, Bruce Nordman, Lawrence Berkeley National Laboratory Introduction This report presents a proposed protocol design for interoperable controls that provide the behaviors outlined in the Power Control Design Report. This implementation uses the HDMI Consumer Electronics Controls (CEC) channel for device power control and would require devices to support a subset of the published CEC commands. Home audio and video equipment is increasing in functionality and power consumption, and a recent study found that these devices spend as much time “on” and in use as they spend “on” and idle4. Industry has focused on improving the user experience, and current devices are networked using HDMI interfaces to provide high speed content streaming and inter-device communication. This network interface includes the capability to provide higher level control through the Consumer Electronics Control (CEC) facility, but CEC is implemented primarily as a vendor specific option without cross-vendor interoperability. HDMI CEC could be used to significantly increase the time devices spend sleeping (instead of remaining in their active state) by enabling devices to expose power state information to connected devices, and the savings potential in the US alone is equivalent to the annual energy output of two or more coal fired power plants (20 to 30TWh). This document outlines the features included in the HDMI 1.3a spec that could be used to implement basic energy saving features. It also introduces new commands that would assist in reducing energy use; these commands would be helpful in future revisions of the standard but are not required for some power control capabilities. Devices should also manage their own power state according to standard conventions; we are separately describing such behavior and that will complement the CEC capabilities. This document proposes a set of HDMI CEC commands that, taken together, implement both user initiated and automatic power control of HDMI networked devices. This set of commands enables a subset of the entertainment system to cooperatively power up and down without the user commanding each device into the active or sleeping state. The user will have a better experience while reducing overall energy use by decreasing the time devices spend in their full power state. Definitions
● Content: Audio or video streams that are sent over HDMI or legacy interfaces. ● Primary Function: A function that requires a device to be in the fully powered on state. A non-
exclusive list of these functions is shown below. ○ Receiving and/or displaying content. ○ Streaming content to a sink that is not a paused image, menu of any kind, or screen saver
type display. ○ Recording content ○ Responding to user action (programming, configuring, or responding to input) ○
● Secondary Conditions: A condition that does not require the device to be fully powered on, so that it can be in a low power mode. A non-exclusive list of these conditions is shown below.
4 K. Roth, K. McKenney, TIAX report D5525 commissioned by the CEA, 2007

B‐2
○ Display of continuous device function (clock timer, status display or indicator lamp). ○ Streaming content that is a paused image, menu of any kind, or screen saver type display. ○ Displaying a screen saver type display. ○ Not processing, receiving outputting or displaying audio or video content. ○ Playback paused or stopped with media in drive. ○ No media in drive.
● Command: A HDMI packet that is used to initiate communication on the HDMI CEC bus. ● Feature: A behavior carried out by a set of networked devices that is executed through the
exchange of HDMI commands and the associated actions resulting from those commands. ● Sleep: A power state between Off and On in which the device retains full network connectivity.
While HDMI uses the term “Standby”, this is taken to be a command to go to a low power mode. There are many advantages to using the term Sleep that are described elsewhere (IEEE 1621).
Power Control Philosophy The intention of this grouping of CEC commands is to make HDMI compliant devices follow a consistent philosophy on networked device power control. If this philosophy were applied broadly to electronic devices, significant energy savings would be possible through increased time in the sleep state and decreased time in the active state. The intent is to enable part or all of the functionality on non-HDMI links as well. To that end, this document will be generalized to apply to other interfaces, and a non-standard specific document will be available publicly. Devices should: • Have a 3-state power model • Maintain network connectivity while asleep • Advertise power state changes • Make decisions regarding their own state • Be capable of observing link state (signal present?) • Power down after period without performing primary function • Make links appear inactive when no active content is supplied Note that the expectation is that most devices will usually toggle between off and sleep in normal operation. Off (no network connectivity) is important but expected to be used only occasionally. Features to be Implemented The HDMI CEC commands (potentially) needed to implement these features are shown after the feature in the format <command>. These features must be implemented with legacy HDMI CEC in mind to ensure that no unintended behaviors occur. Some features rely on other HDMI characteristics in addition to the CEC channel. User Initiated Power Down The user commands the primary sink device into a low power state, and the device broadcasts this message to all connected devices. All devices go to sleep except those that are performing a primary function that should continue while the display is asleep. When a user commands a source or other HDMI non-sink device into a low power mode, the device should transition to the low power state but not broadcast a standby command. Legacy devices may go into a low power mode not intended by the user.

B‐3
Behavior is complicated in the case of an A/V receiver. If it is receiving an audio stream, it should broad cast a standby command. If it is receiving a video stream (with or without audio) and routing some or all of it to another sink, it should not broadcast a standby command. If it is not receiving content, it should not broadcast a standby command. This feature when coupled with the following two “Automatic Power Down” features result in reasonable power control capability. <Standby> Automatic Power Down of an Inactive Sink A sink device loses its active input stream and detects this through the TMDS link. The device should not switch to a different input or request an active source because the user will request a source if the user is present and using content. After a delay period (e.g. 5 min) without a user selected source, the device should broadcast a standby command and power down. This features works with the “Automatic Power Down of Inactive Source” feature to provide full automatic power down capability. A/V receivers and displays should be able to respond to active source command to ensure that they can switch sources if the user is requesting this behavior through a source device. <Standby>, <Active Source> Automatic Power Down of Inactive Source A non-display device determines it is not performing a primary function. It goes to sleep after a delay period (e.g. 20 min). No message is broadcast. This features works with the “Automatic Power Down of Inactive Sink” feature to provide full automatic power down capability. A proposed command notifying the network that a device is going to sleep would allow other devices to go to sleep faster, but this command is not required for operation. <Transitioning to Sleep> User Initiated Power On The user commands a device into the active state, and the device sends a message to the last active source/sink telling it to provide/display content. LBL expects that this functionality will be implemented by others and is not planning to develop this functionality. Power Down After Interval with No User Input This is a function that would be useful in reducing energy use, but there are no CEC commands to support it. If no user input to any device has been received for 3 hours, it is unlikely a user is actively observing the provided content. If a device hasn’t received input in 3 hours, it should broadcast a message. A device that has received input would respond with the time since last input if it is less than 3 hours. If no device responds, the TV would display a warning of the system’s intent to power down. No user input would result in the system powering down. If user input is received by any device in the interval with the display warning, the device will report user activity. All devices active in the network need to support the two proposed commands for this functionality to be used. Incorporating the commands into new products is required to ensure future use. The following two commands are proposed to implement this function. <Request User Activity >, <Report User Activity>

B‐4
These commands would also be required. <Standby>, <Get CEC Version>, <Report CEC Version> Comprehensive List of Commands for Interoperable Power Control The following commands exist as optional in HDMI 1.3a.
Command Description
<Active Source> Used to declare the intent to provide content
<Set OSD String> Used to display text on screen
<Standby > Used to notify devices of the intent to power down or as a notice to a device that it is believed the device should power down.
<Get CEC Version> Used at network initialization by coordinator to query devices for CEC version. Assists in determining which bundle of commands can be relied upon for power control.
<Report CEC Version> Used to reply to query and notify network of supported CEC version. Devices should maintain state based on this reply to ensure that only supported functionality is performed.
The following new/proposed commands would be helpful in expanded power control capabilities.
Command Description
<Request User Activity> Broadcast to determine if user input has occurred in the last 180 minutes
<Report User Activity> Report back only if user has provided input. Report time since last input
<Transitioning to Sleep> Broadcast when a device is going to sleep but does not want to command legacy HDMI devices to change state.
Summary Using relatively few commands, it is possible to exhibit behaviors that will result in both increased user satisfaction and reduced energy use. In order for these benefits to be realized, however, it is critical for there to be universally accepted protocols, commands and behaviors. This report proposes a set of commands using the most common physical layer protocol on the market, and it would provide the set of behaviors needed to enable the available savings.