energy dynamics - eyfile/energy-dynamics-(updated-2).pdf · the recent discoveries of natural gas...
TRANSCRIPT
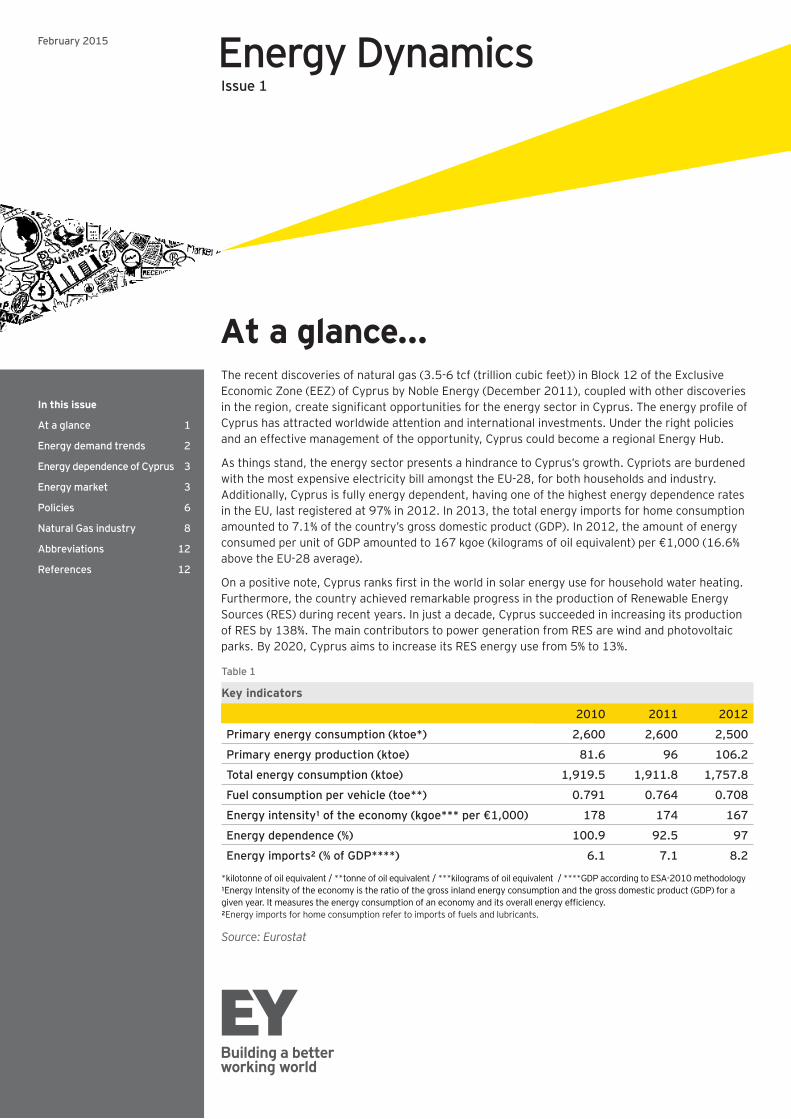
The recent discoveries of natural gas (3.5-6 tcf (trillion cubic feet)) in Block 12 of the Exclusive Economic Zone (EEZ) of Cyprus by Noble Energy (December 2011), coupled with other discoveries in the region, create significant opportunities for the energy sector in Cyprus. The energy profile of Cyprus has attracted worldwide attention and international investments. Under the right policies and an effective management of the opportunity, Cyprus could become a regional Energy Hub.
As things stand, the energy sector presents a hindrance to Cyprus’s growth. Cypriots are burdened with the most expensive electricity bill amongst the EU-28, for both households and industry. Additionally, Cyprus is fully energy dependent, having one of the highest energy dependence rates in the EU, last registered at 97% in 2012. In 2013, the total energy imports for home consumption amounted to 7.1% of the country’s gross domestic product (GDP). In 2012, the amount of energy consumed per unit of GDP amounted to 167 kgoe (kilograms of oil equivalent) per €1,000 (16.6% above the EU-28 average).
On a positive note, Cyprus ranks first in the world in solar energy use for household water heating. Furthermore, the country achieved remarkable progress in the production of Renewable Energy Sources (RES) during recent years. In just a decade, Cyprus succeeded in increasing its production of RES by 138%. The main contributors to power generation from RES are wind and photovoltaic parks. By 2020, Cyprus aims to increase its RES energy use from 5% to 13%.
At a glance...
2010 2011 2012
Primary energy consumption (ktoe*) 2,600 2,600 2,500
Primary energy production (ktoe) 81.6 96 106.2
Total energy consumption (ktoe) 1,919.5 1,911.8 1,757.8
Fuel consumption per vehicle (toe**) 0.791 0.764 0.708
Energy intensity1 of the economy (kgoe*** per €1,000) 178 174 167
Energy dependence (%) 100.9 92.5 97
Energy imports2 (% of GDP****) 6.1 7.1 8.2
Table 1
Key indicators
*kilotonne of oil equivalent / **tonne of oil equivalent / ***kilograms of oil equivalent / ****GDP according to ESA-2010 methodology1Energy Intensity of the economy is the ratio of the gross inland energy consumption and the gross domestic product (GDP) for a given year. It measures the energy consumption of an economy and its overall energy efficiency.2Energy imports for home consumption refer to imports of fuels and lubricants.
Source: Eurostat
February 2015 Energy Dynamics Issue 1
In this issue
At a glance 1
Energy demand trends 2
Energy dependence of Cyprus 3
Energy market 3
Policies 6
Natural Gas industry 8
Abbreviations 12
References 12
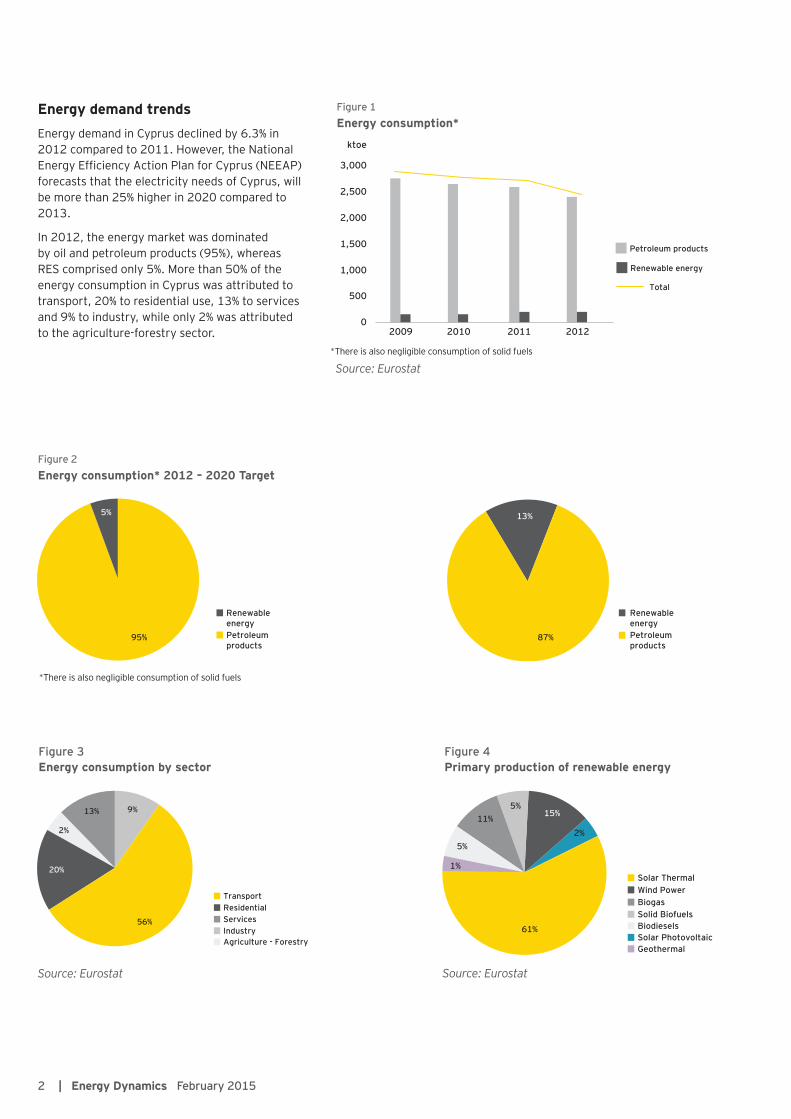
Energy demand trendsEnergy demand in Cyprus declined by 6.3% in 2012 compared to 2011. However, the National Energy Efficiency Action Plan for Cyprus (NEEAP) forecasts that the electricity needs of Cyprus, will be more than 25% higher in 2020 compared to 2013.
In 2012, the energy market was dominated by oil and petroleum products (95%), whereas RES comprised only 5%. More than 50% of the energy consumption in Cyprus was attributed to transport, 20% to residential use, 13% to services and 9% to industry, while only 2% was attributed to the agriculture-forestry sector.
*There is also negligible consumption of solid fuels
*There is also negligible consumption of solid fuels
Figure 1Energy consumption*
Figure 2Energy consumption* 2012 – 2020 Target
Figure 3Energy consumption by sector
Figure 4Primary production of renewable energy
Source: Eurostat
Source: Eurostat Source: Eurostat
Renewable energy
Petroleum products
Total
0
500
1,000
1,500
2,000
2,500
3,000
ktoe
2009 2010 2011 2012
Petroleumproducts
Renewable energy
Petroleumproducts
Renewable energy
95% 87%
13%5%
56%
9%13%
20%
2%
TransportResidentialServicesIndustryAgriculture - Forestry
Solar ThermalWind PowerBiogasSolid BiofuelsBiodieselsSolar PhotovoltaicGeothermal
61%
15%5%
11%
5%
1%
2%
2 | Energy Dynamics February 2015
Energy dependence of Cyprus
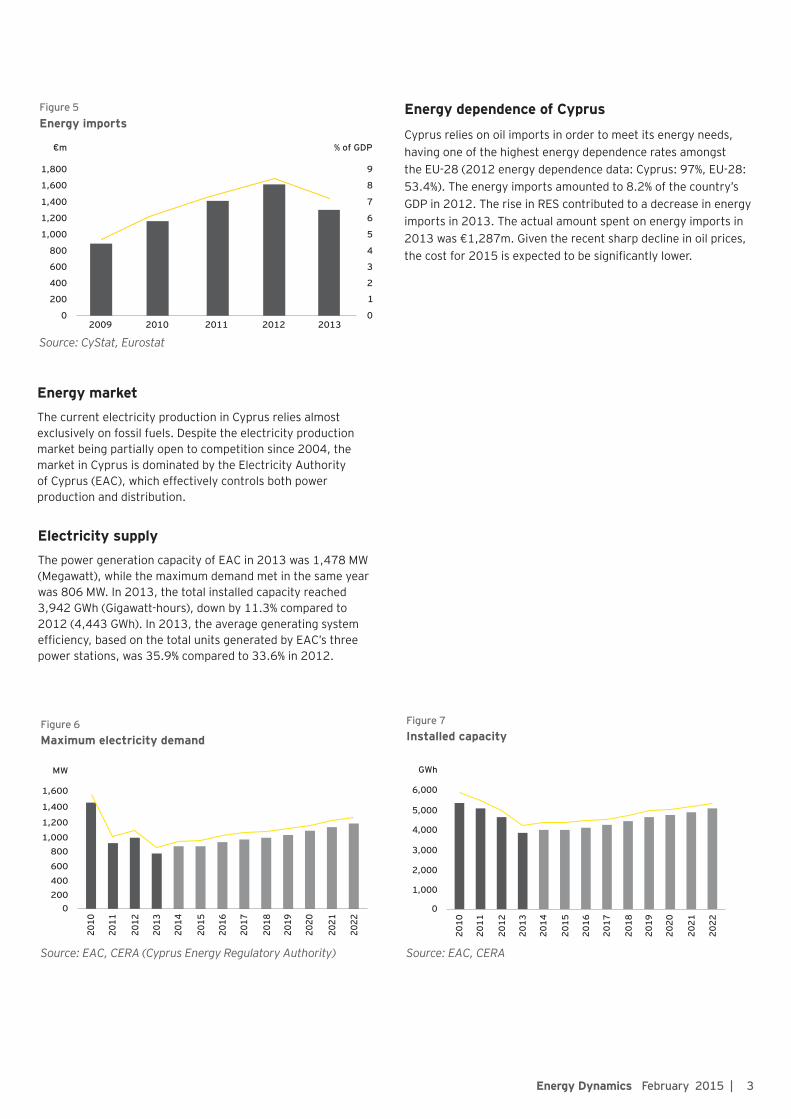
Cyprus relies on oil imports in order to meet its energy needs, having one of the highest energy dependence rates amongst the EU-28 (2012 energy dependence data: Cyprus: 97%, EU-28: 53.4%). The energy imports amounted to 8.2% of the country’s GDP in 2012. The rise in RES contributed to a decrease in energy imports in 2013. The actual amount spent on energy imports in 2013 was €1,287m. Given the recent sharp decline in oil prices, the cost for 2015 is expected to be significantly lower.
Energy marketThe current electricity production in Cyprus relies almost exclusively on fossil fuels. Despite the electricity production market being partially open to competition since 2004, the market in Cyprus is dominated by the Electricity Authority of Cyprus (EAC), which effectively controls both power production and distribution.
Electricity supplyThe power generation capacity of EAC in 2013 was 1,478 MW (Megawatt), while the maximum demand met in the same year was 806 MW. In 2013, the total installed capacity reached 3,942 GWh (Gigawatt-hours), down by 11.3% compared to 2012 (4,443 GWh). In 2013, the average generating system efficiency, based on the total units generated by EAC’s three power stations, was 35.9% compared to 33.6% in 2012.
Figure 6Maximum electricity demand
Source: EAC, CERA (Cyprus Energy Regulatory Authority)
0200400
600
8001,000
1,200
1,400
1,600
MW
2010
2011
2012
2013
2014
2015
2016
2017
2018
2019
2020
2021
2022
Figure 7Installed capacity
Source: EAC, CERA
0
1,000
2,000
3,000
4,000
5,000
6,000
GWh
2010
2011
2012
2013
2014
2015
2016
2017
2018
2019
2020
2021
2022
Figure 5Energy imports
Source: CyStat, Eurostat
0
200
400
600
800
1,000
1,200
1,400
1,600
% of GDP
0
1
2
3
4
5
6
7
8
9
2009 2010 2011 2012 2013
1,800
€m
3Energy Dynamics February 2015 |
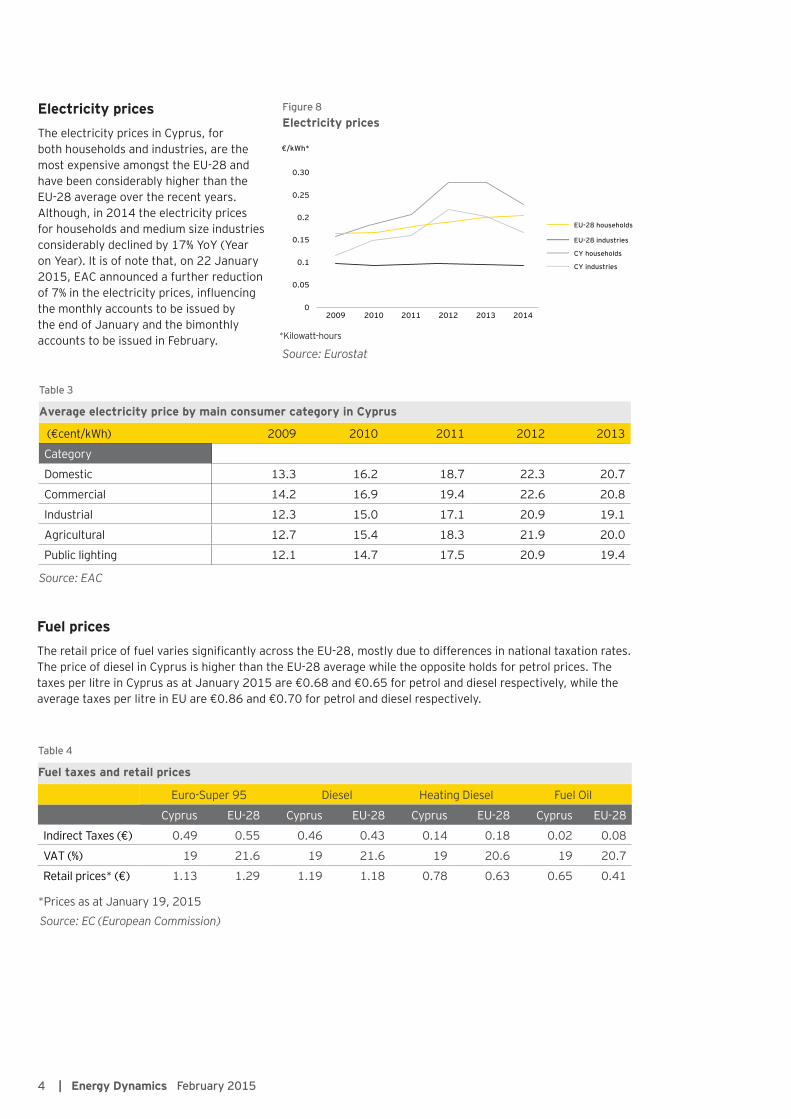
Electricity pricesThe electricity prices in Cyprus, for both households and industries, are the most expensive amongst the EU-28 and have been considerably higher than the EU-28 average over the recent years. Although, in 2014 the electricity prices for households and medium size industries considerably declined by 17% YoY (Year on Year). It is of note that, on 22 January 2015, EAC announced a further reduction of 7% in the electricity prices, influencing the monthly accounts to be issued by the end of January and the bimonthly accounts to be issued in February.
Fuel pricesThe retail price of fuel varies significantly across the EU-28, mostly due to differences in national taxation rates. The price of diesel in Cyprus is higher than the EU-28 average while the opposite holds for petrol prices. The taxes per litre in Cyprus as at January 2015 are €0.68 and €0.65 for petrol and diesel respectively, while the average taxes per litre in EU are €0.86 and €0.70 for petrol and diesel respectively.
Euro-Super 95 Diesel Heating Diesel Fuel Oil
Cyprus EU-28 Cyprus EU-28 Cyprus EU-28 Cyprus EU-28
Indirect Taxes (€) 0.49 0.55 0.46 0.43 0.14 0.18 0.02 0.08
VAT (%) 19 21.6 19 21.6 19 20.6 19 20.7
Retail prices* (€) 1.13 1.29 1.19 1.18 0.78 0.63 0.65 0.41
(€cent/kWh) 2009 2010 2011 2012 2013
Category
Domestic 13.3 16.2 18.7 22.3 20.7
Commercial 14.2 16.9 19.4 22.6 20.8
Industrial 12.3 15.0 17.1 20.9 19.1
Agricultural 12.7 15.4 18.3 21.9 20.0
Public lighting 12.1 14.7 17.5 20.9 19.4
Figure 8Electricity prices
Table 3
Average electricity price by main consumer category in Cyprus
Table 4
Fuel taxes and retail prices
0
0.05
0.1
0.15
0.2
0.25
0.30
2009 2010 2011 2012 2013 2014
EU-28 households
EU-28 industries
CY households
CY industries
€/kWh*
Source: Eurostat
Source: EAC
Source: EC (European Commission) *Prices as at January 19, 2015
*Kilowatt-hours
4 | Energy Dynamics February 2015

Total taxation share in the end consumer price for Euro-Super 95 and Diesel oil
Source: EC
6748 1,14
1,40
6659 1,29
1,28
6655 1,29
1,37
5850 1,05
1,05
5749 1,06
1,10
5954 1,06
1,00
5652 1,04
1,046657 1,14
1,30
5749 0,98
1,08
6554 1,16
1,29
6659 1,13
1,28
6654 1,14
1,31
5851 1,08
1,13
7058 1,20
1,48
6454 1,23
1,38
5851 1,14
1,11
6051 1,20
1,31
5753 1,11
1,06
6056 1,16
1,11
5148 1,04
1,06
5955 1,19
1,14
6254 1,09
1,14
6763 1,39
1,47
6661 1,20
1,27
6054 1,11
1,13
5147 1,35
1,42
7067 1,49
1,40
6560 1.22
1,30
Diesel oil
Euro-Super 95
Total taxation share in the end consumer price for Euro-Super 95 and Diesel oil (%)
Consumer prices for Euro-Super 95 per litre (€)
Consumer prices for Automotive Gas Oil (Diesel oil) per litre (€)
Prices as at 12.01.2015
EU Weighted Average = 66% (Euro-Super 95), 58% (Diesel Oil)
5Energy Dynamics February 2015 |
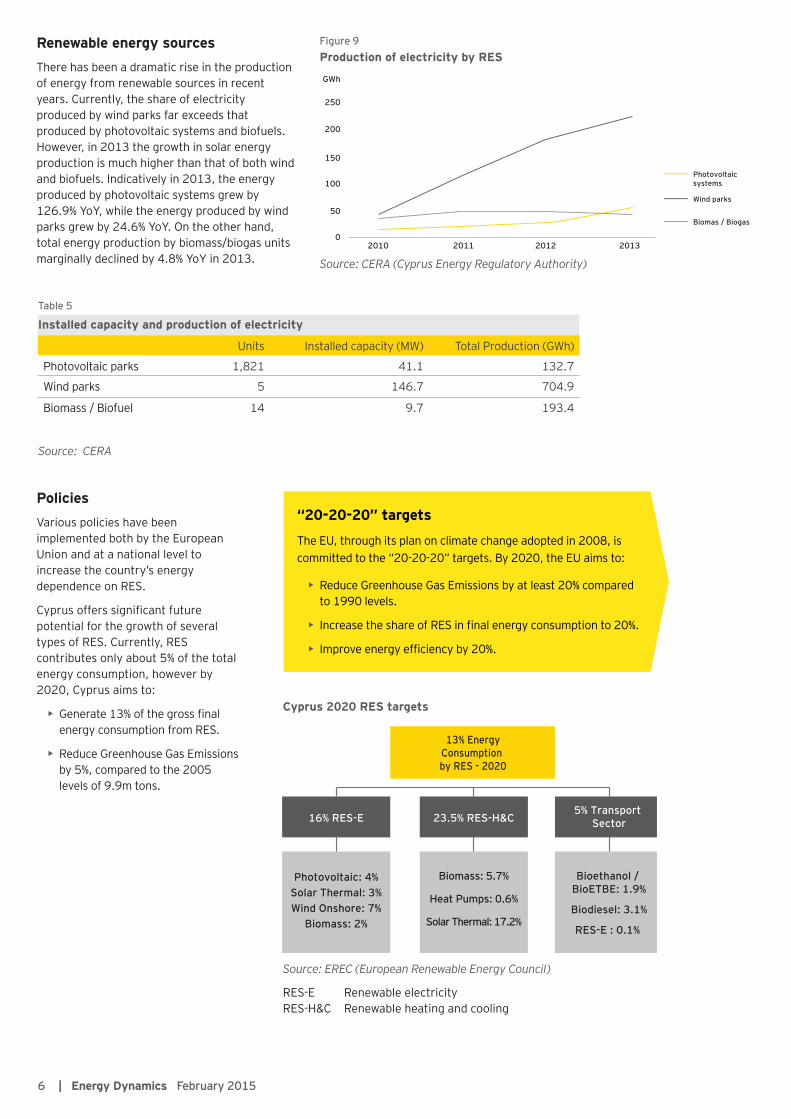
Renewable energy sourcesThere has been a dramatic rise in the production of energy from renewable sources in recent years. Currently, the share of electricity produced by wind parks far exceeds that produced by photovoltaic systems and biofuels. However, in 2013 the growth in solar energy production is much higher than that of both wind and biofuels. Indicatively in 2013, the energy produced by photovoltaic systems grew by 126.9% YoY, while the energy produced by wind parks grew by 24.6% YoY. On the other hand, total energy production by biomass/biogas units marginally declined by 4.8% YoY in 2013.
PoliciesVarious policies have been implemented both by the European Union and at a national level to increase the country’s energy dependence on RES.
Cyprus offers significant future potential for the growth of several types of RES. Currently, RES contributes only about 5% of the total energy consumption, however by 2020, Cyprus aims to:
• Generate 13% of the gross final energy consumption from RES.
• Reduce Greenhouse Gas Emissions by 5%, compared to the 2005 levels of 9.9m tons.
“20-20-20” targets
The EU, through its plan on climate change adopted in 2008, is committed to the “20-20-20” targets. By 2020, the EU aims to:
• Reduce Greenhouse Gas Emissions by at least 20% compared to 1990 levels.
• Increase the share of RES in final energy consumption to 20%.
• Improve energy efficiency by 20%.
Units Installed capacity (MW) Total Production (GWh)
Photovoltaic parks 1,821 41.1 132.7
Wind parks 5 146.7 704.9
Biomass / Biofuel 14 9.7 193.4
Figure 9Production of electricity by RES
Cyprus 2020 RES targets
0
50
100
150
200
250
GWh
2010 2011 2012 2013
Photovoltaicsystems
Wind parks
Biomas / Biogas
13% EnergyConsumption by RES - 2020
16% RES-E 23.5% RES-H&C
Biomass: 5.7%
Heat Pumps: 0.6%
Solar Thermal: 17.2%
Bioethanol / BioETBE: 1.9%
Biodiesel: 3.1%
RES-E : 0.1%
5% Transport Sector
Photovoltaic: 4%Solar Thermal: 3%Wind Onshore: 7%
Biomass: 2%
Source: CERA (Cyprus Energy Regulatory Authority)
Source: EREC (European Renewable Energy Council)
RES-E Renewable electricityRES-H&C Renewable heating and cooling
Table 5
Installed capacity and production of electricity
Source: CERA
6 | Energy Dynamics February 2015

National renewable energy policies
Net meteringIn June 2014, CERA began accepting applications for the installation of low-capacity domestic photovoltaic systems (net metering), and of electricity self-production for businesses. Licenses will be granted for the installation of 15 MW net metering in 4,500 homes and 450 licenses will be given to low-income and other vulnerable groups of which 50% will be state funded (€1m). The 450 low-income families will be compensated with €900 per kW (kilowatt) to install a net metering system with capacity up to 3 kW. The subsidy covers half of the cost of each installation.
Feed-in-Tariffs3In 2004, the Government launched public support schemes in order to promote RES, based on feed–in–tariffs. The feed-in-tariff schemes were in force until 2013, with the RES producers receiving the fuel avoidance cost from EAC, as approved by CERA, and the rest of the feed-in-tariff premium from the Special Fund set up for this purpose. From 2014 onwards, the net-metering schemes and the electricity-self production schemes are applied.
National Energy Efficiency Action Plan (NEEAP)
Savings through the introduction of natural gas in the electricity productionAnother policy targeted by the government is the reduction of Cyprus’ oil dependency, by shifting the focus to cheaper natural gas. Under the 3rd NEEAP, Cyprus’ savings in primary electricity due to the introduction of natural gas will reach 192 ktoe by 2020. The total savings in primary electricity are expected to reach 283 ktoe by 2020.
Tax reductions - AllowancesThe Government provides a 10% tax allowance for annual wear and tear for wind power generators and photovoltaic systems.
Support schemesTwo Cypriot projects are amongst the 19 that will be funded by the European Commission, as part of the initiative for climate change:
• The EOS Green Energy Project funded with €60m for concentrated solar power.
• The Green+ Project, funded with €11.1m focusing on smart grids.
The 19 projects are estimated to increase the renewable energy production in Europe by almost 9 TWh (Terawatt-hours) annually, equivalent to the combined annual electricity consumption of Cyprus and Malta.
Technology Feed-in-tarifs (€/kwH)
Wind 0.166
Offshore Wind 0.140
Biogas 0.110
Solar PV 0.360
Figure 10Energy savings with the introduction of natural gas
Savings in final electricityconsumption
Savings in primary electricityproduction because of savingsin final electricity
Savings in primary electricitydue to introduction of naturalgas
Total savings in primaryelectricity
0
50
100
150
200
250
300
ktoe
2014 2015 2016 2017 2018 2019 2020
Source: MECIT (Ministry of Energy, Commerce, Industry and Tourism)
Source: Renewable Energy Policy Network for the 21st century
Table 6
Cyprus feed-in-tariffs (2013)
3 Grid Tied Feed in Tariff (FIT) systems involve connecting your system to the power lines and selling electricity to the power company.
7Energy Dynamics February 2015 |

Measures for energy savings 2014-2020 (Expected Cumulative Energy Savings for the year 2020)
Table 7
Total average purchase price for energy produced by RES (€)
Proposals for use of resources from the European
Structural and Investment Funds (ERDF, ECB, EAFRD,
EEF) = 191,620 toe
Government (Net metering, Feed-in-Tariffs) =117,713 toe
Grant Schemes from EEE-F = 9827.5 toe319,160 toe
Source: EC
Source: EAC
(€cent/kWh) 132/66KV* 11KV Low Volatility
2011 11.9 12.1 12.4
2012 15.2 15.5 15.8
2013 12.8 13.0 13.2
2014 11.2 11.4 11.6
Beneficiaries of the energy saving policies
The industries that stand to benefit most from the policies to reduce the energy cost and oil dependence are the hotel industry and the pharmaceuticals industry. Their energy costs are a large part of their variable costs, therefore the lower costs of production will result in a higher output at lower price levels.
Natural Gas industry development
The oil and gas sector in Cyprus is under development (currently there is no natural gas on the island). After the discovery of significant hydrocarbon reserves in the country’s EEZ, Cyprus’ energy profile is set to change.
In May 2012, the Cyprus National Hydrocarbons Company (CNHC) was established as a private company, according to the provisions of Article 16 of the Hydrocarbons (Prospection, Exploration and Exploitation) Law of 2007.
ERDF European Regional Development FundECB European Central BankEAFRD European Agricultural Fund for Rural DevelopmentEEF European Fisheries FundEEE-F European Energy Efficiency Fund
Following a revision of the government targets performed in 2014, the cumulative primary energy savings in 2020 will amount to 375,000 toe. The energy savings achieved through the measures implemented in the period 2010-2013 amount to 23,272 toe, or 6.2% of the target.
*Kilovolts
8 | Energy Dynamics February 2015
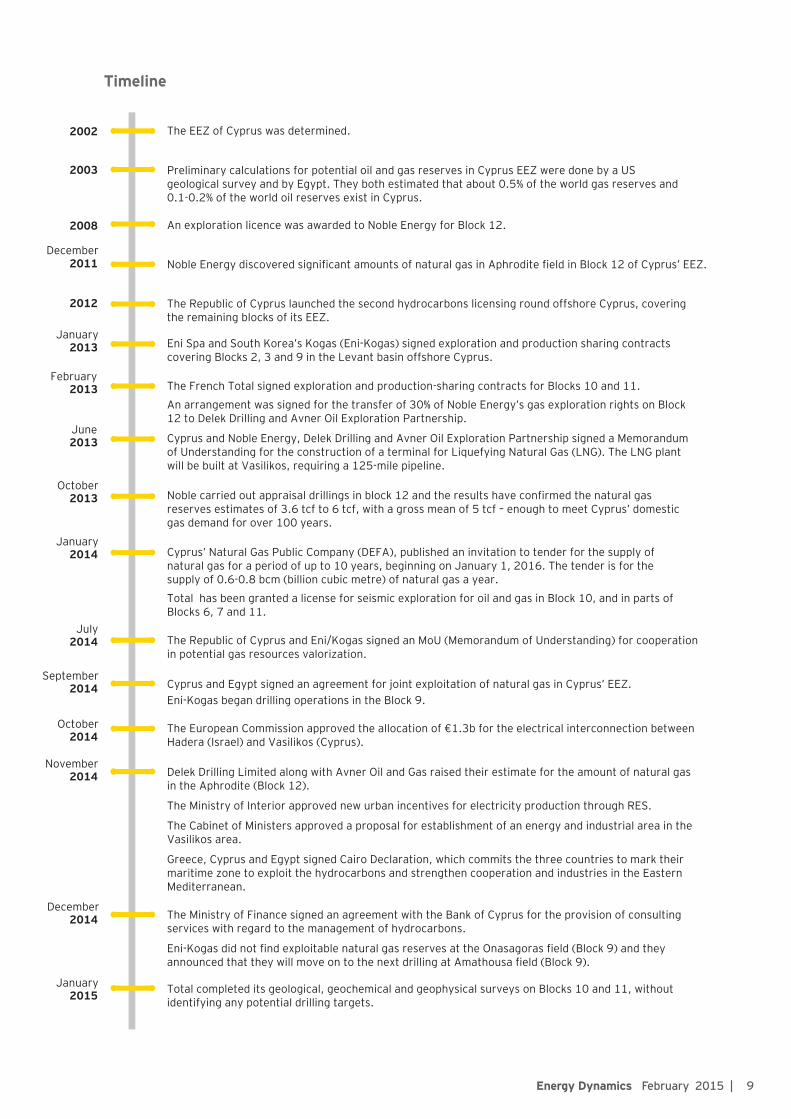
Timeline
2002
2003
2008
2011
2012
The EEZ of Cyprus was determined.
An exploration licence was awarded to Noble Energy for Block 12.
Noble Energy discovered significant amounts of natural gas in Aphrodite field in Block 12 of Cyprus’ EEZ.
The Republic of Cyprus launched the second hydrocarbons licensing round offshore Cyprus, covering the remaining blocks of its EEZ.
Eni Spa and South Korea’s Kogas (Eni-Kogas) signed exploration and production sharing contracts covering Blocks 2, 3 and 9 in the Levant basin offshore Cyprus.
The French Total signed exploration and production-sharing contracts for Blocks 10 and 11.
An arrangement was signed for the transfer of 30% of Noble Energy’s gas exploration rights on Block 12 to Delek Drilling and Avner Oil Exploration Partnership.
Preliminary calculations for potential oil and gas reserves in Cyprus EEZ were done by a US geological survey and by Egypt. They both estimated that about 0.5% of the world gas reserves and 0.1-0.2% of the world oil reserves exist in Cyprus.
January2013
December
February2013
Cyprus and Noble Energy, Delek Drilling and Avner Oil Exploration Partnership signed a Memorandum of Understanding for the construction of a terminal for Liquefying Natural Gas (LNG). The LNG plant will be built at Vasilikos, requiring a 125-mile pipeline.
June2013
Noble carried out appraisal drillings in block 12 and the results have confirmed the natural gas reserves estimates of 3.6 tcf to 6 tcf, with a gross mean of 5 tcf – enough to meet Cyprus’ domestic gas demand for over 100 years.
October2013
Cyprus’ Natural Gas Public Company (DEFA), published an invitation to tender for the supply of natural gas for a period of up to 10 years, beginning on January 1, 2016. The tender is for the supply of 0.6-0.8 bcm (billion cubic metre) of natural gas a year.
Total has been granted a license for seismic exploration for oil and gas in Block 10, and in parts of Blocks 6, 7 and 11.
January2014
The Republic of Cyprus and Eni/Kogas signed an MoU (Memorandum of Understanding) for cooperation in potential gas resources valorization.
July2014
Cyprus and Egypt signed an agreement for joint exploitation of natural gas in Cyprus’ EEZ. Eni-Kogas began drilling operations in the Block 9.
September2014
The European Commission approved the allocation of €1.3b for the electrical interconnection between Hadera (Israel) and Vasilikos (Cyprus).
October2014
Delek Drilling Limited along with Avner Oil and Gas raised their estimate for the amount of natural gas in the Aphrodite (Block 12).
The Ministry of Interior approved new urban incentives for electricity production through RES.
The Cabinet of Ministers approved a proposal for establishment of an energy and industrial area in the Vasilikos area.
Greece, Cyprus and Egypt signed Cairo Declaration, which commits the three countries to mark their maritime zone to exploit the hydrocarbons and strengthen cooperation and industries in the Eastern Mediterranean.
November2014
The Ministry of Finance signed an agreement with the Bank of Cyprus for the provision of consulting services with regard to the management of hydrocarbons.
Eni-Kogas did not find exploitable natural gas reserves at the Onasagoras field (Block 9) and they announced that they will move on to the next drilling at Amathousa field (Block 9).
December2014
Total completed its geological, geochemical and geophysical surveys on Blocks 10 and 11, without identifying any potential drilling targets.
January2015
9Energy Dynamics February 2015 |
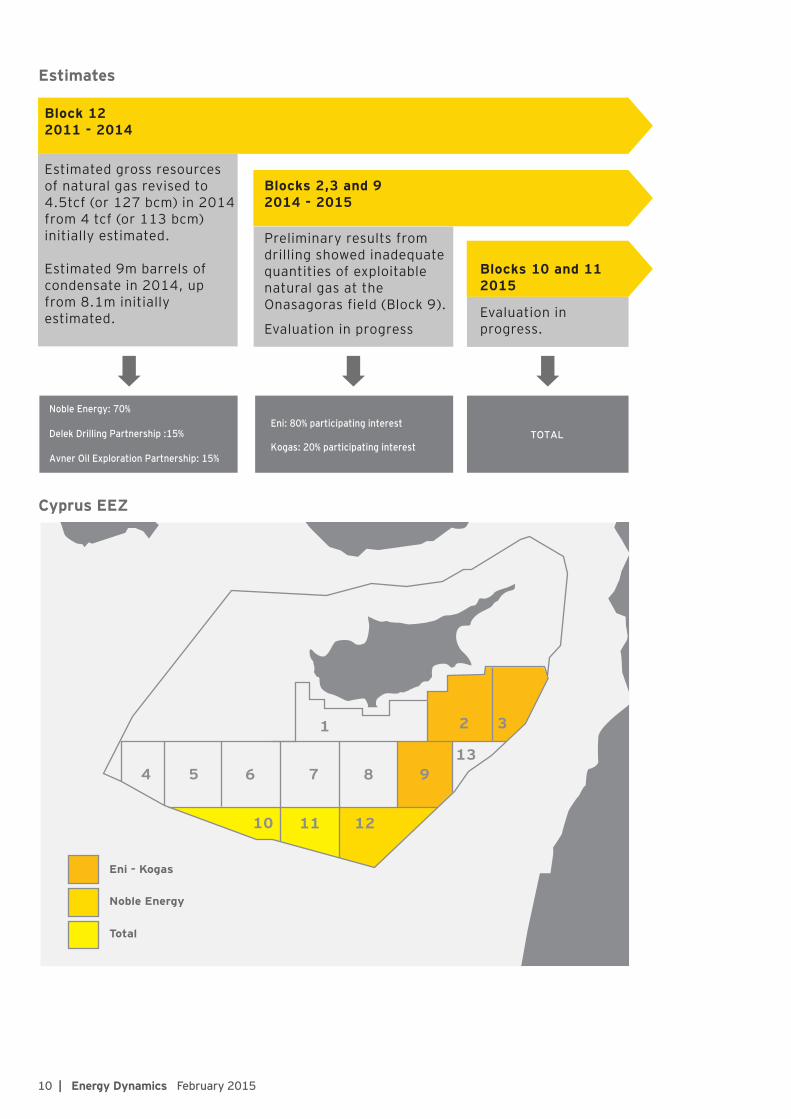
Block 12 2011 - 2014
Blocks 2,3 and 9 2014 - 2015
Blocks 10 and 11 2015
Estimated gross resources of natural gas revised to 4.5tcf (or 127 bcm) in 2014 from 4 tcf (or 113 bcm) initially estimated.
Estimated 9m barrels of condensate in 2014, up from 8.1m initially estimated.
Preliminary results from drilling showed inadequate quantities of exploitable natural gas at the Onasagoras field (Block 9).
Evaluation in progressEvaluation in progress.
TOTAL
Noble Energy: 70%
Delek Drilling Partnership :15%
Avner Oil Exploration Partnership: 15%
Eni: 80% participating interest
Kogas: 20% participating interest
Eni - Kogas
Noble Energy
Total
Estimates
Cyprus EEZ
10 | Energy Dynamics February 2015

Facts
Block 12, Aphrodite field holds 4.5 tcf of natural gas (Delek Drilling Partnership estimate, 2014). Cypriots pay the highest electricity prices in EU-28 (Cyprus' medium size industry 2014: 0.167 €/kWh vs EU-28 medium size industry 2014: 0.09 €/kWh). DEFA has planned and launched the work for the construction and development of a Natural Gas Pipeline Network. This project already secured sponsorship of €10m by EU funds (European Energy Programme for Recovery (EEPR)).
Unemployment rate at 16.7% (November 2014)
Expectations / Forecasts
Just 0.5 tcf could serve Cypriot domestic demand for up to 25 years.
As of January 2015, electricity prices were reduced by 7%, and further reductions are expected in the months ahead.
This network will consist of 3 pipelines that will supply the 3 power plants of EAC in Vasilikos, Dhekeleia and Moni. The initial cost estimated for the first phase is €60m.
According to International Renewable Energy Agency (2015), the deployment of RES in Cyprus has the potential to create between 11,000 and 22,000 jobs by 2030.
Source: Organisation of the Petroleum Exporting Countries (OPEC), Oil and Gas Journal
11Energy Dynamics February 2015 |

12 | Energy Dynamics February 2015
AbbreviationsCERA Cyprus Energy Regulatory Authority
CypERC Cyprus Economic Research Centre
DEFA Natural Gas Public Company
EAC Electricity Authority of Cyprus
EC European Commission
EAFRD European Agricultural Fund for Rural Development
ECB European Central Bank
EEF European Fisheries Fund
EEE-F European Energy Efficiency Fund
EEZ Exclusive Economic Zone
ERDF European Regional Development Fund
EREC European Renewable Energy Council
GDP Gross Domestic Product
IRENA International Renewable Energy Agency
LNG Liquefying Natural Gas
MECIT Ministry of Energy, Commerce, Industry and Tourism
MoU Memorandum of Understanding
NEEAP National Energy Efficiency Action Plan
OPEC Organisation of the Petroleum Exporting Countries
QoQ Quarter on Quarter
RES Renewable Energy Sources
RES-E Renewable electricity
RES-H&C Renewable heating and cooling
YoY Year on Year
Miscellaneous:
bcm billion cubic metre
GWh Gigawatt-hours
kgoe kilograms of oil equivalent
KV kilovolts
ktoe kilotonne of oil equivalent
kW Kilowatt
kWh Kilowatt-hours
MW Megawatt
tcf trillion cubic feet
toe tonnes of oil equivalent
TWh Terawatt-hours
References“Annual Report 2013”, EAC, 2014
“2013 National Report to the European Commission”, CERA, 2013
“3rd National Energy Efficiency Action Plan of Cyprus”, Cyprus, 2014
“National Energy Efficiency Program”, December 2013, EC, 2013
Nestor Fylactos, “Natural Gas Monetization Pathways for Cyprus”, MIT, 2013
“Outlook of Cyprus”, Cyprus Economic Policy Review, 2014
“Projects of Common Interest”, EC, 2014 of Common Interest”, EC, 2014
“Renewable Energy Roadmap for the Republic of Cyprus”, January 2015, IRENA, 2015
Theodoros Zachariadis, “The effect of Energy Efficiency Policies on the Medium-Term Energy Outlook of Cyprus”, Cyprus Economic Policy Review, Vol.8, No.1

About EYEY is a global leader in assurance, tax, transaction and advisory services. The insights and quality services we deliver help build trust and confidence in the capital markets and in economies the world over. We develop outstanding leaders who team to deliver on our promises to all of our stakeholders. In so doing, we play a critical role in building a better working world for our people, for our clients and for our communities.
EY refers to the global organization, and may refer to one or more, of the member firms of Ernst & Young Global Limited, each of which is a separate legal entity. Ernst & Young Global Limited, a UK company limited by guarantee, does not provide services to clients. For more information about our organization, please visit ey.com.
© 2015 Ernst & Young Cyprus Ltd. All rights reserved.
This material has been prepared for general informational purposes only and is not intended tobe relied upon as accounting, tax, or other professional advice. Please refer to your advisors forspecific advice.
This material has been produced by Emergo Wealth Ltd. on behalf of Ernst & Young Cyprus Limited.
ey.com/cy
EY | Assurance | Tax | Transactions | Advisory
13Energy Dynamics February 2015 |