energy data and databases in latin america and caribbean
TRANSCRIPT
Energy Data and Databases in Latin
America and Caribbean. ECLAC
experience.
Víctor Hugo Ventura
Chief, Energy and Natural Resources Unit,
UN Economic Commission for Latin American and the Caribbean
(ECLAC),
subregional headquarters Mexico.
Rio de Janeiro,
Brazil June 17-18, 2015.
Content
About ECLAC
ECLAC Mexico
Energy data bases for the Central America
Integration System, origin, evolution and current
situation
Database of energy efficiency indicators
Conclusions.

About ECLAC
The Economic Commission for Latin America and the
Caribbean (ECLAC) -the Spanish acronym is CEPAL- was
established in 1948.
ECLAC, which is headquartered in Santiago, Chile, is one of
the five regional commissions of the United Nations. It was
founded with the purpose of contributing to the economic
development of Latin America, coordinating actions directed
towards this end, and reinforcing economic ties among
countries and with other nations of the world. The promotion
of the region's social development was later included among
its primary objectives.

About ECLAC Mexico
In June 1951, the Commission established the ECLAC
subregional headquarters in Mexico City, which serves the
needs of the Central American subregion (10 countries), and in
December 1966, the ECLAC subregional headquarters for the
Caribbean was founded in Port-of-Spain, Trinidad and
Tobago. In addition, ECLAC maintains country offices in
Buenos Aires, Brasilia, Montevideo and Bogotá, as well as a
liaison office in Washington, D.C

About ECLAC Mexico
The subregional headquarters of the Economic Commission
for Latin America and the Caribbean (ECLAC) in Mexico
serves 10 countries: Costa Rica, Cuba, Dominican Republic,
El Salvador, Guatemala, Haiti, Honduras, Mexico, Nicaragua
and Panama.
It is a centre of excellence in technical assistance and research,
advising governments in the region at the highest level on the
design, formulation, follow-up and evaluation of public
policies, and training public officials.

Energy in ECLAC Mexico
Energy integration and sustainable development (MDG,
Rio + 20, SE4A and POPs).
Priority to Regional issues and support to countries on
specific issues.
Energy is transversal: a) social development and
universalization of energy services; b) economic development,
and c) environmental externalities.
Infrastructure (energy) axis of regional integration
More activity with Central America, Mexico and Dominican
Republic; in near future we will be more work with Cuba and
Haiti.
Strong relationship with government institutions, regional
authorities and multilateral agencies.

Energy in ECLAC Mexico
The energy issue is very important on the agenda of all
countries.
Differences between countries: level of development, size of
the economies, resources
Differences between its energy sectors and energy
industries
9 of the 10 countries served by the sub-headquarters of
ECLAC in Mexico are highly dependent energy (net
importers of oil and oil products).
Specific differences between Mexico and the other
countries of the subregion. A less developed, higher
dependence on traditional energy sources.

MEXICO, CENTRAL AMERICA, CUBA, HAITI
AND DOMINICAN REPUBLIC
Mexico is in a different level and scale, however, of its
states have high consumption of firewood. Central
America has high consumption of traditional energy,
mainly in Guatemala, Honduras and Nicaragua. The same
happens in Haiti.
With the exception of Costa Rica and Cuba, there are tasks
pending in electrification.
Efforts to diversify the energy matrix and use of renewable
sources. Only one country generates almost all its
electricity from such sources.

Countries of ECLAC Mexico subregional headquarters :
Final Energy Consumption
0
50 000
100 000
150 000
200 000
250 000
300 000
350 000
400 000
450 000
500 000
550 000
600 000
650 000
700 000
750 000
800 000
850 000
México Istmo
Centroamericano
Cuba GuatemalaRep. Dominicana Panamá Haití
kB
EP
Otros
Carbón Mineral
Hidrocarburos
Gases
Electricidad
Carbón Vegetal
Productos de Caña
Leña

FINAL ENERGY CONSUMPTION AND GDP per capita (2008).
Haití
México
Cuba
Costa Rica
Panamá
Guatemala
República DominicanaHonduras
El SalvadorNicaragua
0
1
2
3
4
5
6
7
8
500 2 500 4 500 6 500 8 500 10 500
PIB PER CÁPITA
(US$)
CO
NS
UM
O E
NE
RG
ÉT
ICO
PE
R C
ÁP
ITA
(BE
P)
Currently the database statistics and
energy are focused in these countries
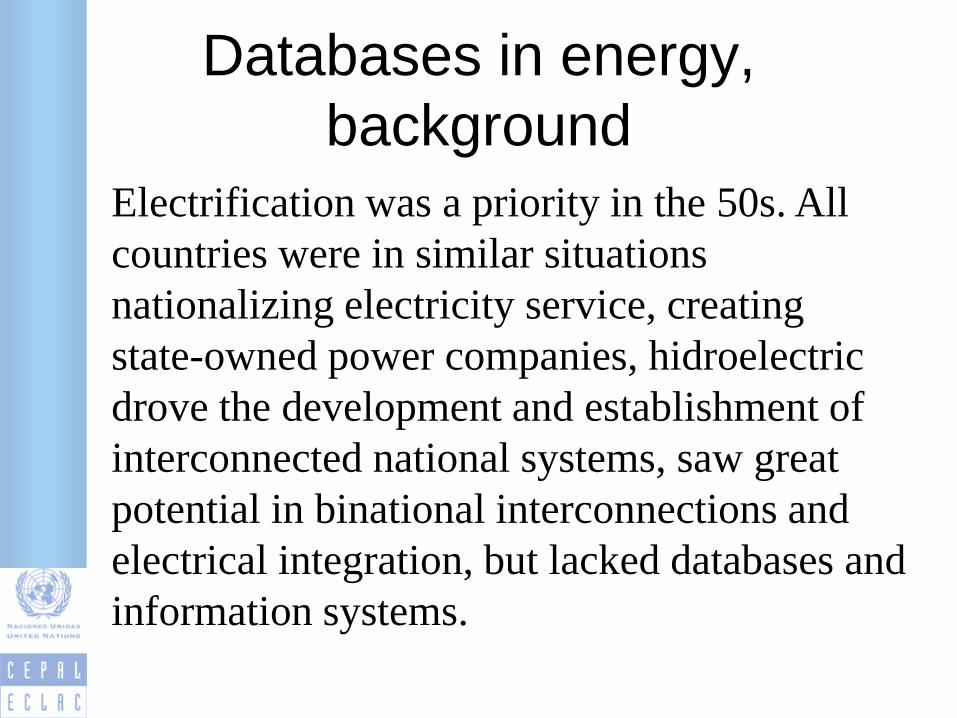
Databases in energy,
background
Electrification was a priority in the 50s. All
countries were in similar situations
nationalizing electricity service, creating
state-owned power companies, hidroelectric
drove the development and establishment of
interconnected national systems, saw great
potential in binational interconnections and
electrical integration, but lacked databases and
information systems.

Databases in energy,
background - electricity
One of the first task in central America: the
creation of data base and publication of
statistics on electricity.
The information was basic for the evaluations
and studies binational interconnections and
regional electrical interconnection of Central
America (60s and 70s).
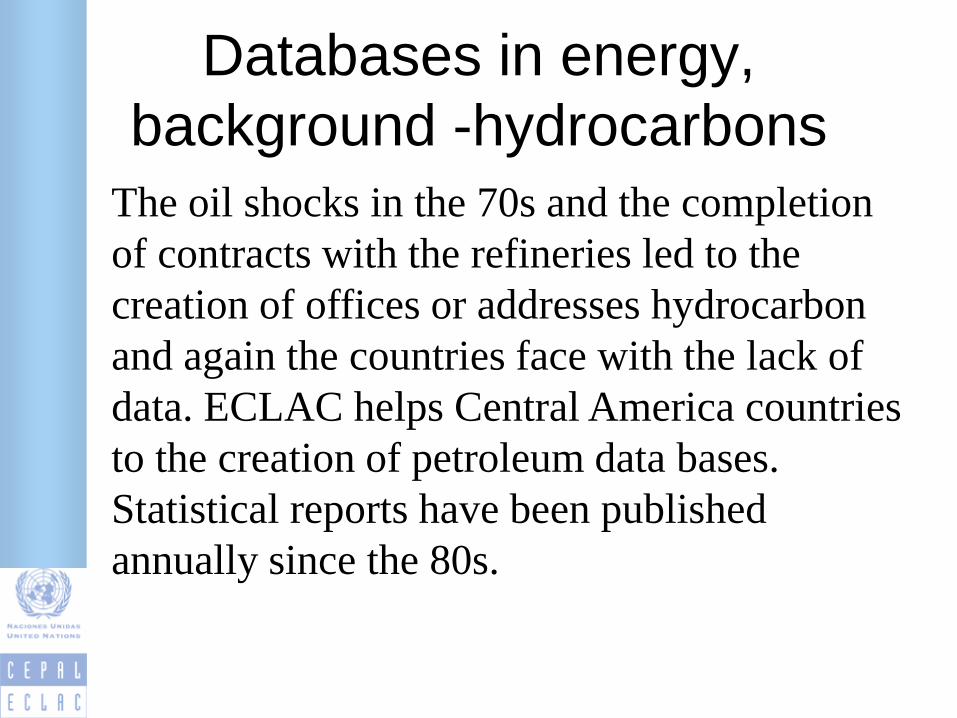
Databases in energy,
background -hydrocarbons
The oil shocks in the 70s and the completion
of contracts with the refineries led to the
creation of offices or addresses hydrocarbon
and again the countries face with the lack of
data. ECLAC helps Central America countries
to the creation of petroleum data bases.
Statistical reports have been published
annually since the 80s.

Databases in energy,
background
The eighties were a very difficult period.
Databases oil and electricity were basic for
countries to promote regional cooperation:
countries advanced in the operational
coordination of the electrical interconnections
and reducing freight and handling oil supply
costs (information is basic to the netback
assessments). Countries understand and have
benefits databases.
Databases in energy,
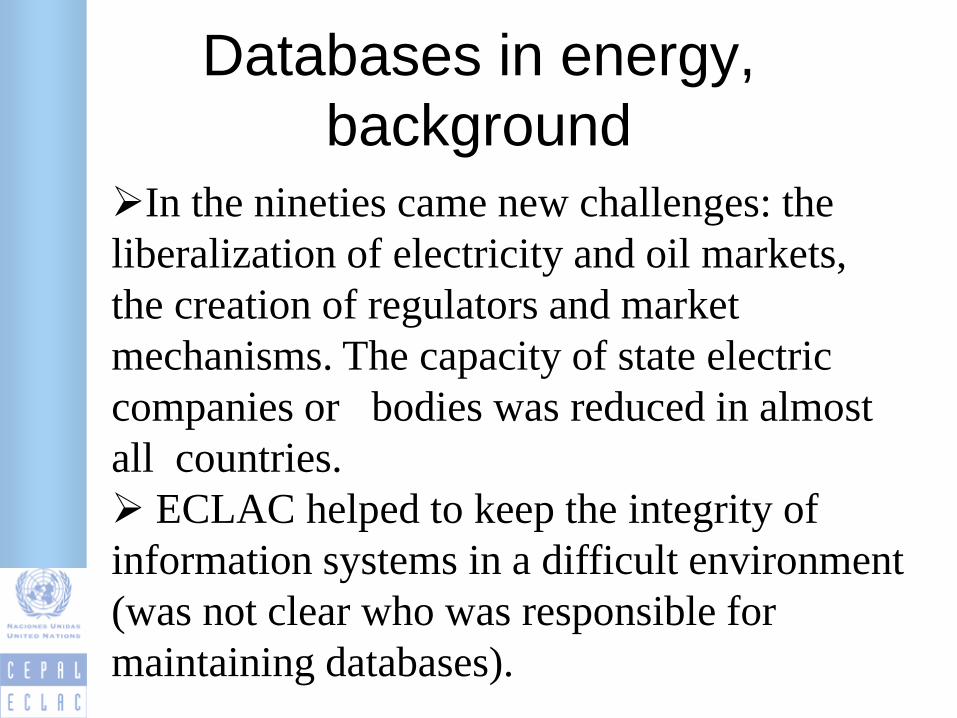
background
In the nineties came new challenges: the
liberalization of electricity and oil markets,
the creation of regulators and market
mechanisms. The capacity of state electric
companies or bodies was reduced in almost
all countries.
ECLAC helped to keep the integrity of
information systems in a difficult environment
(was not clear who was responsible for
maintaining databases).
Partners, stakeholders or counterparts (50)
The General Secretariat of the Central American Integration System
(SICA) and its Energy Coordination Unit (UCE-SICA).
The Council of Energy Ministers
The meeting of Directors of Energy and Hydrocarbons
The Central America Committee for Cooperation on Hydrocarbons
in (CCHAC) ==> 4 regional counterparts
Central America Electrification Council (CEAC)
The institutions of the Regional Electricity Market (SIEPAC owner
(EPR), the regulator – CRIE-, the operator –EOR- EPR and the
ministerial body -CDMER) ==> 5
The Mesoamerica (10 countries SICA + Mexico + Colombia) Project
National Energy Institutions: The Energy Ministers
Energy Directorates, Directorates of Hydrocarbons and petroleum state
enterprises
Public utilities, regulators (electricity and hydrocarbons); ==> 30

Hydrocarbons
18
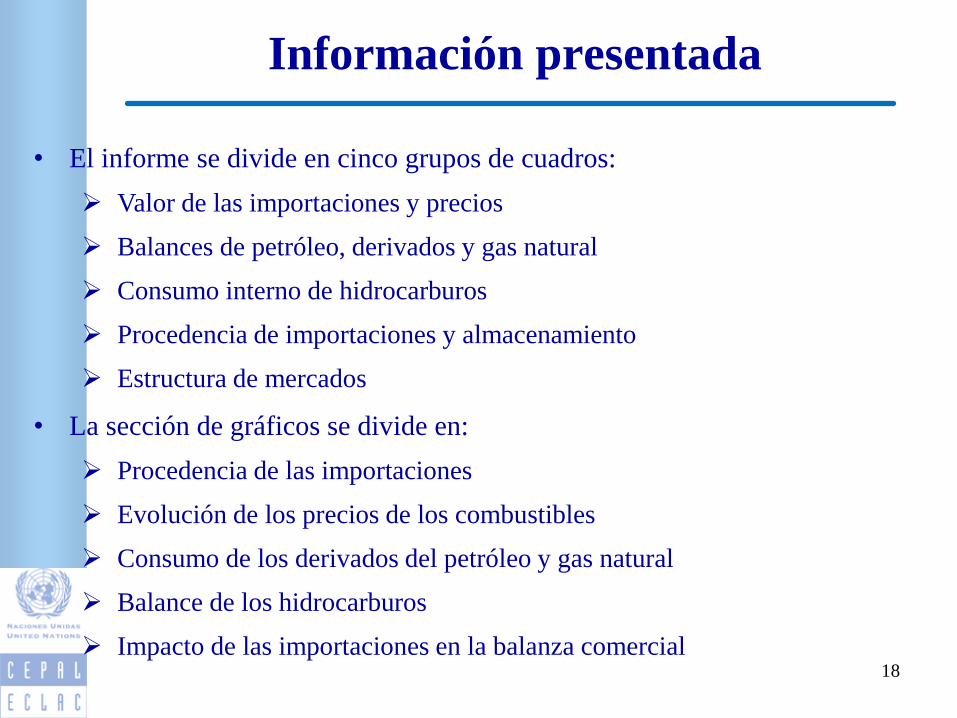
Información presentada
• El informe se divide en cinco grupos de cuadros:
Valor de las importaciones y precios
Balances de petróleo, derivados y gas natural
Consumo interno de hidrocarburos
Procedencia de importaciones y almacenamiento
Estructura de mercados
• La sección de gráficos se divide en:
Procedencia de las importaciones
Evolución de los precios de los combustibles
Consumo de los derivados del petróleo y gas natural
Balance de los hidrocarburos
Impacto de las importaciones en la balanza comercial

19
Cuadros típicos
2010
2011
2012
Nota: República Dominicana inició importaciones de gas natural licuado en 2003.
20,1
11,0
16,0
2 412,6
1 910,6
1 188,3
5 788,8
2 699,7
92,4
1 846,0
23,7
1 527,7
226,2
256,6
34,1
9,7
14,3
2 363,1
1 609,0
1 042,9
5 456,1
2 643,5
Total
12 640,7
1 907,6
30,5
1 519,2
200,0
14,6
9,3
15,5
230,7
932,5
631,4
Fuente: CEPAL, sobre la base de cifras oficiales y estimaciones propias de precios para los volúmenes importados en los que no se reportó su
costo.
43,2 8,8
420,7
1 213,1
76,7 70,8
705,7
732,1 503,7
323,5
0,4
203,7
310,7
6,7
287,8
1 215,0
520,1
414,6
1,2
174,3
1 229,9 657,4
248,0
428,9
232,3
56,2
51,6
349,3
1,9
2,6
75,9
1 110,6
229,1
32,5
2,9
301,6
176,4
372,1
625,8 303,7
649,1
54,9
218,4
2 961,8
364,5 19,7
112,6
21,9 2,0
2 863,0
221,0
0,1
443,0
184,5
1 231,5
3,2 1,2
4,4
CUADRO 2
CENTROAMÉRICA Y REPÚBLICA DOMINICANA: VALOR CIF DE LAS IMPORTACIONES, 2010-2012
(En millones de dólares )
Reconstituido 30,5
Petróleo crudo
1 683,99 320,0 1 603,6 1 350,0
1 121,8 294,5
República
Dominicana
3 320,8
785,8
Asfaltos
Fuel oil
Diesel
2 068,3
4 856,4
92,4
1 713,5 741,4
Producto Centroamérica Costa Rica El Salvador
419,8
Gasolina regular 1 705,9
MTBE 16,0
Gasolina de aviación 11,0 3,1
Gas licuado
Coke 20,1
1 003,3
13 501,7
814,3
2 969,0
Asfaltos 82,7
850,5
Jet/kero 957,5
Gasolina premium 1 934,0
97,4
Reconstituido 22,5
Petróleo crudo
2 175,7
248,9
453,6 835,8
82,7
17 536,9
Gasolina de aviación 9,7
Gasolina regular
Gasolina premium 1 942,1
Fuel oil
22,1
623,6
14,3
Asfaltos 58,1
Fuel oil
1 942,7
Diesel 4 508,4
Coke 34,1
Jet/kero
MTBE 14,3
1 434,8 196,8
189,2
503,5
1,7
2 950,7
5,9
336,2
2,3
605,2
297,9 197,5
0,6
41,0
497,5
1 818,8
29,7
136,3
2 149,9
98,0
149,3
1,8
15,5
43,0 56,4
282,5
96,3
81,7
2 267,0
317,6
5,8
842,2
159,7
471,2
2,6 1,6
125,0
3,7
43,4
1,1
220,4
61,6
2,8
77,0
127,8
473,5
189,4
183,6
407,6
289,1
30,5
949,4
3 067,1
1 502,6
875,5
9,3
Coke 14,6
Gas licuado
2 227,5
71,4
Gas natural
Gasolina de aviación
444,5 109,7 489,0
12,2 157,1 301,8
2,0
10,8
0,1
236,8
MTBE 15,5
Gasolina premium
Gasolina regular
Diesel
Gas licuado
1 249,5
41,0
1 155,4
1 155,2
520,5
13 265,2
Petróleo crudo
Reconstituido
Jet/kero
1 722,7
1 096,4
664,6
3 746,3
1 856,0
58,1
1 774,8
17 325,1
2 248,7
46,2
215,0
148,5
69,4
192,0 419,3
409,8
17,4
3,7
245,4 186,0
0,1
261,5
97,7
21,8
87,0
241,9
40,0
3,4
1 871,4
185,4
188,8
881,8
405,5
22,5
357,6 171,0
16,0
25,8
371,3
421,0
174,2
200,0
2 292,3
Guatemala Honduras Nicaragua Panamá
0,1
63,7
263,1
242,0
175,4
1,2
666,0
615,6
1 215,8
700,8
4 059,9
999,2
5,2
619,4
569,8
220,2
478,6
204,8
Gas natural 256,6
Gas natural 226,2
4 035,2
1 031,7
1,2
524,4
192,4
947,8
700,8
220,9
144,1
679,3
Producto Año Costa Rica El Salvador Guatemala Honduras Nicaragua PanamáRepública
Dominicana
Diesel
2004 1,94 1,91 1,69 2,18 2,13 1,66 1,69
2005 2,31 2,47 2,37 2,68 2,71 2,10 2,59
2006 2,56 2,71 2,62 2,87 2,98 2,35 2,94
2007 2,96 2,90 2,77 2,90 3,10 2,51 3,40
2008 4,30 3,99 3,95 3,61 4,14 3,60 3,56
2009 2,98 2,53 2,42 2,63 2,86 2,22 3,10
2010 3,61 3,10 2,98 3,19 3,41 2,80 3,62
2011 4,43 4,10 3,94 4,06 4,34 3,65 4,80
2012 4,69 4,21 4,08 4,18 4,43 3,78 5,02
Gasolina premium
2004 2,74 2,34 2,33 2,94 2,57 2,19 2,46
2005 3,31 2,87 2,95 3,33 3,07 2,51 3,71
2006 3,79 3,28 3,30 3,57 3,64 2,95 4,12
2007 4,04 3,48 3,41 3,52 3,73 3,09 4,60
2008 4,54 4,06 4,10 4,00 4,36 3,76 4,35
2009 3,39 3,00 2,95 3,18 3,40 2,71 3,95
2010 4,28 3,51 3,51 3,75 3,91 3,18 4,46
2011 4,96 4,28 4,33 4,57 4,81 3,97 5,66
2012 5,31 4,52 4,51 4,78 5,04 4,26 5,88
Gasolina regular
2004 2,62 2,23 2,27 2,87 2,50 2,13 2,24
2005 3,12 2,74 2,89 3,19 2,95 2,39 3,36
2006 3,59 3,10 3,18 3,20 3,41 2,75 3,73
2007 3,84 3,21 3,32 3,31 3,55 2,94 4,26
2008 4,44 3,86 4,01 3,60 4,23 3,57 3,65
2009 3,30 2,80 2,83 2,98 3,31 2,53 3,66
2010 4,08 3,31 3,39 3,50 3,79 2,99 4,20
2011 4,81 4,08 4,24 4,31 4,56 3,73 5,30
2012 5,12 4,25 4,43 4,46 4,77 3,88 5,44
CUADRO 3
CENTROAMÉRICA Y REPÚBLICA DOMINICANA: PRECIOS
(En dólares/galón )
Fuente: CEPAL, sobre la base de cifras oficiales.
INTERNOS DE LOS DERIVADOS, 2004-2012

20
Cuadros típicos
Producción Importación Consumo Exportación
2000
7 090 46 360 46 397 6 638
45 369 89 894 124 304 12 260 36 72
1 346 11 673 13 130 139 10 89
7 585 21 774 30 167 185 25 72
3 655 4 384 7 755 180 47 57
12 132 34 586 46 686 1 112 26 74
19 978 16 869 24 690 10 426 81 68
673 608 1 876 218 36 32
2005
6 728 27 226 28 359 5 976
25 663 105 511 133 296 2 688 19 79
3 400 3 035 112
788 16 636 16 113 924 5 103
4 775 25 443 30 829 74 15 83
2 630 6 046 8 578 2 31 70
6 783 33 245 42 105 143 16 79
9 997 20 311 29 252 1 038 34 69
691 429 3 386 508 20 13
2010
Petróleo 4 363 24 642 25 336 3 719
24 669 140 268 158 651 8 873 16 88
11 846 11 857 100
688 25 192 20 324 5 194 3 124
Gasolinas 4 901 31 099 36 859 1 226 13 84
Kero/Jet 2 823 7 292 9 627 149 29 76
Diesel 6 493 40 494 48 207 1 011 13 84
Fuel oil 9 361 23 626 30 256 1 006 31 78
Otros 403 719 1 521 281 27 47
2011
3 995 21 492 21 774 3 529
20 958 146 047 161 367 7 935 13 91
12 537 12 523 100
588 23 493 19 066 4 810 3 123
3 946 32 425 36 844 1 785 11 88
2 638 8 016 10 471 93 25 77
5 744 43 011 49 200 385 12 87
7 713 25 755 31 245 595 25 82
330 811 2 020 268 16 40
2012
3 876 16 955 17 482 4 131
16 179 150 077 159 946 5 844 10 94
12 605 12 692 99
331 24 213 19 752 4 895 2 123
3 177 33 869 37 707 12 8 90
2 298 8 808 10 885 145 21 81
4 425 43 984 47 685 41 9 92
5 712 25 732 29 220 326 20 88
236 866 2 006 425 12 43
2) Las cifras de 2012 no incluyen importación y consumo de coke (1 406 y 1 243 mbl).
diesel, fuel oil y otros) y gas natural (GN).
3) El gas natural se expresa en barriles de petróleo equivalente (bpe), 1 bpe = 3,5965 millón de btu (MMBtu)
1 bpe = 5 000 pies cúbicos (ft3).
Kero/Jet
Diesel
Gas licuado
Petróleo
Otros
Fuel oil
Gas natural
Total de derivados y GN
Notas: 1) Hidrocarburos incluye: petróleo (crudo y reconstituido), derivados (gas licuado de petróleo, gasolinas,
Otros
Fuel oil
Fuente: CEPAL, sobre la base de cifras oficiales.
Diesel
Gas licuado
Gasolinas
Total de derivados y GN
Petróleo
Gas licuado
Kero/Jet
Otros
Petróleo
Kero/Jet
Gas licuado
Gas natural
Gas natural
Total de derivados y GN
Fuel oil
Total de derivados y GN
Gas natural
Gasolinas
Fuel oil
Diesel
Gasolinas
CUADRO 7
CENTROAMÉRICA Y REPÚBLICA DOMINICANA: BALANCE DE HIDROCARBUROS, 2000-2012
(En miles de barriles )
Imp./Cons. (%)Prod./Cons. (%)
Otros
Petróleo
Diesel
Gas licuado
Total de derivados
Kero/Jet
Gasolinas
Consumo
total Subtotal Gas natural GLP Gasolina Kero/Jet Diesel Fuel oil Otros Subtotal Gas natural Diesel Fuel oil Otros
2000 128 423 96 665 13 130 30 167 7 755 37 840 5 898 1 876 31 757 8 847 18 792 4 119
2001 132 493 97 466 13 806 30 747 7 627 37 038 6 637 1 611 35 027 7 791 24 171 3 064
2002 131 677 97 725 14 424 32 347 7 059 36 610 5 616 1 669 33 951 6 753 23 887 3 311
2003 135 253 98 905 13 396 31 895 7 397 37 148 7 040 2 029 36 349 559 7 596 25 555 2 639
2004 141 818 105 185 15 006 31 673 8 326 37 476 9 520 3 183 36 633 2 513 5 149 23 614 5 357
2005 138 994 102 999 16 113 30 829 8 578 37 593 6 501 3 386 35 995 3 035 4 512 22 750 5 698
2006 144 635 106 138 16 994 30 890 8 887 38 126 7 967 3 274 38 497 3 588 5 674 24 722 4 513
2007 157 608 112 863 74 18 670 32 787 9 401 39 900 8 491 3 539 44 745 7 344 7 013 26 388 4 000
2008 152 491 112 061 117 19 431 32 906 9 641 38 831 7 874 3 262 40 429 7 664 6 562 23 704 2 500
2009 154 243 116 948 149 19 727 35 688 9 483 40 990 7 541 3 368 37 295 7 323 4 975 24 997
2010 159 952 120 343 467 20 324 36 859 9 627 42 761 7 482 2 823 39 609 11 390 5 445 22 774
2011 162 829 121 636 1 423 19 066 36 844 10 471 42 623 7 730 3 481 41 192 11 100 6 577 23 515
2012 161 189 122 709 1 629 19 752 37 707 10 885 42 626 6 863 3 248 38 480 11 063 5 058 22 358
2000 100,0 13,6 31,2 8,0 39,1 6,1 1,9 100,0 27,9 59,2 13,0
2001 100,0 14,2 31,5 7,8 38,0 6,8 1,7 100,0 22,2 69,0 8,7
2002 100,0 14,8 33,1 7,2 37,5 5,7 1,7 100,0 19,9 70,4 9,8
2003 100,0 13,5 32,2 7,5 37,6 7,1 2,1 100,0 1,5 20,9 70,3 7,3
2004 100,0 14,3 30,1 7,9 35,6 9,1 3,0 100,0 6,9 14,1 64,5 14,6
2005 100,0 15,6 29,9 8,3 36,5 6,3 3,3 100,0 8,4 12,5 63,2 15,8
2006 100,0 16,0 29,1 8,4 35,9 7,5 3,1 100,0 9,3 14,7 64,2 11,7
2007 100,0 0,1 16,5 29,1 8,3 35,4 7,5 3,1 100,0 16,4 15,7 59,0 8,9
2008 100,0 0,1 17,3 29,4 8,6 34,7 7,0 2,9 100,0 19,0 16,2 58,6 6,2
2009 100,0 0,1 16,9 30,5 8,1 35,0 6,4 2,9 100,0 19,6 13,3 67,0
2010 100,0 0,4 16,9 30,6 8,0 35,5 6,2 2,3 100,0 28,8 13,7 57,5
2011 100,0 1,2 15,7 30,3 8,6 35,0 6,4 2,9 100,0 26,9 16,0 57,1
2012 100,0 1,3 16,1 30,7 8,9 34,7 5,6 2,6 100,0 28,8 13,1 58,1
2000 100,0 75,3 10,2 23,5 6,0 29,5 4,6 1,5 24,7 6,9 14,6 3,2
2001 100,0 73,6 10,4 23,2 5,8 28,0 5,0 1,2 26,4 5,9 18,2 2,3
2002 100,0 74,2 11,0 24,6 5,4 27,8 4,3 1,3 25,8 5,1 18,1 2,5
2003 100,0 73,1 9,9 23,6 5,5 27,5 5,2 1,5 26,9 0,4 5,6 18,9 2,0
2004 100,0 74,2 10,6 22,3 5,9 26,4 6,7 2,2 25,8 1,8 3,6 16,7 3,8
2005 100,0 74,1 11,6 22,2 6,2 27,0 4,7 2,4 25,9 2,2 3,2 16,4 4,1
2006 100,0 73,4 11,7 21,4 6,1 26,4 5,5 2,3 26,6 2,5 3,9 17,1 3,1
2007 100,0 71,6 0,0 11,8 20,8 6,0 25,3 5,4 2,2 28,4 4,7 4,4 16,7 2,5
2008 100,0 73,5 0,1 12,7 21,6 6,3 25,5 5,2 2,1 26,5 5,0 4,3 15,5 1,6
2009 100,0 75,8 0,1 12,8 23,1 6,1 26,6 4,9 2,2 24,2 4,7 3,2 16,2
2010 100,0 75,2 0,3 12,7 23,0 6,0 26,7 4,7 1,8 24,8 7,1 3,4 14,2
2011 100,0 74,7 0,9 11,7 22,6 6,4 26,2 4,7 2,1 25,3 6,8 4,0 14,4
2012 100,0 76,1 1,0 12,3 23,4 6,8 26,4 4,3 2,0 23,9 6,9 3,1 13,9
2000-2005 1,6 1,3 4,2 0,4 2,0 -0,1 2,0 12,5 2,5 -12,6 3,9 6,7
2005-2010 2,8 3,2 4,8 3,6 2,3 2,6 2,9 -3,6 1,9 30,3 3,8 0,0
2009-2010 0,7 0,6 25,6 0,6 0,6 0,3 0,8 -0,2 -3,5 1,2 9,2 1,8 -1,8
2010-2011 0,4 0,2 25,0 -1,3 -0,0 1,7 -0,1 0,7 4,3 0,8 -0,5 3,8 0,6
2011-2012 -0,2 0,2 2,7 0,7 0,5 0,8 0,0 -2,4 -1,4 -1,4 -0,1 -5,1 -1,0
2) El gas natural se expresa en barriles de petróleo equivalente (bpe), 1 bpe = 3,5965 millón de btu (MMBtu), 1 bpe = 5 000 pies cúbicos (ft3).
Fuente: CEPAL, sobre la base de cifras oficiales.
Notas: 1) El consumo final de otros incluye el consumo de coke (1 243 mbl) en 2012. Otros en generación eléctrica se refiere a crudo e incluye orimulsión de
2004 a 2006.
Año
CUADRO 15
CENTROAMÉRICA Y REPÚBLICA DOMINICANA: CONSUMO INTERNO DE DERIVADOS DEL PETRÓLEO Y GAS NATURAL, 1990-2012
Estructura global (En porcentajes )
Tasas de crecimiento anual (En porcentajes )
Consumo final Generación eléctrica
Volumen (En miles de barriles )
Estructuras (En porcentajes )

21
Cuadros típicos
País de origen
Mbl % Mbl % Mbl % Mbl % Mbl % Mbl % Mbl % Mbl %
Crudo y reconstituido 16 955 100.0 100.0 3 460 100.0 100.0 100.0 4 183 100.0 100.0 9 312 100.0
Colombia 1 482 19,3 1 472 42,5 10 0,1
Ecuador 1 412 18,5 1 412 40,8
Estados Unidos 188 2,5 188 5,4
México 4 233 4 233 45,5
Venezuela (R. B. de) 9 640 59,8 388 11,2 4 183 100,0 5 069 54,4
Derivados y gas natural 151 483 100.0 18 025 100.0 13 527 100.0 27 008 100.0 20 767 100.0 7 037 100.0 23 324 100.0 41 795 100.0
No identificado 17 340 1,1 1 204 4,0 16136,0 38,6
Angola 97 0,1 97 0,5
Bélgica 181 181,0 0,4
Brasil 23 0,0 23 0,1
Caribe 4 996 0,0 43 0,2 4953,0 11,9
Chile 148 0,1 148 0,5
Colombia 5 034 3,9 35 0,2 662 4,9 2 150 7,1 1 334 6,4 81 0,3 772,0 1,8
Corea del Sur 457 0,4 457 1,5
Ecuador 4 118 3,8 258 1,9 1 847 6,1 2 014 9,7
El Salvador 794 0,7 116 0,4 678 9,6
Estados Unidos 78 746 69,5 16 670 92,5 5 862 43,3 15 213 56,3 16 078 77,4 292 4,1 22 127 94,9 2504,0 6,0
Guatemala 1 265 1,2 9 0,0 931 6,9 194 0,9 132 1,9
Guinea Ecuatorial 12 0,0 12 0,1
Honduras 2 914 2,7 5 0,0 1 140 8,4 1 682 5,6 86 1,2
Nicaragua 35 0,0 33 0,2 2 0,0
Nigeria 348 0,3 348 1,2
Noruega 2 146 2,0 2 146 7,1
Panamá 1 367 1,2 884 4,9 483 3,6
Perú 1 064 1,0 105 0,8 444 1,5 515 2,5
Qatar 2 528 2528,0 6,0
República Dominicana 2 117 1,9 5 0,0 900 6,7 602 2,0 584 2,8 28 0,1
Suecia 100 0,1 100 0,6
Taiwan 25 0,0 25 0,1
Trinidad y Tabago 11 932 1,5 116 0,6 410 3,0 49 0,2 1 027 4,4 10330,0 24,7
Venezuela (R. B. de) 13 693 8,5 2 743 20,3 649 2,1 5 848 83,1 62 0,3 4391,0 10,5
Estructura 168 438 100.0 18 025 100.0 16 987 100.0 27 008 100.0 20 767 100.0 11 220 100.0 23 324 100.0 51 107 100.0
Crudo y reconstituido 16 955 10,1 3 460 20,4 4183,2 37 9 312 18,2
Derivados y gas natural 151 483 89,9 18 025 100,0 13 527 79,6 27 008 100,0 20 767 100,0 7 037 62,7 23 324 100,0 41 795 81,8
CUADRO 23
Rep. DominicanaHonduras Nicaragua Panamá
( Continúa )
Total Costa Rica El Salvador Guatemala
CENTROAMÉRICA Y REPÚBLICA DOMINICANA: PROCEDENCIA DE LAS IMPORTACIONES, 2012

22
Cuadros típicos
Tipo de Trim
producto Mbl $/bl Mbl $/bl Mbl $/bl Mbl $/b Mbl $/b Mbl $/bl Mbl $/b Mbl $/bl
Petróleo 16 955 110,27 3 460 113,82 4 183 105,91 9 312 110,92
Crudo 16 757 110,16 3 272 113,47 4 183 105,91 9 302 110,91
Maya-Olmeca 4 233 110,11 4 233 110,11
1 1 295 117,20 1 295 117,20
2 1 397 104,97 1 397 104,97
3 1 097 109,99 1 097 109,99
4 444 105,93 444 105,93
Mesa 4 571 107,33 388 122,72 4 183 105,91
1 648 113,18 648 113,18
2 1 177 111,4 388 122,72 788 105,86
3 1 176 106,38 1 176 106,38
4 1 571 102,58 1 571 102,58
Mesa - Sta Bárbara 5 069 111,57 5 069 111,57
1 1 475 118,99 1 475 118,99
2 1 498 107,90 1 498 107,90
3 1 546 108,25 1 546 108,25
4 550 111,01 550 111,01
Oriente 1 412 110,68 1 412 110,68
1 1 056 114,36 1 056 114,36
2 356 99,8 356 99,76
Vasconia 1 472 113,70 1 472 113,70
2 742 116,95 742 116,95
3 730 110,4 730 110,40
Reconstituido 198 119,94 188 119,93 10 120,10
Nafta 198 119,94 188 119,93 10 120,10
1 101 126,02 101 126,02
2 58 118,26 48 117,88 10 120,10
3 38 106,29 38 106,29
CENTROAMÉRICA Y REPÚBLICA DOMINICANA: VOLUMEN Y PRECIOS CIF DE LOS HIDROCARBUROS IMPORTADOS, 2012
CUADRO 25
Rep Dominicana
(continúa)
Total Costa Rica El Salvador Guatemala Honduras Nicaragua Panamá

23
Cuadros típicos
Total Costa Rica El Salvador Guatemala Honduras Nicaragua PanamáRepública
Dominicana
Total 100,0 10,7 10,4 15,7 12,6 6,2 13,9 30,5
1. Multinacionales 16,9 (15,9) (9,9) (14,2) (85,9)
Chevron-Texaco 16,9 (15,9) (9,9) (14,2) (85,9)
2. Regionales 19,4 (48,7) (32,0) (41,5) (43,7) (9,7)
Puma 11,4 (34,9) (6,1) (22,0) (43,7) (9,7)
Terra 8,0 (13,8) (25,9) (19,5)
2. Nacionales 63,7 (100,0) (35,3) (58,1) (44,3) (56,3) (4,4) (100,0)
a) Grandes 62,7 (100,0) (32,4) (53,8) (44,3) (56,2) (4,4) (100,0)
No diversificadas 50,0 (100,0) (25,4) (46,8) (18,6) (56,2) (4,4) (75,0)
Diversificadas
(eléctricas) 12,7 (7,0) (7,0) (25,7) (25,0)
b) Pequeñas 1,0 (2,9) (4,3) (0,1)
CR3 (%) a
43,6 100,0 64,7 60,3 59,1 90,7 100,0 100,0
HHI b
1 029 10 000 1 955 1 600 1 665 3 112 7 491 3 749
Índice de concentración
Fuente: CEPAL, sobre la base de cifras oficiales.
Notas: Los valores entre paréntesis son porcentajes de las participaciones nacionales.
Los valores sin paréntesis están referidos a los porcentajes de participación en el mercado regional.a CR3 es el índice de concentración de las tres firmas más grandes, mide en cada país y en la región el porcentaje del mercado servido por
dichas firmas.b HHI es el índice de concentración de Herfindahl-Hirschman, que es igual a la suma de los cuadrados de los porcentajes de participación de
cada uno de los agentes.
CUADRO 29
CENTROAMÉRICA Y REPÚBLICA DOMINICANA: PARTICIPACIÓN DE LAS EMPRESAS
E ÍNDICES DE CONCENTRACIÓN EN LA IMPORTACIÓN Y REFINACIÓN DE
DERIVADOS LÍQUIDOS, 2012
Participación de las empresas (En porcentajes )
24
Cuadros típicos
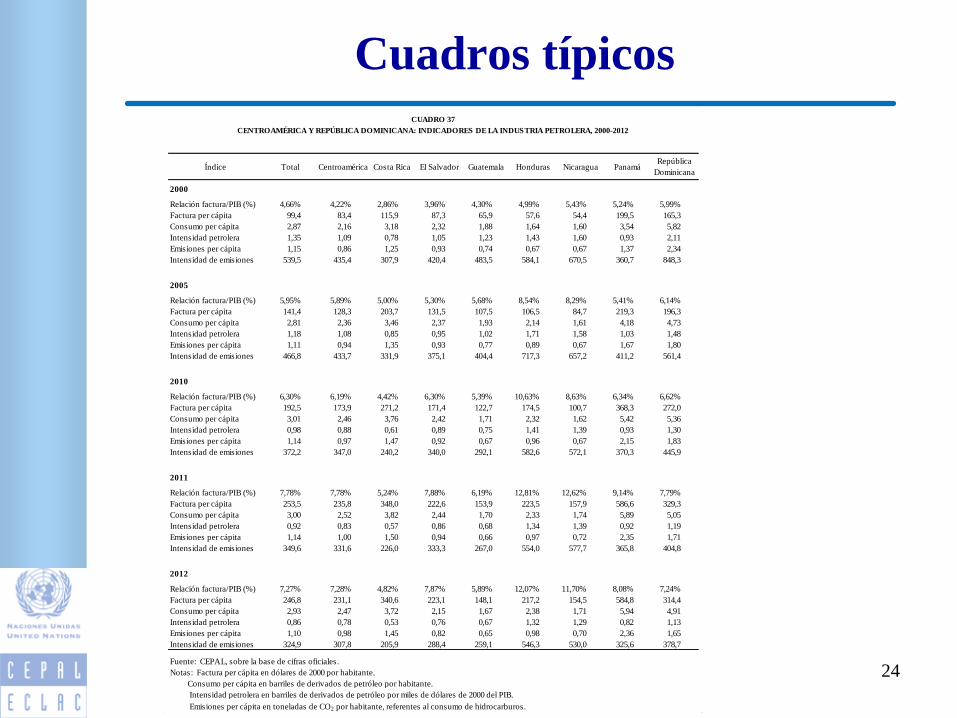
Índice Total Centroamérica Costa Rica El Salvador Guatemala Honduras Nicaragua PanamáRepública
Dominicana
2000
Relación factura/PIB (%) 4,66% 4,22% 2,86% 3,96% 4,30% 4,99% 5,43% 5,24% 5,99%
Factura per cápita 99,4 83,4 115,9 87,3 65,9 57,6 54,4 199,5 165,3
Consumo per cápita 2,87 2,16 3,18 2,32 1,88 1,64 1,60 3,54 5,82
Intensidad petrolera 1,35 1,09 0,78 1,05 1,23 1,43 1,60 0,93 2,11
Emisiones per cápita 1,15 0,86 1,25 0,93 0,74 0,67 0,67 1,37 2,34
Intensidad de emisiones 539,5 435,4 307,9 420,4 483,5 584,1 670,5 360,7 848,3
2005
Relación factura/PIB (%) 5,95% 5,89% 5,00% 5,30% 5,68% 8,54% 8,29% 5,41% 6,14%
Factura per cápita 141,4 128,3 203,7 131,5 107,5 106,5 84,7 219,3 196,3
Consumo per cápita 2,81 2,36 3,46 2,37 1,93 2,14 1,61 4,18 4,73
Intensidad petrolera 1,18 1,08 0,85 0,95 1,02 1,71 1,58 1,03 1,48
Emisiones per cápita 1,11 0,94 1,35 0,93 0,77 0,89 0,67 1,67 1,80
Intensidad de emisiones 466,8 433,7 331,9 375,1 404,4 717,3 657,2 411,2 561,4
2010
Relación factura/PIB (%) 6,30% 6,19% 4,42% 6,30% 5,39% 10,63% 8,63% 6,34% 6,62%
Factura per cápita 192,5 173,9 271,2 171,4 122,7 174,5 100,7 368,3 272,0
Consumo per cápita 3,01 2,46 3,76 2,42 1,71 2,32 1,62 5,42 5,36
Intensidad petrolera 0,98 0,88 0,61 0,89 0,75 1,41 1,39 0,93 1,30
Emisiones per cápita 1,14 0,97 1,47 0,92 0,67 0,96 0,67 2,15 1,83
Intensidad de emisiones 372,2 347,0 240,2 340,0 292,1 582,6 572,1 370,3 445,9
2011
Relación factura/PIB (%) 7,78% 7,78% 5,24% 7,88% 6,19% 12,81% 12,62% 9,14% 7,79%
Factura per cápita 253,5 235,8 348,0 222,6 153,9 223,5 157,9 586,6 329,3
Consumo per cápita 3,00 2,52 3,82 2,44 1,70 2,33 1,74 5,89 5,05
Intensidad petrolera 0,92 0,83 0,57 0,86 0,68 1,34 1,39 0,92 1,19
Emisiones per cápita 1,14 1,00 1,50 0,94 0,66 0,97 0,72 2,35 1,71
Intensidad de emisiones 349,6 331,6 226,0 333,3 267,0 554,0 577,7 365,8 404,8
2012
Relación factura/PIB (%) 7,27% 7,28% 4,82% 7,87% 5,89% 12,07% 11,70% 8,08% 7,24%
Factura per cápita 246,8 231,1 340,6 223,1 148,1 217,2 154,5 584,8 314,4
Consumo per cápita 2,93 2,47 3,72 2,15 1,67 2,38 1,71 5,94 4,91
Intensidad petrolera 0,86 0,78 0,53 0,76 0,67 1,32 1,29 0,82 1,13
Emisiones per cápita 1,10 0,98 1,45 0,82 0,65 0,98 0,70 2,36 1,65
Intensidad de emisiones 324,9 307,8 205,9 288,4 259,1 546,3 530,0 325,6 378,7
Notas: Factura per cápita en dólares de 2000 por habitante.
Consumo per cápita en barriles de derivados de petróleo por habitante.
Intensidad petrolera en barriles de derivados de petróleo por miles de dólares de 2000 del PIB.
Emisiones per cápita en toneladas de CO2 por habitante, referentes al consumo de hidrocarburos.
CUADRO 37
CENTROAMÉRICA Y REPÚBLICA DOMINICANA: INDICADORES DE LA INDUSTRIA PETROLERA, 2000-2012
Fuente: CEPAL, sobre la base de cifras oficiales.

25
Gráficos típicos
Fuente: CEPAL, sobre la base de cifras oficiales.
GRÁFICO 27
CENTROAMÉRICA Y REPÚBLICA DOMINICANA: EVOLUCIÓN DE LAS VENTAS
DE GASOLINA Y DIESEL POR ESTACIÓN DE SERVICIO, 2002-2012
(En miles de barriles/año)
0
5
10
15
20
25
30
35
2002 2003 2004 2005 2006 2007 2008 2009 2010 2011 2012
Costa Rica El Salvador Guatemala Honduras
Nicaragua Panamá Rep Dominicana

Electricity

27
Estadísticas Electricidad
• Se publican dos documentos anualmente del subsector eléctrico:
un informe de producción y un informe estadístico completo.
• La cobertura geográfica incluye 6 países: Costa Rica, El Salvador,
Guatemala, Honduras, Nicaragua y Panamá.
• La fuente de información son diversas instituciones que incluyen
a operadores y reguladores, nacionales y regionales.
• La información recopilada para la elaboración del reporte incluye:
Capacidad de generación, Generación neta, Cobertura Energía
disponible
Ventas de electricidad, Tarifas, Usuarios
Transacciones internacionales

28
Información presentada
• El informe se divide en ocho secciones:
Breve recuento de hechos relevantes
Resumen de la evolución reciente de la industria, incluye los precios
finales de la electricidad para los principales grupos de consumidores
Sección de estadísticas para cada país que incluye:
Oferta-demanda de potencia y energía
Evolución de la capacidad instalada y la generación neta
Empresas eléctricas
Índice de electrificación
Evolución del número de usuarios y consumo medio de electricidad
Evolución de las ventas por sector de consumo

29
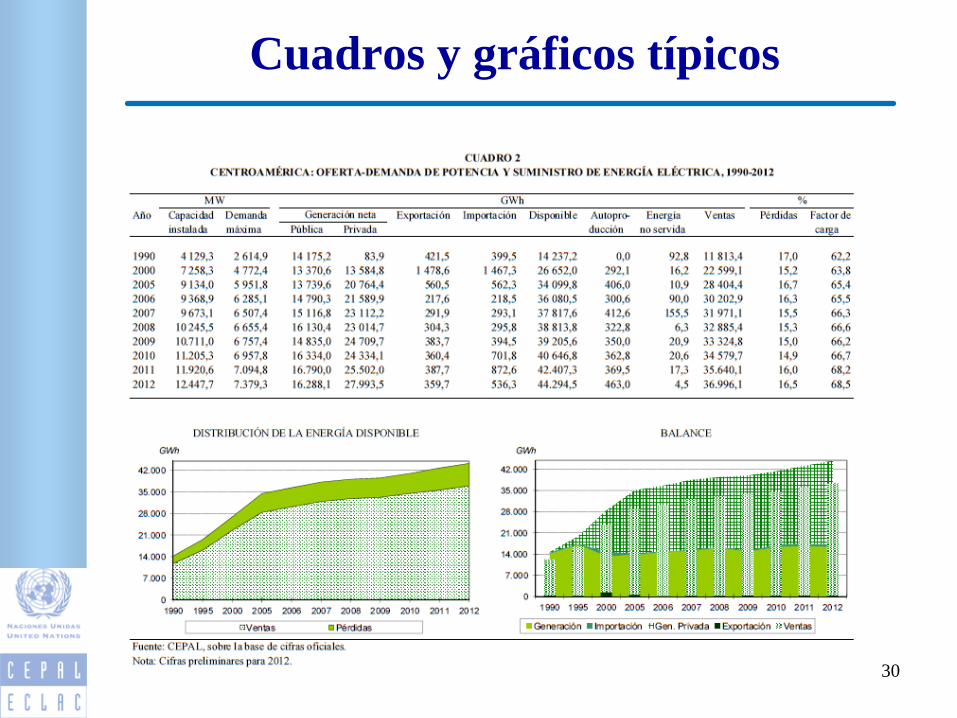
Cuadros y gráficos típicos
30
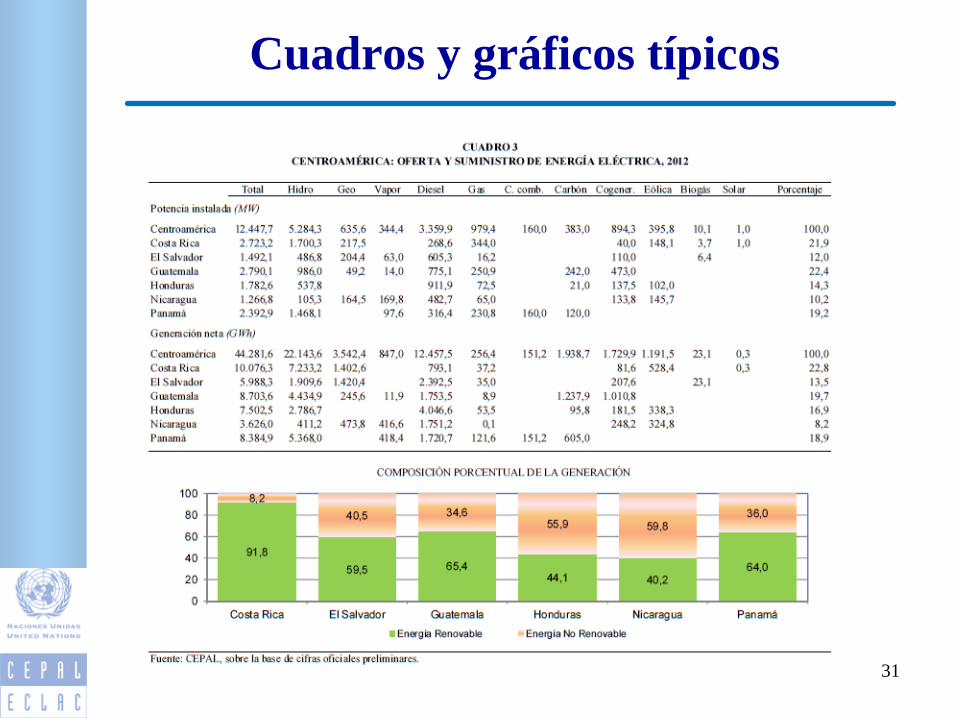
Cuadros y gráficos típicos
31
Cuadros y gráficos típicos

32
Cuadros y gráficos típicos

33
Cuadros y gráficos típicos

34
Cuadros y gráficos típicos
35
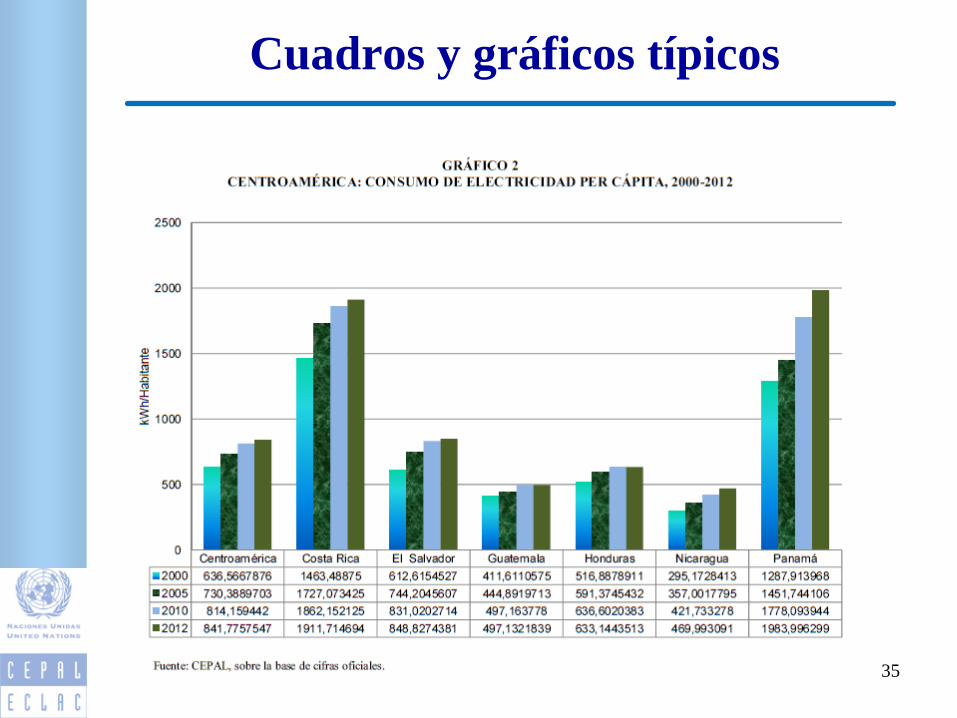
Cuadros y gráficos típicos
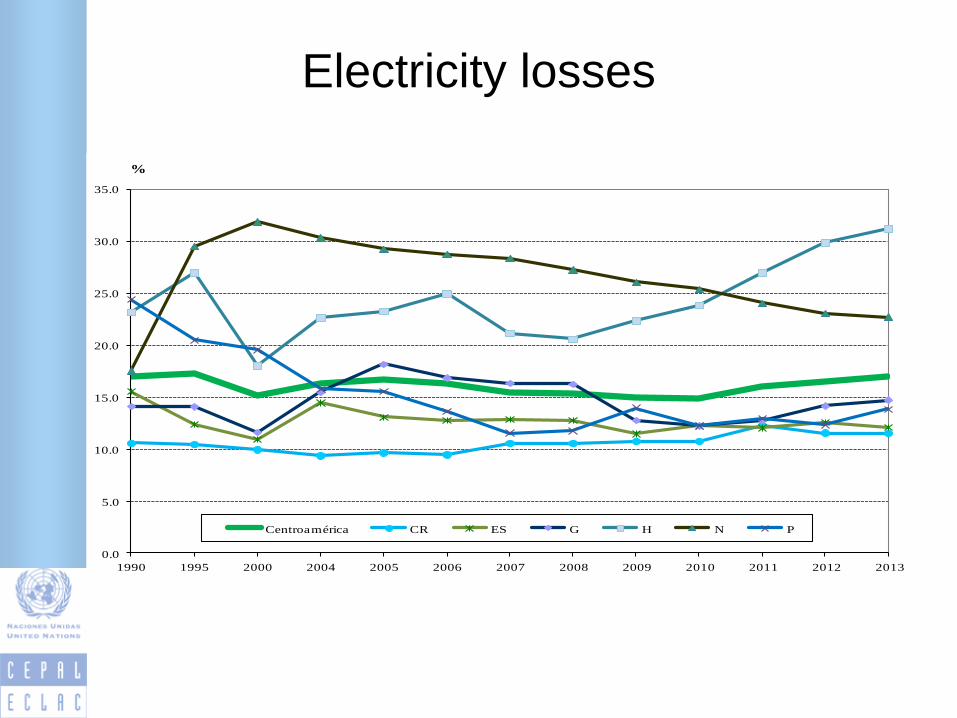
Electricity losses
0.0
5.0
10.0
15.0
20.0
25.0
30.0
35.0
1990 1995 2000 2004 2005 2006 2007 2008 2009 2010 2011 2012 2013
%
Centroamérica CR ES G H N P
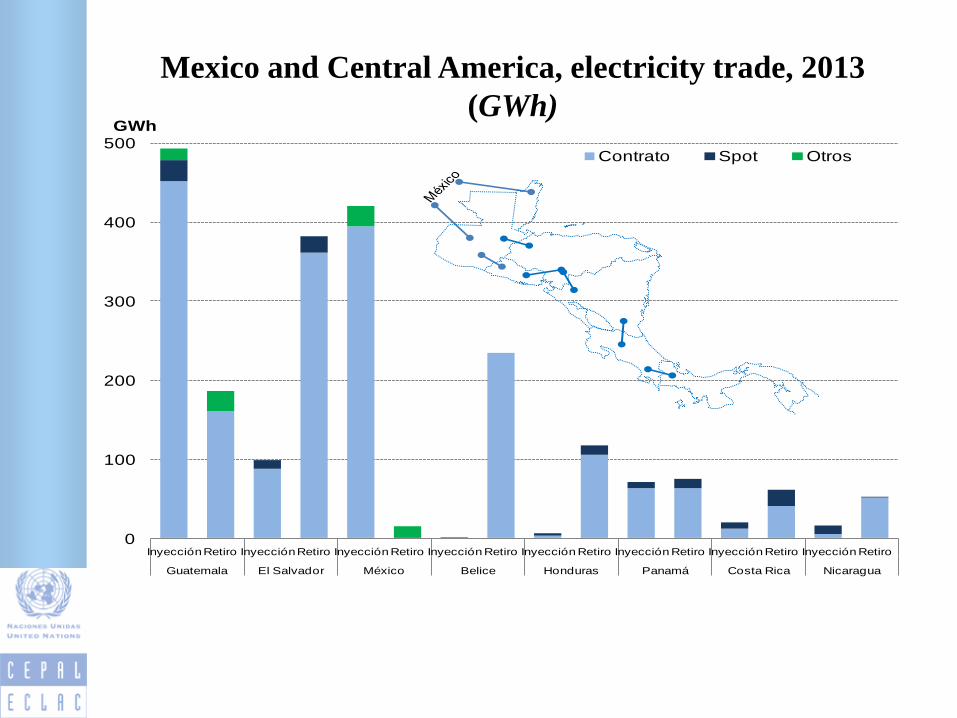
0
100
200
300
400
500
InyecciónRetiro InyecciónRetiro Inyección Retiro Inyección Retiro Inyección Retiro Inyección Retiro Inyección Retiro Inyección Retiro
Guatemala El Salvador México Belice Honduras Panamá Costa Rica Nicaragua
GWh
Contrato Spot Otros
Mexico and Central America, electricity trade, 2013
(GWh)


Programa BIEE: Objetivos
• Desarrollar una herramienta de información para evaluar políticas y programas nacionales de EE
• Fortalecer capacidades locales
• Promover la comparabilidad o benchmark(agregada, sectorial y por rama industrial…)
• Definir una línea de base común para la medición de la EE (importante para SE4ALL)
• Motivar la madurez en la implementación de políticas de EE a través del monitoreo, medición y la estandarización
• Dinamización regional en materia de EE (metas conjuntas, posicionamiento regional como bloque en foros, etc.)

Programa BIEE: Actividades
1. Realización de talleres (presentación del “template”, compilación de información, recolección y estimación, propuesta de indicadores, reportes nacionales)
2. Recolección de datos homogéneos según definición y niveles de desagregación
3. Conformación de una base de datos nacional de indicadores de eficiencia energética
4. Realización del Informe Nacional de Monitoreo de la Eficiencia Energética a nivel Nacional con el análisis de las tendencias, su interpretación y explicación.
5. Website y Red de funcionarios y expertos

• Cooperación Técnica Internacional: ADEME
(Francia) / GIZ
• Países participantes: • América del Sur: Argentina, Bolivia, Brasil, Chile, Paraguay y
Uruguay, Perú, Ecuador, Colombia, Venezuela (8 talleres
realizados)
• Mesoamérica: Costa Rica, El Salvador, Guatemala, México y
Panamá, Honduras, Nicaragua, R. Dominicana (5 talleres
realizados)
• Sectores: Macro, Energía, Transporte, Industria,
Residencial, Agricultura, Servicios
• Otros organismos participantes: OLADE / SEE4ALL
• Dirección del proyecto: Comité Directivo presidido
por CEPAL y ADEME
• Estructura Operativa: Coordinación Técnica del
Proyecto, Coordinación Nacional, Equipos Nacionales
Estructura del Proyecto

Data Mapper• http://www.biee-cepal.enerdata.eu/

!