energy consumption optimization of reverse osmosis...
TRANSCRIPT

Energy Consumption Optimization of Reverse Osmosis Membrane WaterDesalination Subject to Feed Salinity Fluctuation
Aihua Zhu, Panagiotis D. Christofides,* and Yoram Cohen
Department of Chemical and Biomolecular Engineering, Water Technology Research Center, UniVersity ofCaliforniasLos Angeles, Los Angeles, California 90095-1592
We study the energy consumption optimization of a reverse osmosis water desalination process producing aconstant permeate flow in the presence of feed concentration fluctuation. We propose a time-varying optimaloperation strategy that can significantly reduce the specific energy consumption compared to time-invariantprocess operation. We present both computational and experimental results that demonstrate the effectivenessof the proposed optimal operation policy.
1. Introduction
Reverse osmosis (RO) membrane water desalination is nowa well established water desalination technology. The waterproduction cost in a typical RO desalination plant generallyconsists of the cost of energy consumption, equipment, mem-branes, labor, maintenance, and financial charges. Energyconsumption is a major portion of the total cost of waterdesalination and can reach as high as about 45% of the totalpermeate production cost.1-3 The energy cost per volume ofproduced permeate (i.e., the specific energy consumption orSEC) is significant in RO operation due to the high pressurerequirement (up to about 1000 psi for seawater and in the rangeof 100-600 psi for brackish water desalting). Considerableeffort, dating back to the initial days of RO development in theearly 1960s has been devoted to minimizing the specific energyconsumption of water desalination.4 More recently, the introduc-tion of highly permeable membranes in the mid 1990s with lowsalt passage5 has generated considerable interest,4,6-8 given theirpotential for reducing the energy required to attain a givenpermeate flow, since the operating pressure can be greatlyreduced to approach the osmotic pressure difference at the exitof a membrane module (See Figure 1).
In a previous work,4 we systematically studied the effect ofthe thermodynamic restriction (i.e., the fact that the appliedpressure cannot be lower than the osmotic pressure of the exitbrine stream plus pressure losses across the membrane module)on the optimization of the specific energy consumption of anRO process. Specifically, we computed the optimum SEC,corresponding water recovery, and permeate flux for single-stage and two-stage RO membrane desalination systems. Wealso studied the effect of energy recovery device, membranecost, and brine disposal costs on SEC. The developed approachcan also be utilized to evaluate the energy savings of a two-stage RO system over single-stage RO and the impact of extramembrane area consumption of two-stage over single-stage.Following up on this work, we carried out a systematic study6
of the energy consumption of two-pass reverse osmosis mem-brane water desalination accounting for key practical issues likemembrane salt rejection, presence/absence of energy recoverydevices, and thermodynamic restriction. We established that ifthe salt rejection level of the available membranes can achievethe desired permeate salt content, then a single-pass configu-ration is more energy favorable than a two-pass configuration
for the same level of total water recovery and salt rejection.However, if it is not possible to obtain the desired permeatesalt content with the available membranes, then a two-passconfiguration has to be used, and in this case, the energy optimalsolution is to operate the first-pass using the membranes withthe maximum rejection. The computation of the water recoveriesfor the first-pass and the second-pass that minimize energyconsumption were explicitly computed for this case. Ourconclusions on the energy consumption comparison betweensingle-pass and two-pass hold when the applied pressure is closeto or well above the limit imposed by the thermodynamic cross-flow restriction and also in the presence/absence of energyrecovery devices.
In the present work, we extend our previous results to accountfor the effect of feed salinity fluctuation on energy consumptionoptimization. Due to seasonal rainfalls, the feedwater salinitymay fluctuate both for seawater and brackish water desalination.For example, at one location in the central San Joaquin Valley,the total dissolved solids (TDS) content deviated up to 52%from its annual average.9 The objective of the present work isto determine the optimal time-varying operating policy toproduce a constant permeate flow in the presence of feed salinityfluctuation. Specifically, we propose a time-varying optimaloperation policy that can significantly reduce the specific energyconsumption compared to time-invariant process operation. Wepresent a series of computational and experimental results thatdemonstrate the applicability and potential in terms of energysavings of the proposed time-varying optimal operation policy.The operating points located in this work can be used as the
* Corresponding author. Tel: 310-794-1015. Fax: 310-206-4107.E-mail: [email protected].
Figure 1. Schematic illustration of the RO system pressure approachingthe thermodynamic restriction for cross-flow RO desalting when highlypermeable membranes are used.
Ind. Eng. Chem. Res. 2009, 48, 9581–9589 9581
10.1021/ie900729x CCC: $40.75 2009 American Chemical SocietyPublished on Web 06/18/2009
Dow
nloa
ded
by U
OF
CA
LIF
OR
NIA
LO
S A
NG
EL
ES
on O
ctob
er 2
8, 2
009
| http
://pu
bs.a
cs.o
rg
Pub
licat
ion
Dat
e (W
eb):
Jun
e 18
, 200
9 | d
oi: 1
0.10
21/ie
9007
29x

set point for control purpose in reverse osmosis desalinationsystems.10-12
2. Preliminaries
2.1. RO Process Description and Modeling. In order toillustrate the proposed approach to energy cost minimization,it is instructive to consider a membrane RO process withoutthe deployment of an energy recovery device (ERD), as shownschematically in Figure 2.
The energy cost for RO desalination is evaluated in thepresent analysis as the specific energy consumption (SEC)defined as the electrical energy needed to produce a cubic meterof permeate. Pump efficiency can be addressed in the followinganalysis in a straightforward fashion as presented in ref 4. Asa first step, however, in order to simplify the presentation ofthe approach, the required electrical energy is assumed to beequal to the pump work (i.e., assuming a pump efficiency of100%). Accordingly, the SEC for the plant shown in Figure 2is given by
where Qp is the permeate flow rate and Wpump is the rate ofwork done by the pump, given by
in which
where Pf is the feed pressure at the entrance of the membranemodule, P0 is the pressure of the raw water, which is assumed(for simplicity) to be the same as the permeate pressure, and Qf
is the volumetric feed flow rate.The permeate product water recovery for the RO process, Y,
is an important indicator of the process productivity, definedas
and combining eqs 1, 2, and 4, the SEC can be rewritten asfollows:
The permeate flow rate is approximated by the classicalreverse osmosis flux equation13
where Am is the active membrane surface area, Lp is themembrane hydraulic permeability, σ is the reflection coefficient(typically assumed to be about unity for high rejection ROmembranes and in this study σ ) 1), ∆P is the transmembranepressure, ∆π is the average osmotic pressure difference betweenthe retentate (brine) and permeate (product) stream along themembrane module, ∆P - σ∆π is the average transmembranenet driving pressure, designated as NDP. In order to simplifythe analysis, we initially assume that the effect of the pressuredrop (within the RO module) on locating the minimum SEC isnegligible; this issue is addressed in more details in ref 4. It isimportant to recognize that fouling and scaling will impact theselection of practical RO process operating conditions and feedpretreatment. However, the inclusion of such effects is beyondthe scope of the present paper. We also invoke the typicalapproximation in ref 13 that the osmotic pressure varies linearlywith concentration (i.e., π ) fosC, where fos is the osmoticpressure coefficient and C is the solution salt concentration).For the purpose of the present work and motivated by our focuson RO processes that utilize highly permeable membranes, theaverage osmotic pressure difference (up to the desired level ofproduct water recovery), ∆π, can be approximated as the so-called log-mean average along the membrane as follows14
where Cf is the salt concentration of the feed to the inlet of themembrane module. The osmotic pressures at the entrance andthe exit of the membrane module, relative to the permeatestream, can be approximated by
where Cr is the salt concentration of the exit brine (i.e., retenate)stream. For sufficiently high rejection level, the osmotic pressureof the permeate can be taken to be negligible relative to thefeed or concentrate streams and Cr can be approximated by
Thus, by combining eqs 8-10, the osmotic pressure differ-ence between the brine and permeate stream at the exit of themodule can be expressed as
where π0 ) fosCf is the feed osmotic pressure. Equation 11represents the well-known inherent limitation to reaching highrecovery in RO desalination due to the rapid increase in osmoticpressure with increased water recovery. This limitation impliesthat in order to ensure permeate productivity, along the entiremembrane module, the following lower bound has to be imposedon the applied pressure:
Equation 12 indicates that, for a given target recovery, Y,the applied pressure should not be less than the osmotic pressuredifference at the module exit. The above inequality is the so-called “thermodynamic restriction” of cross-flow membrane
Figure 2. Schematic of a simplified RO system.
SEC )Wpump
Qp(1)
Wpump ) ∆P*Qf (2)
∆P ) Pf - P0 (3)
Y )Qp
Qf(4)
SEC ) ∆PY
(5)
Qp ) AmLp(∆P - σ∆π) ) AmLp(NDP) (6)
∆π ) fosCf
ln( 11 - Y)
Y(7)
∆πentrance ) fosCf - πp (8)
∆πexit ) fosCr - πp (9)
Cr )Cf
1 - Y(10)
∆πexit )π0
1 - Y(11)
∆P g ∆πexit )π0
1 - Y(12)
9582 Ind. Eng. Chem. Res., Vol. 48, No. 21, 2009
Dow
nloa
ded
by U
OF
CA
LIF
OR
NIA
LO
S A
NG
EL
ES
on O
ctob
er 2
8, 2
009
| http
://pu
bs.a
cs.o
rg
Pub
licat
ion
Dat
e (W
eb):
Jun
e 18
, 200
9 | d
oi: 1
0.10
21/ie
9007
29x
desalting.5,8 When considering the above inequality, it isimportant to recognize that the osmotic pressure at the exit forthe bulk solution is the same as at the membrane surface. Theabove can be understood by considering the simple film modelfor the concentration polarization module,13 CP ) Cm/Cb )exp(J/k), where Cm and Cb are the salt concentrations at themembrane surface and the bulk solution respectively, J is thepermeate flux and k is the feed-side mass transfer coefficient.Clearly, J will vanish when the thermodynamic restriction limitis reached at the exit and therefore at that limit CP ) 1 (i.e.,Cm ) Cb).
2.2. Energy Cost Optimization for a Single-Stage ROwithout an Energy Recovery Device. The specific energyconsumption (SEC) for the RO desalting process can be derivedby combining eqs 1-4 and 12, to obtain
where SEC is in pressure units. It is convenient to normalizethe SEC, at the limit of thermodynamic restriction, with respectto the feed osmotic pressure such that
In order to locate the analytical global minimum SECtr,norm,with respect to the water recovery, one can set dSECtr,norm/dY) 0, from which it shows that the minimum SECtr,norm occursat a fractional recovery of Y ) 0.5 (or 50%) where (SECtr,norm)min
) 4 (i.e., four times the feed osmotic pressure). The abovecondition, i.e., (SECtr,norm)min ) 4 at Y ) 0.5, represents theglobal minimum SEC (the equality in eq 13). In order toachieve this global minimum energy cost, the RO process shouldbe operated at a water recovery of 50% with an applied pressureof 2π0 (i.e., double that of the feed osmotic pressure).
3. Optimal Operation Policy for Energy Optimization
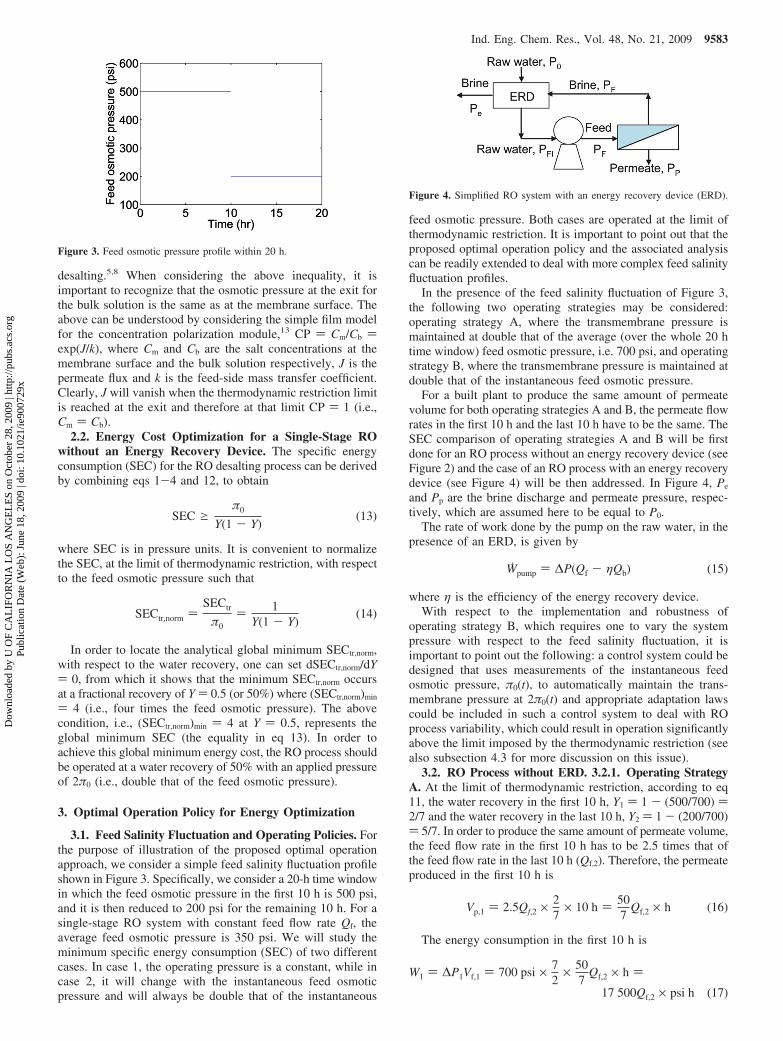
3.1. Feed Salinity Fluctuation and Operating Policies. Forthe purpose of illustration of the proposed optimal operationapproach, we consider a simple feed salinity fluctuation profileshown in Figure 3. Specifically, we consider a 20-h time windowin which the feed osmotic pressure in the first 10 h is 500 psi,and it is then reduced to 200 psi for the remaining 10 h. For asingle-stage RO system with constant feed flow rate Qf, theaverage feed osmotic pressure is 350 psi. We will study theminimum specific energy consumption (SEC) of two differentcases. In case 1, the operating pressure is a constant, while incase 2, it will change with the instantaneous feed osmoticpressure and will always be double that of the instantaneous
feed osmotic pressure. Both cases are operated at the limit ofthermodynamic restriction. It is important to point out that theproposed optimal operation policy and the associated analysiscan be readily extended to deal with more complex feed salinityfluctuation profiles.
In the presence of the feed salinity fluctuation of Figure 3,the following two operating strategies may be considered:operating strategy A, where the transmembrane pressure ismaintained at double that of the average (over the whole 20 htime window) feed osmotic pressure, i.e. 700 psi, and operatingstrategy B, where the transmembrane pressure is maintained atdouble that of the instantaneous feed osmotic pressure.
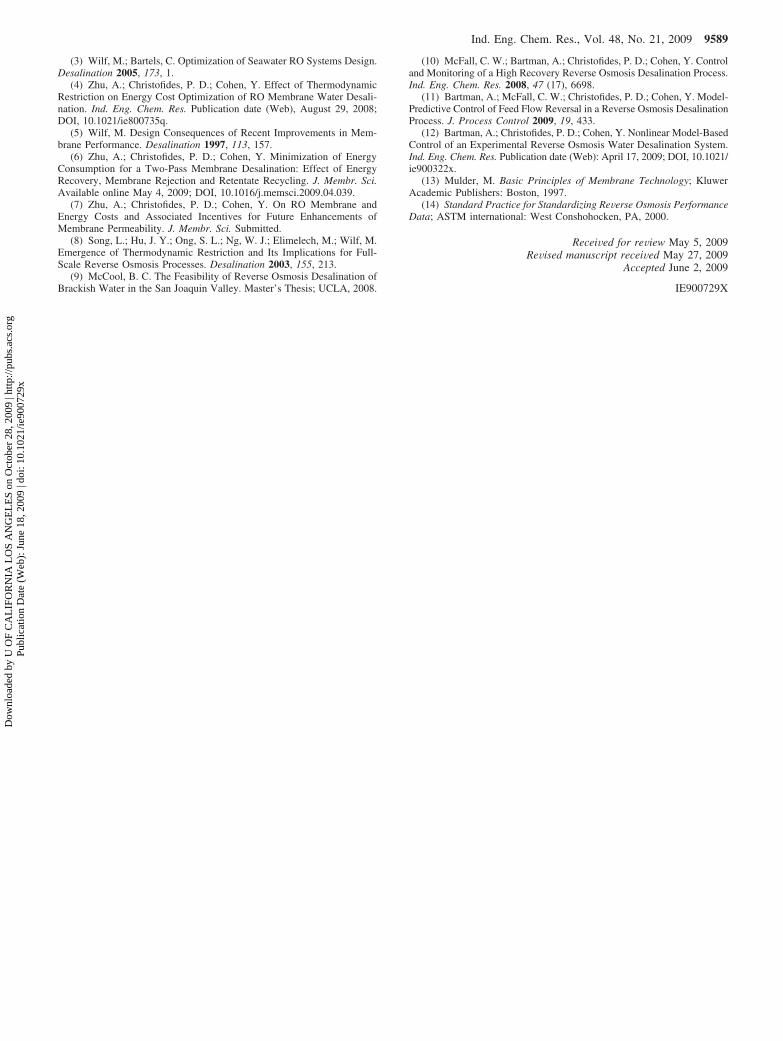
For a built plant to produce the same amount of permeatevolume for both operating strategies A and B, the permeate flowrates in the first 10 h and the last 10 h have to be the same. TheSEC comparison of operating strategies A and B will be firstdone for an RO process without an energy recovery device (seeFigure 2) and the case of an RO process with an energy recoverydevice (see Figure 4) will be then addressed. In Figure 4, Pe
and Pp are the brine discharge and permeate pressure, respec-tively, which are assumed here to be equal to P0.
The rate of work done by the pump on the raw water, in thepresence of an ERD, is given by
where η is the efficiency of the energy recovery device.With respect to the implementation and robustness of
operating strategy B, which requires one to vary the systempressure with respect to the feed salinity fluctuation, it isimportant to point out the following: a control system could bedesigned that uses measurements of the instantaneous feedosmotic pressure, π0(t), to automatically maintain the trans-membrane pressure at 2π0(t) and appropriate adaptation lawscould be included in such a control system to deal with ROprocess variability, which could result in operation significantlyabove the limit imposed by the thermodynamic restriction (seealso subsection 4.3 for more discussion on this issue).
3.2. RO Process without ERD. 3.2.1. Operating StrategyA. At the limit of thermodynamic restriction, according to eq11, the water recovery in the first 10 h, Y1 ) 1 - (500/700) )2/7 and the water recovery in the last 10 h, Y2 ) 1 - (200/700)) 5/7. In order to produce the same amount of permeate volume,the feed flow rate in the first 10 h has to be 2.5 times that ofthe feed flow rate in the last 10 h (Qf,2). Therefore, the permeateproduced in the first 10 h is
The energy consumption in the first 10 h is
Figure 3. Feed osmotic pressure profile within 20 h.
SEC gπ0
Y(1 - Y)(13)
SECtr,norm )SECtr
π0) 1
Y(1 - Y)(14)
Figure 4. Simplified RO system with an energy recovery device (ERD).
Wpump ) ∆P(Qf - ηQb) (15)
Vp,1 ) 2.5Qf,2 × 27
× 10 h ) 507
Qf,2 × h (16)
W1 ) ∆P1Vf,1 ) 700 psi × 72
× 507
Qf,2 × h )
17 500Qf,2 × psi h (17)
Ind. Eng. Chem. Res., Vol. 48, No. 21, 2009 9583
Dow
nloa
ded
by U
OF
CA
LIF
OR
NIA
LO
S A
NG
EL
ES
on O
ctob
er 2
8, 2
009
| http
://pu
bs.a
cs.o
rg
Pub
licat
ion
Dat
e (W
eb):
Jun
e 18
, 200
9 | d
oi: 1
0.10
21/ie
9007
29x

Similarly, the permeate produced in the last 10 h is
which is the same as the permeate volume in the first 10 h asrequired in this scenario. The energy consumption in the last10 h is
Therefore, the average SEC for strategy A is
which can be converted into 11 824 kJ/m3, meaning that 11 824kJ of energy is needed to produce 1 m3 of permeate by adoptingoperating strategy A.
3.2.2. Operating Strategy B. The water recovery in the last10 h is the same as the water recovery in the first 10 h (both at50%). In order to produce the same amount of permeate volume,the feed flow rate in the first 10 h should be the same as thefeed flow rate in the last 10 h (Qf,2′). The permeate produced inthe first 10 h is
The energy consumption in the first 10 h is:
Similarly, the permeate produced in the last 10 h is
which is the same as the permeate volume in the first 10 h, asrequired in this scenario. The energy consumption in the last10 h is
Therefore, the average SEC for strategy B is
which can be converted into 9652 kJ/m3, meaning that 9652kJ of energy is needed to produce 1 m3 of permeate by adoptingoperating strategy B.
From eqs 20 and 25, we see that the operating strategy Ahas a higher SEC than operating strategy B by about 22.5%[(1715 - 1400)/1400 ) 22.5%]. Furthermore, in order to equatethe total permeate volume in operating strategies A and B, Qf,2′) 10/7Qf,2. Thus, the total feed volume in operating strategy Bis 2 × 10/7Qf,2 ) 20/7Qf,2, while the total feed volume inoperating strategy A is (2.5 + 1)Qf,2 ) 3.5Qf,2. Therefore, inorder to get the same amount of permeate volume, operatingstrategy A requires a higher amount of feedwater, and thus, ithas a lower overall water recovery.
3.3. RO Process with ERD of 100% Efficiency. 3.3.1. Op-erating Strategy A. The water recovery in the last 10 h is 2.5times that of the water recovery in the first 10 h. In order toproduce the same amount of permeate volume, the feed flowrate in the first 10 h has to be 2.5 times that of the feed flowrate in the last 10 h (Qf,2). Therefore, the permeate produced inthe first 10 h is
The energy consumption in the first 10 h is
Similarly, the permeate produced in the last 10 h is
which is the same as the permeate volume in the first 10 h asrequired in this scenario. The energy consumption in the last10 h is
Therefore, the average SEC is
which can be converted into 4826 kJ/m3, meaning that 4826kJ of energy is needed to produce 1 m3 of permeate by adoptingoperating strategy A.
3.3.2. Operating Strategy B. We now turn our attention tooperating strategy B. In this strategy, the operating pressure willalways be double that of the instantaneous feed osmotic pressure;therefore, the water recovery in the last 10 h is the same as thewater recovery in the first 10 h. In order to produce the sameamount of permeate volume, the feed flow rate in the first 10 hhas to be the same as that of the feed flow rate in the last 10 h(Qf,2′). The permeate produced in the first 10 h is
The energy consumption in the first 10 h is
Similarly, the permeate produced in the last 10 h is
which is the same as the permeate volume in the first 10 h, asrequired in this scenario. The energy consumption in the last10 h is
Therefore, the average SEC is
Vp,2 ) Qf,2 × 57
× 10 h ) 507
Qf,2 × h (18)
W2 ) ∆P2Vp,2 ) 700 psi × 75
× 507
Qf,2 × h )
7000Qf,2 × psi h (19)
SECA )W1 + W2
Vp,1 + Vp,2)
(17500 + 7000) × Qf,2 × psi h
(50/7 + 50/7) × Qf,2 × h)
1715 psi (20)
Vp,1′ ) Qf,2′ × 12
× 10 h ) 5Qf,2′ × h (21)
W1′ ) ∆P1′Vf,1′ ) 2 × 500 psi × 2 × 5Qf,2′ × h )10 000Qf,2′ × psi h (22)
Vp,2′ ) Qf,2′ × 12
× 10 h ) 5Qf,2′ × h (23)
W2′ ) ∆P2′Vf,2′ ) 2 × 200 psi × 2 × 5Qf,2′ × h )4000Qf,2′ × psi h (24)
SECB )W1′ + W2′
Vp,1′ + Vp,2′)
(10 000 + 4000)Qf,2′ × psi h
(5 + 5)Qf,2′ × h)
1400 psi (25)
Vp,1 ) 2.5Qf,2 × 27
× 10 h ) 507
Qf,2 × h (26)
W1ERD ) ∆P1Vp,1 ) 700 psi × 50
7Qf,2 × h ) 5000Qf,2 × psi h
(27)
Vp,2 ) Qf,2 × 57
× 10 h ) 507
Qf,2 × h (28)
W2ERD ) ∆P2Vp,2 ) 700 psi × 50
7Qf,2 × h ) 5000Qf,2 × psi h
(29)
SECA )W1
ERD + W2ERD
Vp,1 + Vp,2)
(5000 + 5000)Qf,2 × psi h
(50/7 + 50/7)Qf,2 × h)
700 psi (30)
Vp,1′ ) Qf,2′ × 12
× 10 h ) 5Qf,2′ × h (31)
W1ERD′ ) ∆P1′Vp,1′ ) 2 × 500 psi × 5Qf,2′ × h )
5000Qf,2′ × psi h (32)
Vp,2′ ) Qf,2′ × 12
× 10 h ) 5Qf,2′ × h (33)
W2ERD′ ) ∆P2Vp,2′ ) 2 × 200 psi × 5Qf,2′ × h )
2000Qf,2′ × psi h (34)
9584 Ind. Eng. Chem. Res., Vol. 48, No. 21, 2009
Dow
nloa
ded
by U
OF
CA
LIF
OR
NIA
LO
S A
NG
EL
ES
on O
ctob
er 2
8, 2
009
| http
://pu
bs.a
cs.o
rg
Pub
licat
ion
Dat
e (W
eb):
Jun
e 18
, 200
9 | d
oi: 1
0.10
21/ie
9007
29x

which can be converted into 4826 kJ/m3, meaning that 4826kJ of energy is needed to produce 1 m3 of permeate by adoptingoperating strategy B.
From eqs 30 and 35, we see that in the presence of an ERDwith a 100% efficiency, operating strategies A and B have thesame SEC. Furthermore, in order to equate the total permeatevolume in operating strategies A and B, Qf,2′ ) 10/7Qf,2. Thus,the total feed volume in operating strategy B is 2 × 10/7Qf,2 )20/7Qf,2, while the total feed volume in operating strategy A is(2.5 + 1)Qf,2 ) 3.5Qf,2. Therefore, in order to get the sameamount of permeate volume, operating strategy A requires ahigher amount of feedwater, and thus, it has a lower overallwater recovery.
3.4. Effect of ERD Efficiency. In this subsection, we studythe effect of ERD efficiency on the optimal operation policysubject to the feed salinity fluctuation. Similarly, two operatingstrategies A (constant pressure operation) and B (time-varyingpressure operation) are compared to determine the effectivenessof strategy B.
3.4.1. Operating Strategy A. The water recovery in the last10 h is 2.5 times that of the water recovery in the first 10 h. Inorder to produce the same amount of permeate volume, the feedflow rate in the first 10 h has to be 2.5 times the feed flow ratein the last 10 h (Qf,2). Therefore, the permeate produced in thefirst 10 h is
The energy consumption in the first 10 h is
Similarly, the permeate produced in the last 10 h is
which is the same as the permeate volume in the first 10 h, asrequired in this scenario. The energy consumption in the last10 h is
Therefore, the average SEC is
which will reduce to 700 psi (eq 30) when η ) 1 (subsection3.3).
3.4.2. Operating Strategy B. The water recovery in the last10 h is the same as the water recovery in the first 10 h. In orderto produce the same amount of permeate volume, the feed flowrate in the first 10 h has to be the same as that of the feed flow
rate in the last 10 h (Qf,2′). Therefore, the permeate producedin the first 10 h is
The energy consumption in the first 10 h is
Similarly, the permeate produced in the last 10 h is
which is the same as the permeate volume in the first 10 h, asrequired in this scenario. The energy consumption in the last10 h is
Therefore, the average SEC is
which will reduce to 700 psi (eq 35) when η ) 1 (subsection3.3).
The SEC difference between operating strategies A and B is(1715 - 1015η) - 700(2 - η) psi ) 315(1 - η) psi. Thus,when 0 < η < 1, the SEC of operating strategy A will be alwaysgreater than the SEC of operating strategy B. The fractionalSEC increase is
which is plotted in Figure 5. For example, when the ERDefficiency is 90%, the fractional SEC increase is 4.1%.Furthermore, in order to equate the total permeate volume inoperating strategy A and operating strategy B, Qf,2′ ) 10/7Qf,2.
SECB )W1
ERD′+W2ERD′
Vp,1′ + Vp,2′)
(2000 + 5000)Qf,2′ × psi h
(5 + 5)Qf,2′ × h)
700 psi (35)
Vp,1 ) 2.5Qf,2 × 27
× 10 h ) 507
Qf,2 × h (36)
W1ERD ) ∆P1(Vf,1 - η(Vf,1 - Vp,1)) ) 700 psi ×
(25 - 1257
η)Qf,2 × h ) (17 500 - 12 500η)Qf,2 × psi h
(37)
Vp,2 ) Qf,2 × 57
× 10 h ) 507
Qf,2 × h (38)
W2ERD ) ∆P2(Vf,2 - η(Vf,2 - Vp,2)) ) 700 psi ×
(10 - 207
η)Qf,2 × h ) (7000 - 2000η)Qf,2 × psi h (39)
SECERDA )
W1ERD + W2
ERD
Vp,1 + Vp,2)
(17 500 - 12 500η)Qf,2 × psi h
(50/7 + 50/7)Qf,2 × h+
(7000 - 2000η)Qf,2 × psi h
(50/7 + 50/7)Qf,2 × h) (1715 - 1015η) × psi (40)
Figure 5. Variation of normalized SEC for operating strategy A(dashed-dotted line) and B (solid line) with respect to ERD efficiency inthe presence of 42.9% of feed fluctuation (Figure 3). The SEC is normalizedwith respect to the average feed osmotic pressure (i.e., 350 psi for the feedfluctuation profile in Figure 3).
Vp,1′ ) Qf,2′ × 12
× 10 h ) 5Qf,2′ × h (41)
W1ERD′ ) ∆P1′(Vf,1′ - η(Vf,1′ - Vp,1′)) ) 2 × 500 psi ×
(10 - 5η)Qf,2′ × h ) 5000(2 - η)Qf,2′ × psi h (42)
Vp,2′ ) Qf,2′ × 12
× 10 h ) 5Qf,2′ × h (43)
W2ERD′ ) ∆P2(Vf,2′ - η(Vf,2′ - Vp,2′)) ) 2 × 200 psi ×
(10 - 5η)Qf,2′ × h ) 2000(2 - η)Qf,2′ × psi h (44)
SECERDB )
W1ERD′+W2
ERD′Vp,1′ + Vp,2′
)
(2000 + 5000)(2 - η)Qf,2′ × psi h
(5 + 5)Qf,2′ × h) 700(2 - η) × psi
(45)
secERDA - secERD
B
secERDB
) 315(1 - η)700(2 - η)
) 315700
(1 - η)[1 + (1 - η)]
(46)
Ind. Eng. Chem. Res., Vol. 48, No. 21, 2009 9585
Dow
nloa
ded
by U
OF
CA
LIF
OR
NIA
LO
S A
NG
EL
ES
on O
ctob
er 2
8, 2
009
| http
://pu
bs.a
cs.o
rg
Pub
licat
ion
Dat
e (W
eb):
Jun
e 18
, 200
9 | d
oi: 1
0.10
21/ie
9007
29x

Thus, the total feed volume in operating strategy B is 2 × 10/7Qf,2 ) 20/7Qf,2, while the total feed volume in operatingstrategy A is (2.5 + 1)Qf,2 ) 3.5Qf,2. Therefore, in order to getthe same amount of permeate volume, operating strategy Arequires a higher amount of feedwater, and thus, it has a loweroverall water recovery.
In summary, operating strategy A is worse, since we need toprocess more feedwater to obtain the same permeate and it hasa higher SEC. In others words, by adjusting the operatingpressure to be double that of the instantaneous feed osmoticpressure, the system needs to process less volume of feedwaterto produce the same amount of permeate water and requires alower SEC.
4. Experimental Study
4.1. Experimental System. In order to test the proposedoptimal operation policy, we applied it to an experimental waterdesalination system (Figure 6) that was recently developed andtested at the UCLA Water Technology Research (WaTeR)Center by the authors and co-workers. The experimental systemincludes a feed tank, filters, pressure vessels, membranemodules, pumps, variable frequency drivers, valves, actuators,sensors (pH, temperature, conductivity, flow rate), and a dataacquisition system. A detailed description of the system can befound in ref 12.
4.2. Experimental Design. On the basis of the theoreticalcalculations of section 3, an experiment was designed tocompare the SEC of the two different operating strategies, Aand B, and verify the theoretical calculations. Strategy A is tooperate the system at a fixed pressure, while strategy B adjuststhe operating pressure to achieve 50% water recovery. Specif-ically, the experimental procedure is as follows:
1. fix the feed concentration to be Cf,1;2. adjust the RO feed flow rate Qf,1 and RO feed pressure
∆P1 to achieve 50% water recovery and record theresulting permeate flow rate Qp,1;
3. adjust the RO feed concentration to Cf,2;4. adjust the RO feed flow rate Qf,2 and RO feed pressure
∆P2 to achieve the same water recovery and permeate flow
rate as those in step 2 (i.e., 50% water recovery and atthe recorded Qp,2 ) Qp,1 ) Qp);
5. maintain the feed concentration at Cf,2, tune the RO feedpressure to (∆P1 + ∆P2)/2 and the permeate flow rate toQp, and record the resulting feed flow rate Qf,4 and waterrecovery Y4;
6. adjust the feed concentration back to Cf,1;7. adjust the RO feed pressure to (∆P1 + ∆P2)/2 and the
permeate flow rate to Qp, and record the resulting feedflow rate Qf,3 and water recovery Y3.
4.3. Experimental Results. Following the procedure de-scribed in subsection 4.2, we pick two different feed salinities,i.e., Cf,1 ) 9000 mg/L (feed osmotic pressure is 104 psi)and Cf,2 ) 5000 mg/L (feed osmotic pressure is 60 psi). Theexperimental results are listed in Table 2. The first columnis the experimental set number as in Table 1. In experiments1 and 2, the system operates at 50% water recovery,producing 1 gpm of product permeate water, and the resultingfeed pressures in the system are 230 psi (10% above thethermodynamic restriction in terms of applied pressure; seeeq 12) and 149 psi (24% above the thermodynamic restrictionin terms of applied pressure; see eq 12), respectively.According to our experimental procedure, experiments 3 and4 are operated at the average pressure of experiments 1 and2, i.e., 190 psi. On the basis of the experimental results ofTable 2, we can conclude that varying the feed pressure withtime (strategy B) leads to substantial SEC savings. However,it is important to elaborate further on these experimentalresults and put them into perspective with respect to the typeof experimental system used to carry them out. Specifically,referring to the results of Table 2, we observe that the waterrecovery decreases while the operating pressure increasesfrom 149 to 190 psi for the same feed salinity when switchingfrom experiment 2 to experiment 3. This is due to the physicallimitations of the experimental system. In particular, theavailable settings of retentate valves and pump speed do notallow one to regulate the feed pressure and feed flow rateindependently. As a result, in order to increase the feedpressure and maintain the permeate flow to be 1 gpm, thehigh pressure pumps have to run faster, and thus, more wateris discharged in the brine stream, thereby decreasing the waterrecovery. If it were possible to independently adjust the feedpressure and feed flow rate (with an appropriate pump andvalve choice), an estimate of the resulting SEC for such anoperation could be computed as follows: specifically, insteadof lowering water recovery, the water recovery wouldincrease as shown in Table 3. As limited by the thermody-namic restriction, the maximum water recovery in this casewould be 1 - (60/190) ) 0.68 (see eq 12). If the systemwere to operate (in terms of feed pressure) 10% above thethermodynamic limit pressure, the water recovery would be1 - {60/[190/(1 + 10%)]} ) 0.65 (see eq 12). If the systemwere to operate 24% above the thermodynamic restriction,
Figure 6. Experimental water desalination system developed at UCLAWaTeR Center and used in the experiments.
Table 1. Feed Fluctuation Experimental Designa
strategy B strategy A
experiment 1 experiment 2 experiment 3 experiment 4
FC (mg/L) Cf,1 Cf,2 Cf,1 Cf,2
PF(gpm) Qp Qp Qp Qp
FP (psi) ∆P1 ∆P2 1/2(∆P1 + ∆P2) 1/2(∆P1 + ∆P2)FF (gpm) Qf,1 Qf,2 Qf,3 Qf,4
Y 50% 50% Y3 Y4
a FC, feed concentration; FP, feed pressure; PF, permeate flow; Y,water recovery; RF, retentate flow; RC, retentate concentration; SEC,specific energy consumption.
9586 Ind. Eng. Chem. Res., Vol. 48, No. 21, 2009
Dow
nloa
ded
by U
OF
CA
LIF
OR
NIA
LO
S A
NG
EL
ES
on O
ctob
er 2
8, 2
009
| http
://pu
bs.a
cs.o
rg
Pub
licat
ion
Dat
e (W
eb):
Jun
e 18
, 200
9 | d
oi: 1
0.10
21/ie
9007
29x

the water recovery would be 1 - {60/[190/(1 + 24%)]} )0.6 (see eq 12 and the numbers shown in the parentheses ofTable 3). Similarly for experiment 4, the system cannot reachthe permeate flow of 1 gpm, while operated at 190 psi, dueto the physical limitations discussed above. However, asimilar calculation to the one made for experiment 3 wouldlead to a water recovery of 1 - {104/[190/(1 + 10%)]} )0.4 (if the system were to operate 10% above the thermo-dynamic restriction) and 1 - {104/[190/(1 + 24%)]} ) 0.32(if the system were to operate 24% above the thermodynamicrestriction), as shown in Table 3. Finally, another averagecase is to operate the RO process with feed pressures thatare 17% (i.e., average of 24% and 10%) above the thermo-dynamic limit pressure for both experiments 3 and 4, asshown in Table 4; this would lead to water recoveries of 1- {60/[190/(1 + 17%)]} ) 0.63 and 1 - {104/[190/(1 +17%)]} ) 0.36, respectively. In this case, the average SECis 415 psi for strategy A, which is about 9.5% higher thanthe average SEC of strategy B. In summary, in all of thecases (Tables 2-4), the average SECs are 384-452 and 379psi for strategies A and B, respectively; therefore, it can beconcluded, both from the experimental results and theanalysis, that it is better, from an energy optimization point-of-view, to adjust the feed pressure to target 50% waterrecovery (strategy B) instead of adopting a constant operatingpressure (strategy A).
5. Effect of the Feed Salinity Fluctuation Percentage onEnergy Savings
The effect of the fluctuation amplitude on energy savings canbe studied following the same procedure presented in subsection3.4. Assuming that the average osmotic pressure is π0, theosmotic pressure in the first 10 h is (1 + σ)π0 (0 < σ < 1), andthe osmotic pressure in the last 10 h is (1 - σ)π0. Therefore,the feed fractional fluctuation is σ. Similarly, the following twooperating strategies may be considered: operating strategy A,where the transmembrane pressure is maintained at double thatof the average feed osmotic pressure, i.e. 2π0, and operatingstrategy B, where the transmembrane pressure is maintained atdouble that of the instantaneous feed osmotic pressure.
5.1. Operating Strategy A. The water recovery in the last10 h, Y1 ) 1 - [(1 + σ)π0]/2π0 ) (1 - σ)/2, and in the last10 h, Y2 ) 1 - [(1 - σ)π0]/2π0 ) (1 + σ)/2. In order to producethe same amount of permeate volume, the feed flow rate in thefirst 10 h has to be (1 + σ)/(1 - σ) times that of the feed flowrate in the last 10 h (Qf,2). The permeate produced in the first10 h is
The energy consumption in the first 10 h is
Similarly, the permeate produced in the last 10 h is
which is the same as the permeate volume in the first 10 h, asrequired in this scenario. The energy consumption in the last10 h is
Therefore, the average SEC is
Table 2. Experimental Resultsa
set FC (mg/L) FP (psi) PF (gpm) Y RF (gpm) RC (mg/L) SEC (psi) SECavg (psi)
1 9000 230 1 0.50 1 35000 460 strategy B2 5000 149 1 0.50 1 19600 298 3793 5000 190 1 0.19 4.25 12200 1000 strategy A4 9000 190 0.57 0.41 0.82 30000 463 805
a FC, feed concentration; FP, feed pressure; PF, permeate flow; Y, water recovery; RF, retentate flow; RC, retentate concentration; SEC, specificenergy consumption.
Table 3. Experimental Results and Analysisa
set FC (mg/L) FP (psi) PF (gpm) Y SEC (psi)SECavg
(psi)
1 9000 230 1 0.50 460 strategy B2 5000 149 1 0.50 298 379
3 5000 190 1 0.65 (0.6) 292 (316) strategy A4 9000 190 1 0.4 (0.32) 475 (594) 384 (452)
a FC, feed concentration; FP, feed pressure; PF, permeate flow; Y,water recovery; RF, retentate flow; RC, retentate concentration; SEC,specific energy consumption. Data inside and before the parentheses instrategy A are calculated on the basis of the assumption that the ROprocesses are operated 24% and 10% above the correspondingthermodynamic limit pressures, respectively.
Table 4. Additional Experimental Results and Analysisa
set FC (mg/L) FP (psi) PF (gpm) Y SEC (psi)SECavg
(psi)
1 9000 230 1 0.50 460 strategy B2 5000 149 1 0.50 298 379
3 5000 190 1 0.63 302 strategy A4 9000 190 1 0.36 528 415
a FC, feed concentration; FP, feed pressure; PF, permeate flow; Y,water recovery; RF, retentate flow; RC, retentate concentration; SEC,specific energy consumption. Data in 3 and 4 for strategy A arecalculated on the basis of the assumption that the feed pressures are17% above the corresponding thermodynamic limit pressure, respec-tively.
Vp,1 ) 1 + σ1 - σ
× Qf,2 × 1 - σ2
× 10 h ) 5(1 + σ)Qf,2 × h
(47)
W1ERD ) ∆P1(Vf,1 - η(Vf,1 - Vp,1)) )
2π0[(1 - η)(10(1 + σ)(1 - σ)
+ 5η(1 + σ))]Qf,2 × h )
10[2(1 - η)(1 + σ)1 - σ
+ η(1 + σ)]π0Qf,2 × h (48)
Vp,2 ) Qf,21 + σ
2× 10 h ) 5(1 + σ)Qf,2 × h (49)
W2ERD ) ∆P2(Vf,2 - η(Vf,2 - Vp,2)) )
2π0[10 - η(10 - 5(1 + σ))]Qf,2 × h )10[2(1 - η) + η(1 + σ)]π0Qf,2 × h (50)
Ind. Eng. Chem. Res., Vol. 48, No. 21, 2009 9587
Dow
nloa
ded
by U
OF
CA
LIF
OR
NIA
LO
S A
NG
EL
ES
on O
ctob
er 2
8, 2
009
| http
://pu
bs.a
cs.o
rg
Pub
licat
ion
Dat
e (W
eb):
Jun
e 18
, 200
9 | d
oi: 1
0.10
21/ie
9007
29x

5.2. Operating Strategy B. The water recovery in the last10 h is the same as the water recovery in the first 10 h. In orderto produce the same amount of permeate volume, the feed flowrate in the first 10 h has to be the same as the feed flow rate inthe last 10 h (Qf,2′). The permeate produced in the first 10 h is
The energy consumption in the first 10 h is
Similarly, the permeate produced in the last 10 h is
which is the same as the permeate volume in the first 10 h, asrequired in this scenario. The energy consumption in the last10 h is
Therefore, the average SEC is
The SEC difference of operating strategy A from operatingstrategy B is {2[(1 - η)/(1 - σ)] + [(1 + ησ)/(1 + σ)] - 2(2- η)}π0. When 0 < η < 1, the SEC of operating strategy A willbe always greater than the SEC of operating strategy B. Thefractional SEC increase is
which is plotted in Figure 7 when the efficiency of the ERD is setto be 90%. The greater-than-zero sign in eq 57 shows that strategyB is always superior to A in terms of energy utilization, irrespectiveof the feed salinity fluctuation percentage and ERD efficiency.Figure 7 shows that, as the feed salinity fluctuation percentageincreases, the time-invariant operation increases the SEC moreremarkably. Furthermore, while in some cases there is only
marginal energy savings, it is still worthwhile to adopt the proposedtime-varying operating strategy, since future feed salinity fluctuationprofiles are unknown. Finally, in order to equate the total permeatevolume in operating strategies A and B, Qf,2′ ) (1 + σ)Qf,2. Thus,the total feed volume in operating strategy B is 2(1 + σ)Qf,2, whilethe total feed volume in operating strategy A is [(1 + σ)/(1 - σ)+ 1]Qf,2 ) (1 + [2σ/(1 - σ)] + 1)Qf,2 > (1 + 2σ + 1)Qf,2.Therefore, in order to get the same amount of permeate volume,operating strategy A requires a higher amount of feedwater, andthus, it has a lower overall water recovery.
6. Conclusion
Building upon our previous work on the effect of thermo-dynamic restriction on energy consumption optimization ofreverse osmosis membrane desalination,4 the present work hasaddressed a practical problem of energy-optimal process opera-tion in the presence of feed salinity fluctuation, which iscommon in both seawater and brackish water desalination. Ouranalysis can be used to predict the energy savings of theproposed optimal operating policy relative to constant pressureoperation. On the basis of a simple model for a reverse osmosismembrane desalination plant and the feed concentration fluctua-tion profile, we found that the specific energy consumption canbe substantially reduced, providing the same permeate flow.Even though in some cases there is only marginal energysavings, it is still worthwhile to adopt the proposed operatingstrategy given the lack of knowledge of future feed salinityprofile. The other benefit of using the proposed approach is thatit requires less feedwater, since it has a higher overall waterrecovery than the time-invariant operating strategy. Higheroverall water recovery will be more favorable, especially whenthe concentrate stream disposal cost is high.
Acknowledgment
The present work was supported in part by the ChannabasappaMemorial Scholarship awarded to A.Z. (by the InternationalDesalination Association), California Department of WaterResources, the Metropolitan Water District of Southern Cali-fornia, the University of California Water Resources Center,and the United States Environmental Protection Agency.
Literature Cited
(1) Manth, T.; Gabor, M.; Oklejas, E. Minimizing RO Energy Consump-tion under Variable Conditions of Operation. Desalination 2003, 157, 9.
(2) Busch, M.; Mickols, W. E. Reducing Energy Consumption inSeawater Desalination. Desalination 2004, 165, 299.
SECERDA )
W1ERD + W2
ERD
Vp,1 + Vp,2)
10[2(1 - η)(1 + σ)1 - σ
+ η(1 + σ)]2 × 5(1 + σ)Qf,2 × h
π0Qf,2 × h +
10[2(1 - η) + η(1 + σ)]2 × 5(1 + σ)Qf,2 × h
π0Qf,2 × h )
2(1 - η)(1 + σ)1 - σ
+ 2η(1 + σ) + 2(1 - η)
1 + σπ0 )
2[(1 - η)1 - σ
+ (1 + ησ)1 + σ ]π0 (51)
Vp,1′ ) Qf,2′ × 12
× 10 h ) 5Qf,2′ × h (52)
W1ERD′ ) ∆P1′(Vf,1′ - η(Vf,1′ - Vp,1′)) ) 2 × (1 + σ)π0 ×
(10 - 5η)Qf,2′ × h ) 10 × (1 + σ)(2 - η)π0Qf,2′ × h (53)
Vp,2′ ) Qf,2′ × 12
× 10 h ) 5Qf,2′ × h (54)
W2ERD′ ) ∆P2(Vf,2′ - η(Vf,2′ - Vp,2′)) ) 2 × (1 - σ)π0 ×
(10 - 5η)Qf,2′ × h ) 10 × (1 - σ)(2 - η)π0Qf,2′ × h (55)
SECERDB )
W1ERD′+W2
ERD′Vp,1′ + Vp,2′
)
10(1 - σ + 1 + σ)(2 - η)π0Qf,2′ × h
(5 + 5)Qf,2′ × h) 2(2 - η)π0 (56)
SECERDA - SECERD
B
SECERDB
)2[(1 - η)
1 - σ+ (1 + ησ)
1 + σ ] - 2(2 - η)
2(2 - η))
2σ2(1 - η)
(2 - η)(1 - σ2)> 0 (57)
Figure 7. Variation of normalized SEC for operating strategies A(dashed-dotted line) and B (solid line) with respect to feed salinityfluctuation in the presence of an ERD of 90% efficiency. The SEC isnormalized with respect to the average feed osmotic pressure (i.e., 350 psifor the feed fluctuation profile in Figure 3).
9588 Ind. Eng. Chem. Res., Vol. 48, No. 21, 2009
Dow
nloa
ded
by U
OF
CA
LIF
OR
NIA
LO
S A
NG
EL
ES
on O
ctob
er 2
8, 2
009
| http
://pu
bs.a
cs.o
rg
Pub
licat
ion
Dat
e (W
eb):
Jun
e 18
, 200
9 | d
oi: 1
0.10
21/ie
9007
29x
(3) Wilf, M.; Bartels, C. Optimization of Seawater RO Systems Design.Desalination 2005, 173, 1.
(4) Zhu, A.; Christofides, P. D.; Cohen, Y. Effect of ThermodynamicRestriction on Energy Cost Optimization of RO Membrane Water Desali-nation. Ind. Eng. Chem. Res. Publication date (Web), August 29, 2008;DOI, 10.1021/ie800735q.
(5) Wilf, M. Design Consequences of Recent Improvements in Mem-brane Performance. Desalination 1997, 113, 157.
(6) Zhu, A.; Christofides, P. D.; Cohen, Y. Minimization of EnergyConsumption for a Two-Pass Membrane Desalination: Effect of EnergyRecovery, Membrane Rejection and Retentate Recycling. J. Membr. Sci.Available online May 4, 2009; DOI, 10.1016/j.memsci.2009.04.039.
(7) Zhu, A.; Christofides, P. D.; Cohen, Y. On RO Membrane andEnergy Costs and Associated Incentives for Future Enhancements ofMembrane Permeability. J. Membr. Sci. Submitted.
(8) Song, L.; Hu, J. Y.; Ong, S. L.; Ng, W. J.; Elimelech, M.; Wilf, M.Emergence of Thermodynamic Restriction and Its Implications for Full-Scale Reverse Osmosis Processes. Desalination 2003, 155, 213.
(9) McCool, B. C. The Feasibility of Reverse Osmosis Desalination ofBrackish Water in the San Joaquin Valley. Master’s Thesis; UCLA, 2008.
(10) McFall, C. W.; Bartman, A.; Christofides, P. D.; Cohen, Y. Controland Monitoring of a High Recovery Reverse Osmosis Desalination Process.Ind. Eng. Chem. Res. 2008, 47 (17), 6698.
(11) Bartman, A.; McFall, C. W.; Christofides, P. D.; Cohen, Y. Model-Predictive Control of Feed Flow Reversal in a Reverse Osmosis DesalinationProcess. J. Process Control 2009, 19, 433.
(12) Bartman, A.; Christofides, P. D.; Cohen, Y. Nonlinear Model-BasedControl of an Experimental Reverse Osmosis Water Desalination System.Ind. Eng. Chem. Res. Publication date (Web): April 17, 2009; DOI, 10.1021/ie900322x.
(13) Mulder, M. Basic Principles of Membrane Technology; KluwerAcademic Publishers: Boston, 1997.
(14) Standard Practice for Standardizing ReVerse Osmosis PerformanceData; ASTM international: West Conshohocken, PA, 2000.
ReceiVed for reView May 5, 2009ReVised manuscript receiVed May 27, 2009
Accepted June 2, 2009
IE900729X
Ind. Eng. Chem. Res., Vol. 48, No. 21, 2009 9589
Dow
nloa
ded
by U
OF
CA
LIF
OR
NIA
LO
S A
NG
EL
ES
on O
ctob
er 2
8, 2
009
| http
://pu
bs.a
cs.o
rg
Pub
licat
ion
Dat
e (W
eb):
Jun
e 18
, 200
9 | d
oi: 1
0.10
21/ie
9007
29x