energy consumption by office and telecommunications
TRANSCRIPT

i
Energy Consumption by Office and Telecommunications Equipment in Commercial
Buildings Volume II: Energy Savings Potential
Prepared by
Kurt W. Roth Gerald R. Larocque Jonathan Kleinman
TIAX LLC 15 Acorn Park
Cambridge, MA 02140-2390
TIAX Reference No. D0065-11.08
For
Building Technologies Program Project Managers: Dr. James Brodrick, Mr. Sam Johnson, and Mr.
Brian Card (DOE)
Subcontract No. 115867-00 under Contract No. DE-AM26-99FT40465
December, 2004

ii
Disclaimer
This report was prepared as an account of work sponsored by an agency of the
United States Government. None of the following entities makes any warranty,
expressed or implied, or assumes any legal liability or responsibility for the
accuracy, completeness, or usefulness of any information, apparatus, product,
or process disclosed, or represents that its use would not infringe privately
owned rights: a) the United States Government, b) any agency, contractor, or
subcontractor thereof, and c) any of their respective employees. Any use the
reader makes of this report, or any reliance upon or decisions to be made based
upon this report, are the responsibility of the reader. The reader understands
that no assurances can be made that all relevant factors have been identified.
Reference herein to any specific commercial product, process, or service by
trade name, trademark, manufacturer, or otherwise, does not necessarily
constitute or imply its endorsement, recommendation, or favoring by the United
States government or any agency, contractor or subcontractor thereof. The
views and opinions of the authors expressed herein do not necessarily state or
reflect those of the United States Government or any agency thereof.
Available to the public from:
National Technical Information Service (NTIS)
U.S. Department of Commerce
Springfield, VA 22161
(703) 487-4650
NTIS Number: PB2005-100014

iii
Acknowledgements The authors would like to acknowledge the valuable support provided by several others in the preparation of this report, including Donna Bryan, Fred Goldstein, Jeff Jasperse, and Ratcharit Ponoum, all of TIAX LLC. Dr. James Brodrick, Mr. Sam Johnson, and Mr. Brian Card, all of U.S. Department of Energy provided day-to-day oversight of this assignment and helped to shape the approach, execution, and documentation. They also reviewed and constructively critiqued draft versions of the report. The report further benefited from the experiences and vision of volunteers that provided guidance in the selection of the technology options:
• J. Brodrick, U.S. Department of Energy, Building Technology • G. Crawford, Brown University • E. Forsythe, ARL • K. Kawamoto, Osaka Gas • J. Koomey, LBNL • A. Nichols, PNNL • B. Nordman, LBNL • S. Novotny, Sun Microsystems • J. Roturier, ECOCAMPUS Universite Bordeaux • P. Semenza, iSuppli/Stanford Resources • H.-P. Siderius, SenterNovem • S. Somasundaram, PNNL
Moreover, many people reviewed the final report and graciously shared their insights. Their feedback significantly enhanced the quality of the final report.
• B. Aebischer, Swiss Federal Institutes of Technology • C. Belady, Hewlett Packard Corporation • E. Boedecker, U.S. Department of Energy, Energy Information Administration • T. Bolioli, Terra Novum • J. Booth, Lexmark International, Inc. • T. Brady, Intel Corporation • J. Brodrick, U.S. Department of Energy, Building Technology • C. Calwell, Ecos Consulting • E. Forsythe, U.S. Army Research Laboratory • S. Johnson, U.S. Department of Energy, Building Technology • J. Koomey, Stanford University, School of Engineering
iv
• D. Korn, Cadmus Group • H. Mahabadi, Xerox Corporation • M. Marzinelli, Hewlett Packard Corporation • B. Nordman, Lawrence Berkeley National Laboratory • S. Novotny, Sun Microsystems • P. Semenza, iSuppli/Stanford Resources • H.-P. Siderius, SenterNovem • J. Tang, AMD • E. Troelsen, Hewlett Packard Corporation
Finally, many contacts contributed valuable information and insights about almost all of the eleven technology options selected for further study, greatly enhancing the report’s quality and depth. Individuals from the following companies and organizations graciously shared information used in this report. • 1E • AMD • Amphus, Inc. • Brown University • Cadmus Group, Inc. • City of San Jose • Ecos Consulting • EPRI-PEAC Corporation • EZConserve • Gyricon LLC • Hewlett Packard Corporation • Intel Corporation • Ionary Consulting • iSuppli/Stanford Resources • Kent Displays • Lawrence Berkeley National Laboratory • Lexmark International, Inc. • NerveWire • Northwestern University • Philips Electronics • Organic Lighting Technologies LLC • RLX • Sun Microsystems • Terra Novum • U.S. Army Research Laboratory • United States Display Consortium (USDC)

v
• U.S. Environmental Protection Agency • University of Central Florida • Xerox Corporation
vi
TABLE OF CONTENTS
1 EXECUTIVE SUMMARY ....................................................................................... 1-1 1.1 Study Objectives ................................................................................. 1-1 1.2 Summary of Findings.......................................................................... 1-2 2 INTRODUCTION.................................................................................................... 2-1 2.1 Background......................................................................................... 2-1 2.2 Drivers for Reducing IT Energy Consumption................................... 2-3 2.3 Study Approach .................................................................................. 2-6 2.4 Report Organization............................................................................ 2-7 3 ENERGY SAVING TECHNOLOGY SELECTION PROCESS............................... 3-1 3.1 Initial List of Technology Options (Steps 1 and 2)............................. 3-1 3.2 Selecting Options for Further Study (Steps 3 and 4) .......................... 3-2 3.3 More Refined Evaluation of Options Selected for Further Study (Step 5) 3-2 4 ANALYSIS OF THE TECHNOLOGY OPTIONS SELECTED FOR FURTHER
STUDY .............................................................................................. 4-1 4.1 Chip-Level Power Management ......................................................... 4-3
4.1.1 Summary .......................................................................................... 4-3 4.1.2 Background and Performance Impact........................................... 4-4 4.1.3 Energy Savings Potential ............................................................... 4-9 4.1.4 Cost................................................................................................. 4-11 4.1.5 Perceived Barriers to Market Adoption of Technology ............. 4-11 4.1.6 Technology Development “Next Steps”...................................... 4-12 4.1.7 References ..................................................................................... 4-12
4.2 Cholesteric LCDs.............................................................................. 4-13 4.2.1 Summary ........................................................................................ 4-13 4.2.2 Background and Performance Impact......................................... 4-14 4.2.3 Energy Savings Potential ............................................................. 4-14 4.2.4 Cost................................................................................................. 4-16 4.2.5 Perceived Barriers to Market Adoption of Technology ............. 4-16 4.2.6 Technology Development “Next Steps”...................................... 4-17 4.2.7 References ..................................................................................... 4-17
4.3 E-paper.............................................................................................. 4-18 4.3.1 Summary ........................................................................................ 4-18 4.3.2 Background and Performance Impact......................................... 4-19 4.3.3 Energy Savings Potential ............................................................. 4-22 4.3.4 Cost................................................................................................. 4-23 4.3.5 Perceived Barriers to Market Adoption of Technology ............. 4-24 4.3.6 Technology Development “Next Steps”...................................... 4-26 4.3.7 References ..................................................................................... 4-27
4.4 Higher Efficiency Ac-Dc Power Supplies ........................................ 4-28
vii
4.4.1 Summary ........................................................................................4-28 4.4.2 Background and Performance Impact .........................................4-29 4.4.3 Energy Savings Potential..............................................................4-33
4.4.3.1 Active Mode .......................................................................................................................... 4-34 4.4.3.2 “Off” Mode............................................................................................................................ 4-37
4.4.4 Cost.................................................................................................4-39 4.4.5 Perceived Barriers to Market Adoption of Technology..............4-40 4.4.6 Technology Development “Next Steps” ......................................4-43 4.4.7 References .....................................................................................4-43 4.4.8 Additional References...................................................................4-44
4.4.8.1 Technical Design Reference Books ....................................................................................... 4-44 4.4.8.2 Power Electronics Websites................................................................................................... 4-45
4.5 Higher-Efficiency LCD Backlights .................................................. 4-45 4.5.1 Summary ........................................................................................4-45 4.5.2 Background and Performance Impact .........................................4-46 4.5.3 Energy Savings Potential..............................................................4-50
4.5.3.1 Improved Light Source Efficacy............................................................................................ 4-50 4.5.3.2 Enhanced Optical Path Efficiency.......................................................................................... 4-53 4.5.3.3 Lower Luminance Levels....................................................................................................... 4-54
4.5.4 Cost.................................................................................................4-55 4.5.4.1 Improved Light Source Efficacy............................................................................................ 4-56 4.5.4.2 Enhanced Optical Path Efficiency.......................................................................................... 4-57 4.5.4.3 Lower Luminance Levels....................................................................................................... 4-57
4.5.5 Perceived Barriers to Market Adoption of Technology..............4-58 4.5.5.1 Higher Efficacy Light Sources............................................................................................... 4-58 4.5.5.2 Enhanced Optical Path Efficacy............................................................................................. 4-59 4.5.5.3 Lower Luminance Levels....................................................................................................... 4-60
4.5.6 Technology Development “Next Steps” ......................................4-60 4.5.7 References .....................................................................................4-60
4.6 Inkjet Copiers and Printers................................................................ 4-62 4.6.1 Summary ........................................................................................4-62 4.6.2 Background and Performance Impact .........................................4-63 4.6.3 Energy Savings Potential..............................................................4-65 4.6.4 Cost.................................................................................................4-67 4.6.5 Perceived Barriers to Market Adoption of Technology..............4-68 4.6.6 Technology Development “Next Steps” ......................................4-70 4.6.7 References .....................................................................................4-70
4.7 Microprocessor Line Width Reduction............................................. 4-71 4.7.1 Summary ........................................................................................4-71 4.7.2 Background and Performance Impact .........................................4-72 4.7.3 Energy Savings Potential..............................................................4-74 4.7.4 Cost.................................................................................................4-75 4.7.5 Perceived Barriers to Market Adoption of Technology..............4-76 4.7.6 Technology Development “Next Steps” ......................................4-76 4.7.7 References .....................................................................................4-76
4.8 Network Software to Enact Power Management (PM) Settings....... 4-77 4.8.1 Summary ........................................................................................4-77 4.8.2 Background and Performance Impact .........................................4-78 4.8.3 Energy Savings Potential..............................................................4-81

viii
4.8.4 Cost................................................................................................. 4-83 4.8.5 Perceived Barriers to Market Adoption of Technology ............. 4-84 4.8.6 Technology Development “Next Steps”...................................... 4-85 4.8.7 References ..................................................................................... 4-86
4.9 Organic Light-Emitting Diode (OLED) Monitors and Displays ...... 4-87 4.9.1 Summary ........................................................................................ 4-87 4.9.2 Background and Performance Impact......................................... 4-88 4.9.3 Energy Savings Potential ............................................................. 4-91 4.9.4 Cost................................................................................................. 4-94 4.9.5 Perceived Barriers to Market Adoption of Technology ............. 4-95 4.9.6 Technology Development “Next Steps”...................................... 4-96 4.9.7 References ..................................................................................... 4-97
4.10 Reflective Monitors and Displays..................................................... 4-98 4.10.1 Summary ........................................................................................ 4-98 4.10.2 Background and Performance Impact......................................... 4-99 4.10.3 Energy Savings Potential ........................................................... 4-105 4.10.4 Cost............................................................................................... 4-109 4.10.5 Perceived Barriers to Market Adoption of Technology ........... 4-110 4.10.6 Technology Development “Next Steps”.................................... 4-112 4.10.7 References ................................................................................... 4-113
4.11 Server Computer Power Management ............................................ 4-114 4.11.1 Summary ...................................................................................... 4-114 4.11.2 Background and Performance Impact....................................... 4-115 4.11.3 Energy Savings Potential ........................................................... 4-120 4.11.4 Cost............................................................................................... 4-122 4.11.5 Perceived Barriers to Market Adoption of Technology ........... 4-123 4.11.6 Technology Development “Next Steps”.................................... 4-124 4.11.7 References ................................................................................... 4-125
5 CONCLUSIONS..................................................................................................... 5-1
GENERAL REFERENCES.......................................................................................... 5-6
APPENDIX A: DATA SHEETS FOR TECHNOLOGIES NOT SELECTED FOR FURTHER STUDY ............................................................................... 1
APPENDIX B – NEW MONITOR AEC CALCULATIONS.............................................. 1
APPENDIX C – OPERATIONAL MODES FOR OFFICE AND TELECOMMUNICATIONS EQUIPMENT ............................................ 1
ix
LIST OF FIGURES FIGURE 1-1: PROJECT APPROACH SUMMARY................................................................................ 1-2 FIGURE 1-2: TECHNOLOGY OPTIONS WITH SIGNIFICANT ENERGY SAVINGS POTENTIAL
(NOT SELECTED FOR FURTHER STUDY) .................................................................................. 1-4 FIGURE 2-1: COMMERCIAL BUILDING PRIMARY ENERGY CONSUMPTION BREAKDOWN
(FROM BTS 2003; ADL 2002) .............................................................................................. 2-2 FIGURE 2-2: NON-RESIDENTIAL OFFICE AND TELECOMMUNICATIONS EQUIPMENT
ANNUAL ENERGY CONSUMPTION FOR Y2000, IN TWH (FROM ADL 2002) .......................... 2-2 FIGURE 3-1: STEPS OF THETECHNOLOGY OPTION SELECTION PROCESS....................................... 3-1 FIGURE 4-1: BREAKDOWN OF DESLTOP PC ACTIVE MODE POWER DRAW (PENTIUM IV
MACHINE; BASED ON GABEL 2002A; BRADY ET AL. 2003) ................................................... 4-6 FIGURE 4-2: BREAKDOWN OF 2RU LOW-END SERVER ACTIVE POWER DRAW (FROM
GABEL 2002A) ...................................................................................................................... 4-6 FIGURE 4-3 AMD MEASURED PROCESSOR POWER SAVINGS WITH POWERNOW™
TECHNOLOGY (FROM AMD 2002) ........................................................................................ 4-9 FIGURE 4-4: ILLUSTRATIVE SCHEMATIC OF ELECTROPHORETIC E-PAPER (COURTESY OF E
INK)..................................................................................................................................... 4-20 FIGURE 4-5: BASIC AC-DC SWITCHING POWER SUPPLY ARCHITECTURE.................................... 4-32 FIGURE 4-6: LOSSES OF AN AC-DC 20W SWITCHING POWER SUPPLY AT 20% LOAD (FROM
MANSOOR AND CALWELL 2004)......................................................................................... 4-33 FIGURE 4-7: MEASURED PC SWITCHING POWER SUPPLY EFFICIENCIES AS FUNCTION OF
LOAD PERCENTAGE (FROM CALWELL AND REEDER 2002) ................................................. 4-34 FIGURE 4-8: LCD SCHEMATIC (BASED ON USDC [2003] AND ANANDAN [2002]) ..................... 4-47 FIGURE 4-9: INKJET PRINTING PROCESS SCHEMATIC .................................................................. 4-64 FIGURE 4-10: SMALL MOLECULE OLED STRUCTURE, WITH TYPICAL MATERIALS (BASED
ON FORSYTHE 2002, HOWARD 2001).................................................................................. 4-89 FIGURE 4-11: PREFERRED REFLECTIVE LCD DESIGN (BASED ON VOUTSAS AND ISHII
2002) ................................................................................................................................ 4-102 FIGURE 4-12: TRANSFLECTIVE LCD – BACKLIT VARIANT (BASED ON VOUTSAS AND ISHII
2002) ................................................................................................................................ 4-104 FIGURE 4-13: FRONT LIGHTING FOR TRANSFLECTIVE DISPLAYS (BASED ON JOHNSON ET
AL. 1998). ......................................................................................................................... 4-105 FIGURE 4-14: AVERAGE USAGE PROFILE FOR A GLOBAL WEB-SITE (FROM KILLELEA
2002) ................................................................................................................................ 4-117 FIGURE 4-15: REPRESENTATIVE WEB SERVER DEMAND FLUCTUATIONS (FROM KILLELEA
2002) ................................................................................................................................ 4-117 FIGURE 4-16: REQUEST RATE FOR THE IBM.COM WEBSITE (FROM CHASE ET AL. 2001).......... 4-118 FIGURE 5-1: TECHNOLOGY OPTIONS NOT SELECTED FOR FURTHER STUDY WITH
SIGNIFICANT ENERGY SAVINGS POTENTIAL (PRELIMINARY ESTIMATES) .............................. 5-2

x
LIST OF TABLES TABLE 1-1: TECHNOLOGY OPTIONS EVALUATED (BOLD DENOTES SELECTED FOR
FURTHER STUDY) .................................................................................................................. 1-3 TABLE 1-2: ENERGY SAVINGS POTENTIAL SUMMARY FOR OPTIONS SELECTED FOR
FURTHER STUDY................................................................................................................... 1-5 TABLE 1-3: COMMON THEMES TO ENERGY CONSUMPTION REDUCTION....................................... 1-6 TABLE 1-4: COMMON NON-ENERGY BENEFITS OF THE ELEVEN TECHNOLOGY OPTIONS ............. 1-6 TABLE 1-5: COMMON BARRIERS FACING THE ELEVEN TECHNOLOGIES........................................ 1-7 TABLE 1-6: TECHNOLOGY DEVELOPMENT POTENTIAL “NEXT STEPS” FOR THE ELEVEN
TECHNOLOGIES..................................................................................................................... 1-8 TABLE 2-1: KEY EQUIPMENT CATEGORIES (FROM ADL 2002)..................................................... 2-1 TABLE 2-2: NON-ECONOMIC FACTORS DRIVING REDUCTIONS IN OFFICE AND
TELECOMMUNICATIONS EQUIPMENT ENERGY CONSUMPTION.............................................. 2-4 TABLE 2-3: BREAKDOWN OF TYPICAL SMALL OFFICE BUILDING ANNUAL EXPENDITURES
(FROM CLER ET AL. 1997) ..................................................................................................... 2-5 TABLE 2-4: ELECTRIC COST SAVINGS VERSUS DEVICE CAPITAL COSTS FOR NETWORK
POWER MANAGEMENT.......................................................................................................... 2-6 TABLE 2-5: DESCRIPTIONS OF TECHNOLOGY TECHNICAL MATURITY STAGES ............................. 2-6 TABLE 2-6: DESCRIPTIONS OF TECHNOLOGY DEVELOPMENT STAGES .......................................... 2-6 TABLE 3-1: TECHNOLOGY OPTIONS SELECTED FOR FURTHER STUDY.......................................... 3-2 TABLE 4-1: ENERGY SAVINGS POTENTIAL SUMMARY FOR OPTIONS SELECTED FOR
FURTHER STUDY................................................................................................................... 4-1 TABLE 4-2: COMMERCIAL OFFICE AND TELECOMMUNICATIONS EQUIPMENT ENERGY
CONSUMPTION BREAKDOWN (FROM ADL 2002, APPENDIX B) ............................................ 4-2 TABLE 4-3: SUMMARY OF CHIP-LEVEL POWER MANAGEMENT CHARACTERISTICS ..................... 4-4 TABLE 4-4 COMPARISON OF AMD POWERNOW™ WITH INTEL SPEEDSTEP™ (FROM AMD
2002) .................................................................................................................................... 4-7 TABLE 4-5: DESKTOP PC USAGE AND POWER DRAW BY MODE FOR CHIP-LEVEL POWER
MANAGEMENT, Y2000 ....................................................................................................... 4-10 TABLE 4-6: DESKTOP PC UEC AND AEC FOR CHIP-LEVEL POWER MANAGEMENT................... 4-10 TABLE 4-7: DESKTOP PC USAGE AND POWER DRAW BY MODE VALUES FOR CHIP-LEVEL
PM, Y2002 ......................................................................................................................... 4-10 TABLE 4-8: DESKTOP PC UEC AND AEC FOR CHIP-LEVEL PM, Y2002 .................................... 4-11 TABLE 4-9: SUMMARY OF CHOLESTERIC DISPLAYS CHARACTERISTICS...................................... 4-13 TABLE 4-10: CHOLESTERIC MONITORS – POWER DRAW BY MODE AND AEC............................ 4-15 TABLE 4-11: SUMMARY OF E-PAPER CHARACTERISTICS............................................................ 4-18 TABLE 4-12: PERFORMANCE OF E-PAPER VISUAL CHARACTERISTICS TO OTHER MEDIA............ 4-22 TABLE 4-13: REASONS WHY PEOPLE PREFER READING FROM PAPER INSTEAD OF
ELECTRONIC MEDIA (BASED ON SELLEN AND HARPER 2002)............................................. 4-25 TABLE 4-14: SUMMARY OF HIGHER EFFICIENCY POWER SUPPLIES CHARACTERISTICS .............. 4-29 TABLE 4-15: KEY AC-DC POWER SUPPLY FUNCTIONS ............................................................... 4-30 TABLE 4-16: OFFICE EQUIPMENT POWER SUPPLY CHARACTERISTICS ........................................ 4-35

xi
TABLE 4-17: APPROACHES TO IMPROVE POWER SUPPLY “ACTIVE” MODE EFFICIENCY ............. 4-36 TABLE 4-18: ENERGY SAVINGS POTENTIAL OF HIGHER EFFICIENCY POWER SUPPLIES .............. 4-36 TABLE 4-19: DRAFT ENERGYSTAR® MAXIMUM NO-LOAD POWER DRAW LEVELS FOR
EXTERNAL POWER SUPPLIES............................................................................................... 4-38 TABLE 4-20: EUROPEAN COMMISSION VOLUNTARY “CODE OF CONDUCT”
SPECIFICATIONS FOR EXTERNAL POWER SUPPLIES (FROM EC 2000) .................................. 4-38 TABLE 4-21: APPROXIMATE COST IMPACT OF APPROACHES TO IMPROVE POWER SUPPLY
“ACTIVE” MODE EFFICIENCY ............................................................................................. 4-40 TABLE 4-22: INTEL POWER SUPPLY PERFORMANCE LEVELS FOR PENTIUM (BASED ON
INTEL 2003, HILLER ET AL. 2004, AND CALWELL 2004) ..................................................... 4-41 TABLE 4-23: SUMMARY OF HIGHER-EFFICIENCY LCD BACKLIGHTS CHARACTERISTICS........... 4-46 TABLE 4-24: APPROXIMATE OPTICAL EFFICIENCY OF LCD OPTICAL COMPONENTS .................. 4-48 TABLE 4-25: TYPICAL LIGHT SOURCE EFFICACIES ..................................................................... 4-51 TABLE 4-26: TARGET EFFICACY FOR OLED BACKLIGHTS (FROM BARDSLEY 2001) .................. 4-52 TABLE 4-27: ENERGY CONSUMPTION VALUES AND AEC ESTIMATE FOR HIGHER-
EFFICACY BACKLIGHTS (15-INCH LCD) ............................................................................. 4-52 TABLE 4-28: INCREASED LCD OPTICAL PATH EFFICIENCY MEASURES – POWER DRAW BY
MODE AND AEC IMPACT (17-INCH MONITOR) ................................................................... 4-54 TABLE 4-29: DISPLAY LUMINANCE LEVELS (BASED ON USDC 2003) ........................................ 4-54 TABLE 4-30: REDUCED LCD LUMINANCE – POWER DRAW BY MODE AND AEC....................... 4-55 TABLE 4-31: 15-INCH LCD COST BY COMPONENT (FROM USDC 2003)..................................... 4-55 TABLE 4-32: TARGET OLED DIFFUSE LIGHTING CHARACTERISTICS (FROM BARDSLEY
2001) .................................................................................................................................. 4-56 TABLE 4-33: ADVANTAGES OF LED BACKLIGHTS OVER CCFL BACKLIGHTS (BASED ON
ANANDAN 2002)................................................................................................................. 4-58 TABLE 4-34: SUMMARY OF INKJET IMAGING CHARACTERISTICS ............................................... 4-63 TABLE 4-35: USAGE DATA USED FOR INKJET ENERGY CONSUMPTION MODEL.......................... 4-66 TABLE 4-36: UEC VALUES FOR ELECTROPHOTOGRAPHIC (EP) AND INKJET PRINTERS AND
COPIERS .............................................................................................................................. 4-66 TABLE 4-37: AEC COMPARISON OF ELECTROPHOTOGRAPHIC (EP) AND INKJET DEVICES.......... 4-67 TABLE 4-38: COMPARISON OF HOME LASER AND INKJET PRINTERS (BASED ON CONSUMER
REPORTS [2004] AND PRODUCT LITERATURE).................................................................... 4-69 TABLE 4-39: SUMMARY OF MICROPROCESSOR LINE WIDTH REDUCTION
CHARACTERISTICS .............................................................................................................. 4-72 TABLE 4-40: IMPACT OF LINEWIDTH DECREASE ON ACTIVE POWER DRAW ............................... 4-75 TABLE 4-41: SUMMARY OF NETWORK SOFTWARE TO ENACT POWER MANAGEMENT
SETTINGS CHARACTERISTICS .............................................................................................. 4-78 TABLE 4-42: EFFECT OF NETWORK SOFTWARE TO ENABLE PM ON EQUIPMENT USAGE
PATTERNS, BY STRATEGY ................................................................................................... 4-82 TABLE 4-43: IMPACT OF DIFFERENT PM STRATEGIES ON DEVICE UNIT ENERGY
CONSUMPTION .................................................................................................................... 4-82 TABLE 4-44: IMPACT OF DIFFERENT PM STRATEGIES ON DEVICE ANNUAL ENERGY
CONSUMPTION .................................................................................................................... 4-83

xii
TABLE 4-45: SUMMARY OF OLED CHARACTERISTICS ............................................................... 4-88 TABLE 4-46: ROADMAP FOR ACTIVE MATRIX OLEDS (FROM IBARAKI 2002)............................ 4-91 TABLE 4-47: COMPARISON OF OLED DISPLAY AND LCD OPTICAL LOSSES .............................. 4-91 TABLE 4-48: APPROXIMATE OLED DIODE EFFICACY CIRCA 2001 (BASED ON FORSYTHE
2002) .................................................................................................................................. 4-92 TABLE 4-49: TARGET DIODE PERFORMANCE FOR HIGH-RESOLUTION OLED DISPLAYS
(FROM BARDSLEY 2001) ..................................................................................................... 4-92 TABLE 4-50: POWER DISSIPATION MECHANISMS OF OLED DISPLAYS (FROM HUNTER AND
JOHNSON 2002)................................................................................................................... 4-92 TABLE 4-51: TARGET PERFORMANCE OF HIGH-RESOLUTION OLED DISPLAYS (FROM
USDC 2003)....................................................................................................................... 4-93 TABLE 4-52: OLED DISPLAYS – POWER DRAW BY MODE AND AEC ........................................ 4-94 TABLE 4-53: TARGET SYSTEM PERFORMANCE AND COST FOR AM OLED DISPLAYS
(FROM BARDSLEY 2001) ..................................................................................................... 4-95 TABLE 4-54: RECENT OLED LIFETIMES (FROM FORSYTHE 2002) .............................................. 4-96 TABLE 4-55: SUMMARY OF REFLECTIVE DISPLAY CHARACTERISTICS ....................................... 4-99 TABLE 4-56: ILLUSTRATIVE COMPARISON OF REFLECTIVE AND TRANSMISSIVE LCDS
(FROM VOUTSAS AND ISHII 2002) ..................................................................................... 4-100 TABLE 4-57: NON-LCD REFLECTIVE DISPLAY TECHNOLOGIES (FROM WU AND YANG
2001) ................................................................................................................................ 4-101 TABLE 4-58: REFLECTIVE LCD TECHNOLOGIES ....................................................................... 4-103 TABLE 4-59: ESTIMATES OF FRONT LIGHT POWER REQUIRED FOR DIFFERENT DISPLAY
TECHNOLOGIES FOR A FRONT-LIT LCD............................................................................ 4-107 TABLE 4-60: ENERGY SAVING CALCULATIONS FOR REFLECTIVE LCD MONITORS .................. 4-108 TABLE 4-61: NATIONAL ENERGY IMPACT OF REFLECTIVE LCD............................................... 4-108 TABLE 4-62: APPROXIMATE COST BREAKDOWNS FOR A 15-INCH LCD PANEL (FROM
USDC 2003)..................................................................................................................... 4-109 TABLE 4-63: COMPARISON OF LCD TECHNOLOGIES FOR REFLECTIVE DISPLAYS (FROM
CRAWFORD 2002A)........................................................................................................... 4-111 TABLE 4-64: SUMMARY OF SERVER POWER MANAGEMENT .................................................... 4-115 TABLE 4-65: TYPES OF SERVER POWER MANAGEMENT............................................................ 4-118 TABLE 4-66: TYPICAL APPLICATIONS FOR SERVER COMPUTERS, BY SERVER CLASS (FROM
ADL 2002) ....................................................................................................................... 4-120 TABLE 4-67: IMPACT OF NIGHT AND WEEKEND SHUTDOWN ON LOW-END SERVER
ENERGY CONSUMPTION.................................................................................................... 4-121 TABLE 4-68: ENERGY SAVINGS POTENTIAL FOR DIFFERENT CONTINUOUS SERVER PM
STRATEGIES ...................................................................................................................... 4-121 TABLE 4-69: ENERGY SAVINGS POTENTIAL OF ADVANCED CONTINUOUS POWER
MANAGEMENT STRATEGIES FOR LOW-END SERVERS....................................................... 4-122 TABLE 4-70: ENERGY SAVINGS POTENTIAL OF CONTINUOUS SERVER PM ............................... 4-122 TABLE 5-1: NONRESIDENTIAL ENERGY SAVINGS POTENTIAL SUMMARY FOR OPTIONS
SELECTED FOR FURTHER STUDY........................................................................................... 5-1 TABLE 5-2: COMMON THEMES TO ENERGY CONSUMPTION REDUCTION....................................... 5-3

xiii
TABLE 5-3: COMMON NON-ENERGY BENEFITS OF THE ELEVEN TECHNOLOGY OPTIONS.............. 5-3 TABLE 5-4: COMMON BARRIERS FACING THE ELEVEN TECHNOLOGIES........................................ 5-4 TABLE 5-5: TECHNOLOGY DEVELOPMENT POTENTIAL “NEXT STEPS” FOR THE ELEVEN
TECHNOLOGIES ..................................................................................................................... 5-5

1-1
1 EXECUTIVE SUMMARY Over the past twenty years, the robust penetration of computing devices into the workplace and the rise of the Internet and its associated infrastructure (server computers, UPSs, etc.) has lead to a dramatic increase in the energy consumed by nonresidential office and telecommunications equipment (ADL 2002). Consequently, nonresidential office and telecommunications equipment accounted for just under 3 percent of U.S. electricity consumption in 2000. This report is the second volume of a two-volume set of reports on energy consumption by commercial office and telecommunications equipment in the U.S. The first volume established the baseline energy consumption of 97TWh for office and telecommunications equipment in Y2000 (ADL 2002). This second volume addresses energy savings opportunities for office and telecommunications equipment in commercial buildings, and evaluates the technical energy savings potential, current and future economic suitability, and the barriers preventing widespread utilization of select technologies. 1.1 Study Objectives The objectives of this study were to:
• Identify the wide range of energy savings options applicable to commercial office and telecommunications equipment that have been proposed, developed or commercialized, and develop a rough estimate of each option’s energy saving potential;
• Through successively more detailed analysis and investigation, improve the understanding of energy savings potential and key issues associated with realizing this potential for the technology options least well understood and/or considered more promising after initial study;
• Provide information about the technology options, including key references, that will aid interested parties in assessing each technology’s viability for specific application or program;
• Suggest developmental “next steps” towards achieving widespread commercialization for each technology option;
• Solicit industry review of the report to verify key conclusions and that important trends and barriers are identified.
Figure 1-1 summarizes the project approach.

1-2
Step 1 - Generate initial list of technology options
Step 2 - Develop preliminary technical energy savings potential estimates
Step 4 - Select options for further study
Step 5 - Analyze energy savings potential, performance benefits economics, barriers, and ”next steps”
Step 3 - Solicit outside feedback on initial selections forfurther study
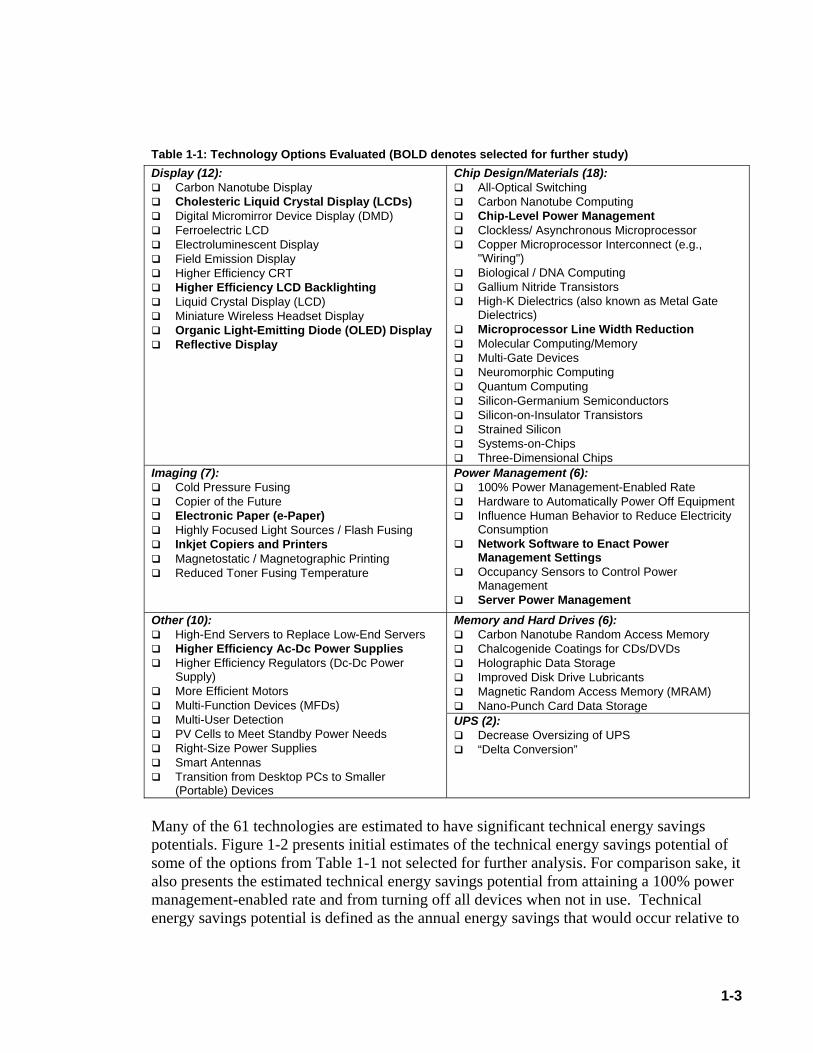
Figure 1-1: Project Approach Summary It is important to note that selection or omission of a particular technology option at a given project stage does not endorse or refute any technical concept, i.e., no “winners” or “losers” are selected. The selected technologies, however, were considered of greater interest for further study, as guided by the industry experts who provided input. This philosophy was clearly reflected in the criteria for selecting the eleven options for further study, i.e., their energy saving potential and the value of further study toward improving estimates of ultimate market-achievable energy savings potential. Indeed, a number of the 50 options not selected for further study had significantly greater energy savings potential than some of the eleven, but further study would not have appreciably clarified their market-achievable energy savings potential. 1.2 Summary of Findings Table 1-1 presents the 61 technologies initially considered, with the eleven options selected for further study highlighted in bold.
1-3
Table 1-1: Technology Options Evaluated (BOLD denotes selected for further study) Display (12):
Carbon Nanotube Display Cholesteric Liquid Crystal Display (LCDs) Digital Micromirror Device Display (DMD) Ferroelectric LCD Electroluminescent Display Field Emission Display Higher Efficiency CRT Higher Efficiency LCD Backlighting Liquid Crystal Display (LCD) Miniature Wireless Headset Display Organic Light-Emitting Diode (OLED) Display Reflective Display
Chip Design/Materials (18): All-Optical Switching Carbon Nanotube Computing Chip-Level Power Management Clockless/ Asynchronous Microprocessor Copper Microprocessor Interconnect (e.g.,
"Wiring") Biological / DNA Computing Gallium Nitride Transistors High-K Dielectrics (also known as Metal Gate
Dielectrics) Microprocessor Line Width Reduction Molecular Computing/Memory Multi-Gate Devices Neuromorphic Computing Quantum Computing Silicon-Germanium Semiconductors Silicon-on-Insulator Transistors Strained Silicon Systems-on-Chips Three-Dimensional Chips
Imaging (7): Cold Pressure Fusing Copier of the Future Electronic Paper (e-Paper) Highly Focused Light Sources / Flash Fusing Inkjet Copiers and Printers Magnetostatic / Magnetographic Printing Reduced Toner Fusing Temperature
Power Management (6): 100% Power Management-Enabled Rate Hardware to Automatically Power Off Equipment Influence Human Behavior to Reduce Electricity
Consumption Network Software to Enact Power
Management Settings Occupancy Sensors to Control Power
Management Server Power Management
Memory and Hard Drives (6): Carbon Nanotube Random Access Memory Chalcogenide Coatings for CDs/DVDs Holographic Data Storage Improved Disk Drive Lubricants Magnetic Random Access Memory (MRAM) Nano-Punch Card Data Storage
Other (10): High-End Servers to Replace Low-End Servers Higher Efficiency Ac-Dc Power Supplies Higher Efficiency Regulators (Dc-Dc Power
Supply) More Efficient Motors Multi-Function Devices (MFDs) Multi-User Detection PV Cells to Meet Standby Power Needs Right-Size Power Supplies Smart Antennas Transition from Desktop PCs to Smaller
(Portable) Devices
UPS (2): Decrease Oversizing of UPS “Delta Conversion”
Many of the 61 technologies are estimated to have significant technical energy savings potentials. Figure 1-2 presents initial estimates of the technical energy savings potential of some of the options from Table 1-1 not selected for further analysis. For comparison sake, it also presents the estimated technical energy savings potential from attaining a 100% power management-enabled rate and from turning off all devices when not in use. Technical energy savings potential is defined as the annual energy savings that would occur relative to

1-4
the installed base1 of equipment if the technology option immediately was installed/enacted in all reasonable applications. It does not consider that the actual ultimate market penetration would be less than 100%, nor the time required for technologies to diffuse into the market. Nonetheless, the technical energy savings potentials indicate the potential for considerable reduction of the 97TWh of electricity consumed by nonresidential office and telecommunications equipment.
0
5
10
15
20
25
30
100%
PM
-ena
bled
Rat
e
Hard
war
e to
Pow
er O
ffEq
uipm
ent
Carb
on N
anot
ube
Disp
lay
Liqu
id C
ryst
al D
ispl
ay
Min
iatu
re W
irele
ssHe
adse
t Dis
play
Cloc
kles
s/As
ynch
rono
usM
icro
proc
esso
r
Silic
on-G
erm
aniu
mSe
mic
ondu
ctor
s
Silic
on-o
n-In
sula
tor
Tran
sist
ors
Cold
Pre
ssur
e Fu
sing
Flas
h Fu
sing
Occ
upan
cy S
enso
rs fo
rPo
wer
Man
agem
ent
Hig
h-En
d Se
rver
sRe
plac
ing
Low
-End
Serv
ers
Impr
oved
Reg
ulat
ors
(DC
-DC
PS)
Mul
ti-fu
nctio
n De
vice
s(M
FDs)
Righ
t-Siz
e Po
wer
Supp
lies
Repl
ace
Desk
top
PCs
with
Por
tabl
e De
vice
s
Estim
ated
Tec
hnic
al E
nerg
y Sa
ving
s Po
tent
ial [
TWh]
Figure 1-2: Technology Options with Significant Energy Savings Potential (not selected for further study)
The study characterized the eleven technologies selected for further study, including their technology status and technical energy savings potentials. The “technology status” entries are defined as: • Current: Technologies that are currently in use but have not achieved broad market
penetration; • New: Technologies that are commercially-available but presently not used in
commercial office or telecommunications equipment and systems; • Advanced: Technologies yet to be commercialized or demonstrated and which require
research and development. The energy savings potential of different options varies greatly between approaches (see Table 1-2). The body of the report contains in-depth discussions of the options, including development of estimated energy savings potential, non-economic benefits, economics (e.g., cost premiums and simple payback periods), commercialization barriers, and developmental “next steps”.
1 Note that the annual energy consumption of monitors has been revised down in light of new data published in 2002 (see Appendix B).
1-5
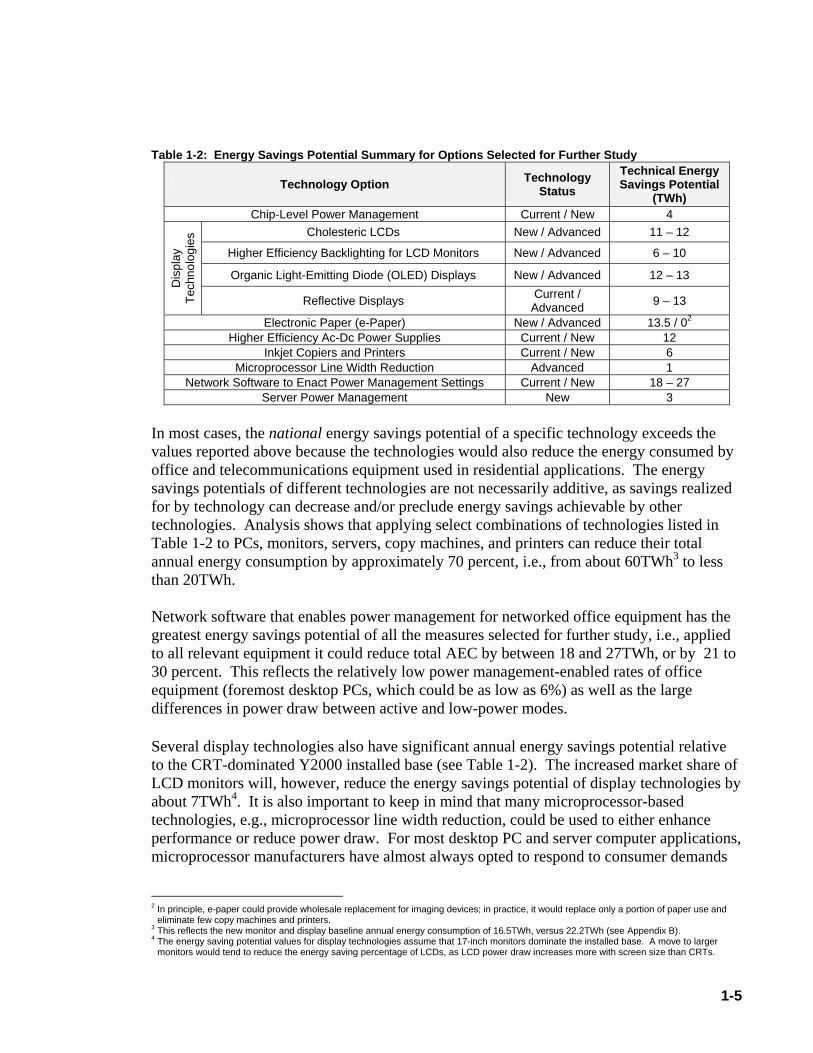
Table 1-2: Energy Savings Potential Summary for Options Selected for Further Study
Technology Option Technology Status
Technical Energy Savings Potential
(TWh) Chip-Level Power Management Current / New 4
Cholesteric LCDs New / Advanced 11 – 12
Higher Efficiency Backlighting for LCD Monitors New / Advanced 6 – 10
Organic Light-Emitting Diode (OLED) Displays New / Advanced 12 – 13
Dis
play
Te
chno
logi
es
Reflective Displays Current / Advanced 9 – 13
Electronic Paper (e-Paper) New / Advanced 13.5 / 02 Higher Efficiency Ac-Dc Power Supplies Current / New 12
Inkjet Copiers and Printers Current / New 6 Microprocessor Line Width Reduction Advanced 1
Network Software to Enact Power Management Settings Current / New 18 – 27 Server Power Management New 3
In most cases, the national energy savings potential of a specific technology exceeds the values reported above because the technologies would also reduce the energy consumed by office and telecommunications equipment used in residential applications. The energy savings potentials of different technologies are not necessarily additive, as savings realized for by technology can decrease and/or preclude energy savings achievable by other technologies. Analysis shows that applying select combinations of technologies listed in Table 1-2 to PCs, monitors, servers, copy machines, and printers can reduce their total annual energy consumption by approximately 70 percent, i.e., from about 60TWh3 to less than 20TWh. Network software that enables power management for networked office equipment has the greatest energy savings potential of all the measures selected for further study, i.e., applied to all relevant equipment it could reduce total AEC by between 18 and 27TWh, or by 21 to 30 percent. This reflects the relatively low power management-enabled rates of office equipment (foremost desktop PCs, which could be as low as 6%) as well as the large differences in power draw between active and low-power modes. Several display technologies also have significant annual energy savings potential relative to the CRT-dominated Y2000 installed base (see Table 1-2). The increased market share of LCD monitors will, however, reduce the energy savings potential of display technologies by about 7TWh4. It is also important to keep in mind that many microprocessor-based technologies, e.g., microprocessor line width reduction, could be used to either enhance performance or reduce power draw. For most desktop PC and server computer applications, microprocessor manufacturers have almost always opted to respond to consumer demands
2 In principle, e-paper could provide wholesale replacement for imaging devices; in practice, it would replace only a portion of paper use and
eliminate few copy machines and printers. 3 This reflects the new monitor and display baseline annual energy consumption of 16.5TWh, versus 22.2TWh (see Appendix B). 4 The energy saving potential values for display technologies assume that 17-inch monitors dominate the installed base. A move to larger
monitors would tend to reduce the energy saving percentage of LCDs, as LCD power draw increases more with screen size than CRTs.

1-6
for improved performance instead of reducing power draw and there is no clear reason why this will change in the near future. Overall, some common themes arise as to how different technologies reduce energy consumption (see Table 1-3). Table 1-3: Common Themes to Energy Consumption Reduction
Energy Consumption Reduction Theme Relevant Technologies
Decrease Active Mode Power Draw
• Chip-Level Power Management • Cholesteric LCDs • Electronic Paper (e-Paper) • Higher Efficiency Ac-Dc Power Supplies • Higher Efficiency Backlighting for LCD Monitors • Microprocessor Line Width Reduction • Organic Light-Emitting Diode (OLED) Displays • Reflective Displays
Increase Time Spend in Low-Power Modes
• Electronic Paper (e-Paper) • Higher Efficiency Ac-Dc Power Supplies • Inkjet Copiers and Printers • Network Software to Enact Power Management Settings • Server Power Management
Consumers clearly purchase office and telecommunications equipment for productivity enhancement, paying minimal – if any – attention to the energy consumption characteristics of the equipment. When energy does come into play, it is driven by product concerns, such as thermal limitations of equipment components, increased portability/battery life, decreased fan noise, lower data center power densities, and improved product quality/lifetime (e.g., Fisher 2002, McKeefry 2004). Hence, commercialization of different technologies depends greatly upon the non-energy benefits of the equipment. Several of the eleven technologies share common non-energy benefits that can, in some cases, significantly enhance their commercial potential (see Table 1-4). Table 1-4: Common Non-Energy Benefits of the Eleven Technology Options
Non-Energy Benefit Relevant Technologies
Increased Battery Life for Portable Devices
• Chip-Level Power Management • Cholesteric LCDs • Higher Efficiency Backlighting for LCD Monitors • Microprocessor Line Width Reduction • Organic Light-Emitting Diode (OLED) Displays • Reflective Displays
Reduce Display Footprint
• Cholesteric LCDs • Organic Light-Emitting Diode (OLED) Displays • Reflective Displays
Potential for Lower First Cost
• Higher Efficiency Backlighting for LCD Monitors (field-sequential) • Inkjet Copiers and Printers • Organic Light-Emitting Diode (OLED) Displays • Reflective Displays

1-7
First cost is the largest market barrier impeding existing (“current”) technologies with limited market share (see Table 1-5). New office and telecommunications technologies must offer clearly superior performance, additional features, or appreciable cost savings relative to existing technologies to have an impact in the marketplace. If a technology has attributes that impair user productivity in any sense, this will have a strongly adverse impact its commercial potential. Several less mature technologies must overcome manufacturing quality and cost, reliability, and basic material issues before they could be commercialized. Table 1-5: Common Barriers Facing the Eleven Technologies
Barrier Relevant Technologies
Higher First Cost (“current” technologies)
• Higher Efficiency Ac-Dc Power Supplies • Network Software to Enact Power Management
Settings
Manufacturing Quality or Cost
• Cholesteric LCDs • Electronic Paper (e-Paper) • Higher Efficiency Ac-Dc Power Supplies • Higher Efficiency Backlighting for LCD Monitors
(color-pixel backlighting; OLED/LED/HCFL/TFFL) • Organic Light-Emitting Diode (OLED) Displays • Reflective Displays
Device Reliability
• Organic Light-Emitting Diode (OLED) Displays • Electronic Paper (e-Paper)** • Higher Efficiency Backlighting for LCD Monitors
(photoluminescent LCD; OLED/LED/HCFL/TFFL) • Server Power Management
Performance Issues
• Cholesteric LCDs • Electronic Paper (e-Paper) • Network Software to Enact Power Management
Settings* • Higher Efficiency Backlighting for LCD Monitors
(OLED/LED/HCFL/TFFL; lower luminance levels*) • Reflective Displays • Server Power Management**
Basic Research Needed • Higher Efficiency Backlighting for LCD Monitors • Organic Light-Emitting Diode (OLED) Displays
*Perceived issues **Concerns; unknown at present
Owing to the different barriers and developmental stages of the different options, the options have a wide range of potential developmental “next steps” towards the commercialization of technologies (see Table 1-6). Except for the software technologies, most of the eleven technologies only have relevance to new products.
1-8
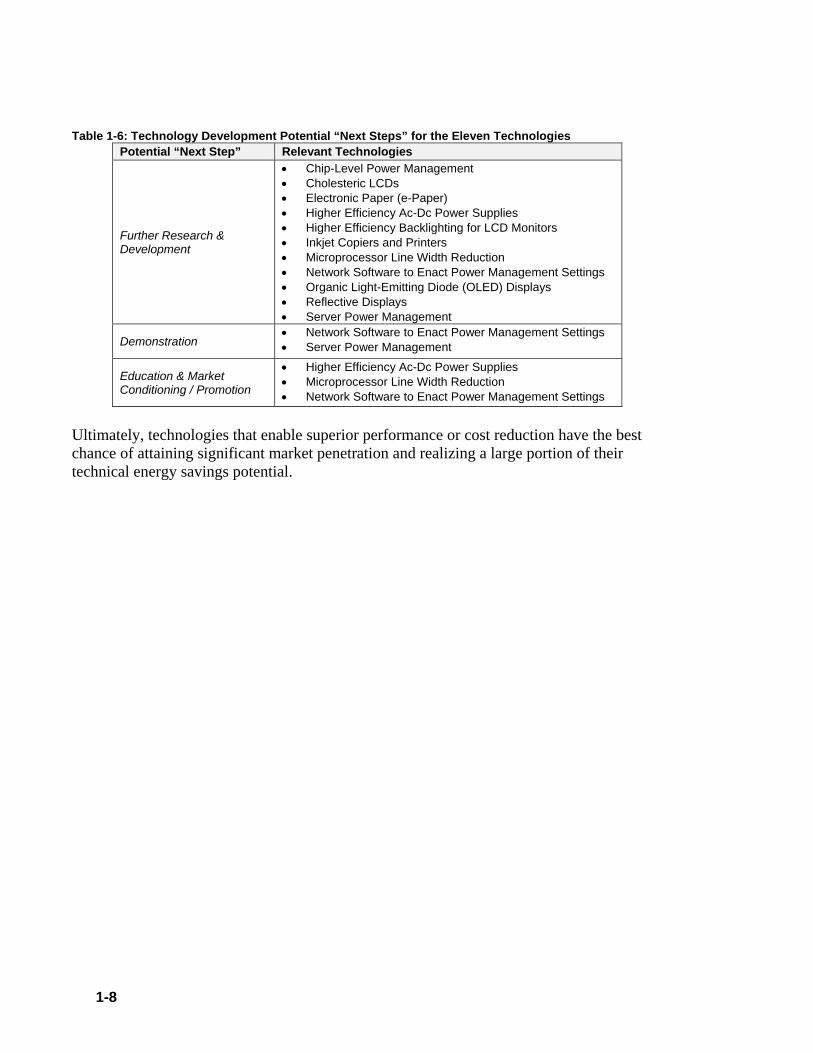
Table 1-6: Technology Development Potential “Next Steps” for the Eleven Technologies Potential “Next Step” Relevant Technologies
Further Research & Development
• Chip-Level Power Management • Cholesteric LCDs • Electronic Paper (e-Paper) • Higher Efficiency Ac-Dc Power Supplies • Higher Efficiency Backlighting for LCD Monitors • Inkjet Copiers and Printers • Microprocessor Line Width Reduction • Network Software to Enact Power Management Settings • Organic Light-Emitting Diode (OLED) Displays • Reflective Displays • Server Power Management
Demonstration • Network Software to Enact Power Management Settings • Server Power Management
Education & Market Conditioning / Promotion
• Higher Efficiency Ac-Dc Power Supplies • Microprocessor Line Width Reduction • Network Software to Enact Power Management Settings
Ultimately, technologies that enable superior performance or cost reduction have the best chance of attaining significant market penetration and realizing a large portion of their technical energy savings potential.

2-1
2 INTRODUCTION This report is the second volume of a two-volume set of reports on energy consumption by office and telecommunications equipment in commercial buildings in the U.S. The first volume was completed by Arthur D. Little, Inc. (ADL) and this second volume by TIAX LLC, formerly the Technology & Innovation business of ADL, ensuring continuity to the two-volume endeavor. Volume 1 contains a significant amount of background information regarding office and telecommunication equipment types, particularly the eight key equipment types (see Table 2-1), and the energy savings potential calculations rely upon the detailed breakdowns of energy consumption put forth in ADL (2002). Table 2-1: Key Equipment Categories (from ADL 2002)
Key Equipment Categories Computer Monitors and Displays Personal Computers Server Computers Copy Machines Computer Network Equipment Telephone Network Equipment Printers Uninterruptible Power Supplies (UPSs)
Hence, the reader is encouraged to refer to Volume 1 as required to supplement this report.
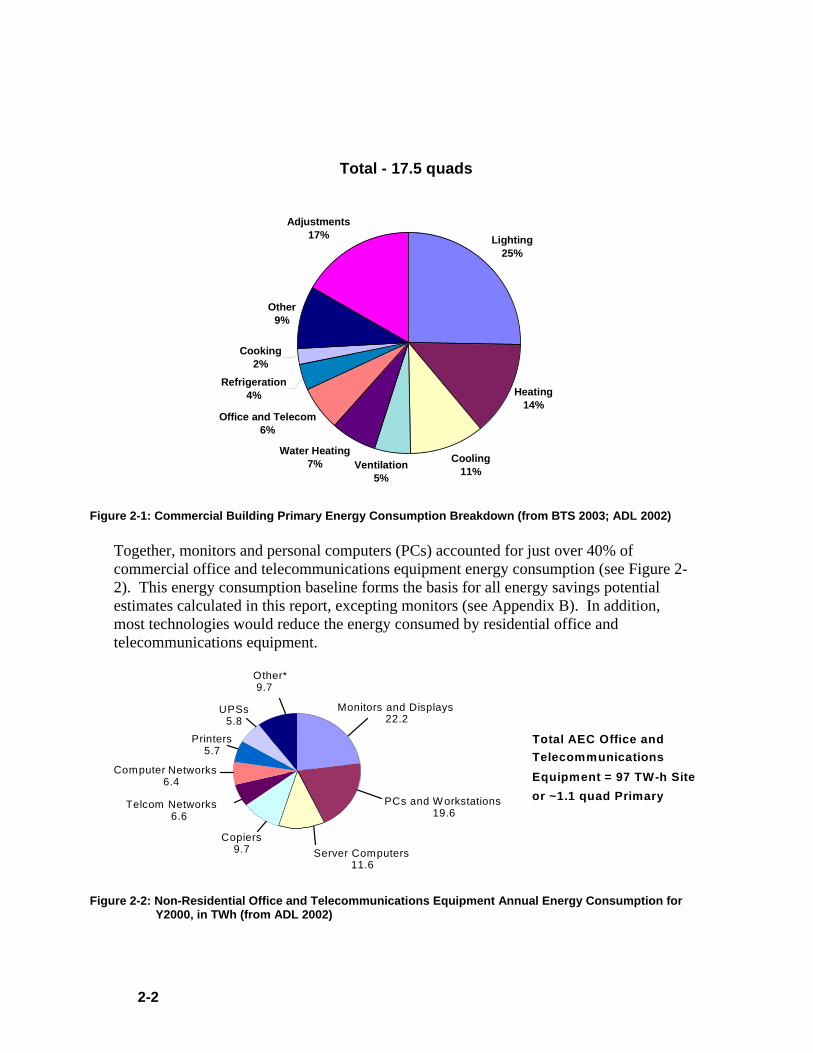
2.1 Background The Volume I report found that commercial office and telecommunications equipment consumed a total of 97TWh of electricity in 2000, an amount equivalent to just under 3% of U.S. electricity consumption. In primary energy terms, commercial office and telecommunications equipment consumed about 1.1 quads of primary energy5 in 2000, which equals just over 1% of U.S. energy consumption. Put in the context of commercial building energy consumption, office and telecommunications energy consumption represented about 6% of sector primary energy consumption in 2001 (see Figure 2-16).
5 Primary energy, as opposed to site energy, takes into account the energy consumed at the electric plant to generate the electricity. On
average, each kWh of electricity produced in Y2000 consumed 11,030 Btu (BTS 2003). 6 HVAC and Refrigeration values from circa 1995; other values from circa 2000.
2-2
Total - 17.5 quads
Lighting25%
Heating14%
Cooling11%Ventilation
5%
Water Heating7%
Office and Telecom6%
Refrigeration4%
Cooking2%
Other9%
Adjustments17%
Figure 2-1: Commercial Building Primary Energy Consumption Breakdown (from BTS 2003; ADL 2002)
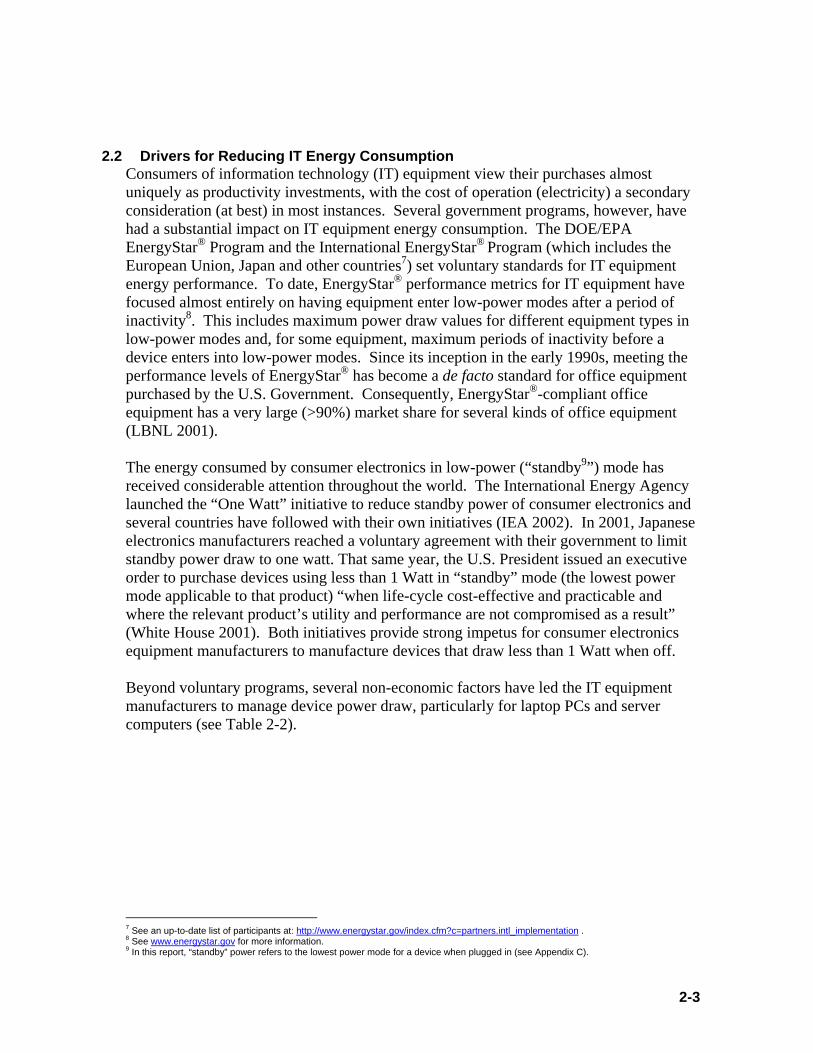
Together, monitors and personal computers (PCs) accounted for just over 40% of commercial office and telecommunications equipment energy consumption (see Figure 2-2). This energy consumption baseline forms the basis for all energy savings potential estimates calculated in this report, excepting monitors (see Appendix B). In addition, most technologies would reduce the energy consumed by residential office and telecommunications equipment.
Monitors and Displays22.2
Other* 9.7
Printers 5.7
Computer Networks 6.4
Telcom Networks 6.6
Copiers 9.7 Server Computers
11.6
PCs and Workstations19.6
UPSs 5.8
Total AEC Office and Telecommunications Equipment = 97 TW-h Site or ~1.1 quad Primary
Figure 2-2: Non-Residential Office and Telecommunications Equipment Annual Energy Consumption for
Y2000, in TWh (from ADL 2002)
2-3
2.2 Drivers for Reducing IT Energy Consumption
Consumers of information technology (IT) equipment view their purchases almost uniquely as productivity investments, with the cost of operation (electricity) a secondary consideration (at best) in most instances. Several government programs, however, have had a substantial impact on IT equipment energy consumption. The DOE/EPA EnergyStar® Program and the International EnergyStar® Program (which includes the European Union, Japan and other countries7) set voluntary standards for IT equipment energy performance. To date, EnergyStar® performance metrics for IT equipment have focused almost entirely on having equipment enter low-power modes after a period of inactivity8. This includes maximum power draw values for different equipment types in low-power modes and, for some equipment, maximum periods of inactivity before a device enters into low-power modes. Since its inception in the early 1990s, meeting the performance levels of EnergyStar® has become a de facto standard for office equipment purchased by the U.S. Government. Consequently, EnergyStar®-compliant office equipment has a very large (>90%) market share for several kinds of office equipment (LBNL 2001). The energy consumed by consumer electronics in low-power (“standby9”) mode has received considerable attention throughout the world. The International Energy Agency launched the “One Watt” initiative to reduce standby power of consumer electronics and several countries have followed with their own initiatives (IEA 2002). In 2001, Japanese electronics manufacturers reached a voluntary agreement with their government to limit standby power draw to one watt. That same year, the U.S. President issued an executive order to purchase devices using less than 1 Watt in “standby” mode (the lowest power mode applicable to that product) “when life-cycle cost-effective and practicable and where the relevant product’s utility and performance are not compromised as a result” (White House 2001). Both initiatives provide strong impetus for consumer electronics equipment manufacturers to manufacture devices that draw less than 1 Watt when off. Beyond voluntary programs, several non-economic factors have led the IT equipment manufacturers to manage device power draw, particularly for laptop PCs and server computers (see Table 2-2).
7 See an up-to-date list of participants at: http://www.energystar.gov/index.cfm?c=partners.intl_implementation . 8 See www.energystar.gov for more information. 9 In this report, “standby” power refers to the lowest power mode for a device when plugged in (see Appendix C).

2-4
Table 2-2: Non-Economic Factors Driving Reductions in Office and Telecommunications Equipment
Energy Consumption Factor Benefits
Longer Battery Life • Increased period of “unplugged” operation for portable devices • Larger market for portable devices
Reduced Component / Device Temperatures
• Decreased thermal loads • Faster microprocessor speed • Longer component life • Quieter devices (smaller fans, eliminate fans) • Reduced fusing time (for imaging devices) • Reduced microprocessor power draw (lower leakage current)
Decreased Data Center Power Density
• Higher equipment density • Decreased cost of electricity and HVAC infrastructure • Reduced demands on HVAC system
The energy efficiency of office and telecommunications equipment is a very difficult concept to quantify because: 1) it does not reflect quality gains, 2) it often does not correlate with actual device usage, and 3) Moore’s law makes efficacy-linked metrics for computational equipment relatively meaningless. Some appliances use an efficacy metric based on the ratio of energy consumed to functionality provided, e.g., kWh per load of wash given standard wash conditions. For certain types of office equipment, this would be a more straightforward metric, e.g., energy consumed per page printed. Such a metric does not, however, capture improvements in image quality, printing rates, color imaging, etc. For others, notably calculating equipment (PCs, servers), it would be much more difficult to come up with a meaningful metric due to the wide range of functionality provided. Energy consumed per floating point operation (FLOP) gives a feel for general computational efficiency10, but many nominally computing devices, notably PCs, are often used for less computationally intensive activities, such as word editing, web browsing, and e-mail. Models for standard usage profiles have been developed, e.g., laptops and copy machines, that might be tailored to other devices (desktop PCs, web servers11, printers). FLOP-based metrics run into another “problem”: Moore’s Law renders them virtually useless as a comparative efficiency metric. For more than 30 years, the number of transistors (and speed) of microprocessors has doubled roughly every 18 to 24 months, while peak microprocessor power draw has grown much, much more slowly due to physical limitations. Consequently, microprocessors and other computer components that follow similar scaling (RAM, hard drives, graphics) cannot help but show dramatic increases in FLOP-based efficacy over even a couple of years. Over the past 20 years, for example, the FLOP-based efficacy of a PC has increased roughly 1,000-fold but PC active power draw has perhaps doubled. If PC active power draw had increased in proportion to FLOPs, commercial PCs would have consumed roughly 17,000TWh in 2000, or about five times U.S. electricity consumption in 2000. 10 Japan’s Top Runner program establishes minimum efficiency standards for the weighted average value performance metrics for all
computers made by a given manufacturer in a given year based on Watts per mega theoretical operations per second (W/MTOPS; see: http://www.eccj.or.jp/top_runner/chapter5-22.html ). It applies to all manufacturers who sell 200 or more PCs and servers a year (Top Runner 2004).
11 Belady (2004) mentions that transactions per watt as a viable metric for some servers.

2-5
Historically several factors have hindered all energy efficiency gains. For most businesses, energy is not a core function or a major cost for the business. Consequently, many businesses are unwilling to make substantial investments in energy efficiency improvements that would displace core capital investments. At the building level, energy costs simply do not represent a significant portion of expenditures for most buildings, e.g., one study found that energy expenditures account for just over 1% of total annual expenditures for a medium-sized office building (see Table 2-3, from Cler et al. 1997). Table 2-3: Breakdown of Typical Small Office Building Annual Expenditures (from Cler et al. 1997)
Expenditure Annual Cost, $/ft2
Office-Workers’ Salaries 130 Gross Office Rent 21 Total Energy Use 1.81 Electricity Use 1.53 Repair and Maintenance 1.37 Total Building Operations and Management Salaries 0.58 Office and Telecommunications Equipment, Electricity Consumption (Rough Estimate by TIAX) 0.27
Based on ADL (2002), office and telecommunications equipment account for only on the order of 0.2% of building expenditures12. On the other hand, the dominance of worker salaries suggest that any productivity gains from office and telecommunications equipment will far outweigh energy savings. Indeed, on a fundamental level, office equipment is purchased to enhance worker productivity. Thus, for the most part, only technologies that improve worker productivity by enhancing the performance of office and telecommunications equipment will have a chance to penetrate the market. Furthermore, the energy saved by efficiency measures applied to office and telecommunications equipment usually equals a small portion of the total life cycle cost of the equipment. For example, network software exists that can enact specific power management (PM) settings for all devices connected to the network. This saves energy by shifting desktop PCs and monitors into the lower-power “sleep” state at night and over weekends that would otherwise remain in the “active” mode. It can reduce desktop PC unit energy consumption (UEC) by more than 50% and that of monitors by about 40% (see Section 4.8). Nonetheless, over the lifetime of the equipment the energy saved by this energy-saving approach equals a small percentage of the device capital cost (see Table 2-4).
12 ADL (1999) estimated that offices account for ~21% of conditioned floorspace, and consume ~22% of commercial building HVAC energy
consumption, suggesting that offices account for roughly 22% of all commercial energy consumption not attributed to office and telecommunications equipment. ADL (2002) estimated that office and telecommunications equipment accounts for ~9% of commercial sector electricity consumption. Assuming that roughly 50% of office and telecommunications equipment occurs in office buildings, this implies that office and telecommunications equipment is responsible for ~18% of electricity consumed in offices ( =[(0.09*0.5)/((1-0.09)*0.22+0.5*0.09)] ). This is equivalent to $1.53/ft2.*0.18 ~$0.27/ft2 per year, or $0.27/$154 ~0.2%.

2-6
Table 2-4: Electric Cost Savings versus Device Capital Costs for Network Power Management13
Equipment Type Equipment Lifetime14
[years] Capital Cost
[$USD] Lifetime
Operating Cost Reduction
Ratio of Electricity Savings to Capital Cost
Desktop PC 3 $1,000 $26 2.6% Monitor (CRT) 3 $200 $39 20% Copier (Band 3) 6 $10,000 $161 1.6% Laser Printer (Desktop) 4 $800 $90 11%
2.3 Study Approach
This report examines the potential of 6115 energy-saving technologies to reduce office and telecommunications equipment energy consumption in commercial buildings. The initial list of technology options came from a review of IT literature, discussions with people in the IT industry, and a survey of ongoing IT research. Each technology was characterized by its maturity and its development stages (see Tables 2-5 and 2-6). Table 2-5: Descriptions of Technology Technical Maturity Stages
Technical Maturity Stage Description
Current Technologies that are currently available, but not in broad market areas
New Technologies that are commercially available, but presently not in use for office and telecommunications equipment
Advanced Technologies that have not yet been commercialized or demonstrated and that still require research and development
Table 2-6: Descriptions of Technology Development Stages
Technical Maturity Stage Description
1. Basic Science Research
Fundamental science exploration performed to expand field’s knowledge base.
2. Applied Research Modeling and/or Laboratory testing performed to identify applications or technical pathways to an application
3. Exploratory Development
Product concept addressing an energy efficiency priority, using laboratory testing to select most promising approach from potential approaches
4. Advanced Development Product concept testing on laboratory prototype to evaluate performance parameters and market issues; focuses target applications and product specifications
5. Engineering Development
Field testing and evaluation of prototype to refine/enhance design features and establish performance limitations
6. Product Demonstration Operational field demonstrations to validate performance
DOE, IT Industry, and TIAX experts selected 11 of the 61 technology options for further study, based on their personal estimates of the technologies with the greatest technical 13 Sources for the table: approximate costs of representative equipment from advertised sales prices; device lifetimes from ADL (2002);
electric rate of $0.070/kWh; savings for the “auto-standby” scenario based on data presented in Section 4.8. 14 From ADL (2002). 15 The initial list contained more than the 61 options presented in this report; 61 represents the final number after consolidating several
options.
2-7
and market-achievable energy savings potential. Although the project attempted to select the technology options perceived to have greater energy savings potential for more study, it is important to note that this project did not select “winners”, i.e., omission of a technology at a given point of the project does not necessarily mean that the technology has negligible promise. In some cases, the team decided not to evaluate technologies with significant energy savings potential because it believed that further study would not yield appreciably greater insight (e.g., for liquid crystal displays [LCDs]). Further study of the eleven included developing improved energy savings estimates, performance gains, economic information, as well as identifying key barriers to widespread commercialization of each technology and potential development “next” steps to overcome the barriers. Section 4 contains the detailed discussions of each of the eleven technology options selected. In addition, Appendix A presents the tabular summaries of preliminary information developed for all technologies not selected for further study; each write-up is approximately one-half page in length.
2.4 Report Organization The Volume 2 report has the following organization: Section 3 describes the process used to choose the 11 technology options selected for further study. Section 4 presents the 11 technology options selected for further study and spends several pages explaining each technology, including its energy savings potential, impact of device performance, cost impact (economics), barriers to its widespread commercialization, and developmental “next steps.” Section 5 presents the conclusions of this report. Appendix A contains concise tabular summaries of information developed for the 50 technologies not selected for further study.


3-1
3 ENERGY SAVING TECHNOLOGY SELECTION PROCESS Figure 3-1 outlines the overall project flow that was used to select and assess technologies that could reduce energy consumption by office and telecommunications equipment in commercial buildings.
Step 1 - Generate i nitial list of tech nology op ti ons
Step 2 - Develop p re lim in ary tech nical energy savi ngs p otentialesti mates
Step 4 - Select option s for furth er study
Step 5 - Analyze energy savings p otential , perform an ce benefi tsecon omi cs, b arr iers an d ”n ext step s”
Step 3 - Soli ci t ou tsi de feed back on ini ti al sel ections forfurth er stud y
Figure 3-1: Steps of theTechnology Option Selection Process The following sub-sections explain each step of the technology option selection process in more detail.
3.1 Initial List of Technology Options (Steps 1 and 2) An initial list of technology options that could potentially reduce the energy consumption of office and telecommunications equipment in commercial buildings comes from a variety of sources, including: • IT and Scientific Popular Press (IEEE Spectrum, Scientific American, Technology
Review, Computer, etc.); • Corporate and University IT Research (IBM, Intel, MIT, DARPA, etc.); • The wider office and telecommunications literature (TIAX/ADL reports, Lawrence
Berkeley National Laboratory reports, etc.), and • TIAX16 and DOE personnel. The initial list of technologies strove to be inclusive to enable consideration of a broad range of technologies,. As such, it included many technologies that may have limited energy savings potential (or not save energy at all) and ideas of questionable merit (e.g., major issues with technical feasibility, cost, and/or performance gains). 16 TIAX was formerly the Technology & Innovation business of Arthur D. Little, Inc.

3-2
3.2 Selecting Options for Further Study (Steps 3 and 4)
After compiling the initial list of more than 60 energy saving options and developing preliminary technical energy savings potential estimates for each, TIAX asked a variety of industry, DOE, and TIAX experts to select the options that they believe exhibited the greatest promise to reduce the energy consumption of office and telecommunications equipment in commercial buildings. The voters received the following instructions: 1. Base your selections on your perception of Technical Energy Savings Potential and
Market-Achievable Energy Savings Potential; 2. Select up to 4 3-point options, and 3. Select up to 8 1-point options. The ability to assign greater weight (3 points) to certain options enabled voters to identify options that they believed to have particular promise. The tally of the votes identified several technologies for further study. Further consultation with the DOE program managers led to the selection of additional options, for a total of eleven options chosen for further study (see Table 3-1). Table 3-1: Technology Options Selected for Further Study
Technology Option Chip-Level Power Management Cholesteric LCDs Electronic Paper (e-Paper) Higher Efficiency Ac-Dc Power Supplies Higher Efficiency Backlighting for LCD Monitors Inkjet Copiers and Printers Microprocessor Line Width Reduction Network Software to Enact Power Management Settings Organic Light-Emitting Diode (OLED) Displays Reflective Displays Server Power Management
3.3 More Refined Evaluation of Options Selected for Further Study (Step 5)
Further analysis for the technology options addressed issues and questions specific to each technology. For each option, the more refined evaluation focused on key information needed to provide a clearer image of the technology’s technical and market-based energy saving potential. This ranged from developing a clearer, quantitative understanding of how the option affects energy consumption of the relevant equipment types to gathering additional cost information related to the technology option. Section 4 contains the evaluation of each technology option selected for further study, paying particular attention to the technical energy savings potential, cost, performance impact, and market barriers.

4-1
4 ANALYSIS OF THE TECHNOLOGY OPTIONS SELECTED FOR FURTHER STUDY Section 4 of the report presents the analyses for the eleven options selected for further study (see Table 4-1), with each sub-section containing the results for a single technology option. Table 4-1: Energy Savings Potential Summary for Options Selected for Further Study
Technology Option Technology Status
Technical Energy Savings Potential
(TWh) Chip-Level Power Management Current / New 4
Cholesteric LCDs New / Advanced 11 – 12
Higher Efficiency Backlighting for LCD Monitors New / Advanced 6 – 10
Organic Light-Emitting Diode (OLED) Displays New / Advanced 12 – 13
Dis
play
Te
chno
logi
es
Reflective Displays Current / Advanced 9 – 13
Electronic Paper (e-Paper) New / Advanced 13.5 / 017 Higher Efficiency Ac-Dc Power Supplies Current to New 12
Inkjet Copiers and Printers Current / New 6 Microprocessor Line Width Reduction Advanced 1
Network Software to Enact Power Management Settings Current / New 18 – 27 Server Power Management New 3
It is important to note that the energy savings potentials of different technologies are not necessarily additive, as savings realized for by technology can, to varying degrees, decrease and/or preclude energy savings achievable by other technologies. Each write-up follows the same basic format:
• Technology Option Status Summary; • Technology Key Metrics Summary Table; • Background Information (how it would impact the performance of key office and
telecommunications equipment types, how it could save energy); • Energy Savings Potential Summary and Discussion; • Cost (economic) Summary and Discussion; • Barriers to Commercialization; • Technology Development “Next Steps”, and • References.
Each technology option summary includes the “Relevant Primary Energy Consumption”, which equals the amount of energy consumed by commercial office and telecommunications equipment to which the technology option could be applied. Table 4-2 presents the breakdown of the 97TWh consumed by commercial office and telecommunications equipment by equipment type. This report does not take into account
17 In principle, e-paper could provide wholesale replacement for imaging devices; in practice, it would replace only a portion of paper use and eliminate few copy machines and printers.

4-2
indirect energy impacts of technologies, such as the energy consumed to manufacture the equipment, HVAC energy consumption, and changes in national energy consumption patterns (see the Volume I report, ADL [2002], for an overview of these impacts). For comparison, U.S. electricity consumption in 2000 totaled 3,610 TWh (EIA 2001).
Table 4-2: Commercial Office and Telecommunications Equipment Energy Consumption Breakdown (from ADL 2002, Appendix B)
Component Total Energy Use (TWh) Percent Monitors and Displays 22.2 / 16.5* 23%
Monitors 18.8 / 14.0* 19% General Displays 3.4 / 2.6* 4%
PCs and Workstations 19.6 20% PCs – Desktop 17.4 18%
Workstations 1.8 2% PCs – Laptop 0.38 0%
Server Computers 11.6 12% Low-End 4.5 5%
Workhorse 3.3 3% Mid-Range 2.0 2%
Data Storage 1.5 2% High-End 0.37 0%
Copiers 9.7 10% Telecoms Networks 6.6 7%
Cell Site Equipment 2.3 2% Transmission (Phone) 1.8 2% Public Phone Network 1.0 1%
Private Branch Exchanges 1.0 1% Wireless Phones 0.49 1%
Computer Networks 6.4 7% LAN Switches 3.3 3%
Hubs 1.6 2% Routers 1.1 1%
WAN Switches 0.15 0% UPSs 5.8 6% Printers 5.7 6%
Laser Printers 4.6 5% Inkjet Printers 0.56 1%
Impact Printers 0.37 0% Line and Other Printers 0.15 0%
Other* 9.7 10% *ADL (2002) / Appendix B values. **Other” includes: Facsimile machines, desktop and handheld calculators, point-of-sale (POS)
terminals, electric typewriters, automated teller machines (ATMs), scanners, very small aperture terminals (VSATs), scanners, supercomputers, voice mail systems (VMSs), smart handheld devices, and dictation equipment.
Note: Sums do not always equal totals due to rounding.
In some instances, the simple payback period (SPP) was used to quantify the economics of a technology. It equals the cost of the energy savings afforded by the technology, CEsave, divided by the incremental premium of the energy efficiency measure, i.e., the difference between the cost of the default technology, Cdef, and that of the technology option, Copt,:

4-3
optdef
Esave
CCCSPP−
= .
De Canio (1994, from Hawken et al., 1999) found that about 80% of American firms that use some other method than first cost to study energy efficiency investments employed SPP, and that the median threshold SPP was 1.9 years. Hawken et al. (1999) note that this corresponds to a 71% real after-tax rate return on investment (ROI), far in excess of the 25% hurdle ROI set for many corporate internal investments. Unless stated otherwise, all calculations assumed that electricity in the commercial buildings sector cost $0.070/kWh18.
4.1 Chip-Level Power Management
4.1.1 Summary Chip-level power management applies software methods – either independently or in combination with specialized microprocessor architectures – to adjust processing capability (frequency and voltage) to the level required by the active application. As microprocessor power draw scales approximately linearly with clock frequency and quadratically with voltage, reductions in either leads to lower device power draw. Major microprocessor manufacturers have developed and applied this approach to laptop PCs devices and it appears that implementation on desktop PCs would have a negligible cost impact. On the other hand, chip-level power management for server computers is less mature and will require the development of ACPI-compatible hardware component drivers and BIOS software for server computers to enable implementation of server microprocessor frequency/voltage scaling schemes. This approach has significant energy savings potential, particularly for devices where the microprocessor accounts for a large percentage of total power draw, e.g., mid-size servers.
18 These reflect a rough average of the prices paid by commercial end users for electricity and gas circa 2000, based on data provided by the
EIA: http://www.eia.doe.gov/cneaf/electricity/epm/epmt53p1.html .

4-4
Table 4-3: Summary of Chip-Level Power Management Characteristics
Characteristic Result Comments
Technical Maturity and Technology Development Stage
Current / New
Existing products for PCs are available but not universally deployed from major (e.g. AMD, Intel) and specialty (e.g. Transmeta) manufacturers. Advances (e.g. more sophisticated control algorithms based on computational activity) have begun to enter the market for workstations and servers19
Basic Science Research
Applied Research
Exploratory Development
Advanced Development
Engineering Development
Product Demonstration
Commerciali-zation
Systems Impacted by Technology PCs, Servers, Workstations
Currently targeting PCs, Servers, and Workstations, with emphasis on laptop PCs
Relevant Electricity Consumption (TWh)20 27 / 32 Desktop PCs (17TWh) and Low-End, Workhorse, and Mid-Range Servers (9.5TWh); range reflects Y2000 and Y2002 baseline UECs for desktop PCs
Technical Energy Savings Potential (TWh [quads21])
4 [0.04]
Cost Impact of Technology Negligible Performance Benefits of Technology Increases laptop PC battery life; decreases thermal loads Notable Developers/Manufacturers of Technology
Intel (Speedstep™); AMD (PowerNow™); Transmeta (LongRun™)
Peak Demand Reduction
Yes Can reduce the percentage of desktop PCs operating at “full power” during peak demand periods (many PCs spend a considerable portion of active mode time in idle mode). Similar principles apply to servers, but servers have more regular processing requirements
Other Environmental Impacts None
Most Promising Applications Desktop PCs (6% to 25% PM-enabled rate) and servers with wide variation in processing requirements (see Section 4.11)
Technology “Next Steps”
• Develop processor/software systems with processing capabilities consistent with typical office/technical computing needs
• Refine technologies to enhance performance with respect to power savings and processor capabilities by developing more sophisticated approaches to interacting with the operating system and/or processor to determine processing speed requirements
4.1.2 Background and Performance Impact These technologies represent an approach to reducing the energy consumption of PCs and Servers by using software and/or hardware control of microprocessor power draw. Specifically these techniques seek to reduce power consumption by control of operating voltage and/or clock frequency in response to the computational needs of applications. The transient power draw of CMOS devices depends on both the operating voltage and signal frequency:
19 See: http://www.intel.com/pressroom/archive/releases/20040628comp.htm . Belady (2004) indicates that high-end servers have begun to use
processors capable of modulating voltage and frequency. 20 Y2000 based on ADL (2002) baseline. Y2002 values reflect Roberson et al. (2002); they, however, only surveyed 14 machines. 21 Per BTS (2003), electric energy is converted to primary energy [quads] using a 11,030 Btu/kWh rate in 2000.

4-5
,2
leakCCT PVfCP += where C denotes the equivalent power dissipation capacitance, f the operating frequency, VCC the dc power supply voltage, and Pleak the leakage current22. While the determination of the precise power by this relationship is difficult for a complex component such as a microprocesor, it illustrates the general principle that reductions in either voltage or frequency can achieve significant reductions in the power draw of CMOS components. PCs applied in most office applications, e.g., word processing, spreadsheet computations, or Internet browsing, are not particularly demanding from a computational standpoint in comparison to technical analyses (e.g., simulations) or even video gaming applications. Furthermore, most office computers spend a substantial fraction of active mode23 time in an idle state. For example, Intel estimates suggest that the average microprocessor load in an office environment is approximately 8% (Brady et al. 2003). This estimate rose to 19% when averaged over the full range of applications examined by Intel (Brady et al. 2003). Consequently, if the operating system can decrease the microprocessor operating frequency and voltage during periods of low microprocessor load, this can substantially reduce overall average energy consumption. The technologies reviewed in this section offer competing approaches to this problem. In particular, the following technologies were reviewed in this context: • Intel Speedstep™ – Power management system by the leading provider of
microprocessors for personal computers; • AMD PowerNow™ – Analogous offering by a major competitor to Intel; • Transmeta Longrun™ – Specialty company focussed in power management software.
The approach is to use “code morphing” which dynamically translates x86 instructions into “very long instruction words” (VLIW) formats;
• Northwestern University – Power-aware Architecture and Compilation Techniques (PACT) Project is a research program that proposes a cross-coupling of computer architectures and compilers with the goal of minimizing power consumption. It attempts to take applications written in the C language and generate power/performance efficient code for embedded computing systems.
In general, the approaches adopted by Intel, AMD and Transmeta have significant similarities, i.e., they monitor computational requirements, and adjust the voltage and/or clock frequency in response to actual computational demand. The principal differences revolve around the approach to estimating computational requirements and the sophistication of the control. It is important to consider the significance of power control technologies in the context of the overall contribution of microprocessors to the total power budget of a computer. For example, to the extent that microprocessor power is reduced to become a minor fraction of the total power budget, this decreases the energy savings 22 Leakage current occurs due to the finite resistance that a transistor in its off state poses between its high and low voltage sides. 23 Appendix C discusses the power mode terminology used in this report.
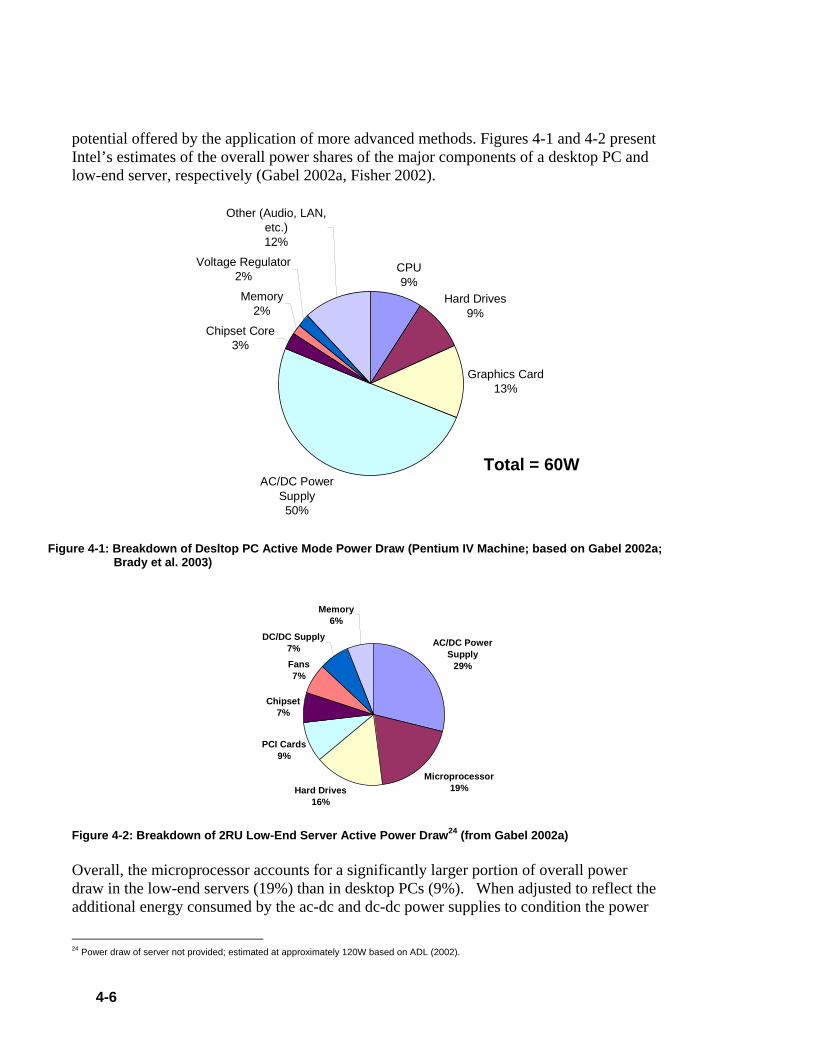
4-6
potential offered by the application of more advanced methods. Figures 4-1 and 4-2 present Intel’s estimates of the overall power shares of the major components of a desktop PC and low-end server, respectively (Gabel 2002a, Fisher 2002).
CPU9%
Hard Drives9%
Graphics Card13%
AC/DC Power Supply50%
Chipset Core3%
Memory2%
Voltage Regulator2%
Other (Audio, LAN, etc.)12%
Total = 60W
Figure 4-1: Breakdown of Desltop PC Active Mode Power Draw (Pentium IV Machine; based on Gabel 2002a;
Brady et al. 2003)
AC/DC Power Supply
29%
Microprocessor19%Hard Drives
16%
PCI Cards9%
Chipset7%
Fans7%
DC/DC Supply7%
Memory6%
Figure 4-2: Breakdown of 2RU Low-End Server Active Power Draw24 (from Gabel 2002a) Overall, the microprocessor accounts for a significantly larger portion of overall power draw in the low-end servers (19%) than in desktop PCs (9%). When adjusted to reflect the additional energy consumed by the ac-dc and dc-dc power supplies to condition the power
24 Power draw of server not provided; estimated at approximately 120W based on ADL (2002).
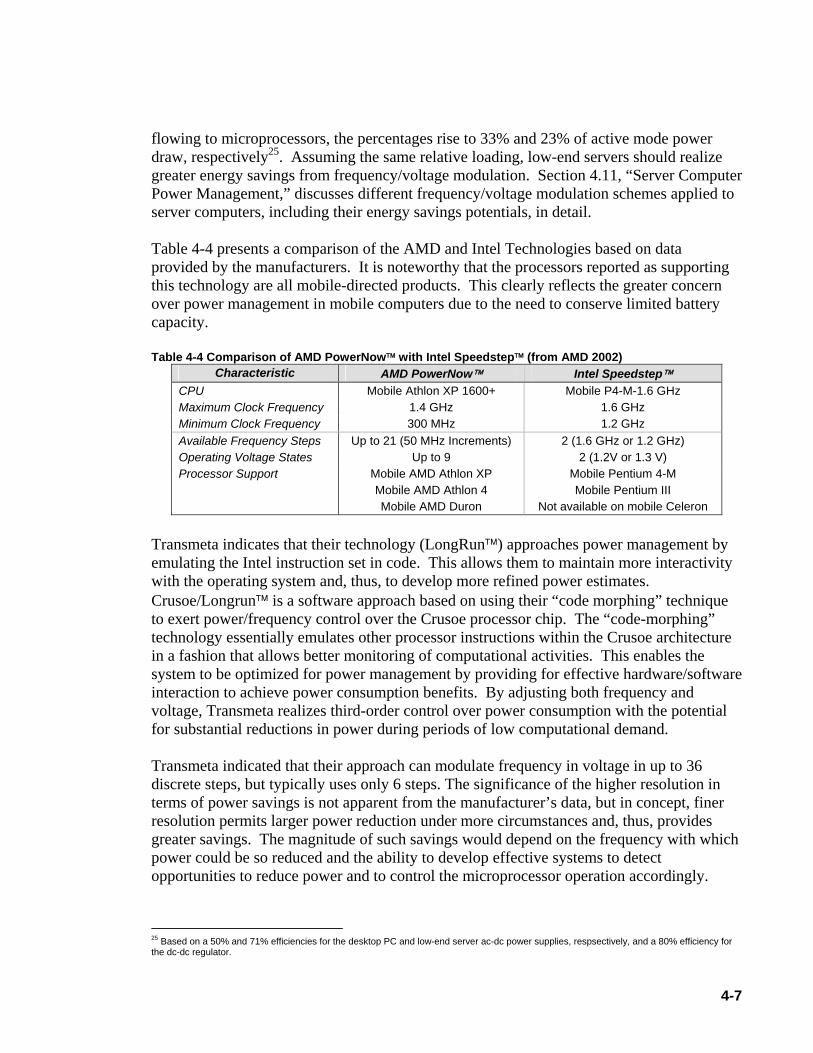
4-7
flowing to microprocessors, the percentages rise to 33% and 23% of active mode power draw, respectively25. Assuming the same relative loading, low-end servers should realize greater energy savings from frequency/voltage modulation. Section 4.11, “Server Computer Power Management,” discusses different frequency/voltage modulation schemes applied to server computers, including their energy savings potentials, in detail. Table 4-4 presents a comparison of the AMD and Intel Technologies based on data provided by the manufacturers. It is noteworthy that the processors reported as supporting this technology are all mobile-directed products. This clearly reflects the greater concern over power management in mobile computers due to the need to conserve limited battery capacity.
Table 4-4 Comparison of AMD PowerNow™ with Intel Speedstep™ (from AMD 2002)
Characteristic AMD PowerNow™ Intel Speedstep™ CPU Mobile Athlon XP 1600+ Mobile P4-M-1.6 GHz Maximum Clock Frequency 1.4 GHz 1.6 GHz Minimum Clock Frequency 300 MHz 1.2 GHz Available Frequency Steps Up to 21 (50 MHz Increments) 2 (1.6 GHz or 1.2 GHz) Operating Voltage States Up to 9 2 (1.2V or 1.3 V) Processor Support Mobile AMD Athlon XP
Mobile AMD Athlon 4 Mobile AMD Duron
Mobile Pentium 4-M Mobile Pentium III
Not available on mobile Celeron Transmeta indicates that their technology (LongRun™) approaches power management by emulating the Intel instruction set in code. This allows them to maintain more interactivity with the operating system and, thus, to develop more refined power estimates. Crusoe/Longrun™ is a software approach based on using their “code morphing” technique to exert power/frequency control over the Crusoe processor chip. The “code-morphing” technology essentially emulates other processor instructions within the Crusoe architecture in a fashion that allows better monitoring of computational activities. This enables the system to be optimized for power management by providing for effective hardware/software interaction to achieve power consumption benefits. By adjusting both frequency and voltage, Transmeta realizes third-order control over power consumption with the potential for substantial reductions in power during periods of low computational demand. Transmeta indicated that their approach can modulate frequency in voltage in up to 36 discrete steps, but typically uses only 6 steps. The significance of the higher resolution in terms of power savings is not apparent from the manufacturer’s data, but in concept, finer resolution permits larger power reduction under more circumstances and, thus, provides greater savings. The magnitude of such savings would depend on the frequency with which power could be so reduced and the ability to develop effective systems to detect opportunities to reduce power and to control the microprocessor operation accordingly.
25 Based on a 50% and 71% efficiencies for the desktop PC and low-end server ac-dc power supplies, respsectively, and a 80% efficiency for the dc-dc regulator.
4-8
By controlling power in this way, the goal is to achieve increased overall power efficiency for computer products. At least one manufacturer of blade servers has incorporated Transmeta processors (Hipp 2001). With respect to estimation of computational requirements and, hence, required power level, AMD’s approach is to interact with the operating system to obtain an estimate of computational activity. The method is not predictive in nature, but AMD claims that since PowerNow™ can switch states in micro-seconds, it does not require predictive computational estimates to save energy (Tang 2002). Transmeta’s Crusoe™ approach is claimed to offer better ability to estimate and adjust to computational load. This claim is based on the adopted approach of using “Code Morphing” software to translate the Intel x86 instruction set into VLIW instructions for use with the underlying Crusoe processor. This translation of the instruction set places the monitoring of computational needs completely under their control at the expense of replacing hardware operations with firmware code. The firmware resides in flash ROM and is configured to execute first (ahead of BIOS) upon power-up. Transmeta concedes that this approach causes a loss of performance, but believes that the appropriate trade-off for the future will be to provide adequate performance at reduced power. Specific estimates of the performance loss were not available for this analysis. Power monitoring is based on a complex set of heuristics, but the general approach may be summarized as follows: • Increment the frequency/voltage setpoint in response to observed idle time (unless
already at maximum setting), and • Decrement the frequency/voltage setpoint in response to excess idle time. The PACT Project at Northwestern University is a research program funded by the Defense Advanced Research Projects Agency (DARPA) directed at the development of low power hardware implementations, power-aware software and compiler architectures and power-aware Computer Aided Design (CAD) tools. At present, the research focuses on smaller embedded devices such as System-on-a-Chip (SOC), Application Specific Integrated Circuits (ASIC), Programmable Logic Devices (PLD) and Field Programmable Gate Arrays (FPGA). Over the medium term, the project hopes to translate applications written in the C programming language into power-efficient architectures and implementations. Currently, the power-aware compiler allows a designer to direct partitioning (of functions between and/or within devices) based on a set of tools designed to facilitate trade-offs among speed, area, and power draw. Essentially, it provides design tools that provide direct feedback to the design of the power implications of various architectural design options and thus facilitate choices among options such as embedded code, SOC, PLD or ASIC implementations. A longer term objective is to automate many of these architectural trade-offs to provide more effective design synthesis tools. The PACT project leader confirmed the claim that the Transmeta approach involves a trade-off with respect to lower performance due to the binary translation method in achieving enhanced power consumption (Banerjee 2003). Although the current work focuses on smaller, portable

4-9
devices, the PACT technology could be applied to larger processors, such as those used in PCs and server computers, in the future.
4.1.3 Energy Savings Potential The effectiveness of manipulation of real-time microprocessor frequency and voltage depends on the specific applications in use, the percentage of power represented by the microprocessor, and the extent of power savings arising from application of the technology.
As discussed in the prior subsection, the AMD technology presents more resolution in both frequency and voltage control than Intel and the typical Transmeta approach. In principle, this provides for the ability to track computational requirements more closely and, thus, to operate more nearly to the minimum possible power required to accomplish the task. Data from AMD show savings of roughly two- to four-fold reduction in microprocessor power draw while idle and while executing common applications such as word processing (see Figure 4-3, from AMD 2002). In mobile applications, this suggests that microprocessor voltage and frequency modulation can increase laptop PC battery life appreciably (AMD 2002; Tang 2002). Clearly, the energy savings potential depends on the portion of “active” mode time spent in “idle” as well as the applications invoked. The data from Figure 4-3 suggest that voltage and frequency modulation reduces microprocessor power draw by roughly a factor of three, which translates into about an 18% reduction in desktop PC power draw in “active” mode26.
26 Based on data from Intel (Gabel 2002a,b). As noted earlier in this section, the microprocessor accounts for about 23% of average desktop PC power draw in active mode after taking into account power supply and regulator losses, or about . Thus, a three-fold reduction in microprocessor power draw reduces total desktop PC power draw by 7.2W, or 12%.
71% 59% 57% 72% 71% 46% 71% 52% 73%
0
2
4
6
8
10
12
14
16
18
20
Windows Idle Word Excel PowerPoint DVDPlayback
MPEG4Playback
MP3Playback
FlashPlayback
MP3Encoding
Ave
rage
CPU
Pow
er (W
att)
35W Mobile Athlon XP 1600+, PowerNow! disabled 35W Mobile Athlon XP 1600+, PowerNow! enabled% Power Savings with PowerNow!
Figure 4-3 AMD Measured Processor Power Savings with PowerNow™ Technology (from AMD 2002)

4-10
Tables 4-5 and 4-6 presents a summary of the usage and power draw calculations for a baseline (i.e., ADL 2002 power draw and usage values) desktop PC, the same PC with “power aware” active mode, and the same PC with “power aware” active mode and 100% power-management-enabled (PM-enabled) by the same software. Table 4-5: Desktop PC Usage and Power Draw by Mode for Chip-Level Power Management, Y2000
Usage by Mode27 [hours/week] Case On Sleep Off
Baseline 98 7 62 Power Aware 98 7 62 Power Aware + 100% PM-enabled 19 86 62
Power Draw by Mode Case On Sleep Off
Baseline 55 25 1.5 Power Aware 47 25 1.5 Power Aware + 100% PM-enabled 47 25 1.5
Table 4-6: Desktop PC UEC and AEC for Chip-Level Power Management
Case UEC [kWh] AEC [TWh] % Reduction Baseline 296 17.4 N/A Power Aware 255 14.9 14 Power Aware + 100% PM-enabled 166 9.7 44
Nationally, chip-level power management reduces annual energy consumption (AEC) by about 14% when applied only to the active power draw state, but by much more – 44% –when used to also power down the desktop PC into “sleep” mode during lulls in activity. The much greater energy savings for the “power aware + 100% PM-enabled” case clearly is due to the fact that more than 50% of desktop PCs are estimated to be “active” at night combined with the low PM-enabled rate of desktop PCs (estimates between 6% and 25%; Roberson et al. 2004; Webber et al. 2001). On the other hand, the active mode power draw of PCs has trended upward since 2000 while “sleep” power draw values have decreased (see Table 4-7 for circa Y2002 values, based on Roberson 2002). Table 4-7: Desktop PC Usage and Power Draw by Mode Values for Chip-Level PM, Y2002
Power Draw by Mode Case On Sleep Off
Y2002 Baseline 70 9 3 Power Aware 60 9 3 Power Aware + 100% PM-enabled 60 9 3
The “power aware” case applied only to the active mode has a similar AEC reduction as the Y2002 baseline case. Strikingly, the greater difference between the “on” and “sleep” mode power draw results in much greater energy savings, about 70%, in the “power aware” case
27 Note: In some cases, hours do not sum to 168 due to rounding.

4-11
where the software also places the PC into “sleep” mode during periods of inactivity (see Table 4-8). Table 4-8: Desktop PC UEC and AEC for Chip-Level PM, Y2002
Case UEC [kWh] AEC [TWh] % ReductionY2002 Baseline 372 22 N/A Power Aware 319 19 14 Power Aware + 100% PM-enabled 112 5 70
As described in Section 4.11.3 (“Server Power Management – Energy Savings”), voltage/frequency scaling can also reduce the average power draw of many low-end, workhorse, and mid-range servers by approximately 20 to 25%. This translates into a national electricity savings of roughly 1.5TWh when applied to the relevant portion of the server population.
4.1.4 Cost Intel provides its SpeedStep™ technology at no additional cost to its OEMs with the exception of, perhaps, the incremental cost of using more efficient power supplies (Brady et al. 2003). Presumably, the AMD PowerNow™ microprocessor also adds negligible cost. The PACT power-conscious software design tool is currently being developed for smaller embedded devices. Research and development applicable to processors has yet to begin. Thus, its cost impact on microprocessors cannot be reasonably assessed. Nonetheless, microprocessors developed using power-conscious software would need to yield cost-competitive designs to succeed in the market.
4.1.5 Perceived Barriers to Market Adoption of Technology Although the technologies presented exhibit considerable potential for energy savings, a number of potential barriers are apparent, including:
• Consumer demand currently focuses on high performance processors and not on energy savings – products that offer reduced power at the expense of reduced processing capability will likely be at a disadvantage in the market place. Laptop PCs and other mobile applications represent notable exceptions, due to the high value of increased battery life;
• The implementation of effective real-time voltage/frequency scaling requires access to good information about real-time computational loads. Obtaining this information requires sophisticated hardware/software interactions that are not supported in many prevalent products, i.e., a common set of structures to access this information currently does not exist;
• If novel power management schemes, e.g., developed under PACT, result in increased cost to achieve enhanced power performance, they are not likely to meet with consumer enthusiasm.
4-12
4.1.6 Technology Development “Next Steps” To achieve effective solutions, the technology developers need to accomplish a number of goals, including:
• Enhance consumer awareness that current microprocessors have more than sufficient capability to meet the needs of most office applications. Consequently, voltage/frequency modulation usually saves energy without compromising performance;
• Encourage major microprocessor manufacturers to integrate existing approaches, i.e., voltage/frequency modulation, into standard products (e.g., desktop PCs) through alliances between hardware and software manufacturers. This requires development of standard interfaces between operating systems and processor components (common hardware/software information exchange protocols). If achieved, this facilitates the implementation of voltage/frequency scaling and increases its effectiveness;
• Developing microprocessor design tools that facilitate power-aware microprocessor design appropriate for server and desktop PC applications.
4.1.7 References ADL 2002, “Energy Consumption by Office and Telecommunications Equipment in
Commercial Buildings Volume 1: Energy Consumption Baseline.”, Final Report Prepared for the U.S. Department of Energy, Office of Building Technology, January.
AMD 2002, “AMD PowerNow!™ Technology”, Mobile Marketing Presentation, September Banerjee, P., 2003, Personal Communication, Northwestern University, December. Brady, T., D. Bodas, and D. Gabel, 2003, Presentation / Personal Communication, February. Fisher, K., 2002, “Drivers for Efficient Power Consumption in Desktop/Mobile PC and
Servers” , Proc. of the 2nd IEECB Conference, 27-29 May, Nice, France. Gabel, D., 2002a, Personal Communication, Intel Corporation, August. Gabel, D., 2002b, Personal Communication, Intel Corporation, December. Roberson, J. A., R.E. Brown, B. Nordman, C.A. Webber., G.K. Homan, A. Mahajan, M.
McWhinne, J.G. Koomey, 2002, “Power Levels in Office Equipment: Measurements of New Monitors and Personal Computers”, Proc. ACEE Summer Study on Energy Efficiency in Buildings, Pacific Grove, CA, 22-26 August.
Roberson, J.A., C.A. Webber, M.C. McWhinney, R.E. Brown, M.J. Pinckard, and J.F. Busch, 2004, “After-Hours Power Status of Office Equipment and Inventory of Miscellaneous Plug-Load Equipment”, Lawrence Berkeley National Laboratory Final Report, Report Number LBNL-53729. Available at: http://enduse.lbl.gov/info/LBNL-53729.pdf .
Tang, J., 2002, Personal Communication, AMD Corporation, December. Webber, C.A., Roberson, J.A.., Brown, R.E., Payne, C.T., Nordman, B., and Koomey, J.G.,
2001, “Field Surveys of Office Equipment Operating Patterns”, LBNL Report, LBNL-46930, September. Available at: http://enduse.lbl.gov/Info/LBNL-46930.pdf

4-13
4.2 Cholesteric LCDs
4.2.1 Summary Cholesteric technology is a non-traditional Liquid Crystal Display (LCD) technology that is capable, in principle, of providing low-power reflective displays given sufficient ambient lighting. The reflective nature of the display could significantly reduce monitor AEC by eliminating some or all of the backlight power draw.. In addition, cholesteric displays exhibit a bistable presentation of data and require power only upon changing the state of a display element (pixel). At present, however, cholesteric displays cannot meet several key demands of monitor applications, including refresh rates, adequate color performance, and display brightness (when purely reflective in low light conditions). They also have high drive voltages and use three LC layers to realize colors, both of which increase their cost. Given that cholesteric displays must make significant progress on several key issues, cholesteric technology appears to be an unlikely candidate for major penetration into the computer monitor markets for several years. Table 4-9: Summary of Cholesteric Displays Characteristics
Characteristic Result Comments Technical Maturity and Technology Development Stage
New / Advanced
One organization (Kent Displays) actively pursuing this technology in the U.S.
Basic Science Research
Applied Research
Exploratory Development
Advanced Development
Engineering Development
Product Demonstration
Commerciali-zation
Systems Impacted by Technology Monitors, display terminals
Current products focus on signage, electronic book products, and small handheld displays
Relevant Electricity Consumption (TWh) 22 / 16 See Appendix B
Technical Energy Savings Potential (TWh / [quads])28
11 – 12 [0.12 – 0.13]
Cost Impact of Technology Likely small For mature manufacturing process; preliminary
information suggests higher cost of higher voltage drivers largely offsets reduced cost of cholesteric LC from elimination of color filters and polarizers
Performance Benefits of Technology Increased battery life of mobile devices; image does not “wash out” in high illumination situations (e.g., outdoors)
Notable Developers/Manufacturers of Technology
Kent Displays; Liquid Crystal Institute at Kent State University; Advanced Display Systems, no longer actively pursues development (Tang 2003)
Peak Demand Reduction Significant; >80% reduction in active mode power draw, the prevalent mode for monitors during peak demand periods
Other Environmental Impacts Elimination of backlight would eliminate mercury from the cold cathode fluorescent lamp in LCDs; eliminates lead used in CRT monitors
Most Promising Applications Small display products with relatively low information update rates (handheld devices, cell phone displays, signage, etc.)
Technology “Next Steps”
• Develop active matrix product with higher update rate (~60Hz as compared to 4 Hz now and current 30 Hz prototype)
• Enhance display brightness in low-light situations • Decrease manufacturing cost • Develop cost-effective color displays
28 On a % basis, monitor energy savings vary little regardless of which power draw data are used.

4-14
4.2.2 Background and Performance Impact Display technology is a critical driver in numerous contemporary electronic applications. The constant trade-off between performance and power consumption (especially in battery operated portable devices) makes affordable, low-power display technology a particularly attractive option for use in modern electronic design. Cholesteric display technology originated in 1991 at the Liquid Crystal Institute at Kent State University. The method takes advantage of the bistable and reflective properties of cholesteric crystal structures to form a display that consumes significant power only during changes of the displayed information. Cholesteric displays rely on the liquid crystal (LC) phase exhibited by chiral molecules or mixtures containing chiral components. The crystal structure is similar to nematic liquid crystals in that cholesteric materials exhibit long range average orientational structure but lack large scale positional order. Relative to the nematic LC, the critical distinction of a cholesteric crystal is its helical structure in which the preferred direction (director) of adjoining layers exhibits a slight twist. The resulting crystal structure’s helix is characterized by a “pitch” representing the periodicity of the helical rotation. Consequently, the Bragg reflection occurs in a cholesteric LC whenever the incident wavelength equals an integer multiple of the helix pitch. By adjusting the state and properties of the crystal electrically, it is possible to build elements that selectively reflect light in limited spectral bands, enabling fabrication of a color display without the need for color filters or polarizer (Wu and Yang 2001). In conventional tranmissive LCDs, color filters and polarizers contribute significantly to display cost and have a very low optical efficiency (less than 15%; see Section 4.5.2). Unfortunately, in the current state of the art, control of the display elements requires significantly higher voltages than do more conventional active matrix LCD elements. The latter complicates fabrication and adds cost to the display. Since the display is reflective (i.e., illumination occurs by reflection of ambient light rather than transmission of an active light source), cholesteric displays can eliminate the need for the backlight used in current active matrix displays. In addition, the reflective quality of cholesteric displays also prevents them from “washing out” under high illumination conditions, e.g., when exposed to sunlight. Under some circumstances, i.e., low ambient light levels may need supplementary frontlighting to provide a clear and legible display. To date, most applications of cholesteric LCDs have focused on small displays or signage. Cholesterics have yet to enter the computer display market for several reasons discussed in the “Barriers” section (Section 4.2.4).
4.2.3 Energy Savings Potential Cholesteric displays reduce monitor active mode power draw in two ways. First, cholesteric displays have very high reflectivity, about 40 to 50%29 (Crawford 2002a, Doane 2003, Amundson 2003), a value not far from that of newsprint (around 60%) and about half that of white paper (about 80%; Wu and Yang 2001). As a consequence, in most office settings,
29 Crawford (2002a) cites 40-45% for peak reflectivity, ~20-25% for photopic reflectance.

4-15
cholesteric displays could operate without backlighting, which would reduce active mode power draw by about 80% relative to conventional transmissive LCDs (see Section 4.10 for additional details). If they did use supplemental front-lighting to achieve white-paper luminance levels under typical office conditions30, cholesteric displays would still realize most of the reduction in active power draw due to their high reflectivity (around 40%) relative to the light efficiency of transmissive LCDs (approximately 4%; see section 4.5). Second, the bistable nature of cholesteric displays implies that the driver electronics only draw power when a pixel changes. In contrast, conventional CRT and LCD displays refresh the image for each cycle, i.e., at least 30 times a second. Thus, driver electronics power draw will decrease substantially in applications with relatively stable images, including most office applications. To some extent, the higher drive voltages required by cholesteric displays will offset gains from bi-stability. Table 4-10 shows the estimated reduction in monitor power draw and AEC for a cholesteric LC monitor in a well-lit office setting. These reflect updated CRT and LCD power draw values as discussed in Appendix B. All calculations embody four assumptions: 1. All monitors are 17-inch monitors; 2. All cholesteric LCDs have the same power draw in sleep and off modes as current
LCDs; 3. Backlighting and driver electronics account for 80% and 20% of baseline LCD monitor
active mode power draw, respectively (Simmarano 2003); 4. The driver electronics power draw remains constant while the backlight component
changes for each approach studied. Table 4-10: Cholesteric Monitors – Power Draw by Mode and AEC
Display Type Active [W] Sleep [W] Off [W] AEC
[TWh] Source
CRT 61 2 1 13.1 LCD 35 2 2 7.9
Roberson et al. (2002)
Frontlit Cholesteric LC – White Paper Illuminance 7.931 2 2 2.3
Frontlit Cholesteric LC – 200 cd/m2 Illuminance 12.832 2 2 3.3
Cholesteric LCD – Purely Reflective 7.0 2 2 2.1
Roberson et al. (2002) for
“sleep” and “off” modes
Assuming complete penetration of the monitor market, cholesteric LC monitors could reduce monitor AEC by up 11TWh. Even if cholesteric displays require front lighting to achieve the luminance values of current LCDs, i.e., 200cd/m2, they still can reduce monitor AEC by about 10TWh.
30 250 lux; see Section 4.10.3. 31 Assumes 50% reflectance, light pipe efficiency of 50% (Anandan 2002), similar reflectivity as for ambient light, a CCFL lamp efficacy of 45
lm/W, and a power supply efficiency of 70%; viewable area = 337.9mm x 270.3mm (from http://compare.HitachiDisplays.com/hitachidisplays/productinfo.jsp?id=1136 ).
32 Assumes 50% reflectance, light pipe efficiency of 50% (Anandan 2002), similar reflectivity as for ambient light, a CCFL lamp efficacy of 45 lm/W, and a power supply efficiency of 70%; viewable area = 337.9mm x 270.3mm .

4-16
4.2.4 Cost Cholesteric displays for large, high performance applications such as computer displays remain developmental in nature. As a result, manufacturing costs are higher. Based on discussion with a leading promoter of cholesteric displays, two principal factors influence the application cost of this technology (Doane 2003): • Materials costs are lower than current displays due to elimination of the polarizer,
retardation layer, and color filters, and • Current implementations require higher driver voltage (approximately 30 to 40V33)
which increases fabrication cost due to inconsistency with current semiconductor manufacturing processes.
At present, it appears that these two factors are largely offsetting and result in a projected cost comparable to that of LCD displays34. Significant cost savings could occur if semi-conductor technology provides lower cost solutions to the higher-voltage drivers. The latter would probably be motivated by advances in the core cholesteric technology to enhance performance to attractive levels with respect to brightness and refresh rates. In addition, cholesteric displays that use stacked layers of red, green, and blue arrays would increase display cost relative to a single-layer display.
4.2.5 Perceived Barriers to Market Adoption of Technology Cholesteric display technology faces several critical barriers to widespread use in monitors: • Low refresh rates – Current performance levels (four frames per second) and active
matrix prototypes (30 Hz) cannot support video content, although the developer sees no clear obstacles to developing devices with enhanced performance. The problem becomes more challenging as display resolution increases (Doane 2003);
• Lower brightness than current transmissive LCDs – Current commercial display products developed by Kent achieve approximately 50% reflectance, yielding a luminance of around 40cd/m2 in a well-lit office35 compared to the 150-250cd/m2 typical of tranmissive LCD monitors (see Section 4.10). Kent has achieved 75% (equivalent to paper) in some developmental products, which still falls well short of current LCD monitor luminance (60 versus 150 to 250cd/m2). It is not clear, however, that monitor applications require high luminance levels (see following subsection).
• High drive voltages – Device drivers presently require much higher drive voltages than transmissive LCDs, increasing their cost (~30-4036V versus 10-15V);
• Color Performance: The state of color cholesteric displays is not very mature. Cholesteric displays can achieve color performance by using stacked layers of red, green, and blue arrays (Wu 2003). This maintains a high-reflectance display, but increases display cost relative to a single-layer display. The different distances from the
33 Crawford (2002a) estimates 20-35V. 34 On the other hand, OLED-based displays could have a significantly lower cost than both LCD and cholesteric displays; see Section 4.9. 35 250 lux; see Section 4.10.3. 36 Admuson (2003) notes driving voltages as high as 50V.
4-17
color arrays to the display surface also tends to cause parallax of the display, which can mix colors and degrade display resolution (Wu 2003).
• Low-Cost Manufacturing Techniques– Low-cost manufacturing techniques presently are not available for cholesteric displays, notably production of the higher voltage drive electronics. Although the base technology is consistent with existing infrastructure (and lower in cost due to the absence of color filters and polarizers), the incorporation of high voltage drives adds significantly to manufacturing cost;
As a result, existing successful applications have largely been limited to small size, low performance applications such as handheld displays and signage. A cholesteric LCD manufacturer sells a full-color 6.3-inch VGA module37, but larger and higher-resolution displays need to be developed for monitors. Given that cholesteric displays must make significant progress on several key issues to achieve market competitiveness, combined with the vast sums being invested worldwide to enhance and reduce the cost of other display technologies, cholesteric technology currently appears to be an unlikely candidate for major penetration into the computer monitor over the next several years.
4.2.6 Technology Development “Next Steps” To enter the PC monitor market, cholesteric displays need to achieve similar performance and cost as alternative technologies (i.e., active matrix LCDs and in the future, OLED-based displays), specifically: • Develop display capability at computer monitor sizes (i.e., 15- to 17-inch displays); • Increase the refresh rate to levels suitable for personal computer use (around 60Hz); • Develop technology with lower drive voltage requirements and/or approaches to lower
the cost of display driver circuits to reduce display production cost; • Develop cost-effective color displays.
4.2.7 References ADL 2002, “Energy Consumption by Office and Telecommunications Equipment in
Commercial Buildings Volume 1: Energy Consumption Baseline.”, Final report prepared for the U.S. Department of Energy, Office of Building Technology, January.
Amundson, K., 2003, “Toward Electronic Paper”, Society for Information Display: Seminar Lecture Notes: Volume II, 23 May, Baltimore, pp. F-3/1 - F-3/42.
Anandan, M., 2002, “LCD Backlighting”, Society for Information Display: Seminar Lecture Notes: Volume II, 24 May, Boston, pp. F-5/1 - F-5/82.
Crawford, G.P., 2002a, “Liquid-Crystal Technology”, Society for Information Display: Seminar Lecture Notes: Volume I, 24 May, Boston, pp. M-2/1- M-2/28.
Doane, W., 2003, Personal Communication, Kent Displays, March. 37 Manufactured by Kent Displays, the display has a fesolution/format of 640 by 480 and 127 dots per inch (DPI). Information available at: http://www.kentdisplays.com/order/literature/StandardDS.pdf .

4-18
Roberson, J. A., R.E. Brown, B. Nordman, C.A. Webber., G.K. Homan, A. Mahajan, M. McWhinne, J.G. Koomey, 2002, “Power Levels in Office Equipment: Measurements of New Monitors and Personal Computers”, Proc. ACEE Summer Study on Energy Efficiency in Buildings, Pacific Grove, CA, 22-26 August.
Tang, R., 2003, Personal Communication, Advanced Display Systems. Wu, S.-T. and D.-K. Yang, 2001, Reflective Liquid Crystals, John Wiley & Sons, Ltd.:
Chichester, UK. Wu, S.-T., 2003, “Reflective and Transflective LCDs”, Society for Information Display:
Seminar Lecture Notes: Volume II, 23 May, Baltimore, pp. F-4/1-F-4/54. 4.3 E-paper Electronic paper, or e-paper, is an emerging product that displays text or picture images on a thin and flexible display. Ideally, the display would appear similar to paper, provide additional functionality beyond paper, and could replace paper consumption and the associated imaging energy consumption. Current e-paper displays, however, lack several positive attributes of paper, including ease of annotation, nor do they offer comparable image quality (e.g., reflectance and resolution). Moreover, projected e-paper costs are more than two orders of magnitude higher than conventional paper, which calls into question the viability of e-paper for most common applications. It appears highly unlikely that e-paper will supplant conventional paper in most office applications any time soon.
4.3.1 Summary Table 4-11: Summary of E-paper Characteristics
Characteristic Result Comments Technical Maturity and Technology Development Stage
New / Advanced
Very limited demonstration of display technologies in signage and e-book applications
Basic Science Research
Applied Research
Exploratory Development
Advanced Development
Engineering Development
Product Demonstration
Commerciali-zation
Systems Impacted by Technology Copy Machines and Laser Printers Relevant Electricity Consumption (TWh) 13.5 Roughly 2/3rd copy machines , 1/3rd laser printers
Technical Energy Savings Potential (TWh / [quads])
13.5 / 0 [0.15 / 0]
In principle, e-paper could provide wholesale replacement for imaging devices; in practice, it would probably replace only a portion of paper use and eliminate few copy machines and printers
Cost Impact of Technology High E-paper is many years away from replacing paper in most office applications
Performance Benefits of Technology Utility Greatly reduced bulk and weight relative to paper Notable Developers/Manufacturers of Technology
Canon, E Ink, Fuji Xerox, Gyricon Media, Iridigm Display Corporation, Sony
Peak Demand Reduction Yes / No See “Technical Energy Savings Potential” comments
Other Environmental Impacts Eliminates energy used to produce paper; additional energy consumed to produce e-paper; disposal of e-paper
Most Promising Applications Personal Laser Printers Technology “Next Steps” Development of truly flexible, durable and inexpensive e-paper

4-19
4.3.2 Background and Performance Impact E-paper is a new medium for displaying text or picture images on a thin and flexible display that would resemble paper. E-paper typically consist of a thin (>1mm; E-Ink 2002b, Gyricon Media 2003, Werner 2003), flexible, and durable plastic sheet incorporating an array of pixels. Another device transmits a digital representation of an image to the e-paper, switching the pixels to display the desired image on the e-paper. After registering the new image, e-paper requires no power to maintain the image displayed because it is both reflective and bi-stable. Reflective displays, in contrast to conventional monitors, reflects sufficient ambient light such that the display does not require another light source (e.g., back lighting). Additionally, bi-stable displays have pixels with two stable states that can be maintained for extended periods without power. Such displays can maintain an image for at least 18 hours (Webber 2002) or, in some instances, indefinitely38. Pixels remain in their registered state until the e-paper receives a different image transmission (in contrast to image refreshing). For these reasons, e-paper consumes power only when the display changes. Initial development of e-paper focused on developing a substitute for office paper, i.e., “electronic reusable paper” (Werner 2003). This clearly reflects its origin in an imaging and document company. Used as such, e-paper would reduce the imaging energy consumed by printers and copiers39. Technologies considered for e-paper include: bistable nematic liquid crystal, cholesteric liquid crystal, electrochromic, electrophoretic, ferroelectric liquid crystal, interferometric MEMS, and rotating balls (Amundson 2003). The current discussion focuses on electrophoretic and rotating ball variants, as they appear to have the most promising characteristics for office paper applications. Electrophoretic and rotating ball e-paper are based on similar principles. In both cases, each sheet of e-paper comprises an array of electrically-charged pigmented particles sandwiched between a transparent top layer of plastic and an opaque back plastic layer. The back layer incorporates drive electronics to control the display pixels, each of which consists of many particles. At present, these particles are typically bi-color, with a highly reflective side and a side that reflects very little light. Applying a charge to a pixel either attracts or repels the particles making up that pixel from the bottom or top layers, which causes the particles to assume the desired orientation, i.e., to reflect or not reflect light, and create an image. Once generated, the display does not consume energy to maintain the image. The thin, plastic substrate gives e-paper designs significant substrate flexibility, e.g. some substrates can be wrapped around a 4.5 cm radius (Slikkerveer et al. 2002). Several manufactures are attempting to commercialize products based on e-paper. Figure 4-4 depicts electrophoretic e-paper.
38 See: http://www.gyriconmedia.com/smartpaper/faq.asp, FAQ #9. 39 Such a paradigm shift would also decrease the energy consumed to produce paper, which is on the order of ~20TWh/year (ADL 2002). Of
course, e-paper production would consume additional energy.

4-20
Figure 4-4: Illustrative Schematic of Electrophoretic E-Paper (Courtesy of E ink) A sheet of electrophoretic e-paper consists of a plastic film, proprietary electronic ink, and a layer of control circuitry (see Figure 4-4). The ink contains positively charged white and negatively charged black pigment chips contained in microcapsules. In turn, the microcapsules lie between the circuit and the plastic layer. To switch an individual pixel between black and white, the control electronics change the electric field which either attracts or repels the ink particles in the capsule to present either a white or black pixel (E-ink 2002a). An alternate approach uses microscale “cups” to contain the pigment chips (USDC 2003). Another company has developed a “rotating ball” e-paper architecture. They, too, use bi-color particles sandwiched between two plastic sheets but, instead of using capsules filled with many particles, the display has charged spheres with black and white sides into cavities built into the plastic substrate. Each display pixel comprises one to four beads, with more beads typically used to ensure acceptable performance (Pham et al. 2002). Application of an electric field causes the bead to rotate in its cavity to display the black or white hemisphere to the user. At least one company has worked on electrodeposition-based e-paper. A basic electrodeposition display has front and back surfaces, with a gel electrolyte containing metal ions (e.g., silver) between them. Patterned electrodes on the display surfaces locally apply a voltage to the gel to control individual display pixels. When the applied voltage falls below a threshold level, the metal ions leave the gel and deposit on an electrode (i.e., electroplating). This causes that pixel to display the color of the metal material. Applying a voltage above a different threshold level causes the metal ions to go back into solution and exposes the highly-reflective (e.g., TiO2) backplane. A prototype electrodeposition display has exhibited a reflectance in excess of 70% and a contrast ratio in excess of 20:1, but have encountered problems in achieving truly black pixels (Shinozaki 2002). Several methods could be used to change the e-paper and the best choice probably depends the e-paper application. In conventional paper applications, e.g., forms, the e-paper could
4-21
pass through a printer-like device that contains drive electronics (and, in the case of Yamamoto et al. 2001, a light source) to change the individual pixels. Portable wands (or similar) housing drive electronics are another option. A user would sweep the wand over the e-paper to change its pixels as needed (Babyak 2000). Signage applications, on the other hand, would likely incorporate drive electronics in the e-paper backplane to enable remote (e.g., wireless) modification of the display. An e-book that uses e-paper incorporate an active matrix backplane (i.e., drive electronics; Sony 2004). Most e-paper efforts have focused on bi-color displays, typically black and white without gray scale capability (the two colors, however, could be composed of any pigment). At least two developers have demonstrated color e-paper. One uses color filters, which reduce display brightness by about a factor of three, while another uses adjacent red, green and blue capsules at the sub-pixel level to reflect light of different colors (Amundson 2003). Although initial e-paper development centered on creating re-usable paper (Werner 2003), e-paper developers now envision applying e-paper for other applications. Specifically, applications exploiting the high image quality (brightness, broad field of view) and low power draw (i.e., have very low update rates) characteristics of e-paper, such as dynamic store signage and electronics books have been targeted. E-paper signage products40 recently have come to market and retail signage continues to be a target market for new products. The low-power, eye-catching, and durable characteristics of the segmented displays (i.e., a retail type advertisement display) present an attractive option because of the ease of updating the displays, without physically changing the sign. Displays capable of real-time modification can implement time-varying advertising and pricing policies, or even the preferences of individual shoppers. In a large retail facility such as a department store, this technology could boost sales and reduce operational costs (for labor to update signs). For a national chain, a local PC could control signage to change the displays in response to commands received from a remote corporate headquarters. Document presentation and storage represents another target market for e-paper. Products under development could store documentation, periodicals, and other resources on one single sheet. For example, one small and lightweight e-paper device could “carry” several documents (or newspapers and magazines) for easy access and transport. One e-paper developer has partnered with a major electronics firm to develop41 an electronic book with an electrophoretic e-paper (E-ink 2002c). When they reach the market, the e-paper electronic book should offer superior viewing angle and lower power draw (smaller battery and longer battery life) than commercial (as of late 2003) electronic books using transflective LCDs (Amundson 2003). Clearly, these tools have the potential for applications beyond the conventional office. In the future, even outdoor advertisements, such as those on billboards, bus shelters, and in airports could adopt e-paper based media. In this instance, one sign could advertise several products. For example, a bus shelter sign
40 See, for example, http://www.gyricon.com . 41 Although the press release states that a product would come to market, one had not as of March, 2004.
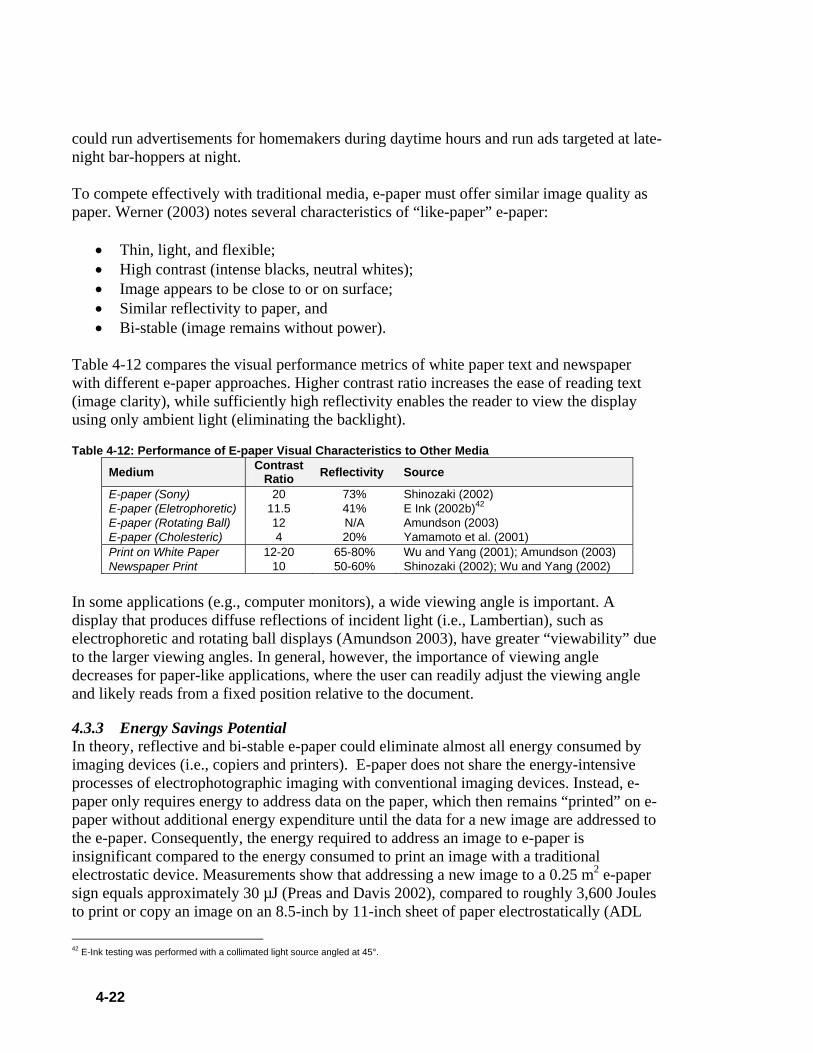
4-22
could run advertisements for homemakers during daytime hours and run ads targeted at late-night bar-hoppers at night. To compete effectively with traditional media, e-paper must offer similar image quality as paper. Werner (2003) notes several characteristics of “like-paper” e-paper:
• Thin, light, and flexible; • High contrast (intense blacks, neutral whites); • Image appears to be close to or on surface; • Similar reflectivity to paper, and • Bi-stable (image remains without power).
Table 4-12 compares the visual performance metrics of white paper text and newspaper with different e-paper approaches. Higher contrast ratio increases the ease of reading text (image clarity), while sufficiently high reflectivity enables the reader to view the display using only ambient light (eliminating the backlight). Table 4-12: Performance of E-paper Visual Characteristics to Other Media
Medium Contrast Ratio Reflectivity Source
E-paper (Sony) 20 73% Shinozaki (2002) E-paper (Eletrophoretic) 11.5 41% E Ink (2002b)42 E-paper (Rotating Ball) 12 N/A Amundson (2003) E-paper (Cholesteric) 4 20% Yamamoto et al. (2001) Print on White Paper 12-20 65-80% Wu and Yang (2001); Amundson (2003) Newspaper Print 10 50-60% Shinozaki (2002); Wu and Yang (2002)
In some applications (e.g., computer monitors), a wide viewing angle is important. A display that produces diffuse reflections of incident light (i.e., Lambertian), such as electrophoretic and rotating ball displays (Amundson 2003), have greater “viewability” due to the larger viewing angles. In general, however, the importance of viewing angle decreases for paper-like applications, where the user can readily adjust the viewing angle and likely reads from a fixed position relative to the document.
4.3.3 Energy Savings Potential In theory, reflective and bi-stable e-paper could eliminate almost all energy consumed by imaging devices (i.e., copiers and printers). E-paper does not share the energy-intensive processes of electrophotographic imaging with conventional imaging devices. Instead, e-paper only requires energy to address data on the paper, which then remains “printed” on e-paper without additional energy expenditure until the data for a new image are addressed to the e-paper. Consequently, the energy required to address an image to e-paper is insignificant compared to the energy consumed to print an image with a traditional electrostatic device. Measurements show that addressing a new image to a 0.25 m2 e-paper sign equals approximately 30 µJ (Preas and Davis 2002), compared to roughly 3,600 Joules to print or copy an image on an 8.5-inch by 11-inch sheet of paper electrostatically (ADL
42 E-Ink testing was performed with a collimated light source angled at 45°.

4-23
2002). That is, producing an image on e-paper consumes several orders of magnitude less energy than generating the same image on a copier or laser printer43. E-paper “imaging” also consumes several orders of magnitude less energy than ink jet printing44. In theory, wholesale replacement of current paper with e-paper could eliminate the need for printers and copy machines, and the energy associated with those devices. Moreover, it would eliminate the energy consumed to manufacture the paper, which is of the same order of the energy consumed by the imaging devices (ADL 2002). In practice, e-paper would, if successful, supplant some portion of conventional paper and related imaging energy consumption and would not enable wholesale elimination of printers and copy machines. As discussed in the Barriers subsection (4.3.5), E-paper may have more relevance to “hot” applications that make shorter-term use of paper, such as reports and memoranda used in everyday work. Because imaging accounts for a small portion of total copy machine and laser printer energy consumption (about 10% averaged over the installed based of devices, excluding roll-fed laser printers; ADL 2002), this suggests that incremental e-paper usage would result in little energy savings45.
4.3.4 Cost At present, electronic paper is not cost-competitive with office paper, i.e., it costs a fraction of one cent per page46. E-paper, in contrast, has yet to become available in a format similar to paper. An executive for an e-paper developer indicates that rotating ball e-paper that does not incorporate drive electronics (i.e., uses a printer or a wand; see Section 4.3.2) could have a very low manufacturing cost based on material costs (Sprague 2004). One developer originally expected e-paper to cost “less than three dollars” (Lincoln 2000) or “somewhat more than a normal piece of paper” (Gyricon Media 2004). At three dollars per sheet, a single piece of e-paper would have (roughly) the same retail cost as a ream (500 sheets) of paper. The same developer, however, expects that a single sheet could be re-used up to four million times. If it achieves the $3 per sheet cost target, e-paper could make economic sense in work environments that generate large quantities of disposable documents. E-paper would likely offer greater indirect than direct cost savings. As Sellen and Harper (2002) note, “the actual printing cost (cost of materials) is insignificant compared with the cost of dealing with documents after printing.” Forms account for about 83% of all business documents and businesses spend approximately $25 to $35 billion dollars per year filing, storing, and retrieving forms. Moreover, organizations consume an additional $65 to $85 billion dollars to maintain, update, and distribute the documents over their lifetimes
43 This energy requirement does not include the additional standby energy used by the printer, which further increases the effective amount of
copier or laser printer energy consumption per image. 44 Based on a 6 cpm inkjet printer that consumes 22W more in active mode than in standby mode (32W versus 10W; Meyer and Schaltegger
1999) – 0.06Wh = (22W) * (10 seconds/copy) / (3600 seconds/hour). This broadly agrees with the finding of Sustainable Solutions (2003) that printing of a page on an inkjet printer consumes <0.1Wh.
45 E-paper use would, however, tend to decrease the overall usage of paper (relative to a baseline case, which could include continued growth in paper consumption). This would increase the time between copies and prints. Recent advances that enable imaging devices to power down and heat up rapidly could, combined with higher power management-enabled rates than in 2000, increase the amount of time that imaging devices spend in low power modes between images. This would, in turn, reduce the AEC of imaging devices.
46 Based on 20-pound office paper ream prices at: www.officedepot.com . A copy center operator at a smaller business reported that they purchase copy machine paper for approximately $0.002/sheet.
4-24
(Sellen and Harper 2002). For instance, e-paper could reduce the storage space occupied by filing cabinets if it enabled people to store fewer pieces of paper. On the other hand, a transition to a “paperless” office can incur significant costs to install new document management systems, train employees, and change how employees work. Historically, work practices have evolved around paper and developed to exploit its qualities, which complicates moving away from paper. It is not surprising that case studies indicate that it is difficult and expensive to transition from existing paper-based work to a digital replacement (Sellen and Harper 2002). Some may argue that e-paper could reduce office clutter and thus enhance worker productivity. A study of knowledge workers, however, found that paper plays a key role in thinking and planning. Workers:
“rarely store and file paper documents or refer back to the information they do keep.
Rather, it is the process of taking notes that is important in helping them to construct and organize their thoughts. The information that they do keep is arranged around their office in a temporary holding pattern of paper documents that serves as a way of keeping available the inputs and ideas they might have use for in their current projects. This clutter also provides important contextual clues to remind them of where they were in their space of ideas.”
In sum, the physical nature of paper is crucial and represents “the tangible embodiment of ideas and information” (Sellen and Harper 2002).
4.3.5 Perceived Barriers to Market Adoption of Technology The clear focus of current e-paper development is not to replace bond paper, but signage and, to a lesser extent, e-book applications. While e-paper could ultimately save space relative to conventional paper, the attributes of paper, its low cost, and current paper usage patterns prevent e-paper from supplanting paper in printing and copying applications. A recent study investigated the use of paper in the workplace (Sellen and Harper 2002). People use paper for a wide range of purposes, from correspondence to legal documentation and it provides a very high quality image that people like. As discussed above, they found that paper is fundamentally much more than a way to display information. It facilitates the communication and organization of information, collaboration, plays a key role in thinking and planning, and is a basic aspect of business processes. Their study distinguishes between “hot” and “cold” paper applications. “Cold” applications include longer term paper storage, such as archives for personal, medical, and corporate records. E-paper would not seem to be a good fit for “cold” applications due to its cost (relative to electronic storage or conventional paper), inability to be annotated, and changeable nature. E-paper may have more relevance to “hot” applications that make shorter-term use of paper, such as reports and memoranda used in everyday work. Sellen and Harper (2002) examined paper usage patterns by a product development team. They
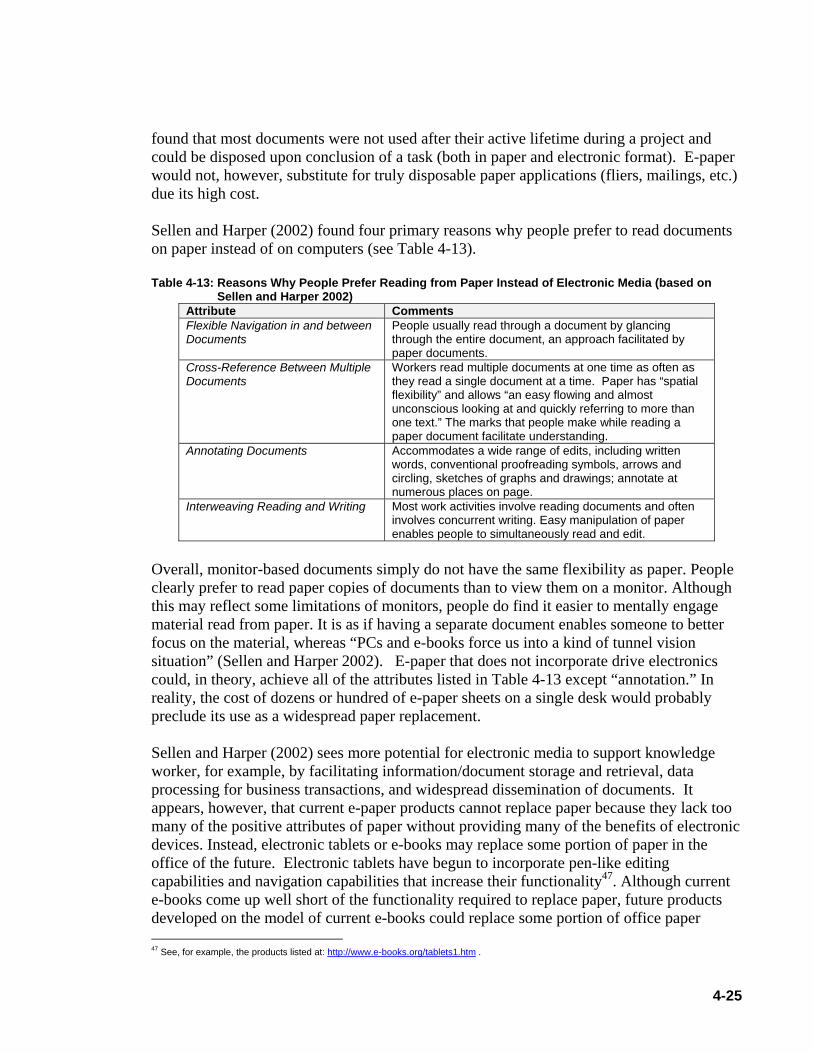
4-25
found that most documents were not used after their active lifetime during a project and could be disposed upon conclusion of a task (both in paper and electronic format). E-paper would not, however, substitute for truly disposable paper applications (fliers, mailings, etc.) due its high cost. Sellen and Harper (2002) found four primary reasons why people prefer to read documents on paper instead of on computers (see Table 4-13). Table 4-13: Reasons Why People Prefer Reading from Paper Instead of Electronic Media (based on
Sellen and Harper 2002) Attribute Comments Flexible Navigation in and between Documents
People usually read through a document by glancing through the entire document, an approach facilitated by paper documents.
Cross-Reference Between Multiple Documents
Workers read multiple documents at one time as often as they read a single document at a time. Paper has “spatial flexibility” and allows “an easy flowing and almost unconscious looking at and quickly referring to more than one text.” The marks that people make while reading a paper document facilitate understanding.
Annotating Documents Accommodates a wide range of edits, including written words, conventional proofreading symbols, arrows and circling, sketches of graphs and drawings; annotate at numerous places on page.
Interweaving Reading and Writing Most work activities involve reading documents and often involves concurrent writing. Easy manipulation of paper enables people to simultaneously read and edit.
Overall, monitor-based documents simply do not have the same flexibility as paper. People clearly prefer to read paper copies of documents than to view them on a monitor. Although this may reflect some limitations of monitors, people do find it easier to mentally engage material read from paper. It is as if having a separate document enables someone to better focus on the material, whereas “PCs and e-books force us into a kind of tunnel vision situation” (Sellen and Harper 2002). E-paper that does not incorporate drive electronics could, in theory, achieve all of the attributes listed in Table 4-13 except “annotation.” In reality, the cost of dozens or hundred of e-paper sheets on a single desk would probably preclude its use as a widespread paper replacement. Sellen and Harper (2002) sees more potential for electronic media to support knowledge worker, for example, by facilitating information/document storage and retrieval, data processing for business transactions, and widespread dissemination of documents. It appears, however, that current e-paper products cannot replace paper because they lack too many of the positive attributes of paper without providing many of the benefits of electronic devices. Instead, electronic tablets or e-books may replace some portion of paper in the office of the future. Electronic tablets have begun to incorporate pen-like editing capabilities and navigation capabilities that increase their functionality47. Although current e-books come up well short of the functionality required to replace paper, future products developed on the model of current e-books could replace some portion of office paper 47 See, for example, the products listed at: http://www.e-books.org/tablets1.htm .

4-26
consumption if they dramatically improve the richness of the user interface in an intuitive way. Sellen and Harper (2002) notes that different, general categories of reading may point toward the development of several different types of e-book/tablet products . Developers of e-paper will be well-served to note the comment that “those who design and develop technologies of reading have often been more interested in getting the best performance from their hardware and software than in properly understanding what reading involves” (Sellen and Harper 2002). Put another way, successful developers of e-paper, electronic tablets, or e-books will need to understand how paper is actually read and used and incorporate the requisite functions in their products instead of focusing primarily on display attributes. As noted above, it appears dubious that cost-effective e-paper could cost effectively incorporate the functions of electronic tablets or books due to the added cost to incorporate drive electronics. E-paper or electronic tablets/e-books that use electrophoretic or rotating ball technology must also overcome technical constraints, including display resolution and durability. The editor-in-chief of a display society notes that e-paper must attain a resolution of about 20048 ppi to approach the image quality of a magazine (Werner 2003). Existing commercial e-paper products do not yet attain this goal (Werner 2003). This reflects, to some extent, the current focus on signage applications – they do not require high resolution because they are viewed at a distance. Prototypical products developed by multiple manufacturers have attained the required resolution (Amundson 2003), which suggests that e-paper technologies have the potential to provide similar image quality as traditional print on paper. E-paper would need to demonstrate long-term durability and image stability throughout its lifecycle, i.e., during shipping, storage (at hot and cold temperature extremes), and in practical day-to-day usage. Current e-paper signage products from one e-paper developer come with a one-year warranty and have an expected life on the order to three to four years. Heat may cause problems with some current e-paper products; however, developers feel confident that they can overcome this problem by changing sensitive materials in future products that may experience more extreme conditions (Sprague 2004).
4.3.6 Technology Development “Next Steps” Multiple barriers, foremost the numerous, positive attributes of paper and the cost of e-paper make wholesale replacement of office paper with e-paper highly unlikely any time soon. Potential “next steps” that would increase the potential for e-paper to play a role in commercial offices include: • Dramatic cost reduction of e-paper to enable it to compete with conventional paper in
appropriate applications; • Demonstration of durable and edit-able e-paper.
48 An avid amateur photographer at TIAX argues that photo quality presentation for magazine images is closer to 300 dpi.
4-27
4.3.7 References ADL, 2002, “Energy Consumption by Office and Telecommunications Equipment in
Commercial Buildings Volume 1: Energy Consumption Baseline.”, Final Report Prepared for the U.S. Department of Energy, Office of Building Technology, January. Available on-line at: http://www.eere.energy.gov/buildings/documents/pdfs/office_telecom-vol1_final.pdf .
Amundson, K., 2003, “Toward Electronic Paper”, Society for Information Display: Seminar Lecture Notes: Volume II, 23 May, Baltimore, pp. F-3/1 – F-3/42.
Babyak, R., 2000, “Will Publishing’s Future be Written on E-Paper?.” Appliance Manufacturer Magazine, December. Available at: http://www.ammagazine.com/CDA/ArticleInformation/features/BNP__Features__Item/0,2606,16146,00.html .
Canon, 2003, http://www.canon.com/technology/future_tech/pl_display/content.html, downloaded on 20 January, 2003.
E Ink, 2002a, Available at: www.eink.com. E Ink, 2002b, “Electronic Ink Offers Superior Solutions with a Truly Paper-like
Experience”, E-Ink Internal Report. Available at: http://www.eink.com/pdf/eink_readability_02.pdf .
E Ink, 2002c, “Philips and E Ink Commercialization Efforts on Track”, E Ink and Philips Press Release, 12 March. Available at: http://www.eink.com/news/releases/pr52.html .
Gladwell, M., 2002, “The Social Life of Paper”, The New Yorker, 25 March, pp. 92-96. Gyricon Media Information, 2002, Available at: www.gyriconmedia.com. Gyricon Media, 2003, http://www.gyriconmedia.com/smartpaper/faq.asp, downloaded on
21 January, 2003. Gyricon Media, 2004, “Electronic Resuable Paper”. Available at:
http://www2.parc.com/dhl/projects/gyricon , downloaded on 24 February, 2004. Joubert, C., J. Angele, A. Boissier, P. Davi, I. Dozov, T. Elbhar, B. Pecout, D. Stoenescu, R.
Vercelletto, and P. Martinot-Lagarde, 2002, “Ultra Low Power Bright Reflective Displays Using BiNem® Technology Fabricated by Standard Manufacturing Equipment”, Society for Information Display, 2002 International Symposium – Digest of Technical Papers, Volume XXXIII, Number 1, pp. 30-33.
Lincoln, A., 2000, “Pulp Fiction?“, CFO, Magazine for Senior Financial Executives, Fall, pp. 5, 8. Available at: http://www.findarticles.com/cf_dls/m3870/11_16/65297817/p5/article.jhtml?term= .
Pham, T., Sheridon, N., and Sprague, R., 2002, “Electro-Optical Characteristics of the Gyricon Display”, Society for Information Display, 2002 International Symposium – Digest of Technical Papers, Volume XXXIII, Number 1, pp. 119-121.
Preas, B. and Davis, H., 2002, “P-8: Low-Cost, Low Power, Electronic Displays for Retail Signs”, Society for Information Display, 2002 International Symposium – Digest of Technical Papers, Volume XXXIII, Number 1, pp. 228-231.
Roberson, J. A., R.E. Brown, B. Nordman, C.A. Webber., G.K. Homan, A. Mahajan, M. McWhinne, J.G. Koomey, 2002, “Power Levels in Office Equipment:

4-28
Measurements of New Monitors and Personal Computers”, Proc. ACEE Summer Study on Energy Efficiency in Buildings, Pacific Grove, CA, 22-26 August.
Sellen, A.J. and R.H.R. Harper, 2002, The Myth of the Paperless Office, The MIT Press: Cambridge, MA.
Shinozaki, K., 2002, “Electrodeposition Device for Paper-Like Display”, Society for Information Display, 2002 International Symposium – Digest of Technical Papers, Volume XXXIII, Number 1, pp. 39-41.
Slikkerveer, P., G. Nisato, N. Kooyman, P. Cirkel, and P. Bouten, 2002, “A Fully Flexible, Cholesteric LC Matrix Display”, Society for Information Display, 2002 International Symposium – Digest of Technical Papers, Volume XXXIII, Number 1, pp. 27-29.
Sony, 2004, “First-Generation Electronic Paper Display from Philips, Sony and E Ink to Be Used in New Electronic Reading Device”, Sony Press Release, 24 March. Available at: http://www.sony.net/SonyInfo/News/Press/200403/04-0324E/ .
Sprague, R., 2004, Personal Communication, Gyricon LLC, March. Sustainable Solutions, 2003, “A Study of Office Equipment Operational Energy Use
Issues”, Final Report Prepared for The Australian Greenhouse Office, February. Webber, R., 2002, “Image Stability on Active Matrix Microencapsulated Electrophoretic
Displays”, Society for Information Display, 2002 International Symposium – Digest of Technical Papers, Volume XXXIII, Number 1, pp. 126-129.
Werner, K.I., 2003, “m-Commerce: Paper-Based Digital Communications”, Business Briefing: Wireless Technology 2003. Available at: http://www.wmrc.com/businessbriefing/pdf/wireless_2003/Publication/werner.pdf .
Yamamoto, S., H. Kobayashi, T. Kakinuma, T. Hikichi, N. Hiji, T. Ishii, Y. Harada, M. Koshimzu, K. Maruyama, T. Niitsu, T. Suzuki, D. Tsuda, and H. Arisawa, 2001, “A Novel Photoaddressable Electronic Paper Utilizing Cholesteric LC Microcapsules and Organic Photoconductor”, Society for Information Display, 2002 International Symposium – Digest of Technical Papers, Volume XXXIII, Number 1, pp. 362-365.
4.4 Higher Efficiency Ac-Dc Power Supplies
4.4.1 Summary Ac-Dc power supplies account for between 25% and 40% of the energy consumed by desktop PCs and monitors. Several technologies exist that can improve the efficiency of ac-dc power supplies and higher-efficiency supplies for desktop PCs exist in the marketplace. The cost premium of several dollars for higher-efficiency power supplies contrasts with current purchasing practices for supplies, where much smaller cost differences affect vendor selection. This cost sensitivity has inhibited the use of more efficient supplies in most office equipment applications. Higher power supply specifications for partial-load efficiency by Intel, which largely drives the PC power supply market, minimum supply efficiency levels in the EnergyStar® specification for desktop PCs, and new market transformation activities will all increase the efficiency of PC power supplies. It is dubious, however, that the market will move to supply efficiencies above those levels unless the cost premium of higher-efficiency supplies decreases dramatically.
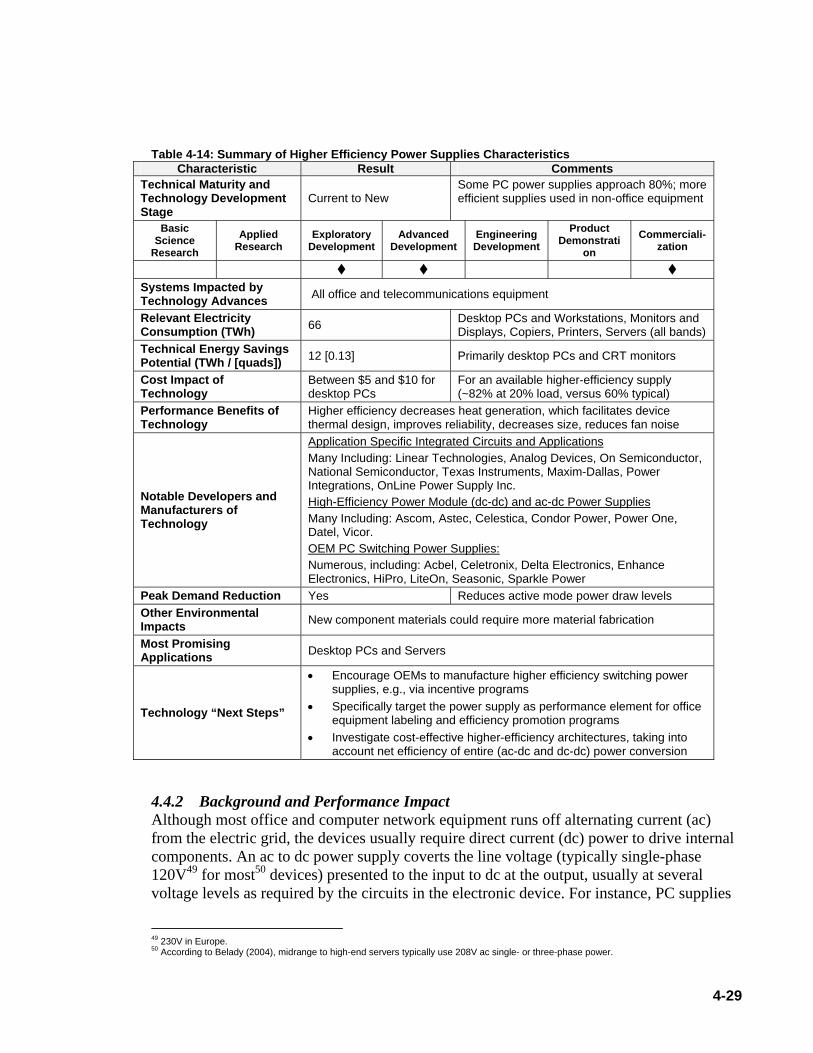
4-29
Table 4-14: Summary of Higher Efficiency Power Supplies Characteristics
Characteristic Result Comments Technical Maturity and Technology Development Stage
Current to New Some PC power supplies approach 80%; more efficient supplies used in non-office equipment
Basic Science
Research Applied
Research Exploratory
Development Advanced
Development Engineering Development
Product Demonstrati
on Commerciali-
zation
Systems Impacted by Technology Advances All office and telecommunications equipment
Relevant Electricity Consumption (TWh) 66 Desktop PCs and Workstations, Monitors and
Displays, Copiers, Printers, Servers (all bands) Technical Energy Savings Potential (TWh / [quads]) 12 [0.13] Primarily desktop PCs and CRT monitors
Cost Impact of Technology
Between $5 and $10 for desktop PCs
For an available higher-efficiency supply (~82% at 20% load, versus 60% typical)
Performance Benefits of Technology
Higher efficiency decreases heat generation, which facilitates device thermal design, improves reliability, decreases size, reduces fan noise
Notable Developers and Manufacturers of Technology
Application Specific Integrated Circuits and Applications Many Including: Linear Technologies, Analog Devices, On Semiconductor, National Semiconductor, Texas Instruments, Maxim-Dallas, Power Integrations, OnLine Power Supply Inc. High-Efficiency Power Module (dc-dc) and ac-dc Power Supplies Many Including: Ascom, Astec, Celestica, Condor Power, Power One, Datel, Vicor. OEM PC Switching Power Supplies: Numerous, including: Acbel, Celetronix, Delta Electronics, Enhance Electronics, HiPro, LiteOn, Seasonic, Sparkle Power
Peak Demand Reduction Yes Reduces active mode power draw levels Other Environmental Impacts New component materials could require more material fabrication
Most Promising Applications Desktop PCs and Servers
Technology “Next Steps”
• Encourage OEMs to manufacture higher efficiency switching power supplies, e.g., via incentive programs
• Specifically target the power supply as performance element for office equipment labeling and efficiency promotion programs
• Investigate cost-effective higher-efficiency architectures, taking into account net efficiency of entire (ac-dc and dc-dc) power conversion
4.4.2 Background and Performance Impact Although most office and computer network equipment runs off alternating current (ac) from the electric grid, the devices usually require direct current (dc) power to drive internal components. An ac to dc power supply coverts the line voltage (typically single-phase 120V49 for most50 devices) presented to the input to dc at the output, usually at several voltage levels as required by the circuits in the electronic device. For instance, PC supplies
49 230V in Europe. 50 According to Belady (2004), midrange to high-end servers typically use 208V ac single- or three-phase power.
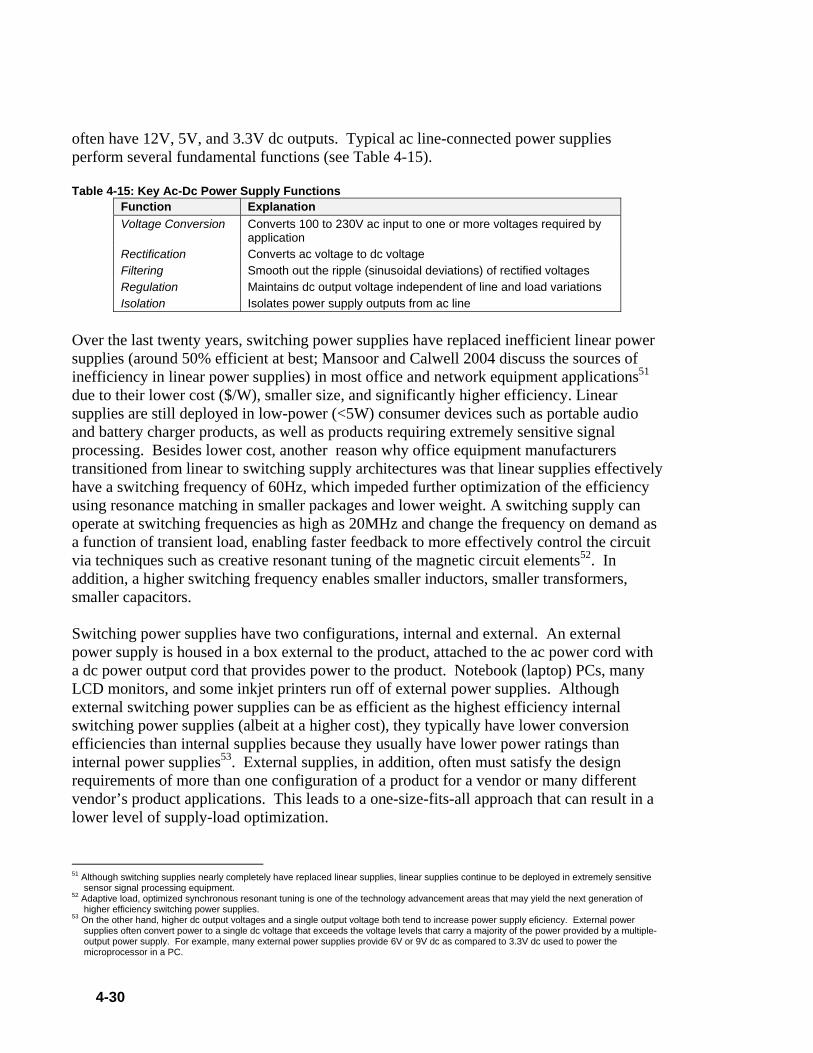
4-30
often have 12V, 5V, and 3.3V dc outputs. Typical ac line-connected power supplies perform several fundamental functions (see Table 4-15). Table 4-15: Key Ac-Dc Power Supply Functions
Function Explanation Voltage Conversion Converts 100 to 230V ac input to one or more voltages required by
application Rectification Converts ac voltage to dc voltage Filtering Smooth out the ripple (sinusoidal deviations) of rectified voltages Regulation Maintains dc output voltage independent of line and load variations Isolation Isolates power supply outputs from ac line
Over the last twenty years, switching power supplies have replaced inefficient linear power supplies (around 50% efficient at best; Mansoor and Calwell 2004 discuss the sources of inefficiency in linear power supplies) in most office and network equipment applications51 due to their lower cost ($/W), smaller size, and significantly higher efficiency. Linear supplies are still deployed in low-power (<5W) consumer devices such as portable audio and battery charger products, as well as products requiring extremely sensitive signal processing. Besides lower cost, another reason why office equipment manufacturers transitioned from linear to switching supply architectures was that linear supplies effectively have a switching frequency of 60Hz, which impeded further optimization of the efficiency using resonance matching in smaller packages and lower weight. A switching supply can operate at switching frequencies as high as 20MHz and change the frequency on demand as a function of transient load, enabling faster feedback to more effectively control the circuit via techniques such as creative resonant tuning of the magnetic circuit elements52. In addition, a higher switching frequency enables smaller inductors, smaller transformers, smaller capacitors. Switching power supplies have two configurations, internal and external. An external power supply is housed in a box external to the product, attached to the ac power cord with a dc power output cord that provides power to the product. Notebook (laptop) PCs, many LCD monitors, and some inkjet printers run off of external power supplies. Although external switching power supplies can be as efficient as the highest efficiency internal switching power supplies (albeit at a higher cost), they typically have lower conversion efficiencies than internal supplies because they usually have lower power ratings than internal power supplies53. External supplies, in addition, often must satisfy the design requirements of more than one configuration of a product for a vendor or many different vendor’s product applications. This leads to a one-size-fits-all approach that can result in a lower level of supply-load optimization.
51 Although switching supplies nearly completely have replaced linear supplies, linear supplies continue to be deployed in extremely sensitive
sensor signal processing equipment. 52 Adaptive load, optimized synchronous resonant tuning is one of the technology advancement areas that may yield the next generation of
higher efficiency switching power supplies. 53 On the other hand, higher dc output voltages and a single output voltage both tend to increase power supply eficiency. External power
supplies often convert power to a single dc voltage that exceeds the voltage levels that carry a majority of the power provided by a multiple-output power supply. For example, many external power supplies provide 6V or 9V dc as compared to 3.3V dc used to power the microprocessor in a PC.

4-31
Most other office equipment, including desktop PCs, CRT monitors, server computers, copy machines, and printers, have internal power supplies. PCs and lower-end servers typically use off-the-self commodity power supplies designed for that general application (but usually not a specific model), while copy machines, monitors, and printers often use supplies specially designed for that machine. Figure 4-5 depicts the basic architecture of a switching supply. The magnetic elements, i.e., the transformer and inductors, are the primary components of any design. Proprietary designs incorporate different circuit configurations, with optimization accomplished via proprietary circuitry and customized magnetics. In addition, the number of voltage outputs and power capacity impacts the overall design architecture. Ac line voltage flows into the power supply and through a Power Factor Correction (PFC) and noise filter (note: many – particularly low-cost – power supplies do not have PFC). This device controls the phase of current and voltage during start up and under transient loads to limit the inrush current and also reduces the harmonic noise reflected back into the ac line. Although not a major factor in steady state operating efficiency loss, the PFC and noise filter do have a significant effect on start-up efficiency. A Rectifier then converts the sinusoidal ac input waveform into dc voltage with some degree of ripple (i.e., periodic deviation from a true dc waveform). Subsequently, a Transformer reduces or increases the voltage levels to meet the output voltage requirements. The change in voltage level is based on the ratio of turns (windings) between the transformer coils. It is the main energy transfer component of the supply. In devices with higher voltage requirements, e.g., monitors with a cathode ray tube (CRT), it tends to decrease the power supply’s efficiency due to dielectric losses in the transformer structure. Pulse Width Modulation (PWM) Proprietary Circuits and Proprietary Feedback Circuits control the switching of the MOSFET Switch, the primary high-current switch driving the transformer, to ensure optimum energy transfer through the transformer under varying loads. Although the circuits themselves do not consume that much energy in larger power supplies, they can have a significant impact on supply efficiency. After the transformer, diodes54, inductors, and capacitors filter the ripple noise at the dc outputs from the power supply and consume an appreciable amount of energy55.
54 Depicted in Figure 4-5 as an arrow within a circle, immediately after the transformer and before the inductors and capacitors to ground. 55 Real inductors have resistive (dissipative) properties and field-related losses.

4-32
Figure 4-5: Basic Ac-Dc Switching Power Supply Architecture

4-33
Ac-dc power supplies have components with fixed losses, such as the control circuits and magnetics (transformers and inductors) and losses that vary with loading, including the MOSFET switch and output diodes (Mansoor and Calwell 2004). Figure 4-6 depicts the losses for a typical 20W switching power supply with a single (5V dc) output, operating at 20% of rated load.
Magnetics36%
MOSFET Conduction
1%MOSFET Switching
21%
Diode10%
IC/Misc.32%
Figure 4-6: Losses of an Ac-Dc 20W Switching Power Supply at 20% Load (from Mansoor and Calwell 2004) In larger power supplies, e.g., a 300W desktop PC supply, it is likely that IC losses would not increase in proportion to the increase in wattage. That is, magnetics (transformers and inductors), MOSFET switching, and, to a lesser extent, diodes would account for most of the losses (energy consumption). As power supply loading increases, the proportion of losses attributed to MOSFET switching and, in particular, diodes typically increases while that of magnetics decreases (Mansoor and Calwell 2004). Advanced power supply architectures, materials, and integrated circuits (ICs) often emerge from the medical, industrial and aerospace markets due to stringent or unique application requirements, e.g., unusually demanding voltage, current, frequency, PWM and servo feedback, power factor matching, ac current leakage reduction. Medical applications include X-Ray, MRI, CT Scan, and operating room and intensive care equipment, while unique industrial power supply design applications include plasma metrology, silicon wafer fabrication and materials process control equipment. Often, advances from these leading-edge applications become commercialized, driving cost down and enabling use in the cost-competitive consumer product power supply market.
4.4.3 Energy Savings Potential Ac-Dc power supplies consume energy in all power modes (excepting unplugged). When in active mode, the power supply dissipates energy while converting the ac input to dc output and conditioning the output. Power supplies continue to draw some energy while in
4-34
“sleep” or even “off” modes. The energy savings potentials for power supplies in each of these two states are largely independent of each other, and will be discussed separately.
Although most ac to dc switching supplies could theoretically attain a maximum full-load efficiency of 90% or greater56 with power factor correction, they typically have significantly lower efficiencies, on the order of 70%. In addition, most power supplies for office and network equipment are over-sized relative to typical operating requirements, generally to ensure product reliability57 and reduce product liability. The loads, consequently, usually draw only a fraction (5 to 35%; ADL 2002) of the rated power in “active” mode. As power supply efficiencies decrease precipitously when the device load falls below about 30% of rated power, operational efficiencies often fall short of full-load efficiencies (see Figure 4-7). More recent test data for PC power supplies with higher output ratings suggest similar efficiencies at 25% loading, typically between 65% and 75%. For example, under typical condition, most PC power supplies operate at an efficiency somewhere between 50% (Fisher 2002) and 70% (Calwell and Reeder 2002, Hiller et al. 2004).
Computer Power Supply Efficiencies
40%
45%
50%
55%
60%
65%
70%
75%
80%
0% 10% 20% 30% 40% 50% 60% 70% 80% 90% 100%Load Percentage
Effic
ienc
y Rush 200W
Rush PFC 200W
Rush 2 220W
Rush 2 PFC 220W
Shrimp 50W
Shrimp 80W
Cobra 175W
Prowler 250W
Figure 4-7: Measured PC Switching Power Supply Efficiencies as Function of Load Percentage (from
Calwell and Reeder 2002)
56 Based on review of power supply and integrated circuits specifications available from Linear Technology and other vendors listed in the
reference section. 57 A test and evaluation study revealed conducted by Stellmack (2001) revealed that many vendors fail to meet their claims of peak load power,
and often fail by destructive burn out.
4.4.3.1 Active Mode

4-35
Table 4-16 presents typical power supply performance for major office equipment types and maximum performance levels with currently-available devices not necessarily used or made for that equipment type today (i.e., may not be cost-effective at that efficiency level). Mansoor and Calwell (2004) estimate a theoretical upper bound of 95% for ac-dc power supplies. Table 4-16: Office Equipment Power Supply Characteristics
Equipment Type
Typical Operational Efficiency
Typical Full-Load Efficiency
Best Available Full Load Efficiency
Source Notes
Desktop PC 50-65%58 65-7559% 87 – 90%
Calwell and Reeder (2002); Calwell (2004); Aebischer and Huser (2002,2003); OnLine Power Supply Inc.60; Linear Technologies
Multiple voltage architecture
CRT Monitor 65-75% 70-80% 90%61 Calwell and Reeder (2002) Multiple voltage architecture. Electron gun operates at ~30kV, which tends to increase losses
LCD Monitor 70-80% 75-85% 90% Calwell and Reeder (2002); Industry literature
In “active” mode, monitor power draw does not exhibit significant variation
Servers 68-72%62 / 85%
65-75% / ~85%63 90%+
Koomey (2002); Novotny (2002); Calwell and Mansoor (2003); Belady (2004)
85% value likely reflects single ac-dc voltage conversion architecture, e.g., from 120Vac to 12Vdc
Copy Machine
65-75% (for non-heater
portions); less in “stand-by”
mode
~ 80% 90% Hershberg (2002); Ascom; OnLine Power Supply Inc.
Supply efficiency has small impact on AEC – fuser heater uses ac power. Typically custom-designed supplies with multiple voltage architecture for circuitry (~65-75% efficient). High voltage corona element
Laser Printer
65-75% / 95%+64 80% / 95%+ 90% / 98%
Troelsen (2003); Hershberg (2002).
Ac-Ac conversion (for heaters, blowers, etc.) efficiencies can run up to 95-98%
Both high- and low-efficiency switching power supplies exist today, but most equipment uses lower-cost/lower-efficiency power supplies. In general, improved design and manufacturing process control of the magnetic elements, notably the transformers and inductors, account for most of the differences in supply efficiency (they also impact performance and cost65). Another important conclusion from Table 4-16 is that laser printers and copy machines use inherently very efficient ac-ac power supplies or even direct power flow from the plug to heat the fuser rolls. Because keeping the fuser roll hot accounts for the bulk of laser printer and copy machine AEC (annual energy consumption), higher efficiency power supplies cannot achieve large AEC reductions in laser printers and copy machines. Several different pathways to higher-efficiency supplies exist (see Table 4-17). 58 Based on an average PC drawing ~60W in active mode, with a supply rating of ~200W. 59 Calwell and Reeder (2002) note that the Apple iMac desktop uses a power supply with 85%+ efficiency. 60 OPS holds a U.S patent for the process of producing ac to dc power supplies that provide efficiencies of up to 97 percent: http://www.powersupply.com/coverage/2002-0114-bizyahoo/index.shtml . 61 A 27-inch TV had a 91% operational efficiency. 62 For a 2RU server; from Koomey (2002), based on information from an Intel white paper. 63 Belady (2004) noted that high-end servers circa 2000 had ac-dc power supply efficiencies in the 80 to 85% range. 64 Values reflect efficiency for ac-dc / ac-ac conversion. 65 Assembly costs, particularly labor, strongly influence cost as well.
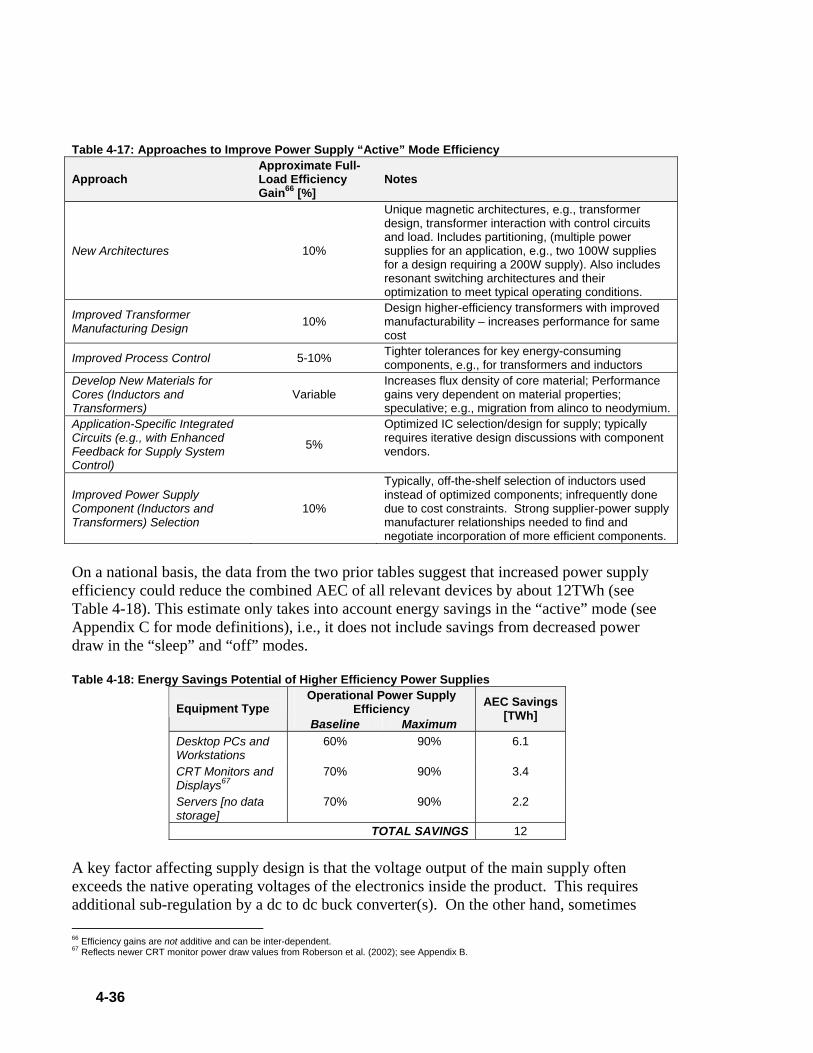
4-36
Table 4-17: Approaches to Improve Power Supply “Active” Mode Efficiency
Approach Approximate Full-Load Efficiency Gain66 [%]
Notes
New Architectures 10%
Unique magnetic architectures, e.g., transformer design, transformer interaction with control circuits and load. Includes partitioning, (multiple power supplies for an application, e.g., two 100W supplies for a design requiring a 200W supply). Also includes resonant switching architectures and their optimization to meet typical operating conditions.
Improved Transformer Manufacturing Design 10%
Design higher-efficiency transformers with improved manufacturability – increases performance for same cost
Improved Process Control 5-10% Tighter tolerances for key energy-consuming components, e.g., for transformers and inductors
Develop New Materials for Cores (Inductors and Transformers)
Variable Increases flux density of core material; Performance gains very dependent on material properties; speculative; e.g., migration from alinco to neodymium.
Application-Specific Integrated Circuits (e.g., with Enhanced Feedback for Supply System Control)
5%
Optimized IC selection/design for supply; typically requires iterative design discussions with component vendors.
Improved Power Supply Component (Inductors and Transformers) Selection
10%
Typically, off-the-shelf selection of inductors used instead of optimized components; infrequently done due to cost constraints. Strong supplier-power supply manufacturer relationships needed to find and negotiate incorporation of more efficient components.
On a national basis, the data from the two prior tables suggest that increased power supply efficiency could reduce the combined AEC of all relevant devices by about 12TWh (see Table 4-18). This estimate only takes into account energy savings in the “active” mode (see Appendix C for mode definitions), i.e., it does not include savings from decreased power draw in the “sleep” and “off” modes. Table 4-18: Energy Savings Potential of Higher Efficiency Power Supplies
Operational Power Supply Efficiency Equipment Type
Baseline Maximum
AEC Savings [TWh]
Desktop PCs and Workstations
60% 90% 6.1
CRT Monitors and Displays67
70% 90% 3.4
Servers [no data storage]
70% 90% 2.2
TOTAL SAVINGS 12 A key factor affecting supply design is that the voltage output of the main supply often exceeds the native operating voltages of the electronics inside the product. This requires additional sub-regulation by a dc to dc buck converter(s). On the other hand, sometimes 66 Efficiency gains are not additive and can be inter-dependent. 67 Reflects newer CRT monitor power draw values from Roberson et al. (2002); see Appendix B.

4-37
internal electronics run on a higher voltage than supplied by the main supply, requiring a dc to dc boost converter to increase the voltage levels. Both of these secondary conversion processes consume additional energy. Internal switching supplies often match and optimize the transformer taps and circuitry to the multiple voltages required by the specific product. However, external power supplies may not incorporate such optimization, which results in sub-optimal magnetic elements and circuitry and lower supply efficiency. Recently, companies (e.g., Intusoft and Power Integrations) have developed software that enables CAD-like power supply design, as well as simulation. In principle, these tools allow designers to model efficiency directly during the design process, facilitating improved assessment of design tradeoffs between performance, efficiency and cost. Consequently, such tools have the potential to realize cost- effective improvements in power supply efficiencies.
The ability of a high-efficiency switching supply to operate efficienly during low load relative to its peak load capacity poses architectural challenges. In a basic sense, it is very difficult to optimize the supply architecture at both the full-load and low-load operating points. Having to optimize about one condition, supply manufacturers select the full load condition so that the supply will generate less heat, decreasing the potential for burnout and ensuring supply reliability. At least two approaches have the potential to reduce power supply energy consumption in low-power mode. One approach to reducing power supply power consumption in the “off” mode is to simply place the power switch before the power supply, such that the device and the power supply power down completely when the power switch turns off (IEA 2001). Although feasible, this approach would necessitate a paradigm shift in device design. At present, many devices, such as PCs, have a “soft” on/off functionality via a momentary switch located on front of the device, which requires circuitry to sense and communicate the switch state to the device. To place the switch before the power supply would entail replacing the momentary switch with a toggle switch, which is already located on the back of most PCs. In fact, many earlier PCs used this design, but the momentary switch was adopted to provide a cleaner, less bulky design and operating system (OS) controlled shut-down. Thus, switching to a toggle switch could actually reduce cost by eliminating the momentary switch, but would represent a design change that manufacturers may well be loathe to make. A second approach would be to optimize supply architectures for low-power modes. Sleep modes have been included in the architectures of the OS, processors and motherboards in PCs, but the system architecture has not been optimized to the fullest extent possible to include the power supply in a closed loop. A multi-architecture supply, i.e., one that includes distinct architectures for at least two different power levels, controlled by logic that routes the load through the more efficient architecture, could lead to improved “off” and/or “sleep” mode performance by including a low-power architecture. For example, if the OS goes into “sleep” mode, it could send a signal to a dual-architecture power supply to trigger
4.4.3.2 “Off” Mode

4-38
a different configuration with more favorable energy consumption characteristics at that level. This approach has market issues, as inclusion of more than one architecture (or, essentially, two physical supplies) increases supply complexity and requires additional logic and communication with the PC motherboard, both of which increase system complexity and cost. External supplies, for LCD monitors and laptop PCs, also represent an opportunity for energy savings, as the power supply remains connected to the ac power line drawing power even when the device has been turned off (unless the end user deploys a power strip or the laptop is disconnected). As these devices draw significantly less power in the “active” mode than comparable devices, e.g., CRT monitors and desktop PCs, the “off” mode energy consumption represents a larger percentage of device unit energy consumption (UEC). One solution would be to design the power switch to provide feedback to the power supply circuitry, causing it to go into a more efficient (i.e., lower power) “off” state. However, taking this approach for an external power supply would pose several problems, as it requires an additional electrical connection for the control signal68, representing a paradigm change from current practice and additional supply cost. To address the power consumed by devices when “off”, the DOE/EPA EnergyStar® program has a draft external power supply specification69 (Energy Star® 2004; see Table 4-19). In addition, Europe has adopted a voluntary “Code of Conduct” for external power supplies (European Commission 2000) that limits the power draw in “off” mode (see Table 4-20). Significant adoption by manufacturers of either specifications for their products clearly would reduce energy consumption by devices with external power supplies. Table 4-19: Draft EnergyStar® Maximum No-Load Power Draw Levels for External Power Supplies
Nameplate Output Power [W]
Maximum No-Load Power Draw [W]
0 to <10 0.5 10 to 250 0.75
Table 4-20: European Commission Voluntary “Code of Conduct” Specifications for External Power
Supplies (from EC 2000) Maximum “No-Load” Power Draw by Year [W] Power Supply
Rating [W] 2001 2003 2005 >=0.3 and <15 1.0 0.75 0.3 >=15 and <50 1.0 0.75 0.5 >=50 and <75 1.0 0.75 0.75
An additional push for products with low “off” mode power draw came from a July, 2001 executive order to purchase devices drawing less than 1W while off “when life-cycle cost-effective and practicable and where the relevant product’s utility and performance are not compromised as a result” (White House 2001). Moreover, if 1W products are not available,
68 The sensing circuit could be integrated into the same electrical connection, but would likely draw more power than a separate, dedicated
control circuit. 69 Additional information available at: http://www.energystar.gov/index.cfm?c=prod_development.power_supplies .
4-39
the order further specifies that “agencies shall purchase products with the lowest standby power wattage.” Power supplies with very low power draw in “off” mode will be key components in achieving these levels.
4.4.4 Cost In most applications, power supplies are commodity components, especially when the requirements are not uniquely demanding. This holds true in the fiercely price-competitive office equipment markets, most notably PCs, monitors, and desktop printers, where very small price differences can have a substantial impact on profits (Calwell and Reeder 2002; Hershberg 2002). As Calwell and Reeder (2002) note, “even technologies that increase cost by pennies can be rejected as too expensive.” Consequently, these products tend to incorporate low-cost supplies, e.g., desktop PC supplies cost, on average, $12 to $15 (wholesale; Calwell 2004) and $3 to $8 for inkjet printers (Hershberg 2002). These supplies have relatively low efficiencies and are manufactured in low-wage countries to maintain power supply manufacturer competitiveness and profitability. Measurements of power supply efficiency do not, however, show a clear correlation between PC power supply cost and efficiency up to efficiency levels of at least 70% (Aebischer and Huser 2003). Currently-available power supplies offer the potential for significant gains in efficiency at – in energy efficiency terms – a relatively small cost premium. An evaluation of existing desktop PC power supplies found that the highest supply efficiency was about 82% at 20% load and that unit would increase the cost of a desktop PC to consumers by $5 to $1070 (Calwell 2004; Carlton 2004). In this case the increased power supply efficiency gives the manufacturer the potential to eliminate the power supply fan and decrease its profile by 80% (Calwell 2004). Assuming that the more efficient power supply only reduces active power draw, at typical commercial building electricity rates this translates into a simple payback period on the order of one to two and a half years71. As desktop PCs have an average lifetime of around three to four years, however, a higher-efficiency supply would offer marginal cost benefit in many instances. Server computers, on the other hand, have much higher duty cycles and high-efficiency power supplies72 can realize simple payback periods of well under one year. Even more efficient power supplies (including key components) are commercially-available but are not used due to the economics of the office equipment market. Table 4-21 summarizes the expected qualitative cost impact of different approaches to improving power supply “active” mode efficiency.
70 87.5% at 50% load, 85% at 100% load (Calwell 2004). The incremental cost estimate takes into account the fan eliminated by the high-
efficiency power supply. The cost-efficiency data presented in Aebischer and Huser (2003) includes only a single power supply with an efficiency greater than 75% (77%; all measured at 80% load).
71 ADL (2002) estimates that the average PC in Y2000 consumes ~285kWh/year in active mode. Assuming that the baseline efficiency equals 65% at load [25%] and that the efficiency improves to 82% yields a savings of 59kWh/year. At $0.07/kWh for electricity, the annual cost savings equals $4.14, in which case $5 and $10 cost premiums pay back in 14 and 29 months, respectively. More recent PCs tend to have higher “on” mode power draw than Y2000 devices, in which case the payback period would decrease.
72 For example, a low-end server that draws 125W and uses a power supply with 80% efficiency instead of 70% would save about 135kW-h of electricity per year, or almost $10 per year (at $0.07/kWh). This translates into a SPP of between half a year and one year for a $5 to $10 price premium.

4-40
Table 4-21: Approximate Cost Impact of Approaches to Improve Power Supply “Active” Mode Efficiency
Approach Expected Cost Impact73 Notes
New Architectures Variable Architectures that increase the number of components and size of components tend to increase device cost; e.g., adding a sensing element to provide additional feedback would add an additional sensor and related circuitry. New designs would likely need new tooling, and could change manufacturing processes (e.g., stamping of laminations switched to laser etched), with application-specific cost impact (fixed cost).
Improved Transformer Manufacturing Design
Neutral to Decrease
Could increase or decrease manufacturing cost depending on final design, often can cost-reduce overall design; would require re-tooling.
Improved Process Control Variable Could increase or decrease manufacturing cost depending on final design choices – a trade-off between what tolerances are tightened and loosened.
Develop New Materials for Cores (Inductors and Transformers)
Likely increase Utilization of new, more costly magnetic materials, such as neodymium instead of alinco.
Application-Specific Integrated Circuits (e.g., with Enhanced Feedback for Supply System Control)
Neutral to Decrease
New, more sophisticated ASIC likely to have similar cost as older IC; potential cost reduction from consolidation of discrete semi-conductor components into one ASIC.
Improved Power Supply Component (Inductors and Transformers) Selection
Neutral to Increase
Potential increase due to decrease in purchasing volumes and/or need for supplier to create and maintain another product or process.
In all cases, cost impact estimates do not include research and development expenses. The degree to which these expenditures impact product cost depends largely on the quantity of supplies using each new approach. Manufacturing process control for high current (supplies above ~50 to 100W) transformers and inductors presents a significant challenge due to their size and geometry. Supplementary manual assembly continues to prevail due to its low cost (assuming low-cost labor) and is generally conducted offshore, i.e., in regions with very low labor costs. Tooling for large magnetic devices is costly to improve by further automation.
4.4.5 Perceived Barriers to Market Adoption of Technology At present, end-users have negligible concern about device energy consumption, as well as awareness about device power supply efficiency. The EnergyStar® program appears likely to include minimum supply efficiency levels in a new specification for PCs (Carlton 2004, Fanara 2004, Hiller et al. 2004). This would increase awareness about supply efficiency for the equipment type with the greatest supply energy saving opportunity. Furthermore, EnergyStar® models account for at least 80% of the desktop PC market (LBNL 2001). If PC manufacturers are willing to accept the cost premium of higher-efficiency supplies to continue to produce EnergyStar® desktop PCs, the desktop PC market would move to a power supply higher efficiency level.
73 Not including research and development expenditures.

4-41
As noted earlier, much of the market for office equipment (e.g., desktop PCs and monitors) is very price sensitive, an environment in which any cost premium that does not increase device performance and/or functionality is not acceptable to the consumer and, hence, office equipment manufacturers. Consequently, from the perspective of the supply manufacturer, higher efficiency is perceived to have little or no benefit to sales revenue in the competitive power supply industry. At first glance, the people manufacturing the supply and computer have little incentive to improve supply efficiency. On the other hand, some players in the office and telecommunications equipment industry do have a very large influence on supply efficiency, foremost Intel. Intel dominates the PC microprocessor market and sets supply specifications for their products. They have recently set new “required” and “recommended” levels that promise to reduce supply energy consumption (see Table 4-22). Intel has indicated that the 2004 “recommended” level will likely become the “required’ level at some point in 2005; at the same time, “recommended” levels would also increase. Recent draft efficiency levels for an EnergyStar® specification for PC power supplies would coincide with the “recommended” 2004 levels (Hiller et al. 2004). Table 4-22: Intel Power Supply Performance Levels for Pentium (based on Intel 2003, Hiller et al. 2004, and Calwell 2004)
Supply Efficiency Level as % of Rated Load Year and Descriptor
20% 50% 100% 2001 – Measured 45% 55% 67% 2003 – Required 50% 60% 70% 2003 – Measured 65% 71% 69% 2004 – Required 60% 70% 70% 2004 – Recommended 67% 80% 75%
Similarly, the implementation of draft EnergyStar® active mode efficiency levels for external power supplies could also increase the efficiencies of those devices (EnergyStar® 2004). Another program has taken a different approach to attempt to move the PC market toward higher-efficiency power supplies. Utilities participating in the 80 Plus program will pay $5 to participating PC manufacturers for each PC sold in their area that contains a power supply that has an 80% or greater efficiency at 20%, 50% and 100% loading74 (Hiller et al. 2004, Calwell 2004). As of September, 2004, several major west coast utilities have committed to the program (Calwell 2004). The Server System Infrastructure (SSI) initiative has also generated supply minimum efficiency levels for a variety of supply architectures (dc output voltages) often used in low-end servers. In most cases, they specify efficiencies between 65% and 75% (Calwell and Mansoor 2003). Higher “active” mode supply efficiency benefits office equipment manufacturers by decreasing device thermal loads which reduces the cost of thermal management and increases product reliability and lifetime. This, combined with size,
74 The power supply must also achieve a power factor of at least 0.9 at full load. More information about the program is available at: www. 80plus.org .

4-42
weight, and cost decreases, drove the change from linear to switching power supplies in PCs. The ability to eliminate the power supply fan and greatly reduce the profile of the supply are important benefits of one high-efficiency desktop PC supply (Calwell 2004). Eliminating the fan also reduces the acoustic impact of the supply. Two other factors warrant consideration for potential changes in power supply design to improve supply efficiency. Switching power supplies emit electromagnetic radiation and the electromagnetic compatibility (EMC) of equipment can become a significant concern when testing under strict electromagnetic compliance requirements set forth by the Federal Communications Commission (FCC) and European Union. In general, ac line filter and switching supply design technology have improved the level of radiated and direct coupled harmonic noise created by switching supplies, and this is generally not an issue today when compared to the high-speed digital circuit emissions. Nonetheless, EMC must be taken into account when considering or implementing any new supply architectures, particularly control feedback schemes with higher frequency content. Power factor correction (PFC) has only recently received more attention in the lower power ranges due to regulations in the European Union (EU 2000) for harmonic content of monitors and PCs. Depending on the approach used, PFC can reduce supply efficiency by as much as 5% (Powerbox 1996). On the other hand, PFC can reduce the indirect energy consumption impact of the power supply. That is, an improved power factor decreases the reactive power draw of the device which, in turn, reduces in the energy dissipated in the utility and building power distribution systems. Finally, future changes in power supply architectures driven by continuing decreases in microprocessor operating voltages may decrease the importance of ac-dc supply efficiency but increase the importance of dc-dc supply efficiency. Almost all desktop PCs and servers use an ac-dc supply with multiple dc output voltages to power different components (Calwell and Mansoor 2003). Ever-decreasing microprocessor voltages (e.g., to as low as 1.1V) make direct conversion of ac to a single, universal dc voltage (such as 12V or 48V) more attractive. In this paradigm, each component would incorporate dc-dc power electronics to step the voltage to the level (or levels) it uses; indeed, most midrange to high-end servers incorporate such an architecture today (Belady 2004). This architecture inherently yields a higher (>80%) ac-dc supply efficiency. As a result, the ac-dc losses become smaller, potential gains in ac-dc conversion efficiency decrease, and dc-dc power conversion losses grow and become more important (Mansoor 2004; Belady 2004). Overall, the net system (i.e., plug to end components) power conversion efficiency75 probably would not change much without increased focus on dc-dc power conversion efficiency.
75 The net system efficiency for a desktop PC is approximately 50 to 60%, based on a 60 to 65% ac-dc supply efficiency and a 90% dc-dc supply efficiency (Calwell and Mansoor 2003).

4-43
4.4.6 Technology Development “Next Steps” • Encourage office equipment manufacturers to specify higher-efficiency power supplies,
including at partial-load (approximately 20% to 30%) ratings, e.g., by targeting the power supply as a performance element for office equipment labeling and efficiency promotion programs;
• Research and develop cost-effective efficient power supply architectures based on total energy conversion efficiency, i.e., ac to final dc used by components, particularly in light of a potential paradigm shift to ac-dc supplies that produce a single dc voltage;
• Research low-cost high-efficiency power supplies in the PC/Monitor wattage classes, including alternative architectures (e.g., partitioning).
4.4.7 References Aebischer, B. and A. Huser, 2002, “Energy Efficiency in Computer Power Supplies”,
Report, Swiss Federal Office of Energy: Research Programme “Electricity”, November. Available at: http://www.electricity-research.ch/pages/berichte/2003/power_supply_e_all-accepted_30.9_endfassung.pdf and http://www.cepe.ethz.ch/download/projects/Bernard/sb_power_supply_full.pdf (annexes, in German).
Aebischer, B. and A. Huser, 2003, “Energy Efficiency of Computer Power Supplies”, Proceedings of the 3rd International Conference on Energy Efficiency in Domestic Appliances and Lighting (EEDAL '03), 1-3 October, Torino, Italy. Available at: http://www.cepe.ethz.ch/download/staff/bernard/28_formated.pdf .
Belady, 2004, Personal Communication, Hewlett Packard Corporation, August. Calwell, C. and T. Reeder, 2002, “Power Supplies: A Hidden Opportunity for Energy
Savings”, Natural Resources Defense Council Report Prepared by Ecos Consulting, 22 May. Available at: http://www.energystar.gov/ia/partners/prod_development/downloads/power_supplies/powersupplysummary.pdf .
Calwell, C. and A. Mansoor, 2003, “Energy Efficient Power Supplies,” Presentation to the California Energy Commission, 16 December.
Calwell, C., 2004, Personal Communication, Ecos Consulting, February and September. Carlton, J., 2004, “Intel Back a More Efficient PC Power Supply”, The Wall Street Journal,
26 February, p. B4. Energy Star®, 2004, “Energy Star® Program Requirements for Single Voltage External Ac-
Dc and Ac-Ac Power Supplies – Draft 3”, Energy Star® Program. Available at: http://www.energystar.gov/index.cfm?c=prod_development.power_supplies .
European Commission, 2000, “Code of Conduct on Efficiency of External Power Supplies (Revision 2)”, European Commission Directorate-General Energy and Transport, 15 June. Available at: http://energyefficiency.jrc.cec.eu.int/pdf/COC_PSfinal_v6june2000.pdf .
European Union, 2000, “Electromagnetic Compatibility”, Harmonized Standard EN 61000-3-2.
4-44
Fanara, A., 2004, “EnergyStar®: A Strategy to Increase the Efficiency of Power Supplies”, Presentation at APEC 2004, 22-26 February, Anaheim, CA. Available at: http://www.energystar.gov/ia/partners/prod_development/downloads/power_supplies/APECSession%201_3_FINALFeb16.ppt .
Fisher, K., 2002, “Drivers for Efficient Power Consumption in Desktop/Mobile PC and Servers” , Proc. Of the 2nd IEECB Conference, 27-29 May, Nice, France.
Hershberg, C., 2002, Personal Communication, U.S. Environmental Protection Agency, December.
Hiller, D., C. Hershberg, and C. Calwell, 2004, “Forging Ahead with Desktop PC Power Supply Efficiency Improvements”, Presented at the Intel Technology Symposium, 8 September.
IEA, 2001, Things That Go Blip in the Night: Standby Power and How to Limit It, OECD Publications Service, Paris: France.
Intel, 2003, “ATX12V PowerSupply Design Guide – Version 2.0,” Intel Design Guide. Available at: http://www.formfactors.org/developer/specs/ATX12V%20PSDG2.0%20Ratified.pdf .
Koomey, J.G., 2002, Personal Communication, Lawrence Berkeley National Laboratory, October.
LBNL, 2001, CCAP-Office2, Microsoft Excel Spreadsheet, Dated 12 July. Mansoor, A., 2004, Personal Communication, EPRI-PEAC Corporation, March. Mansoor, A., and C. Calwell, 2004, “Improving Power Supply Efficiency: A Technical
Primer”, Review Draft, Sponsored by the California Energy Commission, 30 July. Novotny, S., 2002, Personal Communication, Sun Microsystems, Inc., December. Powerbox, 1996, “Technical Engineering Notes”, Powerbox International. Stellmack, D., 2001, “Rant-O-Matic: My Fried Power Supply”, Tom’s Hardware Guide, 12
October. Available at: http://www.tomshardware.com/column/01q4/011012/index.html .
White House, 2001, “Energy Efficient Standby Power Devices”, Executive Order, dated 31 July.
Product Literature Product literature was consulted from the following companies during the preparation of the Ac-Dc Power Supply Section. • Analog Devices • Condor Power Supplies, Incorporated. • Linear Technology • Online Power Supply, Inc.
4.4.8 Additional References The following references offer additional detail about power supply design and function.
4.4.8.1 Technical Design Reference Books

4-45
Middlebrook, R.D. and S. Cuk, 1983, Advances in Switched-Mode Power Conversion (2nd Edition), TESLACo: Pasadena, California.
Pressman, A.I., 1997, Switching Power Supply Design (2nd Edition), McGraw-Hill, Inc.: New York, New York.
Tarter, R.E., 1985, Principles of Solid State Power Conversion , Macmillan Computer Publications: New York, New York.
• Applied Pulse Technology, Inc. – Design and fabrication of high voltage pulse power and power electronics. http://home.san.rr.com/appliedpulse/ .
• International Rectifier – Application notes, technical papers, design tips. http://www.irf.com/technical-info/
• Maxim – Numerous application notes, notably on dc-dc Converters. http://www.maxim-ic.com/appnotes10.cfm .
• National Semiconductor Power – Resources for power electronics: application notes, articles, conference papers, and design ideas. http://www.national.com/appinfo/power/ .
• Power Electronics Technology Magazine – Articles, on-line buyers guide, for power electronics equipment/systems. http://www.powerelectronics.com/ .
• Texas Instruments – Power Management Application Resources. http://www.ti.com/sc/docs/apps/analog/power_management.html .
4.5 Higher-Efficiency LCD Backlights
4.5.1 Summary The monitor and display market is transitioning from cathode ray tube (CRT) displays to liquid crystal displays (LCDs). LCD monitors draw about 40% less power than CRT monitors in active mode. Nonetheless, LCD backlights, which account for about 80% of LCD active power draw, have significant inefficiencies which result in a net backlight system efficiency of about 1%. LCD backlights, typically cold cathode fluorescent lamps (CCFLs) have an efficacy equal to about 20% of the theoretical maximum for white light sources. Moreover, less than 5% of the light emitted by the backlight comes out the front of the screen, primarily due to losses in the color filters, first polarizer, and backlighting optics. Several approaches can yield large improvements in backlight efficiency and, hence, reductions in LCD active power draw and energy consumption. Promising approaches include efficacious flat light sources, higher efficacy backlights, and LED-driven field-sequential backlighting, Strong drivers exist for many backlighting approaches, primarily lower cost (from eliminating components) and longer battery life (for portable devices). Most technologies that increase the efficiency of LCD backlights are, however, technically immature and require further development for commercialization.
4.4.8.2 Power Electronics Websites
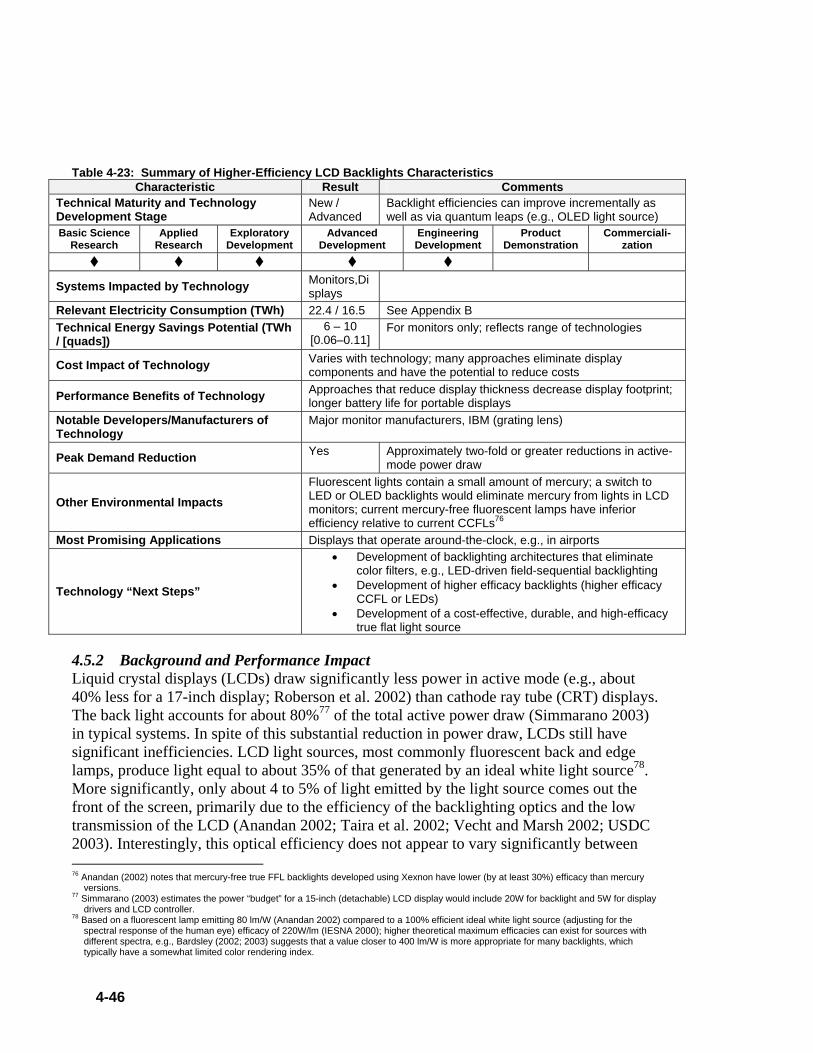
4-46
Table 4-23: Summary of Higher-Efficiency LCD Backlights Characteristics
Characteristic Result Comments Technical Maturity and Technology Development Stage
New / Advanced
Backlight efficiencies can improve incrementally as well as via quantum leaps (e.g., OLED light source)
Basic Science Research
Applied Research
Exploratory Development
Advanced Development
Engineering Development
Product Demonstration
Commerciali-zation
Systems Impacted by Technology Monitors,Displays
Relevant Electricity Consumption (TWh) 22.4 / 16.5 See Appendix B Technical Energy Savings Potential (TWh / [quads])
6 – 10 [0.06–0.11]
For monitors only; reflects range of technologies
Cost Impact of Technology Varies with technology; many approaches eliminate display components and have the potential to reduce costs
Performance Benefits of Technology Approaches that reduce display thickness decrease display footprint; longer battery life for portable displays
Notable Developers/Manufacturers of Technology
Major monitor manufacturers, IBM (grating lens)
Peak Demand Reduction Yes Approximately two-fold or greater reductions in active-mode power draw
Other Environmental Impacts Fluorescent lights contain a small amount of mercury; a switch to LED or OLED backlights would eliminate mercury from lights in LCD monitors; current mercury-free fluorescent lamps have inferior efficiency relative to current CCFLs76
Most Promising Applications Displays that operate around-the-clock, e.g., in airports
Technology “Next Steps”
• Development of backlighting architectures that eliminate color filters, e.g., LED-driven field-sequential backlighting
• Development of higher efficacy backlights (higher efficacy CCFL or LEDs)
• Development of a cost-effective, durable, and high-efficacy true flat light source
4.5.2 Background and Performance Impact Liquid crystal displays (LCDs) draw significantly less power in active mode (e.g., about 40% less for a 17-inch display; Roberson et al. 2002) than cathode ray tube (CRT) displays. The back light accounts for about 80%77 of the total active power draw (Simmarano 2003) in typical systems. In spite of this substantial reduction in power draw, LCDs still have significant inefficiencies. LCD light sources, most commonly fluorescent back and edge lamps, produce light equal to about 35% of that generated by an ideal white light source78. More significantly, only about 4 to 5% of light emitted by the light source comes out the front of the screen, primarily due to the efficiency of the backlighting optics and the low transmission of the LCD (Anandan 2002; Taira et al. 2002; Vecht and Marsh 2002; USDC 2003). Interestingly, this optical efficiency does not appear to vary significantly between 76 Anandan (2002) notes that mercury-free true FFL backlights developed using Xexnon have lower (by at least 30%) efficacy than mercury
versions. 77 Simmarano (2003) estimates the power “budget” for a 15-inch (detachable) LCD display would include 20W for backlight and 5W for display
drivers and LCD controller. 78 Based on a fluorescent lamp emitting 80 lm/W (Anandan 2002) compared to a 100% efficient ideal white light source (adjusting for the
spectral response of the human eye) efficacy of 220W/lm (IESNA 2000); higher theoretical maximum efficacies can exist for sources with different spectra, e.g., Bardsley (2002; 2003) suggests that a value closer to 400 lm/W is more appropriate for many backlights, which typically have a somewhat limited color rendering index.

4-47
edge-lit designs commonly used in laptop computers and area backlighting designs. For instance, a 22-inch high-resolution LCD display analyzed by Anadan (2002) uses 12 horizontal lamps (CCFL) and has a back reflector and two diffuser sheets. Only 3.7%79 of the light incident on the first diffuser comes out the front of the screen. The current discussion focuses on area backlight systems due to their common use in LCD monitors. Figure 4-8 depicts the optical path for a typical LCD monitor (not laptop) and Table 4-24 presents the approximate optical efficiency of each component, where efficiency equals the ratio of light entering the component (in lumens) to that exiting the component.
Screen Surface
2nd Polarizer
Color Filter
Liquid Crystal
Polarizer
Backlight
50%
25%
20%
5%
4%
~4%
Light Reflector
Diffuser
55%
Component%of BacklightTransmitted
Figure 4-8: LCD Schematic (based on USDC [2003] and Anandan [2002])
79 Assuming similar area for the first diffuser and the screen; 6300 cd/m2 at the first diffuser, LCD luminance = 235 cd/m2.

4-48
Table 4-24: Approximate Optical Efficiency of LCD Optical Components
Optical Component Optical Efficiency [%] Source
Light Reflector 50-60%80 Anandan (2002), USDC (2003 – for light pipe)
Diffuser 90% Anandan (2002) First Polarizer (Pre-LCD) 40-50% USDC (2003), Anandan (2002) LCD 70%-95%81 Tanase et al. (1998), Voutsas
and Ishii (2002), USDC (2003) Color Filter 25%-3082 Anandan (2002), Tanase et al.
(1998), USDC (2003) Second Polarizer (Post-LCD), surface reflections
80% Aggregate, USDC (2003)
Integrated System Optical Efficiency
4% Anandan (2002), USDC (2003)
The backlight emits light, with a reflector re-directing light emitted away from the LCD and towards the LCD. A plastic (polyester or polycarbonate) diffuser then “smooths” out the light from the discrete fluorescent tubes to increase the spatial uniformity of the light sheet. Subsequently, a polarizer83 laminated to the LCD aligns the incoming light to an angle approaching normal to the LCD to increase the fraction of light within the view angle accepted by the LCD. Because they only transmit light of one polarity while absorbing the other, the polarizer results in light losses of almost 50%. The light then encounters the LCD which, depending on the state of the crystal, either blocks or lets the light pass through to the color filter for that area. Finally, the light passes through a second polarizer and exits the front of the display. Several approaches exist to improving LCD backlighting efficiency, including increasing the efficacy of the light source and reducing losses of the optical path. In addition, the luminance of LC monitors could be decreased, with a corresponding reduction in monitor power draw. Discussions of the approaches follows. LCDs typically use cold cathode fluorescent lamps (CCFLs) for back lighting instead of hot cathode fluorescent lamps (HCFL) used in lighting applications because of their longer lifetime84 and thinner tube diameter85 (Anandan 2002; Harbers and Astler 2002). These have lower efficacy than conventional hot cathode fluorescent lamps used for lighting applications, e.g., about 40 to 5086 lm/W versus 70 to 90 (Anandan 2002). For reference, a white light with 100% efficiency would have an efficacy of 220 lm/W (IESNA 2000), i.e., CCFLs have an efficacy equal to less than 25% of the theoretical maximum. Several options exist for increasing the efficiency of the LCD light source, including higher-
80 According to Anandan (2002), the lamp reflectors and holder account for ~80% of these losses. 81 70% aperture ratio for LCD. 82 Tanase et al. (1998) estimate 70%, Anandan (2002) “almost 80%”. 83 Anandan (2002) describes an example consisting of two prism sheets. 84 Roughly 20,000 hours versus 10,000 (Anandan 2002). 85 Approximately 2mm versus 5mm (Anandan 2002). 86 USDC (2003) notes that CCFL efficacies can approach 80 lm/W, but the lower values appear to be typical.

4-49
efficiency fluorescent lamps, an array of light-emitting diodes (LED), and developing organic light-emitting diode (OLED) light sheets. Modifications that improve the efficiency of or completely eliminate the need for LCD optical components could result in dramatic reductions in monitor power draw. As noted earlier, less than five percent of the backlight light comes out the front of the screen. Color filters rank as the most inefficient component, with only 25 to 30% of incident light transmitted through the filters. Several approaches to eliminate color filters entirely are under investigation. A field-sequential color backlighting scheme eliminates the need for color filters. It uses three backlights (red-green-blue, a.k.a. RGB) that flash on the back of the LCD when the LCs are addressed to transmit the specific color. By independently addressing all three colors within 1/60th of a second, the eye perceives a consistent (flicker-free) image (Anandan 2002). The backlights could be fluorescent lamps or LEDs (USDC 2003). Alternatively, an array of discrete RGB LEDs distributed across the back of the LCD could flash one color at a time. At present, some cell phones use field-sequential backlighting (Bardsley 2003). A photoluminescent LCD replaces the conventional cold cathode fluorescent lamp with a lamp that produces UV radiation. The UV light excites an appropriately-colored phosphor on the surface of each LC to emit light at the desired visible wavelength (Anadan 2002). In effect, the phosphor replaces the color filter. Another approach that eliminates color filters is color pixel backlighting. The backlight – in this case probably a flat fluorescent lamp – incorporates color-specific RGB pixels (or strips of pixels) that directly emit RGB (Anandan 2002). IBM has explored a variation on this approach using a conventional CCFL with a grating sheet placed between the light guide and the polarizer. The grating sheet acts as a prism and splits the light into its RGB components, and microlenses focus each component on the desired portion of the LCD array. Some higher-end (approximately $5-10k) projection systems currently use color pixel backlighting (Bardsley 2003). Some displays use brightness enhancement films (BEF) to collect light rays emerging at a wide range of angles from diffuser and redirecting them at an angle closer to normal to the back surface of LCD. This increases the amount of light seen over a limited viewing angle, by up to a factor of two87 (Harbers and Astler 2002). However, it fundamentally does not increase the total amount of light passing through the front of the screen (Anandan 2002). The importance of wide viewing angles in monitor applications precludes using BEFs. Polarizers account for the next lowest efficiency, typically passing only 40 to 50% of incident light because light of one polarization passes through the layer while the polarizer absorbs the other (Anandan 2002). Increases in polarizer efficiency can be achieved by
87 If done only in vertical plane (but not horizontal), Harbers and Astler (2002) estimate that brightness increases by ~50%.

4-50
passing the light of the desired polarity through the polarizer while reflecting back the rest of the light to be de-polarized and converted to the desired polarity. The “prism sheet” approach uses a two-layer polarizer with optical features with specially selected angles. As the light passes through the “sheet”, the optics refract the light to increase the percentage of light with the preferred polarity. Light is reflected between the layers at angles such that it exits the polarizer “entrance” without a preferred polarization. This light can then scatter off of the back layer, de-polarizing the light and directing it back into the polarizer again (Anandan 2002). A second approach employs a specially designed film, e.g., a cholesteric liquid crystal (CLC) film, to transmit light with the desired polarity and to reflect the rest for recycling. Ultimately, development of an efficient wide-area polarized light source would obviate the need for the first polarizer and eliminate its losses (USDC 2003). Clearly, the system-level efficiency gain would depend upon the efficacy of the wide-are polarized light source.
4.5.3 Energy Savings Potential The annual revenues of the global display industry approached $60 billion dollars in 2003 (Young 2003). Collectively, this industry has invested – and continues to invest – extensive resources toward researching and commercializing many of the topics covered in this section. As a consequence, this report presents a basic overview of the energy savings potential of the technologies presented. Importantly, most of the approaches discussed have yet to become commercialized in monitor applications, which increases the uncertainty of the energy-savings estimates. The energy savings potential varies appreciably from one approach to another and each approach is discussed separately. All calculations embody four assumptions: 1. All monitors are 17-inch monitors; 2. All LCDs have the same power draw in sleep and off modes as current LCDs; 3. Backlighting and driver electronics account for 80% and 20% of baseline LCD monitor
active mode power draw, respectively (Simmarano 2003); 4. The driver electronics power draw remains constant while the backlight component
changes for each approach studied.
Fluorescent Lamps CCFLs used for LCD backlighting have efficacies in the range of 40 to 50 lm/W. Table 4-25 summarizes the efficacy of light sources, as used for conventional lighting; these values should be seen as broadly representative values for the efficacy of currently-available light sources.
4.5.3.1 Improved Light Source Efficacy
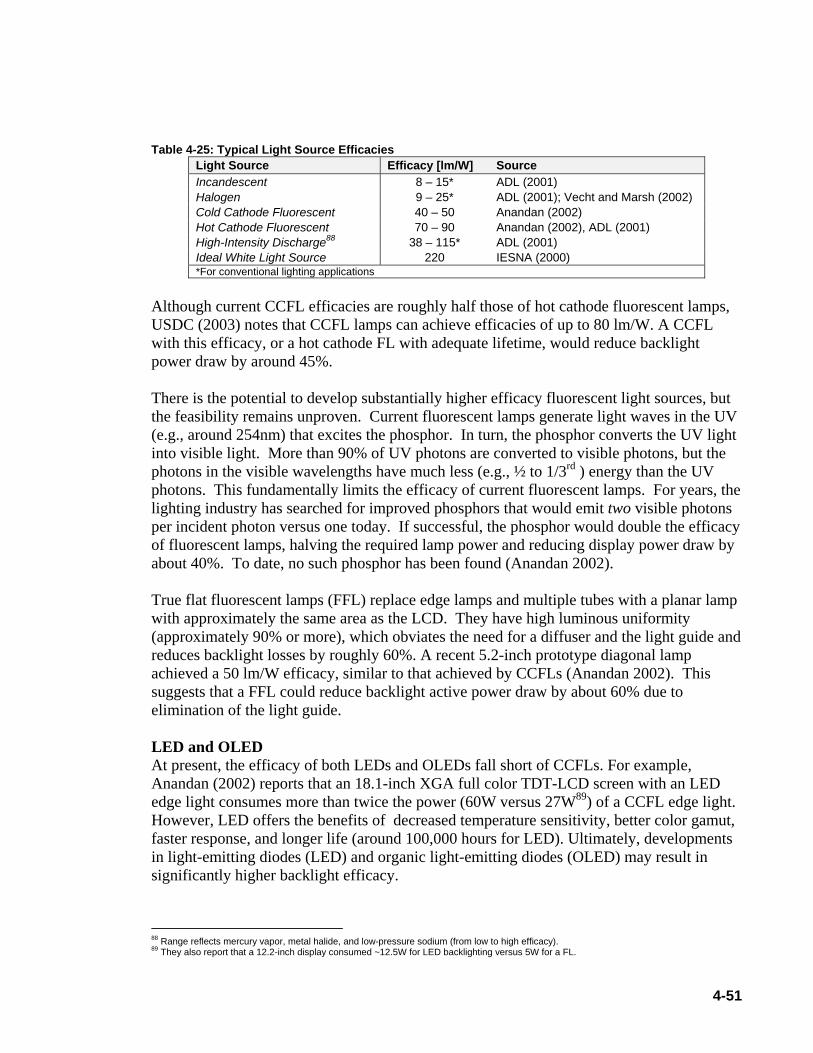
4-51
Table 4-25: Typical Light Source Efficacies
Light Source Efficacy [lm/W] Source Incandescent 8 – 15* ADL (2001) Halogen 9 – 25* ADL (2001); Vecht and Marsh (2002) Cold Cathode Fluorescent 40 – 50 Anandan (2002) Hot Cathode Fluorescent 70 – 90 Anandan (2002), ADL (2001) High-Intensity Discharge88 38 – 115* ADL (2001) Ideal White Light Source 220 IESNA (2000) *For conventional lighting applications
Although current CCFL efficacies are roughly half those of hot cathode fluorescent lamps, USDC (2003) notes that CCFL lamps can achieve efficacies of up to 80 lm/W. A CCFL with this efficacy, or a hot cathode FL with adequate lifetime, would reduce backlight power draw by around 45%. There is the potential to develop substantially higher efficacy fluorescent light sources, but the feasibility remains unproven. Current fluorescent lamps generate light waves in the UV (e.g., around 254nm) that excites the phosphor. In turn, the phosphor converts the UV light into visible light. More than 90% of UV photons are converted to visible photons, but the photons in the visible wavelengths have much less (e.g., ½ to 1/3rd ) energy than the UV photons. This fundamentally limits the efficacy of current fluorescent lamps. For years, the lighting industry has searched for improved phosphors that would emit two visible photons per incident photon versus one today. If successful, the phosphor would double the efficacy of fluorescent lamps, halving the required lamp power and reducing display power draw by about 40%. To date, no such phosphor has been found (Anandan 2002). True flat fluorescent lamps (FFL) replace edge lamps and multiple tubes with a planar lamp with approximately the same area as the LCD. They have high luminous uniformity (approximately 90% or more), which obviates the need for a diffuser and the light guide and reduces backlight losses by roughly 60%. A recent 5.2-inch prototype diagonal lamp achieved a 50 lm/W efficacy, similar to that achieved by CCFLs (Anandan 2002). This suggests that a FFL could reduce backlight active power draw by about 60% due to elimination of the light guide. LED and OLED At present, the efficacy of both LEDs and OLEDs fall short of CCFLs. For example, Anandan (2002) reports that an 18.1-inch XGA full color TDT-LCD screen with an LED edge light consumes more than twice the power (60W versus 27W89) of a CCFL edge light. However, LED offers the benefits of decreased temperature sensitivity, better color gamut, faster response, and longer life (around 100,000 hours for LED). Ultimately, developments in light-emitting diodes (LED) and organic light-emitting diodes (OLED) may result in significantly higher backlight efficacy.
88 Range reflects mercury vapor, metal halide, and low-pressure sodium (from low to high efficacy). 89 They also report that a 12.2-inch display consumed ~12.5W for LED backlighting versus 5W for a FL.

4-52
LEDs are fundamentally point sources and a monitor with an LED-based backlight probably would have a line of white or RGB LEDs (much as an edge-lit CCFL) with reflector optics to distribute the light over the entire display. Although current LEDs do not approach the efficacy of current CCFLs, a 200 lm/W efficacy target exists for white LED light sources (OIDA 2002). OLED backlights can be fabricated as a “sheet” light source and offer the potential for significantly higher system efficiency for two reasons. First, OLEDs eventually may attain a higher efficacy than fluorescent lamps, with an industry roadmap projecting superior efficacy to a CCFL in 2010, and substantially higher efficacy likely circa 2013 (see Table 4-26). It is important to note that OLED efficacy is lower in monitor (backlighting) applications than in conventional (diffuse) lighting applications. Table 4-26: Target Efficacy for OLED Backlights (from Bardsley 2001)
Target Efficacy [lm/W] Application 2004 2007 2010 2013
Diffuse Lighting 20 50 80 120 Monitor Backlight90 12 30 60 N/A
Much larger energy savings likely will result from the “sheet”-like nature of OLED light sources, which eliminate the need for reflectors and diffusers – and the net losses of about 60% associated with these components. Table 4-27 summarizes the energy impact calculations for the different approaches, which indicate that several approaches have the potential to halve LCD AEC. It is important to keep in mind that these energy saving potential estimates are based on pre-production data sources and that actual, commercialized monitors may have appreciably different values due to design tradeoffs. Table 4-27: Energy Consumption Values and AEC Estimate for Higher-Efficacy Backlights (15-inch LCD)
Display Type Active [W]
Sleep [W] Off [W] AEC
[TWh] Source
Conventional (Baseline) – 45 lm/W 35 2 2 7.9 Roberson et al.
(2002) Hot Cathode Fluorescent Lamp (HCFL) – 80 lm/W 23 2 2 5.4
Flat Fluorescent Lamp (FFL) – 45 lm/W 18 2 2 4.4
LED – 100 lm/W 20 2 2 4.7 LED – 150 lm/W 15 2 2 3.9 LED – 200 lm/W 13 2 2 3.4 OLED – 60 lm/W 15 2 2 3.9
Roberson et al. (2002) for “sleep” and “off” modes
90 Bardsley (2003) believes that the “basic diode” values shown provide a reasonable estimate of monitor backlight values.

4-53
Large potential gains in LCD efficiency come from increasing the optical path efficiency, which typically is less than 5%. Polarizers (40-50% efficiency) and color filters (25-30%) have the lowest optical efficiencies and measures to improve each will be addressed separately. Polarizers Polarizers have light losses of about 50% because light of one polarization passes through the layer while the polarizer absorbs the other. Ideally, approaches that reflect and recycle light with the “undesired” polarity would eventually convert all light to the desired polarity. In practice, the polarizers have optical losses that prevent polarizer efficiency from reaching 100%. Data for the “prism sheet” approach from tests using a sample polarizer yielded about a 30% increase in brightness (Anandan 2002), which translates into a polarizer efficiency of about 65% and approximately a 25% decrease in backlight power draw. Meanwhile, tests for a six-inch display integrating a cholesteric liquid crystal (CLC) film has produced a 40%91 increase in luminance for a six-inch display, or about a 30% decrease in backlight power draw (Anandan 2002). Simulations of a lightguide with integrated microstructure show an estimated increase in CCFL luminous efficiency of 70%, suggesting that larger gains may be possible (Chien and Shieh 2002). Based on these limited data, a 35% increase in brightness is used to estimate the backlight power level. Development of an efficient wide-area polarized light source would obviate the need for the first polarizer and eliminate its losses (USDC 2003). Clearly, the system-level efficiency gain would depend upon the efficacy of the wide-are polarized light source. Assuming that the light source had similar efficacy as current CCFL sources, backlight power draw would decrease by 50%. Color Filters Color filters only transmit roughly one quarter of the incident light, making them the most inefficient portion of the optical path. Therefore, approaches that eliminate color filters have the greatest promise for improving optical path efficiency by up to four-fold. A field-sequential color backlighting scheme supplants all color filters with three (RGB) backlights or, alternatively, an array of discrete RGB LEDs distributed across the back of the LCD. Field-sequential color backlighting also allows replacement of RGB sub-pixels with single pixels, which eliminates 2/3rds of the TFTs and electrodes and the light losses from those components and the sub-pixel borders. That is, it improves the aspect ratio of the pixels (Semenza 2004). Assuming that the RGB backlights have the same efficacy as current CCFLs, elimination of the color filter should translate into up to a four-fold reduction in backlight active power draw. The sequential operation of the different colored lamps should not increase total lamp energy consumption (Anandan 2003a). The approximately three-fold faster LCD addressing required, however, will increase drive electronics energy consumption.
91 Habers and Astler (2002) cite a ~50% gain for a polarization recovery film applied to an LCD television.
4.5.3.2 Enhanced Optical Path Efficiency

4-54
A photoluminescent LCD replaces the conventional cold cathode fluorescent lamp with a lamp that produces UV radiation that excites RGB phosphors. In effect, the phosphor replaces the color filter. Ultimately, the efficiency depends on how effectively the phosphors convert the UV light into visible light. To date, practical phosphors have yet to be developed (Anandan 2003a); consequently, any estimate of power draw reduction is speculative. The values in Table 4-28 assume that the UV lamp-phosphor combination performs similarly to current CCFLs while eliminating the color filters. Color pixel backlighting also eliminates color filters by using a flat fluorescent lamp that incorporates color-specific RGB pixels that directly emit RGB. One variant uses a conventional CCFL with a grating sheet to spilt light into its RGB components and microlenses to focus the RGB light on desired portion of LCD. IBM has demonstrated a prototype (13.3-inch diagonal) of the grating sheet plus microlens variant and achieved a three-fold improvement in the overall optical efficiency (Taira et al. 2002). It is reasonable to assume that a FFL incorporating RGB phosphors on its surface would realize similar efficiency gains92. Table 4-28: Increased LCD Optical Path Efficiency Measures – Power Draw by Mode and AEC Impact
(17-inch Monitor)
Display Type Active [W]
Sleep [W]
Off [W]
AEC [TWh] Source
Conventional (Baseline) 35 2 2 7.9 Roberson et al. (2002)
Polarizer Enhancement Films and Optics
28 2 2 6.4
Field-Sequential Color Backlighting
14 2 2 3.6
Photoluminescent LCD 14 2 2 3.6 Color Pixel Backlighting – Grating Sheet-Microlens
16 2 2 4.1
Roberson et al. (2002) for “sleep” and “off” modes
Monitor luminance levels vary significantly with display technology and application. For example, CRT monitors having luminance values roughly three times greater than LCD monitors. Furthermore, stand-alone LCD monitors have about twice the luminance of laptop LCDs (see Table 4-29), suggesting that stand-alone LCD monitors could have lower luminance levels and reduce their active mode power draw. Table 4-29: Display Luminance Levels (based on USDC 2003)
Display Type Peak Luminance [cd/m2] CRT Monitor 500 – 600 LC Monitor 200 LC Laptop Display 100
92 If the FFL efficacy matches that of a CCFL, the system could reduce backlight power draw further due to the elimination of the backlight optics. On the other hand, down-conversion of the light by the phosphors will result in some losses.
4.5.3.3 Lower Luminance Levels

4-55
If LC monitors could decrease their luminance to the levels of laptop PC displays, the backlight power draw would decrease by about 50%. As the backlight accounts for about 80% of active mode power draw, this reduces the active mode power draw by about 40% (see Table 4-30). Table 4-30: Reduced LCD Luminance – Power Draw by Mode and AEC
Display Type Active [W]
Sleep [W] Off [W] AEC [TWh]
Source
CRT 61 2 1 18.1 LCD 35 2 2 7.9
Roberson et al. (2002)
LCD w/ 50% Luminance Reduction 21 2 2 5.0
Roberson et al. (2002) for “sleep” and “off” modes
Thus, lower LC monitor luminance values would reduce AEC by about 3TWh relative to typical LCDs and ~12TWh as compared to similar CRTs monitors.
4.5.4 Cost The global market for monitors needs to be viewed in the context of the approximately $30 billion dollars total of flat panel displays sold in Y2003 (Bardsley 2003). Computer monitors are mass-produced commodities with low margins, making them very sensitive to small cost differences in different components as well as production volume. In part, this reflects the size of up-front investments in flat panel display manufacturing lines (roughly $25 billion spent for flat panel displays in the 1990s; USDC 2003). Consequently, the cost impact of different approaches that increase LCD backlighting efficiency depends on the ability for the approach to be incorporated into existing manufacturing processes and to eliminate various display components. Table 4-31 presents a breakdown of LCD factory cost93 in 2002 and 2005 (projected), framing the basic cost impact of eliminating different components from an LCD. Table 4-31: 15-inch LCD Cost by Component (from USDC 2003)
Approximate Component Cost94 Display Component In 2002 In 2005 (Projected)
Glass $6.75 $4.40 Color Filter $29.00 $20.00 Polarizer $11.50 $8.00 Driver IC $20.00 $15.00 Backlight System $22.50 $15.50 TOTAL, Components $90 $63 TOTAL OEM Panel Cost ~$200 $150
93 That is, the cost to manufacture the LCD, including purchased components, labor, facility, and capital costs. 94 Converted from Yen at $1 = 120 Yen.

4-56
Fluorescent Lamps Backlight systems using conventional CCFLs cost about $22 for a 15-inch LCD, or just over 10% of the total cost (see Table 4-31). FLs with improved fluorescent efficacy, be it from longer-life HCFLs appropriate for monitors or two-photon phosphor, have yet to be developed and thus have uncertain cost impact. Flat fluorescent lamps (FFLs) will cost more than conventional edge backlights but may reduce monitor cost slightly by eliminating optics (Anandan 2003a). Assuming that they can achieve necessary reliability levels, a more mature FFL likely will have a small impact on total monitor cost. LED and OLED At this point in time, LEDs have a very ambiguous cost structure. LEDs are fundamentally point sources, requiring conversion to line and then plane sources. One source suggests that LED backlights for 15- and 17-inch LCDs would cost roughly $35 and $4595, respectively (Anandan 2003b); note that the cost does not include the optics required to convert the LED point sources into plane sources. This is significantly higher than the 2002 estimated backlight system cost of $22.50 for a 15-inch LCD (Table 4-31; USDC 2003). Circa 2003, LED backlights have a dominant (about 80%) share of the cell phone backlight market (Anandan 2003b). White LED costs could decrease dramatically due to rapid advancements in LED use for general light sources. Ultimately, the evolution of white LED costs over time will determine whether or not they might replace CCFL backlights in monitors. A flat OLED backlight would eliminate the need for light optics; however, this does not appear to account for a significant portion of LCD cost (see Table 4-31). Consequently, its cost impact will depend upon the relative cost of the OLED-based backlight relative to a CCFL backlight. The Director of Roadmaps and Standards at the U. S. Display Consortium notes that the OLED diffuse lighting cost targets are very ambitious (see Table 4-32) and that OLED backlights will likely need TFTs or photosensors to manage evenness of display output (caused by inhomogeneous display characteristic introduced during manufacturing and differential aging; Bardsley 2003). He expects that OLED backlight systems will cost significantly more than conventional backlights for at least 5 to 10 years. Instead, the display industry has focused on using OLED backlights in smaller displays in wireless devices where the power draw advantage of OLEDs can justify the higher cost. Table 4-32: Target OLED Diffuse Lighting Characteristics (from Bardsley 2001)
Characteristic 2004 2007 2010 2013 Lifetime [hours @ 2,000 cd/m2] 10,000 20,000 40,000 40,000 Maximum Panel Width [inches] 14 40 40 >40 Fabrication Costs [$/m2] 120 60 40 30 Estimated Fabrication Costs, OLED Backlight for 17-inch Monitor96 [$]
$10.75 $5.40 $3.60 $2.70
95 Based on a brightness of 108 cd/m2, screen area of 0.091m2 (17-inch screen, 337.9mm x 270.3mm), peak luminance of 200 cd/m2, and an
optical efficiency of 4%. 96 Assumes a 4:3 ratio of width to height, i.e., 13.6-inch by 10.2-inch.
4.5.4.1 Improved Light Source Efficacy

4-57
Polarizers Both approaches considered to enhance the efficiency of polarizers both incorporate additional optics (prism sheet and integrated microguid) or film (CLC film) and, thus, would increase monitor costs. USDC (2003) comments that micro-optical technologies are “cost-prohibitive at this time,” which suggests that this approach will not become cost-effective in the near future. Color Filters Field-sequential color backlighting supplants all color filters with three (RGB) backlights or, alternatively, an array of discrete RGB LEDs distributed across the back of the LCD. Thus, it will eliminate the cost of the color filters ($29; see Table 4-31) but increase the number and total cost of backlights. Adding two conventional CCFL lamps would increase the monitor cost by roughly $1097 (Anandan 2003a), which suggests that successful implementation of the field-sequential approach would reduce LCD cost by about 10%. A photoluminescent LCD replaces the conventional CCFL with a lamp without a phosphor that produces UV radiation. The UV rays then pass through the LCD and excite RGB phosphors on the front (other) side of the LCD, generating color pixels. In effect, the phosphors replace the color filters. The lack of appropriate phosphors for this application prevents development of a credible cost impact estimate (see section 4.5.5 for a discussion of barriers). However, it is unlikely that the patterned phosphors will cost less than current color filters (Bardsley 2003). Color pixel backlighting also eliminates color filters by using a flat fluorescent lamp that incorporates color-specific RGB pixels that directly emit RGB or a CCFL with a light grating sheet. The FFL variant replaces the color filters with an array of phosphors that convert the incoming light to RGB light sources. Bardsley (2003) suggests that this approach would have a similar complexity of manufacture, hence, no appreciable decrease in cost and quite possibly higher cost. At present, the grating sheet approach is prohibitively expensive, due to the challenge of maintaining spatial uniformity of the features and effective optical alignment over larger display areas (Barsley 2003).
Decreasing monitor luminance levels will result in a moderate reduction in monitor cost because it enables use of a less-powerful lamp for the display. Similarly, it could reduce the size and cost of the monitor power supply.
97 Based on an approximate cost of ~$3-$5/lamp (Anandan 2003).
4.5.4.2 Enhanced Optical Path Efficiency
4.5.4.3 Lower Luminance Levels
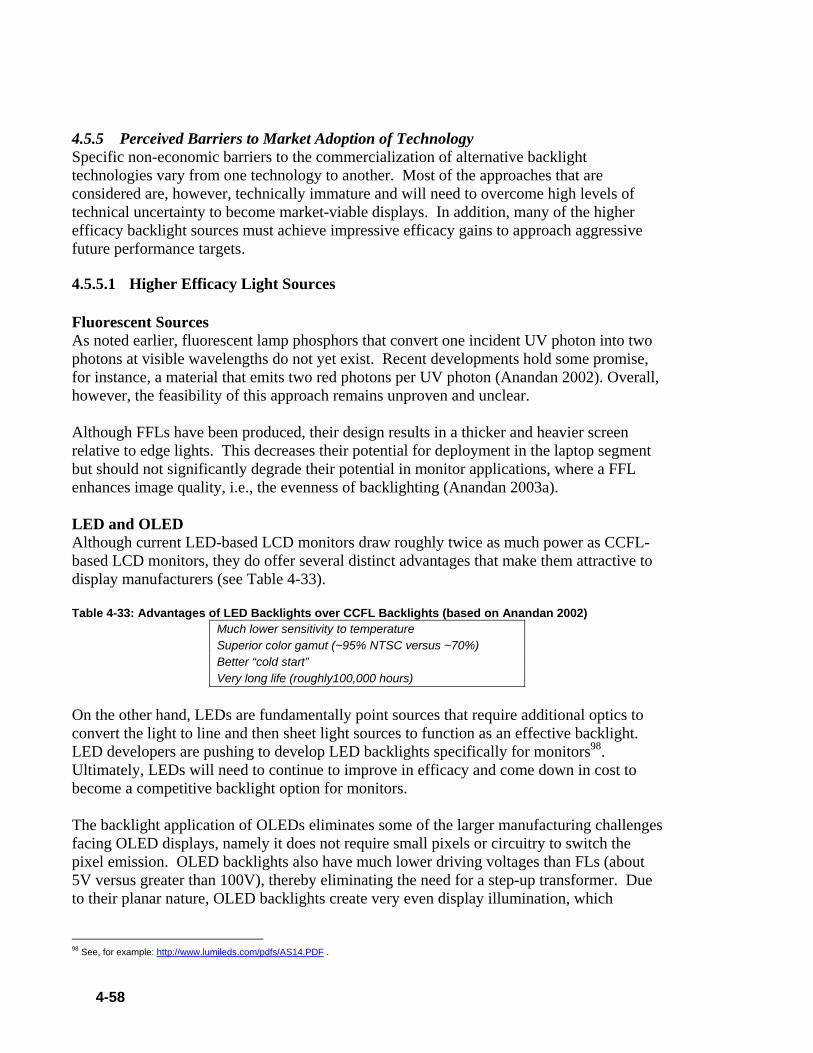
4-58
4.5.5 Perceived Barriers to Market Adoption of Technology Specific non-economic barriers to the commercialization of alternative backlight technologies vary from one technology to another. Most of the approaches that are considered are, however, technically immature and will need to overcome high levels of technical uncertainty to become market-viable displays. In addition, many of the higher efficacy backlight sources must achieve impressive efficacy gains to approach aggressive future performance targets.
Fluorescent Sources As noted earlier, fluorescent lamp phosphors that convert one incident UV photon into two photons at visible wavelengths do not yet exist. Recent developments hold some promise, for instance, a material that emits two red photons per UV photon (Anandan 2002). Overall, however, the feasibility of this approach remains unproven and unclear. Although FFLs have been produced, their design results in a thicker and heavier screen relative to edge lights. This decreases their potential for deployment in the laptop segment but should not significantly degrade their potential in monitor applications, where a FFL enhances image quality, i.e., the evenness of backlighting (Anandan 2003a). LED and OLED Although current LED-based LCD monitors draw roughly twice as much power as CCFL-based LCD monitors, they do offer several distinct advantages that make them attractive to display manufacturers (see Table 4-33). Table 4-33: Advantages of LED Backlights over CCFL Backlights (based on Anandan 2002)
Much lower sensitivity to temperature Superior color gamut (~95% NTSC versus ~70%) Better “cold start” Very long life (roughly100,000 hours)
On the other hand, LEDs are fundamentally point sources that require additional optics to convert the light to line and then sheet light sources to function as an effective backlight. LED developers are pushing to develop LED backlights specifically for monitors98. Ultimately, LEDs will need to continue to improve in efficacy and come down in cost to become a competitive backlight option for monitors. The backlight application of OLEDs eliminates some of the larger manufacturing challenges facing OLED displays, namely it does not require small pixels or circuitry to switch the pixel emission. OLED backlights also have much lower driving voltages than FLs (about 5V versus greater than 100V), thereby eliminating the need for a step-up transformer. Due to their planar nature, OLED backlights create very even display illumination, which
98 See, for example: http://www.lumileds.com/pdfs/AS14.PDF .
4.5.5.1 Higher Efficacy Light Sources

4-59
enhances image quality (Anandan 2003a). In addition, OLED backlights are much thinner than CCFLs, reducing their form factor. Despite these benefits, several barriers to commercialization of OLED backlights in monitor applications remain. Present light conversion efficiency levels are much lower than CCFLs and must increase dramatically to attain even parity with CCFLs. Moreover, the current stability and lifetime of OLEDs must improve to meet the approximately 20,000-hour lifetime required for monitor applications. An industry roadpmap has set 2007 as a target date for accomplishing this goal for diffuse lighting applications (see Table 4-32). Finally, current OLED costs far exceed those of CCFL backlights. As USDC (2003) notes: “The cost requirements of this application are extremely aggressive and little opportunity appears to exist for extracting sufficient value to justify the R&D and capital expenses required to produce such light sources for their own sake.” On the other hand, the same source notes that OLED backlights could represent an opportunity for an OLED lighting manufacturer to increase sales volume. Taken as a whole, unless OLED backlight prices approach that of CCFLs, it appears doubtful that the display industry will apply OLED backlights in desktop monitor applications in the short or long term.
Polarizers Both approaches considered to increase polarizer efficiency incorporate additional optics (prism sheet and integrated microguide) or film (CLC film). Thus, both would increase monitor costs. USDC (2003) comments that micro-optical technologies are “cost-prohibitive at this time”, suggesting that this approach will not become cost-effective in the near future. Color Filters Bardsely (2002) characterizes field-sequential color backlighting based on RGB backlights as very difficult to implement in monitors at present. This approach requires synchronization between the flashing of each color on the back of LCD and addressing of specific LCDs to transmit each color. All pixels must be capable of displaying all three colors within 1/60th of a second (to avoid flicker), which demands fast response (~3-5ms, about three times faster than current rates) from the LCD and from the fluorescent lamps (~1ms rise and decay time; Anandan 2002, Semenza 2004). Researchers have identified phosphors and LCDs with the necessary response times, but the fluorescent lamps require additional detailed study (Anandan 2002). One prototype built using LED backlights obtained superior color saturation than NTSC. Field-sequential color backlighting cannot, however, be easily implemented with current AMLCD electronics (Taira et al. 2002). Overall, USDC (2003) sees the potential for commercial unit production circa 2005 to 2007. UV light sources and viable phosphors to produce RGB colors exist to produce a photoluminescent LCD. However, the sensitivity of glass and acrylic components to UV light impedes commercialization of the concept. Specifically, the CCFL tube, light reflectors, LC, LC substrate and polarizer materials will all require evaluation for stability and/or replacement (Anandan 2002).
4.5.5.2 Enhanced Optical Path Efficacy
4-60
Color pixel backlighting replaces the color filters with a backlight with color-specific RGB pixels that directly emit RGB (Anandan 2002). Both the patterned backlight and prism variants require very precise alignment of the light sources with LCD pixels and related optics to insure that the LCD pixels pass the proper colors. The patterned backlight incorporates two additional sheets of glass, which increases the monitor thickness by approximately 0.5mm and adds additional weight (Anandan 2003a). Although problematic for laptop PC applications, the additional thickness and weight should not prove a significant burden for desktop monitors.
Although technically feasible, it is unlikely that monitor manufacturers will decrease monitor luminance values. Customers generally want brighter displays, and a display industry roadmap projects moderate increases in PC monitors luminance over the next several years (USDC 2003). Thus, this option has little chance of succeeding in the monitor market.
4.5.6 Technology Development “Next Steps” Most technologies that increase the efficiency of LCD backlights are technically immature and require further development for commercialization. Strong drivers exist for many backlighting approaches, primarily lower cost (from eliminating components) and longer battery life (for portable devices). “Next steps” that could lead to gains in backlight efficiency include development of: • Backlighting architectures that eliminate the need for color filters; field-sequential
backlighting appears to be a promising option, e.g., illuminated by LEDs; • Higher efficiency backlights, e.g., a more efficacious CCFL or LEDs (whose cost could
decrease dramatically due to rapid advancements in LED use for general light sources); • Cost-effective, durable, and high-efficacy true flat light source.
4.5.7 References ADL, 2001, “Energy Savings Potential of Solid State Lighting in General Lighting
Applications”, Final Report to the U.S. Department of Energy, Office of Building Technology, State and Community Programs, April. Available at: http://www.eren.doe.gov/buildings/documents/pdfs/ssl_final_report3.pdf .
ADL, 2002, “Energy Consumption by Office and Telecommunications Equipment in Commercial Buildings – Volume I: Energy Consumption Baseline”. ,” Final Report to the U.S. Department of Energy, Office of Building Technology, State and Community Programs, January. Available on-line at: http://www.eere.energy.gov/buildings/documents/pdfs/office_telecom-vol1_final.pdf .
Anandan, M., 2002, “LCD Backlighting”, Society for Information Display: Seminar Lecture Notes: Volume II, 24 May, Boston, pp. F-5/1 – F-5/82.
4.5.5.3 Lower Luminance Levels

4-61
Anandan, M., 2003a, Personal Communication, Organic Lighting Technologies LLC, August.
Anandan, M., 2003b, “LCD Backlighting”, Society for Information Display: Seminar Lecture Notes: Volume II, 23 May, Baltimore, pp. F-2/1 – F-2/84.
Bardsley, J.N., 2001, “International OLED Technology Roadmap: 2001-2010”, White Paper by U.S. Display Consortium. Available at: http://www.usdc.org/technical/downloads/OLED_Techroadmap_nbtext.pdf .
Bardsley, N., 2003, Personal Communication, United States Display Consortium, August. Chien, K.-W. and H.-P. D. Shieh, 2002, “An Integrated Lightguide Equipped with
Polarization Conversion”, Society for Information Display, 2002 International Symposium – Digest of Technical Papers, Volume XXXIII, Number 1I, pp. 1229-1231.
Crawford, G.P., 2002, Personal Communication, Brown University, October. Fisher, K., 2002, “Drivers for Efficient Power Consumption in Desktop/Mobile PC and
Servers” , Proc. Of the 2nd IEECB Conference, 27-29 May, Nice, France. Harbers, G. and C. Astler, 2002, “The New Light Behind LCD HDTV”, Information
Display, June, pp. 22-25. IESNA, 2000, IESNA Lighting Handbook – 9th Edition, Mark S. Rea (Editor),
Illuminating Engineering Society of North America: New York, New York. Jakhanwal, V., 2003, “Managing the Cost of LCD Components”, Information Display,
February, pp. 26-30. Kim, S.J., N.-O. Kwon, Y.-M. Kim, D.-O. Yang, J.-W. Hong, Y.-G. Lee, T.-S. Cho, J.-G.
Kang, E.-H. Chaoi, and G. Cho, 2002, “Capacity Coupled Electrodeless Discharge Backlight Driven by Switching Inverter for 17-inch and 20.1-inch LCD TVs”, Society for Information Display, 2002 International Symposium – Digest of Technical Papers, Volume XXXIII, Number I1, pp. 1151-1153.
Mently, D.E., 2002a, “State of Flat-Panel Display Technology and Future Trends”, Proceedings of the IEEE, vol. 90, no. 4., April, pp. 453-459.
Mentley, D.E., 2002b, “Display Market and Technology Trends”, Society for Information Display: Seminar Lecture Notes: Volume I, 24 May, Boston, pp. M-1/1-M-1/72.
OIDA, 2002, “The Promise of Solid State Lighting for General Illumination”, 2002 Update, Co-Sponsored by the U.S. Department of Energy, Office of Building Technology, State and Community Programs and the Optoelectronics Industry Development Association (OIDA).
Park, H.B., K.Y. Kim, J.H. Hong, Y.J. Lee, H. Hatanaka, Y.M. Kim, and S.J. Im, 2002, “The Dual Coplanar Electrode Mercury Free Flat Fluorescent Lamp”, Society for Information Display, 2002 International Symposium – Digest of Technical Papers, Volume XXXIII, Number 2, pp. 1138-1141.
Semenza, P., 2002, Personal Communication, iSuppli/Stanford Resources, October. Semenza, P., 2004, Personal Communication, iSuppli/Stanford Resources, September. Shiga, T and S. Mikoshiba, 2002, “LCD Backlights: With or Without Hg?”, Journal of the
Society for Information Display, vol. 10, no. 4, pp. 343-346. Simmarano, R., 2003, “Rethinking the PC”, Information Display, January, pp. 12-15. Taira, Y., D. Nakano, H. Numata, A. Nishikai, S. Ono, F. Yamada, M. Suzuki, M. Noguchi,
R. Singh, and E.G. Colgan, 2002, “Low-Power LCD Using a Novel Optical

4-62
System”, Society for Information Display, 2002 International Symposium – Digest of Technical Papers, Volume XXXIII, Number 2, pp. 1313-1315.
USDC, 2003, “The Global Flat Panel Display Industry ‘2003’: An In-Depth Overview and Roadmap on FPD Technologies, Markets, Manufacturing, and Materials”, U.S. Display Consortium.
Vecht, A. and P.J. Marsh, 2002, “Light Emission in Organic Displays”, Society for Information Display: Seminar Lecture Notes: Volume I, 24 May, Boston, pp. F-8/1 – F-8/77.
Wu, S.-T. and D.-K. Yang, 2001, Reflective Liquid Crystals, John Wiley & Sons, Ltd.: Chichester, UK.
Young, R., 2003, “FPD Market and Technology Overview”, Society for Information Display, Seminar Lecture Notes – Volume I: May 19.
4.6 Inkjet Copiers and Printers
4.6.1 Summary Personal inkjet printers have captured a large portion of the residential printer market, but have yet to have a significant impact in most business printing and copying applications. Recently, inkjet printers targeted for the low-end business segment have entered the market. Compared to electrophotographic (EP) devices, i.e., laser printers and copy machines, inkjet printers have the potential to consume significantly less energy because they do not require continuous heating to keep a fuser roll hot in anticipation of imaging. On a nationwide basis, inkjet technology could reduce imaging AEC by more than 40%. To realize this potential, inkjet technology must satisfy three requirements. First, inkjet devices need to achieve per-image costs that are competitive with monochrome copy machines and laser printers. Second, inkjet devices still have much lower imaging rates for text documents than EP devices and need to dramatically increase their actual throughputs for printing text documents to that of mid-range (about 40ppm/cpm) laser printers and copiers to penetrate the broader commercial market, without compromising image quality. Third, inkjet printers need to improve their image quality to achieve parity with laser printers. On the other hand, a dramatic increase in the demand for color business printers and copiers may favor inkjet devices, and increase their potential to succeed in the commercial market.

4-63
Table 4-34: Summary of Inkjet Imaging Characteristics Characteristic Result Comments
Technical Maturity and Technology Development Stage
Current / New
Low-throughput (around 15ppm rated speed) inkjet devices are commercially available
Basic Science
Research Applied
Research Exploratory Developme
nt Advanced
Development Engineering Development
Product Demonstrati
on Commercial
i-zation
Systems Impacted by Technology Laser printers and copy machines Relevant Electricity Consumption (TWh) 13.5 2/3rds copy machines, 1/3rds laser printers
Technical Energy Savings Potential (TWh / [quads])
6 [0.07]
71% copy machines, 29% laser printers; Electrophotographic (EP) imaging devices with power management enabled that can warm up quickly could achieve similar savings
Cost Impact of Technology Potentially Lower
Currently similar for similar color laser and inkjet printers; inkjet devices have fewer parts than laser devices, indicating the potential for lower cost
Performance Benefits of Technology Increased color capability; most EP copiers and laser printers are black and white
Notable Developers/Manufacturers of Technology
Canon, Fuji-Xerox, Hewlett-Packard, Sharp; several manufacturers of wide format printers use UV-curable inks
Peak Demand Reduction Yes Reduces “active” mode (i.e., ready to print or copy;
see Appendix C) power draw levels, as well as instantaneous peak draw (laser or lamp)
Other Environmental Impacts Unclear impact of switch from toner to ink
Most Promising Applications Moderate- to low-speed laser printers; “active” mode accounts for greatest percentage of total UEC for these devices
Technology “Next Steps” Development of inkjet imaging devices with high image quality at higher speeds (about 40+ ppm/cpm)
4.6.2 Background and Performance Impact Laser printing and traditional copying are both electrophotographic (EP), also called xerophotographic, processes, but they differ in how the input data are gathered and used. Laser printing interprets electronic signals representing an image (page) sent to the printer, whereas analog copiers manipulate the reflected light from the copied paper. During operation, a laser printer receives an electronic signal from the computer that triggers a laser. The laser then shines on certain areas of a rotating drum, creating a charge pattern that defines the image or text to be printed. Next, the charged portion of the drum rotates past the toner supply, attracting particles of toner to the charged areas of the drum. As the drum continues to rotate over the paper, a charged wire beneath the paper draws the toner from the drum and onto the paper. Finally, the paper travels into the fuser, where a pair of hot fuser rollers fuse the toner to the paper and then eject the paper from the printer (ADL 2002; Lovins and Heede 1990). Laser printers consume more energy than inkjet printers, primarily because the fuser rolls must remain at high temperatures to bond the toner to the paper. During printing, the laser printer actively supplies resistance heat to ensure effective bonding. In addition, laser printers in stand-by mode require perpetual heating to avoid heat-up driven delays in response to a print request.
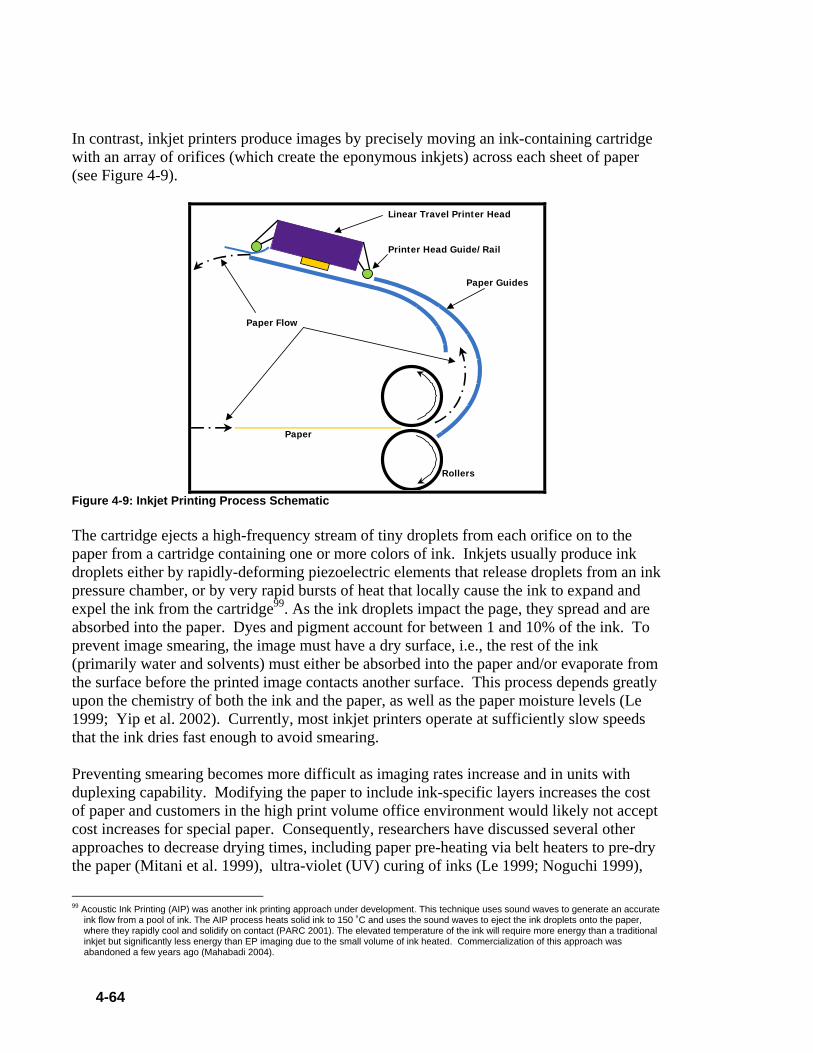
4-64
In contrast, inkjet printers produce images by precisely moving an ink-containing cartridge with an array of orifices (which create the eponymous inkjets) across each sheet of paper (see Figure 4-9).
Rollers
Paper Guides
Paper Flow
Linear Travel Printer Head
Printer Head Guide/Rail
Paper
Figure 4-9: Inkjet Printing Process Schematic The cartridge ejects a high-frequency stream of tiny droplets from each orifice on to the paper from a cartridge containing one or more colors of ink. Inkjets usually produce ink droplets either by rapidly-deforming piezoelectric elements that release droplets from an ink pressure chamber, or by very rapid bursts of heat that locally cause the ink to expand and expel the ink from the cartridge99. As the ink droplets impact the page, they spread and are absorbed into the paper. Dyes and pigment account for between 1 and 10% of the ink. To prevent image smearing, the image must have a dry surface, i.e., the rest of the ink (primarily water and solvents) must either be absorbed into the paper and/or evaporate from the surface before the printed image contacts another surface. This process depends greatly upon the chemistry of both the ink and the paper, as well as the paper moisture levels (Le 1999; Yip et al. 2002). Currently, most inkjet printers operate at sufficiently slow speeds that the ink dries fast enough to avoid smearing. Preventing smearing becomes more difficult as imaging rates increase and in units with duplexing capability. Modifying the paper to include ink-specific layers increases the cost of paper and customers in the high print volume office environment would likely not accept cost increases for special paper. Consequently, researchers have discussed several other approaches to decrease drying times, including paper pre-heating via belt heaters to pre-dry the paper (Mitani et al. 1999), ultra-violet (UV) curing of inks (Le 1999; Noguchi 1999),
99 Acoustic Ink Printing (AIP) was another ink printing approach under development. This technique uses sound waves to generate an accurate
ink flow from a pool of ink. The AIP process heats solid ink to 150 ˚C and uses the sound waves to eject the ink droplets onto the paper, where they rapidly cool and solidify on contact (PARC 2001). The elevated temperature of the ink will require more energy than a traditional inkjet but significantly less energy than EP imaging due to the small volume of ink heated. Commercialization of this approach was abandoned a few years ago (Mahabadi 2004).

4-65
and solvent-based ink (Le 1999). If any of these approaches could provide high-quality images and replace EP devices, they could eliminate the energy consumed to maintain EP device fuser rolls at higher temperatures, i.e., the component that accounts for most of the energy consumed by the population of laser printers and copy machines. Instead, higher-speed inkjet devices may only require application of some heat during the actual printing process to dry the ink (Mitani et al. 1999, Troelsen 2002). Inkjet imaging products have begun to enter the market for lower-speed (pages per minute) copier and printers in commercial buildings. At least three manufacturers produce inkjet copiers and inkjet printers have specified speeds of around 20 ppm/cpm, although limited test data suggest that at least two of the devices print text documents at between 7 and 10ppm using a “standard” quality setting (Grevstad 2002, Grevstad 2003). Inkjet copiers with duplex capability have also come to market100. Although not yet competitive with higher-speed devices, this capability is an important step for the success and acceptance of inkjet technology. Further advances in inkjet technology may enable inkjet devices to replace higher-speed EP-based equipment. One imaging company has developed a “long-line” inkjet print head that increases the printer’s throughput. With multiple print heads, they estimate that inkjet printers could print in excess of 60 pages per minute in color (Canon 2004); a product based on this approach has yet, however, to come to market. Inkjet technology offers additional benefits, most notably the provision of color printing capability at low cost.
4.6.3 Energy Savings Potential Inkjet devices that eliminate the need to maintain a fuser rolls at an elevated temperature could enable inkjet devices to reduce total copy machine and laser printer energy consumption by almost 50%. The energy savings calculations reflect modified power draw and usage assumptions based on four assumptions: 1) The inkjet devices image at the same rate as the EP devices; 2) The energy required by inkjet devices to dry the ink is roughly equivalent to the energy
required to print an EP image, i.e., 1Wh/page101 (ADL 2002). Product literature for a 14ppm102 business inkjet printer103 supports this assumption, while an experimental evaluation of a belt-type preheating system (Mitani et al. 1999) and a study of UV curing suggests lower energy levels (Noguchi 1999);
100 HP currently markets a 21 cpm (draft quality) inkjet copy machine, the HP Business Inkjet 3000, capable of duplexing. 101 According to information provided by a major printer manufacturer, an older inkjet printer would require about 0.24cc of water to print a plain
text page at 5% text coverage (it is not clear that newer devices would use appreciably less water). The energy required to evaporate this volume equals about 550J, or ~0.15Wh. In reality, some evaporation will occur into the ambient air within the allowable time (before contacting another sheet) without convection; forced air would significantly increase evaporation. Another portion of the water will wick into the paper where it won't create a smearing issue. On the other hand, heat must be applied to the entire sheet at this rate because the text will be distributed over document and much heat will be "wasted" heating areas that don't fully need it. This would result in an upper bound of ~3Wh of heat to drive off the moisture (0.15Wh/5%). Overall, it would appear that an inkjet printer that relies primarily on heat to drive off the moisture would require roughly the same amount of energy per image as an EP device, i.e., ~1Wh.
102 Document printing tests reported in Grevstad (2003) suggest a rate of about 8ppm for typical office use. 103 The HP 3000 business inkjet printer has a maximum power draw of 700W; presumably, the printer approaches this speed while printing
(downloaded on 15 August, 2003, at: http://h10010.www1.hp.com/wwpc-JAVA/offweb/vac/us/product_pdfs/83387.pdf ).
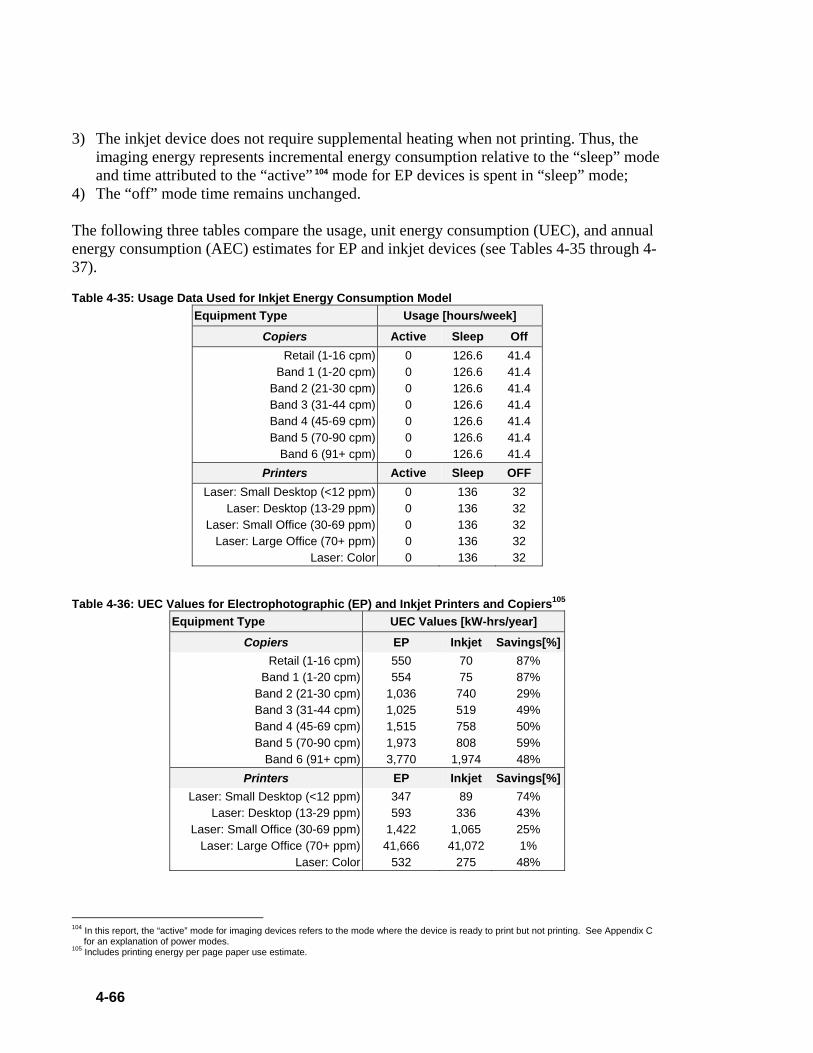
4-66
3) The inkjet device does not require supplemental heating when not printing. Thus, the imaging energy represents incremental energy consumption relative to the “sleep” mode and time attributed to the “active” 104 mode for EP devices is spent in “sleep” mode;
4) The “off” mode time remains unchanged. The following three tables compare the usage, unit energy consumption (UEC), and annual energy consumption (AEC) estimates for EP and inkjet devices (see Tables 4-35 through 4-37). Table 4-35: Usage Data Used for Inkjet Energy Consumption Model
Equipment Type Usage [hours/week]
Copiers Active Sleep Off Retail (1-16 cpm) 0 126.6 41.4
Band 1 (1-20 cpm) 0 126.6 41.4 Band 2 (21-30 cpm) 0 126.6 41.4 Band 3 (31-44 cpm) 0 126.6 41.4 Band 4 (45-69 cpm) 0 126.6 41.4 Band 5 (70-90 cpm) 0 126.6 41.4
Band 6 (91+ cpm) 0 126.6 41.4 Printers Active Sleep OFF
Laser: Small Desktop (<12 ppm) 0 136 32 Laser: Desktop (13-29 ppm) 0 136 32
Laser: Small Office (30-69 ppm) 0 136 32 Laser: Large Office (70+ ppm) 0 136 32
Laser: Color 0 136 32 Table 4-36: UEC Values for Electrophotographic (EP) and Inkjet Printers and Copiers105
Equipment Type UEC Values [kW-hrs/year]
Copiers EP Inkjet Savings[%]Retail (1-16 cpm) 550 70 87%
Band 1 (1-20 cpm) 554 75 87% Band 2 (21-30 cpm) 1,036 740 29% Band 3 (31-44 cpm) 1,025 519 49% Band 4 (45-69 cpm) 1,515 758 50% Band 5 (70-90 cpm) 1,973 808 59%
Band 6 (91+ cpm) 3,770 1,974 48% Printers EP Inkjet Savings[%]
Laser: Small Desktop (<12 ppm) 347 89 74% Laser: Desktop (13-29 ppm) 593 336 43%
Laser: Small Office (30-69 ppm) 1,422 1,065 25% Laser: Large Office (70+ ppm) 41,666 41,072 1%
Laser: Color 532 275 48%
104 In this report, the “active” mode for imaging devices refers to the mode where the device is ready to print but not printing. See Appendix C
for an explanation of power modes. 105 Includes printing energy per page paper use estimate.

4-67
Table 4-37: AEC Comparison of Electrophotographic (EP) and Inkjet Devices Equipment Type EP [TWh/year] Inkjet [TWh/year]
Copiers 9.0 4.6
Retail (1-16 cpm) 0.2 0.0 Band 1 (1-20 cpm) 1.5 0.2
Band 2 (21-30 cpm) 3.4 2.4 Band 3 (31-44 cpm) 1.0 0.5 Band 4 (45-69 cpm) 2.1 1.0 Band 5 (70-90 cpm) 0.5 0.2
Band 6 (91+ cpm) 0.4 0.2 Laser Printers 4.5 2.7
Laser: Small Desktop (<12 ppm) 0.3 0.1 Laser: Desktop (13-29 ppm) 3.0 1.7
Laser: Small Office (30-69 ppm) 0.3 0.2 Laser: Large Office (70+ ppm) 0.5 0.5
Laser: Color 0.3 0.2 TOTAL 13.5 7.3
It is important to note that EP imaging devices can approach the UEC and AEC values shown in Table 4-36 and 4-37 for inkjet devices if their power management is enabled and they can rapidly (e.g., on the order of ten seconds) transition between imaging and sleep mode. Solid ink deposition processes that directly deposit ink on the paper should realize similar energy savings106. An ink deposition process that transfers the ink from a print head, to a hot drum, and then to the paper, however, may have energy consumption characteristics more similar to EP devices because the drum requires heating to maintain quick response107.
4.6.4 Cost The cost of copy machines and printers consists of the first cost of the device and a per-image cost to operate the device. A detailed cost analysis of comparable laser and inkjet printers, as well as inkjet and conventional copy machines, lies beyond the scope of this project. Based on a comparison of current low-output models and the relative simplicity of the inkjet designs, it appears likely that inkjet systems would – if they could function effectively at higher speeds – have a lower first cost than similar EP-based systems. Faster inkjet printers may use additional print heads. Price data for a single-color print heads used with business inkjet printers ($30 per head108) suggest that additional heads will likely not result greatly increase the cost of faster inkjet-based devices. In higher-volume applications, inkjet printhead life could become an issue. A leading inkjet manufacturer has made progress in this area by separating the printhead from cartridges and designing the printheads for longer life in their business inkjet printers (Troelsen 2003).
106 In practice, the energy savings will be marginally less, because solid ink processes require heating of the ink to a temperature of100oC to
150oC, while liquid inkjet devices do not require ink heating. 107 The Xerox Phaser 8400 series printer specifications indicate that it can print both draft quality color and black and white images at up to
24ppm. It has a maximum power draw of 1,500W (while printing), draws 120W in idle mode (i.e., ready to print, referred to as the “active” mode for imaging devices in this report; see Appendix C), an 43W in sleep mode (Xerox 2004). These power draw values lie between those reported for electrophotographic copiers and monochrome laser printers) in the same ppm range (per ADL 2002).
108 See, for example, http://asp.issidata.com/viewpage.asp?category=86&colhed=PRINT%20HEADS&StoreID=WH .
4-68
Based on information for existing products109, a business inkjet printer with a listed printing speed of 14 to 20ppm has a price betwen $500 to $800, while a 18cpm monochrome laser printer has a price of around $300. These products are not, however, directly comparable. Limited test data suggest that these two inkjet printers print text documents at speeds ranging from 7 to 10ppm (Grevstad 2002, Grevstad 2003), while laser printers typically operate closer to their rated speeds (Consumer Reports 2004). Inkjet printers do, however, offer color performance and have comparable first costs with a low-speed color laser printers (Grant 2003). In the low-speed range, inkjet printers have higher per page ink prices than monochrome laser printer toner and comparable costs to color laser printer toner (Su 1999). Business inkjet printers achieve lower per-page price than personal inkjet printers by separating the printhead from the ink supply to allow re-supply of different ink supplies as they are consumed (Troelsen 2003). Although this increases the first cost of the printer, the overall price per page decreases at commercial printer volumes Ultimately, the ability of inkjet devices to become cost-competitive in the mainstream office printer and copier applications depends on if they can achieve similar per-page image costs. At higher annual image volumes, toner prices per page decrease dramatically, to on the order of $0.001 per page (Su 1999). Recent decreases in toner particle size (e.g., from 9µm to 5µm; Mahabadi 2004) holds promise for further reductions in toner cost. It is not clear that inkjet inks can achieve these cost levels, particularly UV inks that presently cost two to three times more than conventional inks (Cahill 2001, Klang and Balcerski 2002).
4.6.5 Perceived Barriers to Market Adoption of Technology Presently, commercial examples of mid-speed (about 40 ppm/cpm) inkjet copy machines or printers do not exist. Product specifications suggest that the fastest inkjet printers can approach the speed of low-end laser printers in draft quality mode, i.e., about 20ppm. Meaningful comparisons between inkjet and laser printer performance require, however, looking beyond specified printing speeds. Testing performed by an independent lab evaluated the ability of home printers to generate text documents110. They found that home laser printers approached their rated printing speeds, whereas inkjets printed at a much lower rate (see Table 4-38). Limited test data found that at least two of the inkjet devices with specified speeds of 14 to 20ppm print text documents at between 7 and 10ppm using a “standard” quality setting (Grevstad 2002, Grevstad 2003). This suggests that inkjet printers have to realize even larger speed gains to compete in mainstream office printing
109 Inkjet Printers: The HP Business Inkjet 3000 can print black and white at up to 21ppm (14ppm in “normal” mode) and costs $599
(information downloaded from: http://h10010.www1.hp.com/wwpc/us/en/sm/WF25a/18972-236251-236261-24728-236261-83387.html ; March, 2004); the Canon N1000 Office Color printer can operate at up to 20ppm color or 18 ppm color (from: http://www.usa.canon.com/cpr/pdf/Brochures/FinalN10002000.pdf); prices at cnet.com averaged about $500 (March, 2004). Laser Printers: HP LaserJet 1150, rated for 10,000 sheets/month, costs $299 (the HP LaserJet 2300L costs $549, produces 20ppm, and is rated for 30,000 sheets/month). The HP Color LaserJet 1500 costs $799, yields 16ppm black and white, and is rated for 30,000 pages/month. Information downloaded from: http://h10010.www1.hp.com/wwpc/us/en/sm/WF02a/18972-236251-236263.html , on 15 August, 2003.
110 Consumer Reports (2004) used printing time for a three-page text document to evaluate text printing speed.
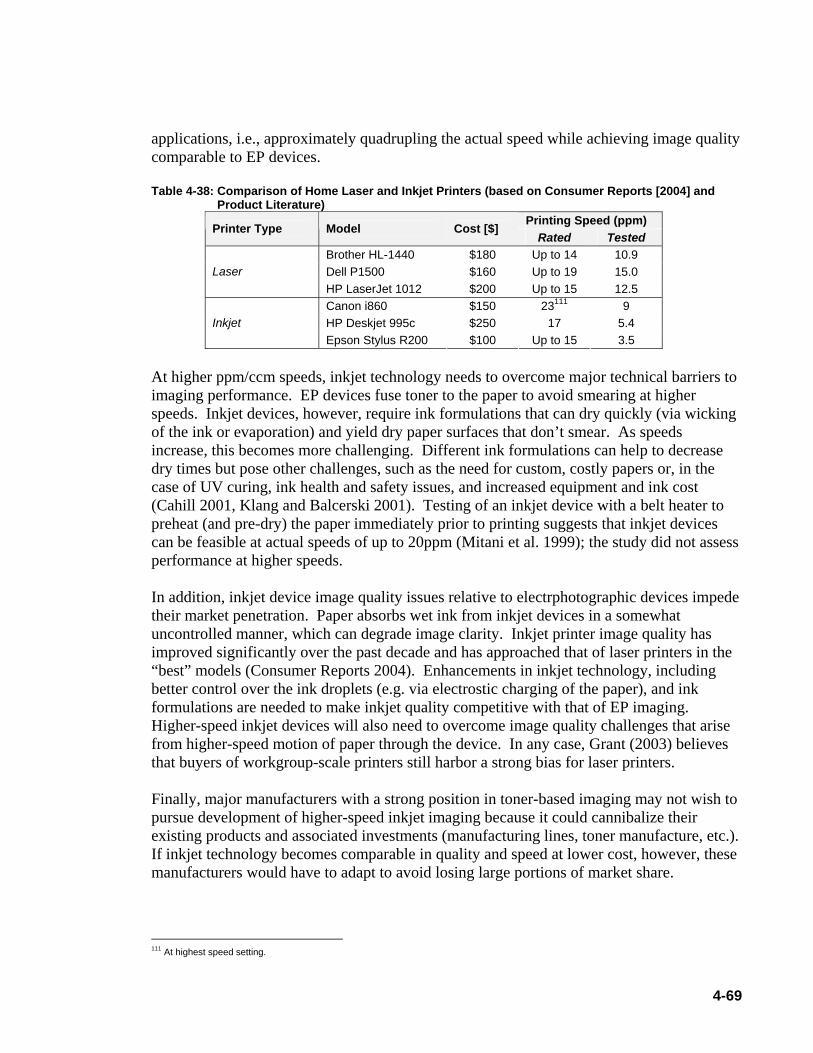
4-69
applications, i.e., approximately quadrupling the actual speed while achieving image quality comparable to EP devices. Table 4-38: Comparison of Home Laser and Inkjet Printers (based on Consumer Reports [2004] and
Product Literature) Printing Speed (ppm) Printer Type Model Cost [$]
Rated Tested Brother HL-1440 $180 Up to 14 10.9 Dell P1500 $160 Up to 19 15.0 Laser HP LaserJet 1012 $200 Up to 15 12.5 Canon i860 $150 23111 9 HP Deskjet 995c $250 17 5.4 Inkjet Epson Stylus R200 $100 Up to 15 3.5
At higher ppm/ccm speeds, inkjet technology needs to overcome major technical barriers to imaging performance. EP devices fuse toner to the paper to avoid smearing at higher speeds. Inkjet devices, however, require ink formulations that can dry quickly (via wicking of the ink or evaporation) and yield dry paper surfaces that don’t smear. As speeds increase, this becomes more challenging. Different ink formulations can help to decrease dry times but pose other challenges, such as the need for custom, costly papers or, in the case of UV curing, ink health and safety issues, and increased equipment and ink cost (Cahill 2001, Klang and Balcerski 2001). Testing of an inkjet device with a belt heater to preheat (and pre-dry) the paper immediately prior to printing suggests that inkjet devices can be feasible at actual speeds of up to 20ppm (Mitani et al. 1999); the study did not assess performance at higher speeds. In addition, inkjet device image quality issues relative to electrphotographic devices impede their market penetration. Paper absorbs wet ink from inkjet devices in a somewhat uncontrolled manner, which can degrade image clarity. Inkjet printer image quality has improved significantly over the past decade and has approached that of laser printers in the “best” models (Consumer Reports 2004). Enhancements in inkjet technology, including better control over the ink droplets (e.g. via electrostic charging of the paper), and ink formulations are needed to make inkjet quality competitive with that of EP imaging. Higher-speed inkjet devices will also need to overcome image quality challenges that arise from higher-speed motion of paper through the device. In any case, Grant (2003) believes that buyers of workgroup-scale printers still harbor a strong bias for laser printers. Finally, major manufacturers with a strong position in toner-based imaging may not wish to pursue development of higher-speed inkjet imaging because it could cannibalize their existing products and associated investments (manufacturing lines, toner manufacture, etc.). If inkjet technology becomes comparable in quality and speed at lower cost, however, these manufacturers would have to adapt to avoid losing large portions of market share.
111 At highest speed setting.

4-70
4.6.6 Technology Development “Next Steps” The quality and speed of inkjet imaging devices have consistently increased to the point where inkjet devices may begin to compete with the slowest commercial laser printers and copiers. Inkjet imaging devices need to realize major gains in printing speed while achieving high image quality and realizing per printed page costs on the order of $0.001 to compete effectively with EP copy machines and printers in core office applications. • Development of inkjet-based copy machines and printers with very high image quality
at the text document throughput rates required for mainstream office applications (about 40 or more ppm/cpm for text documents).
4.6.7 References ADL, 2002, “Energy Consumption by Office and Telecommunications Equipment in
Commercial Buildings – Volume I: Energy Consumption Baseline”. ,” Final Report to the U.S. Department of Energy, Office of Building Technology, State and Community Programs, January. Available at: http://www.eere.energy.gov/buildings/documents/pdfs/office_telecom-vol1_final.pdf .
Cahill, V.J., 2001, “A Short History and Current Developments of UV-Curing for Ink Jet Printing”, RadTech Report, July/August, pp. 20 -24. Available at: http://www.radtech.org/jul_aug01_p_20.pdf .
Canon, 2004, “Long-Line Bubble Jet Print Head,” Canon Technology, downloaded on 4 March from: http://www.canon.com/technology/detail/bj/long_bjhead .
Chatow, U., 2002, “The Fundamentals of HP Indigo’s Digital Offset Color Printing Process and How it Rivals Mechanical Offset Printing.”, Final Program and Proceedings, The Society for Imaging Science and Technology, NIP18: International Conference on Digital Printing Technologies, San Diego, CA, 29 September – 4October.
Consumer Reports, 2004, “Printers”, Consumer Reports, September. Elrod, S. A., C. Brown, S. Buhler, R.N. Ellson, J. Fitch, B. Hadimioglu, R. Kowalski, R.
Matusiak, J. Roy, D. Ruiz, B. Russo, R.A. Sprague, M. Weisberg, D. White, M. Young, and J. Zesch, 2001, “Acoustic Ink Printing with Solid Ink”, Final Program and Proceedings, The Society for Imaging Science and Technology, NIP17: International Conference on Digital Printing Technologies, Fort Lauderdale, FL, 30 September – 5 October.
Grant, P.J., 2003, “Color Printing is Now More Affordable for SMBs”, Gartner Dataquest Perspective, Number: HARD-WW-DP-051021, May. Available at: http://www.gartner.com/reprints/hp/114943.html#h6 .
Grevestad, E., 2002, “Canon N1000 Office Color Printer Review “, HardwareCentral, 5 September. Available at: http://www.hardwarecentral.com/hardwarecentral/reviews/4422/1/ .
Grevstad, E., 2003, “HP3000 Business Inkjet Review”, SmallBusinessComputing.com, 17 January. Available at: http://www.smallbusinesscomputing.com/testdrive/article.php/1571371 .

4-71
Klang, J.A. and J.S. Balcerski, 2002, “New Developments in the Commercialization of UV Curable Inkjet Inks”, SARTOMER Whitepaper, August. Available at: http://www.sartomer.com/wpapers/5057.pdf .
Le, H., 1999, “Progress and Trends in Ink-jet Printing Technology”, appearing in Recent Progress in Inkjet Technologies II, E. Hanson, editor, Society of Imaging Science & Technology: Springfield, VA. Available at: http://www.imaging.org/resources/leinkjet/part4.cfm .
Lovins, A.B. and H.R. Heede, 1990, “Electricity-Saving Office Equipment”, Technical Subreport from COMPITITEKSM, September.
Mahabadi, H., 2004, Personal Communication, Xerox Corporation, July. Mitani, M. K. Shimizu, and K. Kawasumi, 1999, “Rapid Drying and Low Feathering in a
Plain Paper Ink-jet Printer”, appearing in Recent Progress in Inkjet Technologies II, E. Hanson, editor, Society of Imaging Science & Technology: Springfield, VA.
Noguchi, H., 1999, “UV Curable, Aqueous Ink Jet Ink: Material Design and Performance for Digital Printing”, appearing in Recent Progress in Inkjet Technologies II, E. Hanson, editor, Society of Imaging Science & Technology: Springfield, VA.
PARC, 2001, Xerox PARC Project Page. Available at: wysiwyg://projectsbtm.7/http://www.parc.xeox.com/proj-1st.shtml, downloaded on 2 August, 2001.
Sprauge, R., B.B. Hadimioglu, C. Brown, S. Buhler, R.N. Ellson, S.A. Elrod, R. Kowalski, D. Mantell, R. Matusiak, J. Roy, D. Ruiz, B. Russo, M. Weisberg, D. White, M. Young, J. Zesch, 2001, “Acoustic Ink Printing: Photographic Quality Printing at High Speed.”, Final Program and Proceedings, The Society for Imaging Science and Technology, NIP17: International Conference on Digital Printing Technologies, Fort Lauderdale, FL, 30 September – 5 October.
Su, W., 1999, “U.S. Inkjet and Laser Printer Installed Base and Supplies Forecast, 1995-2003”, IDC Report #21262.
Troelsen, E.P., 2002, Personal Communication, Hewlett Packard, Corp., December. Troelsen, E.P., 2003, Personal Communication, Hewlett Packard, Corp., August. Xerox, 2004, Phaser 8400 Product Specifications, Xerox Corporation. Yip, K.L., A.R. Lubinsky, D.R. Perchak, and K.C. Ng, 2002, “Measurement and Modeling
of Drop Absorption Time for Various Ink-Receiver Systems”, Final Program and Proceedings, The Society for Imaging Science and Technology, NIP18: International Conference on Digital Printing Technologies, San Diego, CA, 29 September – 4October.
4.7 Microprocessor Line Width Reduction
4.7.1 Summary Microprocessor line widths have consistently decreased for more than thirty years. Reductions in line width lead to lower voltage operation and reduced capacitance, both of which can, in theory, reduce power draw for given operating conditions. This analysis examines the potential reductions in microprocessor active mode power draw due to reduced line-width in microprocessor design. The primary drivers for this development are
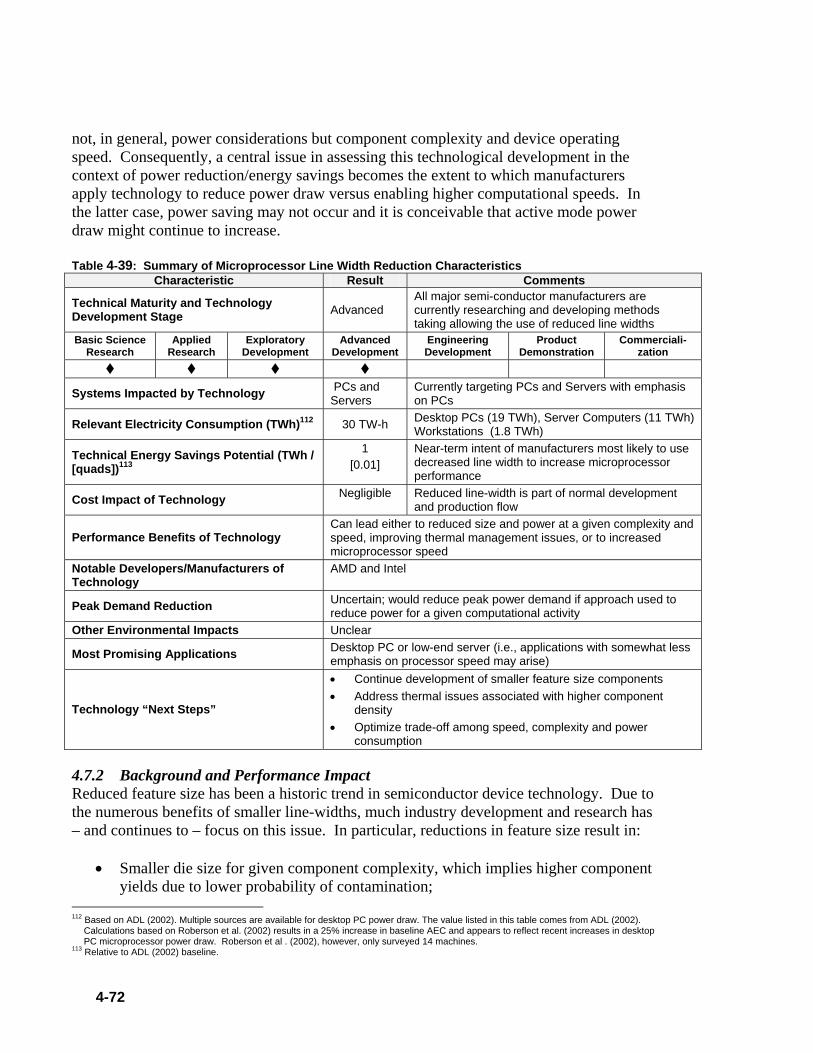
4-72
not, in general, power considerations but component complexity and device operating speed. Consequently, a central issue in assessing this technological development in the context of power reduction/energy savings becomes the extent to which manufacturers apply technology to reduce power draw versus enabling higher computational speeds. In the latter case, power saving may not occur and it is conceivable that active mode power draw might continue to increase. Table 4-39: Summary of Microprocessor Line Width Reduction Characteristics
Characteristic Result Comments
Technical Maturity and Technology Development Stage Advanced
All major semi-conductor manufacturers are currently researching and developing methods taking allowing the use of reduced line widths
Basic Science Research
Applied Research
Exploratory Development
Advanced Development
Engineering Development
Product Demonstration
Commerciali-zation
Systems Impacted by Technology PCs and Servers
Currently targeting PCs and Servers with emphasis on PCs
Relevant Electricity Consumption (TWh)112 30 TW-h Desktop PCs (19 TWh), Server Computers (11 TWh) Workstations (1.8 TWh)
Technical Energy Savings Potential (TWh / [quads])113
1 [0.01]
Near-term intent of manufacturers most likely to use decreased line width to increase microprocessor performance
Cost Impact of Technology Negligible Reduced line-width is part of normal development and production flow
Performance Benefits of Technology Can lead either to reduced size and power at a given complexity and speed, improving thermal management issues, or to increased microprocessor speed
Notable Developers/Manufacturers of Technology
AMD and Intel
Peak Demand Reduction Uncertain; would reduce peak power demand if approach used to reduce power for a given computational activity
Other Environmental Impacts Unclear
Most Promising Applications Desktop PC or low-end server (i.e., applications with somewhat less emphasis on processor speed may arise)
Technology “Next Steps”
• Continue development of smaller feature size components • Address thermal issues associated with higher component
density • Optimize trade-off among speed, complexity and power
consumption
4.7.2 Background and Performance Impact Reduced feature size has been a historic trend in semiconductor device technology. Due to the numerous benefits of smaller line-widths, much industry development and research has – and continues to – focus on this issue. In particular, reductions in feature size result in:
• Smaller die size for given component complexity, which implies higher component yields due to lower probability of contamination;
112 Based on ADL (2002). Multiple sources are available for desktop PC power draw. The value listed in this table comes from ADL (2002).
Calculations based on Roberson et al. (2002) results in a 25% increase in baseline AEC and appears to reflect recent increases in desktop PC microprocessor power draw. Roberson et al . (2002), however, only surveyed 14 machines.
113 Relative to ADL (2002) baseline.
4-73
• Higher speed operation due to reduced logic circuit capacitance; • Lower voltage operation, and • Higher power density.
Of these characteristics, the lower voltage operation leads directly to the potential for reduced power. Specifically, transient power in CMOS devices scales with both voltage and signal frequency:
,2leakCCT PVfCP +=
where C denotes the equivalent power dissipation capacitance, f the operating frequency, VCC the dc power supply voltage, and Pleak the leakage current. While the determination of the precise power draw by this relationship is difficult for a complex component such as a microprocessor, it illustrates the general principle that reductions in either voltage or frequency can achieve significant reductions in the power draw of complementary metal oxide semiconductor (CMOS) components. Since reduced feature size permits lower voltage operation, it is clear that significant power reductions can result since reduction of voltage has a quadratic effect on CMOS power consumption, all else being equal. In reality, however, the clear market-driven trend in the semiconductor industry is to operate at higher clock speed (frequency) which tends to increase power draw. Leakage current114 tends to increase dramatically as line widths decrease. Although leakage current represented a negligible portion of microprocessor power draw for most of the history of microprocessors, it recently has become a major concern of microprocessor manufacturers. Circa 2003, the prevalent feature size in high-performance components equaled 0.13µm. Discussions with AMD indicated that their plans include progressive reductions in the feature size. For example, they plan to reach 90nm in 2004 and expect that, within about four years (circa 2007), 60nm processes will be realized (Rowe 2003). Intel indicated that they could produce 70nm features in 2003 and expect feature size to decrease by approximately 30% every two years for at least the next decade. Intel considers feature sizes of less than 12nm to be speculative at this time (Borkar 2003). The ability to perform the necessary lithography at small dimensions currently paces the rate of decrease in feature size (Rowe 2003). According to AMD, die sizes currently range from about 60 to 200 mm2 with 100 mm2
representing the optimal tradeoff between manufacturing yield and microprocessor complexity (which relates to performance). Due to legacy fabrication processes (and presumably the high cost of new fabrication facilities), the overall die size is not, in general, declining with the feature size. Instead, manufacturers have taken advantage of reduced feature size to fabricate more dies on a wafer. AMD indicated that the lowest microprocessor power draw that they and Intel have achieved is about 1-2W, for mobile applications, i.e., laptop PCs. Microprocessor power draw has not continued to decrease at
114 Leakage current occurs due to the finite resistance of a transistor in its off state between its high and low voltage sides.
4-74
a meaningful rate, primarily because further reductions in power draw would have limited benefit, i.e., the microprocessor currently accounts for a small portion (e.g., Fisher [2002] estimates about 7%) of overall laptop PC power draw. Line width reduction may be relevant to other high-performance PC or server components, namely graphics cards, but most other components use substantially larger line widths for cost reduction purposes. Currently, microprocessor speed strongly influences purchasing decisions in the PC and server markets, particularly relative to system power draw (Rowe 2003; Brady et al. 2003). Nonetheless, Intel perceives that power will become a significant issue over the next 5 to 10 years. Power density is a concern since, as more and more capability is provided in smaller die sizes, effective power dissipation becomes increasingly problematic. AMD indicated that they did not expect any significant change in die size or processor power draw over the next five years (Rowe 2003).
4.7.3 Energy Savings Potential Discussions with the two dominant developers and producers of microprocessors, Intel and AMD, clearly indicate that the long-term trend toward smaller and smaller feature sizes will continue for several years. It is also apparent, based on the basic physics of CMOS devices, that smaller feature sizes provide the potential for lower device power draw at a given complexity and clock rate. The essential question regarding energy savings becomes whether decreases in feature sizes will lead to lower power components or to increasingly complex components with higher processing capability. The interviews strongly suggest that, in the near to intermediate term, the latter is most likely, i.e., representatives of both major microprocessor suppliers indicated a perception that the market demands increased performance more than reduced power (Brady et al. 2003; Rowe 2003). Microprocessor power draw is unlikely to decline substantially over the next several years for the following reasons (Rowe 2003):
• Supply voltage will likely decline more slowly in the near future (in part because lower voltages increase the potential for incorrect logic switching from dc-dc converter noise; the quadratic dependence of power on voltage will limit the rate of potential power reduction);
• As transistor size declines, “second order” effects such as leakage currents become increasingly significant and decrease the rate of decrease in power draw, and
• A tendency to increase the computational capability of processors will likely offset decreased power consumption at the device level.
TIAX agrees with this assessment but believes that it largely reflects market perceptions of priorities. Most common business applications (e.g. word processing) are not particularly demanding on microprocessor speed and are constrained, in their performance, by other characteristics such as graphics capability, memory, and bus speed. Typical business operations115 only use a small fraction (about 8%, per Brady et al. 2003) on current
115 Future developments, such as widespread access of broadband infrastructure (Rowe 2003) or new applications that place greater demands
on the microprocessor (real-time video conferencing [Lanier 2001], much greater use of “grid” computing, etc.), could alter this.
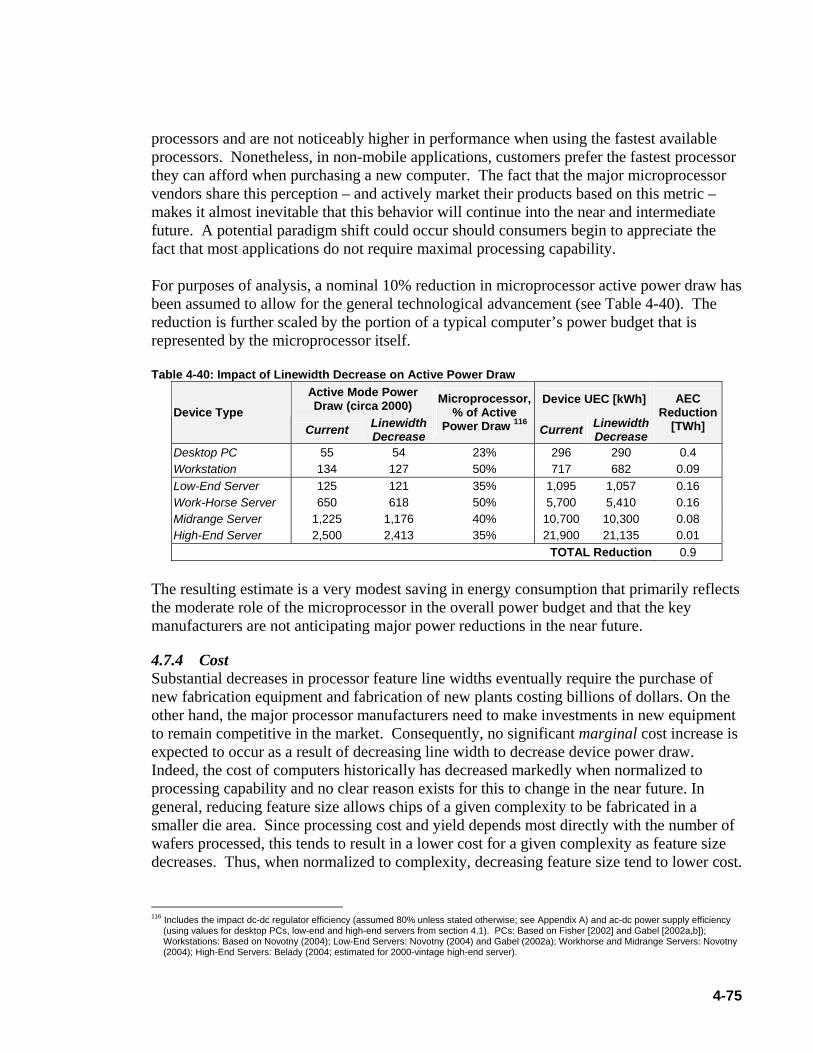
4-75
processors and are not noticeably higher in performance when using the fastest available processors. Nonetheless, in non-mobile applications, customers prefer the fastest processor they can afford when purchasing a new computer. The fact that the major microprocessor vendors share this perception – and actively market their products based on this metric – makes it almost inevitable that this behavior will continue into the near and intermediate future. A potential paradigm shift could occur should consumers begin to appreciate the fact that most applications do not require maximal processing capability. For purposes of analysis, a nominal 10% reduction in microprocessor active power draw has been assumed to allow for the general technological advancement (see Table 4-40). The reduction is further scaled by the portion of a typical computer’s power budget that is represented by the microprocessor itself. Table 4-40: Impact of Linewidth Decrease on Active Power Draw
Active Mode Power Draw (circa 2000) Device UEC [kWh]
Device Type Current Linewidth
Decrease
Microprocessor, % of Active
Power Draw 116 Current Linewidth Decrease
AEC Reduction
[TWh]
Desktop PC 55 54 23% 296 290 0.4 Workstation 134 127 50% 717 682 0.09 Low-End Server 125 121 35% 1,095 1,057 0.16 Work-Horse Server 650 618 50% 5,700 5,410 0.16 Midrange Server 1,225 1,176 40% 10,700 10,300 0.08 High-End Server 2,500 2,413 35% 21,900 21,135 0.01
TOTAL Reduction 0.9 The resulting estimate is a very modest saving in energy consumption that primarily reflects the moderate role of the microprocessor in the overall power budget and that the key manufacturers are not anticipating major power reductions in the near future.
4.7.4 Cost Substantial decreases in processor feature line widths eventually require the purchase of new fabrication equipment and fabrication of new plants costing billions of dollars. On the other hand, the major processor manufacturers need to make investments in new equipment to remain competitive in the market. Consequently, no significant marginal cost increase is expected to occur as a result of decreasing line width to decrease device power draw. Indeed, the cost of computers historically has decreased markedly when normalized to processing capability and no clear reason exists for this to change in the near future. In general, reducing feature size allows chips of a given complexity to be fabricated in a smaller die area. Since processing cost and yield depends most directly with the number of wafers processed, this tends to result in a lower cost for a given complexity as feature size decreases. Thus, when normalized to complexity, decreasing feature size tend to lower cost.
116 Includes the impact dc-dc regulator efficiency (assumed 80% unless stated otherwise; see Appendix A) and ac-dc power supply efficiency
(using values for desktop PCs, low-end and high-end servers from section 4.1). PCs: Based on Fisher [2002] and Gabel [2002a,b]); Workstations: Based on Novotny (2004); Low-End Servers: Novotny (2004) and Gabel (2002a); Workhorse and Midrange Servers: Novotny (2004); High-End Servers: Belady (2004; estimated for 2000-vintage high-end server).

4-76
4.7.5 Perceived Barriers to Market Adoption of Technology Clearly, the dominant influence of microprocessor performance on consumer purchasing decisions rather than energy savings strongly works against the development of microprocessors that offer reduced power at the expense of reduced processing capability. The case of laptop PCs, where power draw directly impacts battery life, stands out as a notable exception. Moreover, the microprocessor itself has already become a modest component of overall computer power draw in most office applications, which tends to limit the value of future power reductions. Implementation of smaller line widths also poses technical challenges. For example, smaller line widths tend to increase the significance of electromigration, the diffusion of metal atoms from the circuit into the surrounding materials. Over time, this can degrade circuit performance, reliability, and lifetime. Smaller line widths also tend to increase the significance of leakage current for each transistor, which increases power draw and decreases transistor performance. Microprocessor manufacturers are pursuing several lines of research to reduce leakage current as line widths decrease, including the use of high-k dielectric materials (see Appendix A).
4.7.6 Technology Development “Next Steps” Several development can increase the potential of decreased line widths to reduce power draw, including to: • Enhance consumer awareness that current microprocessors have more than sufficient
capability to meet the needs of most office applications. Consequently, microprocessors with moderate gains in performance can save energy without compromising performance;
• Continue the prevailing trend to reduce the feature size of components, including the development of advanced lithographic techniques and new semi-conductor technologies;
• Develop techniques to address the critical issues associated with small feature sizes (e.g. increased leakage current; device fabrication inconsistency);
• Address thermal issues associated with higher component density; • Develop new materials facilitating new fabrication technologies with smaller feature
sizes that have decreased leakage current (e.g. Silicon-on-Insulator transistors; see Appendix A).
4.7.7 References ADL 2002, “Energy Consumption by Office and Telecommunications Equipment in
Commercial Buildings Volume 1: Energy Consumption Baseline.”, Final report prepared for the U.S. Department of Energy, Office of Building Technology, January.
AMD, 2002, “AMD PowerNow!™ Technology”, Mobile Marketing Presentation, September.
Belady, C., 2004, Personal Communication, Hewlett Packard Corporation, August. Borkar, S., 2003, Personal Communication, Intel Corporation, February.
4-77
Bohr, M., 2002, “Intel’s 90 nm Technology: Moore’s Law and More”, Intel Developer Forum.
Brady, T., D. Bodas, D. Gabel, 2003, Presentation / Personal Communication, Intel Corporation, February.
Chou, S. and M. Bohr, 2000, Intel Technology Briefing, Dated November 7. Lanier, J., 2001, “Virtually There: Three-Dimensional Tele-Immersion May Eventually
Bring the World to Your Desk”, Scientific American, April. Available at: http://www.sciam.com/2001/0401issue/0401lanier.html .
Novotny, S., Personal Communication, Sun Microsystems, July. Roberson, J. A., R.E. Brown, B. Nordman, C.A. Webber., G.K. Homan, A. Mahajan, M.
McWhinne, J.G. Koomey, 2002, “Power Levels in Office Equipment: Measurements of New Monitors and Personal Computers”, Proc. ACEE Summer Study on Energy Efficiency in Buildings, Pacific Grove, CA, 22-26 August.
Rowe, J., 2003, Personal Communication, AMD, January. 4.8 Network Software to Enact Power Management (PM) Settings
4.8.1 Summary Despite the wide availability of power management (PM) systems for office equipment, a large portion of commercial office equipment does not have power management (PM) enabled. Notably, only a small fraction of desktop PCs have PM enabled. Recently, products have come to market that enable the network administrator to enable and manage PM settings for PCs and monitors over the network. In principle, the convenience and central control afforded by these options could increase the PM-enabled rate of network-connected devices to nearly 100%. To achieve a high rate of adoption, network PM software must require minimal overhead for implementation and maintenance and not adversely affect network or device performance when networks and devices require peak performance. Field studies to date suggest that larger organizations (500 or more seats) benefit most from a centralized approach because the greater energy cost savings accelerates recovery of the up-front costs to evaluate and install the software.

4-78
Table 4-41: Summary of Network Software to Enact Power Management Settings Characteristics Characteristic Result Comments
Technical Maturity and Technology Development Stage
Current / New
Existing products for PCs, monitors; none for most printers and copiers
Basic Science Research
Applied Research
Exploratory Development
Advanced Development
Engineering Development
Product Demonstration
Commerciali-zation
Systems Impacted by Technology All networked office equipment Relevant Electricity Consumption (TWh)117
53 Desktop PCs and Workstations – 37%; Monitors – 37%; Copiers – 17%; Printers – 9% Assumes that all devices are network connected
Technical Energy Savings Potential (TWh / [quads])118
18 – 29 [0.20 – 0.32]
Desktop PCs and Workstations – 39%; Monitors – 34%; Copiers – 19%; Printers – 8%; a limited number of copiers are networked
Cost Impact of Technology $0 to 20 per PC+monitor
• Software cost only, i.e., does not include installation. Remote installation has a negligible installed cost; machine-by-machine installation increases cost by roughly $10/seat.
• EnergyStar® provides their products for free • Corporate custom solutions exist but their cost
is not known Performance Benefits of Technology Turning PCs off at night increases their security Notable Developers/Manufacturers of Technology
Verdiem (formerly EZConserve); 1E; DOE/EPA Energy Star®; Alteris, AutoProf
Peak Demand Reduction Small Most PCs in use during peak demand periods Other Environmental Impacts None Most Promising Applications PCs (which currently have a PM-enabled rate of 6% to 25%)
Technology “Next Steps”
• Integrate PM management options directly into standard network management software
• Educate users about the improved reliability and stability of more recent PM implementations in newer versions of major operating systems (e.g., more recent versions of WindowsTM)
• Further verification of system performance, particularly regarding potential problems
• Apply technology to copiers and printers, encouraging software capability development to enable PM setting control
• Encourage major operating system developers to develop a standard network card driver specification for Wake-on-LAN (WOL) functionality to facilitate centralized network-based enabling of WOL
4.8.2 Background and Performance Impact A modest fraction of most types of major office equipment realizes the full energy savings potential of automatic power management (PM) technology. Overall, only between 6% and
117 Multiple sources are available for desktop computer and monitor power draw. The AEC values listed in this table are from ADL (2002). AEC
calculations based on more recent PC power draw data (Roberson et al. 2002) result in a 25% increase in baseline energy consumption. Roberson et al. (2002), however, only surveyed 14 machines, and likely has high uncertainty. The monitor baseline AEC value comes from ADL (2002). Applying Roberson et al. (2002) or Groot and Siderius (2000) data decreases monitor AEC by about 37% and 11%, respectively (based on a comparison of power draw values for a 17-inch CRT).
118 The percentage of desktop PC and monitor energy saved does not vary appreciably when considering power draw values from different studies (i.e., ADL (2002), Roberson et al. (2002), and Groot and Siderius (2000)). This table reflects powering down desktop PCs to the “sleep” mode during nights and weekends. Powering the desktops PCs to the “off” mode during these periods would yield an additional 8TWh of energy savings, for a total of energy savings of 31TWh.
4-79
25% of PCs119 and about 60 to 70% of monitors are PM-enabled. Moreover, on average, more than half of all PCs and monitors are left on (in active or sleep mode) during nights and weekends (Roberson et al. 2004; Nordman et al. 2000). Although a rigorous breakdown of the reasons for low PM-enabled rates does not exist, Korn et al. (2004) reports several reasons based on discussions of PC PM with numerous organizations.
• Prior Problems with PM Reliability: Earlier PC PM did not function well with operating systems, leading to system crashes and increasing technical support calls. These past experiences make system administrators wary of enabling PM.
• Network Issues: PC PM was not originally designed for operation in the current centrally-managed environment. Many organizations distribute software patches and updates to PCs when their users are not using the machine, i.e., at night, which requires leaving the machines on at night (Korn et al. 2004). Enabling PC PM inhibits this practice because most networked PCs cannot be awakened by the network once they enter sleep mode, i.e., they require local (at the PC) awakening (Korn 2004; Nordman 2004). Wake-on-LAN (WOL)120 enables the network to awaken a networked PC from sleep mode and, thus, represents a potential fix Most PCs do not, however, have WOL enabled by default due to both perceived and real security concerns (Bolioli 2004). In that case, WOL activation currently cannot be implemented through the network and, instead, requires time-consuming manual implementation on each PC. This impedes WOL use (Korn et al. 2004), as does the need to properly configure networks to use WOL (Bolioli 2004). Alternately, Christensen et al. (2004) notes that network interfaces (NI) with greater computing capability could provide intelligent NI management121, but current NIs lack the required capability.
• Difficulties of Centrally Managing PM: The PM settings for a given PC depend on those established for the current user. If a PC remains on with no user logged on, it typically does not enable PM. Consequently, PCs left on at night (e.g., for software deployment) but with no user logged on have low PM-enabled rates.
• Software Incompatibility: In some cases, software does not conform to new PC PM standards, which prevents enablement or effective use of PM. Older versions appear more prone to causing problems with PM.
• Lack of Awareness of PM: Many PC users have little or no knowledge that PM exists, in large part because neither PC manufacturers, system administrators, and PC retailers have actively promoted PC PM. Consequently, they do not enable PM.
• Myths About PM: Several persistent myths inhibit PM enabling, including: increased cycling from PM damages PC power supplies and reduced monitor life, awakening a
119 Based on working with numerous private and public organizations, Korn et al. (2004) estimate that less than 5% of PCs have PM enabled. 120 Wake-on LAN allows the LAN card to interact with a network even when the PC enters low-power modes. If the LAN card receives a
specified data sequence from the network, it wakes up the operating system. A description of the AMD “Magic Packets” Wake-on LAN can be found at http://www.amd.com/us-en/ConnectivitySolutions/TechnicalResources/0,,50_2334_2481,00.html .
121 When the PC enters sleep mode, the intelligent NI would assume responsibility for managing network traffic. For example, the NI would decrease its data rate, which would enable it to interpret the incoming data packets and determine how to respond to different types of network traffic based on pre-programmed logic. Thus, the NI maintain s network connectivity while the PC remains in sleep mode; the PC only awakens when the NI receives a request that it cannot handle, i.e., requires input from the PC (Nordman 2004).

4-80
PC from sleep causes power surges that increase device energy consumption, screen savers save energy.
A candidate method to increase PM-enabled rates is to educate users with the goal of changing their behavior. The results are, however, generally unpredictable and often modest since it is difficult to educate people sufficiently about new procedures and provide adequate motivation or enforcement to be truly effective. Alternately, companies could request that PC manufacturers, system integrators, or in-house IT departments deliver PCs with their PM enabled (Korn et al. 2004). This would increase PM-enabled rates, as most users do not typically active PM themselves (Korn et al. 2004), but does not adequately addresses the network or software compatibility issues noted earlier. The implementation of network software to automatically establish PM settings has the potential to increase the PM-enabled rates of networked devices, including PCs, monitors, copiers, and printers. Some larger corporations customize existing network software to control PC and monitor PM settings (Korn 2004). Furthermore, at least two commercially-available software packages are specially designed to enable centralized control of PM settings for network-connected PCs and monitors (1E 2004; Linger 2002a), as does software provided for free by DOE/EPA EnergyStar®122. Both of the commercially-available programs provides for distinct daytime and nighttime settings. This allows the IT administrator to configure PM settings using a WindowsTM-based environment that allows the IT administrator to assign time intervals before entering for “monitor off”, “hard disk off”, “system standby”, and “system hibernate” as a function of time of day. The IT administrator can also assign PM settings for individual or groups of devices. For example, the administrator can specify that daytime PM settings apply between 8:00am and 6:00pm and that, during that period, the PC and monitor will enter “sleep” mode after 15 minutes of inactivity. Once configured, only the IT administrator can alter the settings. In addition, the software may be configured to shut down a PC or monitor (Linger 2002a; Linger 2002b; Wilcock 2002). By judicious selection of the times when the PC enters the “sleep” or “off” mode, the software can reduce the inconvenience of network disconnection. Both products also have features to prevent system shutdown from occurring during active use. If a PC is in use when its shut-down time arrives, the software enables the user to refuse or delay PC shut-down (Verdiem 2004; Wilcox 2002). In addition, at least one program has a passive mode that prevents the system from shutting down if the user does not respond to a shutdown request (Wilcock 2002). The DOE/EPA EnergyStar® software allows a system administrator to establish power management settings for groups of machines. At least one commercially available software product used for managing network software deployment incorporates similar functionality (Korn 2004; Bolioli 2004). In this case, the administrator would create multiple groups of PCs in the network directory software (e.g., Active Directory-AD, Network Directory Services-NDS); all PCs in a given group would have the same PM settings. In this case, the
122 See http://www.energystar.gov/index.cfm?c=power_mgt.pr_pm_ez_gpo .

4-81
administrator would create multiple groups of PCs in the network directory software. In contrast to the commercial software products, however, this software tool does not incorporate the capability of varying the PM settings as a function of time of day (Bolioli 2004). Network administrators can install all three software options discussed via remote installation methods. This obviates the need for time-consuming machine-by-machine software installation. Clearly, any PM management software package should not interfere with normal operation. After installing the software, the system administrator can modify the PM settings of networked devices via subsequent updates pushed over the network. At present, the available software packages apply only to PCs and monitors. Conceivably, similar control schemes could be developed for networked printers and copy machines. Some printers manufactured by at least one company incorporate a power management feature that evaluates usage patterns and uses this information to intelligently determine when to enter low-power modes (Mahabadi 2004). On a national basis, the energy saving potential of printers and copy machines is significant but less than that of and monitors. Currently, a small portion of copy machines are networked, which limits the energy savings potential of this approach. It appears likely that networking of copy machines will increase in the future; this would increase the energy-saving potential of network-based PM.
4.8.3 Energy Savings Potential This study evaluated the energy savings potential of two different strategies for network-connected devices, specifically:
Auto Sleep: Monitors and PCs enter a hibernate123 state instead of “off” during weekend and nighttime periods; and Auto Off: All devices enter the “off” state during weekend and nighttime periods.
Tables 4-42 and 4-43 compare the usage patterns and UEC values, respectively, for the relevant equipment types under each power management schemes relative to the “baseline” case (i.e., ADL 2002).
123 Hibernate is the power mode with the lowest power draw without turning the device off, i.e., with “all power off and the image of your desktop saved to disk” (see: http://www.microsoft.com/windows2000/techenthusiast/features/standby1127.asp ).

4-82
Table 4-42: Effect of Network Software to Enable PM on Equipment Usage Patterns, by Strategy Usage by Mode [hours/week124] Equipment Type
On Sleep Off Desktop PC
Baseline 98 7 62 Auto-Off 34 5 130
Auto-Sleep 34 72 62 Monitors
Baseline 63 57 63 Auto-Off 27 12 130
Auto-Sleep 27 93 48 Copiers
Baseline 86 41 41 Auto-Off 55 0 113
Auto-Sleep 55 72 41 Printers
Baseline 76 60 32 Auto-Off 36 15 118
Auto-Sleep 36 100 32 Table 4-43: Impact of Different PM Strategies on Device Unit Energy Consumption
Equipment Type Baseline [kWh/year]
Auto Off [kWh/year]
Auto Sleep [kWh/year]
Computer Desktop 296 113 195
Workstation 717 263 468
Monitor Baseline [kWh/year]
Auto Off [kWh/year]
Auto Sleep [kWh/year]
CRT, screen size 15-inch 199 89 94 17-inch 208 93 98
LCD, screen size 15-inch 43 19 24 17-inch 126 64 64
Copier Baseline [kWh/year]
Auto Off [kWh/year]
Auto Sleep [kWh/year]
Band 1 (1-20 cpm) 776 369 776 Band 2 (21-30 cpm) 1,037 582 929 Band 3 (31-44 cpm) 1,025 641 842 Band 4 (45-69 cpm) 1,515 1,025 1,241 Band 5 (70-90 cpm) 1,973 1,261 1,552
Band 6 (91+ cpm) 3,758 2,361 3,109
Printer Baseline [kWh/year]
Auto Off [kWh/year]
Auto Sleep [kWh/year]
Laser: Small Desktop (<12 ppm) 347 170 210 Laser: Desktop (13-29 ppm) 593 305 455
Laser: Small Office (30-69 ppm) 1,422 926 1,232 Laser: Large Office (70+ ppm) 41,666 40,800 41,350
Laser: Color 532 316 432
124 Note: Hours may not sum to 168 due to rounding.
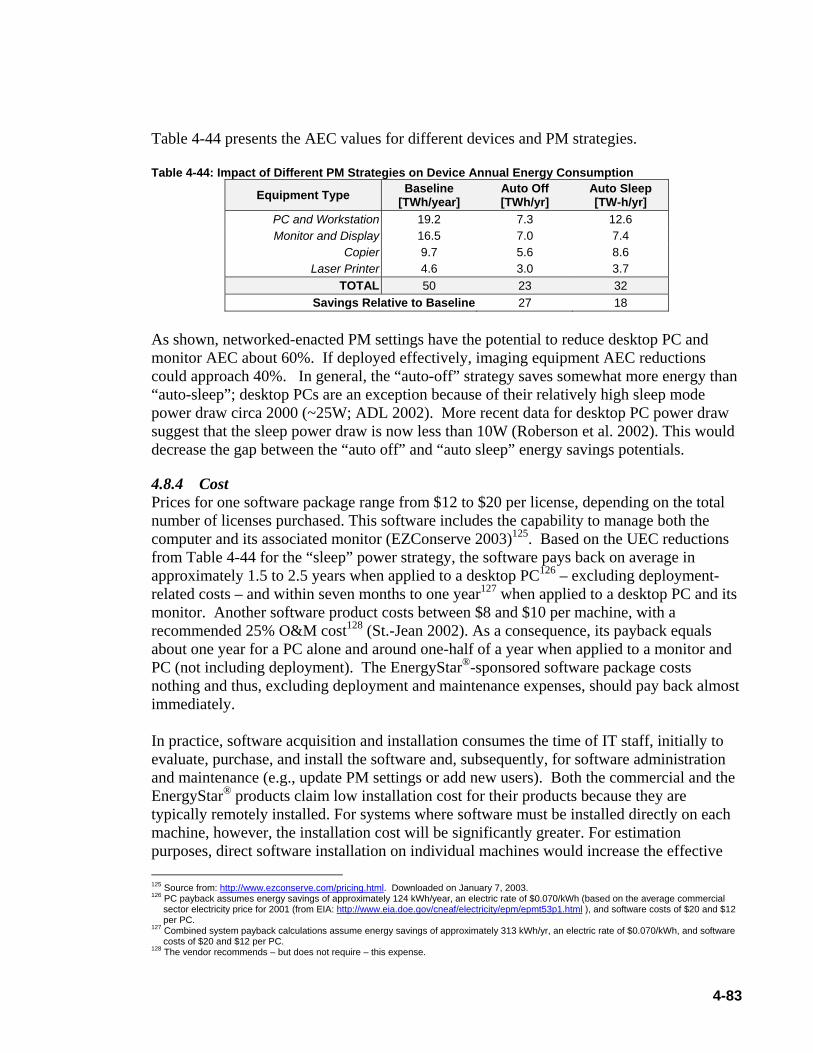
4-83
Table 4-44 presents the AEC values for different devices and PM strategies. Table 4-44: Impact of Different PM Strategies on Device Annual Energy Consumption
Equipment Type Baseline [TWh/year]
Auto Off [TWh/yr]
Auto Sleep [TW-h/yr]
PC and Workstation 19.2 7.3 12.6 Monitor and Display 16.5 7.0 7.4
Copier 9.7 5.6 8.6 Laser Printer 4.6 3.0 3.7
TOTAL 50 23 32 Savings Relative to Baseline 27 18
As shown, networked-enacted PM settings have the potential to reduce desktop PC and monitor AEC about 60%. If deployed effectively, imaging equipment AEC reductions could approach 40%. In general, the “auto-off” strategy saves somewhat more energy than “auto-sleep”; desktop PCs are an exception because of their relatively high sleep mode power draw circa 2000 (~25W; ADL 2002). More recent data for desktop PC power draw suggest that the sleep power draw is now less than 10W (Roberson et al. 2002). This would decrease the gap between the “auto off” and “auto sleep” energy savings potentials.
4.8.4 Cost Prices for one software package range from $12 to $20 per license, depending on the total number of licenses purchased. This software includes the capability to manage both the computer and its associated monitor (EZConserve 2003)125. Based on the UEC reductions from Table 4-44 for the “sleep” power strategy, the software pays back on average in approximately 1.5 to 2.5 years when applied to a desktop PC126 – excluding deployment-related costs – and within seven months to one year127 when applied to a desktop PC and its monitor. Another software product costs between $8 and $10 per machine, with a recommended 25% O&M cost128 (St.-Jean 2002). As a consequence, its payback equals about one year for a PC alone and around one-half of a year when applied to a monitor and PC (not including deployment). The EnergyStar®-sponsored software package costs nothing and thus, excluding deployment and maintenance expenses, should pay back almost immediately. In practice, software acquisition and installation consumes the time of IT staff, initially to evaluate, purchase, and install the software and, subsequently, for software administration and maintenance (e.g., update PM settings or add new users). Both the commercial and the EnergyStar® products claim low installation cost for their products because they are typically remotely installed. For systems where software must be installed directly on each machine, however, the installation cost will be significantly greater. For estimation purposes, direct software installation on individual machines would increase the effective 125 Source from: http://www.ezconserve.com/pricing.html. Downloaded on January 7, 2003. 126 PC payback assumes energy savings of approximately 124 kWh/year, an electric rate of $0.070/kWh (based on the average commercial
sector electricity price for 2001 (from EIA: http://www.eia.doe.gov/cneaf/electricity/epm/epmt53p1.html ), and software costs of $20 and $12 per PC.
127 Combined system payback calculations assume energy savings of approximately 313 kWh/yr, an electric rate of $0.070/kWh, and software costs of $20 and $12 per PC.
128 The vendor recommends – but does not require – this expense.
4-84
cost of the software by roughly $9 per machine129. This would increase the payback period of the commercial software products by 50% to 100%. Training of IT staff and ongoing maintenance of the software is another, more difficult to estimate, component of life-cycle cost. Given that, to date, primarily larger organizations (in excess of 1,000 employees) have adopted network PM software (Linger 2002a), it appears that the cost of evaluating, learning, installing, and maintaining the software is substantial. The cost of implementing custom corporate network software to manage PM settings across an organization is not clear; presumably, however, companies would not go this route unless it provided an attractive payback. Based on energy savings alone, the estimated average payback period for printers and copiers equals 0.3 to 0.8 years and 0.3 to 0.7 years, respectively. The per-unit installation and maintenance costs of these specialized software products, however, would likely be quite high and result in substantially longer real simple payback periods.
4.8.5 Perceived Barriers to Market Adoption of Technology Fundamentally, the software must operate in an unobtrusive way that does not impede employees’ ability to work (employee salaries’ far exceed the electric energy savings attributed to the software130) or present a burden to IT support staff. IT professionals expressed concerns that the software could slow or freeze systems, interrupt calculations, and increase “boot up” times. For example, TIAX IT staff expressed limited interest in network PM software. They had concerns about the potential for network disruption, in particular, due to the end-user interaction. Frequently, staff are not familiar with PM settings and operations and perceive that “a blank screen is a bad thing to them”. Consequently, TIAX IT staff feared that network PM would increase the number of help desk calls. These echo the “prior problems with PM reliability” and "lack of awareness of PM” concerns about power management discussed earlier (see Section 4.8.2). Furthermore, the cost savings are, when placed in a corporate context, viewed as minimal and not worth the potential up-front hassles. Finally, in most organizations, IT staff are not tasked directly with managing operating expenses. This reduces their incentive to take on an additional responsibility that, from their perspective, can only cause additional problems. One of the companies selling network PM software identified the latter barrier as a significant issue (St. Jean 2002). To promote software sales, they first offer a software package to assist with software distribution and network performance. Their PM software is then positioned as a simple add-in tool to the initial software. Discussions with IT managers who have implemented commercial network PM software suggest that the software has incurred no significant performance penalties to date. For example, the Energy Manager for the City of San Jose supervised a pilot project consisting of 50 users who had one of the commercial products installed on their machines. He indicated that installation time was minimal, that they did not experience any performance
129 Based on 15 minutes of installation time, salary of $60,000/year, and a 1.25 markup for added company cost. 130 For example, assuming an average staff salary of $75,000/year, the potential interruption of worker productivity for two hours or more would
cancel any savings gained over the lifetime of the equipment.

4-85
interruptions, and that the software paid back in 7 to 8 months (Lin 2003). Similarly, another company reported that no complications, problems, or end-user complaints resulted from the installation of software to enable PM settings (1E Client Source 2003). Both commercial software providers state that their products take very little time to install, particularly when the software can be remotely installed on users’ machines. Similarly, both companies also claim that their software is very “light” computationally and does not degrade operating performance. The relatively simple nature of the software suggest that both of these claims are reasonable. Although the EnergyStar® software is available for free, it offers less functionality than the commercial products. In particular, it does not incorporate the ability to establish different PM settings as a function of time-of-day. Thus, this software cannot not address network issues that may cause PCs to have their PM disabled. For example, network administrators using this software could not push out software updates to machines after the machines enter sleep mode (unless WOL is enabled on the PCs). Network administrators can, however, work around this limitation by creating scheduled real-time clock events on PCs that wake up PCs at pre-determined times to allow deployment of software updates (Bolioli 2004). To consider seriously implementing a network PM software package, IT managers will desire in-depth case studies that address (and alleviate) their concerns about user experience and performance, as well as software maintenance cost. Some case studies already exist, but they generally focus on energy savings and do not address implementation problems thoroughly (SMS 2000; Linger 2002a131). In general, due to the low reward and perceived high risk of additional software to mange, IT professionals appear reluctant to incorporate it until the software’s maturity has been demonstrated.
4.8.6 Technology Development “Next Steps” • Integrate PM management options directly into standard network management software.
This could result in a more cohesive and robust package that would enhance its attractiveness to IT administrators and decrease its cost.
• Educate users about the compatibility of more recent power management schemes with operating systems. Specifically, Windows2000 and XPTM support PM, whereas WindowsNTTM could not support PM without additional software (Webber et al. 2001; Korn et al. 2004).
• Perform field testing and evaluation to: 1) Assess the impact of the software on PC user experiences and IT maintenance personnel, and 2) Obtain better estimates of the full costs to implement and maintain software.
• Investigate implementation via an Energy Service Company (ESCO) model, where the ESCO pays for the up-front deployment of the software at a location (e.g., a business) and shares the energy savings that accrue over the life of the software with the business. The ability of some existing network PM software to monitor and record before-and-after usage patterns would simplify evaluation of energy savings.
131 Also see the case studies summarized at: http://www.ezconserve.com/realworld.html .
4-86
• Encourage major operating system developers to develop a standard network card driver specification for Wake-on-LAN (WOL) client configuration to facilitate network-based enabling of WOL functionality. This would greatly simplify network-based PM enablement.
• Extend network-based PM to control settings of network-connected copiers and printers.
4.8.7 References 1E, 2004, “Night Watchman “, Night Watchman Product Sheet. Available at:
http://www.1e.com/download/products/nightwatchman_product_sheet.pdf . 1E Client Source, 2003, Personal Communication, Confidential Client, January. ADL, 2002, “Energy Consumption by Office and Telecommunications Equipment in
Commercial Buildings Volume 1: Energy Consumption Baseline.”, Final Report Prepared for the U.S. Department of Energy, Office of Building Technology, January.
Bolioli, T., 2004, Personal Communication, Terra Novum, November. Christensen, K., B. Nordman, and R. Brown, 2004, “Power Management in Networked
Devices”, Computer, August, pp. 91-93. Available at: http://www.computer.org/computer/homepage/0804/communications/ .
EPA, Energy Star web-site for EZ Save software, 2002. Available at: http://www.energystar.gov/powermanagement/download.asp?orgtype.
Korn, D., 2004, Personal Communication, Cadmus Group, November. Korn, D. R. Huang, D. Deavers, T. Bolioli, and M. Walker, 2004, “Power Management of
Computers”, Proc. IEEE International Symposium on Electronics and the Environment, 10-13 May, Phoenix/Scottsdale, Arizona, U.S.
Lin, W., 2003, Personal Communication, City of San Jose. Linger, P., 2002a, “Surveyor – Network Energy and Asset Management”, Presentation from
EZConserve. Linger, P., 2002b, Personal Communication, EZConserve, December. Mahabadi, H., 2004, Personal Communication, Xerox Corporation, July. Nordman, B., A. Meier, and M.A. Piette, 2000, “PC and Monitor Night Status: Power
Management Enabling and Manual Turn-Off”, LBNL Report, LBNL-46099. Nordman, B., 2004, Personal Communication, July. Roberson, J. A., R.E. Brown, B. Nordman, C.A. Webber., G.K. Homan, A. Mahajan, M.
McWhinne, J.G. Koomey, 2002, “Power Levels in Office Equipment: Measurements of New Monitors and Personal Computers”, Proc. ACEE Summer Study on Energy Efficiency in Buildings, Pacific Grove, CA, 22-26 August.
Roberson, J.A., C.A. Webber, M.C. McWhinney, R.E. Brown, M.J. Pinckard, and J.F. Busch, 2004, “After-Hours Power Status of Office Equipment and Inventory of Miscellaneous Plug-Load Equipment”, Lawrence Berkeley National Laboratory Final Report, Report Number LBNL-53729. Available at: http://enduse.lbl.gov/info/LBNL-53729.pdf .
SMS, 2002, “Optician Chain Vision Service Plan (VSP) Opens its Eyes to Electricity Wastes”, SMS/NightWatchmanTM Case Study, Produced by 1E.
4-87
St.-Jean, M., 2002, Personal Communication, 1E, December. Verdiem, 2004, “Surveyor Network Energy Manager – Frequently Asked Questions”,
Downloaded on 17 November. Available at: http://virtual.pnw.com/surveyor/faqs.asp .
Webber, C.A., J.A. Roberson, R.E. Brown, C.T. Payne, B. Nordman, and J.G. Koomey, 2001, “Field Surveys of Office Equipment Operating Patterns”, LBNL Report, LBNL-46930, September. Available at: http://enduse.lbl.gov/Info/LBNL-46930.pdf.
Wilcock, P., 2002, “1E – Environmental PC Computing”, 1E Presentation. 4.9 Organic Light-Emitting Diode (OLED) Monitors and Displays
4.9.1 Summary Organic light-emitting diode (OLED)-based monitors have the potential to replace current cathode ray tube (CRT) and liquid crystal display (LCD) monitors132 eventually. An OLED display consists of an array of very thin organic semiconductor diodes sandwiched between cathodes and anodes. When a current passes through the material, it stimulates the emission of light from the diodes. Hence, OLEDs are emissive displays, as are conventional CRTs. Relative to CRTs, OLEDs offer greatly decreased profile, weight, and – possibly in the future – much lower power draw. Relative to LCDs – which are essentially light valves – OLED-based monitors offer potentially lower manufacturing cost and smaller profile, while reducing active power draw by at least 50%. The sheer number (around 100) of companies actively developing OLED-based displays clearly reflects their potential, and small OLED-based displays have entered the market (e.g., for cell phones). To achieve significant penetration of the computer monitor market, OLEDs must attain performance and cost parity with LCDs. At present, high relative production costs, packaging issues, and insufficient device lifetimes (notably of blue OLEDs) remain the primary barriers to market penetration of OLEDs in that market.
132 See Mently (2002) for a concise review of the history and current state of flat panel display (FPD) technologies.
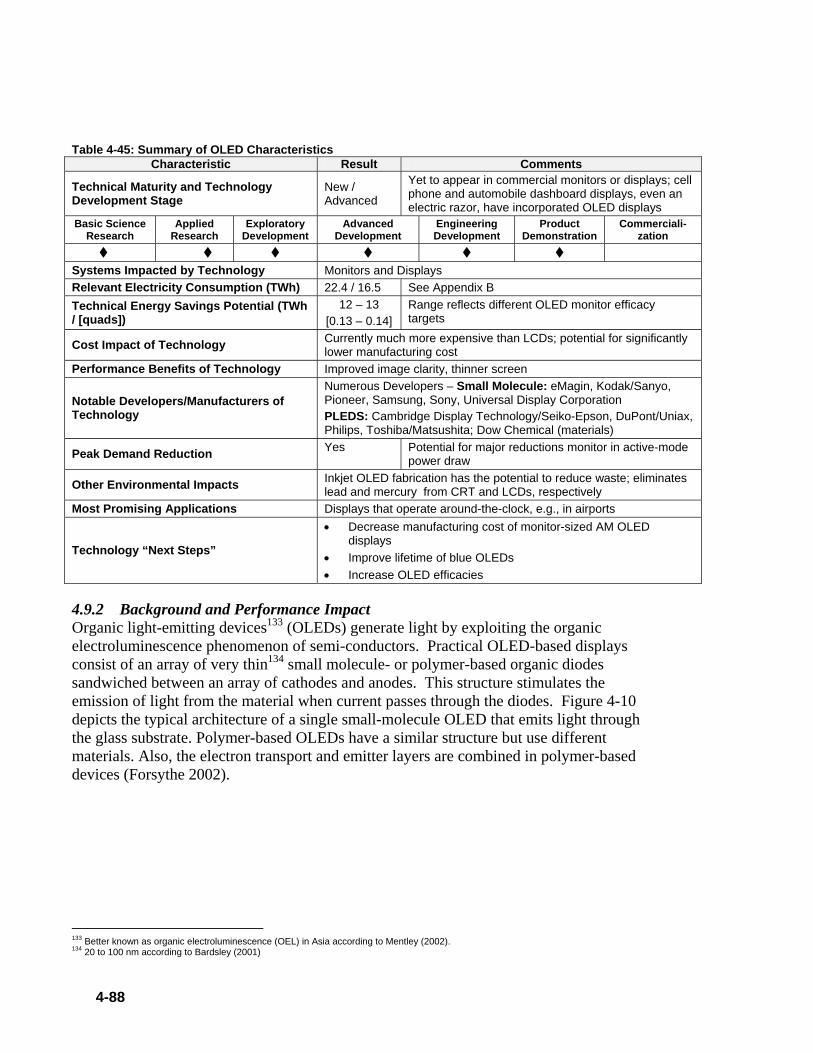
4-88
Table 4-45: Summary of OLED Characteristics
Characteristic Result Comments
Technical Maturity and Technology Development Stage
New / Advanced
Yet to appear in commercial monitors or displays; cell phone and automobile dashboard displays, even an electric razor, have incorporated OLED displays
Basic Science Research
Applied Research
Exploratory Development
Advanced Development
Engineering Development
Product Demonstration
Commerciali-zation
Systems Impacted by Technology Monitors and Displays Relevant Electricity Consumption (TWh) 22.4 / 16.5 See Appendix B Technical Energy Savings Potential (TWh / [quads])
12 – 13 [0.13 – 0.14]
Range reflects different OLED monitor efficacy targets
Cost Impact of Technology Currently much more expensive than LCDs; potential for significantly lower manufacturing cost
Performance Benefits of Technology Improved image clarity, thinner screen
Notable Developers/Manufacturers of Technology
Numerous Developers – Small Molecule: eMagin, Kodak/Sanyo, Pioneer, Samsung, Sony, Universal Display Corporation PLEDS: Cambridge Display Technology/Seiko-Epson, DuPont/Uniax, Philips, Toshiba/Matsushita; Dow Chemical (materials)
Peak Demand Reduction Yes Potential for major reductions monitor in active-mode power draw
Other Environmental Impacts Inkjet OLED fabrication has the potential to reduce waste; eliminates lead and mercury from CRT and LCDs, respectively
Most Promising Applications Displays that operate around-the-clock, e.g., in airports
Technology “Next Steps”
• Decrease manufacturing cost of monitor-sized AM OLED displays
• Improve lifetime of blue OLEDs • Increase OLED efficacies
4.9.2 Background and Performance Impact Organic light-emitting devices133 (OLEDs) generate light by exploiting the organic electroluminescence phenomenon of semi-conductors. Practical OLED-based displays consist of an array of very thin134 small molecule- or polymer-based organic diodes sandwiched between an array of cathodes and anodes. This structure stimulates the emission of light from the material when current passes through the diodes. Figure 4-10 depicts the typical architecture of a single small-molecule OLED that emits light through the glass substrate. Polymer-based OLEDs have a similar structure but use different materials. Also, the electron transport and emitter layers are combined in polymer-based devices (Forsythe 2002).
133 Better known as organic electroluminescence (OEL) in Asia according to Mentley (2002). 134 20 to 100 nm according to Bardsley (2001)
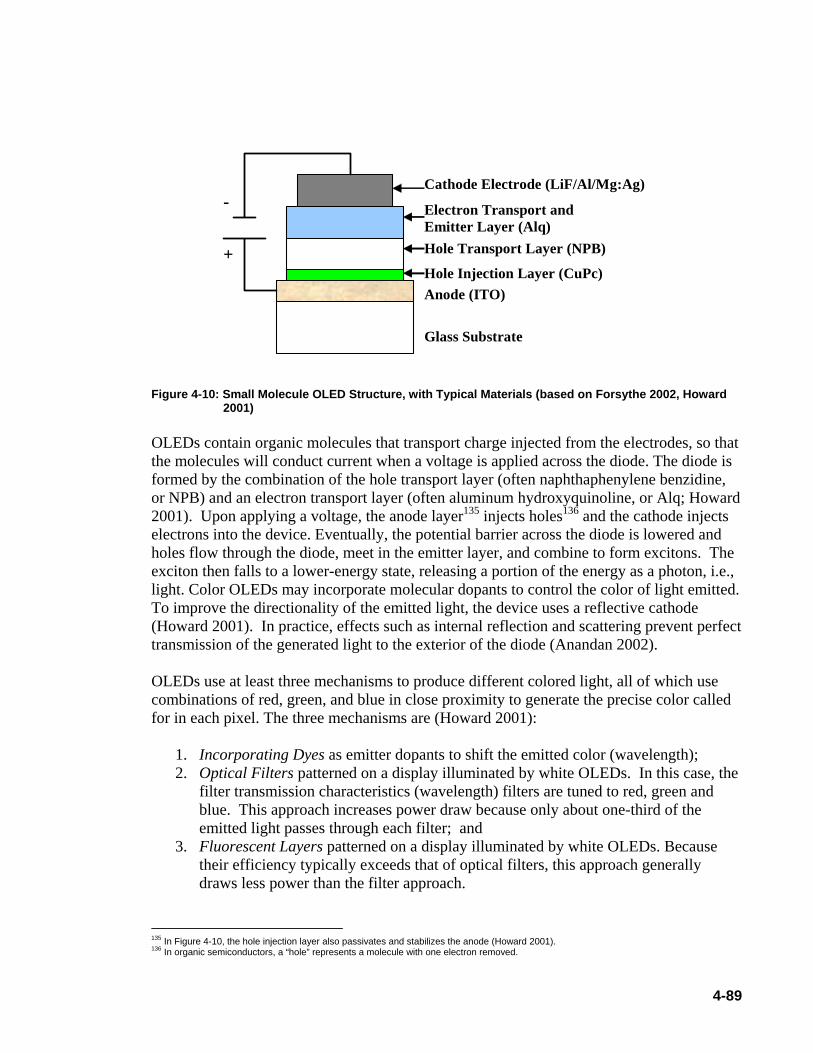
4-89
Cathode Electrode (LiF/Al/Mg:Ag)
Electron Transport and Emitter Layer (Alq) Hole Transport Layer (NPB)
Hole Injection Layer (CuPc) Anode (ITO)
Glass Substrate
+
-
Figure 4-10: Small Molecule OLED Structure, with Typical Materials (based on Forsythe 2002, Howard
2001) OLEDs contain organic molecules that transport charge injected from the electrodes, so that the molecules will conduct current when a voltage is applied across the diode. The diode is formed by the combination of the hole transport layer (often naphthaphenylene benzidine, or NPB) and an electron transport layer (often aluminum hydroxyquinoline, or Alq; Howard 2001). Upon applying a voltage, the anode layer135 injects holes136 and the cathode injects electrons into the device. Eventually, the potential barrier across the diode is lowered and holes flow through the diode, meet in the emitter layer, and combine to form excitons. The exciton then falls to a lower-energy state, releasing a portion of the energy as a photon, i.e., light. Color OLEDs may incorporate molecular dopants to control the color of light emitted. To improve the directionality of the emitted light, the device uses a reflective cathode (Howard 2001). In practice, effects such as internal reflection and scattering prevent perfect transmission of the generated light to the exterior of the diode (Anandan 2002). OLEDs use at least three mechanisms to produce different colored light, all of which use combinations of red, green, and blue in close proximity to generate the precise color called for in each pixel. The three mechanisms are (Howard 2001):
1. Incorporating Dyes as emitter dopants to shift the emitted color (wavelength); 2. Optical Filters patterned on a display illuminated by white OLEDs. In this case, the
filter transmission characteristics (wavelength) filters are tuned to red, green and blue. This approach increases power draw because only about one-third of the emitted light passes through each filter; and
3. Fluorescent Layers patterned on a display illuminated by white OLEDs. Because their efficiency typically exceeds that of optical filters, this approach generally draws less power than the filter approach.
135 In Figure 4-10, the hole injection layer also passivates and stabilizes the anode (Howard 2001). 136 In organic semiconductors, a “hole” represents a molecule with one electron removed.

4-90
All of the layers shown in Figure 4-10 can be evaporated and deposited on the substrate, facilitating device manufacture. In contrast, polymer-based OLED (or PLED) displays can be manufactured by precision ink-jet printing of color (red-green-blue) PLEDs onto a glass substrate (Forsythe 2002). OLED-based monitors can use either active or passive matrix addressing137. A passive matrix consists of columns (anodes) and rows (cathodes) applied perpendicular to each other in parallel planes. The columns and rows do not directly contact each other, but are connected at each pixel by an OLED. Voltage pulses from a “row driver” and current sources from a “column driver” are coordinated to excite each row of pixels successively for a brief time interval. Due to the high refresh rates (typically about 60 images per second), the human eye does not detect the intermittent illumination of the pixels and integrates them to form a flicker-free image (Hunter and Johnson 2002). Active matrix devices provide individual electronic switches for each pixel, typically one or more thin film transistors (TFTs) patterned on a glass backplane, to control the light output of each pixel. In contrast to passive matrix devices, active matrix displays address each pixel individually and emit light continuously throughout each frame period (Hunter and Johnson 2002). Due to individual control of each pixel, active matrix displays generally have faster response times and higher contrast than passive matrix displays. With both matrix types, higher drive current increases display intensity (Forsythe 2002). Relative to CRT monitors, OLED monitors will offer a flat display, greatly decreased weight and thickness, the potential for lower power draw, and even the possibility of flexible displays (in the case of PLEDs). As an emissive display, OLEDs have improved viewing angles, superior contrast, and faster response138 than LCDs (Mentley 2002). Additionally, they exhibit lower (about three-fold) weight and thickness and OLED-based displays fabricated on plastic backplanes also are far more rugged than LCDs (USDC 2003). For all of these reasons, “almost 100 companies are engaged in OLED development” (Hack and Brown 2002). To date, OLED-based monitors are not commercially available, but OLED displays have appeared in other products, including automobile dashboard radios, digital cameras, cell phones, and on an electric shaver (to show battery charge status). All existing displays have used small-molecule technology, with polymer devices still in development with the exception of the electric shaver, which uses a polymer device. Allen (2002) cites an industry estimate that the $112 million market for OLED displays in 2002 will grow to $2.8 billion in 2008. This represents about a 65% compound annual growth rate. The same source projects that OLED computer display sales will approach 10 million units139 in 2008. Several major display manufacturers have pursued monitor-sized OLEDs, such as the 13-inch and 17-inch displays in development by Sony and Toshiba-Matsushita, respectively.
137 Addressing denotes the means by which display drivers relay information to each pixel in the display, including the intensity and color of the
pixel. 138 Ibaraki (2002) places OLED response times on the order of 100µs compared to 40-50ms for LCDs. 139 The authors believe that units would be sold as part of notebook (laptop) PCs.

4-91
Sony has recently indicated that they are exploring pursuing production of monitor-sized displays in 2003 (Lieberman 2002). Other OLED market penetration estimates and roadmaps suggest commercialization in the computer monitor market circa 2005 or 2006 (see Table 4-46; Ibaraki 2002, USDC 2003). This is consistent with other estimates that OLED-based computer monitors will achieve significant market share between 2007 and 2010 (USDC 2003). Table 4-46: Roadmap for Active Matrix OLEDs (from Ibaraki 2002)
Target Application Year Issues to Overcome Mobile Phones 2002 Entered market PDA 2004 Higher efficiency Navigation/Amusement 2005 Higher efficiency, longer lifetime TV and PC 2006 Longer lifetime, better color
Past and future OLED display development has and will continue to leverage extensive research into LEDs and OLEDs as light sources, including for general lighting140.
4.9.3 Energy Savings Potential OLED-based monitors have the potential to consume substantially less energy than LCDs because OLEDs directly emit light, in contrast to the backlights used in LCDs. The emissive property eliminates the need for several optical components that account for most of the optical losses associated with LCDs. As a result, OLEDs realize roughly a ten-fold increase in optical efficiency (see Table 4-47). Table 4-47: Comparison of OLED Display and LCD Optical Losses
Optical Components Optical Efficiency [%] Optical Component LCD OLED LCD141 OLED
Light Reflector [LCD] / Front Substrate + Back Electrode [OLED] Y N 50-60% 80 –
90%142 Diffuser Y N 90% N/A First Polarizer (Pre-LCD) Y N 40-50% N/A LCD Y N 70%-95% N/A Color Filter Y N 25%-30 N/A Second Polarizer (Post-LCD) + surface reflections [LCD] / Contrast Enhancement Layer [OLED]
Y Y 80% 50%143
Integrated System Optical Efficiency 4% 40 – 45% Since backlights represent approximately 80% of LCD active power draw, an OLED-based monitor would draw about four times less active power than a similarly-sized LCD. This estimate reflects two key assumptions: 1) the LCD backlight and the OLEDs have similar efficacies, and 2) the drive electronics of both monitors have the same power draw. Neither assumption holds for current technology.
140 Information about the U.S. Department of Energy, Energy Efficiency and Renewable Energy, research into OLED and LED lighting can be
found at: www.netl.doe.gov/SSL . 141 See Section 4.5 for a description of LCD losses. 142 USDC (2003). 143 For contrast enhancement layer (USDC 2003).
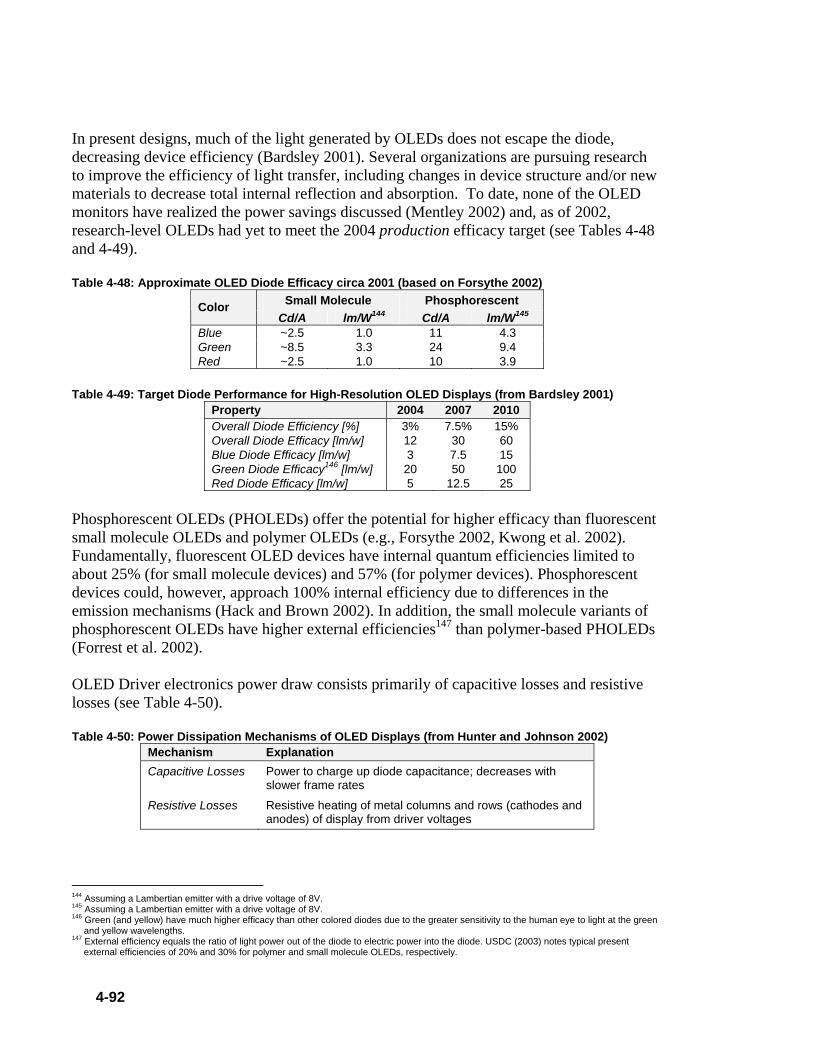
4-92
In present designs, much of the light generated by OLEDs does not escape the diode, decreasing device efficiency (Bardsley 2001). Several organizations are pursuing research to improve the efficiency of light transfer, including changes in device structure and/or new materials to decrease total internal reflection and absorption. To date, none of the OLED monitors have realized the power savings discussed (Mentley 2002) and, as of 2002, research-level OLEDs had yet to meet the 2004 production efficacy target (see Tables 4-48 and 4-49). Table 4-48: Approximate OLED Diode Efficacy circa 2001 (based on Forsythe 2002)
Small Molecule Phosphorescent Color Cd/A lm/W144 Cd/A lm/W145
Blue ~2.5 1.0 11 4.3 Green ~8.5 3.3 24 9.4 Red ~2.5 1.0 10 3.9
Table 4-49: Target Diode Performance for High-Resolution OLED Displays (from Bardsley 2001)
Property 2004 2007 2010 Overall Diode Efficiency [%] 3% 7.5% 15% Overall Diode Efficacy [lm/w] 12 30 60 Blue Diode Efficacy [lm/w] 3 7.5 15 Green Diode Efficacy146 [lm/w] 20 50 100 Red Diode Efficacy [lm/w] 5 12.5 25
Phosphorescent OLEDs (PHOLEDs) offer the potential for higher efficacy than fluorescent small molecule OLEDs and polymer OLEDs (e.g., Forsythe 2002, Kwong et al. 2002). Fundamentally, fluorescent OLED devices have internal quantum efficiencies limited to about 25% (for small molecule devices) and 57% (for polymer devices). Phosphorescent devices could, however, approach 100% internal efficiency due to differences in the emission mechanisms (Hack and Brown 2002). In addition, the small molecule variants of phosphorescent OLEDs have higher external efficiencies147 than polymer-based PHOLEDs (Forrest et al. 2002). OLED Driver electronics power draw consists primarily of capacitive losses and resistive losses (see Table 4-50). Table 4-50: Power Dissipation Mechanisms of OLED Displays (from Hunter and Johnson 2002)
Mechanism Explanation Capacitive Losses Power to charge up diode capacitance; decreases with
slower frame rates
Resistive Losses Resistive heating of metal columns and rows (cathodes and anodes) of display from driver voltages
144 Assuming a Lambertian emitter with a drive voltage of 8V. 145 Assuming a Lambertian emitter with a drive voltage of 8V. 146 Green (and yellow) have much higher efficacy than other colored diodes due to the greater sensitivity to the human eye to light at the green
and yellow wavelengths. 147 External efficiency equals the ratio of light power out of the diode to electric power into the diode. USDC (2003) notes typical present
external efficiencies of 20% and 30% for polymer and small molecule OLEDs, respectively.
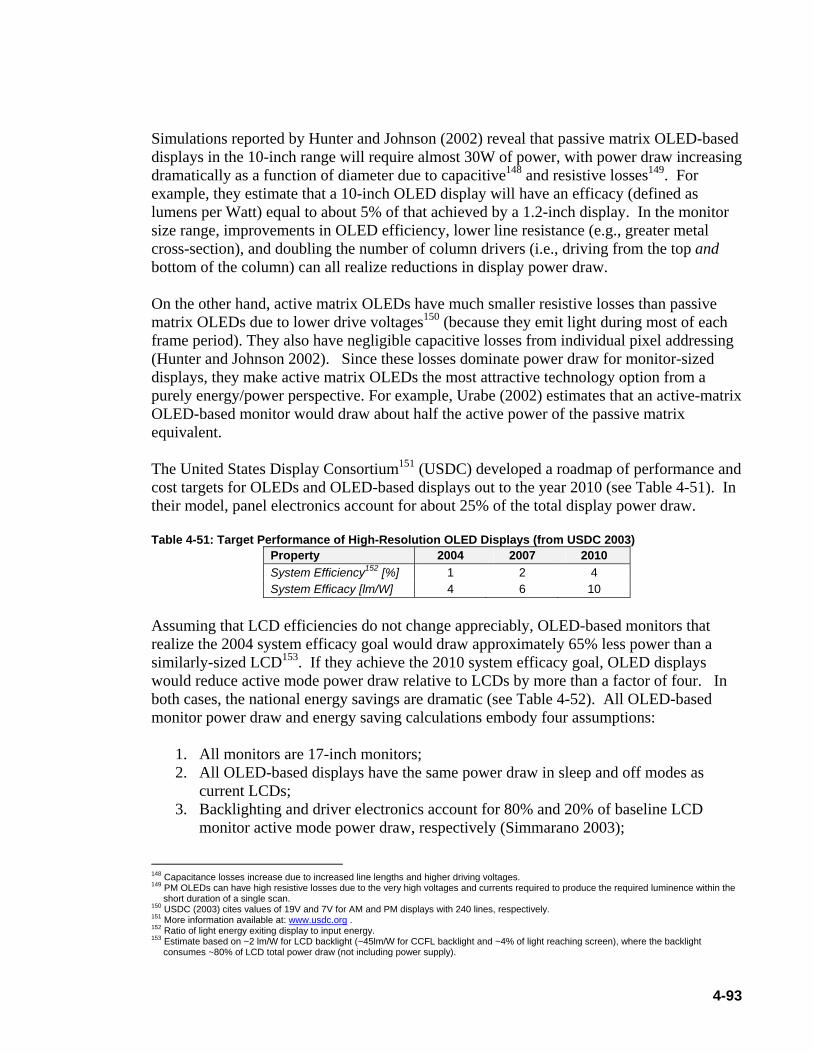
4-93
Simulations reported by Hunter and Johnson (2002) reveal that passive matrix OLED-based displays in the 10-inch range will require almost 30W of power, with power draw increasing dramatically as a function of diameter due to capacitive148 and resistive losses149. For example, they estimate that a 10-inch OLED display will have an efficacy (defined as lumens per Watt) equal to about 5% of that achieved by a 1.2-inch display. In the monitor size range, improvements in OLED efficiency, lower line resistance (e.g., greater metal cross-section), and doubling the number of column drivers (i.e., driving from the top and bottom of the column) can all realize reductions in display power draw. On the other hand, active matrix OLEDs have much smaller resistive losses than passive matrix OLEDs due to lower drive voltages150 (because they emit light during most of each frame period). They also have negligible capacitive losses from individual pixel addressing (Hunter and Johnson 2002). Since these losses dominate power draw for monitor-sized displays, they make active matrix OLEDs the most attractive technology option from a purely energy/power perspective. For example, Urabe (2002) estimates that an active-matrix OLED-based monitor would draw about half the active power of the passive matrix equivalent. The United States Display Consortium151 (USDC) developed a roadmap of performance and cost targets for OLEDs and OLED-based displays out to the year 2010 (see Table 4-51). In their model, panel electronics account for about 25% of the total display power draw. Table 4-51: Target Performance of High-Resolution OLED Displays (from USDC 2003)
Property 2004 2007 2010 System Efficiency152 [%] 1 2 4 System Efficacy [lm/W] 4 6 10
Assuming that LCD efficiencies do not change appreciably, OLED-based monitors that realize the 2004 system efficacy goal would draw approximately 65% less power than a similarly-sized LCD153. If they achieve the 2010 system efficacy goal, OLED displays would reduce active mode power draw relative to LCDs by more than a factor of four. In both cases, the national energy savings are dramatic (see Table 4-52). All OLED-based monitor power draw and energy saving calculations embody four assumptions:
1. All monitors are 17-inch monitors; 2. All OLED-based displays have the same power draw in sleep and off modes as
current LCDs; 3. Backlighting and driver electronics account for 80% and 20% of baseline LCD
monitor active mode power draw, respectively (Simmarano 2003);
148 Capacitance losses increase due to increased line lengths and higher driving voltages. 149 PM OLEDs can have high resistive losses due to the very high voltages and currents required to produce the required luminence within the
short duration of a single scan. 150 USDC (2003) cites values of 19V and 7V for AM and PM displays with 240 lines, respectively. 151 More information available at: www.usdc.org . 152 Ratio of light energy exiting display to input energy. 153 Estimate based on ~2 lm/W for LCD backlight (~45lm/W for CCFL backlight and ~4% of light reaching screen), where the backlight
consumes ~80% of LCD total power draw (not including power supply).
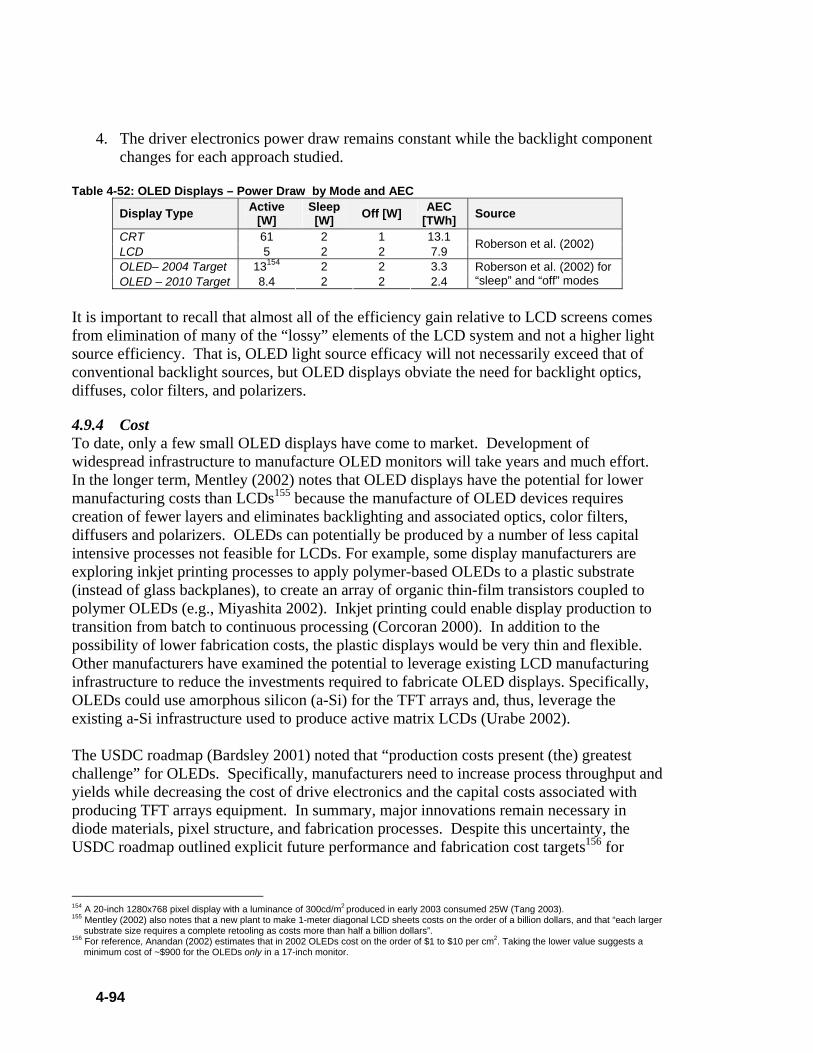
4-94
4. The driver electronics power draw remains constant while the backlight component changes for each approach studied.
Table 4-52: OLED Displays – Power Draw by Mode and AEC
Display Type Active [W]
Sleep [W] Off [W] AEC
[TWh] Source
CRT 61 2 1 13.1 LCD 5 2 2 7.9 Roberson et al. (2002)
OLED– 2004 Target 13154 2 2 3.3 OLED – 2010 Target 8.4 2 2 2.4
Roberson et al. (2002) for “sleep” and “off” modes
It is important to recall that almost all of the efficiency gain relative to LCD screens comes from elimination of many of the “lossy” elements of the LCD system and not a higher light source efficiency. That is, OLED light source efficacy will not necessarily exceed that of conventional backlight sources, but OLED displays obviate the need for backlight optics, diffuses, color filters, and polarizers.
4.9.4 Cost To date, only a few small OLED displays have come to market. Development of widespread infrastructure to manufacture OLED monitors will take years and much effort. In the longer term, Mentley (2002) notes that OLED displays have the potential for lower manufacturing costs than LCDs155 because the manufacture of OLED devices requires creation of fewer layers and eliminates backlighting and associated optics, color filters, diffusers and polarizers. OLEDs can potentially be produced by a number of less capital intensive processes not feasible for LCDs. For example, some display manufacturers are exploring inkjet printing processes to apply polymer-based OLEDs to a plastic substrate (instead of glass backplanes), to create an array of organic thin-film transistors coupled to polymer OLEDs (e.g., Miyashita 2002). Inkjet printing could enable display production to transition from batch to continuous processing (Corcoran 2000). In addition to the possibility of lower fabrication costs, the plastic displays would be very thin and flexible. Other manufacturers have examined the potential to leverage existing LCD manufacturing infrastructure to reduce the investments required to fabricate OLED displays. Specifically, OLEDs could use amorphous silicon (a-Si) for the TFT arrays and, thus, leverage the existing a-Si infrastructure used to produce active matrix LCDs (Urabe 2002). The USDC roadmap (Bardsley 2001) noted that “production costs present (the) greatest challenge” for OLEDs. Specifically, manufacturers need to increase process throughput and yields while decreasing the cost of drive electronics and the capital costs associated with producing TFT arrays equipment. In summary, major innovations remain necessary in diode materials, pixel structure, and fabrication processes. Despite this uncertainty, the USDC roadmap outlined explicit future performance and fabrication cost targets156 for
154 A 20-inch 1280x768 pixel display with a luminance of 300cd/m2 produced in early 2003 consumed 25W (Tang 2003). 155 Mentley (2002) also notes that a new plant to make 1-meter diagonal LCD sheets costs on the order of a billion dollars, and that “each larger
substrate size requires a complete retooling as costs more than half a billion dollars”. 156 For reference, Anandan (2002) estimates that in 2002 OLEDs cost on the order of $1 to $10 per cm2. Taking the lower value suggests a
minimum cost of ~$900 for the OLEDs only in a 17-inch monitor.

4-95
displays (see Table 4-53). They project that the display array and display cell will account for most of the display cost. Table 4-53: Target System Performance and Cost for AM OLED Displays (from Bardsley 2001)
Property 2004 2007 2010 Lifetime [hours @ 300cd/m2] 10,000 20,000 40,000 Maximum Pixel Density [ppi] 100 200 300 Panel Thickness [mm] 2.0 1.0 0.5 Panel Weight [g/cm2] 0.5 0.25 0.1 Fabrication Costs [$/in2] 5.00 1.00 0.50 17-inch Display157 Fabrication Cost [$] $690 $140 $70
According to Bardsley (2001), pixel densities will need to approach 300 pixels per inch (ppi) to achieve needed resolution for PC monitor. Display market analyses project that active matrix-OLEDs will become cost- and performance-competitive with LCDs circa 2007 and surpass LCDs in both attributes circa 2010 (Bardsley 2001; USDC 2003). This projection assumes future decreases in LCD monitor costs, as well as future increases in OLED display production volumes and yields along with advances in OLED fabrication. Ortiz (2003) notes that a market research firm projects that OLED displays will cost about 20% less than LCDs once mass production is achieved.
4.9.5 Perceived Barriers to Market Adoption of Technology Mentley (2002) noted that although more than 100 companies and research institutions were developing OLED displays in 2002, the development of a manufacturing infrastructure will take time and poses the greatest present challenge to commercialization. At present, full color manufacturing processes are still under development, with small molecule displays more advanced than polymer displays (Forsythe 2002). In particular, it has proven difficult to achieve higher material deposition and patterning speeds/rates, due to the time needed to build up sufficiently thick layers. In contrast, inkjet printing can realize much faster rates, but has problems in managing uniform small layer thickness. Prototypes suggest that the 2004 manufacturing goals for both vacuum deposition with shadowmask (small molecules) and ink-jet printing (polymers) of materials into pre-defined pixels can be met, but the transition to high-volume manufacturing will require much additional development (Bardsley 2001). To date, TFT arrays have been formed on glass substrates, while plastic substrate development has lagged behind. For both substrates, maintaining TFT post-manufacturing uniformity poses a significant challenge. In addition to the manufacturing issues discussed in the prior “cost” subsection, OLEDs currently suffer from material stability issues. Notably, blue-colored OLEDs had demonstrated lifetimes158 of only a few hundred hours circa 2002 for more efficient fluorescent blue emitters (see Table 4-54). Other colors have exhibited better stability (i.e., on the order of several thousand hours), but still fall short of the tens of thousands of hours required for monitor applications. The USDC roadmap estimates that OLEDs must have a 157 Assumes a 4:3 ratio of width to height, i.e., 13.6 by 10.2. Roadmap target costs for OLED panels from 2004 to 2010 assume that processing
costs will always equal about twice materials cost, Bill of material components now represent more than 50% of total fabrication costs for some AM OLED manufacturers.
158 Time to 50% of original brightness.
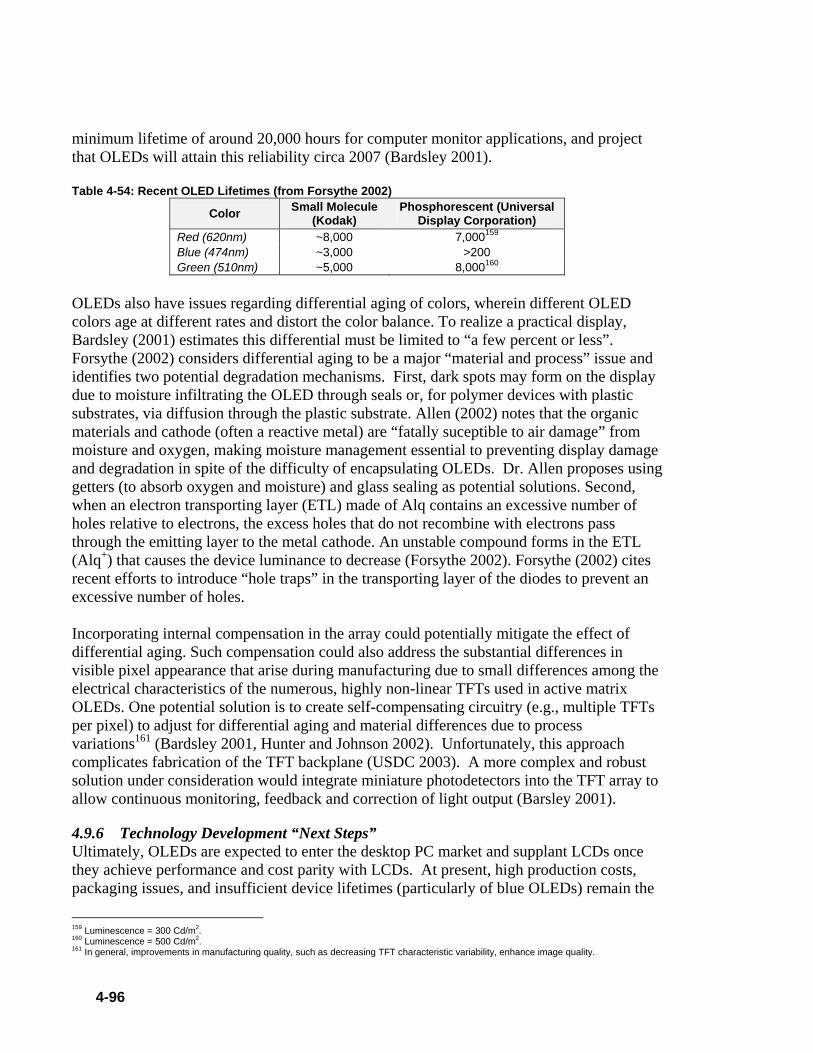
4-96
minimum lifetime of around 20,000 hours for computer monitor applications, and project that OLEDs will attain this reliability circa 2007 (Bardsley 2001). Table 4-54: Recent OLED Lifetimes (from Forsythe 2002)
Color Small Molecule (Kodak)
Phosphorescent (Universal Display Corporation)
Red (620nm) ~8,000 7,000159 Blue (474nm) ~3,000 >200 Green (510nm) ~5,000 8,000160
OLEDs also have issues regarding differential aging of colors, wherein different OLED colors age at different rates and distort the color balance. To realize a practical display, Bardsley (2001) estimates this differential must be limited to “a few percent or less”. Forsythe (2002) considers differential aging to be a major “material and process” issue and identifies two potential degradation mechanisms. First, dark spots may form on the display due to moisture infiltrating the OLED through seals or, for polymer devices with plastic substrates, via diffusion through the plastic substrate. Allen (2002) notes that the organic materials and cathode (often a reactive metal) are “fatally suceptible to air damage” from moisture and oxygen, making moisture management essential to preventing display damage and degradation in spite of the difficulty of encapsulating OLEDs. Dr. Allen proposes using getters (to absorb oxygen and moisture) and glass sealing as potential solutions. Second, when an electron transporting layer (ETL) made of Alq contains an excessive number of holes relative to electrons, the excess holes that do not recombine with electrons pass through the emitting layer to the metal cathode. An unstable compound forms in the ETL (Alq+) that causes the device luminance to decrease (Forsythe 2002). Forsythe (2002) cites recent efforts to introduce “hole traps” in the transporting layer of the diodes to prevent an excessive number of holes. Incorporating internal compensation in the array could potentially mitigate the effect of differential aging. Such compensation could also address the substantial differences in visible pixel appearance that arise during manufacturing due to small differences among the electrical characteristics of the numerous, highly non-linear TFTs used in active matrix OLEDs. One potential solution is to create self-compensating circuitry (e.g., multiple TFTs per pixel) to adjust for differential aging and material differences due to process variations161 (Bardsley 2001, Hunter and Johnson 2002). Unfortunately, this approach complicates fabrication of the TFT backplane (USDC 2003). A more complex and robust solution under consideration would integrate miniature photodetectors into the TFT array to allow continuous monitoring, feedback and correction of light output (Barsley 2001).
4.9.6 Technology Development “Next Steps” Ultimately, OLEDs are expected to enter the desktop PC market and supplant LCDs once they achieve performance and cost parity with LCDs. At present, high production costs, packaging issues, and insufficient device lifetimes (particularly of blue OLEDs) remain the
159 Luminescence = 300 Cd/m2. 160 Luminescence = 500 Cd/m2. 161 In general, improvements in manufacturing quality, such as decreasing TFT characteristic variability, enhance image quality.

4-97
primary barriers to market penetration. As noted earlier, numerous display companies continue to invest substantial funds towards overcoming these barriers, which clearly reflects the perceived potential of OLED-based displays. • Reduce Manufacturing Cost of AM Displays – Improve process yield, lower-cost
manufacture of more complex TFT architectures. • Improve Device Lifetime – Dramatic increases in expected lifetime of OLEDs,
particularly blue OLEDs; improved packaging to reliably prevent failure due to moisture and air; address differential aging (and color issues).
• Increase OLED Efficacy – Developing production-ready OLEDs with higher internal and external efficacies.
4.9.7 References Allen, K., 2002, “OLED Encapsulation”, Information Display, July, pp. 26-28. Anandan, M., 2002, “LCD Backlighting”, Society for Information Display: Seminar Lecture
Notes: Volume II, 24 May, Boston, pp. F-5/1 - F-5/82. Bardsley, J.N., 2001, “International OLED Technology Roadmap: 2001-2010”, White Paper
by U.S. Display Consortium. Available at: http://www.usdc.org/technical/downloads/OLED_Techroadmap_nbtext.pdf .
Corcoran, E., 2000, “Out Of This World”, Forbes Global, 18 September, Available at: http://www.forbes.com/global/2000/0918/0318100a.html .
Crawford, G.P., 2002, Personal Communication, Brown University, October. Forrest, S.R., M.A. Baldo, J.J. Brown, B.D’Andrade, Y. Kawamura, R. Kwong, M.E.
Thompson, and S. Yanagida, 2002, “Electrophosphorescent Organic Light Emitting Devices”, Society for Information Display, 2002 International Symposium – Digest of Technical Papers, Volume XXXIII, Number I1, pp. 1357-1359.
Forsythe, E.W., 2002, “Operation of Organic-Based Light-Emitting Devices”, Society for Information Display: Seminar Lecture Notes: Volume I, 24 May, Boston, pp. M-5/1-M-5/50.
Hack, M. and Brown, J.J, 2002, “High-Efficiency AMOLEDs”, Information Display, July, pp. 16-19.
Harris, T., “How Light Emitting Diodes Work”, HowStuffWorks.com. Downloaded from: http://www.howstuffworks.com/led1.htm , 13 November, 2002.
Howard, W.E., 2001, “OLED Technology Primer”, eMagin Corporation. Downloaded from: http://www.emagin.com/oledpri.htm , 8 November, 2002.
Hunter, I.M. and M.T. Johnson, 2002, “OLED Addressing”, Society for Information Display: Seminar Lecture Notes: Volume I, 24 May, Boston, pp. M-6/1-M-6/44.
Ibaraki, N., 2002, “Low-Temperature Poly-Si Technologies: Key to Future LCDs and OLEDs”, Society for Information Display: Seminar Lecture Notes: Volume II, 24 May, Boston, pp. F-4/1-F-4/27.
Johnston, B., 2001, “A Bright Future for Displays”, Technology Review, April, pp. 81-85. Kwong, R.C., M.R. Nugent, L. Michalski, T. Ngo, K. Rajan, Y.-J. Tung, M.S. Weaver, T.X.
Zhou, M. Hack, and J.J. Brown, 2002,”Display Properties of High-Efficiency Electrophosphorescent Diodes”, Society for Information Display, 2002 International
4-98
Symposium – Digest of Technical Papers, Volume XXXIII, Number 1I, pp. 1365-1367.
Lieberman, D., 2002, “Emissives Shine at SID 2002”, Information Display, September, p.13, 24-28.
Mently, D.E., 2002, “State of Flat-Panel Display Technology and Future Trends”, Proceedings of the IEEE, vol. 90, no. 4., April, pp. 453-459.
Miyashita, S., 2002, “Printing Panels”, Information Display, April/May, pp. 16-19. Ortiz, S., 2003, “New Monitor Technologies Are On Display”, Computer, February, pp. 14-
17. Semenza, P., 2002, Personal Communication, iSuppli/Stanford Resources, October. Tang, C.W., 2003, “Organic Light-Emitting Diodes (OLEDs)”, Society for Information
Display: Seminar Lecture Notes: Volume I, 19 May, Baltimore, pp. M-5/1-M-5/87. Urabe, T., 2002, “Active Matrix OLED Display”, Society for Information Display: Seminar
Lecture Notes: Volume II, 24 May, Boston, pp. F-7/1 - F-7/18. USDC, 2003, “The Global Flat Panel Display Industry ‘2003’: An In-Depth Overview and
Roadmap on FPD Technologies, Markets, Manufacturing, and Materials”, U.S. Display Consortium.
4.10 Reflective Monitors and Displays
4.10.1 Summary The backlight accounts for about 80% of the active mode power consumption of a conventional (transmissive) LCD (see Section 4.5). Reflective monitors and displays use ambient light for all or a significant portion of display illumination, which eliminates some or all of the backlight power draw. Several reflective liquid crystal technologies have high reflectances that, when combined with a front lighting system, have a much higher light delivery efficiency than transmissive LCDs (e.g., >15% for a 35% reflectance versus around 4%). This benefit has lead to the use of reflective displays in portable electronic devices to extend unplugged operational times. To penetrate the computer monitor market, each reflective display technology will need to achieve significant gains in one or more key display quality attributes, including contrast ratio, resolution, switching speeds, viewing angle, gray scale, and color gamut. In addition, many technologies need to overcome existing manufacturing issues.

4-99
Table 4-55: Summary of Reflective Display Characteristics
Characteristic Result Comments
Technical Maturity and Technology Development Stage
Current to Advanced
Some smart handheld devices use reflective displays; much prior use for other applications (e.g., calculators). At least one portable PC circa 1990 used a reflective display (Lovins and Heede 1990)
Basic Science Research
Applied Research
Exploratory Development
Advanced Development
Engineering Development
Product Demonstration
Commerciali-zation
Systems Impacted by Technology Monitors and Displays Relevant Electricity Consumption (TWh) 22.4 / 16.5 See Appendix B Technical Energy Savings Potential (TWh / [quads])
9 –13 [0.10 – 0.14]
Range from frontlit to fully reflective displays
Cost Impact of Technology Potential for cost decrease if backlight eliminated; some approaches currently face manufacturing issues
Performance Benefits of Technology Decreased display thickness and weight; mitigates “washout” in high-ambient light conditions
Notable Developers/Manufacturers of Technology
Kent Displays (cholesteric; see Section 4.2); LG-Philips; Sharp (reflective and transflective LCDs); Sony (grating light valve); Toshiba; Iridigm (interferometric modulation); Wintek Electro-Optics Corporation (color reflective and transflective STN)
Peak Demand Reduction Yes Reductions in active-mode power draw Other Environmental Impacts Unclear
Most Promising Applications Displays that operate around-the-clock with suitable levels of ambient light, e.g., airports
Technology “Next Steps”
• Improved display qualities (contrast ratio, viewing angle, switching speed, color gamut ) for high-reflectance LC technologies
• Development of efficient and low-cost front lighting systems
4.10.2 Background and Performance Impact Conventional cathode ray tube (CRT) displays and transmissive LCDs use an integrated light source to provide illumination. In a CRT display, the CRT is the light source and accelerates electrons into a phosphor layer on the screen that emits light of the desired color. As discussed further in Section 4.5, LCDs162 use a backlight163 and the liquid crystals act as a “light valve” that either block or pass light. Typically, however, only 4 to 5 percent of the light emitted by the backlight actually comes out the front of the LCD (see Section 4.5). In contrast, a reflective display relies upon ambient light for display illumination and reflects the incoming light back to the viewer. Wu and Yang (2001) describe four basic kinds of reflector developed to date. Reflectors with light control films are affixed to front layer of the display to diffuse incoming light and outgoing light, mitigating the specular reflections from the mirrored back reflector. Rough surface reflectors have different reflector surface morphologies that can produce a range of display qualities (e.g., viewing angles, brightness, contrast). Holographic reflectors incorporate a volume hologram that refracts (bends) different wavelengths of light at
162 Kawamoto (2002) provides an extensive review of the history and current state of LCDs. 163 Most LCD monitors use several cold cathode lamps for backlighting.

4-100
different angles from the specular reflection angles. In some instances, different holograms can be used to produce different colors and eliminate the need for “lossy” color filters. Finally, cholesteric reflectors incorporate cholesteric liquid crystals that reflect one component of circularly-polarized light and does not require color filters. Reflective displays offer several distinct benefits relative to transmissive LCDs, most notably reduced power draw and a thinner profile from elimination of the backlight. Without a backlight, reflective displays only draw power to drive the display, which results in a dramatic reduction in display power draw. Similarly, elimination of the backlight reduces the thickness and weight of the display. Table 4-56 offers a comparison of the characteristics of reflective and transmissive 6.5-inch HVGA color TFT-LCDs (from Voutsas and Ishii 2002). Table 4-56: Illustrative Comparison of Reflective and Transmissive LCDs (from Voutsas and Ishii 2002)
Characteristic Transmissive Reflective Reduction by
Reflective Display [%]
Active Power [W] 1.4 0.2 86% Thickness [mm] 6.5 2.2 66% Weight [g] 200 80 60%
Although the data from Table 4-56 are not for a computer monitor application, they clearly illustrate the general magnitude of the potential benefits from reflective LCDs relative to mainstream transmissive LCDs. Reflective displays also do not “wash” out in high ambient light conditions such as daylight. In fact, more ambient light makes the images more vivid. Finally, Wu and Yang (2001) note that reflective displays can obtain an image quality closer to that of photographic film because they have high aperture ratios164 (approaching 90% as compared to <70% for transmissive LCDs) that result in pixels with a “fuller” appearance. On the other hand, current reflective displays are inferior to transmissive LCDs in several respects. Mently (2002a) notes that “color, contrast, viewing angle, and overall appearance are typically sacrificed in a reflective display” relative to transmissive LCDs due to the internal light source and filter subsystem. The “barriers” subsection discusses these and other issues further. Several different reflective display technologies exist, including: LCD (several different types; see Table 4-58), digital micromirror, grating light valve, interferometric modulation, electrophoretic display, and rotating ball (as used in electronic paper) (Wu and Yang 2001). Table 4-57 summarizes several other reflective display approaches besides LCDs.
164 In this context, aperture ratio refers to the ratio of the LCD array that passes or reflects light to the entire display area. Conventional transmissive LCDs have an aperture ration of ~70% or less (Voutsas and Ishii 2002).

4-101
Table 4-57: Non-LCD Reflective Display Technologies (from Wu and Yang 2001) Technology Pros and Cons Description
Grating Light Valve
Pros: High efficiency (~65%); very fast switching (~1µs); high contrast ratio; Cons: Likely cost to manufacture; projection seen as primary application165
MEMS device consisting of an array of small metal ribbons that vary their position to allow or impede light reflection from display.
Digital Micromirror Devices (DMD)
Pros: Very high contrast ratios; digital image precision; very high reflectance (~62%) and very short response times (~µs) 166. Cons: Cost to manufacture167; specular reflections; considered primarily for projection applications.
An array of small (e.g., 16µm x 16µm) mirrors that electronically switches between two states, one that reflects incident light to the viewer and a second in which reflected light does not reach the viewer. Field-sequential lighting, separate red, green and blue DMD arrays168 or a color wheel can be used to generate color displays sequentially.
Interferometric Modulation
Pros: Very fast switching (~100kHz); high reflectivity (~30-35%) some potential for bistable operation; eliminates active matrices, color filters, polarizers; <5V driver voltage (Miles et al. 2002, Amundson 2003, USDC 2003) Cons: Very low (~4:1 or less) contrast ratio; in developmental stage.
MEMS device that varies the optical thickness of a microscale cavity to change the color produced by the cavity; uses cavity arrays for color.
Rotating Ball Displays
Pros: High reflectance; wide viewing angle; bistable (USDC 2003). Cons: Very high voltages (>50V) required for acceptable switching speed and reflectance; very limited gray scales; minimal color development (USDC 2003)
Multiple two-colored spheres with opposing charges on each hemisphere are suspended in an oil-filled cavity to form each pixel of a display; applying a voltage causes the spheres to rotate and display the desired color.
Electrophoretic Pros: High reflectance (~40%); bistable; wide viewing angle; acceptable contrast ratio (~10:1; USDC 2003). Cons: Reflectivity of <30% typical; slow switching speed (0.06 to 0.15s; USDC 2003, Pitt et al. 2002); very limited color gamut (~3.5% NTSC) in initial models (USDC 2003); driving voltages quite high (~15V; Pitt et al. 2002).
Small charged particles in a colloidal suspension either block or allow reflection of light for each pixel; applying voltage attracts the particles to electrodes, allowing the light to pass to a reflecting (or absorbing) layer.
The current discussion will focus on LCD approaches, as they are perceived to have greater commercial potential in monitor applications. In general, mirror-type reflectors reflect light at very specific angles defined by the incoming light. This, combined with poor contrast resulting from glare produced at the mirror substrate, effectively eliminates the use of mirror reflectors in displays. On the other hand, a Lambertian (diffuse) reflector – such as paper, reflects light rather equally in all directions. This makes for wider viewing angles. Ideally, a reflector would reflect light equally and uniquely over the desired viewing angle without generating appreciable glare. Voutsas and Ishii (2002) mention four basic structures for reflective LCDs, of which only the diffused reflector offers a high-quality image (also Sugiura et al. 2002; see Figure 4-11) 165 For instance, Silicon Light Machines has licensed the technology to Sony, for very high definition laser-based projection displays – the laser
is scanned over the array; more information available at: http://www.siliconlight.com/htmlpgs/glvtechframes/glvmainframeset.html . 166 USDC (2003) 167 USDC (2003) notes that DMD cinema projection systems cost six to eight times more than analog systems. 168 USDC (2003).

4-102
Glass Substrate
Color Filter
LC Layer
Diffused Reflector
Glass Substrate
Figure 4-11: Preferred Reflective LCD Design (based on Voutsas and Ishii 2002) In turn, several different technologies can be applied for diffused reflector LCDs, including phase retardation, ploarisation rotation, absorption, light scattering, and Bragg reflection (Wu and Yang 2001). Table 4-58 explains different reflective LCD technologies and their pros and cons.
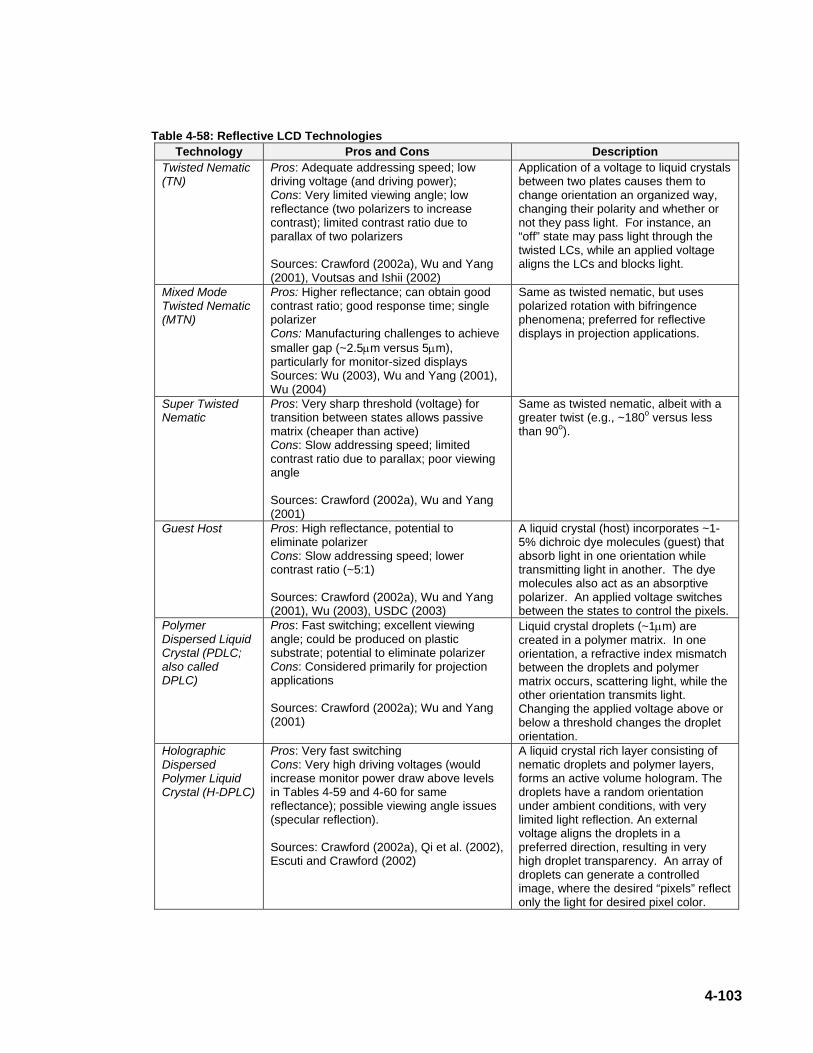
4-103
Table 4-58: Reflective LCD Technologies Technology Pros and Cons Description
Twisted Nematic (TN)
Pros: Adequate addressing speed; low driving voltage (and driving power); Cons: Very limited viewing angle; low reflectance (two polarizers to increase contrast); limited contrast ratio due to parallax of two polarizers Sources: Crawford (2002a), Wu and Yang (2001), Voutsas and Ishii (2002)
Application of a voltage to liquid crystals between two plates causes them to change orientation an organized way, changing their polarity and whether or not they pass light. For instance, an “off” state may pass light through the twisted LCs, while an applied voltage aligns the LCs and blocks light.
Mixed Mode Twisted Nematic (MTN)
Pros: Higher reflectance; can obtain good contrast ratio; good response time; single polarizer Cons: Manufacturing challenges to achieve smaller gap (~2.5µm versus 5µm), particularly for monitor-sized displays Sources: Wu (2003), Wu and Yang (2001), Wu (2004)
Same as twisted nematic, but uses polarized rotation with bifringence phenomena; preferred for reflective displays in projection applications.
Super Twisted Nematic
Pros: Very sharp threshold (voltage) for transition between states allows passive matrix (cheaper than active) Cons: Slow addressing speed; limited contrast ratio due to parallax; poor viewing angle Sources: Crawford (2002a), Wu and Yang (2001)
Same as twisted nematic, albeit with a greater twist (e.g., ~180o versus less than 90o).
Guest Host Pros: High reflectance, potential to eliminate polarizer Cons: Slow addressing speed; lower contrast ratio (~5:1) Sources: Crawford (2002a), Wu and Yang (2001), Wu (2003), USDC (2003)
A liquid crystal (host) incorporates ~1-5% dichroic dye molecules (guest) that absorb light in one orientation while transmitting light in another. The dye molecules also act as an absorptive polarizer. An applied voltage switches between the states to control the pixels.
Polymer Dispersed Liquid Crystal (PDLC; also called DPLC)
Pros: Fast switching; excellent viewing angle; could be produced on plastic substrate; potential to eliminate polarizer Cons: Considered primarily for projection applications Sources: Crawford (2002a); Wu and Yang (2001)
Liquid crystal droplets (~1µm) are created in a polymer matrix. In one orientation, a refractive index mismatch between the droplets and polymer matrix occurs, scattering light, while the other orientation transmits light. Changing the applied voltage above or below a threshold changes the droplet orientation.
Holographic Dispersed Polymer Liquid Crystal (H-DPLC)
Pros: Very fast switching Cons: Very high driving voltages (would increase monitor power draw above levels in Tables 4-59 and 4-60 for same reflectance); possible viewing angle issues (specular reflection). Sources: Crawford (2002a), Qi et al. (2002), Escuti and Crawford (2002)
A liquid crystal rich layer consisting of nematic droplets and polymer layers, forms an active volume hologram. The droplets have a random orientation under ambient conditions, with very limited light reflection. An external voltage aligns the droplets in a preferred direction, resulting in very high droplet transparency. An array of droplets can generate a controlled image, where the desired “pixels” reflect only the light for desired pixel color.

4-104
Overall, reflective direct-view displays incorporating a polarizer offer high contrast ratio and good color saturation, albeit at the expense of some brightness due to polarizer losses. The absoprtion, light scattering, and Bragg reflection mechanisms obviate the need for a polarizer and associated losses, but have lower (about 5-10:1) contrast ratios that compromise their quality for monitor applications (Wu and Yang 2001). Different from a reflective display, a transflective display combines conventional and reflective displays. Each pixel incorporates reflective and transmissive sub-pixels, with typically about a 4:1 area ratio (the ratio varies with the intended application; Wu 2003). Thus, transflective displays reflects ambient light when possible and using a supplementary light – either a backlight or frontlight – under low ambient light conditions (see Figure 4-12).
R G B
Polarizer
Retardation Film
Liquid Crystal Layer
Retardation Film
Polarizer
Reflective Electrode
Transparent Electrode
Backlighting System
Figure 4-12: Transflective LCD – Backlit Variant (based on Voutsas and Ishii 2002) Relying on ambient results in large reductions in display power draw; consequently, transflective displays have been used in handheld devices with stringent battery power limitations, such as cell phones and PDAs. Relative to a transmissive (i.e., conventional) LCD, the transflective LCD generally offers similar contrast ratio and color gamut169 under most conditions, excepting higher ambient lighting where it offers distinct advantages such decreased image “washout” (Voutsas and Ishii 2002). At moderate light levels, the reflective and transmissive color pixels can have different levels of color saturation because the light passes through the color filters once in transmission mode and twice in reflective mode (Wu 2003).
169 Color gamut denotes the range of colors that can be realized, i.e., a display with a 50% color gamut can display 50% of colors in a reference standard representative of colors perceived by human sight.
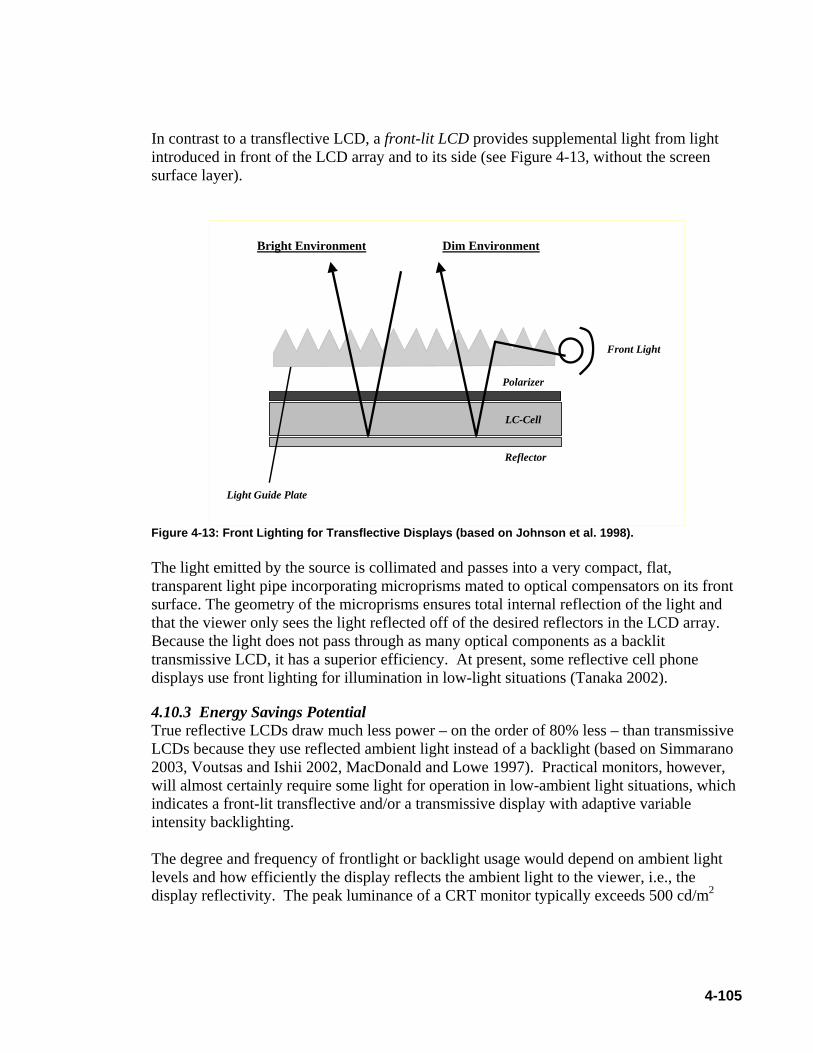
4-105
In contrast to a transflective LCD, a front-lit LCD provides supplemental light from light introduced in front of the LCD array and to its side (see Figure 4-13, without the screen surface layer).
Dim EnvironmentBright Environment
Light Guide Plate
Reflector
LC-Cell
Polarizer
Front Light
Figure 4-13: Front Lighting for Transflective Displays (based on Johnson et al. 1998). The light emitted by the source is collimated and passes into a very compact, flat, transparent light pipe incorporating microprisms mated to optical compensators on its front surface. The geometry of the microprisms ensures total internal reflection of the light and that the viewer only sees the light reflected off of the desired reflectors in the LCD array. Because the light does not pass through as many optical components as a backlit transmissive LCD, it has a superior efficiency. At present, some reflective cell phone displays use front lighting for illumination in low-light situations (Tanaka 2002).
4.10.3 Energy Savings Potential True reflective LCDs draw much less power – on the order of 80% less – than transmissive LCDs because they use reflected ambient light instead of a backlight (based on Simmarano 2003, Voutsas and Ishii 2002, MacDonald and Lowe 1997). Practical monitors, however, will almost certainly require some light for operation in low-ambient light situations, which indicates a front-lit transflective and/or a transmissive display with adaptive variable intensity backlighting. The degree and frequency of frontlight or backlight usage would depend on ambient light levels and how efficiently the display reflects the ambient light to the viewer, i.e., the display reflectivity. The peak luminance of a CRT monitor typically exceeds 500 cd/m2
4-106
(Becker 2003, USDC 2003, product literature), while monitor LCDs170 have substantially lower luminances, ranging from 150-250 cd/m2 (Anandan 2002, IBM 2003). In practice, reflective displays must provide sufficient luminance levels over a wide range of ambient conditions, e.g., Becker (2003) reports that a computer monitor in an office setting will “see” measured (incident) luminance values from 100 cd/m2 (from ceilings and floors) to 30,000 cd/m2 (windows. At the high-end of the ambient illumination range, reflective displays can provide adequate light, while at the lower end of the range they cannot provide enough light. In between these values, the efficacy depends on the precise levels of ambient light and the reflectivity of the display. This suggests that practical reflective displays will need to incorporate a light source. It is not necessary for reflective displays to attain the luminance values of LCD and CRTs. A more reasonable assumption might be that reflective display luminance must equal that of white paper in a well-lit office. Typically, a well-lit office will have lighting of at least 250 lux, which yields a surface luminance of just over 80 cd/m2 for a perfect, diffuse reflector. In this environment, newspapers, magazines and white paper have luminance values of about 40 cd/m2, 50cd/m2, and 64cd/m2, respectively (based on reflectance values of ~55% for newspaper, up to 65% magazines [USDC 2003, Miles et al. 2002] and 80% for white paper [Wu and Yang 2001]) . Most reflective displays have significantly lower reflectance than these materials (see Table 4-59), usually due to the need to incorporate a polarizer and color filters. The display design used to implement color has a large impact on the overall display reflectance. A common approach for LCDs is to use separate red, green and blue sub-pixel regions to create color for each pixel. This design can use light from only one region to display a pure color, which results in at least a 66% decrease in display reflectance171. At least two approaches, multiple (stacked) color layers and micro-lens assemblies, exist that do not suffer from this shortfall (USDC 2003). Stacked layers, however, increase the cost of the display because it increases the number of LCD arrays, each of which also requires separate drive electronics. An energy savings potential range exists for reflective displays, bounded by two scenarios. In the low-energy (reflective) case, the display does not require supplemental lighting and driver electronics account for all energy consumption. This suggests active mode power reductions on the order of 80% (see Section 4.10.2). In the high-energy scenario, an edge- or front-light continuously illuminates the display to provide light levels equal to those provided by paper in a well-lit office or a conventional (transmissive) LCD. As shown in Table 4-59, most reflective LCDs do not approach the reflectance values of white paper and will require front lighting in a well-lit office to achieve lighting levels equivalent to that of paper. Achieving transmissive LCD luminance values would require roughly three times the power levels indicated in Table 4-59.
170 Notebook PC LCDs typically have higher luminance values in the direction of the viewer than monitor LCDs because they focus the light
over a limited viewing angle (USDC 2003). 171 The losses will also depend on the percentage of the display area covered by reflective surfaces, i.e., the reflective aperture ratio, which
can range from less than 70% in transmissive displays to 90% in purely reflective displays (Voutsas and Ishii 2002).

4-107
Table 4-59: Estimates of Front Light Power Required for Different Display Technologies for a Front-Lit LCD
Monitor Frontlight Power Draw, 17-inch Monitor172 [W] Reflective Display Type
Peak Reflectance, Photopic [%; from
Crawford 2002a]
Multiplier to Equal White
Paper Reflectance White Paper – 64
cd/m2 200 cd/m2
White Paper 80% N/A N/A N/A Magazine 60-65% N/A N/A N/A Twisted Nematic <10% [4%173] 8 – 20 10 – 26 35 – 90 Super Twisted Nematic <10%174 [4.2%175] 8 – 19 10 – 28 35 – 85 Guest Host 35% 2.3 2 9 PDLC 12-15% 5 – 7 6 – 8 23 –29 H-PDLC 15-30% 3 – 5 2 – 6 11 – 23 MTN ~30%176 2.7 2 11 Cholesteric 40% 2 1 8
Reflective display technologies with a reflectance of 10% or greater can achieve white paper luminance values (at 250 lux) with additional frontlight power significantly less than the ~28W required for a transmissive LCD backlight. This is possible because a reflective display has a significantly lower target luminance value than a transmissive LCD and combined efficiency of the front light-light pipe- LCD reflectance exceeds the ~4% light transmission efficiency. On the other hand, only displays with a reflectance in excess of about 15% can achieve luminance values similar to that of transmissive LCDs while reducing monitor active power draw. All reflective display-based monitor power draw and energy saving calculations (see Tables 4-60 and 4-61) embody four assumptions:
1. All monitors are 17-inch monitors; 2. All reflective displays have the same power draw in sleep and off modes as current
LCDs; 3. Backlighting and driver electronics account for 80% and 20% of baseline LCD
monitor active mode power draw, respectively (Simmarano 2003); 4. The driver electronics power draw remains constant while the backlight component
changes for each approach studied.
172 Assumes a light pipe efficiency of 50% (Anandan 2002), similar reflectivity as for ambient light, a CCFL lamp efficacy of 45 lm/W, a power
supply efficiency of 70%, and a viewable area of 304.1mm x 228.0mm (viewable area from: http://compare.HitachiDisplays.com/hitachidisplays/productinfo.jsp?id=741 ).
173 For a “common eBook” (USDC 2003). 174 Joubert et al. (2002) claim a reflectance of 30-35% at normal incidence. 175 For a “common PDA” (USDC 2003). 176 Based on a reflective display manufactured by Sharp in 2.5-inch to 8.4-inch sizes (Yu 2003).

4-108
Table 4-60: Energy Saving Calculations for Reflective LCD Monitors
Power Draw [W] Display Type Active Sleep Off
Source
CRT 61 2 1 LCD 35 2 2
Roberson et al. (2002)
Reflective (R=20%) – Front Lit [to 200 cd/m2]
24 2 2
Reflective (R=20%) – Front Lit [to 64 cd/m2]177
11 2 2
Guest Host (R=35%) – Front Lit [to 200 cd/m2]
16 2 2
Purely Reflective – No Front Light 7 2 2
Roberson et al. (2002) for “sleep” and “off” modes
Table 4-61: National Energy Impact of Reflective LCD
Display Type AEC [TWh] CRT Monitors 13.1 LCD Monitors 7.9 Reflective Monitors (R=20%) – Front Lit [to 200 cd/m2] 5.6 Guest Host Monitors (R=35%) – Front Lit [to 200 cd/m2] 4.0 Reflective Monitors (R=20%) – Front Lit [to 64 cd/m2] 3.0 Purely Reflective Monitors 2.1
Overall, reflective displays could reduce monitor national annual energy consumption by up to 11TWh relative to the installed base of monitors, or up to 6TWh relative to current transmissive LCDs. Increasing LCD reflectance while maintaining image quality is the key to obtaining the lowest possible active mode power draws. Cholesteric displays appear to have very high reflectivity because they do not require a polarizer; they are discussed in a separate section (Section 4.2). In addition, guest host liquid crystals, polymer dispersed liquid crystals (PDLCs) and holographic polymer dispersed liquid crystals (HPDLCs) have higher reflectance values than typical twisted nematic (TN) and super twisted nematic (STN) liquid crystals. All three remain in a developmental state and are discussed further in the barriers section. Recently, researchers have made progress in increasing the reflectance of TN and STN reflective displays. For instance, Fujimori et al. (2002) developed a color transflective TFT-LCD than integrates both transparent (to allow the backlight to pass) and reflective pixels into each pixel; as USDC (2003) notes, this is the most common manner of implementing transflective displays due to its relative ease-of-manufacture. For a 2-inch display (120x160), their approach yielded ~22% reflectance (relative to MgO standard white) and a ~3.3% transmittance. Some reflective LCDs used in handheld devices also report higher reflectance values than noted earlier, for example, the Sharp “High Reflectance TFT-LCD” claims 40%. However, they typically achieve these values by focusing light over a very limited viewing angle, a strategy that does not translate well to fixed devices such as monitors (USDC 2003).
177 Same as white paper luminance under 250 lux illumination.
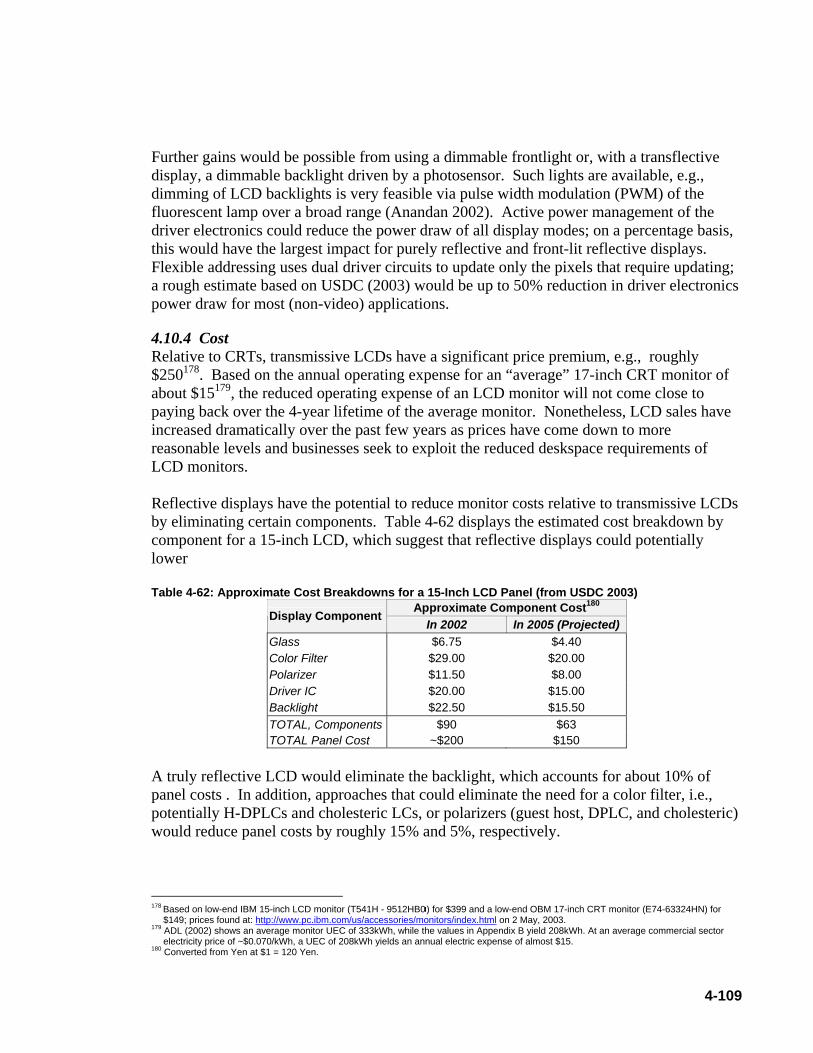
4-109
Further gains would be possible from using a dimmable frontlight or, with a transflective display, a dimmable backlight driven by a photosensor. Such lights are available, e.g., dimming of LCD backlights is very feasible via pulse width modulation (PWM) of the fluorescent lamp over a broad range (Anandan 2002). Active power management of the driver electronics could reduce the power draw of all display modes; on a percentage basis, this would have the largest impact for purely reflective and front-lit reflective displays. Flexible addressing uses dual driver circuits to update only the pixels that require updating; a rough estimate based on USDC (2003) would be up to 50% reduction in driver electronics power draw for most (non-video) applications.
4.10.4 Cost Relative to CRTs, transmissive LCDs have a significant price premium, e.g., roughly $250178. Based on the annual operating expense for an “average” 17-inch CRT monitor of about $15179, the reduced operating expense of an LCD monitor will not come close to paying back over the 4-year lifetime of the average monitor. Nonetheless, LCD sales have increased dramatically over the past few years as prices have come down to more reasonable levels and businesses seek to exploit the reduced deskspace requirements of LCD monitors. Reflective displays have the potential to reduce monitor costs relative to transmissive LCDs by eliminating certain components. Table 4-62 displays the estimated cost breakdown by component for a 15-inch LCD, which suggest that reflective displays could potentially lower Table 4-62: Approximate Cost Breakdowns for a 15-Inch LCD Panel (from USDC 2003)
Approximate Component Cost180 Display ComponentIn 2002 In 2005 (Projected)
Glass $6.75 $4.40 Color Filter $29.00 $20.00 Polarizer $11.50 $8.00 Driver IC $20.00 $15.00 Backlight $22.50 $15.50 TOTAL, Components $90 $63 TOTAL Panel Cost ~$200 $150
A truly reflective LCD would eliminate the backlight, which accounts for about 10% of panel costs . In addition, approaches that could eliminate the need for a color filter, i.e., potentially H-DPLCs and cholesteric LCs, or polarizers (guest host, DPLC, and cholesteric) would reduce panel costs by roughly 15% and 5%, respectively.
178 Based on low-end IBM 15-inch LCD monitor (T541H - 9512HB0) for $399 and a low-end OBM 17-inch CRT monitor (E74-63324HN) for
$149; prices found at: http://www.pc.ibm.com/us/accessories/monitors/index.html on 2 May, 2003. 179 ADL (2002) shows an average monitor UEC of 333kWh, while the values in Appendix B yield 208kWh. At an average commercial sector
electricity price of ~$0.070/kWh, a UEC of 208kWh yields an annual electric expense of almost $15. 180 Converted from Yen at $1 = 120 Yen.

4-110
Different reflective approaches could, however, increase other component costs or possibly require additional components. For example, a promising way to produce a high-reflectance display is to use three color layers instead of a single layer that reflects RGB in sub-pixel regions (the three-layer approach increases reflectance ~three fold; color cholesteric and guest host LCDs will likely use this approach [Wu 2003]). This increases the complexity and cost of the reflector layer, including drive electronics. Another promising approach is to use a microlens to separate RGB components and focus them on the desired portions of the LCD array. This enables greater use of the incident light without using multiple layers. Although projectors use this approach, it has yet to be successfully applied in displays with diffuse light sources (USDC 2003). Ultimately, costs will also depend upon the manufacturing techniques that develop for different approaches and the ability of manufacturers of LCDs to leverage prior manufacturing techniques and equipment for other approaches. Some reflective LCDs suffer from manufacturing issues that prevent cost-effective manufacturing. MTN LCDs, for example, require a cell gap of ~2.5mm compared to a typical gap of ~4mm for conventional LCDs. Maintaining a smaller gap increases the difficulty of manufacturing a display, particularly larger displays181, and increases display cost. Over time, advances in manufacturing technology should improve the potential to produce LCDs with smaller gaps. Alternatively, a display could use a lower birefringence material that increases the gap size (Wu 2004).
4.10.5 Perceived Barriers to Market Adoption of Technology To achieve commercial viability in monitor applications, a reflective display needs to provide sufficient display quality. Key attributes include adequate contrast ratio, resolution, switching speeds, viewing angle, gray scale, and color gamut. All reflective LCD display approaches suffer from display quality issues that currently impede their market potential (see Table 4-63).
181 This is reason why projection devices use MTN but monitors do not (Wu 2004).
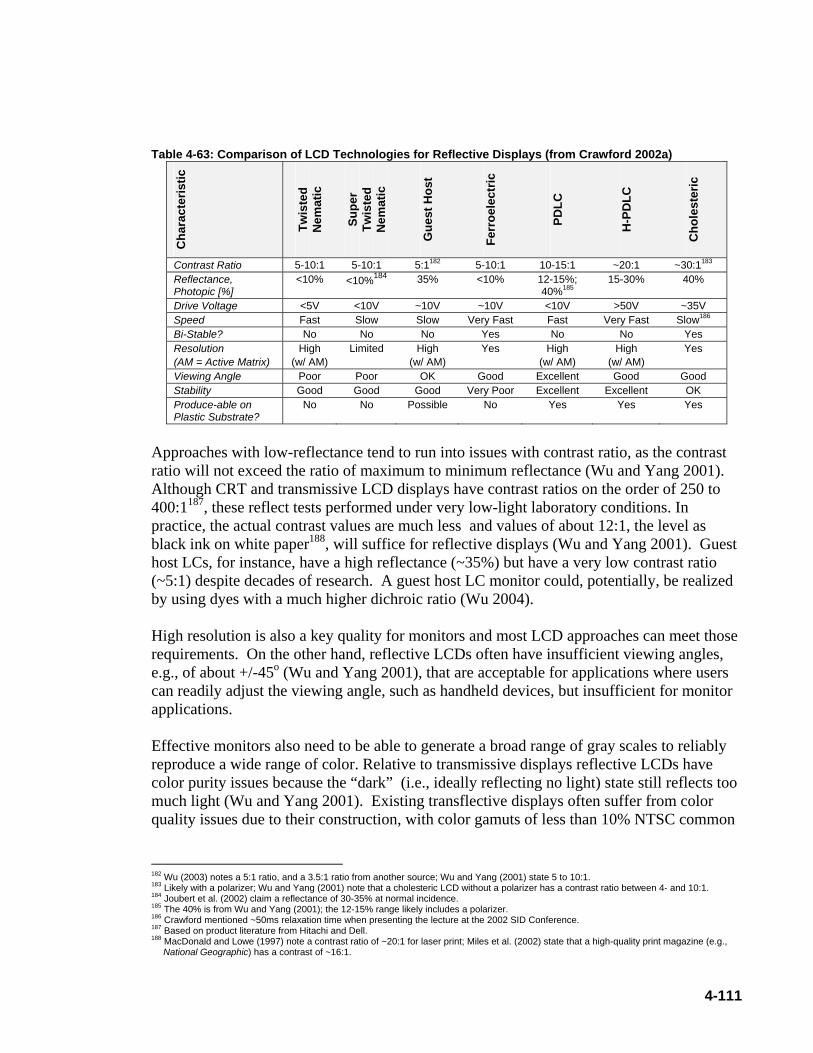
4-111
Table 4-63: Comparison of LCD Technologies for Reflective Displays (from Crawford 2002a)
Cha
ract
eris
tic
Twis
ted
Nem
atic
Supe
r Tw
iste
d N
emat
ic
Gue
st H
ost
Ferr
oele
ctric
PDLC
H-P
DLC
Cho
lest
eric
Contrast Ratio 5-10:1 5-10:1 5:1182 5-10:1 10-15:1 ~20:1 ~30:1183 Reflectance, Photopic [%]
<10% <10%184 35% <10% 12-15%; 40%185
15-30% 40%
Drive Voltage <5V <10V ~10V ~10V <10V >50V ~35V Speed Fast Slow Slow Very Fast Fast Very Fast Slow186 Bi-Stable? No No No Yes No No Yes Resolution (AM = Active Matrix)
High (w/ AM)
Limited High (w/ AM)
Yes High (w/ AM)
High (w/ AM)
Yes
Viewing Angle Poor Poor OK Good Excellent Good Good Stability Good Good Good Very Poor Excellent Excellent OK Produce-able on Plastic Substrate?
No No Possible No Yes Yes Yes
Approaches with low-reflectance tend to run into issues with contrast ratio, as the contrast ratio will not exceed the ratio of maximum to minimum reflectance (Wu and Yang 2001). Although CRT and transmissive LCD displays have contrast ratios on the order of 250 to 400:1187, these reflect tests performed under very low-light laboratory conditions. In practice, the actual contrast values are much less and values of about 12:1, the level as black ink on white paper188, will suffice for reflective displays (Wu and Yang 2001). Guest host LCs, for instance, have a high reflectance (~35%) but have a very low contrast ratio (~5:1) despite decades of research. A guest host LC monitor could, potentially, be realized by using dyes with a much higher dichroic ratio (Wu 2004). High resolution is also a key quality for monitors and most LCD approaches can meet those requirements. On the other hand, reflective LCDs often have insufficient viewing angles, e.g., of about +/-45o (Wu and Yang 2001), that are acceptable for applications where users can readily adjust the viewing angle, such as handheld devices, but insufficient for monitor applications. Effective monitors also need to be able to generate a broad range of gray scales to reliably reproduce a wide range of color. Relative to transmissive displays reflective LCDs have color purity issues because the “dark” (i.e., ideally reflecting no light) state still reflects too much light (Wu and Yang 2001). Existing transflective displays often suffer from color quality issues due to their construction, with color gamuts of less than 10% NTSC common
182 Wu (2003) notes a 5:1 ratio, and a 3.5:1 ratio from another source; Wu and Yang (2001) state 5 to 10:1. 183 Likely with a polarizer; Wu and Yang (2001) note that a cholesteric LCD without a polarizer has a contrast ratio between 4- and 10:1. 184 Joubert et al. (2002) claim a reflectance of 30-35% at normal incidence. 185 The 40% is from Wu and Yang (2001); the 12-15% range likely includes a polarizer. 186 Crawford mentioned ~50ms relaxation time when presenting the lecture at the 2002 SID Conference. 187 Based on product literature from Hitachi and Dell. 188 MacDonald and Lowe (1997) note a contrast ratio of ~20:1 for laser print; Miles et al. (2002) state that a high-quality print magazine (e.g.,
National Geographic) has a contrast of ~16:1.

4-112
for existing products189 as compared to at least 50% for most LC monitors (USDC 2003). Light produced in the reflective and transmissive modes generate somewhat different colors because the backlight passes through color filters once while reflected light passes through them twice. USDC (2003) indicates that stacked H-PDLCs have the potential to significantly improve color gamut, although their manufacturability remains uncertain. In addition, problems arise because the reflected and transmissive modes have inverted images, which leads to the display of both images if the backlight operates in the presence of similar levels of ambient light, degrading image contrast. The reflective polarizer can also cause parallax to occur in the reflective mode, limiting image resolution (Wu and Yang 2001). Lastly, a gray film that absorbs unwanted light passing through the reflective polarizer (in the dark pixel state) creates additional backlight losses. Reflective monitors will require supplementary lighting to operate at low-light conditions. Front-lit reflective displays have a greater energy savings potential than transflective displays) because they cover a greater portion of the display area with reflectors to make greater use of ambient light. Clearly, an efficient and low-cost front-light system is crucial to the commercialization of monitor-sized reflective displays. Moderate-sized front-lit displays have suffered from image quality issues to date, for example, the wave guide of one front-lit display scatters excessive light and causes the contrast ratio to suffer (Sharp’s reflective LCD; Wu 2004). Finally, no standard procedure for the evaluation of the effectiveness of reflective displays exists. This inhibits meaningful comparisons of different displays (Becker 2003). In large part, this is due to the wide range of applications and operating conditions for reflective displays. For instance, reflective displays need provide readable display over a wide range of ambient conditions, e.g., in an office setting, a monitor will “see” measured luminance values from 100cd/m2 (from ceilings and floors) to 30,000 cd/m2 (windows; Becker 2003). The characteristics of reflective displays can also vary substantially with the incident angle of incoming light and the viewing angle, both of which further may depend on the spectra of the incident light sources. A development of a standardized test procedure that coincides with displays perceived to offer high viewing quality would provide useful common metrics to enable consumers to reliably asses reflective display image quality.
4.10.6 Technology Development “Next Steps” Reflector design has been – and remains – a topic of broad and intense research within the display industry. It is probable that short-term development of reflective LCDs will continue to focus on portable applications, where the reduced power draw offers the greatest benefit, i.e., longer battery usage and reduced device profile and weight. Promising avenues for future research include development of: • Cost-effective LCD-based reflective displays that do not require a polarizer, i.e., guest
host, MTN, PDLCs, and can achieve the required contrast ratio, switching speed, and color gamut for monitor applications; and
189 USDC (2003) notes that cholesteric dyes in TN-LCs could help to improve color gamut somewhat, although not to the level obtained in
transmissive LCDs.

4-113
• Efficient front-light optics that do not appreciably impair display quality.
4.10.7 References Amundson, K., 2003, “Toward Electronic Paper”, Society for Information Display: Seminar
Lecture Notes: Volume II, 23 May, Baltimore, pp. F-3/1 - F-3/42. Becker, M.E., 2003, “Reflections on Measurement Methods”, Information Display,
February, pp. 14-18. Crawford, G.P., 2002a, “Liquid-Crystal Technology”, Society for Information Display:
Seminar Lecture Notes: Volume I, 24 May, Boston, pp. M-2/1- M-2/28. Crawford, G.P., 2002b, Personal Communication, Brown University, October. Escutie, M. and G. Crawford, 2002, “Tailoring Morphology in Holographic-Polymer
Dispersed Liquid Crystals for Reflective Display Applications”, Society for Information Display, 2002 International Symposium – Digest of Technical Papers, Volume XXXIII, Number I, pp. 550-553.
Fujimori, K., Y. Narutaki, Y. Itoh, N. Kimura, S. Mizushima, Y. Ishii, and M. Hijikigawa, 200, “New Color Filter Structures for Transflective TFT-LCD”, Society for Information Display, 2002 International Symposium – Digest of Technical Papers, Volume XXXIII, Number II, pp. 1382-1385.
IBM, 2003, “T541H 15.0 inch Black Hybrid Flat Panel Monitor”, Product Information, downloaded on 30 April, 2003 from: https://www-132.ibm.com/webapp/wcs/stores/servlet/ProductDisplay?catalogId=-840&storeId=1&productId=2542728&langId=-1&dualCurrId=73 .
Johnson, K., S. Fujita, L. Schaefer, and H. Koseki, 1998, “The Trends on the Color and Gray Reflective LCDs for Future Electronic Paper”, SID Digest.
Joubert, C., J. Angele, A. Boissier, P. Davi, I. Dozov, T. Elbhar, B. Pecout, D. Stoenescu, R. Vercelletto, and P. Martinot-Lagarde, 2002, “Ultra Low Power Bright Reflective Displays Using BiNem® Technology Fabricated by Standard Manufacturing Equipment”, Society for Information Display, 2002 International Symposium – Digest of Technical Papers, Volume XXXIII, Number 1, pp. 30-33.
Kawamoto, H., 2002, "The History of Liquid-Crystal Displays", Proceedings of the IEEE, vol. 90, no. 4, April, pp. 460-500.
Kim, M.-K., Y.-G. Mo, S.-H. Jeong, and W.-S. Choi, 2002, “Low Driving Voltage of Cholesteric Liquid Crystal Displays”, Society for Information Display, 2002 International Symposium – Digest of Technical Papers, Volume XXXIII, Number I, pp. 543-545.
Lovins, A.B. and H.R. Heede, 1990, “Electricity-Saving Office Equipment”, Technical Subreport from COMPITITEKSM, September.
MacDonald, L.W. and A.C. Lowe, 1997, Display Systems: Design and Applications. John Wiley & Sons, Ltd: Chichester, England.
Miles, M., E. Larson, C. Chui, M. Kothari, B. Gally, and J. Batey, 2002, “Digital PaperTM for Reflective Displays”, Society for Information Display, 2002 International Symposium – Digest of Technical Papers, Volume XXXIII, Number I, pp. 115-117.
Pitt, M.G., R.W. Zehner, K.R. Amundson, and H. Gates, 2002, “Power Consumption of Micro-Encapsulated Electrophoretic Displays for Smart Handheld Appliances”,

4-114
Society for Information Display, 2002 International Symposium – Digest of Technical Papers, Volume XXXIII, Number II, pp. 1378-1381.
Qi, J., L. Li, M. De Sarkar, and G.P. Crawford, 2002, “Optical Characterization of Reflective Holographic Polymer Dispersed Liquid Crystals”, Society for Information Display, 2002 International Symposium – Digest of Technical Papers, Volume XXXIII, Number I, pp. 538-541.
Semenza, P., 2002, Personal Communication, iSuppli/Stanford Resources, October. Simmarano, R., 2003, “Rethinking the PC”, Information Display, January, pp. 12-15. Sugiura, N., K. Tashiro, K. Ohmuro, and Y. Koike, 2002, “A Novel Vertically Aligned
Reflective-Color TFT-LCD with High Contrast Ratio”, Society for Information Display, 2002 International Symposium – Digest of Technical Papers, Volume XXXIII, Number 1I, pp. 1386-1389.
Tanaka, A., 2002, “Technical Trends of Front-Lighting Systems in Reflective Color LCD Modules”, Society for Information Display, 2002 International Symposium – Digest of Technical Papers, Volume XXXIII, Number 1I, pp. 1240-1243.
Uchida, T., 2002, “Reflective LCDs”, Society for Information Display: Seminar Lecture Notes: Volume I, 24 May, Boston, pp. F-2/1- F-2/50.
USDC, 2003, “The Global Flat Panel Display Industry ‘2003’: An In-Depth Overview and Roadmap on FPD Technologies, Markets, Manufacturing, and Materials”, U.S. Display Consortium.
Voutsas, T. and Ishii, Y., 2002, “Fundamentals of AMLCDs”, Society for Information Display: Seminar Lecture Notes: Volume I, 24 May, Boston, pp. M-3/1-M-3/60.
USDC, 2003, “The Global Flat Panel Display Industry ‘2003’: An In-Depth Overview and Roadmap on FPD Technologies, Markets, Manufacturing, and Materials”, U.S. Display Consortium.
Werner, K., 2002, “Eighth Annual Display of the Year Awards”, Information Display, December, pp. 12-15.
Wu, S.-T. and D.-K. Yang, 2001, Reflective Liquid Crystals, John Wiley & Sons, Ltd.: Chichester, UK.
Wu, S.-T., 2003, “Reflective and Transflective LCDs”, Society for Information Display: Seminar Lecture Notes: Volume II, 23 May, Baltimore, pp. F-4/1-F-4/54.
Wu, S.-T., 2004, Personal Communication, University of Central Florida, School, of Optics, March.
4.11 Server Computer Power Management
4.11.1 Summary Most server computers experience significant fluctuations in demand. Unlike personal computers, however, server computers typically do not use power management (PM) to reduce server energy consumption during periods of decreased use. The potential exists to power down or off a significant portion of server computers used in offices when workloads decrease after the workday, i.e., at night and on weekends. Continuous PM strategies that scale server microprocessor operating voltage/frequency in response to server demand can reduce the energy consumed by servers in many applications during periods of reduced

4-115
demand. Furthermore, load-balancing continuous PM strategies can reduce the overall energy consumption of server arrays (e.g., in data centers) by focusing the load on a subset of servers while powering down other servers. Together, these approaches could reduce overall server AEC by roughly 30 percent. On the other hand, significant barriers to all server PM approaches exist. In general, personnel managing servers are very sensitive about powering down or off servers because they feel that the risk of compromising server performance or access far outweighs the perceived gain from energy savings. In addition, most existing servers are not designed to implement PM systems and existing PM specifications developed for PCs may not be appropriate for servers. Finally, several continuous PM strategies feature frequent “spin up and down” of disks, but current server disks do not have the required mechanical integrity to handle the expected cycling levels. Overall, both server users and manufacturers need to be convinced that server PM offers sufficient value to make the changes in server management, operational, and design practices needed to enable widespread commercial application of server PM. Table 4-64: Summary of Server Power Management
Characteristic Result Comments
Technical Maturity and Technology Development Stage Current
• Night shut-off current • Intel has recently incorporated demand-based
switching190 for processors used in servers and workstations; similar strategies applied in laptop PCs
Basic Science Research
Applied Research
Exploratory Development
Advanced Development
Engineering Development
Product Demonstration
Commerciali-zation
Systems Impacted by Technology Server Computers Relevant Electricity Consumption (TWh) 10 Not applied to data storage
Technical Energy Savings Potential (TWh / [quads])
3 [0.03]
Low-end servers account for about 50% of savings; savings potentials for higher-class servers have large uncertainties because of lack of usage data
Cost Impact of Technology Likely low Performance Benefits of Technology Enhanced reliability from decreased loading and operating time Notable Developers/Manufacturers of Technology
IBM, Intel, Amphus, Dell
Peak Demand Reduction Yes Moderate due to greater daytime server demand
Other Environmental Impacts Load diversity-based management of tasks could potentially reduce number of servers purchased relative to baseline
Most Promising Applications Low-end web and file servers
Technology “Next Steps”
• Development of ACPI-compatible hardware drivers and BIOS software for servers
• Assess ability of servers to endure more frequent spin up and down of drives
• Field tests to assess issues that may arise from server power management, e.g., impact on expected service (i.e., lag time)
4.11.2 Background and Performance Impact Server computers are designed to be available 24 hours, seven days per week. Some servers types, mainly the “mid-range” and “high-end”, commonly are utilized 24 hours per day. 190 See: http://www.intel.com/pressroom/archive/releases/20040628comp.htm .

4-116
These devices are typically used to manipulate corporate data (e.g., to generate bills). On the other hand, lower-range server computers often serve in applications where they operate well below their maximum capacity for significant periods. Examples include web servers and corporate file and e-mail servers. In order to keep these devices ready for use, they remain in an active state and consume close to the typical “average” power draw during these periods. Similar to PC power management (PM) approaches, server PM takes advantage of the prolonged periods of relatively low usage to save energy by powering down unneeded components or, in server clusters, to “focus” server demand on a smaller group of servers and power down excess server unit capacity. Corporate file servers exhibit wide usage variations, with particularly low average usage during night and weekend hours. Studies of small- and medium-sized companies in Switzerland (Huser 2002; Gubler and Peters 2000) found that approximately 90% of companies leave servers on during weekends and holidays and 94% leave servers on all night during the week. They also found that about 25% of active servers are not used at all during the night, that around 65% of servers left on at night needed three hours or less to complete their tasks, and that only about 50% of active servers were used at all on weekends. Taken as a whole, this suggests that corporate server systems are viable candidates for energy savings by powering inactive servers down or off at night and over weekends. Web servers also show large usage variations and often exhibit significant periods of low usage (Iyengar et al. 1999). Figure 4-14 shows the general usage trend associated with a global web-site during a typical day. As shown, servers in practice experience sporadic peaks (see Figure 4-15). Similarly, demand data suggest that average usage varies by a factor of three and in extreme cases usage can vary by a factor of eleven during a given day (see Figure 4-16; from Case et al. 2001). In the case of retail web servers, peak demand generally occurs during the two-month period at the end of the year coinciding with the Christmas shopping season (Bohrer et al. 2001).

4-117
Figure 4-14: Average Usage Profile for a Global Web-site (from Killelea 2002)
Figure 4-15: Representative Web Server Demand Fluctuations (from Killelea 2002)

4-118
Figure 4-16: Request Rate for the IBM.com Website (from Chase et al. 2001) The wide range in server usage clearly presents an energy saving opportunity for server clusters. Importantly from the perspective of power management (PM), the data suggest that large swings in server demand generally occur over fairly long timescales. Because average usage changes appreciably on the scale of minutes, not seconds191, a PM algorithm can successfully power up and down server components. This provides the ability to respond effectively to significant changes in server usage. For example, processors have a wakeup sequence duration on the order of 1.5 milliseconds (Elnozahy et al. 2003). Table 4-65 summarizes three different classes of PM for server computers exhibiting large variations in load. This approach would not yield appreciable energy savings for servers that continuously process data, such as mid-range and high-end servers. Table 4-65: Types of Server Power Management
Server PM Type Description Component Power Down Powering down selected server components, e.g.,
spinning down one or more hard drive or scaling down the voltage/frequency of processors
Server Sleep/Off Powering down or turning off servers during periods expected to have little or no server usage
Load Balancing Focusing the aggregate server load to a subset of servers in a server array/cluster to enable powering down or off unneeded servers
The “server component power down” and “server sleep/off” strategies apply basic power-down (sleep and hibernate) principles similar to those applied to portable computer power management. Instead of being directly activated by sensing activity, servers might activate 191 Server arrays use a variety of load-balancing strategies (implemented in software) to manage server resources in response to short-term
spikes in server demand, enabling the servers to maintain adequate response times (Kalaher 2003).
4-119
upon receipt of “special wake packets” or “wake-on-LAN packets” (e.g., per Chase and Doyle 2001). Researchers have modeled and tested operating protocols to reduce server energy consumption based on all three strategies presented in Table 4-65. “Energy conscious provisioning,” for example, is an algorithm that tracks time-averaged server farm usage (e.g., as measured by defined as requests per second) over time and determines the number of servers required to meet average demand (Doyle et al. 2001). In response to changes in demand, this algorithm uses combinations of three operational schemes: • Independent Voltage Scaling192 (IVS) : The algorithm scales the voltages of processors
on individual servers up and down in response to load changes to reduce processor power draw during period of low demand (processor power scales with voltage squared193);
• Coordinated Voltage Scaling (CVS): The algorithm scales microprocessor voltages across several servers in a cluster in a coordinated way to reduce cluster power draw (Elnozahy et al. 2002; Rajamony and Bianchini 2002), and
• Vary-On Vary-Off (VOVO): The algorithm turns on and off servers in response to load to reduce the number of servers operating at one point in time.
The same parties also have explored combinations of these three approaches (see, e.g., Elnozahy et al. 2002). Additionally, groups have explored a technique that intermittently powers down portions of servers during periods of relatively lower server demand called “request batching.” In this approach, when demand lags, servers accumulate multiple data packets in memory until a specified time period has elapsed. During this accumulation period, the server operates in lower-power modes to increase the duration of lower-power mode operation. The technique also can switch processors to a “deep sleep” mode when the server has no queued requests for processing. Researchers have explored combinations of these techniques to provide active power management of web servers while maintaining a performance level194 that does not appreciably degrade client-perceived response times (CPRT; Elnozahy et al. 2003). To accomplish this goal, the control software decreases server performance (voltage and frequency) to save more energy when the CPRT falls below the threshold. Conversely, when the CPR exceeded the threshold, the control software increases server performance. In addition to saving energy, power management decreases the average heat dissipated by servers, which enables denser deployment of equipment in data centers and other venues with high server densities. This, in turn, reduces the square footage and associated building (and other infrastructure) costs to deliver a required level of service (Bohrer et al. 2001). Regular shutting down and re-booting servers may also increase operating system stability (see, for instance, Huser 2002). 192 Similar to the “Dynamic Voltage Scaling” described in Elnozahy et al. (2003). 193 One blade server manufacturer also scales fan speeds in response to microprocessor speeds (LaVerdiere 2003). Gabel (2002a) estimates that fans account for ~7% of a 2RU low-end server (~10% taking into account power supply efficiency). 194 Their procedure specified that the servers must respond to 90% of requests within 50ms; according to Elnozahy et al. (2003), “most service level agreements are crafted based on a percentile goal.”
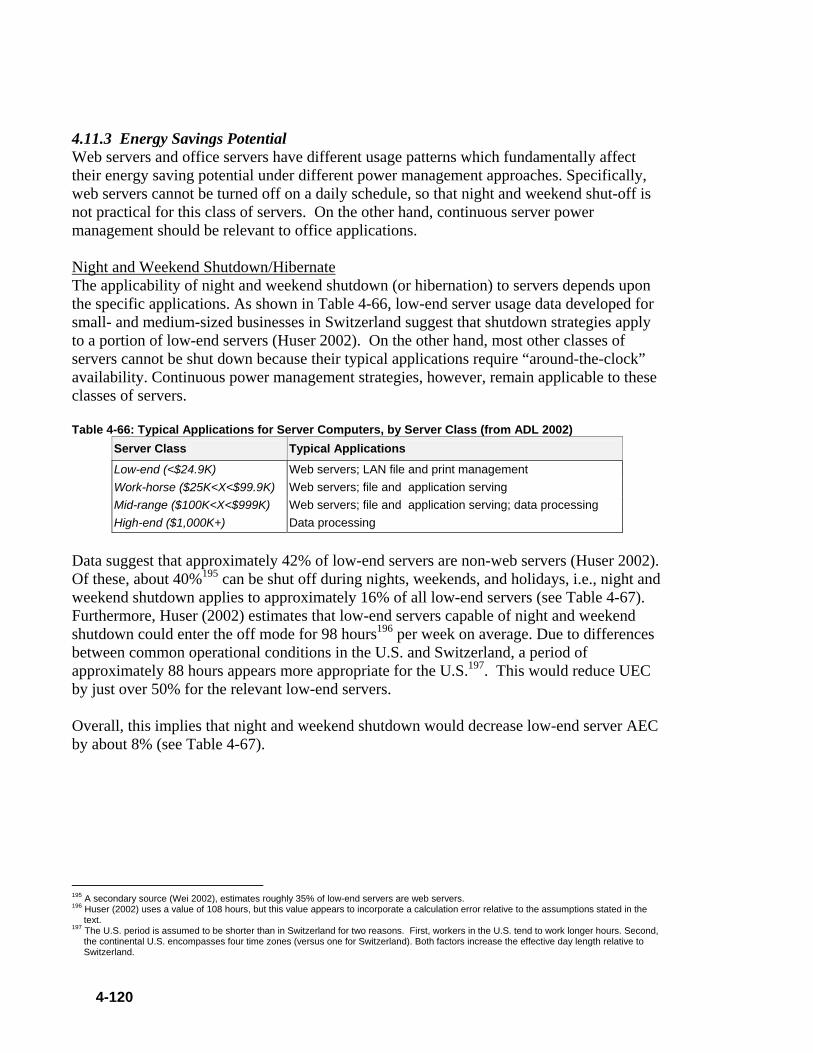
4-120
4.11.3 Energy Savings Potential Web servers and office servers have different usage patterns which fundamentally affect their energy saving potential under different power management approaches. Specifically, web servers cannot be turned off on a daily schedule, so that night and weekend shut-off is not practical for this class of servers. On the other hand, continuous server power management should be relevant to office applications. Night and Weekend Shutdown/Hibernate The applicability of night and weekend shutdown (or hibernation) to servers depends upon the specific applications. As shown in Table 4-66, low-end server usage data developed for small- and medium-sized businesses in Switzerland suggest that shutdown strategies apply to a portion of low-end servers (Huser 2002). On the other hand, most other classes of servers cannot be shut down because their typical applications require “around-the-clock” availability. Continuous power management strategies, however, remain applicable to these classes of servers. Table 4-66: Typical Applications for Server Computers, by Server Class (from ADL 2002)
Server Class Typical Applications
Low-end (<$24.9K) Web servers; LAN file and print management Work-horse ($25K<X<$99.9K) Web servers; file and application serving Mid-range ($100K<X<$999K) Web servers; file and application serving; data processing High-end ($1,000K+) Data processing
Data suggest that approximately 42% of low-end servers are non-web servers (Huser 2002). Of these, about 40%195 can be shut off during nights, weekends, and holidays, i.e., night and weekend shutdown applies to approximately 16% of all low-end servers (see Table 4-67). Furthermore, Huser (2002) estimates that low-end servers capable of night and weekend shutdown could enter the off mode for 98 hours196 per week on average. Due to differences between common operational conditions in the U.S. and Switzerland, a period of approximately 88 hours appears more appropriate for the U.S.197. This would reduce UEC by just over 50% for the relevant low-end servers. Overall, this implies that night and weekend shutdown would decrease low-end server AEC by about 8% (see Table 4-67).
195 A secondary source (Wei 2002), estimates roughly 35% of low-end servers are web servers. 196 Huser (2002) uses a value of 108 hours, but this value appears to incorporate a calculation error relative to the assumptions stated in the
text. 197 The U.S. period is assumed to be shorter than in Switzerland for two reasons. First, workers in the U.S. tend to work longer hours. Second,
the continental U.S. encompasses four time zones (versus one for Switzerland). Both factors increase the effective day length relative to Switzerland.

4-121
Table 4-67: Impact of Night and Weekend Shutdown on Low-End Server Energy Consumption
Characteristic Value Percentage of Office Servers 42% % of Office Servers for Night/Weekend Shutdown 40%
Characteristic Baseline Night and Weekend Shutdown
Active Hours / Week 168 80 UEC [kWh] 1,100 525 Low-End Server AEC [TWh] 4.5 4.1
Continuous Server Power Management This category includes both voltage scaling (IVS and CVS) strategies discussed in Section 4.11.2, as well as the “vary-on vary-off” (VOVO) strategies for individual machines and server clusters. Fully powered down, i.e., in a “hibernate” mode, a low-end server can draw under ten watts, which represents at least a ten-fold reduction in power draw from idle mode (Chase et al. 2001, Huser and Grieder 2004). Other data suggest that a processor in “deep sleep” mode draws about 10% of the power of an “active” processor. Table 4-68 summarizes the energy saving potential of different continuous power management strategies applied to web server applications. The actual energy savings realized in a specific application naturally depends on the exact demands of the application. Table 4-68: Energy Savings Potential for Different Continuous Server PM Strategies
Server PM Strategy Energy Savings* [%] (Elnozahy et al. 2003)
Energy Savings* [%] (Elnozahy et al. 2002)
Independent Voltage Scaling (IVS) N/A 19 – 24% Coordinated Voltage Scaling (CVS) 198 25 – 30% 21 – 25% Vary-On Vary-Off (VOVO)199 7 – 21% 38 – 42% VOVO+IVS N/A 46 – 48% VOVO+CVS 35 – 40% 50% *The ranges reflect different server load characteristics
A collaborative study by IBM and Rutgers University has resulted in similar findings (Rajamony and Bianchini 2002). Simple voltage scaling procedures produced energy savings from 20-29%, while the application of a combination of voltage scaling and VOVO resulted in up to 50% savings. Amphus Incorporated, a manufacturer of server management software, has explored incorporating server power management features into web servers to build low-power dense servers (Wei 2002). Their software actively manages traffic for a load-balanced server farm and they claim energy savings of 50 to 75% (Amphus 2002). The basis for this claim, however was not available for evaluation.
198 Dynamic Voltage Scaling approach for Elnozahy et al. (2003). 199 For “Request Batching” approach for Elnozahy et al. (2003).

4-122
Overall, it appears that more advanced continuous server PM strategies can reduce web server UEC by about 40 to 50%. The findings of Gubler and Peters (2000) and Huser (2002) suggest that these strategies may achieve similar reductions for at least 40% of low-end servers in non-web applications (based solely on the powering down server processors at night and during weekends). It follows that continuous server PM strategies could reduce overall low-end server AEC by at least 1.5TWh (see Table 4-69). If continuous strategies achieved similar reductions for all office servers, AEC savings could approach 2TWh. Table 4-69: Energy Savings Potential of Advanced Continuous Power Management Strategies for Low-End Servers
Energy Savings Characteristic Web Servers Office Servers
Percentage of Low-End Servers 58% 42% UEC Reduction 40 – 50% 50% Baseline AEC [TWh] 2.6 1.9 PM AEC [TWh] 1.3 – 1.6 1.5 PM AEC Reduction [TWh] 1.0 – 1.3 0.4
Continuous PM strategies also apply to other servers whose operations involve intermittent loading. For example, corporate file server demand depends on employee work hours, as may the load on other application servers. In addition, many web servers should experience similar patterns of demand variation. Table 4-70 reflects TIAX estimates of the percentage of servers in each class that can realize significant benefit from continuous server PM. It should be noted that actual usage data and performance models for higher-class server power draw are needed to develop more accurate AEC savings potential. The AEC savings potential estimates assume application of the most aggressive PM strategies, i.e., a 45% UEC reduction from both VOVO and CVS. Table 4-70: Energy Savings Potential of Continuous Server PM
Server Class Relevant Percentage
Baseline AEC [TWh]
Server PM Case AEC [TWh]
AEC Reduction [TWh]
Work-horse ($25K<X<$99.9K) 80% 3.3 2.1 1.2200 Mid-range ($100K<X<$999K) 50% 2.0 1.5 0.45 High-end ($1,000K+) 10% 0.4 0.36 0.04
Overall, continuous server PM appears to have the potential to reduce total server AEC by approximately 3TWh, or about 30%.
4.11.4 Cost Powering off servers at specific times of day could be done manually or by network scheduling command. It would, therefore, likely have a low, recurring cost. The cost of load balancing strategies, however, is less apparent and no cost information could be located for this study. Presumably, vendors would demand a cost premium for the implementation of PM server technology. To be attractive to buyers, however, the software would need to offer a quick payback and require minimal maintenance requirements. Alternatively, some
200 1.2 quads = 3.3 quads * 80% of workhorse servers * 45% reduction.
4-123
vendors might incorporate PM functionality for a minimal cost premium to differentiate their product offerings from those of their competitors. Data centers and other sites with large concentrations of servers should be more favorable environments for implementation of load balancing PM strategies. Blade server arrays, notably, face thermal management challenges that could benefit from server PM. In data centers, IT equipment accounts for a significant portion of overall expenses (Elnozahy et al. 2003). The high concentration of computing capability spreads the overhead of managing server PM over a larger population of machines.
4.11.5 Perceived Barriers to Market Adoption of Technology Historically, the server market has emphasized server performance, functionality, and reliability rather than energy consumption (Bohrer et al. 2001). Additionally, conversations with an experienced IT/Network Manager during this study revealed significant reluctance to adoption of either operating strategy. A major concern expressed was potential problems that often occur when network servers are powered down and during re-booting (O’Boyle 2002). Finally, discussions with European server vendors suggest that very few customers have inquired about server power management (Huser and Grieder 2004). Night and Weekend Shutdown Powering down servers introduces availability concerns. Although most individuals do not work during night and weekend periods when the servers would be turned off, it is not uncommon that there would be some need to access the servers during those periods. Maintaining access to information during periods with overall negligible usage but occasional need for information would undermine much of the potential savings. Entering a hibernate mode, which would result in some delay in service, would offer greater flexibility than a complete shutdown. Continuous Server Power Management There are three main impediments to adoption of effective web-server power management. First, although processors can rapidly increase their processing speed, disks are slower to “spin up.” This implies the potential for delays in responding to information request. For example, a very large “spike” in web requests could require rapid response from additional servers to maintain service quality. Companies that rely upon the web to conduct business, particularly e-businesses, may be reluctant to risk compromising customer service for a modest cost savings. Similarly, many server farms and data centers specify minimum quality of service and incur penalties for failing to meet the specified levels. To the extent that potential users of PM software perceive a conflict between application of PM software and meeting their specifications, this will impede the adoption PM software. On the other hand, in some cases activation time delays and the resulting delay in data transmission may render increases in response time undetectable by the average user. Second, most existing servers are not designed to implement PM systems (Huser and Grieder 2004; Huser 202; Bohrer et al. 2001). Personal computers implement power management through ACPI specifications that specify compatibility requirements for:
4-124
hardware component drivers, BIOS software, motherboard hardware and software, and the operating systems software. Huser and Grieder (2004) established the feasibility of implementing some degree of power management for at least one low-end server using a Windows®-based operating system, but notes that very few ACPI-compatible hardware component drivers and BIOS software are available for use in low-end server computers. Furthermore, they state that “sleep modes are not yet fully available” for servers using a Linux operating system. Until these become available, implementation of continuous server PM schemes will remain complicated and fairly customized. In addition, because the current power management specifications were developed primarily for portable (battery-powered) devices, the specifications may require alterations to address the different demands of server computer applications, including more extensive disk access (Bohrer et al. 2001). Third, frequent cycling of hard drives and microprocessors could impact server reliability. Idling of storage disks is necessary to achieve low power draw levels. To support this capability, end-users must purchase equipment that is compatible with the frequent cycling of disks demand imposed PM software. Server disks, however, are not mechanically designed for frequent cycling on and off and increased spinning up and down of the disks could result in premature disk failure (Bohrer et al. 2001; Chase et al. 2001). This concern is particularly relevant to the load management scheme presented by Chase et al. (2001). It should not, however, significantly impede night or weekend shut down/hibernate options. Another potential reliability concern caused by server power management is that cycling of microprocessor power draw varies the temperature in soldered joints, which tends to accelerate joint fatigue (Belady 2004). Global initiatives to eliminate lead use in electronic products, most notably in Europe201, will result in the widespread use of lead-free solders in IT equipment. The thermal-mechanical properties of these new solders are not as well understood by electronics manufacturers as are lead solders, which increases uncertainty about the reliability of the solder joints. Testing is underway202 to better understand the characteristics of potential replacements for lead solder. Finally, Bohrer et al. (2001) note that enterprises have significant and relatively enduring investments in server management software that enterprises will want to maintain those investments. To be attractive, server PM software must readily function with mainstream existing server management software.
4.11.6 Technology Development “Next Steps” • Development of ACPI-compatible hardware component drivers and BIOS software for
server computers to facilitate implementation of continuous server PM schemes.
201 EU (2003) states that “Member States shall ensure that, from 1 July 2006, new electrical and electronic equipment put on the market does
not contain lead, mercury, cadmium, hexavalent chromium, polybrominated biphenyls (PBB) or polybrominated diphenyl ethers (PBDE).” 202 See, for example, work at NIST: http://www.metallurgy.nist.gov/solder/ .

4-125
• Develop server disks that can tolerate the stresses of repeated spin-up. Although current laptop PCs have disk drives capable of frequent cycling, their mean time to failure is roughly an order of magnitude less than that required for server disks (Bohrer et al. 2001), i.e., they have insufficient durability for server PM applications.
• Field testing of continuous server PM schemes to evaluate efficacy and issues that arise in “real-life” applications.
4.11.7 References ADL 2002, “Energy Consumption by Office and Telecommunications Equipment in
Commercial Buildings Volume 1: Energy Consumption Baseline.”, Final Report Prepared for the U.S. Department of Energy, Office of Building Technology, January. Available on-line at: http://www.eere.energy.gov/buildings/documents/pdfs/office_telecom-vol1_final.pdf .
Bohrer, P., Cohn, D., Elnozahy, E., Keller, T., Kistler, M., Lefurgy, C., Rajamony, R., Rawson, F., and Van Hensbergen, E., 2001203, “Energy Conservation for Servers”, IBM Austin Research Laboratory. Available at: http://www.research.ibm.com/arl/projects/papers/energyConservationForServers.pdf .
Chase, J., D. Anderson, P. Thakar, A.. Vahdat, and R. Doyle, 2001, “Managing Energy and Server Resources in Hosting Centers”, Proceedings of the 18th ACM Symposium on Operating System Principles, Banff, Alberta, Canada. Available at: http://www.cs.duke.edu/ari/publications/muse.pdf .
Chase, J.D. and R. Doyle, 2001, “Balance of Power: Energy Management for Server Clusters”, Submitted for publication, January. Available at: http://www.cs.duke.edu/ari/publications/balance.html .
Elnozahy, M., M. Kistler, and R. Rajamony, 2002, “Energy-Efficient Server Clusters”, Proceedings of the Second Workshop on Power Aware Computing Systems, 2 February. Available at: http://www.cs.rice.edu/~rrk/publications/pacs02.shtml .
Elnozahy, M., M. Kistler and R. Rajamony, 2003, “Energy Conservation Policies for Web Servers”, Fourth USENIX Symposium on Internet Technologies and Systems, Seattle, 26-28 March. Available at: http://www.cs.rice.edu/~rrk/publications/usits2003.pdf .
EU, 2003, “Directive 2002/95/EC of the European Parliament and of the Council of 27 January 2003 on the Restriction of the Use of Certain Hazardous Substances in Electrical and Electronic Equipment”, Official Journal of the European Union, L 37, 13 February, pp. 19 – 23. Available at: http://europa.eu.int/eur-lex/pri/en/oj/dat/2003/l_037/l_03720030213en00190023.pdf .
Gubler, M., and Peters, M., 2000, “Use of Servers in Small and Medium-Sized Companies”, Abstract of Final Report, Swiss Federal Office of Energy, September. Available at: http://www.electricity-research.ch/scripts/index.php?lang=1036 . Full Report (in
203 Actual year is inconclusive; context on IBM website (http://www.research.ibm.com/arl/projects/papers ) appears to suggest 2001.

4-126
German) available at: http://www.electricity-research.ch/pages/berichte/server-schalten-kmu.pdf .
Huser, A., 2002, “Potential for Reducing Electricity Consumption by Switching Off Servers”, Final Report, Swiss Federal Office of Energy, May. Available at: http://www.electricity-research.ch/e.htm .
Huser, A. and T. Grieder, 2004, “Findings Relating to the Use of ACPI in Windows Servers”, Final Report Prepared by Encontril GmbH for the Swiss Federal Office of Energy, Electricity Programme, July. Available (for purchase) at: http://www.energieforschung.ch/__C125690A00613C0E.nsf/fmPubsByType?ReadForm&Start=1&Count=1000&ExpandView&lang=de .
Iyengar, A., M. Squillante and L. Zhang, 1999, “Analysis and Characterization of Large-Scale Web Server Access Patterns and Performance”, World Wide Web, vol. 2, pp. 85-100. Available at: http://citeseer.nj.nec.com/cache/papers/cs/2897/http:zSzzSzwww.research.ibm.comzSzpeoplezSzizSziyengarzSzwww99.pdf/iyengar99analysis.pdf .
Josselyn, S., Hingley, M., Bozman, J., and Cohen, L., 2000, “Server Market Forecast and Analysis, 1996-2004”, International Data Corporation.
Kalaher, P., 2003, Personal Communication, NerveWire, August. Killelea, P., 2002, Web Performance Tuning (2nd Edition), O’Reilly & Associates, Inc.:
Sebastopol, CA. Book available at: http://www.oreilly.com/catalog/webpt . Lakkas, G. and B. Duduman, 2001, “The ACPI Advantage for Powering Future-Generation
Computers”, EDN Magazine, 20 September. Available at: http://e-insite.net/ednmag/contents/images/158984.pdf .
LaVerdiere, P., 2003, Personal Communication, RLX, August. PARC, 2001, Xerox PARC Project Page. Available at:
wysiwyg://projectsbtm.7/http://www.parc.xeox.com/proj-1st.shtml, downloaded on 8/2/01.
Rajamony, R. and Bianchini, R., 2002, “Energy Management for Server Clusters”, Technical Presentation, IBM Austin Research Lab and Rutgers University.
RLX Server information, 2002, Available at: www.rlx.com . Wei, J., December 2002, Personal Communication, Amphus, Inc., December.

5-1
5 CONCLUSIONS Based on surveys of the office and telecommunications equipment literature, this study originally identified 61204 technology options that could potentially reduce nonresidential office and telecommunications equipment energy consumption. After developing first-cut energy savings potential estimates for each technology, eleven technologies were selected for further study in consultation with a range of office and telecommunications experts. Each of the eleven options received further study, including more detailed assessment of their technical energy savings potential, current and future economics (cost), barriers to achieving their full market potential, and developmental “next steps” for each technology. Many of the eleven technologies have significant technical energy savings potentials (see Table 5-1). In most cases, the national energy savings potential of a specific technology exceeds the reported values because the technologies would also reduce the energy consumed by residential office and telecommunications equipment. The technical energy savings potentials are not, however, necessarily additive, as application of one option may reduce the energy savings achievable by other options or preclude other options. Nonetheless, the technical energy savings potentials indicate the potential for considerable reduction of the 97TWh of electricity consumed by nonresidential office and telecommunications equipment. Table 5-1: Nonresidential Energy Savings Potential Summary for Options Selected for Further Study
Technology Option Technology Status
Technical Energy Savings Potential
(TWh) Chip-Level Power Management Current / New 4
Cholesteric LCDs New / Advanced 11 – 12
Higher Efficiency Backlighting for LCD Monitors New / Advanced 6 – 10
Organic Light-Emitting Diode (OLED) Displays New / Advanced 12 – 13
Dis
play
Te
chno
logi
es
Reflective Displays Current / Advanced 9 – 13
Electronic Paper (e-Paper) New / Advanced 13.5 / 0205 Higher Efficiency Ac-Dc Power Supplies Current to New 12
Inkjet Copiers and Printers Current / New 6 Microprocessor Line Width Reduction Advanced 1
Network Software to Enact Power Management Settings Current / New 18 – 27 Server Power Management New 3
Note: The annual energy consumption of monitors has been revised down in light of new data published in 2002 (see Appendix B).
Analysis shows that applying select combinations of technologies206 listed in Table 5-1 to PCs, monitors, servers, copy machines, and printers can reduce their total annual energy consumption by approximately 70 percent, i.e., from about 60TWh207 to less than 20TWh. 204 The initial list contained more than the 61 options presented in this report; 61 represents the final number after consolidating several options. 205 In principle, e-paper could provide wholesale replacement for imaging devices; in practice, it would replace only a portion of paper use and
eliminate few copy machines and printers. 206 PCs and Workstations: Higher-Efficiency Power Supplies, Linewidth Reduction, Chip-Level Power Management (that achieves 100% PM-
enabled), Network Software to Enact Power Management Settings (night power off). Monitors: OLED (2010 Target), Software to Enact Power Management Settings (100% PM-enabled during daytime, night power off).

5-2
Network software that enables power management for networked office equipment has the greatest energy savings potential of all the measures selected for further study. If applied to all relevant equipment it could reduce nonresidential annual energy consumption by between 18 and 27TWh, or by 20 to 30 percent. This reflects the relatively low power management-enabled rates of office equipment and large differences in power draw between active and low-power modes. Several display technologies also have significant annual energy savings potential relative to the CRT-dominated Y2000 installed base (see Table 5-1). If the Y2000 installed base of monitors and displays were replaced by LCDs, the energy savings potential of all display technologies would decrease by about 7TWh208. Appendix A contains summaries of the fifty options not chosen for further evaluation. Several of the fifty technologies not selected for further evaluation also appear to have significant energy savings potential (based on initial estimates; see Figure 5-1). To place the estimates in context, Figure 5-1 presents the estimated energy savings from: 1) 100% power management-enabled rate, and 2) turning off all devices not in use.
0
5
10
15
20
25
30
100%
PM
-ena
bled
Rat
e
Hard
war
e to
Pow
er O
ffEq
uipm
ent
Carb
on N
anot
ube
Disp
lay
Liqu
id C
ryst
al D
ispl
ay
Min
iatu
re W
irele
ssHe
adse
t Dis
play
Cloc
kles
s/As
ynch
rono
usM
icro
proc
esso
r
Silic
on-G
erm
aniu
mSe
mic
ondu
ctor
s
Silic
on-o
n-In
sula
tor
Tran
sist
ors
Cold
Pre
ssur
e Fu
sing
Flas
h Fu
sing
Occ
upan
cy S
enso
rs fo
rPo
wer
Man
agem
ent
High
-End
Ser
vers
Repl
acin
g Lo
w-E
ndSe
rver
s
Impr
oved
Reg
ulat
ors
(DC-
DC P
S)
Mul
ti-fu
nctio
n De
vice
s(M
FDs)
Righ
t-Siz
e Po
wer
Supp
lies
Repl
ace
Desk
top
PCs
with
Por
tabl
e De
vice
s
Estim
ated
Tec
hnic
al E
nerg
y Sa
ving
s Po
tent
ial [
TWh]
Figure 5-1: Technology Options Not Selected for Further Study with Significant Energy Savings
Potential (preliminary estimates) In general, the eleven technologies reduce energy consumption by either decreasing active mode power draw or increasing the time spent in low-power modes (see Table 5-2).
Servers: Higher-Efficiency Power Supplies, Linewidth Reduction, Server Power Management. Copy Machines and Printers: Inkjet Copiers and Printers, Software to Enact Power Management Settings (100% PM-enabled during daytime, night power off).
207 This reflects the new monitor and display baseline annual energy consumption of 16.5TWh, versus 22.2TWh (see Appendix B). 208 The energy saving potential values for display technologies assume that 17-inch monitors dominate the installed base. A move to larger
monitors would tend to reduce the energy saving potential of LCDs on a percentage basis, as LCD power draw increases more with screen size than CRTs.

5-3
Table 5-2: Common Themes to Energy Consumption Reduction
Energy Consumption Reduction Theme Relevant Technologies
Decrease Active Mode Power Draw
• Chip-Level Power Management • Cholesteric LCDs • Electronic Paper (e-Paper) • Higher Efficiency Ac-Dc Power Supplies • Higher Efficiency Backlighting for LCD Monitors • Microprocessor Line Width Reduction • Organic Light-Emitting Diode (OLED) Displays • Reflective Displays
Increase Time Spend in Low-Power Modes
• Electronic Paper (e-Paper) • Higher Efficiency Ac-Dc Power Supplies • Inkjet Copiers and Printers • Network Software to Enact Power Management Settings • Server Power Management
Consumers purchase office and telecommunications equipment to enhance worker productivity or provide services and rarely consider energy consumption in their decisions. Manufacturers do, however, often address energy issues in order to improve product functional issues, such as increased portability/battery life, thermal limitations of equipment components, decreased fan noise, lower data center power densities, and improved product quality/lifetime (Fisher 2002). New office and telecommunications technologies must offer clearly superior performance, additional features, or appreciable cost savings relative to existing technologies to have an impact in the marketplace. Several of the eleven technology options offer the possibility of non-energy benefits that would enhance their ultimate commercial potential (see Table 5-3). Table 5-3: Common Non-Energy Benefits of the Eleven Technology Options
Non-Energy Benefit Relevant Technologies Increased Battery Life for Portable Devices
• Chip-Level Power Management • Cholesteric LCDs • Higher Efficiency Backlighting for LCD Monitors • Microprocessor Line Width Reduction • Organic Light-Emitting Diode (OLED) Displays • Reflective Displays
Reduce Display Footprint
• Cholesteric LCDs • Organic Light-Emitting Diode (OLED) Displays • Reflective Displays
Potential for Lower First Cost
• Higher Efficiency Backlighting for LCD Monitors (field-sequential)
• Inkjet Copiers and Printers • Organic Light-Emitting Diode (OLED) Displays • Reflective Displays
Increased first cost represents the largest market barrier that impedes greater market penetration of existing (“current”) technologies with limited market share (see Table 5-4). In addition, if aspects of a technology reduce device performance, they will adversely affect the technology’s commercial potential. Several less mature technologies must overcome

5-4
manufacturing quality and cost, reliability, and basic material issues before they could be commercialized. Table 5-4: Common Barriers Facing the Eleven Technologies
Barrier Relevant Technologies Higher First Cost (“current” technologies)
• Higher Efficiency Ac-Dc Power Supplies • Network Software to Enact Power Management
Settings Manufacturing Quality or Cost • Cholesteric LCDs
• Electronic Paper (e-Paper) • Higher Efficiency Ac-Dc Power Supplies • Higher Efficiency Backlighting for LCD Monitors
(color-pixel backlighting; OLED/LED/HCFL/TFFL) • Organic Light-Emitting Diode (OLED) Displays • Reflective Displays
Device Reliability • Electronic Paper (e-Paper)** • Higher Efficiency Backlighting for LCD Monitors
(photoluminescent LCD; OLED/LED/HCFL/TFFL) • Organic Light-Emitting Diode (OLED) Displays • Server Power Management
Performance Issues • Cholesteric LCDs • Electronic Paper (e-Paper) • Higher Efficiency Backlighting for LCD Monitors
(OLED/LED/HCFL/TFFL; lower luminance levels*) • Network Software to Enact Power Management
Settings* • Reflective Displays • Server Power Management**
Basic Research Needed • Higher Efficiency Backlighting for LCD Monitors (OLED/LED/higher-efficacy fluorescent source)
• Organic Light-Emitting Diode (OLED) Displays *Perceived issues **Concerns; unknown at present
Owing to the different barriers and developmental stages of the different options, the options have a wide range of potential “next steps” (see Table 5-5). Except for the software technologies, most of the eleven technologies only have relevance to new products

5-5
Table 5-5: Technology Development Potential “Next Steps” for the Eleven Technologies Potential “Next Step” Relevant Technologies Further Research & Development
• Chip-Level Power Management • Cholesteric LCDs • Electronic Paper (e-Paper) • Higher Efficiency Ac-Dc Power Supplies • Higher Efficiency Backlighting for LCD Monitors • Inkjet Copiers and Printers • Microprocessor Line Width Reduction • Network Software to Enact Power Management Settings • Organic Light-Emitting Diode (OLED) Displays • Reflective Displays • Server Power Management
Demonstration • Network Software to Enact Power Management Settings • Server Power Management
Education & Market Conditioning / Promotion
• Higher Efficiency Ac-Dc Power Supplies • Microprocessor Line Width Reduction • Network Software to Enact Power Management Settings

5-6
GENERAL REFERENCES ADL, 1999, “Opportunities for Energy Savings in the Residential and Commercial Sectors
with High-Efficiency Electric Motors”, Final Report for the U.S. Department of Energy, Office of Building Technology, State and Community Programs. Available at: http://www.eren.doe.gov/buildings/documents/pdfs/doemotor2_2_00.pdf.
ADL, 2002, “Energy Consumption by Office and Telecommunications Equipment in Commercial Buildings – Volume I: Energy Consumption Baseline”. ,” Final Report to the U.S. Department of Energy, Office of Building Technology, State and Community Programs, January. Available on-line at: http://www.eere.energy.gov/buildings/documents/pdfs/office_telecom-vol1_final.pdf .
Belady, C., Personal Communication, Hewlett Packard Corporation, August. BTS, 2003, 2003 Buildings Energy Databook, U.S. Department of Energy, Energy
Efficiency and Renewable Energy, August. Available at: http://btscoredatabook.eren.doe.gov/ .
Cler, G. et al., 1997, Commercial Space Cooling and Air Handling: Technology Atlas. E Source, Inc.
EIA, 2001, Energy Information Administration’s 2001 Annual Energy Outlook”, Table 8.1, Electricity Overview, 1949-2000.
Fisher, K., 2002, “Drivers for Efficient Power Consumption in Desktop/Mobile PC and Servers” , Proc. of the 2nd IEECB Conference, 27-29 May, Nice, France.
Hawken, P., Lovins, A., and Hunter Lovins, L., 1999, Natural Capitalism, Back Bay Books: Boston, Massachusetts.
IEA, 2002, “Reducing Standby Power Waste to Less than 1 Watt: A Relevant Global Strategy that Delivers”, International Energy Agency White Paper. Available at: http://library.iea.org/dbtw-wpd/textbase/papers/2002/globe02.pdf .
IEC, 2003, “IEC 62301 Ed 1.0: Measurement of Standby Power”, Committee Draft for Vote, 28 November. Available at: http://www.energyrating.gov.au/library/pubs/iec-standbycdv2003.pdf .
IEEE, 2002, “IEEE P1621 – Draft Standard for User Interface Elements in Power Control of Electronic Devices Employed in Office/Consumer Environments”, Unapproved Draft Standard by the Institute for Electrical and Electronics Engineers, 15 December . Available at: http://standards.ieee.org/announcements/pr_p1621.html .
LBNL, 2001, CCAP-Office2, Microsoft Excel Spreadsheet, Dated 12 July. McKeefry, H.L., 2004, “Cool Servers are a Hot Issue”, ServerPipeline, 14 June. Available
at: http://www.serverpipeline.com/trends/showArticle.jhtml;jsessionid=P2TNJDOIMIES4QSNDBCSKHQ?articleId=21800060&printableArticle=true .
Roberson, J. A., R.E. Brown, B. Nordman, C.A. Webber., G.K. Homan, A. Mahajan, M. McWhinne, J.G. Koomey, 2002, “Power Levels in Office Equipment: Measurements of New Monitors and Personal Computers”, Proc. ACEE Summer Study on Energy Efficiency in Buildings, Pacific Grove, CA, 22-26 August.
Roberson, J.A., C.A. Webber, M.C. McWhinney, R.E. Brown, M.J. Pinckard, and J.F. Busch, 2004, “After-Hours Power Status of Office Equipment and Inventory of Miscellaneous Plug-Load Equipment”, Lawrence Berkeley National Laboratory Final
5-7
Report, Report Number LBNL-53729. Available at: http://enduse.lbl.gov/info/LBNL-53729.pdf .
Top Runner, 2004, “What is the Top Runner Program”, The Energy Conservation Center of Japan. Downloaded on 23 June, from: http://www.eccj.or.jp/top_runner/index.html .
White House, 2001, “Energy Efficient Standby Power Devices”, Executive Order, dated 31 July. Available at: http://www.whitehouse.gov/news/releases/2001/07/20010731-10.html .
Young, R., 2003, “FPD Market and Technology Overview”, Society for Information Display, Seminar Lecture Notes – Volume I, 19 May, Baltimore, pp. M-1/1-M-1/63.


A-1
APPENDIX A: DATA SHEETS FOR TECHNOLOGIES NOT SELECTED FOR FURTHER STUDY Appendix A contains the write-ups for the 50 technologies evaluated in the initial technology screening process but not selected for further study (see Table A-1 for an index). As such, the information should be considered preliminary. The information developed for each technology option is presented in a concise, tabular format and includes the following: • Technical Maturity; • Equipment Affected by the Technology; • Concise Explanation of the Technology and How It Saves Energy; • Total Energy Consumption of Equipment Impacted by the Technology (in site TWh); • Approximate Energy Savings (site TWh); • Cost impact; • Performance Benefits; • Notable Developers/Manufacturers of the Technology; • Perceived Barriers to Market Adoption of the Technology; • References for the Information Developed. Table A-1: List of Technology Option Not Evaluated in Further Detail Category Technology Option Page #
Carbon Nanotube Displays A-3 Digital Micromirror Device Monitors (DMD) A-4 Ferroelectric LCDs A-5 Electroluminescent Display (AC Thin Film EL Displays) A-5 Field Emission Display A-6 Higher Efficiency CRT A-7 Liquid Crystal Display (LCD) A-8
Display Technologies (8)
Miniature Wireless Headset Display A-9 All-Optical Switching A-10 Quantum Computing A-10 Carbon Nanotube Computing A-11 Clockless/ Asynchronous Microprocessor A-11 Copper Microprocessor Interconnect (e.g., "Wiring") A-12 Biological / DNA Computing A-12 Gallium Nitride Transistors A-13 High-K Dielectrics (also known as Metal Gate Dielectrics) A-13 Molecular Computing/Memory A-14 Multi-Gate Devices A-14 Neuromorphic Computing A-15 Silicon-Germanium Semiconductors A-15 Silicon-on-Insulator Transistors A-16 Strained Silicon A-16 Systems-on-Chips A-17
Chip Design/Materials (16)
Three-Dimensional Chips A-17
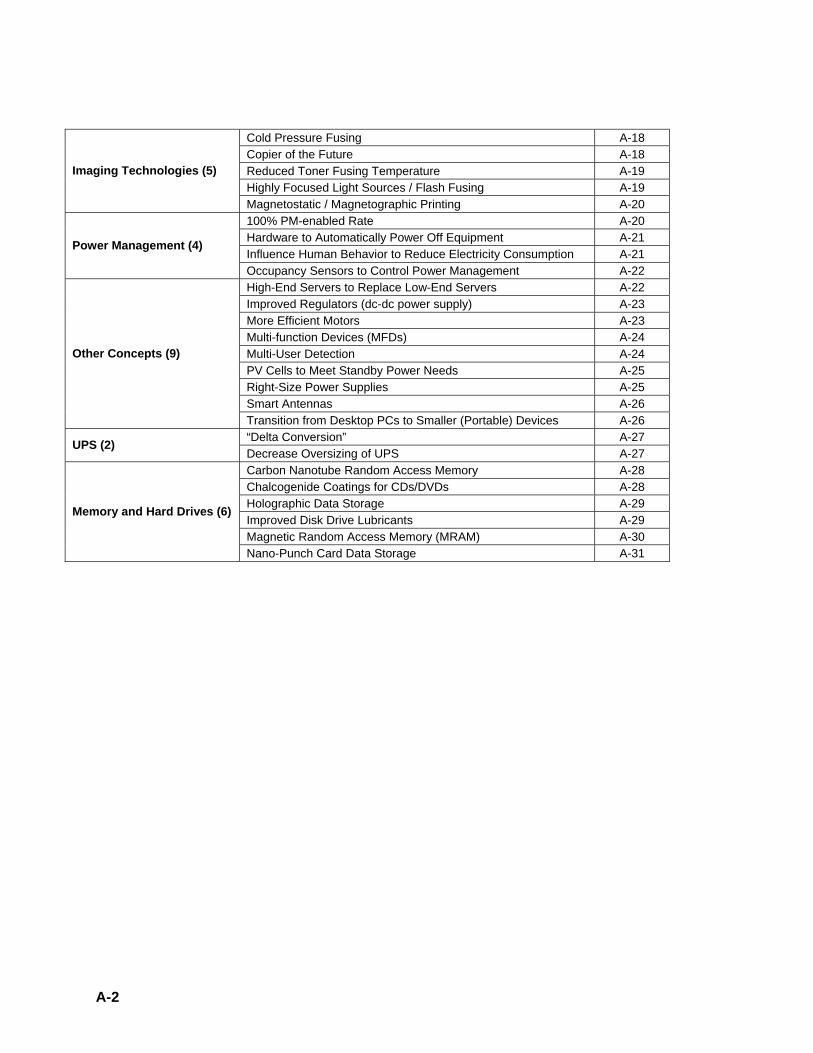
A-2
Cold Pressure Fusing A-18 Copier of the Future A-18 Reduced Toner Fusing Temperature A-19 Highly Focused Light Sources / Flash Fusing A-19
Imaging Technologies (5)
Magnetostatic / Magnetographic Printing A-20 100% PM-enabled Rate A-20 Hardware to Automatically Power Off Equipment A-21 Influence Human Behavior to Reduce Electricity Consumption A-21
Power Management (4)
Occupancy Sensors to Control Power Management A-22 High-End Servers to Replace Low-End Servers A-22 Improved Regulators (dc-dc power supply) A-23 More Efficient Motors A-23 Multi-function Devices (MFDs) A-24 Multi-User Detection A-24 PV Cells to Meet Standby Power Needs A-25 Right-Size Power Supplies A-25 Smart Antennas A-26
Other Concepts (9)
Transition from Desktop PCs to Smaller (Portable) Devices A-26 “Delta Conversion” A-27 UPS (2) Decrease Oversizing of UPS A-27 Carbon Nanotube Random Access Memory A-28 Chalcogenide Coatings for CDs/DVDs A-28 Holographic Data Storage A-29 Improved Disk Drive Lubricants A-29 Magnetic Random Access Memory (MRAM) A-30
Memory and Hard Drives (6)
Nano-Punch Card Data Storage A-31

A-3
Display Technologies – Carbon Nanotube Displays
Description
Discovered in 1991, carbon nanotubes are built up from hexagons of carbon atoms. They exhibit a wide range of electrical and mechanical properties, including great strength, low weight, flexibility, and low electric resistance. If used in a display, an array of carbon nanotubes located right behind a phosphor-coated screen would emit electrons at an energy level that efficiently excites the phosphor, replacing the electron gun of a CRT (Mirsky 2000).
Impacted Equipment Monitors and Displays Technical Maturity Advanced Relevant Energy Consumption [TWh/year] 22.2 / 16.5 (see Appendix B)
Energy Savings Potential [TWh/year] 12 Based on about a 50% reduction in LCD active mode power draw
Cost Impact Currently, nanotubes are extremely expensive, e.g., circa 2000, carbon nanotubes were estimated to cost ten-times more than gold. Actual cost impact would depend on the amount of material used and ultimate easy of fabrication.
Performance Benefits Possible gain in image quality due to exceptional resolution of emitters Notable Developers of Technology
Samsung, DuPont/Nanomix, Motorola, Noritake (Japan), several Universities
Perceived Barriers
• Cost • Material Problems: Growing nanotubes for emitters requires a temperature
in excess of 600oC, which is too high for the glass currently used by display manufacturers. Manufacturers trying to adapt by using "tips" from CNTs deposited on glass, regular patterning a major problem, potentially overcome via sophisticated drive electronics (Werner 2002).
• Expected not to appear in office equipment for at least a decade: costly, many unknowns, not demonstrated yet (Semenza 2002)
References
• Mirsky, S., 2000, "Tantalizing Tubes", Scientific American , June. Available at: http://www.sciam.com/article.cfm?articleID=00004308-6A8A-1C74-9B81809EC588EF21 .
• Semenza, P., 2002, Personal Communication, iSuppli/Stanford Resources, October.
• Werner, K.I., 2002, "They Drink a Lot of Coffee in Brazil - and Also Develop Displays", Information Display, December, pp. 1, 30,31.

A-4
Display Technologies – Digital Micromirror Device Monitors (DMD)
Description
A digital micromirror is a small (e.g., 16µm x 16µm) mirror that electronically switches between two states. Wu and Yang (2001) describe DMD as a “semiconductor light switch” which, in one state the mirror reflects incident light such that it reaches the viewer, while in the other state light does not reach the viewer. A DMD monitor would consist of a light source that would illuminate the DMD array, where the individual DMDs present a lit or dark pixel to the viewer. A color wheel can be used to generate color displays sequentially.
Impacted Equipment Monitors and displays
Technical Maturity New; dominates ultra-light projection system market; used for digital movie projection
Relevant Energy Consumption [TWh/year] 22.2 / 16.5 (see Appendix B)
Energy Savings Potential [TWh/year] 11
DMDs consume less power than LCDs because they have higher fill factors and do not require polarizers; Wu and Yang (2001) estimate that the DMD display would consume approximately 45% less energy than an LCD in active mode.
Cost Impact Unknown; likely higher
Performance Benefits Digital precision for images, including color – particularly advantageous for digital video; tested reliability appears to be good for DMD arrays.
Notable Developers of Technology Texas Instruments
Perceived Barriers
• Because it is a projection technology, it will have lower image quality than LCD or CRT monitors (Allen 2002)
• Unclear space savings (similar to CRT size unit; Allen 2002) • Not considered serious potential replacement for monitors (Allen 2002)
References
• Allen, K., 2002, Personal Communication, iSuppli/Stanford Resouces, May.
• USDC, 2003, “The Global Flat Panel Display Industry ‘2003’: An In-Depth Overview and Roadmap on FPD Technologies, Markets, Manufacturing, and Materials”, U.S. Display Consortium.
• Wu, S.-T. and D.-K. Yang, 2001, Reflective Liquid Crystals, John Wiley & Sons, Ltd.: Chichester, UK.
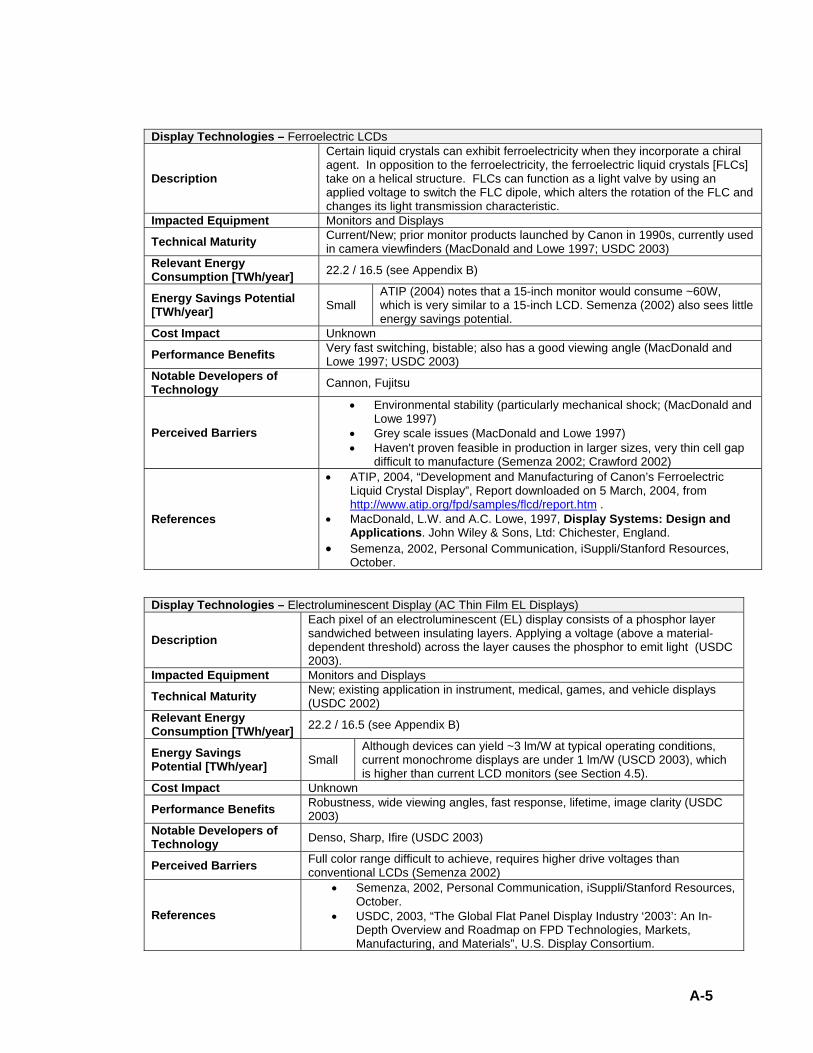
A-5
Display Technologies – Ferroelectric LCDs
Description
Certain liquid crystals can exhibit ferroelectricity when they incorporate a chiral agent. In opposition to the ferroelectricity, the ferroelectric liquid crystals [FLCs] take on a helical structure. FLCs can function as a light valve by using an applied voltage to switch the FLC dipole, which alters the rotation of the FLC and changes its light transmission characteristic.
Impacted Equipment Monitors and Displays
Technical Maturity Current/New; prior monitor products launched by Canon in 1990s, currently used in camera viewfinders (MacDonald and Lowe 1997; USDC 2003)
Relevant Energy Consumption [TWh/year] 22.2 / 16.5 (see Appendix B)
Energy Savings Potential [TWh/year] Small
ATIP (2004) notes that a 15-inch monitor would consume ~60W, which is very similar to a 15-inch LCD. Semenza (2002) also sees little energy savings potential.
Cost Impact Unknown
Performance Benefits Very fast switching, bistable; also has a good viewing angle (MacDonald and Lowe 1997; USDC 2003)
Notable Developers of Technology Cannon, Fujitsu
Perceived Barriers
• Environmental stability (particularly mechanical shock; (MacDonald and Lowe 1997)
• Grey scale issues (MacDonald and Lowe 1997) • Haven't proven feasible in production in larger sizes, very thin cell gap
difficult to manufacture (Semenza 2002; Crawford 2002)
References
• ATIP, 2004, “Development and Manufacturing of Canon’s Ferroelectric Liquid Crystal Display”, Report downloaded on 5 March, 2004, from http://www.atip.org/fpd/samples/flcd/report.htm .
• MacDonald, L.W. and A.C. Lowe, 1997, Display Systems: Design and Applications. John Wiley & Sons, Ltd: Chichester, England.
• Semenza, 2002, Personal Communication, iSuppli/Stanford Resources, October.
Display Technologies – Electroluminescent Display (AC Thin Film EL Displays)
Description Each pixel of an electroluminescent (EL) display consists of a phosphor layer sandwiched between insulating layers. Applying a voltage (above a material-dependent threshold) across the layer causes the phosphor to emit light (USDC 2003).
Impacted Equipment Monitors and Displays
Technical Maturity New; existing application in instrument, medical, games, and vehicle displays (USDC 2002)
Relevant Energy Consumption [TWh/year] 22.2 / 16.5 (see Appendix B)
Energy Savings Potential [TWh/year] Small
Although devices can yield ~3 lm/W at typical operating conditions, current monochrome displays are under 1 lm/W (USCD 2003), which is higher than current LCD monitors (see Section 4.5).
Cost Impact Unknown
Performance Benefits Robustness, wide viewing angles, fast response, lifetime, image clarity (USDC 2003)
Notable Developers of Technology Denso, Sharp, Ifire (USDC 2003)
Perceived Barriers Full color range difficult to achieve, requires higher drive voltages than conventional LCDs (Semenza 2002)
References
• Semenza, 2002, Personal Communication, iSuppli/Stanford Resources, October.
• USDC, 2003, “The Global Flat Panel Display Industry ‘2003’: An In-Depth Overview and Roadmap on FPD Technologies, Markets, Manufacturing, and Materials”, U.S. Display Consortium.
A-6
Display Technologies – Field Emission Display
Description
Field emission displays (FEDs) emit electrons from a cold cathode in a vacuum. The electrons excite a phosphor, which emits visible light. One embodiment uses microtip fluorescent emitters, where a small-scale (e.g., 5µm x 5µm emitter pattern) structure serves as the cathode emitter and excites phosphor across a small (~200µm) gap (MacDonald and Lowe 1997).
Impacted Equipment Monitors and Displays Technical Maturity New Relevant Energy Consumption [TWh/year] 22.2 / 16.5 (see Appendix B)
Energy Savings Potential [TWh/year]
4.5 to 12
Itoh and Tanaka (2002) estimate ~20W for a 17-inch TV (LCD ~50W, CRT ~100W); earlier estimates of 50% less power draw than vacuum fluorescent display (due to cold cathode; MacDonald and Lowe 1997), 33% reduction relative to CRT (ADL 1993).
Cost Impact Unknown
Performance Benefits Thin panels (~2mm), distortion-free images, wide (~170o), quick response (~microseconds; Itoh and Tanaka 2002)
Notable Developers of Technology Futaba; prior developers include PixTech and Candescent
Perceived Barriers
• Manufacturing problems and assembly difficulties (Itoh and Tanaka 2002; Semenza 2002)
• Cost (Crawford 2002); MacDonald and Lowe (1997) note that they would cost more than plasma display at sizes 15-inches and greater
• Companies exiting the market (PixTech; Crawford 2002); Candescent liquidated in 2002 (Forsythe 2002)
• Poor Contrast under illumination (MacDonald and Lowe 1997)
References
• Crawford, C., 2002, Personal Communication, Brown University, October. • Forsythe, E., 2002, Personal communication, U.S. Army Research
Laboratory, October. • Itoh, S. and Tanaka, M., 2002, “Current Status of Field-Emission
Displays", Proceedings of the IEEE, vol. 90, no. 4., April, pp. 514-520. • MacDonald, L.W. and A.C. Lowe, 1997, Display Systems: Design and
Applications, John Wiley & Sons, Ltd: Chichester, England. • Semenza, 2002, Personal Communication, iSuppli/Stanford Resources,
October.

A-7
Display Technologies – Higher Efficiency CRT
Description Although CRTs are technically mature products, further design improvements could decrease their active power draw. For example, the shadow mask absorbs up to 80% of the electron beams (Bergman 2002a).
Impacted Equipment Monitors and Displays Technical Maturity Advanced Relevant Energy Consumption [TWh/year] 22.2 / 16.5 (see Appendix B)
Energy Savings Potential [TWh/year] 0 to 8
CRTs without shadowmasks could use up to 80% less power for the emitter (Bergman 2002a), but they currently require additional logic and drive electronics to enable more precise beam control. At present, this negates a majority of the CRT energy savings but future improvements could result in some savings (Bergman (2002b) .
Cost Impact Unclear
Depends on the balance between cost saved from elimination of shadow mask and additional processing/drive electronics; Bergman (2002a) indicates that shadowmasks “can be one of the most expensive items” in a CRT.
Performance Benefits Improved image quality, greater durability, potential to increase display luminance (would reduce energy savings)
Notable Developers of Technology Philips / LG Philips
Perceived Barriers • Mature product with very high cost sensitivity • Market moving away from CRTs to more compact display technologies
References
• Bergman, A.H., 2002a, “Removing the Shadow Mask”, Information Display, October, pp. 12-16.
• Bergman, A.H., 2002b, Personal Communication, Philips Electronics, November.
• Semenza, 2002, Personal Communication, iSuppli/Stanford Resources – personal communication, October.
A-8
Display Technologies – Liquid Crystal Display (LCD)
Description
A backlight emits light, with a reflector re-directing light emitted away from the LC array and towards the array. A plastic (polyester or polycarbonate) diffuser then “smooths” out the light from the discrete fluorescent tubes to increase the spatial uniformity of the light sheet. Subsequently, a polarizer laminated to the LC array aligns the incoming light to an angle approaching normal to the LC array to increase the fraction of light within the view angle accepted by the LCs. The light then encounters the LCs. Each liquid crystal twists to function as a light valve, i.e., depending on the state of the crystal, it either blocks or passes the light to the color filter for that area. Finally, the light passes through a second polarizer and exits the front of the display.
Impacted Equipment Monitors and Displays Technical Maturity Current; About 30% of global monitor market (by units; Young 2003) Relevant Energy Consumption [TWh/year] 22.2 / 16.5 (see Appendix B)
Energy Savings Potential [TWh/year] 7
Based on power draw values in Appendix B. As display sizes increases, the power draw difference between LCD- and CRT-based displays decreases. Consequently, a move to larger monitors would decrease the energy saving potential of LCDs.
Cost Impact At present, LCD monitors cost roughly twice as much as CRT monitors. Over the past several years, LCD monitor prices have dropped significantly.
Performance Benefits Decreased footprint – takes up less desk space, image clarity, elimination of electronic noise
Notable Developers of Technology Numerous monitor manufacturers
Perceived Barriers First Cost
References
• Kawamoto, H., 2002, "The History of Liquid-Crystal Displays", Proceedings of the IEEE, vol. 90, no. 4, April, pp. 460-500.
• Roberson, J. A., R.E. Brown, B. Nordman, C.A. Webber., G.K. Homan, A. Mahajan, M. McWhinne, J.G. Koomey, 2002, “Power Levels in Office Equipment: Measurements of New Monitors and Personal Computers”, Proc. ACEE Summer Study on Energy Efficiency in Buildings, Pacific Grove, CA, 22-26 August.
• Young, R., 2003, “FPD Market and Technology Overview”, Society for Information Display, Seminar Lecture Notes – Volume I, 19 May, Baltimore, pp. M-1/1-M-1/63.
• See section 4.5 of this report.

A-9
Display Technologies – Miniature Wireless Headset Display
Description A headset display uses a small (<one inch) display based on one of several technologies (such as liquid crystal [LC], liquid crystal on silicon [LCOS], microelectromechanical systems [MEMS], etc.). The user either looks at the display directly or the display scans the image onto the retina of the user.
Impacted Equipment Monitors and Displays Technical Maturity New; used in military, medical and industrial applications Relevant Energy Consumption [TWh/year] 22.2 / 16.5 (see Appendix B)
Energy Savings Potential [TWh/year] 14 Product specifications suggest active power draw between 3 and 6W
Cost Impact Unclear
Performance Benefits Exceptional clarity, virtual reality ability, confidentiality in public places, light and compact
Notable Developers of Technology Several (see Allen 2002a)
Perceived Barriers
• Not considered a reasonable replacement to traditional displays • Difficult to consult other media formats in order to compile information into
one location • Likely requires touch-typing ability • Can cause headaches and vertigo
References
• Allen, K., 2002a, “A Big-Picture View of Microdisplays”, Society for Information Display, Seminar Lecture Notes – Volume I, 20 May, Boston, pp. M-12/1-M-12/74.
• Allen, K., 2002b, Personal Communication, iSupply/Stanford Resources.
• Crawford, G.P., 2002, Personal Communication, Brown University. • Cybermind, 2001, “Mobile Personal Display”, Cy-Visor Product
Specifications.

A-10
Chip Design/Materials – All-Optical Switching
Description
Current “optical” switches convert incoming light signals over fiber to electrical signals, switch, and reconvert the signals back to light signals. All-optical switching uses microelectromechanical systems (MEMS) devices consisting of an array of mirrors to route information instead of electronic or gate-based switching devices (notably for fiber optic terminals). In microprocessors, optical switching could potentially replace electronic or gate-based switching, although this would entail a significant paradigm shift (see Moore 2002).
Impacted Equipment Telecom and computer network equipment; Servers, Workstations, and Personal Computers
Technical Maturity New; earlier fiber optic switching products anticipated appear not to have penetrated the market
Relevant Energy Consumption [TWh/year] 43
Energy Savings Potential [TWh/year]
Small, if at all It is not clear that this will reduce energy consumption
Cost Impact Unknown; likely higher for computer applications Performance Benefits Enables rapidly re-configurable switches; potential for higher data rates Notable Developers of Technology Alcatel, Cisco Systems, Ciena, Corvis, Lucent Technologies, Nortel Networks
Perceived Barriers
• On-chip optical interconnects are at least 15 years away, if feasible; unclear energy impact (need ~lasers); potential use to reconfigure interconnections via changeable optics for different problems (Moore 2002).
• Power/heat of lasers used to general light signals; interference; cost
References
• Fairley, P., 2000, “The Microphotonics Revolution”, Technology Review, July/August, pp. 38-44.
• Goldstein, F., 2004, Personal Communication, Ionary Consulting, May. • Moore, S.K., 2002, "Linking with Light", IEEE Spectrum, pp. 32-36.
Chip Design/Materials –Quantum Computing
Description
Quantum computing exploits the probabilistic nature of subatomic particles to carry out logic operations. For example, a quantum computing device using electrons might use magnetic fields to manipulate the spin of the electrons and carry out logic operations. Each electron would be a quantum bit, or qubit, that would have three potential states until measuring the electron’s spin.
Impacted Equipment Servers, PCs, and Workstations Technical Maturity Advanced; practical devices are likely decades away from development Relevant Energy Consumption [TWh/year] 31
Energy Savings Potential [TWh/year] Unclear Would not necessarily consuming less energy (quite likely more) but
opening up new opportunities for additional computing Cost Impact Unknown; likely more expensive Performance Benefits Potential to greatly increase the efficiency of highly parallel calculations Notable Developers of Technology Many universities; IBM
Perceived Barriers Very difficult to isolate qubits from outside interference (i.e., maintaining coherence between qubits); cost and size of equipment for manipulating particles (e.g., nuclear magnetic resonance).
References • Waldrop, M.M., 2000, “Quantum Computing Technology Review,
May/June, pp. 59-66. • Mullins, J., 2002, "Quantum Superbrains", New Scientist, 8 June, pp.
24-29.

A-11
Chip Design/Materials – Carbon Nanotube Computing
Description
Discovered in 1991, carbon nanotubes are built up from hexagons of carbon atoms. They exhibit a wide range of electrical and mechanical properties, including great strength, low weight, flexibility, and low electric resistance. Used in microprocessors, carbon nanotubes would decrease the resistance of the “wires” between transistors and, thus, their associated losses.
Impacted Equipment Telecom Network, Computer Network, Server Computers, PC, and Workstations Technical Maturity Advanced Relevant Energy Consumption [TWh/year] 43
Energy Savings Potential [TWh/year] Small
Lower resistance to electricity flows through “wires” used in microprocessors. At present, however, such resistance does not account for much of microprocessor power draw.
Cost Impact Currently materials are very expensive but required quantity of material unknown
Performance Benefits Much lower “wire” resistance could enable continued decreases in future microprocessor line widths (due to thermal limitations from heat dissipation); higher speed operation due to reduced internal time constants.
Notable Developers of Technology Many universities; IBM, NEC, several smaller companies
Perceived Barriers Technology immature (material compatibility, cost, manufacturing, etc.)
References
• Mirsky, S., 2000, "Tantalizing Tubes", Scientific American , June. Available at: http://www.sciam.com/article.cfm?articleID=00004308-6A8A-1C74-9B81809EC588EF21 .
• Rotman, D., 2002, “The Nanotube Computer”, Technology Review, March, pp. 37-45.
Chip Design/Materials – Clockless/Asynchronous Microprocessor
Description
Almost all microprocessor operate with a high frequency oscillating crystal clock (i.e., the GHz rating given for microprocessors) which synchronizes microprocessor operations. A clockless system does not rely on a single clock to coordinate processing and different portions of the microprocessor run at different speeds that depend on the operations carried out.
Impacted Equipment Servers, Workstations, and Personal Computers Technical Maturity Advanced Relevant Energy Consumption [TWh/year] 30
Energy Savings Potential [TWh/year] 4
Two major factors account for the power saving. One is clock distribution. Roughly a third of the power consumption of a microprocessor is for the clock itself, which must be distributed all over the chip while maintaining quality. The other saving comes from the improvement in speed. If circuits do not need to wait for the clock to complete an operation, some can operate faster. Energy savings reflect a 50% reduction in active mode microprocessor power draw.
Cost Impact Unclear
Performance Benefits Faster operation, i.e., clockless prototypes demonstrated two to three times faster operation than conventional microprocessors.
Notable Developers of Technology Sun Microsystems, Theseus Logic, Philips Electronics, Intel, IBM
Perceived Barriers
• Runs counter to current marketing paradigms, i.e., marketing performance based on clock speed
• Inadequate design tools for large, complex, high-speed microprocessor design. A likely compromise is to have asynchronous subsystems within clocked processors.
• Requires precise design to ensure accurate calculations
References Tristam, C., 2001, “It’s Time for Clockless Chips”, Technology Review, October, pp. 36-41.

A-12
Chip Design/Materials – Copper Microprocessor Interconnect (e.g., "Wiring") Description Microprocessors that use copper circuitry instead of aluminum.
Impacted Equipment Telecommunications and computer network equipment; Servers, Workstations, and Personal Computers
Technical Maturity Current; first chips came to market in the late 1990s Relevant Energy Consumption [TWh/year] 43
Energy Savings Potential [TWh/year] Small
Copper wiring has about 40% less resistance than aluminum wiring; however, wiring resistance accounts for a small portion of microprocessor power draw at present line widths.
Cost Impact Unclear; IBM claimed a 10% to 15% cost savings
Performance Benefits Potential for increased speed (IBM claims up to 15%); decreased electromigration (can generate voids and break wiring) and, hence, improved reliability
Notable Developers of Technology IBM
Perceived Barriers Copper can diffuse into silicon; may alter silicon’s electrical properties and impair transistor operation.
References IBM, 1997, “Back to the Future: Copper Comes of Age”, Think Research. Available at: http://domino.research.ibm.com/comm/wwwr_thinkresearch.nsf/pages/copper397.html .
Chip Design/Materials – Biological / DNA Computing
Description Biological computing would use logic circuits based on biological components, such as genes, instead of microelectronics.
Impacted Equipment Servers, PCs, and workstations; a prominent researcher does not see it replacing existing devices, but for controlling chemical/biological systems.
Technical Maturity Advanced; exceedingly rudimentary at this stage. Relevant Energy Consumption [TWh/year] 30
Energy Savings Potential [TWh/year] Unclear
In theory, very low power draw (e.g., the human brain); in practice, would not necessarily consume less energy (e.g., due to interface challenges) but could open up new computing opportunities.
Cost Impact Unknown Performance Benefits Theoretically very high “transistor” density Notable Developers of Technology Many universities; Bell Labs, LBNL
Perceived Barriers Numerous issues surrounding development of practical devices, e.g., logic circuit development, large-scale integration of numerous logic circuits, input/output.
References • Garfinkel, S.L., 2000, “Biological Computing”, Technology Review,
May/June, pp. 70-77. • Regalado, A., 2000, “DNA Computing”, Technology Review, May/June,
pp. 80-84.

A-13
Chip Design/Materials – Gallium Nitride Transistors
Description Gallium Nitride (GaN) transistors would use GaN as the semiconductor material instead of more conventional materials (such as silicon, gallium arsenide).
Impacted Equipment Cell site equipment Technical Maturity Advanced; used for light-emitting diodes and semiconductor lasers Relevant Energy Consumption [TWh/year] 2.3
Energy Savings Potential [TWh/year]
0.8 – 1.5
Current cellular base-station amplifiers have an efficiency of about 10%, GaN transistors could double or triple their efficiency
Cost Impact Likely substantially higher unless new substrate materials found
Performance Benefits High speed relative to silicon, higher power densities enable compactness (heat resistance, high breakdown fields/voltages)
Notable Developers of Technology
DARPA has funded "tens of millions of dollars in grants" to major defense companies. Private: RF Micro Devices, Cree Inc., Sensor Electronic Technology, ATMI, HRL, Lucent, NEC, TRW, Sumitomo.
Perceived Barriers Inexpensive substrate materials for GaN have yet to be found.
References Eastman, L.F. and Mishra, U.K., 2002, "The Toughest transistor Yet", ICEEE Spectrum, May, pp. 28-33.
Chip Design/Materials – High-K Dielectrics (also known as Metal Gate Dielectrics)
Description As microprocessor line widths shrink, power losses due to current leakage from gate to the substrate increase. High-k dielectric materials reduce the induced electric field in the substrate, which reduces current leakage losses.
Impacted Equipment Servers, PCs, and workstations Technical Maturity New Relevant Energy Consumption [TWh/year] 30
Energy Savings Potential [TWh/year] Small Leakage current issues will become more important in the future as
microprocessor line widths continue to decrease. Cost Impact Unknown Performance Benefits Enables high performance as microprocessor line widths decrease Notable Developers of Technology IBM, Intel, AMD
Perceived Barriers Manufacturing difficulties (current dielectric materials incompatible with higher-temperature processes currently used); high k dielectric material selection
References Geppert, L., 2002, "The Amazing Vanishing Transistor Act", IEEE Spectrum, October, pp. 28-33. Available at: www.ece.osu.edu/~berger/press/spectrum_cmos_trends.pdf .

A-14
Chip Design/Materials – Molecular Computing/Memory
Description Logic circuits would use molecules as switches (currently transistors); for example, complex molecules sandwiched between electrodes in a silicon substrate.
Impacted Equipment Servers, Workstations and Personal Computers Technical Maturity Advanced; viewed as “decades off” (Rotman 2000) Relevant Energy Consumption [TWh/year] 30
Energy Savings Potential [TWh/year] Unclear Nascent approach that may not save energy, but could create new
opportunities for additional computing power Cost Impact Unknown; unclear potential for self-assembling molecular circuits
Performance Benefits In theory, much higher switch density (several orders of magnitudes denser, as molecules have nanometer-scale dimensions versus ~100nm line widths today) enabling smaller microprocessors.
Notable Developers of Technology HP, IBM
Perceived Barriers Very immature approach that faces basic challenges in all areas
References
• HP, 2002, "HP Announces Breakthrough in Molecular Electronics", Press Release, Stockholm, Sweden, 9 September.
• Rotman, D., 2000, “Molecular Computing”, Technology Review , May/June, pp. 52-58.
• Mullins, J., 2002, "The Ultimate Domino Rally", New Scientist, 2 November, p. 14.
Chip Design/Materials – Multi-Gate Devices
Description Current C-MOS transistors have a single gate. Future transistors may have two or more gates to enhance their performance as line widths decrease and leakage currents increase.
Impacted Equipment Servers, Workstations and Personal Computers Technical Maturity Advanced Relevant Energy Consumption [TWh/year] 29
Energy Savings Potential [TWh/year] 1.8 Assumed same order as 3-D chips; becomes more significant as line
widths continue to shrink (e.g., below 30nm) Cost Impact Likely to increase cost due to greater manufacturing complexity
Performance Benefits Increased processing speed; some architectures can eliminate doping at gate, which improves consistency of device performance at very small dimensions (very low number of dopants in small features can result in variations in performance from gate to gate).
Notable Developers of Technology IBM, AMD, Intel, Hitachi, others
Perceived Barriers Manufacturing complexity and cost
References • Geppert, L., "The Amazing Vanishing Transistor Act", IEEE Spectrum,
October, pp. 28-33. • Geppert, L., 2002, "Triple Gate Double Play", IEEE Spectrum,
November, p. 18.

A-15
Chip Design/Materials – Neuromorphic Computing
Description Neuromorphic computing attempts to develop computing structures that mimic the “computing” structure of the human brain.
Impacted Equipment Servers, Workstations and Personal Computers Technical Maturity Advanced; Relevant Energy Consumption [TWh/year] 29
Energy Savings Potential [TWh/year] Unclear
Would likely be used to perform new and different computations; in theory, could have very low power draw per computation (e.g., teraflops per watts)
Cost Impact Unknown
Performance Benefits Unclear; has the potential to solve certain types of problems, e.g., highly parallel, pattern recognition better; possibly improved redundancy.
Notable Developers of Technology Caltech, Johns Hopkins
Perceived Barriers Very immature approach
References • Economist, 2001, “Machines with a Human Touch”, The Economist Technology Quarterly, 20 September.
Chip Design/Materials – Silicon-Germanium Semiconductors
Description Conventional semiconductors use transistors made of silicon. Silicon-Germanium (SiGe) semiconductors incorporate silicon doped with germanium on a silicon substrate, which lowers the bandgap and increases potential transistor switching speed.
Impacted Equipment Servers, Workstations, Personal Computers, Computer and Telecom network Equipment
Technical Maturity Current; used in data storage devices, portable devices (e.g., cell phones), targeted for higher-performance computer and telecom network equipment
Relevant Energy Consumption [TWh/year] 30 (only Servers, Workstations, Personal Computers)
Energy Savings Potential [TWh/year] 5 Reflects three-fold reduction in active power draw; in practice, would
likely be used to increase performance instead of saving energy
Cost Impact Unclear; presumably more expensive than conventional semiconductors, but might prove a lower cost solution for same performance level
Performance Benefits Higher microprocessor speeds; lower noise Notable Developers of Technology IBM
Perceived Barriers Challenging to apply to processors with large quantities of transistors (i.e., those used in PCs and servers have tens of millions of transistors)
References
• Hesseldahl, A., 2001, “ IBM Pushes the Silicon Edge”, Forbes, 27 June. Available at: http://www.forbes.com/2001/06/27/0627ibm.html .
• Ahlgren, D.C. and J. Dunn, 2000, “SiGE Comes of Age”, MicroNews, vol. 6, no. 1. Available at: http://www-306.ibm.com/chips/micronews/vol6_no1/vol6no1.pdf .

A-16
Chip Design/Materials – Silicon-on-Insulator Transistors
Description
Silicon-on-insulator (SOI) transistors incorporate an insulating layer (e.g., silicon oxide) between a thin layer of silicon and a thicker silicon substrate. Subsequently, the microprocessor transistors are built on the thin silicon layer. The insulating layer decreases the junction capacitance between the microprocessor silicon and the silicon substrate, which increases their switching speed.
Impacted Equipment Servers, Workstations, and Personal Computers Technical Maturity Current; primarily used for servers Relevant Energy Consumption [TWh/year] 30
Energy Savings Potential [TWh/year] 2.5 – 5
35% to 70% power reduction without loss of performance claimed by developer; in practice, could be used to enhance performance, particularly at smaller line widths (~60nm).
Cost Impact Unknown Performance Benefits Higher microprocessor speeds. Notable Developers of Technology IBM
Perceived Barriers Challenges mating oxide layer on crystalline silicon layers while maintaining desirable properties of SOI (e.g., lower capacitance)
References
• Geppert, L., "The Amazing Vanishing Transistor Act", IEEE Spectrum, October, pp. 28-33.
• IBM, 2002, “SOI Technology: IBM’s Next Advance in Chip Design”. Available at: http://www-306.ibm.com/chips/technology/technologies/soi/soipaper.pdf .
Chip Design/Materials – Strained Silicon
Description The transistors are produced with a layer of silicon deposited upon the semiconductor. Because the semiconductor contains some molecules that are larger than the silicon molecules, the silicon layer stretches (strains) to align with the semiconductor material.
Impacted Equipment Workstations, Servers and Personal Computers Technical Maturity Current Relevant Energy Consumption [TWh/year] 30
Energy Savings Potential [TWh/year] 2
Straining the silicon layer increases distances between atoms, which allows freer movement of electrons through the silicon layer. This decreased resistance can increase microprocessor speed by up to 35% for the same transistor size. Savings assume a 30% reduction in microprocessor power draw.
Cost Impact Intel estimates that it will add about 2% to cost of processing a wafer Performance Benefits Increased microprocessor speeds Notable Developers of Technology IBM, Amberware, Intel, Taiwan Semiconductor Manufacturing Hitachi, Toshiba
Perceived Barriers Cost
References
• Amberwave, 2004, “Strained Silicon Technology”. Available at: http://www.amberwave.com/technology/index.php .
• Geppert, L., "The Amazing Vanishing Transistor Act", IEEE Spectrum, October, pp. 28-33.
• Hesseldahl, 2002, "Stretching Silicon's Limits", Forbes.com, 13 August. Available at: http://www.forbes.com/2002/08/13/0813chips.html .
• IBM, 2001, “IBM's Strained Silicon Breakthrough Image Page”. Available at: http://www.research.ibm.com/resources/press/strainedsilicon/ .
A-17
Chip Design/Materials – Systems-on-Chips
Description A Systems-on-Chip (SOC) architecture integrates the CPU, chipset and graphics functions onto a single chip.
Impacted Equipment Servers, Workstations, and Personal Computers Technical Maturity New; greater focus on use in consumer electronics and communications devices Relevant Energy Consumption [TWh/year] 30
Energy Savings Potential [TWh/year] Unclear
Cost Impact Lower total system cost is a driver in other applications Performance Benefits Could have an adverse impact on performance Notable Developers of Technology National Semiconductor, IBM, AMD, Philips, Toshiba, Sony, Motorola
Perceived Barriers • Lower performance than conventional chips; some SOCs, however, already
offer adequate performance for a modest fraction of the PC market. • Need to prevent software from consuming the additional speed
References • Ohr, S. and A. Cataldo, 2002, “Designers Confront Costs of SoC
Scaling, Integration”, EE Times, 5 February. Available at: http://www.eetimes.com/article/showArticle.jhtml?articleId=18306588 .
Chip Design/Materials – Three-Dimensional Chips
Description The features of microprocessors lie in a plane, i.e., two dimensions. Three dimensional chips would also incorporate features in different parallel planes “stacked” on top of each other.
Impacted Equipment Servers, Workstations, and Personal Computers Technical Maturity Advanced Relevant Energy Consumption [TWh/year] 31
Energy Savings Potential [TWh/year] 1.5
More compact processors could draw less power, e.g., 20% reduction in drive current estimated; however, technology will likely used to increase processor performance instead.
Cost Impact Unclear Performance Benefits Increased processing speed Notable Developers of Technology Intel (Tri-gate transistor); IBM
Perceived Barriers Fabrication complexity and cost
References
• Geppert, L., 2002, "Triple Gate Double Play", IEEE Spectrum, November, p. 18.
• Geppert, L., 2003, "High-Rise Chips for High Performance", IEEE Spectrum, January, pp. 20-21.
• Jonietz, E., 2002, “Chips Go 3-D”, Technology Review, January/February, p. 23.
• Lammers, D., 2002, “Tri-Gate Transistor Called Post-Planar Contender”, EE Times, 17 September. Available at: http://www.eetimes.com/article/showArticle.jhtml?articleId=12804924 .

A-18
Imaging Technologies – Cold Pressure Fusing
Description This process passes paper through steel rollers that use high pressures (e.g., on the order of 30MPa) instead of thermal means to bond the toner to the paper.
Impacted Equipment Laser Printers, Copiers
Technical Maturity Current; commercialized for lower-speed devices in the 1980s; discontinued in the late 1980s
Relevant Energy Consumption [TWh/year] 13.5
Energy Savings Potential [TWh/year] 6.5
Actual savings likely approach inkjet imaging (see Section 4.6) as eliminating the need to keep the fuser roll hot greatly decreases power draw in “ready to print” mode.
Cost Impact Potential for lower cost (simpler design)
Performance Benefits Eliminates warm up time; decreases toner fumes; potential for improved maintenance and lifetime
Notable Developers of Technology Prior developers (in 1980s) include Canon, Gestetner, and Mita
Perceived Barriers High pressures can compromise image quality (including image finish and decreased image life due to toner flaking); high pressures may create design challenges for smaller machines.
References
• ADL, 1993, “Characterization of Commercial Building Appliances.” Final Report prepared for U.S. Department of Energy, Office of Building Technologies, August.
• Lovins, A.B. and H.R. Heede, 1990, “Electricity-Saving Office Equipment”, Technical Subreport from COMPITITEKSM, September.
Imaging Technologies – Copier of the Future
Description
Application of “Copier Of The Future” operational standards to all copiers and printers. This standard provides decreased energy consumption via aggressive requirements for start up time and sleep mode power draw. Various methods exist for meeting the reduced start up times, including reduced thermal mass of fuser components and alternative heating approaches.
Impacted Equipment Laser Printers, Copiers Technical Maturity Current Relevant Energy Consumption [TWh/year] 13.5
Energy Savings Potential [TWh/year] 3.5 Based on application of specifications; used 10W for “sleep” modes
and 100% power management-enabled rate Cost Impact Unclear
Performance Benefits Reduced start up time (e.g., less than 10 second transition time to and from “sleep” mode for a mid-speed copier from one manufacturer)
Notable Developers of Technology Canon and Ricoh
Perceived Barriers Challenges of achieving warm-up times from low-power mode (<10 seconds)
References
• EnergyStar, 1998, “Copier of the Future Technology Procurement Project – Procurement Documentation”. Available at: http://www.energystar.gov/ia/products/ofc_equip/copiers/Copier_Procurement.pdf .
• Information about Canon and Richo High EnergyStar® Copiers (1999-2000). More information available at: http://www.energystar.gov/index.cfm?c=copiers.copier_future .
A-19
Imaging Technologies – Reduced Toner Fusing Temperature
Description Modifications to the toner material enable it to have a lower fusing temperature. This decreases the amount of energy required to fuse the toner to paper, the energy expended to keep the fuser hot, and decreases the warm-up time.
Impacted Equipment Laser Printers, Copiers
Technical Maturity Current; toner temperatures have gradually decreased over the past decade (from about 350oF to about 250oF)
Relevant Energy Consumption [TWh/year] 13.5
Energy Savings Potential [TWh/year] 1
Based on a further 30oF reduction in fusing temperature, from 250oF. Savings in “printing” and “active but not printing” of about 17% reflect assumption that heat is primarily transferred via convection and conduction (both of which scale linearly with temperature difference); does not account for increased time in lower-power modes.
Cost Impact Unclear
Performance Benefits Decreased fusing time can enable greater copies and prints per minute rates, decreases device warm up time
Notable Developers of Technology Major manufacturers of imaging products
Perceived Barriers Storage issues (premature melting) limit ultimate decrease in fusing temperature
References
• ADL, 1993, “Characterization of Commercial Building Appliances.” Final Report prepared for U.S. Department of Energy, Office of Building Technologies, August.
• Ishihara, T., Hayashi, K., Ito, K., and Hasegawa, J., 1998, “Encapsulated Toner Fixed by Low Temperature”, Oki Technical Review, no. 161, vol. 64.
• Lovins, A.B. and H.R. Heede, 1990, “Electricity-Saving Office Equipment”, Technical Subreport from COMPITITEKSM, September.
Imaging Technologies – Highly Focused Light Sources / Flash Fusing
Description A flash fuser uses several flashtubes to generate a very intense and brief (microseconds) pulse of light that melts and fuses the toner to the paper.
Impacted Equipment Laser Printers, Copiers Technical Maturity Current; commercialized in the 1980s Relevant Energy Consumption [TWh/year] 13.5
Energy Savings Potential [TWh/year] 6.5
Savings likely approach inkjet imaging (see Section 4.6), as eliminating the need to the keep fuser roll hot greatly decreases power draw in “ready to print” mode.
Cost Impact Unclear Performance Benefits Good image quality, can print on many different media (e.g., plastic, cloth) Notable Developers of Technology
Many smaller manufacturers (often for larger-form roll-fed laser printers); Fujitsu, Agfa-Gevaert
Perceived Barriers Larger footprint for smaller machines (requires flat sheet at some point)
References
• ADL, 1993, “Characterization of Commercial Building Appliances.” Final Report prepared for U.S. Department of Energy, Office of Building Technologies, August.
• Lovins, A.B. and H.R. Heede, 1990, “Electricity-Saving Office Equipment”, Technical Subreport from COMPITITEKSM, September.

A-20
Imaging Technologies – Magnetostatic/Magnetographic Printing
Description Magnetostatic printing uses a magnetic head akin to a hard drive head to “write” the image pattern across a small (several micron) gap on to a rotating drum. The charged drum attracts magnetically charged toner to create the desired pattern on the drum, which then transfers the pattern to the paper.
Impacted Equipment Laser Printers, Copiers Technical Maturity Current; introduced by Bull in the 1980s Relevant Energy Consumption [TWh/year] 13.5
Energy Savings Potential [TWh/year] Negligible
This process still requires thermal (or thermal-pressure) fusing to fix the toner; hence, it does not appreciably reduce energy consumption.
Cost Impact Unknown Performance Benefits May have better maintenance and reliability characteristics Notable Developers of Technology
Nipson, Xeitron, Bull; current products appear to be targeted at larger-form roll-fed laser printers (often very high throughput devices)
Perceived Barriers Much higher toner production costs (Lovins and Heede 1990)
References
• ADL, 1993, “Characterization of Commercial Building Appliances.” Final Report prepared for U.S. Department of Energy, Office of Building Technologies, August.
• Lovins, A.B. and H.R. Heede, 1990, “Electricity-Saving Office Equipment”, Technical Subreport from COMPITITEKSM, September.
Power Management – 100% Power Management (PM)-enabled Rate
Description
This reflects the energy saving potential if all devices with power management (PM) capability had it enabled. Data from circa 2000/2004 suggest that PM-enabled rates fall short of 100%, notably for desktop PCs (25%/<=6%) and, to a lesser extent, copiers (34%/29%; 12 copy machines surveyed), laser printers (54%/60%), and monitors (60%/71%). Several ways exist to increase PM-enabled rates.
Impacted Equipment PCs, Monitors, Laser Printers, Copiers, Displays, Workstations Technical Maturity Current (technical capability present) Relevant Energy Consumption [TWh/year] 49
Energy Savings Potential [TWh/year] 22
Assumes 100% PM-enabled rate for the impacted equipment, based on usage data from ADL (2002), new monitor and display values (see Appendix B)
Cost Impact Small Performance Benefits Unknown Notable Developers of Technology Not applicable
Perceived Barriers Very challenging to modify personal behavior; in addition, see reaons discussed in “Network Software to Enact Power Management (PM) Settings“ (Section 4.8.2) from Korn et al. (2004)
References
• ADL, 2002, “Energy Consumption by Office and Telecommunications Equipment in Commercial Buildings Volume 1: Energy Consumption Baseline.”, Final Report Prepared for the U.S. Department of Energy, Office of Building Technology, January. .
• Korn, D. R. Huang, D. Deavers, T. Bolioli, and M. Walker, 2004, “Power Management of Computers”, Proc. IEEE International Symposium on Electronics and the Environment, 10-13 May, Phoenix/Scottsdale, Arizona, U.S.
• Roberson, J.A., C.A. Webber, M.C. McWhinney, R.E. Brown, M.J. Pinckard, and J.F. Busch, 2004, “After-Hours Power Status of Office Equipment and Inventory of Miscellaneous Plug-Load Equipment”, Lawrence Berkeley National Laboratory Final Report, Report Number LBNL-53729. Available at: http://enduse.lbl.gov/info/LBNL-53729.pdf .

A-21
Power Management – Hardware to Automatically Power Off Equipment
Description External devices automatically power down equipment based on time-of-day settings or sensed occupancy.
Impacted Equipment PCs, Workstations, Monitors, Displays, Laser Printers, and Copiers Technical Maturity Current Relevant Energy Consumption [TWh/year] 50
Energy Savings Potential [TWh/year] 28 Devices consume little power (e.g., <1W for PowerMiser)
Cost Impact $80 to $90 price quote for a single occupancy-based device (could serve PC and its monitor, a smaller laser printer)
Performance Benefits Some models provide a degree of surge protection Notable Developers of Technology USA Technologies, Wattstopper
Perceived Barriers
• Cost • Current devices do not have sufficient power capacity for larger imaging
equipment (e.g., >1kW) • Could interrupt systems while in use • Re-start time delay (electrophotographic reproduction equipment)
References Product Literature Power Management – Influence Human Behavior to Reduce Electricity Consumption
Description This general category includes a wide range of non-technology means to increase power management enabled and night turn-off rates, such as stickers, corporate rules and regulations and education.
Impacted Equipment PCs, Workstations, Monitors, Copiers, Printers Technical Maturity Current/Advanced Relevant Energy Consumption [TWh/year] 49
Energy Savings Potential [TWh/year]
~17 (very rough)
Based on a before-and-after study of information program to reduce monitor usage in a French building; study found ~25% reduction in monitor energy consumption during weekdays and ~65% reduction on weekends; rough assumption: apply ~35% savings to all equipment.
Cost Impact Likely small; primarily labor Performance Benefits Unclear Notable Developers of Technology Not applicable
Perceived Barriers • Unclear how measures will sustain efficacy over time • Difficult to educate people and to change their minds • Prior problems encountered with PCs entering PM modes without problems
References Beyrand, D., A. Anglade, G. Burle, and J. Roturier, 2002, “Influence of Human Behaviour in Reducing the Electricity Demand of Two Office Buildings", Proc. IEECB, Nice, France, May, pp. 367-371.
A-22
Power Management – Occupancy Sensors To Control Power Management
Description Devices are based on infrared or other surveillance means to detect presence of user. Systems then turn off equipment.
Impacted Equipment PCs, Workstations, and Monitors Technical Maturity New Relevant Energy Consumption [TWh/year] 33
Energy Savings Potential [TWh/year] 16
Assumed same as 100% PM-enabled rates for PCs, Workstations, and Monitors; actual savings somewhat lower due to timeout period before powering equipment into low power modes
Cost Impact Likely similar to “Hardware to Automatically Power Off Equipment”; Nordman (2004) suggests that incorporating occupancy sensors into devices could reduce implementation costs.
Performance Benefits Unclear Notable Developers of Technology
None known; likely same developers as “Hardware to Automatically Power Off Equipment”
Perceived Barriers Cost of occupancy sensor and controls; also See “Network Software to Enact Power Management (PM) Settings“ (Section 4.8)
References Nordman, B., 2004, Personal Communication, Lawrence Berkeley National Laboratory, July.
Other Concepts – High-End Servers to Replace Low-End Servers
Description
Operators of high-end servers209 can partition the servers to provision multiple instances of separate operating systems simultaneously. This capability can enable them to provide the functionality of numerous low-end servers using a single machine. In a utility computing model, companies might outsource their server management to a larger company that meets that (and other) company’s needs from one or more larger servers.
Impacted Equipment Low-end Server Computers Technical Maturity Current Relevant Energy Consumption [TWh/year] 4.5
Energy Savings Potential [TWh/year] 4 Rough estimate; one major high-end server manufacturer claims up to
a 95% reduction in power draw relative to low-end servers. Cost Impact Likely higher first costs for high-end server, with lower recurring costs
Performance Benefits High-end servers can dynamically scale computing resources in response to actual demand; top three reasons for consolidating servers: improved system availability, improved disaster recovery, and security (Connor 2004); allows system management from one interface, which can reduce management costs.
Notable Developers of Technology IBM, HP, Sun
Perceived Barriers • High initial cost for high-end servers • Many organizations do not need all the capabilities of a high-end server • For utility computing, some companies wary of outsourcing server function
References • Connor, D., 2004, “Today’s Focus: Server Consolidation on the Rise”,
Network World Newsletter, 8 January. • IBM, 2001, “IBM eServer z900 Provides Energy Saving Alternative to
Server Farms”, 15 March.
209 This capability has been expanding to smaller servers as well.
A-23
Other Concepts – Improved Regulators (Dc-Dc power supply)
Description
Power supplies for computing devices typically use an Ac-Dc supply to convert line voltage to one or more lower dc voltages, e.g., 120Vac to 5Vdc. Different components often require voltage levels that differ from the dc voltage levels provided by the supply and use dc-dc regulators to provide the required dc voltage levels.
Impacted Equipment Personal Computers and Workstations, Servers Technical Maturity New Relevant Energy Consumption [TWh/year] 30
Energy Savings Potential [TWh/year] 7
Based on an average increase from 80% to 95% efficiency; assumes that further dc-dc conversion applies to most power-consuming components
Cost Impact Likely more expensive Performance Benefits Decreased heat dissipation Notable Developers of Technology Analog Devices, Linear Technology, On semiconductor and Dallas-Maxim
Perceived Barriers First cost
References
• Calwell, C. and T. Reeder, 2002, “Power Supplies: A Hidden Opportunity for Energy Savings”, Natural Resources Defense Council Report Prepared by Ecos Consulting, 22 May.
• Calwell, C. and A. Mansoor, 2003, “Energy Efficient Power Supplies,” Presentation to the California Energy Commission, 16 December.
• Gabel, D., 2002, Personal Communication, Intel Corporation, August. Other Concepts – More Efficient Motors
Description Higher-efficiency dc motors would replace existing motors where relevant, for example, in paper handling, fans and disk drive operation.
Impacted Equipment Copiers, Printers, Workstations, Personal Computers, and Server Computers Technical Maturity Advanced Relevant Energy Consumption [TWh/year] 47
Energy Savings Potential [TWh/year] Small
Motors equal a small fraction of total energy consumption for relevant devices; many motors are already dc (permanent magnet) motors, which have high efficiencies.
Cost Impact Likely a cost increase. Performance Benefits Quieter operation, decreased thermal loading Notable Developers of Technology Dc motor manufacturers
Perceived Barriers Cost
References • ADL, 1993, “Characterization of Commercial Building Appliances.” Final
Report prepared for U.S. Department of Energy, Office of Building Technologies, August.
A-24
Other Concepts – Multi-function Devices (MFDs)
Description Multifunction devices (MFDs) integrate printing, copying, and facsimile functionality in smaller devices. Combining the functionality of two or three devices in one machine limits “read to print” and “sleep” energy consumption.
Impacted Equipment Copiers, Printers and Facsimile Machines
Technical Maturity Current; MFDs are common for home offices, and networked copiers provide the functionality of group laser printers.
Relevant Energy Consumption [TWh/year] 17
Energy Savings Potential [TWh/year] 6
Assumes elimination of devices (printer or copier) with smaller installed base in each speed range (~45%), as well as elimination of facsimile machines (~55%)
Cost Impact Consolidation of devices reduces first cost and, likely, maintenance expenditures Performance Benefits Fewer devices to maintain, reduced footprint Notable Developers of Technology Major imaging companies
Perceived Barriers Queuing issues (although implementation appears favorable) References Other Concepts – Multi-User Detection
Description
Multi-user detection uses digital signal processing to "subtract" interference from cell phone signals, which generally increases the area that a given cell tower can serve. This approach cannot overcome some geographical limitations to capacity and would not realize substantial savings in saturated areas where peak traffic rates approach capacity maximum.
Impacted Equipment Telecom Network Technical Maturity Advanced Relevant Energy Consumption [TWh/year] 2.3
Energy Savings Potential [TWh/year] 0.4 Assumed 50% increase (TIAX estimate) in capacity reduces the
number of cell stations deployed in 50% of areas Cost Impact Increase
Performance Benefits Could increase redundancy in some areas (where multiple towers could reach a service area)
Notable Developers of Technology Ascom; Mercury Computer Systems
Perceived Barriers Cost and complexity References Hardesty, L., 2002, "Clear Connection", Technology Review, October, p. 29.

A-25
Other Concepts – PV Cells to Meet Standby Power Needs
Description This approach uses a photovoltaic (PV) and battery system to meet the loads of the devices when they are off.
Impacted Equipment Personal Computers, Workstations, Monitors, Displays, Printers, Copy Machines Technical Maturity New; PV used to power handheld calculators Relevant Energy Consumption [TWh/year] 57
Energy Savings Potential [TWh/year] 0.7 “Off” mode power draw.
Cost Impact Cost increase depends on device “off” mode power draw of specific devices Performance Benefits Unclear Notable Developers of Technology None known for office and telecommunications equipment at this scale
Perceived Barriers • Cost • Light availability / solar panel position • Battery reliability
References Caddet, 2001, “Reducing Stand-By Power Consumption – A Technical Approach”, CADDET Energy Efficiency, Newsletter No. 2, pp. 4-5.
Other Concepts – Right-Size Power Supplies
Description
Power supplies are typically over-designed in order to guarantee performance and, in many cases, to accommodate potential system expansion. For example, a desktop PC that typically consumes 60 or 75 watts during operation likely has a 250 or 300W power supply, i.e., between 15% and 25% of rated load. Power supply efficiency usually decreases when the actual load falls below about 40% of the rated load, and decreases precipitously when the actual load falls below about 20% of the rated load. Using a smaller power supply would improve power supply efficiency and decrease its losses.
Impacted Equipment Greatest impact for desktop PCs and server computers Technical Maturity Current Relevant Energy Consumption [TWh/year] 31
Energy Savings Potential [TWh/year] 5 Based on a 7% increase in power supply efficiency
Cost Impact Small reduction in cost for smaller power supply (likely less than a few dollars) Performance Benefits Reduced heat dissipation Notable Developers of Technology
Desktop PC, Workstations and server manufacturers; Major microprocessor manufacturers largely drive power supply specifications.
Perceived Barriers Very difficult to realize in practice, as manufacturers do not want to risk device failure from inadequate power supply (e.g., for expansion or upgrade products).
References
• Calwell, C. and T. Reeder, 2002, “Power Supplies: A Hidden Opportunity for Energy Savings”, Natural Resources Defense Council Report Prepared by Ecos Consulting, 22 May. Available at: http://www.energystar.gov/ia/partners/prod_development/downloads/power_supplies/powersupplysummary.pdf .
• Also see Section 4.4

A-26
Other Concepts – Smart Antennas
Description Cell base stations with smart antennas would use multiple antennas and actively steer them to best respond to real-time requirements.
Impacted Equipment Wireless Phone Networks Technical Maturity New; steered antennas used for many other applications Relevant Energy Consumption [TWh/year] 6.6
Energy Savings Potential [TWh/year] 2.1
Manufacturer estimates that Smart Antennas could increase base station capacity by three- to eight-fold. A TIAX telecom expert believes this to be optimistic due to implementation complications as part of network (I.e., peoples phones are omni-directional, with variable service quality w/ geography), leading to a 30% power draw reduction estimate.
Cost Impact Unclear relative to adding additional base stations (depends on price relative to conventional stations)
Performance Benefits Increased antenna capacity Notable Developers of Technology ArrayComm; Metawave
Perceived Barriers • Higher cost than conventional antenna • Major manufacturers have incentives to sell additional base station gear
References Economist Technology Quarterly. 2002. "Watch This Airspace". The Economist. 22 June. pp. 14-21. Available at: http://www.economist.com/printedition/displayStory.cfm?Story_ID=1176136 .
Other Concepts – Transition from Desktop PCs to Smaller (Portable) Devices
Description
Smaller, portable computing devices are designed to operate for several hours on batteries and thus, by design, have much lower power draw than desktop devices. Typically, portable devices use numerous low power components, including low-power mobile processors and lower-power LCD monitors that focus light over a limited viewing angle.
Impacted Equipment Desktop Computers and Monitors
Technical Maturity Current; as the functionality of portable devices increases and their cost decreases, portable devices should continue to increase their market share (circa 2003, laptops accounted for about 25% of PC units sold).
Relevant Energy Consumption [TWh/year] 31
Energy Savings Potential [TWh/year] 26 Assumed replacement with laptop PCs, with same PM-enabled rate as
a desktop PC
Cost Impact Laptop PCs cost significantly more than desktop PCs with identical performance (even after taking into account monitor cost).
Performance Benefits Portability, built-in backup power Notable Developers of Technology Most personal computer manufacturers
Perceived Barriers • Cost • Decreased performance • Limited screen size
References • Rapp. D., 2002, "Anyway, Anyhow, Anywhere", Technology Review,
November, p.88. • Wolfe, A., 2002, "Putting Pen to Screen on Tablet PCs", IEEE
Spectrum, October, pp. 16-18.

A-27
UPS – "Delta Conversion"
Description Double-conversion UPSs convert all of the input power from ac to dc and then back to ac output. In contrast, the inverter in a “Delta Conversion” UPS converts only a portion of the ac input to dc, which increases the overall efficiency of the UPS.
Impacted Equipment UPS Technical Maturity Current Relevant Energy Consumption [TWh/year] 5.8
Energy Savings Potential [TWh/year] 2.5
Savings assume an increase from about 85% efficiency for double conversion UPSs to about 95% for delta conversion 3.8 quads consumed by on-line UPSs.
Cost Impact Higher first cost for additional power conditioning for electricity not converted to dc (relative to a double-conversion device, which provides excellent output isolation from input).
Performance Benefits Decreased operating cost Notable Developers of Technology American Power Conversion Corporation (APCC)
Perceived Barriers APCC holds intellectual property on the concept
References • APCC, 2003, “The Different Types of UPS Systems”, APC White Paper
#1, Revision 4. Available at: http://sturgeon.apcc.com/whitepapers.nsf/URL/WP-1/$FILE/WP1.pdf .
UPS – Decrease Oversizing of UPS
Description
Like power supplies, many UPSs operate at a fraction of their rated capacity due to oversizing. Typically, UPS efficiency decreases when the load fall below between 15% and 25% of the rated capacity. Such oversizing appears to occur frequently in data centers, where system loads often do not approach expected (design) loads and designers size UPS to accommodate future center expansion. More appropriate sizing of UPSs or, alternatively, more robust UPS performance at part loads, can reduce UPS energy consumption.
Impacted Equipment UPS Technical Maturity Current Relevant Energy Consumption [TWh/year] 5.8
Energy Savings Potential [TWh/year] 0.4 Based on efficiency increases from 82.5% to 90% for online UPS and
from 92.5% to 95% for all other UPSs
Cost Impact Cost reduction except in cases where system expansions cause power draw to reach expected levels.
Performance Benefits Unclear. Notable Developers of Technology Not applicable; this is a system design approach.
Perceived Barriers
UPS sizing practice stresses conservative sizing with sufficient margin to ensure that UPS can meet current – and, often, future – power requirements. Many users would rather pay a bit more for an initial installation than a lot more on a second installation. Consequently, increasing UPS efficiency partial-load performance may prove a more promising approach.
References
• ADL, 2002, “Energy Consumption by Office and Telecommunications Equipment in Commercial Buildings Volume 1: Energy Consumption Baseline.”, Final Report Prepared for the U.S. Department of Energy, Office of Building Technology, January. Available on-line at: http://www.eere.energy.gov/buildings/documents/pdfs/office_telecom-vol1_final.pdf .
• Garcia, P.V., A. Anglade, D. Beyrand, G. Burle, and J. Roturier, 2002, “Impact of UPS on the Actual Power Load and Electricity Demand of Office Equipment in Commercial French Buildings”, Proc. of the 2nd IEECB Conference, 27-29 May, Nice, France.

A-28
Memory and Hard Drives – Carbon Nanotube Random Access Memory
Description
One proposed design would use two parallel arrays of nanotubes, with a nanometer-scale gap between the arrays. An applied electric field causes a number of tubes to elongate, contact the opposing tubes, and then bind to the opposing tubes. This forms a circuit and each potential circuit represents a memory bit that does not change when the device is turned off.
Impacted Equipment Servers, Workstations and Personal Computers Technical Maturity Advanced Relevant Energy Consumption [TWh/year] 31
Energy Savings Potential [TWh/year] 0
Unclear direct energy savings potential; nonvolatile memory could, however, greatly reduce the time needed to boot up computers, which could lead to increases in their power management-enabled rates and much greater energy savings.
Cost Impact Unknown
Performance Benefits • Very high theoretical memory density • Writes faster than current RAM technology • Nonvolatile memory
Notable Developers of Technology Nantero
Perceived Barriers Manufacturing challenges; limited memory capacities relative to current RAM devices
References • Economist, 2003, “On the Tube”, The Economist, 8 March. • Rotman, D., 2002, “The Nanotube Computer”, Technology Review,
March, pp. 37-45. Memory and Hard Drives – Chalcogenide Coatings for CDs/DVDs
Description Chalcogenide coatings for nonvolatile memory applications electrically switch between a crystalline state that conducts electricity and an amorphous state that does not. This greatly increases the storage density of optical methods (e.g., CD-ROM).
Impacted Equipment Servers, Workstations and Personal Computers Technical Maturity Advanced Relevant Energy Consumption [TWh/year] 31
Energy Savings Potential [TWh/year] 0
No appreciable direct benefit; nonvolatile memory could, however, greatly reduce the time needed to boot up computers, which could lead to increases in their power management-enabled rates and much greater energy savings.
Cost Impact Unknown Performance Benefits Nonvolatile memory Notable Developers of Technology Intel; Ovonyx
Perceived Barriers Slower than MRAM, which may limit application in non-portable applications; stronger external electric fields can erase memory.
References
• Economist Technology Quarterly. 2002. "A Match for Flash?". The Economist. 22 June. pp. 22-23.
• Helm, N., 2003, “When Flash Becomes a Memory”, Electronic News, 22 August. Available at: http://www.electronicsnews.com.au/articles/c9/0c018ac9.asp .

A-29
Memory and Hard Drives – Holographic Data Storage
Description Holographic data storage would write memory (bits) in a three-dimensional structure using two beams of light to change the phase of the storage material. In contrast, current data storage approaches use planar (two-dimensional) layouts.
Impacted Equipment Servers, Workstations, and Personal Computers Technical Maturity New Relevant Energy Consumption [TWh/year] 31
Energy Savings Potential [TWh/year] 0 Unclear energy impact
Cost Impact Unclear; material expense an issue at present
Performance Benefits Much higher (>10-fold) storage densities and resulting smaller profile; faster data retrieval; potential for faster data search and retrieval.
Notable Developers of Technology IBM, Aprilis, InPhase Technologies, Polight Technologies
Perceived Barriers Finding an inexpensive, stable material
References
• Ashley, J., M.-P. Bernal, G. W. Burr, H. Coufal, H. Guenther, J. A. Hoffnagle, C. M. Jefferson, B. Marcus, R. M. Macfarlane, R. M. Shelby, and G. T. Sincerbox , 2000, “Holographic Data Storage”, Directions in Information Technology, vol. 44, no. 3. Available at: http://www.research.ibm.com/journal/rd/443/ashley.html .
• Economist, 2003, “Light on the Horizon – Holographic Data Storage”, The Economist, 31 July. Available at: http://www.economist.com/science/displaystory.cfm?story_id=1956881.
Memory and Hard Drives – Improved Disk Drive Lubricants
Description Improved disk drive lubricants would reduce the frictional forces in disk drives and, hence, the energy required to keep them spinning.
Impacted Equipment Servers, Workstations, and Personal Computers Technical Maturity New Relevant Energy Consumption [TWh/year] 31
Energy Savings Potential [TWh/year] 2.5
Very rough estimate, based on: Estimate of 50% reduction in friction losses, and that friction losses represent half of total losses. Disk drive power/energy consumption impact for desktop PCs and low-end servers from Gabel (2002), for other devices TIAX estimates.
Cost Impact Unclear Performance Benefits Likely longer disk drive life Notable Developers of Technology Unclear
Perceived Barriers Unclear
References Gabel, D., 2002, Personal Communication, Intel Corporation, August. (note: provided drive power draw values for PCs and low-end servers).

A-30
Memory and Hard Drives – Magnetic Random Access Memory (MRAM)
Description
Magnetic Random Access Memory (MRAM) uses the orientation of magnetic particles to represent bits. Unlike conventional electronic memory, MRAM does not lose its memory when the devices turns off. This eliminates the need for a device with MRAM to boot up when the device turns on, i.e., it could make a very rapid transition from off to on.
Impacted Equipment Servers, Workstations, and Personal Computers Technical Maturity Current (in wireless phones); New Relevant Energy Consumption [TWh/year] 31
Energy Savings Potential [TWh/year] 1.5
Based on a 90% reduction in memory power draw; memory accounts for about 3% and 8% of desktop PC and low-end server power draw210, respectively, TIAX estimates for other equipment types. Nonvolatile memory could, however, greatly reduce the time needed to boot up computers, which could lead to increases in their power management-enabled rates and much greater energy savings.
Cost Impact Unknown
Performance Benefits • Greatly reduced computer boot up time • Potential for higher operating speeds than DRAM (up to ten-fold)
Notable Developers of Technology
Motorola, IBM/Infineon, HP, NEC/Toshiba, Philips Electronics/STMicroelectronics
Perceived Barriers • Challenging and expensive to fabricate • Limited memory capacity at present (e.g., about 4MB circa early 2004)
References
• Economist Technology Quarterly, 2002, "A Match for Flash?", The Economist, 22 June. pp. 22-23. Available at: http://www.economist.com/science/tq/displayStory.cfm?story_id=1176222 .
• Arensman, R., 2004, “A Chip Worth Remembering”, Technology Review, March, p. 24.
• Gabel, D., 2002, Personal Communication, Intel Corporation, August (note: used only for memory power draw values for PCs and low-end servers).
210 Power draw includes the effect of power supply efficiency. For example, if memory accounts for 2% of total PC power draw and the PC has a power supply efficiency of 50%, the memory is said to represent 4% of total power draw.
A-31
Memory and Hard Drives – Nano-Punch Card Data Storage
Description
The “punch card” consists of a silicon chip topped with a thin polymer layer. To write data to the card, a hot silicon tip (or an array of tips – one developer’s prototype has 4,000 tips) touches the polymer layer to form an indent, i.e., data are recorded as the presence or absence of indents. Current prototypes have indent dimensions on the order of 10nm wide. The device reads data from the card by moving the silicon tip(s) over the polymer layer at a somewhat cooler temperature and sensing the change in tip resistance as it cools down further.
Impacted Equipment Server Computers Technical Maturity Advanced Relevant Energy Consumption [TWh/year] 11.6
Energy Savings Potential [TWh/year] Unclear; likely small if it does save energy
Cost Impact Unclear at present
Performance Benefits • Data integrity less sensitive to ambient temperature changes than magnetic storage (more relevant as storage scales shrink).
Notable Developers of Technology IBM; others working on similar concepts
Perceived Barriers • Speed (roughly 1,000 times slower than conventional hard drive) • Considered mostly at present for FLASH memory, i.e., smaller devices, not
desktop PCs and servers
References • Paulson, L.D., 2002, "Tiny 'Punch Cards' Boost Storage Capacity", Computer, September, p. 22.


B-1
APPENDIX B – NEW MONITOR AEC CALCULATIONS The baseline data for non-residential office and telecommunications equipment AEC relied upon monitor power draw values from several sources presented in the Volume I study (ADL 2002). Subsequent to the publication of Volume I, Roberson et al. (2002) reported new values for both CRT and LCD power draw by mode. Table B-1 summarizes the power draw by mode data from both sources. Table B-1: Monitor Power Draw by Mode Data
Power Draw [W] Display Type Active Sleep Off
Source
CRT Monitors – 17-inch 90 9.2 4.3 ADL (2002) CRT Monitors – 17-inch 61211 2 1 Roberson et al. (2002) CRT Displays – 15-inch 61 19 3 ADL (2002) CRT Monitors – 15inch 58 2 1 Roberson et al. (2002) LCD Monitors – 15-inch 11.7 1.2 0.6 ADL (2002) LCD Monitors – 15-inch 20 2 2 Roberson et al. (2002) LCD Monitors – 17-inch 16.7 1.7 0.8 ADL (2002) LCD Monitors – 17-inch 35 2 2 Roberson et al. (2002)
The new monitor power draw data point out two discrepancies. First, Roberson et al. (2002) measured about 30% lower CRT power draw in active mode than used in ADL (2002). In their discussion, the authors attribute their lower values to the fact that they measured actual (as-used) power draw values for monitors, whereas earlier data points reflected worst-case power draw values reported by manufacturers. Second, they measured much higher LCD power draw values than estimated in ADL (2002)212. In light of these data, this report uses the new monitor and general display AEC values shown in Table B-2. These reflect the ADL (2002) values for installed base and usage patterns and the average power draw values of Roberson et al. (2002). Table B-2: New Monitor AEC Baseline (for 2000)
Display Type AEC – 2000 [TWh]
AEC – NEW [TWh]
CRT Monitors 18.7 13.8 LCD Monitors 0.04213 0.14 General Displays214 3.4 2.6
TOTAL – Displays 22.2 16.5 The new CRT AEC value calculation uses a 65W active power draw to represent the entire CRT monitor stock (Roberson et al. 2002). All monitor energy saving calculations, however, will use 17-inch monitor baselines. This assumption allows direct calculation of energy savings potential based on 17-inch monitors for all monitor technologies without
211 They estimate 65W for an average monitor, i.e., taking into account the full range of available sizes. 212 ADL (2002) estimates of LCD power draw were extrapolated from laptop display energy consumption data. As discussed in this report, laptops displays usually have about half the luminance values of LCD monitors to conserve battery energy. 213 ADL (2002) mistakenly assumed that the power management-enabled rate for LCD monitors was 100%. 214 General display AEC values reflect 15-inch devices.

B-2
delving into issues of stock segregation, while incurring a relatively small error in total monitor AEC (~0.7 TWh, or about 5% of monitor AEC).
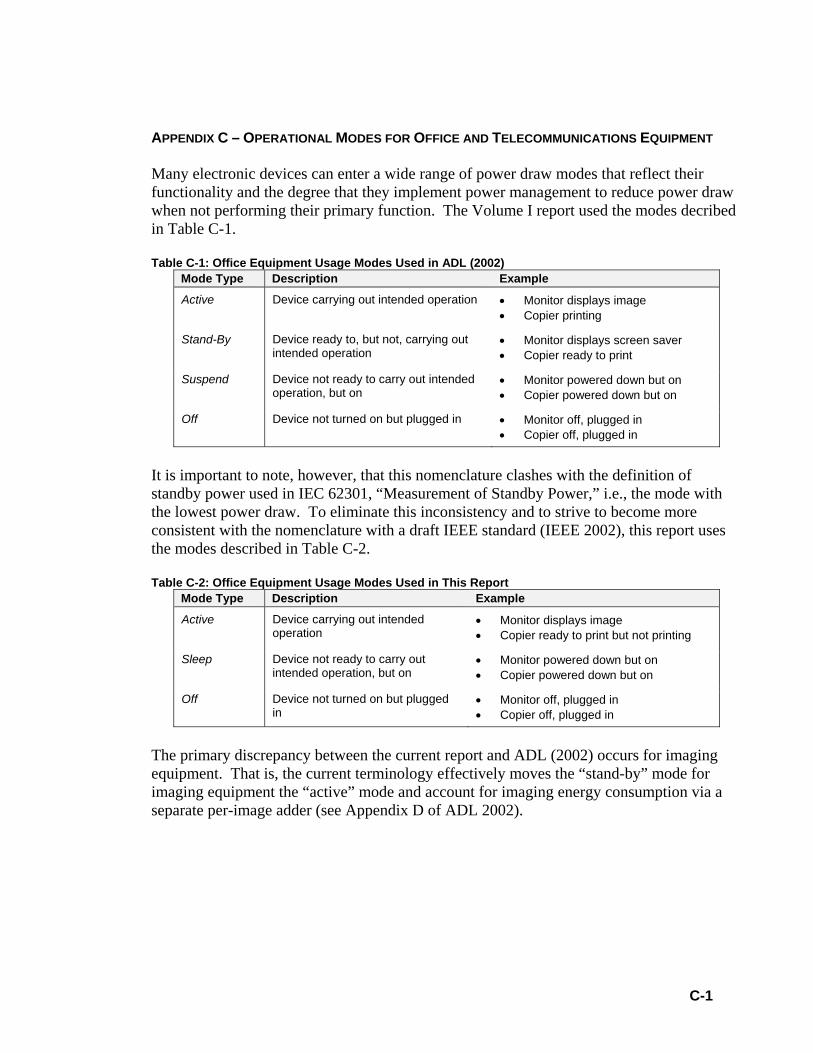
C-1
APPENDIX C – OPERATIONAL MODES FOR OFFICE AND TELECOMMUNICATIONS EQUIPMENT Many electronic devices can enter a wide range of power draw modes that reflect their functionality and the degree that they implement power management to reduce power draw when not performing their primary function. The Volume I report used the modes decribed in Table C-1. Table C-1: Office Equipment Usage Modes Used in ADL (2002)
Mode Type Description Example
Active Device carrying out intended operation • Monitor displays image • Copier printing
Stand-By Device ready to, but not, carrying out intended operation
• Monitor displays screen saver • Copier ready to print
Suspend Device not ready to carry out intended operation, but on
• Monitor powered down but on • Copier powered down but on
Off Device not turned on but plugged in • Monitor off, plugged in • Copier off, plugged in
It is important to note, however, that this nomenclature clashes with the definition of standby power used in IEC 62301, “Measurement of Standby Power,” i.e., the mode with the lowest power draw. To eliminate this inconsistency and to strive to become more consistent with the nomenclature with a draft IEEE standard (IEEE 2002), this report uses the modes described in Table C-2. Table C-2: Office Equipment Usage Modes Used in This Report
Mode Type Description Example
Active Device carrying out intended operation
• Monitor displays image • Copier ready to print but not printing
Sleep Device not ready to carry out intended operation, but on
• Monitor powered down but on • Copier powered down but on
Off Device not turned on but plugged in
• Monitor off, plugged in • Copier off, plugged in
The primary discrepancy between the current report and ADL (2002) occurs for imaging equipment. That is, the current terminology effectively moves the “stand-by” mode for imaging equipment the “active” mode and account for imaging energy consumption via a separate per-image adder (see Appendix D of ADL 2002).