energy consumption and economic growth in egypt: a ... consumption and... · energy consumption and...
TRANSCRIPT

Topics in Middle Eastern and African Economies Vol. 18, Issue No. 2, September 2016
61
Energy consumption and economic growth in Egypt: A disaggregated causality analysis with structural breaks
Mesbah Fathy Sharaf 1
Abstract
Since the 2011 revolution, Egypt has experienced frequent electricity blackouts and severe shortage in energy supplies. The government responded to the problem by reducing the subsidy on energy for heavy industries, and household electricity use. In addition, the government introduced a smart card system that entails a certain quota of fuel for each registered car per month. It appeared to the public that the Egyptian government is attempting to adopt an energy conservation policy to ration energy consumption and manage the deficit in energy supplies. Given that energy is an essential input for many economic activities, there is a concern that a reduction in energy consumption may dampen the growth potentials of the Egyptian economy. This paper investigates the causal relationship between energy consumption and economic growth in Egypt during the period 1980-2012, within a multivariate framework by including measures for capital and labor in the aggregate production function. Causality is tested using a modified version of the Granger causality test due to Toda and Yamamoto (1995). The analyses endogenously controls for potential structural breaks in the time series when conducting the unit root tests. In addition to aggregate energy consumption, the analysis is also segregated by different components of energy use including oil, electricity, natural gas and coal to account for any potential aggregation bias. No causal relationship was found between total primary energy consumption and economic growth, supporting the neutrality hypothesis. When the analysis is stratified by energy type, a one way positive causal relation running from economic growth to electricity and oil consumption was found which is consistent with the conservation hypothesis. The findings of this study provide empirical evidence that energy conservation policy has no negative effect on the growth prospects of the Egyptian economy in the long-run. Keywords: Energy Consumption; GDP; Cointegration; Causality; Egypt JEL Classification: C32, F24, F43
1 Mesbah Sharaf is an Assistant Professor in the Department of Economics, Faculty of Arts, University of Alberta, Edmonton, Canada. Emails: [email protected] & [email protected]

Topics in Middle Eastern and African Economies Vol. 18, Issue No. 2, September 2016
62
1. Introduction
Sustainable and reliable supply of energy is an essential requirement for economic
development. Since the 2011 revolution, Egypt has been experiencing frequent electricity
blackouts and severe shortage in energy supplies. The government responded to the problem by
reducing the subsidy on energy for heavy industries and household electricity use. In addition, the
government introduced a smart card system that entails a certain quota of fuel for each registered
car per month. It appeared to the public that the Egyptian government was attempting to adopt an
energy conservation policy to ration energy consumption and mange the deficit in energy supplies.
Given that energy is an essential input for many economic activities, there is a concern that a
reduction in energy consumption may dampen the growth potentials of the Egyptian economy.
The objective of this paper is to examine the causal relationship between energy consumption and
economic growth in Egypt during the period 1980-2012.
The paper is organized as follows: Section 2 reviews the literature. Section 3 discusses the
evolution of the energy sector in Egypt. The data and the econometric methodology are presented
in Section 4. Section 5 presents the results which are discussed in section 6. The conclusions and
policy implications are summarized in Section 7.
2. Literature Review
The nature of the relationship between energy consumption, or any of its components, and
economic growth has received great attention in the energy economics literature due to its
implication for the design of energy policies. Since the seminal study of Kraft and Kraft (1978)
which found a unidirectional causality from national income to energy consumption in the USA
over the 1947-1974 period, a growing literature has emerged to examine the causal relationship
between energy consumption and economic growth in a wide range of countries and using different
econometric techniques.2
Theoretically, four hypotheses have been put forward to explain the direction of causality
between energy consumption and economic growth. These include the “neutrality hypothesis”;
“conservation hypothesis”; “growth hypothesis”; and the “feedback hypothesis”. The neutrality
2 For recent surveys of the literature on the causal relationship between energy consumption and economic growth see Ozturk (2010) and Payne (2010).

Topics in Middle Eastern and African Economies Vol. 18, Issue No. 2, September 2016
63
hypothesis postulates no causal relationship between energy consumption and economic growth.
The conservation hypothesis considers a one-way positive causality running from economic
growth to energy consumption, while the other direction of causality is asserted by the growth
hypothesis. According to the feedback hypothesis there is a two-way causality between energy
consumption and economic growth.
Existing empirical evidence on the causal relationship between energy use and economic
growth is inconclusive with mixed findings. The neutrality hypothesis has been supported for
example by the findings of Menegaki (2011), Yıldırım et al. (2014); while the findings of Ghali
and El-Sakka (2004), Belloumi (2009), Apergis and Payne (2012), Shahbaz et al. (2012), Fuinhas
and Marques (2012), Mohammadi and Parvaresh (2014), Bloch et al (2015) supports the feedback
hypothesis. Among the studies whose findings support the conservation hypothesis include
Mozumder and Marathe (2007) and Mehrara (2007); while the growth hypothesis is supported by
the findings of Lee (2005) as an example.
The empirical literature on the energy-growth nexus has been largely dominated by cross-
country studies and the findings were mixed. For example, using a panel error correction model,
within a multivariate framework, Apergis and Payne (2012) investigated the relationship between
renewable, non-renewable energy consumption and economic growth for 80 countries, including
Egypt, over the period 1990–2007. They found bidirectional causality between renewable and non-
renewable energy consumption, and economic growth in both the short- and long-run which is in
line with the feedback hypothesis. In another cross-country study, Fuinhas and Marques (2012)
examined the nexus between primary energy consumption and economic growth in Portugal, Italy,
Greece, Spain and Turkey over the period 1965 to 2009. Using an Autoregressive Distributed Lag
(ARDL) approach, they found bidirectional causality between energy consumption and economic
growth in both the long-run and short-run, supporting the feedback hypothesis.
In a panel study of 18 developing countries over the period 1975 to 2001, Lee (2005)
employed heterogeneous panel cointegration and panel-based error correction models and found
evidence of a long-run and short-run causality from energy consumption to GDP, supporting the
growth hypothesis. In a multivariate panel framework, Menegaki (2011) examined the causal
relationship between renewable energy consumption and economic growth for 27 European
countries over the period 1997–2007, using a random effect model, and found no causality between
renewable energy consumption and GDP supporting the neutrality hypothesis. In another study,

Topics in Middle Eastern and African Economies Vol. 18, Issue No. 2, September 2016
64
using panel unit-root tests and panel cointegration analysis, Mehrara (2007) examined the causal
relationship between per capita energy consumption and per capita GDP in a panel of 11 oil
exporting countries. The author found a unidirectional strong causality from economic growth to
energy consumption for the studied group of oil exporting countries.
Using data on 17 African countries including Egypt during the period 1971–2001, Wolde-
Rufael (2006) found mixed results concerning the causality between electricity consumption and
economic growth. For Egypt, Wolde-Rufael (2006) found positive bidirectional causality between
electricity consumption and economic growth. In another study, Wolde-Rufael (2009) re-
examined the causal relationship between energy consumption and economic growth in seventeen
African countries including Egypt during the period 1971-2004, within a multivariate framework
by including labor and capital as additional variables. A variance decomposition analysis was used
to evaluate the importance of the causal effect of energy consumption on economic growth relative
to labor and capital. The causality test rejected the neutrality hypothesis for the energy–income
relationship in fifteen out of the seventeen countries. Results of the variance decomposition
analyses showed that in eleven out of the seventeen countries, energy is merely a contributing
factor to output growth and not an important one when compared to capital and labor. For Egypt,
Wolde-Rufael (2009) found a uni-directional causality running from economic growth to energy
consumption. Similar mixed results on the direction of causality between economic growth and
energy consumption was found by Akinlo (2008) using a multivariate causality test for eleven
Sub-Sahara African countries. In a recent cross-country study, Yıldırım et al. (2014) used a
trivariate model and a bootstrapped autoregressive metric causality approach to examine the
causality between economic growth and energy consumption in 11 countries, including Egypt. The
authors found evidence for the neutrality hypothesis of a no casual relationship between energy
consumption and economic growth for all countries but for Turkey in which a unidirectional causal
link was found from energy consumption to economic growth. In a panel study of 14 oil-exporting
countries over 1980–2007, Mohammadi and Parvaresh (2014), examined the long-run relation and
short-run dynamics between energy consumption and output using panel estimation techniques -
dynamic fixed effect, pooled and mean-group estimators. They found a bidirectional causal
relation in both long- and short-run between energy consumption and output which supports the
feedback hypothesis.

Topics in Middle Eastern and African Economies Vol. 18, Issue No. 2, September 2016
65
Similar to the cross-country studies, evidence on the direction of causality between energy
consumption and economic growth, based on individual country studies is equally mixed. In a
country-specific study, Shahbaz et al. (2012) found a bidirectional casual relationship between
renewable, non-renewable energy consumption and economic growth in Pakistan using the ARDL
bounds testing approach and within a multivariate framework over the period 1972–2011. A merit
of the Shahbaz et al. (2012) study is that it accounted for structural breaks in the time series when
checking for the stationarity property of the variables. In another individual country study, and
using Johansen cointegration test and a vector error correction model (VECM), Belloumi (2009)
found a long-run bi-directional causal relationship between per capita energy consumption and per
capita gross domestic product in Tunisia during the period 1971-2004, and a short- run
unidirectional causality from energy to gross domestic product (GDP). Using a neo-classical one-
sector aggregate production technology, Ghali and EL-Sakka (2004) found a two-way causal
relationship between energy consumption and economic growth in Canada. The authors also found
that a shock to energy would cause a 15% change in the future growth rates of output. In another
study, Mozumder and Marathe (2007), using cointegration and vector error correction model,
found a unidirectional causality from per capita GDP to per capita electricity consumption in
Bangladesh, which is in line with the conservation hypothesis. In a recent study, Bloch et al (2015)
found, using an ARDL technique and a vector error correction model, a long-run bi-directional
causality between GDP and oil, coal, and renewable energy consumption in China during the
period 1977-2013.
Table 1 presents a brief review for recent empirical evidence, in cross-country and country-
specific studies, on the causal relationship between energy consumption and economic growth. As
evident from Table 1, studies differed in their sample, econometric methodology, time period
covered and level of data aggregation.
In the case of Egypt, little research has been done regarding the causal relationship between
energy use and economic growth, especially at the disaggregated level. In addition, pervious cross-
country studies that included Egypt such as the study of Wolde-Rufael (2006) and Wolde-Rufael
(2009) did not control for the existence of potential structural breaks in the time series when
conducting the unit root tests and when estimating the error correction model. Moreover, previous
studies have mostly used a bivariate framework without considering other variables that affect
economic growth, and accordingly their model could be subject to omission variable bias. These
Topics in Middle Eastern and African Economies Vol. 18, Issue No. 2, September 2016
66
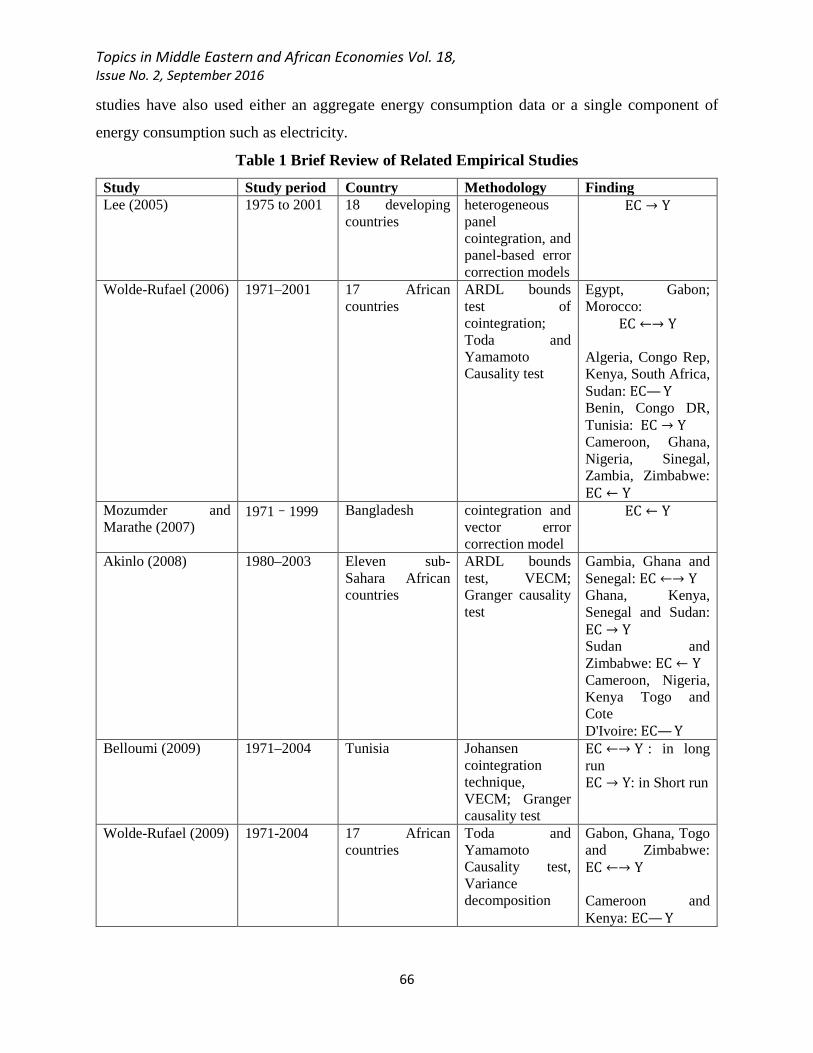
studies have also used either an aggregate energy consumption data or a single component of
energy consumption such as electricity.
Table 1 Brief Review of Related Empirical Studies
Study Study period Country Methodology Finding Lee (2005) 1975 to 2001 18 developing
countries heterogeneous panel cointegration, and panel-based error correction models
EC → Y
Wolde-Rufael (2006) 1971–2001 17 African countries
ARDL bounds test of cointegration; Toda and Yamamoto Causality test
Egypt, Gabon; Morocco:
EC ←→ Y Algeria, Congo Rep, Kenya, South Africa, Sudan: EC— Y Benin, Congo DR, Tunisia: EC → Y Cameroon, Ghana, Nigeria, Sinegal, Zambia, Zimbabwe: EC ← Y
Mozumder and Marathe (2007)
1971–1999 Bangladesh cointegration and vector error correction model
EC ← Y
Akinlo (2008) 1980–2003 Eleven sub-Sahara African countries
ARDL bounds test, VECM; Granger causality test
Gambia, Ghana and Senegal: EC ←→ Y Ghana, Kenya, Senegal and Sudan: EC → Y Sudan and Zimbabwe: EC ← Y Cameroon, Nigeria, Kenya Togo and Cote D'Ivoire: EC— Y
Belloumi (2009) 1971–2004 Tunisia Johansen cointegration technique, VECM; Granger causality test
EC ←→ Y : in long run EC → Y: in Short run
Wolde-Rufael (2009) 1971-2004 17 African countries
Toda and Yamamoto Causality test, Variance decomposition
Gabon, Ghana, Togo and Zimbabwe: EC ←→ Y Cameroon and Kenya: EC— Y

Topics in Middle Eastern and African Economies Vol. 18, Issue No. 2, September 2016
67
Algeria, Benin and South Africa:EC → Y Egypt, Ivory Coast, Morocco, Nigeria, Senegal, Sudan, Tunisia and Zambia: EC ← Y
Menegaki (2011)
1997–2007 27 European countries
random effect model
EC— Y
Fuinhas and Marques (2012)
1965 -2009 Portugal, Italy, Greece, Spain and Turkey
ARDL bounds test approach, VECM
EC ←→ Y
Shahbaz et al. (2012)
1972–2011 Pakistan ARDL bounds test approach, VECM
EC ←→ Y
Apergis and Payne (2012)
1990–2007 80 countries panel cointegration test Engle and Granger (1987) two-step procedure
EC ←→ Y
Yıldırım et al. (2014) 1980-2011
Bangladesh, Egypt, Indonesia, Iran, Korea, Mexico, Pakistan and Philippines, Turkey.
bootstrapped autoregressive metric causality approach
EC— Y
Mohammadi and Parvaresh (2014)
1980–2007 14 oil-exporting countries
dynamic fixed effect, pooled and mean-group estimators
EC ←→ Y
Bloch et al (2015) 1977-2013 China ARDL bounds test approach, VECM
EC ←→ Y
EC and Y refer to energy consumption and real GDP. EC → Y indicates a unidirectional causality from energy consumption to economic growth while EC ← Y indicates that causality runs from economic growth to energy consumption. EC ←→ Y indicates a two-way causality and EC— Y indicates no causality. VAR refers to Vector Auto Regressive model, ECM refers to Error Correction Model, ARDL refers to Auto Regressive Distributed Lag model.
The relationship between energy consumption and GDP could be unstable due to the existence
of structural breaks in the time series resulting from an exogenous shock to the regime. Perron
(1989) and Zivot and Andrews (1997) showed that failure to allow for structural breaks when

Topics in Middle Eastern and African Economies Vol. 18, Issue No. 2, September 2016
68
testing for unit in the series result in wrong inferences. Accordingly, these authors proposed
determining the structural break point ‘endogenously’ from the data.
Previous related studies have mostly used aggregated data on energy use, or a single
component of energy use such as electricity or renewable energy, to examine its causal relationship
with economic growth. The use of aggregated data could suffer from ‘‘aggregation bias’’ where
significant small-level causal relationships might be masked within data series of a larger level of
aggregation.
To overcome the limitations of previous studies, the current paper uses aggregated as well as
disaggregate data of different components of energy consumption. The level of data aggregation
may also affect the direction of causality between energy consumption and economic growth.
Using data from Taiwan, Lee and Chang (2005) find different directions of causality between GDP
and various kinds of energy consumption. In particular, they find a bi-directional causal linkage
between GDP and both total energy and coal consumption while a unidirectional causality running
from oil consumption and gas consumption to GDP.
The mixed findings in previous studies could in part be explained by differences with respect
to the used econometric technique, time period covered, data sets and level of data aggregation.
There are naturally institutional, socio-economic differences between countries. Countries may
also differ in their energy-related policies, energy supplies and pattern of energy consumption.
Accordingly, it is to be expected that, in practice, the energy consumption-economic growth
relationship is country-specific, and varies depending on the period under investigation. While the
extant literature is largely dominated by cross-country studies, few individual country studies have
investigated the relationship between energy consumption or electricity consumption and
economic growth.
This paper adds to the growing number of individual country studies which investigate the
relationship between energy consumption and economic growth by focusing on the specific case
of Egypt.
3. Evolution of the Energy Sector in Egypt
Egypt is the largest non-OPEC oil producer and the second largest natural gas producer in
Africa. Meanwhile, Egypt is the biggest consumer of oil and natural gas, with over 20% and 40%
of total oil and dry natural gas consumption in the continent based on 2013 statistics (Energy
Information Administration, 2013). The strategic geographical location helps Egypt to play a
Topics in Middle Eastern and African Economies Vol. 18, Issue No. 2, September 2016
69
prominent role in the international energy markets through operating the Suez Canal and Suez-
Mediterranean (SUMED) Pipeline, an important transit points for oil and natural gas shipments
from the Arab Gulf countries to Europe.
Over 90 percent of Egypt’s energy consumption is currently satisfied by oil and natural gas.
Though oil production has been declining in recent years, substantial expansion has been taking
place in the production of dry natural gas due to major recent discoveries and substantial
investments in that sector. During the last decade, natural gas production has more than doubled,
increasing from 646 billion cubic feet (bcf) in 2000 to 2141 (bcf) in 2012 which enabled Egypt to
be a net exporter of natural gas since 2003. Nonetheless, Egypt became a net importer of oil since
2012.
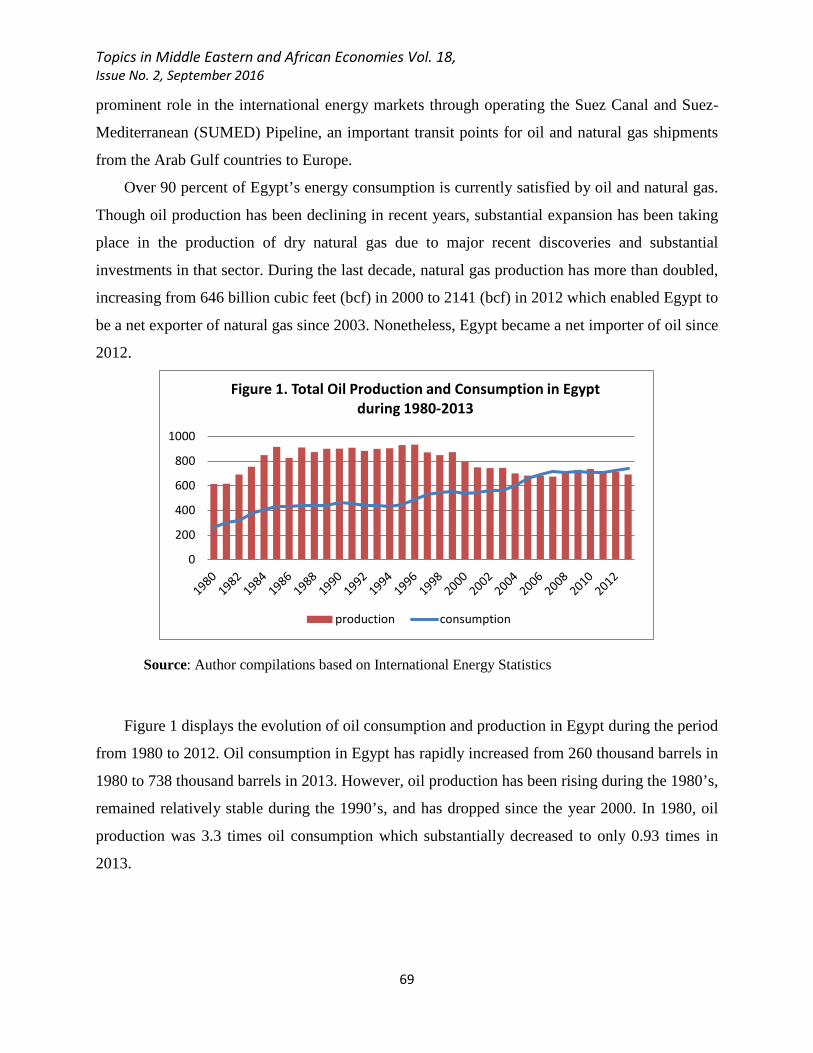
Source: Author compilations based on International Energy Statistics
Figure 1 displays the evolution of oil consumption and production in Egypt during the period
from 1980 to 2012. Oil consumption in Egypt has rapidly increased from 260 thousand barrels in
1980 to 738 thousand barrels in 2013. However, oil production has been rising during the 1980’s,
remained relatively stable during the 1990’s, and has dropped since the year 2000. In 1980, oil
production was 3.3 times oil consumption which substantially decreased to only 0.93 times in
2013.
0
200
400
600
800
1000
Figure 1. Total Oil Production and Consumption in Egypt during 1980-2013
production consumption

Topics in Middle Eastern and African Economies Vol. 18, Issue No. 2, September 2016
70
Source: Author compilations based on International Energy Statistics
Figure 2 depicts the evolution of total primary energy consumption and production in Egypt
over the period 1980-2012. Data shows that Egypt has remained a net exporter of primary energy,
though the amount of exports has been declining over time, dropping from 1.1092 in 1993 to 0.269
Quadrillion Btu in 2012. Consumption of primary energy grew at an average rate of 7.4% during
the 1980’s, 3.5% during the 1990’s, and at 5% during the new millennium. On the other hand,
primary energy production grew at a slower rate than consumption. During 1980’s, the average
growth rate of primary energy production was 5.2%, 0.8% during the 1990’s, and 3.5% afterwards.
Source: Author compilations based on International Energy Statistics
012345
Figure 2. Total Primary Energy Consumption and Production in Egypt (Quadrillion Btu)
production consumption
0
500
1000
1500
2000
2500 Figure 3. Dry Natural Gas Production, Consumption and Exports in Egypt (Billion Cubic Feet)
production consumption
Topics in Middle Eastern and African Economies Vol. 18, Issue No. 2, September 2016
71
Figure 3 displays the development of dry natural gas production and consumption over the
study period and shows that Egypt's natural gas sector has been expanding rapidly, as production
has increased substantially from 30 billion cubic feet (bcf) in 1980, to 646 bcf in 2000, reaching
2141 bcf in 2012. Since 2003, Egypt has become a net exporter of natural gas with substantial
increase in net exports from 12.36 bcf in 2003 to 647 bcf in 2009 before dropping back to 259 bcf
in 2012.
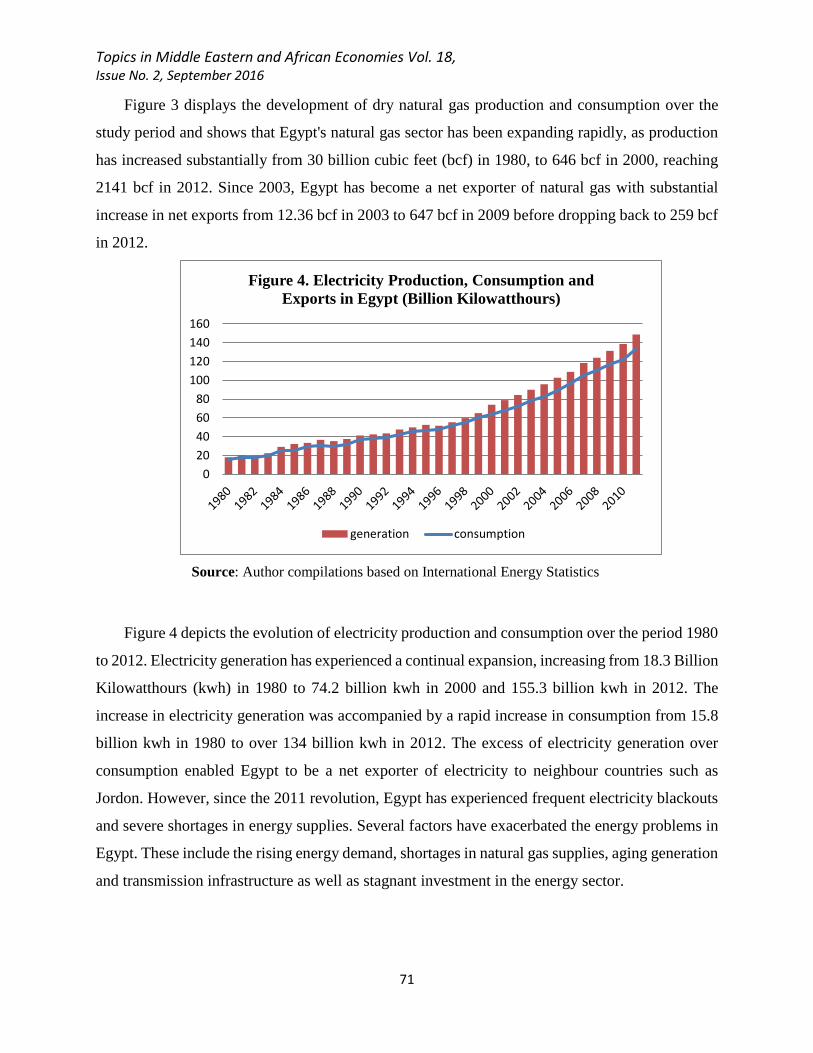
Source: Author compilations based on International Energy Statistics
Figure 4 depicts the evolution of electricity production and consumption over the period 1980
to 2012. Electricity generation has experienced a continual expansion, increasing from 18.3 Billion
Kilowatthours (kwh) in 1980 to 74.2 billion kwh in 2000 and 155.3 billion kwh in 2012. The
increase in electricity generation was accompanied by a rapid increase in consumption from 15.8
billion kwh in 1980 to over 134 billion kwh in 2012. The excess of electricity generation over
consumption enabled Egypt to be a net exporter of electricity to neighbour countries such as
Jordon. However, since the 2011 revolution, Egypt has experienced frequent electricity blackouts
and severe shortages in energy supplies. Several factors have exacerbated the energy problems in
Egypt. These include the rising energy demand, shortages in natural gas supplies, aging generation
and transmission infrastructure as well as stagnant investment in the energy sector.
020406080
100120140160
Figure 4. Electricity Production, Consumption and Exports in Egypt (Billion Kilowatthours)
generation consumption

Topics in Middle Eastern and African Economies Vol. 18, Issue No. 2, September 2016
72
4. Data
Data on energy consumption including primary energy, coal, electricity, oil and natural gas
are obtained from International Energy Statistics. Data on GDP (in constant 2000 US dollars) and
gross fixed capital formation are obtained from World Development Indicators (WDI) issued by
the World Bank (2013). The analysis covers the period from 1980 to 2012. All variables are
expressed in real, per capita, and natural logarithmic form. Figure 5 plots the variables under
investigation over the study period.
Figure 5. Capital, GDP and energy consumption in Egypt during 1980-2012
Source: Data on GDP (in constant 2000 US dollars) and gross fixed capital formation are obtained from World Development Indicators; Data on energy consumption are obtained from International Energy Statistics.
4.8
5.0
5.2
5.4
5.6
5.8
6.0
1980 1985 1990 1995 2000 2005 2010
Ln (per-capita real gross capital formation)
6.4
6.6
6.8
7.0
7.2
7.4
1980 1985 1990 1995 2000 2005 2010
Ln (per-capita real GDP)
2.8
3.0
3.2
3.4
3.6
3.8
1980 1985 1990 1995 2000 2005 2010
Ln (percapita primary energy consumption)
-12.1
-12.0
-11.9
-11.8
-11.7
-11.6
-11.5
1980 1985 1990 1995 2000 2005 2010
Ln ( per-capita oil consumption)
-15
-14
-13
-12
-11
-10
1980 1985 1990 1995 2000 2005 2010
Ln (percapita natural gas consumption)
-15.2
-14.8
-14.4
-14.0
-13.6
-13.2
1980 1985 1990 1995 2000 2005 2010
Ln (per-capita electricity consumption)
-11.0
-10.9
-10.8
-10.7
-10.6
-10.5
-10.4
-10.3
1980 1985 1990 1995 2000 2005 2010
Ln (per-capita coal consumption)

Topics in Middle Eastern and African Economies Vol. 18, Issue No. 2, September 2016
73
5. Econometric Methodology
5.1. New-classical production function
To examine the relationship between energy consumption and economic growth, this paper
uses a neo-classical one-sector aggregate production function with labour; capital and energy used
as separate inputs in the production technology.3 A new-classical production function that relates
output to a set of inputs could be expressed as in equation (1).
𝑌𝑌𝑡𝑡 = 𝑓𝑓 (𝐾𝐾𝑡𝑡, 𝐿𝐿𝑡𝑡 ,𝐸𝐸𝑡𝑡) = 𝐴𝐴𝑡𝑡 𝐾𝐾𝑡𝑡𝛼𝛼 𝐿𝐿𝑡𝑡𝛽𝛽 𝐸𝐸𝑡𝑡
𝛾𝛾 (1)
In which 𝑌𝑌 is the real GDP, 𝐾𝐾 is the real physical capital stock, 𝐿𝐿 is labor input and 𝐸𝐸 is energy
input. With a constant return to scale Cobb-Douglas production function,𝛼𝛼 + 𝛽𝛽 + 𝛾𝛾 = 1, and by
taking the natural logarithm, Eq.(1) would be expressed in per-capita form as in Equation (2).
𝐿𝐿𝐿𝐿 𝑦𝑦𝑡𝑡 = 𝛽𝛽0 + 𝛽𝛽1 𝐿𝐿𝐿𝐿 𝑒𝑒𝑡𝑡 + 𝛽𝛽2 𝐿𝐿𝐿𝐿 𝑘𝑘𝑡𝑡 + 𝑢𝑢1,𝑡𝑡 (2)
Where 𝑦𝑦𝑡𝑡 is the per-capita real GDP, 𝑒𝑒𝑡𝑡is the per-capita real energy consumption, and 𝑘𝑘𝑡𝑡 is the
per-capita real capital stock. Where: 𝑦𝑦𝑡𝑡 = 𝑌𝑌𝑡𝑡𝐿𝐿𝑡𝑡
; 𝑒𝑒𝑡𝑡 = 𝐸𝐸𝑡𝑡𝐿𝐿𝑡𝑡
; 𝑘𝑘𝑡𝑡 = 𝐾𝐾𝑡𝑡𝐿𝐿𝑡𝑡
. 𝛽𝛽1 and 𝛽𝛽2 are the elasticities of
per-capita real output with respect to the per-capita real energy and per-capita real capital inputs.
5.2. Unit root tests
The econometric analysis starts with pre-testing all time series for unit root, to ensure a non-
spurious estimation, and to have time-invariant estimates. Two traditional unit root tests are used;
the Augmented Dickey-Fuller (ADF) (Dickey and Fuller, 1979) test, and the Phillips-Perron (PP)
(Phillips and Perron, 1988) test.
One shortcoming of these traditional tests is that they do not account for structural breaks in
a time series. Time series data may be characterized by the existence of structural breaks or a shift
in the underlying regime. Failing to control for structural breaks in the time series when testing for
unit root, could lead to inaccurate hypothesis testing (Perron, 1989). While Zivot and Andrews
3 This framework has been used by several previous studies such as Ghali and Elsakka (2004) who examined the relationship between energy use and output growth in Canada.

Topics in Middle Eastern and African Economies Vol. 18, Issue No. 2, September 2016
74
(2002) developed a way that allows for an endogenously determined single structural break, while
Clemente et al., (1998) proposed a test to endogenously account for two structural breaks in a
series. This test has two versions, one that allows for any gradual shift in the mean of the series
known as Innovational Outlier ( IO model), and the other version of the test allows for a sudden
shift in the time series known as Additive Outlier (AO model). In addition to ADF, and PP tests,
the current paper uses both Zivot and Andrews (2002), and Clemente et al., (1998) tests to allow
for the possibility of structural breaks in the time series.
5.3. Toda and Yamamoto Granger Causality Test
To test for the existence of a causal relationship between energy consumption and economic
growth, a modified version of the Granger causality test due to Toda and Yamamoto (1995) is
used. Conducting the Toda and Yamamoto (1995) procedure has a set of steps that will be
explained as follows: The first step involves determining the order of integration of all the time
series using any of the unit root tests such as ADF, PP and KPSS. Based on the result of these unit
root tests, let the maximum order of integration for the group of time-series be 𝑚𝑚. The second step
involves estimating a Vector Auto Regressive (VAR) model of the variables in their levels with
optimal lag length 𝑃𝑃 determined based on any of the information criteria, such as Akaike
Information Criterion (AIC), or the Schwarz Information Criterion (SIC). In a third step, we add
m additional lags of all the variables into the system of VAR equations. Finally, we test for
Granger causality using the usual Wald test which is now valid and asymptotically chi-square
distributed. The idea behind the addition of 𝑚𝑚 additional lags of each variable in the VAR model
is to correct for any 'nuisance parameters' in the asymptotic distribution of the Wald test statistic's
if some of the series are non-stationary. It is worth mentioning the additional 𝑚𝑚 lags of the
variables are not included when conducting the Wald test.
The Toda-Yamamoto Granger causality test is applied to the following Vector Auto
Regressive (VAR) model which is estimated using Seemingly Unrelated Regression (SUR) model.
ln 𝑦𝑦𝑡𝑡 = 𝑎𝑎1 + ∑ 𝑏𝑏1𝑖𝑖 ln𝑦𝑦𝑡𝑡−𝑖𝑖𝑝𝑝𝑖𝑖=1 + ∑ 𝑏𝑏2𝑖𝑖 𝑙𝑙𝐿𝐿𝑦𝑦𝑡𝑡−𝑖𝑖
𝑝𝑝+𝑚𝑚𝑖𝑖=𝑝𝑝+1 + ∑ 𝑐𝑐1𝑖𝑖 ln 𝑒𝑒𝑡𝑡−𝑖𝑖
𝑝𝑝𝑖𝑖=1 + ∑ 𝑐𝑐2𝑖𝑖 𝑙𝑙𝐿𝐿𝑒𝑒𝑡𝑡−𝑖𝑖
𝑝𝑝+𝑚𝑚𝑖𝑖=𝑝𝑝+1 +
∑ 𝑑𝑑1𝑖𝑖 ln 𝑘𝑘𝑡𝑡−𝑖𝑖𝑝𝑝𝑖𝑖=1 + ∑ 𝑑𝑑2𝑖𝑖 𝑙𝑙𝐿𝐿𝑘𝑘𝑡𝑡−𝑖𝑖
𝑝𝑝+𝑚𝑚𝑖𝑖=𝑝𝑝+1 + 𝑢𝑢1𝑡𝑡 (3)
𝑙𝑙𝐿𝐿 𝑒𝑒𝑡𝑡 = 𝑎𝑎2 + ∑ 𝑓𝑓1𝑖𝑖 𝑙𝑙𝐿𝐿 𝑒𝑒𝑡𝑡−𝑖𝑖
𝑝𝑝𝑖𝑖=1 + ∑ 𝑓𝑓2𝑖𝑖 𝑙𝑙𝐿𝐿𝑒𝑒𝑡𝑡−𝑖𝑖
𝑝𝑝+𝑚𝑚𝑖𝑖=𝑝𝑝+1 + ∑ 𝑔𝑔1𝑖𝑖 𝑙𝑙𝐿𝐿 𝑦𝑦𝑡𝑡−𝑖𝑖
𝑝𝑝𝑖𝑖=1 + ∑ 𝑔𝑔2𝑖𝑖 𝑙𝑙𝐿𝐿𝑦𝑦𝑡𝑡−𝑖𝑖
𝑝𝑝+𝑚𝑚𝑖𝑖=𝑝𝑝+1 +
∑ ℎ1𝑖𝑖 𝑙𝑙𝐿𝐿 𝑘𝑘𝑡𝑡−𝑖𝑖𝑝𝑝𝑖𝑖=1 + ∑ ℎ2𝑖𝑖 𝑙𝑙𝐿𝐿𝑘𝑘𝑡𝑡−𝑖𝑖
𝑝𝑝+𝑚𝑚𝑖𝑖=𝑝𝑝+1 + 𝑢𝑢2𝑡𝑡 (4)
Topics in Middle Eastern and African Economies Vol. 18, Issue No. 2, September 2016
75
ln𝑘𝑘𝑡𝑡 = 𝑎𝑎3 + ∑ 𝑗𝑗1𝑖𝑖 ln𝑘𝑘𝑡𝑡−𝑖𝑖
𝑝𝑝𝑖𝑖=1 + ∑ 𝑗𝑗2𝑖𝑖 𝑙𝑙𝐿𝐿𝑘𝑘𝑡𝑡−𝑖𝑖
𝑝𝑝+𝑚𝑚𝑖𝑖=𝑝𝑝+1 + ∑ 𝑙𝑙1𝑖𝑖 ln 𝑒𝑒𝑡𝑡−𝑖𝑖
𝑝𝑝𝑖𝑖=1 + ∑ 𝑙𝑙2𝑖𝑖 𝑙𝑙𝐿𝐿𝑒𝑒𝑡𝑡−𝑖𝑖
𝑝𝑝+𝑚𝑚𝑖𝑖=𝑝𝑝+1 +
∑ 𝑟𝑟1𝑖𝑖 ln𝑦𝑦𝑡𝑡−𝑖𝑖𝑝𝑝𝑖𝑖=1 + ∑ 𝑟𝑟2𝑖𝑖 𝑙𝑙𝐿𝐿𝑦𝑦𝑡𝑡−𝑖𝑖
𝑝𝑝+𝑚𝑚𝑖𝑖=𝑝𝑝+1 + 𝑢𝑢3𝑡𝑡 (5)
Where 𝑦𝑦𝑡𝑡 is the per-capita real GDP, 𝑒𝑒𝑡𝑡is the per-capita real energy consumption, and 𝑘𝑘𝑡𝑡 is
the per-capita real capital stock and 𝑢𝑢𝑖𝑖𝑡𝑡 for i=1, 2 3 are white noise error terms. 𝑃𝑃 is the optimal lag
length, 𝑚𝑚 is the maximum order of integration for the time-series.
The conservation hypothesis, which asserts a one-way causality running from economic
growth to energy consumption, is confirmed if g1i ≠ 0 ∀i in equation 4. Support for the growth
hypothesis of a one-way causality from energy consumption to economic growth exists if c1i ≠ 0
∀i in equation 3. A bidirectional causality between energy consumption and economic growth, i.e.
the feedback hypothesis, will hold if both c1i ≠ 0 ∀i and g1i ≠ 0 ∀i in equations 3 and 4, while
the neutrality hypothesis holds if both c1i = 0 ∀i and g1i = 0 ∀i.
6. Empirical Results
6.1.Unit Root Tests
Results of the ADF and PP unit root tests for the variables in levels and in first differences are
reported in Tables 2 and 3 respectively. According to the both the ADF and PP tests, both the per-
capita real GDP and per-capita real gross capital formation time series are non stationary at level
across all specifications of the tests, and they become stationary at their first difference. In other
words, both ln 𝑦𝑦 and ln 𝑘𝑘 are integrated of order one I(1). For the energy consumption series, both
the ADF and PP tests show that the aggregate primary energy consumption, and all its
disaggregated components, are stationary in level I(0) in the specification which includes an
intercept and a trend which is a relevant specifications since the energy consumption time series
shows an upward trend as evident in figures 1 to 4. When unit roots tests are conducted using the
first difference of the energy consumption series, all energy consumption series are stationary
based on both the ADF and PP tests and across all test specifications.
Results of the Zivot-Andrews structural break unit root test for all variables at level and first
difference are presented in Table 4. Results show that time series of GDP, electricity, natural gas,
coal and oil are all stationary at level with a single structural break in 1991, 1988, 2006, 1998 and
1991 respectively, while physical capital and total primary energy are non stationary at level with

Topics in Middle Eastern and African Economies Vol. 18, Issue No. 2, September 2016
76
a single structural break in 1991 and 2001 respectively. Results also show that all time series, at
first difference, become stationary with structural breaks shown in the table. As shown in Table 4,
all t-statistics are statistically significant which imply rejection of the null hypothesis of having a
unit root with a structural break.
Results of the Clemente et al., (1998) unit root test are presented in Table 5 for both versions
the Additive Outlier and Innovational Outlier versions. Results show that the time series of all
variables are non stationary at levels with two structural breaks under the Additive Outlier version
of the test. For electricity, natural gas, and coal time series, the first structural break TB1, took
place in 1990, and in 1991 for GDP and 1992 for oil and 1988 for physical capital and 1995 for
total primary energy consumption. The second structural break TB2 took place in 1999 for physical
capital, 2000 for electricity and natural gas, 2001 for GDP and oil and 1996 for coal. Under the
Innovational Outlier version of the Clemente et al.,(1998) unit root test, it is only natural gas and
coal time series that are stationary at level with two structural breaks in 1998 and 2007 for natural
gas and 1988 and 1996 for coal. The structural breaks identified by the unit root tests coincides
with the 1990 oil price shock accompanying the first Gulf war and the implementation of the
Economic Reform and Structural Adjustment Programme (ERSAP) .
In 1991, Egypt adopted a battery of reform policies under the ERSAP after consultation with
the IMF and the World Bank, to restore the internal as well as the external balance. Liberalization
of the domestic prices of energy products was an integral part of this program and has resulted in
a substantial increase in energy prices in Egypt. As part of the ERSAP, the Egyptian government
raised the petroleum prices to 100% of the international prices, and electricity prices to 74% of
long-run marginal costs. This was synchronized with an oil price spike after the Iraqi Invasion to
Kuwait which was followed by the first Gulf was in 1991.

Topics in Middle Eastern and African Economies Vol. 18, Issue No. 2, September 2016
77
Table 2. ADF and PP Unit root tests of variables in levels
GDP Capital Total Primary energy
Electricity Natural gas Coal oil
ADF PP ADF PP ADF PP ADF PP ADF PP ADF PP ADF PP Intercept -0.19 -0.19 -0.75 -1.15 -1.88 -1.88 -1.73 -1.29 -4.53*** -4.07*** -3.47** -3.61** -4.48*** -4.14***
Trend and intercept
-1.72 -1.95 -1.01 -1.19 -3.88** -3.88** -3.58** -3.77** -5.51*** -11.70*** -6.69*** -7.17*** -3.99** -3.79**
No trend and intercept
8.88 7.96 0.53 0.40 3.24 3.22 -5.57*** -6.53*** -4.56*** -3.71*** 0.43 -0.08 -0.59 -1.15
*, **, *** indicate rejection of the null hypothesis at 10%, 5% and 1% level of significance, respectively. For the ADF test, the hypotheses of interest are 𝐻𝐻0: series has a unit root versus H1: series is stationary. The ADF augments the test using p lags of the dependent variable to ensure that the error terms of the test are not autocorrelated. The Schwarz Bayesian Information Criterion (SBIC) is used to determine the optimal lag length of the ADF test. Three versions for both the ADF and PP tests are used; one version allows for an intercept, a second allows for an intercept and a deterministic trend, and a third version excludes both the intercept and the deterministic trend. The null hypothesis is rejected if the ADF statistic, defined as the t-ratio of the coefficient γ in equation (1), is greater that the critical value from the Dickey-Fuller table. The PP test is similar to the ADF test but it uses a non-parametric correction of any serial correlation and heteroskedasticity in the errors (ut) of the test regression by directly modifying the test statistics Table 3. Unit root tests of variables in first difference
GDP Capital Total Primary energy
Electricity Natural gas Coal oil
ADF PP ADF PP ADF PP ADF PP ADF PP ADF PP ADF PP Intercept -3.88*** -3.93*** -3.87*** -3.84*** -5.61*** -6.41*** -3.76*** -8.92*** -3.62** -4.26*** -5.63*** -29.05*** -3.98*** -4.10***
Trend and intercept
-3.55* -3.76** -3.96** -3.93** -5.52*** -5.80*** -3.59** -9.67*** -3.16* -4.05** -5.51*** -29.25*** -3.90** -4.23**
No trend and intercept
-1.78* -1.78* -3.92*** -3.89*** -4.53*** -4.53*** -2.08** -4.14*** -3.10*** -3.45*** -8.65*** -14.38*** -4.09*** -4.19***
*, **, *** indicate rejection of the null hypothesis at 10%, 5% and 1% level of significance, respectively. For the ADF test, the hypotheses of interest are 𝐻𝐻0: series has a unit root versus 𝐻𝐻1: series is stationary. The ADF augments the test using 𝑝𝑝 lags of the dependent variable to ensure that the error terms of the test are not autocorrelated. The Schwarz Bayesian Information Criterion (SBIC) is used to determine the optimal lag length of the ADF test. For the KPSS test, the hypotheses of interest are 𝐻𝐻0: series is stationary versus 𝐻𝐻1: series has a unit root.

Topics in Middle Eastern and African Economies Vol. 18, Issue No. 2, September 2016
78
Table 4. Zivot-Andrews structural break trended unit root test. At level At first difference T-statistic Time break T-statistic Time break GDP -4.83* (1) 1991 -5.28** (0) 1988 Physical capital -4.79 (1) 1991 -5.23** (0) 1994 Total primary energy
-4.32 (0) 2001 -7.24*** (0) 1994
Electricity -6.58*** (0) 1988 -10.03*** (1) 1987 Natural gas -6.30*** (0) 2006 -5.63*** (0) 1986 Coal -7.25*** (0) 1998 -6.11*** (2) 1990 Oil -6.54*** (2) 1991 -4.96* (0) 1986
For Zivot-Andrews structural break trended unit root test, the hypotheses of interest are H0: the time series has a unit root with a structural break versus 𝐻𝐻1: time series is stationary with a structural break. *, **, *** indicate rejection of the null hypothesis at 10%, 5% and 1% level of significance, respectively
Table 5. Clemente-Montanes-Reyes unit root test with double mean shifts Additive Outlier Innovative outliers Variable T-statistic TB1 TB2 T-statistic TB1 TB2 GDP -2.48 1991 2001 -3.68 1993 2004 Physical capital -3.71 1988 1999 -2.94 1984 2004 Total primary energy
-3.83 1995 2002 -5.41 1992 2006
Electricity -2.91 1990 2000 -2.84 1996 2001 Natural gas -4.28 1990 2000 -5.65** 1998 2007 Coal -3.83 1990 1996 -6.97** 1988 1996 Oil -4.71 1992 2001 -5.04 1994 2002
TB1 and TB2 are the dates of the structural breaks and ** indicates rejection of the null hypothesis at 5% level. For the Clemente, Montanes and Reyes test, the hypotheses of interest are 𝐻𝐻0: the time series has a unit root with structural breaks versus 𝐻𝐻1: time series is stationary with structural breaks.
In the beginning of the new millennium, a worldwide energy crisis took place. At the
beginning of 1999 oil price was $10 a barrel. In the second half of 2000 it reached over $30. Since
then energy prices have been increasing due to the continued global increases in oil demand
coupled with production stagnation and the falling value of U.S. dollar.
6.2. Results of Toda and Yamamoto Causality Test
Results of various unit root tests presented in the previous section show that the maximum
order of integration of the time series is one, i.e. m = 1. The optimal lag length of the unrestricted

Topics in Middle Eastern and African Economies Vol. 18, Issue No. 2, September 2016
79
VAR models is one, determined based on the different information criteria, AIC, SBIC. Results of
the Toda-Yamamoto causality test are presented in Table 7.
The order of integration of the time series varied across the different unit rot tests. To avoid
the problems associated with wrong determination of the order of integration and the cointegration
properties among the time series, Toda and Yamamoto (1995) proposed a modified Wald test by
augmenting the standard Granger causality test through adding extra lags of each variable in the
VAR model to correct for any 'nuisance parameters' in the asymptotic distribution of the Wald test
statistic's if some of the series are non-stationary. This modified Wald test statistic could then be
used to make valid inferences about causality. Toda Yamamoto approach fits a standard VAR
model in the levels of the variables instead of the first differences as in the case of the regular
Granger causality test.
Results of the Toda- Yamamoto Granger non-causality test are presented in Table 6. Results
show no causal relationship between total primary energy consumption and economic growth,
supporting the neutrality hypothesis. As shown in panel A of Table 6, the modified Wald Statistics
are not statistically significant. Hence, we fail to reject the null hypothesis that total primary energy
consumption does not Granger cause real GDP. Likewise, we also fail to reject the null hypothesis
that real GDP does not Granger cause total primary energy consumption. Panel A also shows no
causal relationship between primary energy consumption and physical capital. Based on the
modified Wald Statistics, which are not statistically significant, we fail to reject the null hypothesis
that primary energy consumption does not Granger cause physical capital and we also fail to reject
that physical capital does not Granger cause primary energy consumption.
When the analysis is stratified by energy type, a one way positive causal relation running from
economic growth to electricity and oil consumption was found which is consistent with the
conservation hypothesis. Results depicted in panel B shows no causality between electricity
consumption and physical capital. The modified Wald Statistics fail to reject the null hypothesis
that electricity consumption does not Granger cause physical capital and we also fail to reject that
physical capital does not Granger cause electricity consumption. As for the relationship between
electricity consumption and economic growth, a unidirectional causality running from real GDP
to electricity consumption is found based on the modified Wald statistics which is statistically
significant at 5% significance level. In Panel C, a unidirectional positive causality running from
real GDP to oil consumption is found as the null hypothesis that GDP does not Granger causes oil

Topics in Middle Eastern and African Economies Vol. 18, Issue No. 2, September 2016
80
consumption is rejected since the Wald statistic is significant. While we fail to reject the null
hypothesis that oil consumption does not Granger cause real GDP. In addition, results show that
oil consumption Granger causes physical capital while the other direction of causality does not
hold.
Panel D presents results of the Granger non-causality test for natural gas consumption. None
of the Wald statistics is significant and hence we fail to reject the null hypotheses of no causal
relationship between natural gas consumption, real GDP and physical capital. Similarly, panel E
shows no causality between coal consumption and real GDP as we fail to reject the null hypotheses
of no Granger causality based on the Wald statistics which supports the neutrality hypothesis.

Topics in Middle Eastern and African Economies Vol. 18, Issue No. 2, September 2016
81
Table 6 Toda- Yamamoto Granger non-causality test Null Hypothesis Modified Wald
Statistics Sum of lagged
coefficients Direction of
causality Panel A: Total Primary Energy Consumption
Total primary energy consumption does not Granger cause GDP
0.749 -0.083 none
GDP does not Granger cause total primary energy consumption
0.757 0.526 none
Total primary energy consumption does not Granger cause physical capital
0.11 -0.212 none
Physical capital does not Granger cause total primary energy consumption
0.30 0.054 none
Panel B: Electricity consumption Electricity consumption does not Granger cause GDP
0.837 0.087 none
GDP does not Granger cause electricity consumption
3.33** 1.159 Y to Electricity
Electricity consumption does not Granger cause physical capital
0.361 0.375 none
Physical capital does not Granger cause Electricity consumption
0.187 -0.042 none
Panel C: Oil Consumption Oil Consumption does not Granger cause GDP
0.202 0.048 none
GDP does not Granger cause oil consumption
3.358** 0.929 Y to oil
Oil consumption does not Granger cause physical capital
3.944** 1.27 Oil to K
physical capital does not Granger cause oil consumption
0.001 0.003 none
Panel D: Natural Gas Consumption Natural gas consumption does not Granger cause GDP
0.88 -0.034 none
GDP does not Granger cause natural gas consumption
0.012 -0.159 none
Natural gas consumption does not Granger cause Physical capital
1.44 -0.29 none
Physical capital does not Granger cause natural gas consumption
0.20 -0.105 none
Panel E: Coal Consumption GDP does not Granger cause coal consumption
0.139 -0.735 none
Coal consumption does not Granger cause GDP
0.029 0.005 none
Coal consumption does not Granger cause physical capital
0.050 0.044 none
Physical capital does not Granger cause coal consumption
0.506 -0.20 none

Topics in Middle Eastern and African Economies Vol. 18, Issue No. 2, September 2016
82
** indicates rejection of the null hypothesis at 5% significance level.
7. Conclusions and Policy implications
This paper investigated the causal relationship between energy consumption and economic
growth in Egypt at the disaggregated level, during the period 1980-2012, within a multivariate
framework by including measures for capital and labor in the aggregate production function. To
endogenously control for any potential structural breaks when checking the stationarity properties
of the energy and growth time series, Zivot and Andrews (2002) and Clemente et al., (1998) unit
root tests are used. The causal relationship between energy consumption and economic growth is
examined using a modified version of the Granger causality test due to Toda and Yamamoto (1995)
to avoid problems resulting from wrong determination of the order of integration of the different
time series.
Causality analyses show now causal relationship between total primary energy consumption
and economic growth, supporting the neutrality hypothesis. When the analysis is stratified by
energy type, a positive unidirectional causal relation from economic growth to electricity and oil
consumption was found which is consistent with the conservation hypothesis. In addition, no
causal relationship was found between physical capital and any of the energy components, except
for oil in which a one way positive causality running from oil consumption to physical capital is
found.
The findings of this paper are consistent with those of Wolde-Rufael (2009) who found a
unidirectional causality running from economic growth to aggregate energy consumption. But in
the current study, economic growth causes only electricity and oil consumption. The finds are also
in line with the findings of Yıldırım et al. (2014) who found no casual relationship between
aggregate energy consumption and economic growth supporting the neutrality hypothesis. In a
previous study, Wolde-Rufael (2006) found positive bidirectional causality between electricity
consumption and economic growth. However, in the current study, a positive unidirectional causal
relation from economic growth to electricity is found.
Since the 2011 revolution, Egypt has experienced frequent electricity blackouts and severe
shortages in energy supplies. Securing a sustainable and reliable supply of energy remains one of
the key challenges that face the current Egyptian government. Recent temporary supplies, from
some Arab-Gulf oil producing countries have helped mitigate short-term energy pressures.

Topics in Middle Eastern and African Economies Vol. 18, Issue No. 2, September 2016
83
Nevertheless, these supplies are temporary in nature and are expected to disappear with the recent
collapse of oil prices.
Several factors have exacerbated the energy problems in Egypt. These include the expanding
energy demand, shortages in natural gas supplies, aging generation and transmission infrastructure
as well as stagnant investment in the energy sector. Understanding the nature of these problems is
vital for developing appropriate solutions. New investments in the power sector, renovation of
existing aging infrastructure, as well as the proper management of energy demand has to be at the
core of any energy reform policy in Egypt. To face the high and expanding energy demand, several
policy reforms have been recently implemented by the Egyptian government. These include
subsidy reform whereby the government reduced the subsidy on energy for heavy industries and
household electricity use. The energy subsidies have accounted for a considerable fraction of the
government expenditure with a cost of $26 billion in 2012 and have contributed to the rising energy
demand and continuous budget deficit. The reduction of energy subsidy was accompanied by the
introduction of a smart card system to direct the subsidies toward the poorest people and increase
its effectiveness. Expansion of power generated from renewable sources specially wind and solar
could also be a promising solution.
Conflict of Interests
The author declares that there is no conflict of interests regarding the publication of this paper.

Topics in Middle Eastern and African Economies Vol. 18, Issue No. 2, September 2016
84
References
Administration, E. (2013). Energy profile of Egypt. Retrieved from http://www.eoearth.org/view/article/152493
Akinlo, A. E. (2008). Energy consumption and economic growth: evidence from 11 Sub-Sahara
African countries. Energy Economics, 30(5), 2391-2400. Apergis, N., & Payne, J. E. (2010). Energy consumption and growth in South America: Evidence
from a panel error correction model. Energy Economics, 32(6), 1421-1426. Apergis, N., & Payne, J. E. (2012). Renewable and non-renewable energy consumption-growth
nexus: Evidence from a panel error correction model. Energy Economics, 34(3), 733-738. Apergis, N., & Tang, C. F. (2013). Is the energy-led growth hypothesis valid? New evidence
from a sample of 85 countries. Energy Economics, 38, 24-31. Belloumi, M. (2009). Energy consumption and GDP in Tunisia: cointegration and causality
analysis. Energy Policy, 37(7), 2745-2753. Bloch, H., Rafiq, S., & Salim, R. (2015). Economic growth with coal, oil and renewable energy
consumption in China: Prospects for fuel substitution. Economic Modelling, 44, 104-115. Chen, P. Y., Chen, S. T., & Chen, C. C. (2012). Energy consumption and economic growth-New
evidence from meta analysis. Energy Policy, 44, 245-255. Clemente, J., Montanes, A., & Reyes, M. (1998). Testing for a unit root in variables with a
double change in the mean. Economics Letters, 59(2), 175-182. Dickey, D. A., & Fuller, W. A. (1979). Distribution of the estimators for autoregressive time
series with a unit root. Journal of the American statistical association, 74(366a), 427-431. Eggoh, J. C., Bangaké, C., & Rault, C. (2011). Energy consumption and economic growth
revisited in African countries. Energy Policy, 39(11), 7408-7421. Engle, R. F., & Granger, C. W. (1987). Co-integration and error correction: representation,
estimation, and testing. Econometrica: journal of the Econometric Society, 251-276. Fuinhas, J. A., & Marques, A. C. (2012). Energy consumption and economic growth nexus in
Portugal, Italy, Greece, Spain and Turkey: An ARDL bounds test approach (1965–2009). Energy Economics, 34(2), 511-517.
Ghali, K. H., & El-Sakka, M. I. (2004). Energy use and output growth in Canada: a multivariate
cointegration analysis. Energy Economics, 26(2), 225-238.

Topics in Middle Eastern and African Economies Vol. 18, Issue No. 2, September 2016
85
Kraft, J., & Kraft, A. (1978). Relationship between energy and GNP. J. Energy Dev.;(United States), 3(2).
Lee, C. C. (2005). Energy consumption and GDP in developing countries: a cointegrated panel
analysis. Energy Economics, 27(3), 415-427. Lee, C. C., & Chang, C. P. (2005). Structural breaks, energy consumption, and economic growth
revisited: evidence from Taiwan. Energy Economics, 27(6), 857-872. Mehrara, M. (2007). Energy consumption and economic growth: the case of oil exporting
countries. Energy policy, 35(5), 2939-2945. Menegaki, A. N. (2011). Growth and renewable energy in Europe: A random effect model with
evidence for neutrality hypothesis. Energy Economics, 33(2), 257-263. Mohammadi, H., & Parvaresh, S. (2014). Energy consumption and output: Evidence from a
panel of 14 oil-exporting countries. Energy Economics, 41, 41-46. Mozumder, P., & Marathe, A. (2007). Causality relationship between electricity consumption
and GDP in Bangladesh. Energy policy, 35(1), 395-402. Ozturk, I. (2010). A literature survey on energy–growth nexus. Energy policy, 38(1), 340-349. Payne, J. E. (2010). Survey of the international evidence on the causal relationship between
energy consumption and growth. Journal of Economic Studies, 37(1), 53-95. Perron, P. (1989). The great crash, the oil price shock, and the unit root hypothesis.
Econometrica: Journal of the Econometric Society, 1361-1401. Phillips, P. C., & Perron, P. (1988). Testing for a unit root in time series regression. Biometrika,
75(2), 335-346. Shahbaz, M., Zeshan, M., & Afza, T. (2012). Is energy consumption effective to spur economic
growth in Pakistan? New evidence from bounds test to level relationships and Granger causality tests. Economic Modelling, 29(6), 2310-2319.
Shahiduzzaman, M., & Alam, K. (2012). Cointegration and causal relationships between energy
consumption and output: Assessing the evidence from Australia. Energy Economics, 34(6), 2182-2188.
Toda, H. Y., & Yamamoto, T. (1995). Statistical inference in vector autoregressions with
possibly integrated processes. Journal of econometrics, 66(1), 225-250. Wolde-Rufael, Y. (2006). Electricity consumption and economic growth: a time series
experience for 17 African countries. Energy Policy, 34(10), 1106-1114.

Topics in Middle Eastern and African Economies Vol. 18, Issue No. 2, September 2016
86
Wolde-Rufael, Y. (2009). Energy consumption and economic growth: the experience of African countries revisited. Energy Economics, 31(2), 217-224.
World Bank, World Development Indicators (WDI): Online Database, World Bank, Washington,
DC, USA, 2013. Yıldırım, E., Sukruoglu, D., & Aslan, A. (2014). Energy consumption and economic growth in
the next 11 countries: the bootstrapped autoregressive metric causality approach. Energy Economics, 44, 14-21
Zachariadis, T. (2007). Exploring the relationship between energy use and economic growth with
bivariate models: New evidence from G-7 countries. Energy economics, 29(6), 1233-1253.
Zivot, E., & Andrews, D. W. K. (2002). Further evidence on the great crash, the oil-price shock,
and the unit-root hypothesis. Journal of Business & Economic Statistics, 20(1), 25-44.