energy® carolinas duke - s.c. energy office · planning scenario that examines tile henelits of a...
TRANSCRIPT
DUKEENERGY®CAROLI NAS
iI fE
PJVERBEND—
rated Resource Plan(Annal Report)
--4
Public
I
(X ONFE
BUZZARD
October 15, 2013
DEC 2013 IRP TABLE OF CONTENTS
ABBREVIATIONS
1. EXECUTIVE SUMMARY
2. SYSTEM OVERVIEW
3. ELECTRiC LOAD FORECAST
4. ENERGY EFFICIENCY ANI) DEMANI) Sll)E MANAGEMENT
5. RENEWABLE ENERGY REQUIREMENTS
6. SCREENING OF GENERATION ALTERNAI1VES
7. RESERVE CRITERIA
8. EVALUATION AND DEVELOPMENT OF THE RESOURCE PLAN
9. SHORT TERM ACTION PLAN
APPEN1)IX A:
APPENDIX B:
APPENDIX C:
APPENDIX I):
APPENI)EX F:
APPEN1)IX F:
APPENDIX G:
APPENDIX II:
APPENDIX I:
APPENI)IX J:
APPENDiX K:
ATTACIIMFN’I’:
43
52
64
74
93
95
102
110
130
134
135
136
PACE
2
4
1 0
13
15
17
22
23
25
38
QUANTI’I’ATlVE ANA LYSI S
I)UKE ENERGY CAROLINAS OWN El) GLNERAI’ION
ELECTRIC i,OAD FORECAST
ENERGY EFFiCiENCY AND I)EMANI) SIDE MANAGEMENT
FUEL SUPPLY
SCREENING OF GENERATION ALTERNA’IiVES
ENVIRONMENTAL COMPLIANCE
NON-Ul1L1tY GENERATION ANI) WHOLESALE
TRANSMISSION PLANNEI) OR tiNDER CONSTRUCI1ON
ECONOMIC I)EVELOPMENT
CROSS-REFERENCEFO 2013 IRP
NC REPS COMPLIANCE PLAN
ABBREVIATIONS
CAIR Clean Air Interstate RuleCAMR Clean Air Mercur RuleCC Combined CycleCCR Coal Combustion ResidualsCECPCN Certificate of Environmental Compatibility and Public Convenience and NecessityCFI, Compact Fluorescent Light bulbsCO Carbon DioxideCOD Commercial Operation Date
COL Combined Construction and Operating License
COWICS Carolinas Offshore Wind Integration Case StudyCPCN Certificate of Public Convenience and NecessityCSAPR Cross State Air Pollution RuleCT Combustion TurbineDC l)irect CurrentDEC Duke Energy CarolinasI)EP l)uke Energ) ProgressDOE Department of EnergyDSM Demand Side ManagementEE Energy EfficiencyEIA Energy Information AdministrationEPA Eiwironmental Protection Agenc)EPRI Electric Power Research InstituteFERC Federal Energy Regulatory CommissionFGD Flue Gas DesulfurizationFLG Federal Loan GuaranteeGHG Greenhouse GasIIVAC Heating. Ventilation and Air ConditioningIGCC Integrated Gasification Combined CycleIRP Integrated Resource PlanIS Interruptible ServiceJDA Joint Dispatch AgreementLCR ‘Fable Load. Capacity. and Reserve Margin FableLEED Leadership in Energ) and Environmental DesignMACI Maximum Achievable Control TechnologyMATS Mercur’ Air Toxics StandardNAAQS National Ambient Air QuaIit StandardsNC North CarolinaNCDAQ North Carolina Division of Air QualityNCEMC North Carolina Electric Membership CorporationNCMPAI North Carolina Municipal Poer Agency lNCUC North Carolina Utilities Commission
7

ABBREVIATIONS CONT.
NERC North American Electric Reliability CorpNO Nitrogen OxideNPDES National Pollutant Discharge Elimination SystemNRC N uclear ReguIator Commission
NSPS Ne Source Performance StandardPD Power DeliveryPEV Plug-In Electric VehiclesPMPA Piedmont Municipal Power AgencyPPA Purchase Power AgreementPPI3 Parts Per BillionPSD Prevention of Significant DeteriorationPV PhotooltaicPVDG Solar Photovoltaic Distributed Generation ProgramPVRR Present Value Revenue RequirementsQF Qualifying FacilityRCRA Resource Conservation Recovery ActREC Renewable Energy CertificatesREPS Renewable Energy and Energ Efficiency Portfolio Standard
I RFP Request for ProposalRIM Rate Impact MeasLireRPS Renewable Portfolio StandardSC South CarolinaSCPSC South Carolina Public Service CommissionSCR Selective Catalytic ReductionSEPA Southeastern Power AdministrationSERC SERC Reliability CorporationSG Standby GenerationSIP State Implementation PlanSO Sulfur DioxideTAG Technology Assessment GuideTRC Total Resource CostThe Company Duke Energy Carolinas‘[he Plan I)uke Energ Carolinas Annual PlanLICT Utilit) Cost testVACAR VirginialCarolinasVAR Volt Ampere Reactive
3
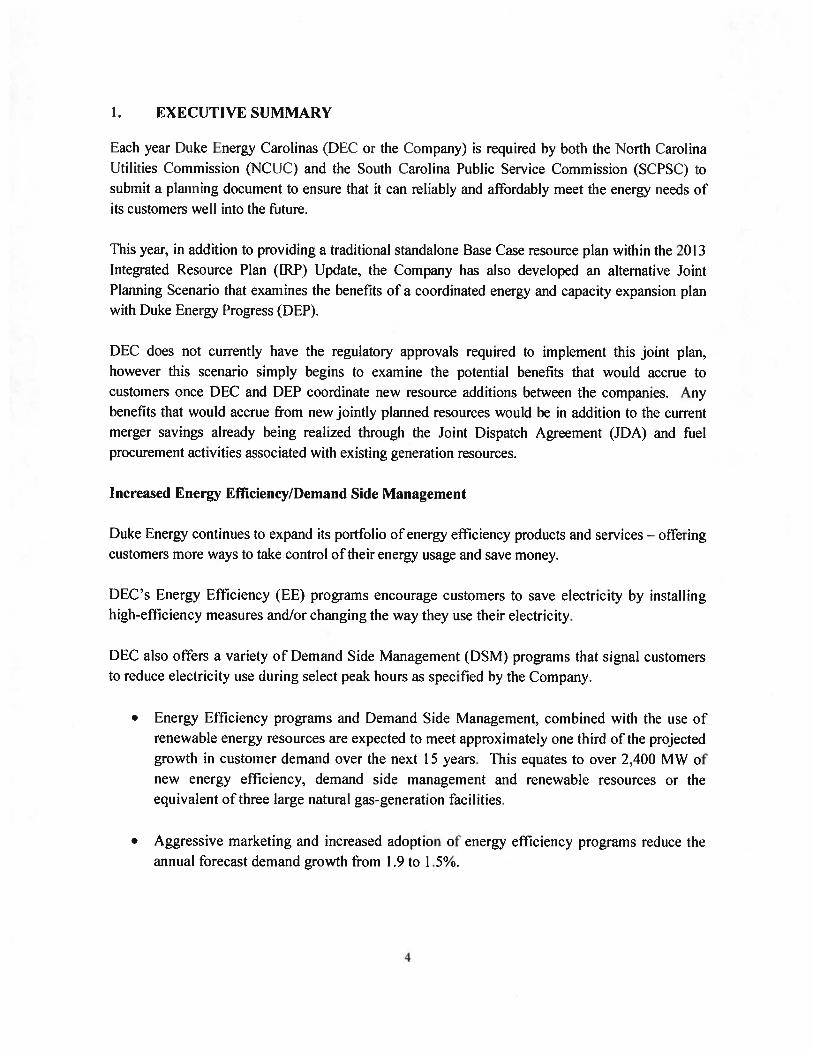
I. EXECUTIVE SUMMARY
Each year L)uke Energy Carolinas (DEC or the Company) is required by both the North CarolinaUtilities Commission (NC UC’) and the South Carol lila Public Service Commission (SCPSC) tosubmit a planning document to ensure that it can reliably and af’lbrdahiy meet the energy needs olits cusWrners well into the future.
This year, in addition to providing a traditional standalone Base Case resource plan within the 2013Integrated Resource Plan (1RP) Update, the Company has also developed an alternative JointPlanning Scenario that examines tile henelits of a coordinated energy and capacity expansion planwith I)uke Energy Progress (DEP).
DEC does not currently have tile regulatory approvals required to implement this joint plan,
however this scenario simply begins to examine the potential benefits that would accrue tocustomers once T)EC and I)EP coordinate new resource additions between the companies. Allybenefits that would accrue from new jointly planned resources would be in addition to the currentmerger savings already being realized through the Joint I)ispatch Agreement (JI)A) and fuel
procurement activities associated with existing generation resources.
Increased Energy Efficiency/Demand Side Management
I)uke Energy continues to expand its portfolio of energy efficiency products and services — offeringcustomers more ways to take control of their energy usage and save money.
T)EC’s Energy Efficiency (EE) programs encourage customers to save electricity by installing
high-efficiency measures and/or changing tile way they use their electricity.
I)EC also offers a variety of Demand Side Management (DSM) programs that signal customersto reduce electricity use during select peak hours as specified by the Company.
• Energy Eliciency programs and [)emand Side Management, combined with the use of
renewable energy resources are expected to meet approximately one third of the projected
growth in customer demand over the next 15 years. This equates to over 2,400 MW of
new energy efficiency, demand side management and renewable resources or the
eq ii ivalent of three large natural gas—generation flue ii ities.
• Aggressive marketing and increased adoption of energy efficiency programs reduce theannual forecast demand growth from I .9 to 1.5%.
4

• DEC will continue to seek Commission approval to implement new DSM and EEprograms that are cost effective and consistent with DECs forecasted resource needsover the planning horizon.
Growth of Renewable Energy and Solar Resources
The Company continues to purchase renewable energy on behalf of our customers and makeinvestments that support our delivery of clean. reliable and alfordahie electricity.
DEC’s strategy to comply with the North Carolina Renewable Energy and Energy EfficiencyPortfolio Standard (NC REPS) is to develop a diverse portfhlio of cost-effective renewableresources including long—term Purchase Power Agreements (PPAs), utility—owned generation,and energy efficiency.
I)EC is committed to meeting the requirements established under the NC REPS and to procuringrenewable energy in a way that minimizes costs for customers. The Company remains on targetto meet these standards within the cost caps established under NC REPS. The Base Case alsoassumes the addition of future SC. renewable resources that could be driven by regulatorymandates or market-based threes.
Solar energy is an important part of the energy future for the Carolinas. As the net price olsolartechnologies including tax incentives continues to decrease. customer use of solar continues toincrease.
• The growth of solar energy has been spurred by several factors, including stale andfederal subsidies that are expected to be in place through 201 5 and 201 7, respectively.
• Substantial tax subsidies and declining costs make solar energy the Company’s primaryrenewable resource projected within the NC REPS compliance plan.
• The Company’s plan currently prq)ects that by the end ot the planning horizon, theCompany will have met over 700 MW of peak demand through solar resources - theequivalent of one large natural gas facility.
Retiring Older, Less Efficient Coal Units
Duke Energy Carolinas is investing in a brighter energy future lhr its more than 2.4 millioncustomers in North and South Carolina. The Company has built some of the cleanest, most efficientnatural gas plants to replace aging, less efficient generation facilities in order to provide essential
power to the communities that DEC serves. This advanced generation technology helps theCompany comply with more stringent air, water and waste rules.
• Since 20! , I)EC has retired 15 coal units. totaling 1,300 MW, in addition to 400 MW ofolder oil units.
• In April 2015, the last of DEC s coal stations that lack advanced emission controls isscheduled to he retired. Lee Steam Station tnits I and 2, located in Peizer, S.C. arecurrently planned for retirement to correspond with the effective date of the téderalMercury Air Toxics Standard (MATS) while Unit 3 is scheduled to be repowered to runon natural gas.
• In December 2012, following the retirement of the L)an River coal units, the Dan RiverCombined Cycle (CC) facility became operational. l’his 620 MW natural gas-fired CCgenerating station located in Eden, N.C. achieves high operational flexibility and highthermal efficiency, while utilizing advanced environmental control technology tominimize plant emissions.
• The 825 MW Cliifside Steam Station Unit 6 in Mooreshoro, N.C., which was completedat the end of 2012 is one of the cleanest coal units in the United States and has advancedemission controls that remove more than 99% of sulfur dioxide and 90% of nitrogen andmercury.
Improved Emissions
The combination of investments in advanced emission controls, retirements of older units and theaddition of efficient clean natural gas units has culminated in dramatic reductions in power plantemissions over the last decade.
• Projected SO2 emission levels in 2014 are expected to he 96% less than they were adecade earlier in 2005.
• Projected N0 emission levels in 2014 are expected to he 76% less than they were in2005.
This positions l)uke l-nergy Carolinas as an industry leader in emission reductions. DEC’ iscurrently on track to exceed pending federal air emission standards.
6
Natural Gas: Meeting Future Customer Demand
Modernizing the power plant fleet is an important investment in the Carolinas’ environment and itsFuture. Because the Company continues to retire older, less efficient coal plants, new incrementalresources must be added to the I)EC system. New resources are also required to keep up withincreasing customer demand.
Aher accounting for the previously-discussed impacts of [)EC’s EL, DSM and renewable resources,the Company projects it will meet its customers’ remaining requirements with a combination ofnatural gas and nuclear resources.
‘Fhe 2013 IRP identifies the need fi)r new natural gas plants that are economic, highly efficient andreliable. The following natural gas resources are included in the plan for the 2014 through 2028planning horizon:
• 2015 — Convert a 1 70 MW coal unit to natural gas at the Lee Steam Station in S.C.• 2017— Construct a new 680 MW natural gas CC generation facility
• 2019— Procure or construct 843 MW of natural gas CC generation
• 2022 — Procure or construct 403 MW of simple cycle combustion turbines (Ci’s)
Nuc’ear Generation
1)uke Energy Carolinas believes nuclear generation is important for the long-term benefits of itscustomers — today and in the future. ‘l’he 2013 [RP continues to support new nuclear generation as acarbon—free, cost—effective option within the Company’s resource portfolio.
• W.S. Lee Nuclear Station, Cherokee, S.C. — DEC continues to pursue nuclear expansionoptions at the proposed site. Currently a new and updated site-specific seismic analysis isbeing conducted at the request of the Nuclear Regulatory Commission. Completion ofthis report delays licensing and pushes the project completion date to 2024.
• V.C’. Summer Nuclear Plant, Fairfield. S.C. - [)iscussions also continue with SanteeCooper to possibly purchase an interest in two units under construction at the V.C.Summer Nuclear Plant in Fairfield County. S.C. in the 201 8 through 2020 timeframe.
‘I’he table below illustrates the Companys optimal Base Case resource plan that includes the gasand nuclear additions described above. As discussed, in addition to these traditional resources.the Base Case also includes approximately 2,400 MW of EL, DSM and renewable resources.
7
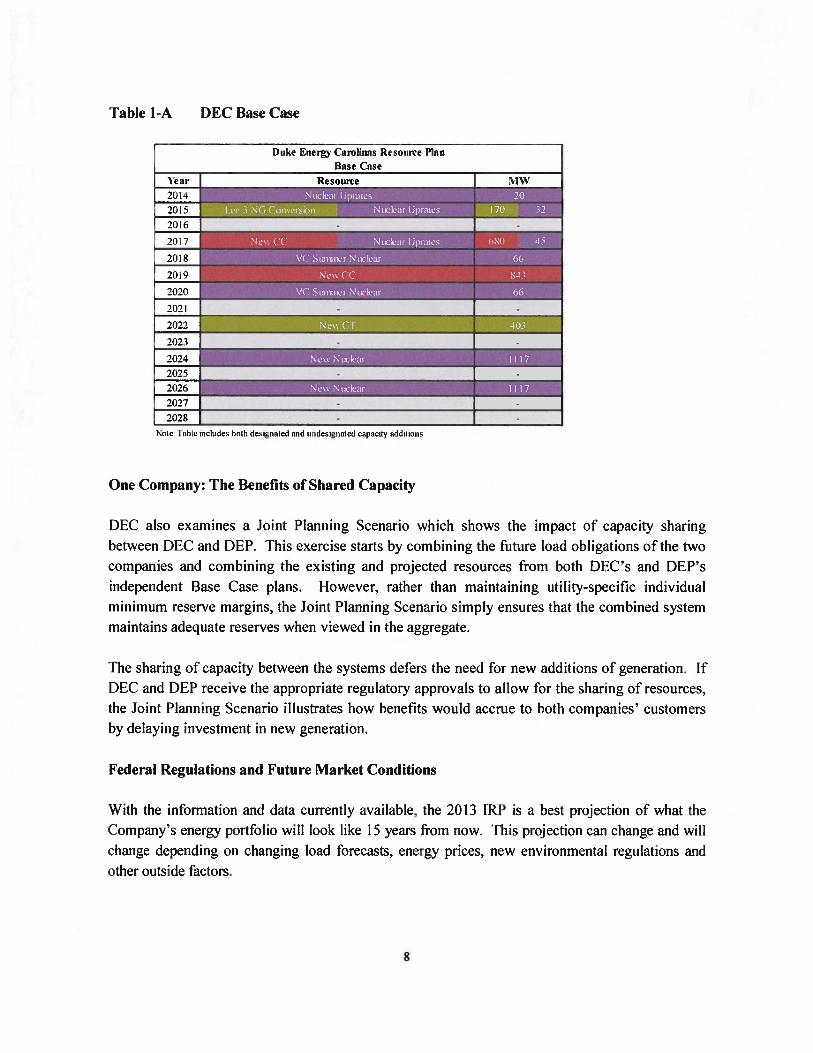
Table 1-A DFC Base Case
Nate fable inc-ndcs both designated and undesignated capacity additions
One Company: The Benefits of Shared Capacity
DEC also examines a Joint Planning Scenario which shows the impact of capacity sharing
between DEC and DEP. This exercise starts by combining the future load obligations of the twocompanies and combining the existing and projected resources from both [)EC’s and DEP’s
independent Base Case plans. [-lowever, rather than maintaining utility-specific individual
minimum reserve margins, the Joint Planning Scenario simply ensures that the combined systemmaintains adequate reserves when viewed in the aggregate.
The sharing of capacity between the systems defers the need tbr new additions of generation. If[)EC and l)EP receive the appropriate regulatory approvals to allow for the sharing of resources,
the Joint Planning Scenario illustrates how benefits would accrue to both companies customers
by delaying investment in new generation.
Federal Regulations and Future Market Conditions
With the information and data currently available, the 2013 IRP is a best projection of what the
Company’s energy portfolio will look like 15 years from now. This projection can change and willchange depending on changing load forecasts, energy prices, new environmental regulations and
other outside factors.
Duke Energy Carolinas Resource Plan
Base Case
Year I Resource—
j MW
2014
2015
2016
2017
2018
2019
2020
2021 - -
onn2022 -
2023 . -
2024
2025
2026
2027 - -
2028 - -
8

Environmental Focus Scenario
What if there is an aggressive new carbon tax in 10 years’? Or additional new government mandatesare required ol electric utilities? The Company has created an l.nviromnental Focus Scenario thatfactors in significant increases in EF and renewable resources that would influence the plan iiregulatory, legislative, or market conditions changed from todays base assumptions to support such
increases. This scenario examines how the amount of traditional supply—side resources would
change if future market conditions andlor state and federal regulations resulted in higher levels of
energy e f1ciency and renewable resources.
*****************
The following chapters give an overview of the inputs incorporated into the 2013 IRP. Chapter 8provides insight into the planning process itself and reviews the results of the Base Case resource
plan as well as the two alternative scenarios developed in this planning cycle. Finally, the
appendices to this document give even greater detail and specifics regarding the input
development and analytic process that produced the resource plans contained in this year’s IRP
filing.
9

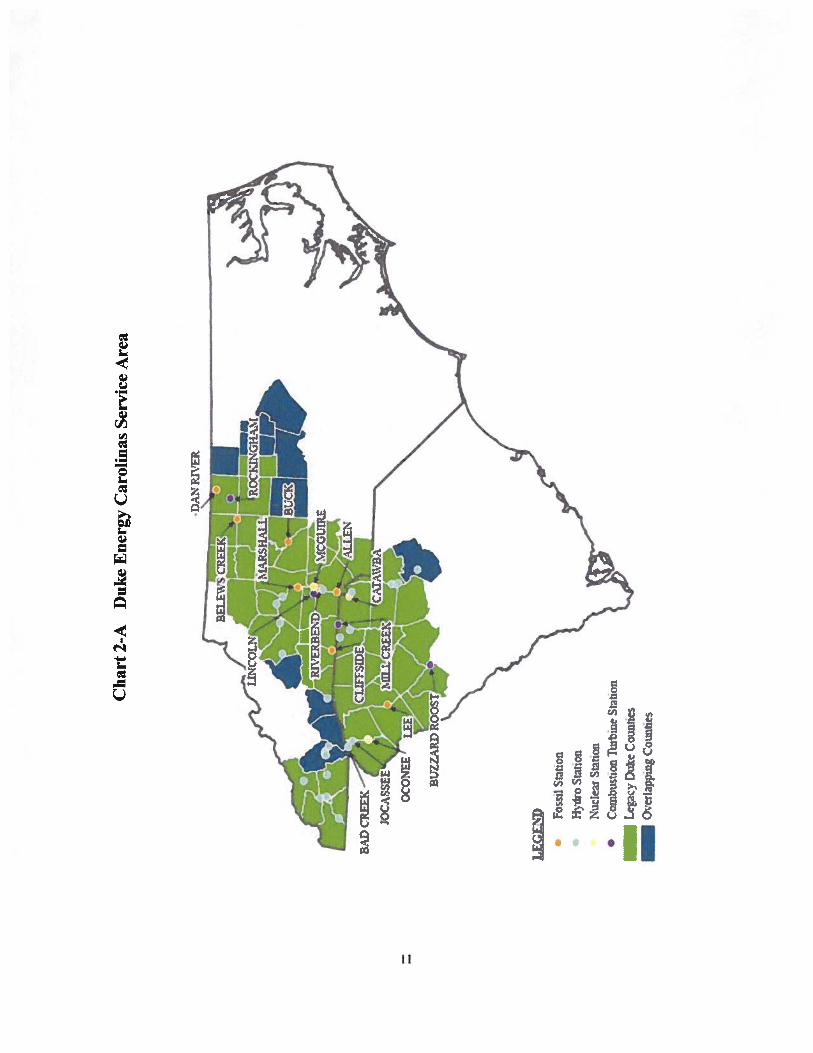
2. SYSTEM OVERVIEW
DEC provides electric service to an approximately 24.000—square-mile service area in central andwestern North Carolina and western South Carolina. In addition to retail sales to approximately2.41 million customers, the Company also sells wholesale electricity to incorporatedmunicipalities and to public and private utilities. Recent historical values for the number ofcustomers and sales of electricity by customer groupings may he lound in Appendix C.
I)EC currently meets energy demand, in part, by purchases from the open market, through longertenn purchased power contracts and from the fillowing electric generation assets:
• Three nuclear generating stations with a combined capacity ot’ 7,054 MW• Five coal-fired stations with a combined capacity of 7,172 MW• 29 hydroelectric stations (including two pumped—storage fticilities) with a combined
capacity of 3,229 MW
• Six CT stations and two CC stations with a combined capacity of 4,010 MW
The C’ornpany’s power delivery system consists of approximately 101 ,700 miles of distributionlines and 13,100 miles of transmission lines. l’he transmission system is directly connected to all ofthe utilities that surround the I)FC service area. There are 36 circuits connecting with nine differentutilities: DEP, American Electric Power, Tennessee Valley Authority, Smokey MountainTransmission, Southern Company, Yadkin, Southeastern Power Administration (SEPA), SouthCarolina Electric & Gas (SCE&G) and Santee Cooper. These interconnections allow utilities towork together to provide an additional level of reliability. The strength of the system is alsoreiHfi)rced through coordination with other electric service providers in the Virginia—Carolinas(VACAR) sub—region, SERC Reliability Corporation (SERC) (lbrrnerly Southeastern ElectricReliability Council) and North American Electric Reliability Corporation (NERC).
‘l’he map on the following page provides a high-level view of’ the L)EC service area.
I0
Ch
art
2-A
Duk
eE
nerg
yC
aroli
nas
Ser
vice
Are
a
.
DA
NPJ
VE
R
BA
DC
REE
K(
1j
3OC
ASS
EE
OC
ON
EEU
LE
GE
ND
•Fo
sstl
Sta
tion
•H
vo
Stat
ion
Nuc
lear
Stat
ion
Con
busu
onTu
rbin
eSt
atio
nL
egac
yL
)ule
Cou
ntie
sO
verl
appt
ngC
ount
ies
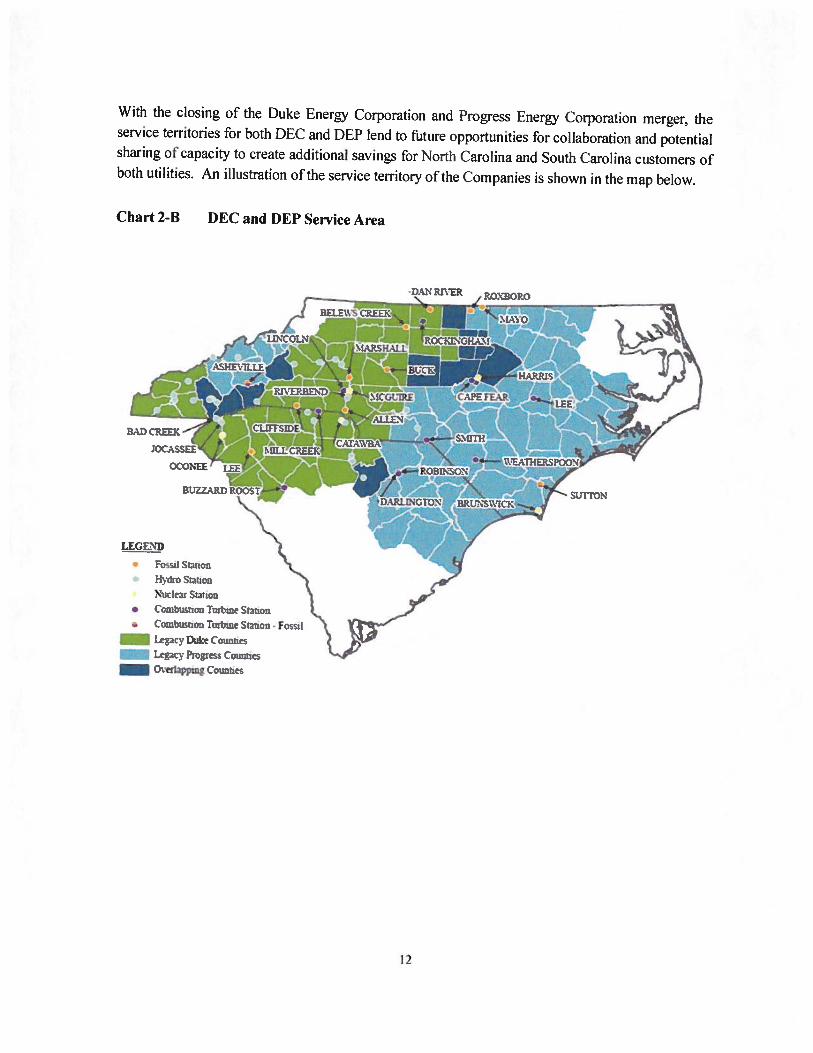
With the closing of’ the Duke Energy Corporation and Progress Energy Corporation merger, theservice territories tbr both DEC and [)EP lend to ftiture opportunities for collaboration and potentialsharing o capacity to create additional savings k)r North Carolina and South Carolina customers ofboth utilities. An illustration ot’lhe service temlory oithe Companies is shown in the map below.
Chart 2-B DEC and D1P Service Area
BL7ZAR.D I
•DAN RIVER ROOZO
cx ONEE r
BAD CREEK
LEGEND
• Fo,iI Smon• Hvdio Staiion
Nu:ear $tlK’n• (cihu’on Tub2ne StX• CombunoüTuibmeSio@-Fo::
Leac; Duke CO1WTICS
Lep4v Progress Cowrnes— OveiLppin C
strrroN
12
3. ELECTRIC LOAD FORECAST
The [)uke Energy (‘aroIinas spring 2013 forecast provides projections of the energy and peakdemand needs fbr its service area. The forecast covers the time period of 2014 thmugh 2028 andrepresents the needs of the retail classes and the wholesale buyers with whom [)EC has acontractual obligation to serve.
Long—term electricity usage is determined by economic and demographic trends. The 2013 springforecast was developed using industry-standard linear regression techniques, which relate electricityusage to such variables as income, electricity prices and the industrial production index along withweather and population. 1)EC has used regression analysis since 1979 and this technique hasyielded consistently reasonable results over the years.
‘l’he economic projections used in the spring 2013 tbrecast are obtained from Moody’s Analytics, anationally recognized economic forecasting firm, and inclLide economic tbrecasts br the slates ofNorth Carolina and South Carolina.
The retail forecast consists of the three major classes: residential, commercial and industrial.
The residential class sales forecast is comprised of two projections. The first is the number ofresidential customers, which is driven by population. 1he second is energy usage per customer,which is driven by weather, regional economic and demographic trends, electricity price andappliance efficiencies. i’he usage per customer forecast is essentially flat through much of theforecast horizon, so most growth is primarily due to customer increases. The projected growth rateof residential sales in the spring 2013 Ibrecast from 2014-2028 is 1.2% annually.
Commercial electricity usage changes with the level of regional economic activity, such as personal
income or commercial employment, and the impact of weather. The three largest sectors in thecommercial class are olbices, education and retail. Commercial is expected to be the fastest growingclass, with a projected sales growth rate of 1 .8%.
The industrial class tbrecast is impacted by the level of manufhcturing output, exchange rates,electric prices and weather. The long—term structural decline that has occurred in the textile industryis expected to moderate in the forecast horizon, with an overall projected sales decline of I .2%,compared to an average decline of 7.2% from 1997—2012. In the other industrial sector, severalindustries such as autos, rubber and plastics and primary metals, are projected to show stronggrowth. Overall, other industrial sales are expected to grow 0.9% over the forecast horizon.
Including all industrial classes, the overall sales growth rate of the total industrial class is 0.6% overthe Ibrecast horizon.
13

Including the impacts of DEC’s FE programs, the projected average annual growth rate from 2014through 2028 is 1 .5% tbr summer peak. 1 .5% for winter peak and 1 .5% fhr energy. Ihese grothrates represent a 4,164 MW increase in capacity and 20,826 MWh increase in energy by 2028.
Compared to the spring 201 2 forecast, the spring 2013 Ibrecast reflects lower growth, due to aslightly slower economic outlook. For example, the growth rate of the summer peak afler alladjustments in the spring 2012 ibrecast is 1.7% versus 1.5% in the new forecast.
The load tbrecast projection tbr energy and capacity including the impacts of EE that was utilized inthe 2013 IRP is shown in Table 3-A.
Table 3-A Load Forecast with Energy Efficiency Programs
YEAR SUMMER ENERGY
(MW) (CWh)
2014 18,332 92,943
2015 18,691 94,721
2016 19,053 96,475
2017 19,398 98,226
2018 19,741 100,032
2019 20,117 101,678
2020 20,359 102,948
2021 20,598 104,187
2022 20,848 105,469
2023 21,104 106,748
2024 21,378 108,089
2025 21,643 109,418
2026 21,922 110,825
2027 22,209 1 12,294
2028 22,496 113,769i.ote: Table 8-C differs from these values due to a 150 MW firm sale in 2014and a 47 MW Piedmont Municipal Power Aoenc (PMPA) hacksand contract through 2020
A detailed discussion of the electric load forecast is provided in Appendix C.
‘4

4. ENERGY EFFICIENCY AND DEMAND SII)E MANAGEMENT
I)EC is committed to making sure electricity remains available, reliable and affordable and that it isproduced in an environmentally sound manner and, therefore, advocates a balanced solution tomeeting future energy needs in the Carolinas. That balance includes a strong commitment todemand side management and energy efficiency.
Since 2009, I)EC has been actively developing and implementing new I)SM and EF programsthroughout its North Carolina and South Carolina service areas to help customers reduce their
electricity demands. DEC’s [)SM and hE plan was designed to be flexible, with programs being
evaluated on an ongoing basis so that program refinements and budget adjustments can he made in atimely fashion to maximize benefits and cost-effectiveness. Initiatives are aimed at helping all
customer classes and market segments use energy more wisely. The potential for new technologies
and new delivery options is also reviewed on an ongoing basis in order to provide customers with
access to a comprehensive and current portfOlio of programs.
DEC’s EE programs encourage customers to save electricity by installing high efficiency measures
and/or changing the way they use their existing electrical equipment, [)EC evaluates the cost-effectiveness of DSM!EE programs from the perspective of program participants, non-participants,
all customers as a whole and total utility spending using the ibur California Standard Practice tests
(i.e., Participant Test, Rate Impact Measure (RIM) Test, Total Resource Cost (‘l’RC) Test and
Utility Cost Test (UCI’), respectively) to ensure the programs can he provided at a lower cost thanbuilding supply-side alternatives. The use of multiple tests can ensure the development of areasonable set of programs and indicate the likelihood that customers will participate. DEC will
continue to seek Commission approval to implement DSM and EE programs that are cost—effective
and consistent with DEC’s forecasted resource needs over the planning horizon. DEC currently hasapproval from the NCUC and SCPSC to offer a large variety of EL and 1)SM programs and
measures to help reduce electricity consumption across all types of customers and end-uses.
[‘or IRP purposes, these EL-based demand and energy savings are treated as a reduction to the load
forecast, which also serves to reduce the associated need to build new supply-side generation,
transmission and distribution facilities. DEC also offers a variety of DSM (or demand response)programs that signal customers to reduce electricity use during select peak hours as specified by theCompany. [he IRP treats these “dispatchable” types of programs as a resource option that can he
dispatched to meet system capacity needs during periods of peak demand.
‘to better understand the long-term hE savings potential. DEC commissioned an update to the 2011market potential study performed by Forefront Economics Inc. for the purpose of estimating the
achievable potential fOr EE on an annual basis over a 20-year forecast period. ‘[he results of the
market potential study are suitable for integrated resource planning purposes and use in long-range
15

system planning models. I lowever, the study did not attempt to closely fbrecast short-term FEachievements from year to year. Thereibre, the Base Case EE/DSM savings contained in this IRPwere projected by blending DECs live-year program planning loreeast into the long—termachievable potential projections from the updated market potential study.
l)EC also prepared a high EL savings projection designed to meet the five—year EL Performancetargets set forth in the December 8. 201 1 Settlement Agreement. ‘l’he savings in this high ELprojection are well beyond the levels historically attained by I)[C and Ibrecasted in the marketpotential study. As a result, there is too much uncertainty regarding the possibility of actuallyrealizing this level of EL savings to risk using the high projection in the base assumptions fi)rdeveloping the 2013 integrated resource plan. however, it is being treated as an aspirationaltarget for the development of Iuiture EL plans and programs. This level of EL is included as aresource planning sensitivity in the Environmental Focus Scenario.
All of these investments are essential to building customer awareness about FE and, ultimately,reducing energy resource needs by driving large—scale, long—term participation in efficiencyprograms. Significant and sustained customer participation is critical to the success of DEC’s ELand DSM programs. ‘Jo support this effort, l)EC has fbcused on planning and implementingprograms that work well with customer lifestyles, expectations and business needs.
Finally, DEC is setting a conservation example by converting its own buildings and plants, as wellas distribution and transmission systems, to new technologies that increase operational efficiency.One example of Duke Energy’s dedication to conservation is that the [)uke Energy corporateheadquarters in Charlotte, N.C., is located in a I eadership in Energy and Environmental Design(LEI3D) platinum building. the highest [EEl) rating. LEEI) is a suite of rating systems for thedesign, construction, operation and maintenance of green buildings, homes and neighborhoods.l3uildings that have attained the [LED platinum certification are among the greenest in the world.See Appendix I) for further detail on DEC’s DSM, EE and consumer education programs.
16

5. RENEWABLE ENERGY REQUIREMENTS
DEC’s plans regarding renewable energy resources within this IRP are based primarily uponthe presence of existing renewable energy requirements and the potential introduction ofadditional renewable energy requirements in the future.
Regarding existing renewable requirements, the Company is committed to meeting therequirements of the NC REPS. This is a statutory requirement enacted in 2007 mandating thatDuke Energy Carolinas supply the cquivalent of 12.5% of retail electricity sales in NorthCarolina from eligible renewable energy resources anchor EE savings by 2021. NC REPSallows for compliance utilizing not only renewable energy resources supplying bundled energyand renewable energy certificates (RECs) and BE, but also the purchase of unbundled RECs(both in-state and out-of-state) and thermal RECs. Therefore, the actual renewable energydelivered to the DEC system is impacted by the amount of ER, unbundled RECs and thermalRECs utilized for compliance.
With respect to potential new renewable energy portfolio standard requirements, theCompany’s plans in this IRP account for the possibility of future requirements that will resultin additional renewable resource development beyond the NC REPS requirements. Renewablerequirements have been adopted in many states across the nation, and have also beencontemplated as a frderal mandate. As such, the Company believes it is reasonable to plan foradditional renewable requirements within the IRP beyond what presently exists with the NCREPS requirements.
Although many reasonable assumptions could be made regarding such Ibture renewablerequirements, the Company has assumed for purposes of the 2013 IRP that a new legislativerequirement would be implemented in the future that would result in additional renewableresource development in South Carolina. For planning purposes, DEC has assumed that therequirement would be similar in many respects to the NC REPS requirement, but with adifferent implementation schedule. Specifically, the Company has assumed that thisrequirement would have an initial 3% milestone in 2018 and would gradually increase to at2.5% level by 2026. Similar to NC REPS, this assumed legislative requirement wouldincorporate renewable energy and lEE, as well as a limited capability to utilize out of stateunbundled purchases of RECs. Further, this assumed requirement would not contain additionaltechnology-specific set-asides or a cost-cap feature.
The Company has assessed the current and potential future costs of renewable and traditionaltechnologies. Based on this analysis, the IRP modeling process shows that, for the most part,the amount of renewable energy resources that will be developed over the planning horizonwill be defined by the existing and anticipated statutory renewable energy requirements
17
described above. In other words, under Base Case assumptions, the IRP modeling does notindicate any material quantity of renewable resource development over and above the requiredlevels.
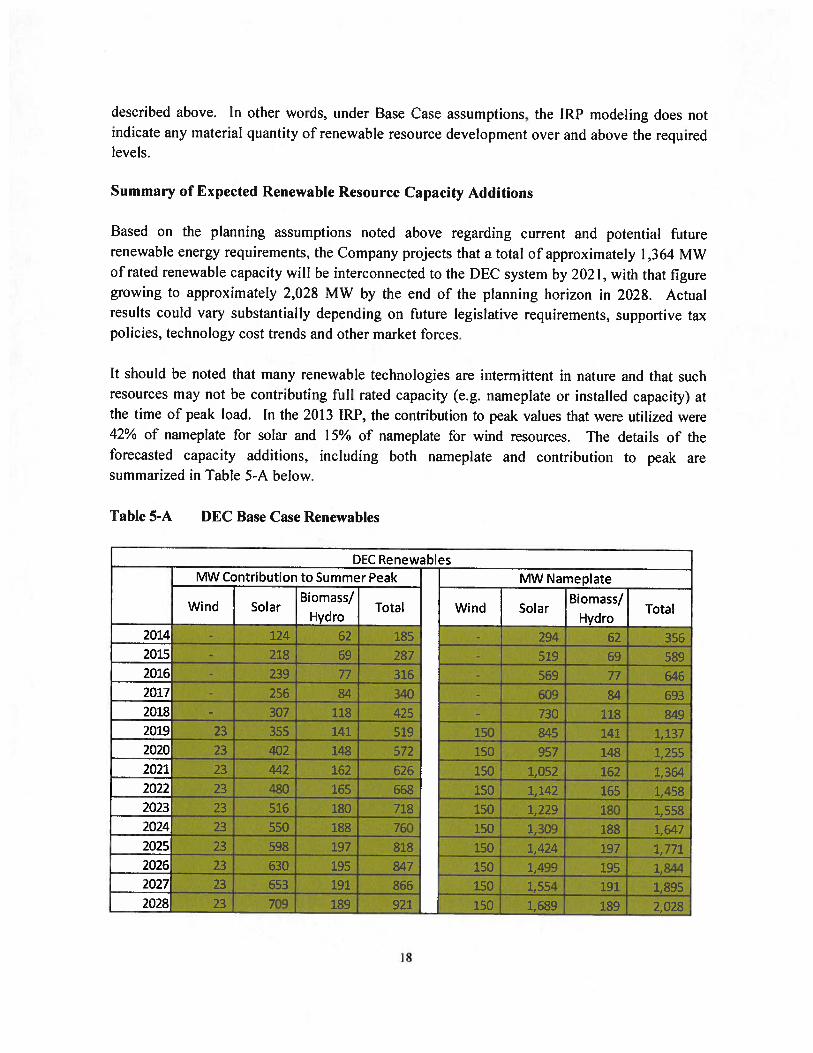
Summary of Expected Renewable Resource Capacity Additions
Based on the planning assumptions noted above regarding current and potential futurerenewable energy requirements, the Company projects that a total of approximately I ,364 MWof rated renewable capacity will he interconnected to the DEC system by 2021, with that figuregrowing to approximately 2,028 MW by the end of the planning horizon in 2028. Actualresults could vary substantially depending on future legislative requirements, supportive taxpolicies, technology cost trends and other market forces.
It should be noted that many renewable technologies are intermittent in nature and that suchresources may not be contributing full rated capacity (e.g. nameplate or installed capacity) atthe time of peak load. In the 2013 IRP, the contribution to peak values that were utilized were42% of nameplate for solar and 15% of nameplate for wind resources. The details of theforecasted capacity additions, including both nameplate and contribution to peak aresummarized in Table 5-A below.
Table 5-A DEC Base Case Renewables
18
Summary of Renewable Energy Planning Assumptions
The Company s assumptions relating to renewable energy requirements (existing andanticipated) included in the 2013 IRP are largely similar to the assumptions in I)EC’s 2012 IRP.However, expectations regarding how those requirements will be met have evolved. Changesfrom the prior year are summarized below.
As compared to last year’s I RP, DEC has assumed the development and interconnection of moresolar resources over the planning horizon, along with corresponding reductions in thedevelopment of other resources.
the installed cost of solar resources has lallen dramatically over the past few years, driven byincreased industry scale, standardization, and technological innovation. Many industryparticipants expect the cost of solar to continue a steady decline through the end of the decade,albeit at a slower pace than in recent years. Solar resources benefit from generous supportivefederal and stale policies that are expected to he in place through 201 5 01. longer. In combinationwith declining costs, such supportive policies have made solar resources increasinglycompetitive with other renewable resources, including wind and hiomass, at least in the near-term. While uncertainty remains around possible alterations or extensions of policy support, aswell as the pace of future cost declines, the C’ompany fully expects solar resources lo contributeto DEC’s REPS compliance efthrts beyond the solar set-aside minimum threshold for NC REPS,and correspondingly in South Carolina.
DEC recognizes lhat some land-based wind developers are presently pursuing projects ofsignificant size in North Carolina. The Company believes it is reasonable to expect that land-based wind will ultimately he developed in both North and South Carolina. l-lowever, land-based wind in the U.S. has henefitted from supportive federal tax policies set to decline in thenear future. The Company is a contributor to the U.S Department of Energy (I)OE) sponsoredCarolinas Offshore Wind Integration Case Study (COWICS). Although the C’ompariy expects torely upon wind resources fbr REPS compliance, the extent and timing of that reliance will likelyvary commensurately with changes to supporting policies and prevailing market prices. TheCompany also has observed that oppollunities currently exist, and may continue to exist, totransmit land—based wind energy resources into the Carolinas from other regions, which couldsupplement the amount of wind that could he developed within the Carolinas.
The Company expects hiomass resources to continue to play an important and vital role in theCompanys compliance efforts. Ilowever, biornass potential ultimately depends upon how keyuncertainties, such as permitting and fuel supply risks, are resolved, as well as the projectedavailability of other fbrms ol renewable resources to offset the needs fur biornass.
19
Hydro generation remains a valuable and significant part of the generating fleet for the Carolinas.The potential for additional hydro generation on a commercially viable scale is limited and the costand feasibility arc highly site-specific. Given these constraints, hydro is not included in the moredetailed evaluations but may be considered when site opportunities are evidenced and the potentialis identified. DEC will continue to evaluate hydro opportunities on a case-by-case basis and willinclude it as a resource option ifappropriate.
In general, the Company expects a mix of resources will ultimately be used for meetingrenewable targets, with the specifics of that mix determined in large part by policy developmentsover the coming five to ten years. Costs for all the resources discussed above are highlydependent upon future subsidies, or lack thereof, and the Company’s procurement efibrts willvary accordingly. Furthermore, the Company values portfolio diversification from a resourceperspective, particularly in light ofthe varying production profiles of the resources in question.
Further Details on Compliance with NC REPS
A more detailed discussion of the Company’s plans to comply with the NC REPS requirementscan be found in the Company’s NC REPS Compliance Plan (Compliance Plan), which isprovided as an Attachment to this document
Details of that Compliance Plan are not duplicated hcre, although it is important to note thatvarious details of the NC REPS law have impacts on the amount of energy and capacity thatthe Company projects to obtain from renewable resources to help meet the Company’s long-term resource needs. For instance, NC REPS contains several detailed parameters, includingtechnology-specific set-aside requirements for solar, swine waste and poultry waste resources;capabilities to utilize EE savings and unbundled REC purchases from in-state or out-of-stateresources and RECs derived from thermal (non-electrical) energy; and a statutory spendinglimit to protect customers from cost increases stemming from renewable energy procurementor development. Each of these features of NC REPS has implications on the amount ofrenewable energy and capacity the Company forecasts to obtain over the planning horizon ofthis IRP. Additional details on NC REPS compliance can be found in the Company’sCompliance Plan.
The Company continues to see an increasing amount of alternative energy resources in thetransmission and distribution queues. These resources are mostly solar resources, due to thecombination of federal and state subsidies to encourage solar development. This combination ofincentives has led solar to be the primary renewable resource projected in the Company’s NC REPSCompliance Plan. With state incentives scheduled to end in 2015 and federal incentives scheduledto be reduced in the same time period, the exact amount ofsolar that will ultimately be developed ishighly uncertain. If tax incentives were to be extended or significant additional cost reductions in
20
the technology realized, incremental solar contribution above NC REPS requirements could heachieved.
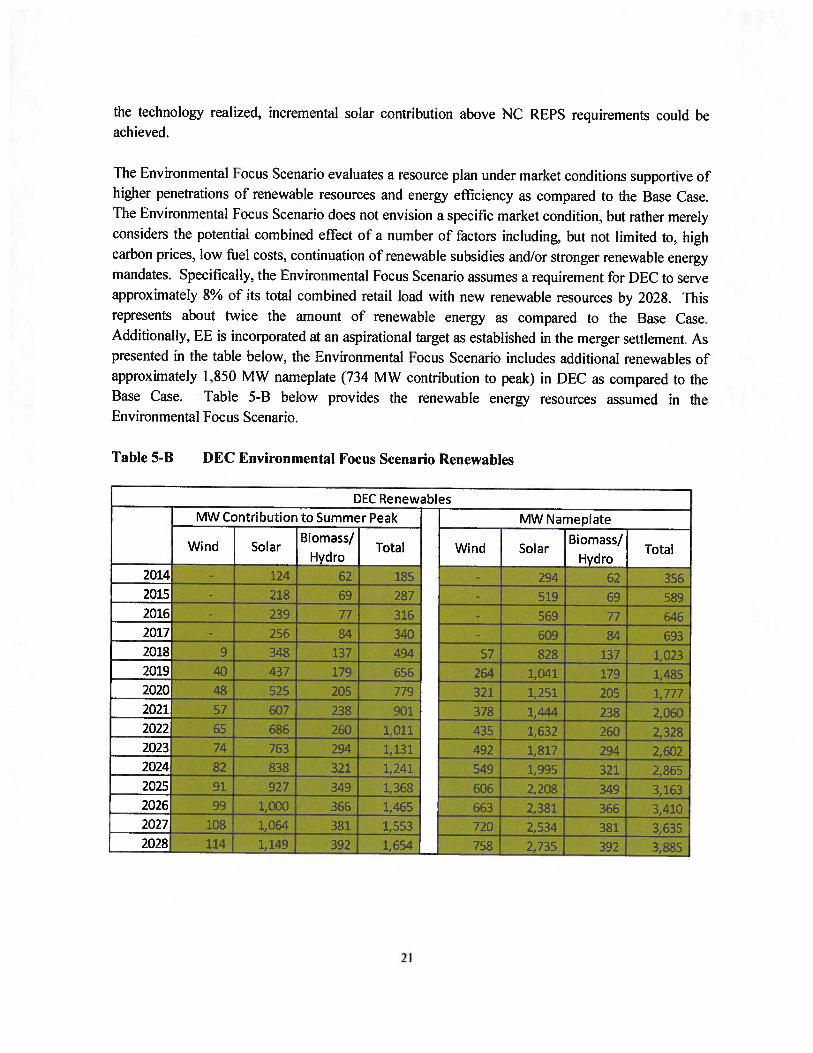
The Environmental Focus Scenario evaluates a resource plan tinder market conditions supportive of’higher penetrations of renewable resources and energy efficiency as compared to the Base Case.The Environmental Focus Scenario does not envision a specific market condition, hut rather merelyconsiders the potential combined efièct of a number of factors including. but not limited to. highcarbon prices, low fuel costs, continuation of renewable subsidies and/or stronger renewable energymandates. Specifically, the Environmental Focus Scenario assumes a requirement for I)EC to serveapproximately 8% of its total combined retail load with new renewable resources by 2028. Ibisrepresents about twice the amount of renewable energy as compared to the Base Case.Additionally, FE is incorporated at an aspirational target as established in the merger settlement. Aspresented in the table below, the Environmental Focus Scenario includes additional renewables ofapproximately 1,850 MW nameplate (734 MW contribution to peak) in [)EC as compared to theBase Case. Table 5-B below provides the renewable energy resources assumed in theEnvironmental Focus Scenario.
Table 5-B DEC Environmental Focus Scenario Renewables
21
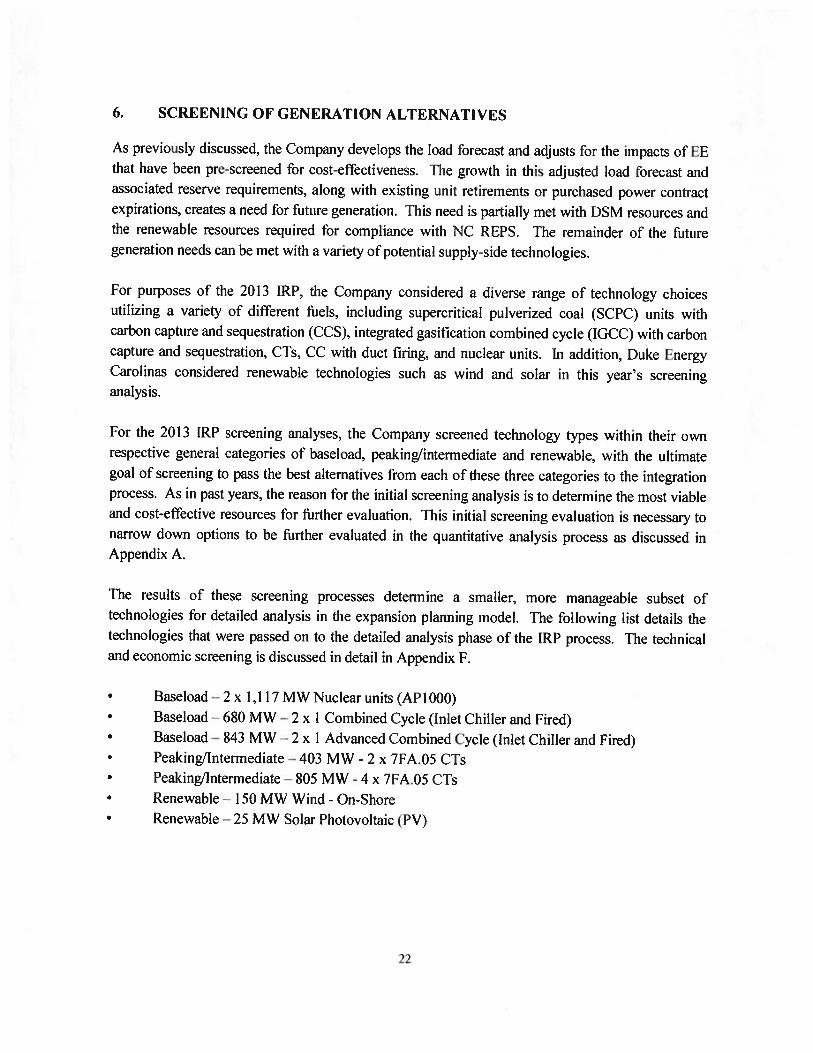
6. SCREENING OF GENERATION ALTERNATIVES
As previously discussed, the Company develops the load forecast and adjusts for the impacts of EEthat have been pre—screened fbr cost-effectiveness. The growth in this adjusted load tbrecast andassociated reserve requirements, along with existing unit retirements or purchased power contract
expirations, creates a need lbr future generation. l’his need is partially met with DSM resources andthe renewable resources required fbr compliance with NC REPS. The remainder of the futuregeneration needs can he met with a variety of potential supply-side technologies.
For purposes of’ the 201 3 IRP, the Company considered a diverse range of technology choicesutilizing a variety of different ftiels, including supercritical pulverized coal (SC’PC’) units withcarbon capture and sequestration (CCS), integrated gasification combined cycle (1(1CC) with carboncapture and sequestration, Cl’s, CC with duct firing, and nuclear units. In addition, I)uke EnergyCarolinas considered renewable technologies such as wind and solar in this year’s screeninganalysis.
f:or the 2013 IRP screening analyses, the Company screened technology types within their ownrespective general categories of baseload, peaking/intermediate and renewable, with the ultimategoal of screening to pass the best alternatives from each of these three categories to the integrationprocess. As in past years, the reason for the initial screening analysis is to determine the most viableand cost-effective resources for further evaluation. This initial screening evaluation is necessary tonarrow down options to he further evaluated in the quantitative analysis process as discussed inAppendix A.
‘[‘lie results of these screening processes determine a smaller, more manageable subset oftechnologies fhr detailed analysis in the expansion planning model. ‘[he Following list details thetechnologies that were passed on to the detailed analysis phase of the IRP process. The technicaland economic screening is discussed in detail in Appendix F.
• I3aseload —2 x 1,117 MW Nuclear units (API 000)• E3aseload — 680 MW — 2 x I Combined Cycle (Inlet Chiller and Fired)• Baseload — 843 MW — 2 x I Advanced Combined Cycle (Inlet Chiller and Fired)• Peaking/Intermediate — 403 MW - 2 x 71”A.05 CTs• Peaking/Intermediate — 805 MW - 4 x 71”A.05 Cl’s• Renewable — I 50 MW Wind - On-Shore• Renewahle—25 MW Solar Photovoltaic (PV)
22
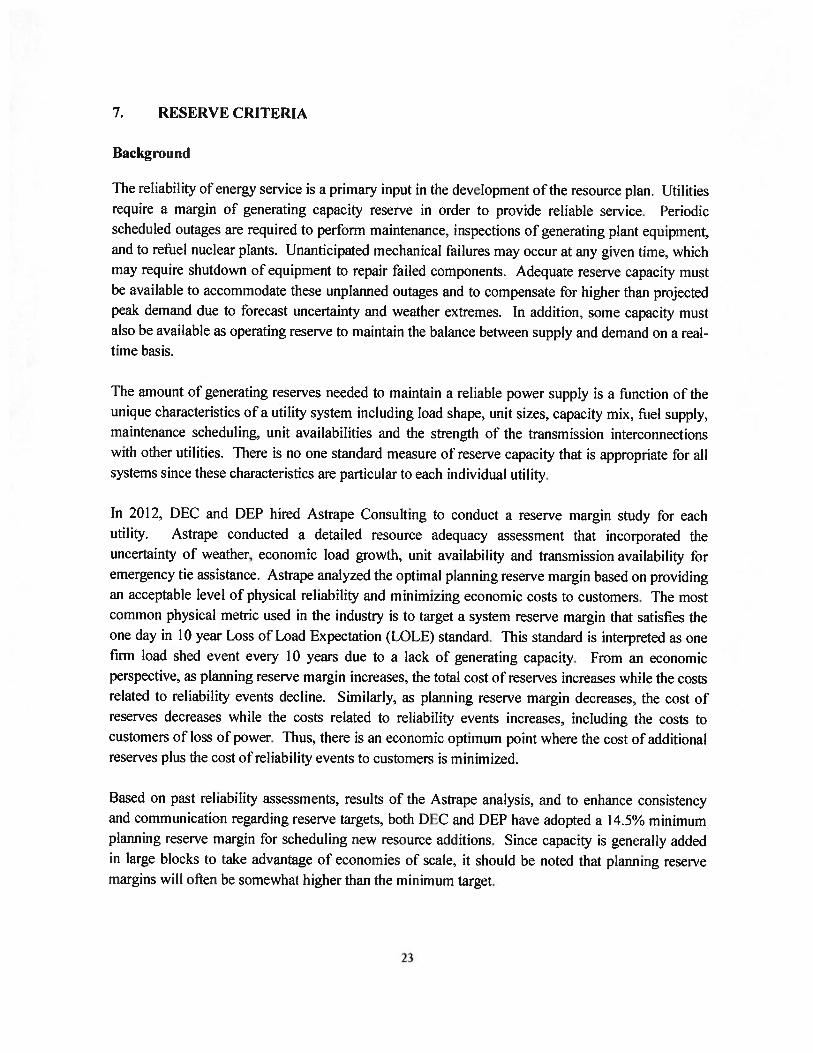
7. RESERVE CRITERIA
Background
Flie reliability of energy service is a primary input in the development of the resource plan. Utilitiesrequire a margin of generating capacity reserve in order to provide reliable service. Periodicscheduled outages are required to perform maintenance, inspections of generating plant equipment.and to reftiel nuclear plants. Unanticipated mechanical failures may occur at any given time, whichmay require shutdown of equipment to repair failed components. Adequate reserve capacity mustbe available to accommodate these unplanned outages and to compensate for higher than projectedpeak demand due to forecast uncertainty and weather extremes. In addition, some capacity mustalso he available as operating reserve to maintain the balance between supply and demand on a realtime basis.
The amount of generating reserves needed to maintain a reliable power supply is a function of theunique characteristics of a utility system including load shape, unit sizes, capacity mix, fuel supply,maintenance scheduling, unit availabilities and the strength of the transmission interconnectionswith other utilities. ‘lliere is no one standard measure of reserve capacity that is appropriate lbr allsystems since these characteristics are particular to each individual utility.
In 201 2, I)EC and l)EP hired Astrape Consulting to conduct a reserve margin study for eachutility. Astrape conducted a detailed resource adequacy assessment that incorporated theuncertainty of weather, economic load growth, unit availability and transmission availability foremergency tie assistance. Astrape analyzed the optimal planning reserve margin based on providingan acceptable level of physical reliability and minimizing economic costs to customers. The mostcommon physical metric used in the industry is to target a system reserve margin that satisfies theone day in 10 year Loss of Load Expectation (LOLE) standard. l’his standard is interpreted as onelirm load shed event every 10 years due to a lack of generating capacity. From an economicperspective, as planning reserve margin increases, the total cost of reserves increases while the costsrelated to reliability events decline. Similarly, as planning reserve margin decreases, the cost ofreserves decreases while the costs related to reliability events increases, including the costs tocustomers of loss of power. Thus, there is an economic optimum point where the cost of additionalreserves plus the cost of reliability events to customers is minimized.
Based on past reliability assessments, results of the Astrape analysis, and to enhance consistencyand communication regarding reserve targets, both DEC and DEP have adopted a 14.5% minimumplanning reserve margin fbr scheduling new resource additions. Since capacity is generally addedin large blocks to take advantage of economies of scale, it should he noted that planning reservemargins will often he somewhat higher than the minimum target.
23
Adequacy of Projected Reserves
[)EC’s resource plan reflects reserve margins ranging from 14 to 22%. Reserves projected inT)EC’s [RP meet the minimum planning reserve margin target and thus satisfy the one day in 10year LOLE criterion. Projected reserve margins exceed the minimum 14.5% target by 3% or morein 2019 as a result of the economic addition of a large combined cycle facility and in 2024-2028 as aresult o the economic addition of large baseload additions in 2024 and 2026. Large resourceadditions are deemed economic only if they have a lower Present Value Revenue Requirement(PVRR) over the life of the asset as compared to smaller resources that better ft the short—termreserve margin need. Reserves projected in I)EC”s IRP are appropriate for providing an economicand reliable power supply.
24
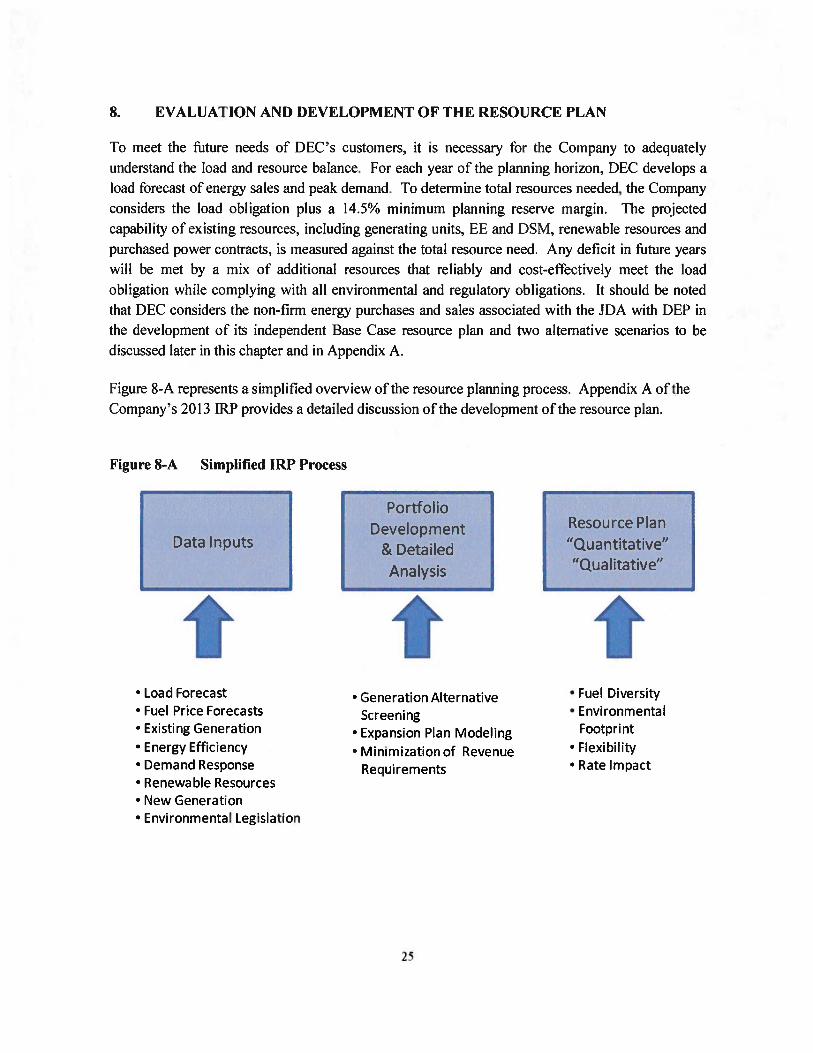
8. EVALUATION AND DEVELOPMENT OF THE RESOURCE PLAN
To meet the ftiture needs of DEC’s customers, it is necessary for the Company to adequatelyunderstand the load and resource balance. For each year of the planning horizon, 1)EC develops aload forecast of energy sales and peak demand. ‘E’o determine total resources needed, the Companyconsiders the load obligation plus a 14.5% minimum planning reserve margin. ‘Ihe projected
capability of existing resources, including generating units, FE and [)SM, renewable resources and
purchased power contracts, is measured against the total resource need. Any deficit in future years
will be met by a mix of additional resources that reliably and cost-effectively meet the load
obligation while complying with all environmental and regulatory obligations. It should he noted
that DEC considers the non-firm energy purchases and sales associated with the iDA with 1)EP in
the development of its independent l3ase Case resource plan and two alternative scenarios to bediscussed later in this chapter and in Appendix A.
Figure 8-A represents a simplified overview of the resource planning process. Appendix A of the
Company’s 2013 1RP provides a detailed discussion of the development ol the resource plan.
• Load Forecast• Fuel Price Forecasts• Existing Generation
• Energy Efficiency• Demand Response• Renewable Resources• New Generation• Environmental Legislation
• Generation AlternativeScreening
• Expansion Plan Modeling
• Minimization of RevenueRequirements
• Fuel Diversity• Environmental
Footprint
• Flexibility• Rate Impact
Figure 8-A Simplified IRP Process
Data Inputs
f
PortfolioDevelopment
& DetailedAnalysis
t
Resource Plan“Quantitative”“Qualitative”
25
DEC performed its expansion plan modeling under Base Case assumptions that were updated as
compared to its 2012 IRP. In addition to an updated Base Case expansion plan, DEC also
considered an Environmental Focus Scenario that includes a greater amount of renewable
resources and EE, as well as changes to other assumptions, such as fuel and CO2 prices. Finally,
DEC and I)EP examined the potential benefits of sharing capacity as represented in a commonJoint Planning Scenario.
Data Inputs
DEC utilizes updated data to develop its resource plan. For the 2013 FRP, data inputs such as load
forecast, EE and DSM, fuel prices, projected CO2 prices, individual plant operating and cost
information, and future resource information were updated. These data inputs were developed and
provided by company subject matter experts and/or based upon vendor studies, where available.
Furthennore, DEC and DEP benefitted from the combined experience of both utilities’ subject
matter experts by utilizing best practices from each utility in the development of their respective
IRP inputs. Where appropriate, common data inputs were applied.
As expected, certain data elements and issues have a larger impact on the plan than others. Any
changes in these elements may result in a noticeable impact to the plan, and as such, these elements
are closely monitored. Some of the most consequential data elements are listed below. A detailed
discussion of each of these data elements has been presented throughout this document and is
examined in more detail in the appendices to this document.
• Load Forecast
• EE/DSM
• Renewable Resource Projections
• Fuel Costs
• Technology Costs and Operating Characteristics
• Environmental Legislation
• Nuclear Issues
Generation Alternative Screening
DEC reviews generation resource alternatives on a technical and economic basis. Resources also
must he demonstrated to be commercially available lhr utility scale operations. The resources that
are thund both technically and economically’ viable are then passed to the detailed analysis process
further analysis.
26

Portfolio De3’eloplneiIt and DetaikdA iialysis
[he portfolio development and detailed analysis phase utilizes the inlomation compile(I in the datainput step to derive resource portlolios or resource plans. ‘[his step in the [RP process utilizesexpansion planning models and detailed production costing models. The goal ol the modeling is todetermine the best mix of’ capacity additions frr the (oiupanys short— and long—term resource planswith an objective of selecting a robust plan that minimizes the Present Value of RevenueRequirements and is environmentally sound complying with all stale and federal regulations.
In the 2013 IRP, a Base Case along with an lnvironmental Focus Scenario and a Joint PlanningScenario were analyzed.
Resource Plans
Base Case
DEC produced an updated Base Case resource plan utilizing consistent assumptions and analyticmethods between I)EC and DEP where appropriate. ‘I’his plan represents an update to theCompany’s 2012 IRP filing and does not take into account the sharing of capacity between I)ECand DEP. However, the Base Case incorporates the JDA between DEC and DEP whichrepresents a non-firm energy only commitment between the companies.
1’he Load and Resource Balance Chart shown in Chart 8—B illustrates the resource need that isrequired fbr 1)EC to meet its load obligation plus required reserves. The existing generatingresources, designated resource additions and EE resources do not meet the required load andreserves and thus, the resource plan analysis will determine the most robust plan to meet thisresource gap.
27

Chart 8-B DEC Load Resource Balance
27DEC - Load Resource Balance
26
2014 2015 2016 2017 2018 2019 2020 2021 2022 2023 2024 2025 2026 2027 2028
• Existing Resources • Designated Resources (mci Uprates)
I Non-traditional Resources (DSM, Renewable) D Resource Gap
Cumulative Resource Additions to Meet Load Obligation and Reserve Margin (MW)
Year 2014 2015 2016 2017 2018 2019 2020 2021ResourceNeed - - 37 317 573 941 1,172 1,425
Year 2022 2023 2024 2025 2026 2027 2028Resource Need 1,682 1,935 2,218 2,463 2,753 3,064 3,358
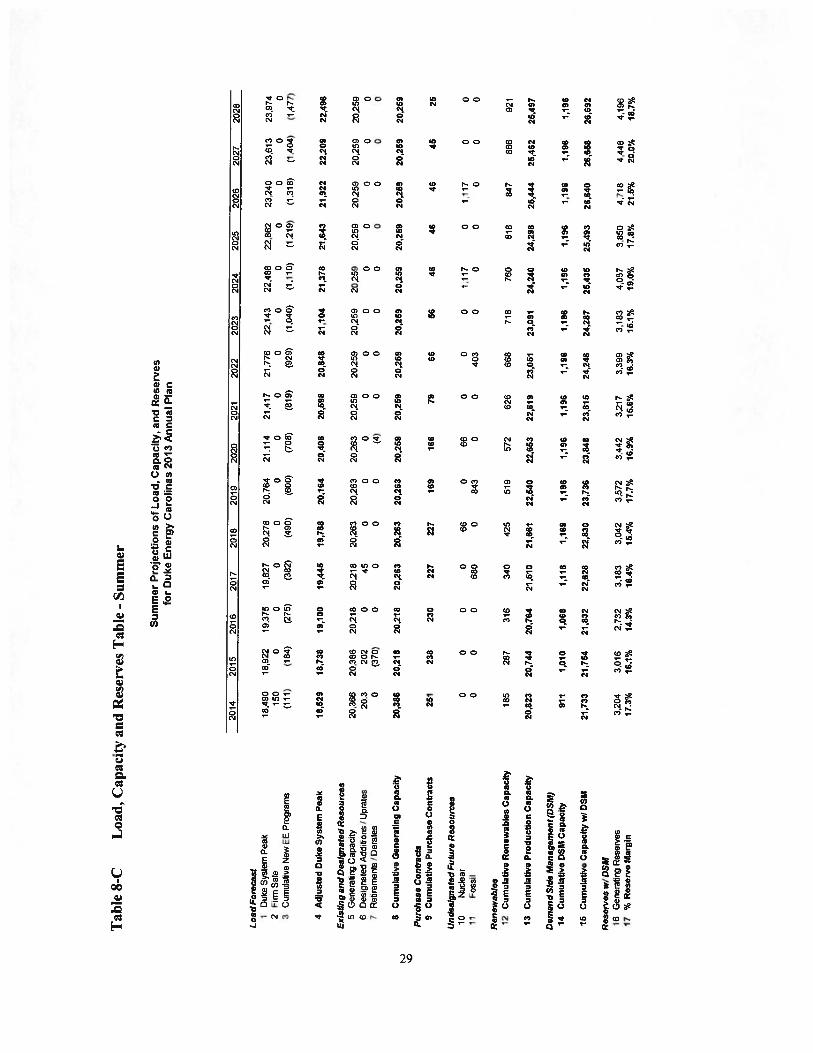
Tables 8-C and 8-D present the Load, Capacity and Reserves tables fhr the Base Case analysis thatwas completed for DEC’s 2013 IRP.
28
Tab
le8-
CL
oad,
Cap
acit
yan
dR
eser
ves
Tab
le-
Sum
mer
Su
mm
erP
roje
cti
on
so
fL
oad
,C
apac
ity,
and
Rese
rves
for
Duke
En
erg
yC
aro
lin
as2013
An
nu
alP
lan
Load
Fore
cast
201
42015
2016
2017
2018
2019
2020
2021
2022
2023
2024
2026
2026
2027
2028
1D
uke
Syst
emP
eak
18,4
9018
,922
19,3
7519
,827
20.2
78
20.7
64
21,1
14
21
41
721.7
76
22,1
43
22.4
88
22,8
62
23,2
40
23.6
13
23.9
742
Fir
mS
ale
150
00
00
00
00
00
00
00
3C
umul
ativ
eN
ewE
Epro
gra
ms
(111
)(1
84)
(275
)(3
82)
ç490
)(6
00)
(708
)(8
19)
(929
)(1
.040
)(1
.110
)(1
.219
)(1
.318
)(1
,404
>(1
.477
)
4A
dju
sted
Duke
Sy
stem
Pea
k18
,529
18.7
38
19,1
0019
,445
19,7
8820,1
64
20,4
0620,5
98
20,8
48
21,1
04
21,3
7821,6
43
21,9
22
22,2
09
22,4
96
Exis
ting
and
Des
ign
ated
Reso
urc
es
5G
ener
alrn
gC
apac
ity
20,3
66
20.3
86
20.2
18
20,2
18
20,2
63
20,2
63
20.2
6320,2
59
20
.259
20,2
59
20,2
59
20,2
59
20.2
59
20.2
59
20,2
59
6D
esig
nat
edA
ddit
ions
/U
pra
tes
20.3
202
045
00
00
00
00
00
07
Ret
irem
ents
/Der
ates
0(3
70>
00
00
(4)
00
00
00
00
8C
um
ula
tive
Gen
erat
ing
Cap
acit
y20,3
86
20,2
18
20,2
1820,2
63
20.2
6320,2
63
20,2
59
20,2
59
20
,259
20,2
59
20,2
59
20,2
59
20,2
59
20,2
59
20,2
59N ‘C
Pu
rch
ase
Co
ntr
acts
9C
um
ula
tive
Pu
rch
ase
Contr
acts
251
238
230
227
227
169
166
7966
5646
4646
45
25
Undes
ignat
edF
utu
reR
eso
urc
es
10N
ucle
ar0
00
066
066
00
01,
117
01,
117
00
11F
ossi
l0
00
680
084
30
0403
00
00
00
Ren
ew
ab
les
12C
um
ula
tive
Renew
able
sC
apac
ity
185
287
316
340
425
519
572
626
668
718
760
818
847
866
921
13C
um
ula
tive
Pro
du
ctio
nC
apac
ity
20,8
23
20,7
44
20,7
64
21,5
10
21,6
6122
,540
22,6
53
22,6
1923
,051
23.0
9124,2
40
24,2
98
25,4
44
25,4
62
25,4
97
Dem
and
Sid
eM
anag
emen
t(D
SM
)14
Cum
ula
tive
DS
MC
apac
ity
911
1,01
01,
068
1,11
81169
1,19
61,
196
1,19
61,
196
1,19
61,
196
1,19
61,
196
1,19
61,
196
15C
um
ula
tive
Cap
acit
yW
ID
SM
21,7
3321,7
54
21,8
32
22.6
2822
,830
23,7
3623,8
48
23,8
15
24,2
46
24,2
87
25,4
35
25,4
93
26,6
40
26,6
58
26,6
92
Res
erves
wiD
SM
16G
ener
atin
gR
eser
ves
3.20
43.
016
2.73
23,
183
3,04
23.
572
3.44
23,
217
3,39
93,
183
4.0
57
3.85
04,
718
4,44
84.
196
17%
Rese
rve
Mar
gin
17.3
%16
.1%
14.3
%16
.4%
15.4
%17
.7%
16.9
%15
.6%
16.3
%15
.1%
19.0
%17
.8%
21.5
%20
.0%
18.7
%

Tab
le8-
flL
oad,
Cap
acit
yan
dR
eser
ves
Tab
le—
Win
ter
Win
ter
Pro
ject
ion
so
fL
oad
,C
apac
ity
and
Rese
rves
for
Du
ke
Ener
gy
Car
oli
nas
20
13
An
nu
alP
lan
Load
Fo
recast
ID
uke
Sys
tem
Pea
k2
Fir
mS
ale
3C
umul
ativ
eN
ewE
EP
rogra
ms
4A
dju
sted
Duke
Sy
stem
Pea
k
Exis
ting
an
dD
esig
nat
edR
eso
urc
es
5G
ener
atin
gC
apac
ity
6D
esig
nat
edA
ddit
ions
/ Upr
ates
7R
etir
emen
tsI
Der
ates
8C
um
ula
tive
Gen
erat
ing
Cap
acit
y
Purc
hase
Co
ntr
acts
9C
um
ula
tive
Purc
hase
Co
ntr
acts
Un
des
ign
ated
Futu
reR
eso
urc
es
10N
ucle
ar11
Fos
sil
Ren
ewab
ies
12C
um
ula
tive
Ren
ewab
les
Cap
acit
y
13C
um
ula
tive
Pro
du
ctio
nC
apac
ity
Dem
and
Sid
eM
anag
emen
t(D
SM
)14
Cu
mu
lati
ve
DS
MC
apac
ity
15C
um
ula
tive
Cap
acit
yw
/D
SM
Rese
rves
w!D
SM
16G
ener
atin
gR
eser
ves
17%
Res
erv
eM
argi
n
13/1
414
/15
15/1
616
/17
17/1
818
/19
19/2
020
/21
21/2
222
/23
23/2
424
/25
25/2
626
/27
27/2
8
17,7
1718
,177
18,5
9519
,000
19.4
101
9,81
820,1
65
20,4
6320
,803
21,1
5021
,510
21866
22,2
3422
,589
22,9
3825
00
00
00
00
00
00
00
(64)
(123
)(1
94)
(276
)(3
97)
(486
)(5
72)
(661
)(7
48)
(837
)(9
23)
(1,0
13)
(1,0
94)
(1,1
64>
(1.2
25)
17.6
7818
,053
18.4
0118
.724
19,0
1319
,332
19,5
9319
,802
20,0
5420
,313
20,5
8820
,853
21,1
4021,4
25
21.7
13
21.9
2721
.219
21,2
3921
,071
21,0
7121
.116
21,1
1621
,116
21,1
1221
,112
21.1
/221
,112
21.1
1221
,112
21,1
122
2020
20
450
00
00
00
00
0(7
10>
0(3
70)
00
00
(4)
00
00
00
0
21.2
1921,2
39
21,0
7121
,071
21,1
1621
,116
21,1
1621
,112
21,1
1221
.112
21,1
1221
,112
21,1
12
21,1
1221
,112
229
216
210
210
210
152
149
5643
3323
2323
2323
00
00
066
066
00
01,
117
01.
117
00
00
071
10
875
00
443
00
00
0
6211
211
912
713
416
821
422
123
423
825
226
027
026
826
3
21,5
0921
,567
21,4
0022
,119
22,1
7123
,088
23,1
3123
,107
23,5
5023,5
44
23,5
4824
,673
24,6
8325
.797
25,7
93
561
584
604
626
649
649
649
649
649
649
649
649
649
649
649
22.0
7022
.151
22,0
0422
,745
22,8
2023
,737
23,7
80
23.7
5624
,199
24,1
9324
,197
25,3
2225
.332
26.4
4626
,442
4.39
24.
098
3.60
34,
021
3,80
74,
405
4,18
73.
954
4,14
53.
880
3,61
04,
469
4,19
15,
021
4.72
924
.8°/
a22
.7°A
19.6
%21
.5°/
a20
.0%
22.8
%21
.4%
20.0
%20
.7%
19.1
%17
.5%
21.4
%19
.8%
23.4
%21
.8%
DEC - Assumptions of Load, Capacity, and Reserves Table
The fbi lowing notes are nimbered to match the line nunihers on the Summer Proiections of Load.Capacity, and Reserves tables. All values are MW except where shown as a Percent.
1. Planning is done Ibr the peak demand tbr the Duke System including Nantahimla. Nantahala became adivision of Duke Energ Carolinas in 1998.
A firm wholesale hackstand agreement lbr 47 MW between Duke Energ Carolinas and PMPA starts on1/1/2014 and continues through the end of 2020.
2. A firm sale of 150 MW summer and 25 MW winter for l-’FRC market power mitigation in 2013.
3. Cummlative energy efficiency and conservation programs (does not include demand response programs)
4. Peak load adjusted for tirm sale and cumulative energy efficiency
5. [bdsting generating capacity reflecting designated additions, planned uprates, retirements and deratesIncludes 101 MW Nantahala hydra capacity. and total capacity for Catawba Nuclear Station less832 MW to account for NCMPAI firm capacity sale.
6. Capacity Additions include the conversion of Lee Steam Station unit 3 from coal to natural gas in 2015 (170 MW).Capacit Additions include Duke Energ Carolinas hydra units scheduled to be repaired and returned to service.These units are returned to service in the 2012-20 15 timeframe and total 2 MW.
Also included is a 96.5 MW capacity increase due to nuclear uprates at Catawba. McGuire, and Oconee.Timing ol these uprates is shown from 20 14—2t) 17
7. Fhe 370 MW capacity retirement in summer 2015 represents the projected retirement date for Lee Steam Station.Capacity Derate of 4 MW associated with Marshall 4 SCR is included in 2020lime NRC has issued renewed energy facility operating licenses for all Duke Energy Carolinas nuclear facilities.‘[lie [ly’dro facilities for which Duke has submitted an application 10 FERC’ for licence renewal are assumed to
continue operation through the planning horiton.All retirement dates are subject to review on an ongoing basis.
8. Sum of lines 5 through 7
9. Cumulative Purchase Contracts including purchased capacit from PIIRPA Qualifying Facilities.an 88 MW (‘herokee County Cogeneration Partners contract which began in tune 1998 andexpires June 2020 and miscellaneous other QF projects.
(0. New nuclear resources economically’ selected to meet load and minimum planning reserve marginCapacity must be on—line by’ June 1 to be included in available capacit for the summer peak of that year
and h December 1 to he included in available capacit for the winter peak of that year.I O% share (allocated by’ load ratio basis with DEP) V.C. Summer Nuclear facility in 2018 and 2020
(66 MW in cacti year)1117 MW I .ee Nuclear Unit additions in 2024 and 2(126
31
DEC - Assumptions of Load, Capacity, and Reserves Table cont.
II. New fossil fuel resources economically selected to meet load and minimum planning reser e marginCapacity must he on—line by iune I to be included in available capacit) for the summer peak of that year
and h l)ecemher I to he included in available capacity for the winter peak ofthat year.Addition of680 MW oFC’omhined (‘vcle capacit iii 2017 (based on the need determined in 2012 [RP)Addition of 843 MW Advanced Combined Ccle units in 2019Addition of 403 MW of Combustion Turbine capacit in 2022
1 2. Cumulative solar. hiomass. hvdro and wind resources to meet 1’C REPS complianceAlso includes a compliance plan fbr South Carolina as a placehulder to reflect a possible state or kderal
renewable standard beginning in 201 8
13. Sum of lines 8 through I 2
14. Cumulative Demand Side Management programs including load control and DSDR
15. Sum of lines 13 and 14
16. The difference between lines 4 and 15
17. Reserve Margin = (Cumulative Capacity—Ssteni Peak {)emand)/Sstem Peak DemandMiniminn target planning resere margin is 14.5%
32
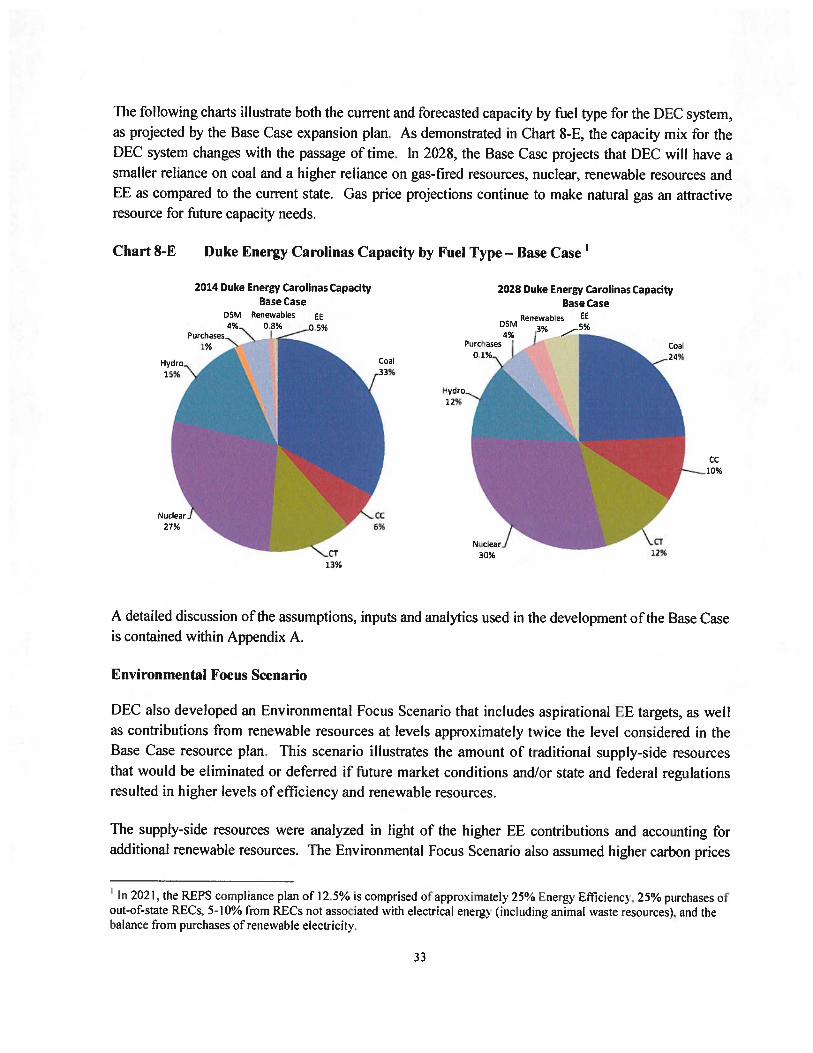
The following charts illustrate both the current and Forecasted capacity by fuel type for the DEC system,
as projected by the Base Case expansion plan. As demonstrated in Chart 8-E, the capacity mix for theDEC system changes with the passage of time. In 2028, the Base Case projects that DEC will have asmaller reliance on coal and a higher reliance on gas—fired resources, nuclear, renewable resources andEE as compared to the current state. Gas price projections continue to make natural gas an attractiveresource for future capacity needs.
Chart 8-E I)uke Energy Carolinas Capacity by Fuel Type — Base Case’
2014 Duke Energy Carolinas CapacityBase Case
DSM Renewables ER4% 0.8% j 5%
Purchases “\1%
2028 Duke Energy Carolinas CapacityBase Case
A detailed discussion of the assumptions, inputs and analytics used in the development of the Base Caseis contained within Appendix A.
Environmental Focus Scenario
l)EC also developed an Environmental [octis Scenario that includes aspirational EE targets, as wellas contributions from renewable resources at levels approximately twice the level considered in theBase Case resource plan. This scenario illustrates the amount of traditional supply-side resourcesthat would be eliminated or deferred if future market conditions and/or state and federal regulationsresulted in higher levels of efficiency and renewable resoui’ces.
The supply-side resources were analyzed in light of the higher EE contributions and accounting foradditional renewable resources. The Environmental Focus Scenario also assumed higher carbon prices
In 2021. the REPS compliance plan of 12.5°/b is comprised ofapproximatel 25% Energy Efflcienc3. 25% purchases ofout—of—state RECs. 5-10% from RE.Qs not associated ith electrical energ (including animal waste resources), and thebalance from purchases of rene able electricity.
33

and slightly lower fuel prices due to declining demand for fissil fuels. Table 8-F below represents theannual incremental additions reflected in the Environmental Focus Scenario expansion plan contrastedwith the Base Case expansion plan.
Table 8-F DEC Environmental Focus Scenario
Duke Energy Carolinas Resource PlanEnvironmental Focus Scenario
Note. Fables represent only undesiiznated resources from 208 through 2028 no changes to the Base (‘use build plan occurred in pror years
The Environmental Focus Scenario results in the ftllowing changes as compared to the Base Caseresource plan:
• Incremental increase in renewable energy resources of 1,857 MW nameplate (734 MWcontribution to peak) by 2028
• Increase in FE of 724 MW by 2028• 1)elay in the need for the new CC resource from 20 I 9 to 2022
• Cl’ resource in 2022 moves beyond 2028 timell’ame
The following charts illustrate both the current and Ibrecasted capacity by fuel type fbr the 1)EC’ system.as projected by the Environniental Focus Scenario expansion plan. Chart 8-G demonstrates the impactsof doubling the renewable resources as compared to the Base Case and including aspirational EE goals.i’he increase in FE and renewable resources reduce the Company’s reliance on coal, hydro and CTresources. Natural gas CC and nuclear capacity is still economically selected in the Environmentallocus Scenario, thus increasing the impact that those haseload resources have on the system capacitymix.
Duke Energy (‘arolinas Resource PlanBase Case
‘s’earT F I “w2018 .1
20192021)202! - -
2022
2023 - -
2024
2025 - -
20262027 - -
2028 - -
Year Resrnwce MW20182019
- -
20202021 - -
20222023 - -
2024
2025 - -
20262027 - -
2028 - -
34

Chart 8-C Duke Energy Carolinas Capacity by Fuel Type — Environmental Focus Scenario
2014 Duke Energy Carolinas CapacityEnvironmental Focus Scenario
RenewabIe FEDSM 08% 05%4%Purchses \
1%
Joint Planning Scenario
2028 Duke Energy Carolinas CapacityEnvironmental Focus Scenario
Renewjbies EE
6%
A Joint Planning Scenario that begins to explore the potential for DEC and l)EP to share firmcapacity between the companies was also developed. The Ibcus of this scenario is to illustrate thepotential for the utilities to collectively defer generation investment by utilizing each other’scapacity when available and by jointly owning new capacity. This plan does not address the specificimplementation methods or issues required to implement shared capacity. Rather, this scenarioillustrates the benefits of joint planning between DEC and DEP with the understanding that theactual execution of capacity sharing would require separate regulatory proceedings and approvals.
Table 8-LI below represents the annual non-renewable incremental additions reflected in the JointPlanning Scenario system expansion plan for the combined DEC and DEP Base Cases as compared tothe Joint Planning Scenario. The plan contains the undesignated additions for I)EC and DEP over theplanning horizon.
OSM
4%-
2jrchases
35
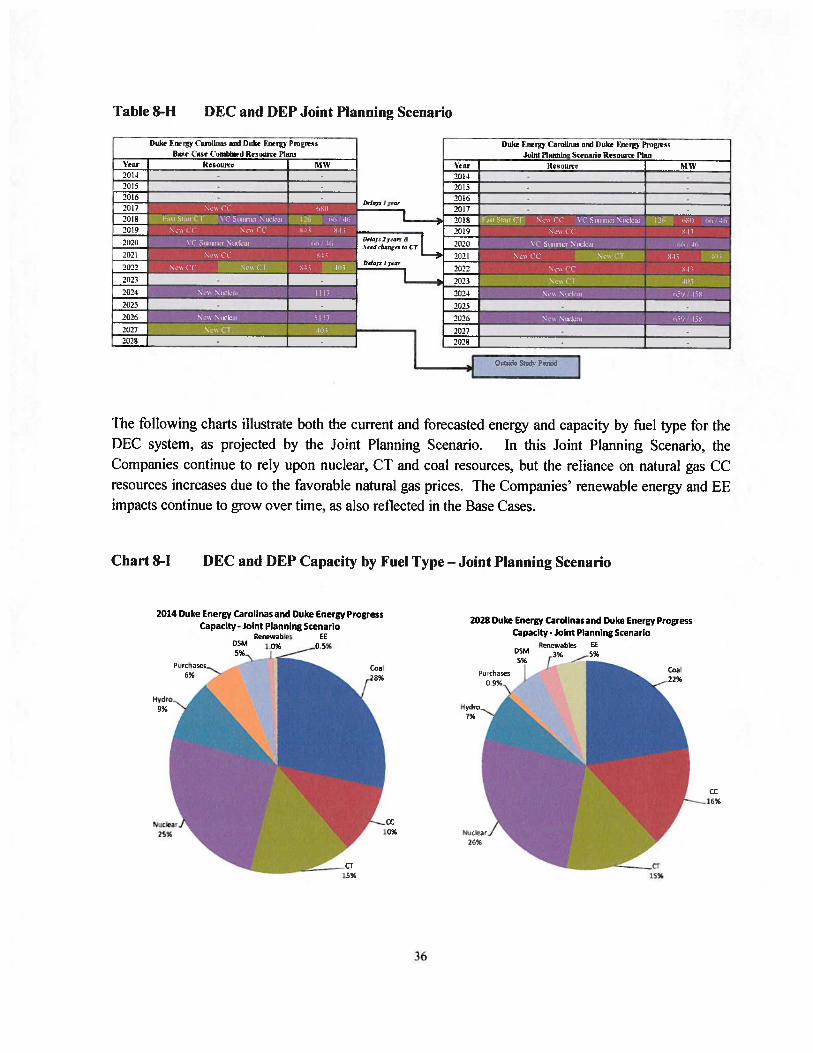
Table 8-H DEC and DEP Joint Planning Scenario
Duk I-in’pr (mimi and Duke Fmrj Pnigre’lla,i- (use (‘onibint-d kesourre Plans
Vear Resaune MW2014 -
2015 — -
20(620)7
201820(9
202))
202!
2622
2023 I
The following charts illustrate both the current and forecasted energy and capacity by fuel type for thel)EC system, as projected by the Joint Planning Scenario. In this Joint Planning Scenario, theCompanies continue to rely upon nuclear, C1’ and coal resources, hut the reliance on natural gas CCresources increases due to the favorable natural gas prices. The Companies’ renewable energy aiid EEimpacts continue to grow over time, as also reflected in the Base Cases.
Chart 8-1 DEC and DEP Capacity by Fuel Type — Joint Planning Scenario
l)uke 1ner (‘andinas and Duke Energy I’nignssJoint Planning Scenaiiu Rnsourre Plan
21)2-I
2025
‘!t
\tar Resnwte MW
2014 - -
21)15 - -
2(1)6 - -
20(7 - -
2(1)8
2019
202))
202!
2022
21)23
2024
2026
2027 - -
2028 -
0, C
2014 Duke Energy Carolinas and Duke Energy ProgressCapacity - Joint Planning Scenario
Renewables EEDSM 1.0% 05%5%\
2028 Duke Energy Carolinas and Duke Energy ProgressCapacity- Joint Planning Scenario
Rc-newab)es 00DIM 3%
Purhoses
36

Chart 8-J DEC and DEP Energy by Fuel Type — Joint Planning Scenario
2014 Duke Energy Carolinas and Duke Energy Progress 2028 Duke Energy Carolnas and Duke Energy Progress
Energy - 1ont Planning Scenario Energy - Joint Planning Scenario
P,seRenewables EE
1%Rnnewab’es
yurchasesrydro
2%
37

9. SHORT-TFRM ACTION IThAN
The Company’s Short-Term Action Plan, which identifies accomplishments in the past year and
actions to he taken over the next live years, is summarized below:
• Take actions to ensure capacity needs beginning in 2017 are met.2 As discussed later in
this chapter, DEC issued a Request for Proposals (RFP) to address the 2017 capacity
need. After evaluating multiple bids including a self-build option, the Company has
determined the most economic alternative to meet the 201 7 need is to construct a new
natural gas combined cycle facility at the Lee Steam Station site in Anderson County S.C.
• Retire older coal generation. Buck Steam Station tJnits 3 and 4 were retired in May
2011. Chffside Units I through 4 and Dan River Units I and 2 were retired in October
2011 and April 2012, respectively, in advance of the initial testing of new generation at
those locations. The remaining tin-scrubbed coal units at Buck and Riverbend were
retired in April 2013, nearly two years earlier than previously planned. The retirement ofLee Steam Station is currently planned for April 201 5 to correspond with the compliance
requirements of the Mercury and Air Toxics Standard. Duke Energy Carolinas alsoretired 350 MWs of its older CTs in October 2012.
• Continue to execute the Company’s FE and I)SM plan, which includes a diverse
portfolio of EE and l)SM programs, and continue on-going collaborative work to
develop and implement additional cost-effective EE and DSM products and services.
• Continue to seek enhancements to the Company’s DSM/EE portfolio by: (1) adding new
or expanding existing programs to include additional measures, (2) program
modifications to account for changing market conditions and new measurement and
veritication (M&V) results and (3) other FE research and development pilots.
• Completed construction of the new Dan River Combined Cycle unit. The unit was
operational December 2012. The 620 MW natural gas-tired CC generating station
achieves high operational flexibility and high thermal efficiency while utilizing state-of-
the-art environmental control technology to minimize plant emissions.
• Completed construction of the 825 MW Cliffside Unit 6, at the existing Cliffside Steam
Station. As of December 2012, Cliffside Unit 6 began commercial operation.
• Move fbrward with the conversion of Lee Steam Station Unit 3 from coal to natural gas fuel.
2 While there is a slight capacit) need in 2016. the Compan will continue to monitor that small need and take actionas necessary.
38

Lee Steam Station Unit 3 is reflected in the 2013 L)uke Energy Carolinas IRP as a retiredcoal unit in the fourth quarter of 201 4 and converted to natural gas before the summer peakof 201 5. Preliminary engineering has been completed and more detailed projectdew lopment and regulatory efforts are ongoing.
Continue to pursue the option tor new nuclear generating capacity in the 201 7 to 2028timeframe.
> DEC continues to explore the potential for a joint ownership share of the SouthCarolina Electric and Gas V.C. Summer nuclear station. The plan shows a 5.9%share of the two 1,100 units being available for the summer peaks of 2018 and 2020,respectively. While shown to he cost-effective from a planning perspective, theacquisition of this capacity is still subject to successful completion of discussions aswell as multiple regulatory approvals.
> The Company submitted an application for a Combined Construction and OperatingLicense (COL) and an environmental report to the Nuclear Regulatory Commission(NRC) fhr W.S. Lee IH (Lee) Nuclear on I)ec. 12, 2007. A supplement to theenvironmental report was filed September 24, 2009. The NRC issued its DrafiLnvironmental Impact Statement lbr the Lee Nuclear plant in I)ecernher 2011,concluding that the NCUC’s evaluation of DEC’s future load demand and itsaccuracy in historical load forecasting within the 2011 IRP was a reasonable basisfor planning.
In April 2012, the NRC staff subsequently requested I)uke Energy Carolinas toupdate the Lee Nuclear site-specific seismic analysis to incorporate the new Centraland Eastern United States (CEUS) Seismic Source Characterization model(published as NUREG-2 115 in January 2012). This negatively impacts the schedulefor NRC issuance of the Lee COL. Completion of the new site-specific seismicanalysis will delay Lee COl. issuance until second quarter 2016. Accordingly, 1)EChas moved the Conmiercial Operation [)ate (COD) for Lee Nuclear Unit 1 to 2024.
The Company continues to evaluate the optimal time to tile the Certificate ofEnvironmental Compatibility and Public Convenience and Necessity (CECPCN) forLee Nuclear in South Carolina, as well as pursue other relevant regulatory approvals.
> The Company will continue to pursue available federal, state and local tax incentivesand favorable financing options at the federal and state level.
The Company will continue to assess opportunities to benefit from economies of scaleand risk reduction in new resource decisions by considering the prospects fbr joint
39
ownership and/or sales agreements fbi’ new nuclear generation resources.
• Continue to evaluate market options fbi’ renewable generation and procure capacity, asappropriate. PPAs have been signed with developers of solar PV, landfill gas and windresources. Additionally, REC purchase agreements have been executed fbr purchases of’unhundled RE(’s from wind, solar PV, solar thermal and hydroelectric facilities.
• Continue to investigate the future environmental control requirements and resultingoperational impacts associated with existing and potential environmental regulations suchas MATS. the Coal Combustion Residuals t’itle, the Cross—State Air Pollution Rule(CSAPR) and the new ozone National Ambient Air Quality Standard (NAAQS).
• Continue to pursue existing and potential opportunities for wholesale ower salesagreements within the 1)uke Energy balancing authority area.
• Continue to monitor energy—related statutory and regulatory activities.
• Continue to examine the benefits of joint capacity planning and pursue appl’opriateregulatory actions.
A summarization of the capacity resource changes for the Base Case in the 2013 IRP is shown inTable 9-A. Capacity retirements and additions are presented as incremental values in the year inwhich the change is projected to occur. The values shown for renewable resources, I)SM and EErepresent cumulative totals.
40
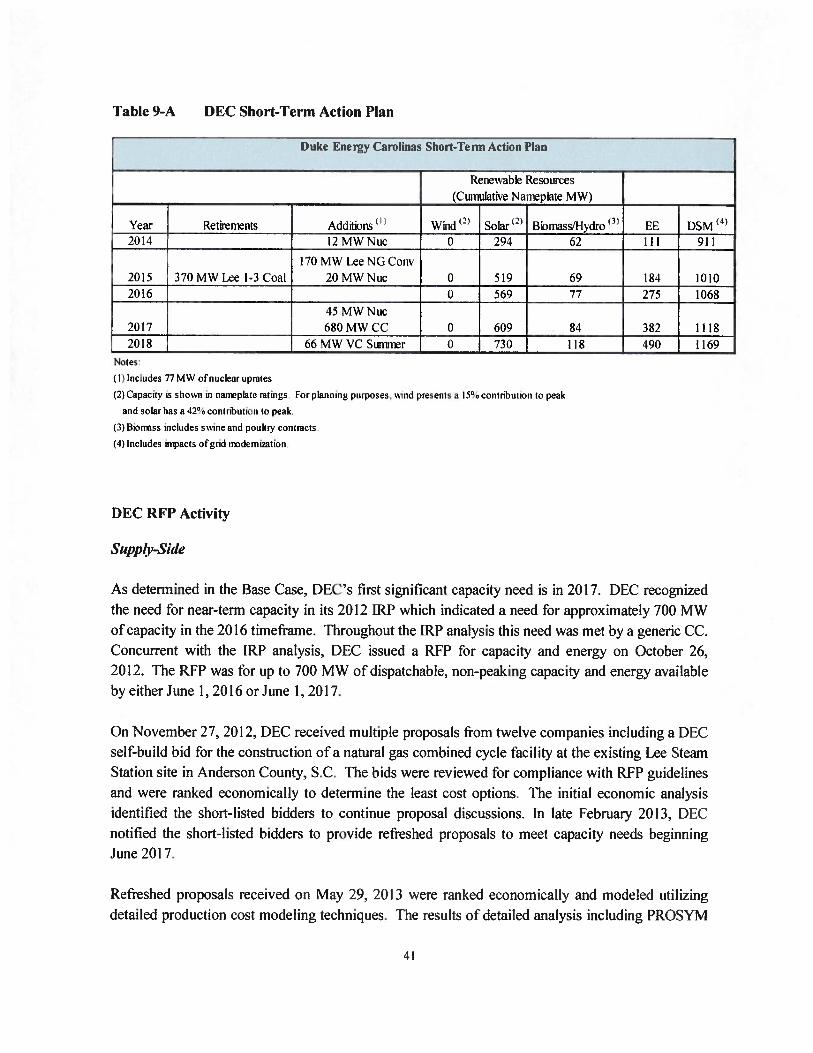
Table 9-A DEC Short-Term Action Plan
Duke Energy Carolinas Short-Term Action Plan
Renewable Resources
(Ciuimlative Nanplate MW)
Year Retitnnts Additions (21 Solar Bitiniass/Hvdro FE DSM °
2014 12 MW Nuc 0 294 62 I I 1 91 1
170 MW Lee NG Conx
2015 370 MW Lee 1-3 Coal 20 MW Nuc 0 519 69 184 10102016 0 569 77 275 1068
45 MW Nuc2017 68OMWCC’ 0 609 84 382 11182018 66MWVCSunmer 0 730 118 490 1169
Notes
(I) Includes 77MW ofnuclear uprates
(2) Capacity is shossii in nameplate ratings For planning purposes. sond presents a lSo contribution to peak
and solar has a 40 contribution to peak
(3) Bionss includes ssone and poultrs contracts
(4) Includes impacts ofurid irxdemizution
[)EC RFP Activity
Supply-Side
As determined in the Base Case, DEC”s first significant capacity need is in 2017. [)EC recogiiized
the need for near-term capacity in its 2012 IRP which indicated a need ibr approximately 700 MWof capacity in the 2016 tirneframe. ‘l’hroughout the IRP analysis this need was met by a generic CC.Concurrent with the IRP analysis, DEC issued a RFP fbr capacity and energy on October 26,2012. The RFP was for up to 700 MW of dispatchable, non-peaking capacity and energy available
by either June 1,2016 or June 1,2017.
On November 27, 2012, DEC received multiple proposals from twelve companies including a DECselthuild bid for the construction of a natural gas combined cycle fcility at the existing Lee SteamStation site in Anderson County, S.C. ‘[‘lie bids were reviewed for compliance with RFP guidelinesand were ranked economically to determine the least cost options. ‘l’he initial economic analysisidentified the short—listed bidders to continue proposal discussions. In late February 2013, DECnotified the short—listed bidders to provide refreshed proposals to meet capacity needs beginningJune 2017.
Refreshed proposals received on May 29, 2013 were ranked economically and modeled utilizing
detailed production cost modeling techniques. The results of detailed analysis including PROSYM
41

production cost modeling, along with all other fixed and variable revenue requirements. indicatedthe Lee CC selt-huild proposal to he the least—cost option of the refreshed proposals.
Renewable Enerp
No renewable energy RFPs have been issued since the filing ol’ l)LC s 2012 IRP.
42

AflEN DIX A: QUANTITATIVE ANALYSIS
This appendix provides an overview of the Company’s quantitative analysis of resource optionsavailable to meet customers’ future energy needs in the Base Case and for an Environmental
Focus Scenario that reflects increased C02 cost, FE and renewables. The future resource needswere optimized based on DEC and DEP independently. However the benefits of jointly planning
on a system basis for the Base Case and Environmental Focus Scenario were also presented.
A. Overview of Analytical Process
The analytical process consists of tour steps:
1. Assess resource needs
2, Identit’ and screen resource options for further consideration
3. 1)evelop portfolio configurations
4. Perform portfolio analysis
I. Assess Resource Needs
The required load and generation resource balance needed to meet future customer demands was
assessed as outlined below:
• Customer load peak and energy forecast — identified future customer aggregate demands
to determine system peak demands and developed the corresponding energy load shape
• Existing supply-side resources — summarized each existing generation resource’s
operating characteristics including unit capability, potential operational constraints and
life expectancy
• Operating parameters — determined operational requirements including target planning
reserve margins and other regulatory considerations
Customer load growth, the expiration of purchased power contracts and additional asset retirements
result in significant resource needs to meet energy and peak demands. The following assumptions
impacted the 2013 resource plan:
• In the Base Case, the summer peak demand and energy growth after the impact of energy
efliciency averaged 1.5% through 202g. In the Fnvironmental Focus Scenario afier the
impact of energy efficiency, summer peak demand growth averaged 1 .3% and energy
growth averaged 1 .2% over the next 15 years
• Retirement of an additional 350 MW of old fleet combustion turbines and 710 MW of older
coal units since the 2012 IRP filing
• Retirement of an additional 370 MW at Lee Steam Station by April 2015
43
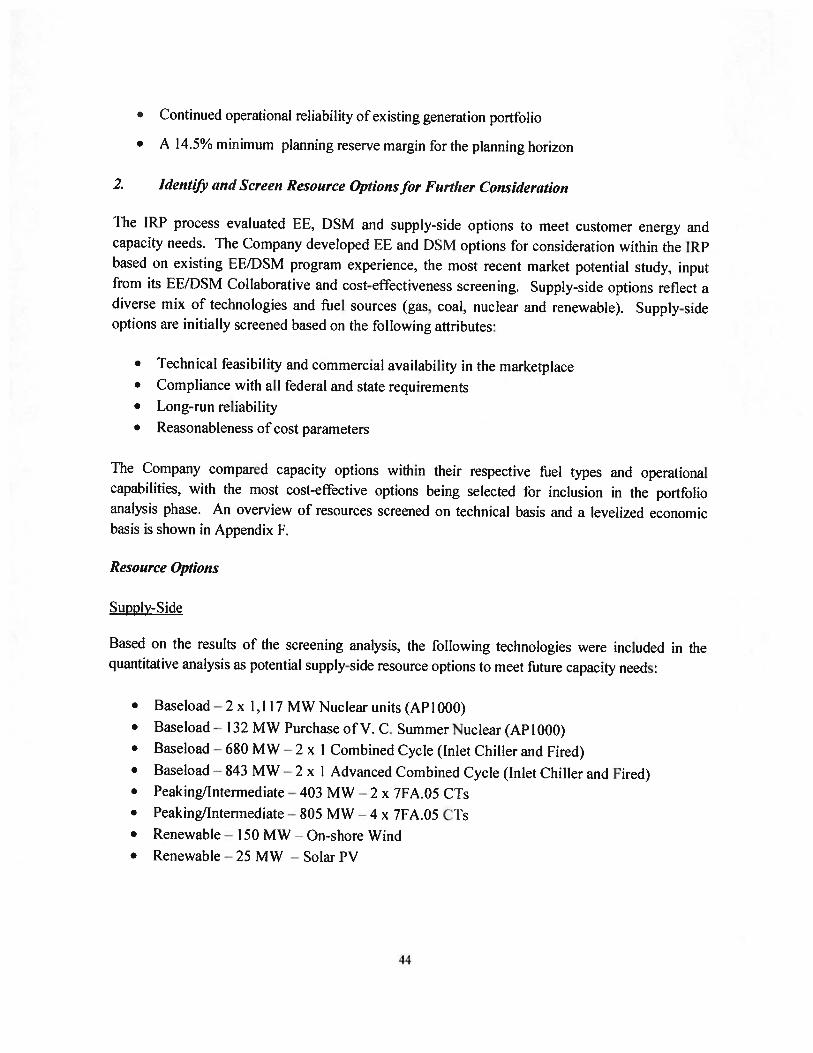
• Continued operational reliability of existing generation portlblio
• A 14.5% minimum planning reserve margin for the planning horizon
2. IdentiJj’ aiid Screen Resource Optionsfor Further Consideration
Ihe IRP process evaluated FE, E)SM and supply—side options to meet customer energy ancicapacity needs. The Company developed EE and l)SM options for consideration within the IRPbased on existing EE/1)SM program experience, the most recent market potential study, inputfrom its EE/DSM Collaborative and cost-effectiveness screening. Supply-side options reflect adiverse mix of technologies and fuel sources (gas, coal. nuclear and renewable). Supply-sideoptions are initially screened based on the thilowing attributes:
• Technical feasibility and commercial availability in the marketplace• Compliance with all lèderal and state requirements• Long-run reliability
• Reasonableness of cost parameters
The Company compared capacity options within their respective fttel types and operationalcapabilities, with the most cost-effective options being selected for inclusion in the portfolioanalysis phase. An overview of resources screened on technical basis and a levelized economicbasis is shown in Appendix F.
Resource Options
Supply-Side
Based on the results of the screening analysis, the ft)llowing technologies were included in thequantitative analysis as potential supply-side resource options to meet future capacity needs:
• Baseload —2 x 1,117 MW Nuclear units (API 000)• Baseload 132 MW Purchase of V. C. Summer Nuclear (API000)• Baseload — 680 MW — 2 x I Combined Cycle (Inlet Chiller and Fired)• Baseload — 843 MW — 2 x I Advanced Combined Cycle (Inlet Chiller and Fired)• Peaking/Intermediate 403 MW — 2 x 7FA.05 CTs• Peaking/Intermediate — 805 MW — 4 x 7FA.05 CR• Renewable 1 50 MW On-shore Wind• Renewable — 25 MW — Solar PV
44
Energy Efficiency and Demand-Side Management
FE and DSM programs continue to be an important part of Duke Energy Carolinas’ system mix.
The Company considered both DSM and FE programs in the 1RP analysis. As described in
Appendix D, EE and I)SM measures are compared to generation alternatives to identiI’ cost-effective EE and DSM programs.
In the [3ase Case, the Company modeled the program costs associated with FE and DSM based on acombination of both internal company expectations and projections based on infbrma(ion from the
2013 update of the Company’s 2011 market potential study. In the DEC and DEP mergersettlement agreement, the Company agreed to aspire to a more aggressive implementation of FE
throughout the planning horizon, and the impacts of this goal were incorporated in the
Environmental Focus Scenario. The program costs used for this analysis leveraged the Company’sinternal projections tbr the first five years. in the longer term, updated market potential study data
incorporating the impacts of customer participation rates over the range ol potential programs.
3. Develop Portfolio configurations
l’he Company conducted a screening analysis using a simulation model to identify the most
attractive capacity options under the expected load profile for both the Base Case andEnvironmental Focus Scenario. The set of basic inputs included:
• CO2 price starting in 2020 increasing throughout the planning horizon
Base Case - 1 7 s/ton in 2020 increasing to 33 $/ton by 2028
Environmental Focus Scenario - 20 S/ton in 2020 increasing to 45 S/ton by 2028;
• Coal, natural gas and fuel oil
Short-term: Based on the market observations
Long—term: Based on the Company’s fundamental fuel price projections
For the Environmental Focus Scenario, the Company’s fundamental fuel price
projection incorporated the impact of ditierent C02, EE and renewable
1-equirements consistent with that scenario
• Availability and operating and maintenance cost for both new and existing generation
• Compliance with current and potential environmental regulations,
• Financial updates including cost of capital, escalation and discount rates
• System operational needs for load ramping, and spinning reserves
45
The projected load and generation resource need incorporating the impacts of EE and[)SM.
- I’he Base Case reflects FE savings projections based on the updated market
potential study at the end ol the planning horizon
l’he Environmental Focus Scenario assumes lull compliance with the Duke
Energy-Progress Energy merger settlement agreement with the cumulative FE
achievements since 2009 counted toward the cumulative settlement agreement
impacts
Compliance with NC REPS requirements and a placeholder renewable requirement for
South Carolina that could represent a federal or state program starting in 201 8
.r The Environmental [ocus Scenario reflects a doubling of the amount ofrenewables included in the Base Case by 2028
4. Perform Portfolio ,4,,a!vsis
For the Base Case and Environmental Focus Scenario, the optimal portfolios were developed forI)EC without the benefit of sharing capacity with DEP. To demonstrate the value of sharingcapacity with [)EP, a Joint Planning Scenario was developed that examined how the combined
plans of DEC and DEP would change if a 14.5% minimum planning reserve niargin was applied atthe combined system level rather than the individual company level.
An overview of the specific details of the optimal portiblios for both the Base Case and
Environmental Focus Scenario without the benefit of sharing capacity with L)EP is shown inTable A-I below.
46
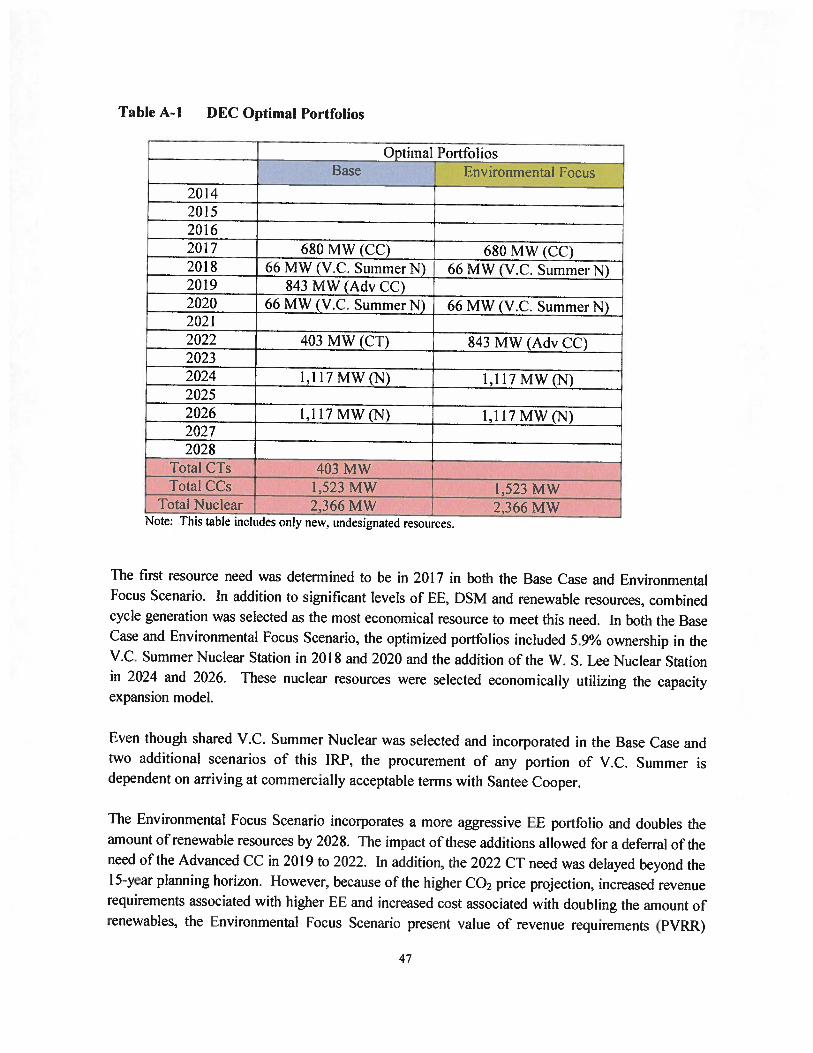
Table A-I DEC Optimal Portfolios
Optimal PortfoliosBase 1 Environmental Focus
2014201520162017 680MW(CC) 680MW(CC)r 2018 66 MW(V.C. SummerN) 66 MW(V.C. Summer N)2019 843 MW(AdvCC)2020 66 MW (V.C. Summer N) 66 MW (VC. Summer N)20212022 403 MW (CT) 843 MW (Adv CC’)20232024 l,II7MW(N) 1.II7MW(N)20252026 1,II7MW(N) 1,II7MW(N)20272028
Total CTs 403 MWTotal CCs 1,523 MW 1,523 MW
Total Nuclear 2,366 MW 2,366 MWNote: This table includes onl’ new. undesignated resources.
‘l’he first resource need was determined to he in 2017 in both the Base Case and EnvironmentalFocus Scenario. In addition to significant levels of FE, 1)SM and renewable resources, combinedcycle generation was selected as the most economical resource to meet this need. In both the BaseCase and Environmental Focus Scenario, the optimized portfolios included 5.9% ownership in theV.C’. Summer Nuclear Station in 2018 and 2020 and the addition of the W. S. Lee Nuclear Stationin 2024 and 2026. These nuclear resources were selected economically utilizing the capacityexpansion model.
Even though shared V.C. Summer Nuclear was selected and incorporated in the Base Case andtwo additional scenarios of this IRP, the procurement of aiiy portion of V.C. Summer isdependent on arriving at commercially acceptable terms with Santec Cooper.
The Environmental Focus Scenario incorporates a more aggressive FE portfolio and doubles theamount of renewable resources by 2028. The impact of these additions allowed for a deferral of theneed of the Advanced CC in 2019 to 2022. In addition, the 2022 CT need was delayed beyond the1 5-year planning horizon. However, because of the higher CO2 price projection. increased revenuerequirements associated with higher EE and increased cost associated with doubling the amount ofrenewables, the Environmental Focus Scenario present value of revenue requirements (PVRR)
47
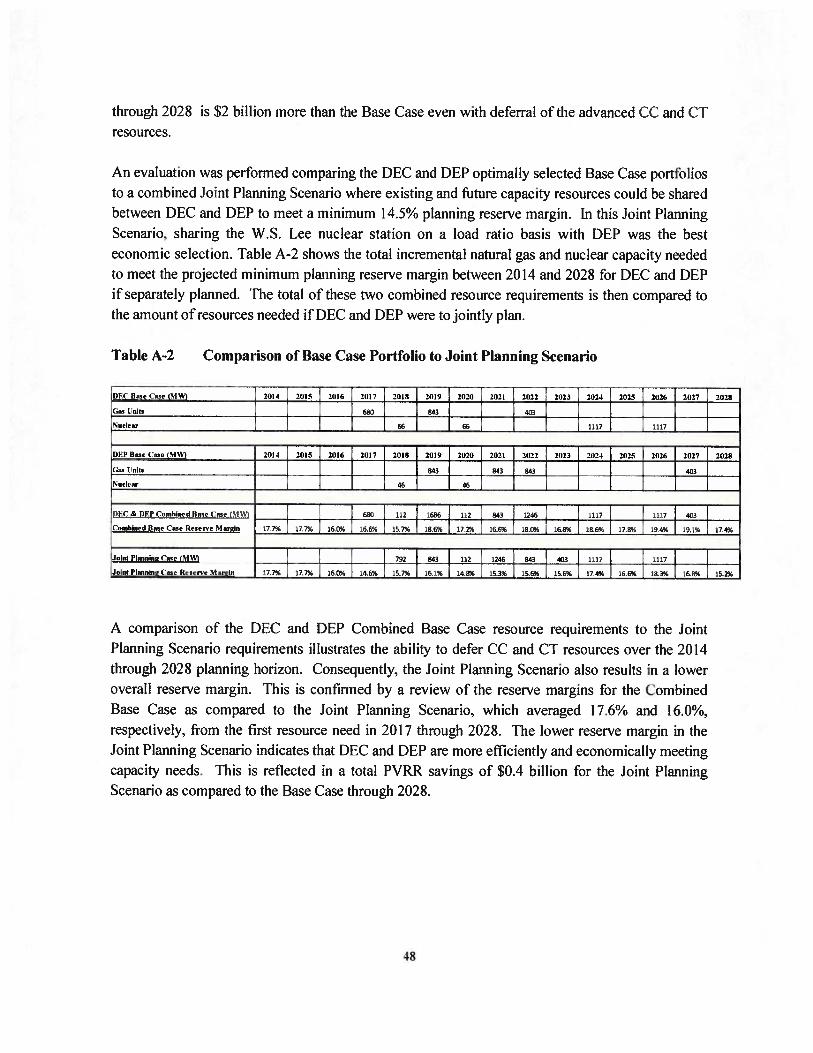
through 2028 is $2 billion more than the Base Case even with deferral of the advanced CC’ and CTresources.
An evaluation was performed comparing the DEC and [)EP optimally selected Base Case porttoiiosto a combined .Joint Planning Scenario where existing and future capacity resources conic! he sharedbetween DEC and DEP to meet a minimum 14.5% planning reserve margin. In this Joint Planning
Scenario. sharing the W.S. Lee nuclear station on a load ratio basis with 1)EP vas the besteconomic selection. ‘fable A-2 shows the total incremental natural gas and nuclear capacity neededto meet the projected minimum planning reserve margin between 2014 and 2028 for 1)FC and DEP
if separately planned. The total of these two combined resource requirements is then compared tothe amount of resources needed if l)EC and DEP were to jointly plan.
Table A-2 Comparison of Base Case Portfolio to Joint Planning Scenario
D6P Bane Coon, (MW)
Gun Loito
Nuclear
2014 2015 2016 20)7 2(110
46
2(119
843
21(20
46
2021
843
21(22
843
2(123 2024 2025 j 2026 2(127
401
DEC l(ote ( one ll99) 2(114 21)15 21)16 2(117 2019 2019 2(121) 21(21 2022 21(23 21(24 2(125 2026 21)27 2028
(unnUni!s 6813 843 403
‘nuclear J 66 66 1117 3117
DEC & DEl’ (‘onthjoe,l Bone Cane (51W) 680 112 1686 132 843 1248 1117 1117 403
Combined Bone Cone Rcnerve Mmin 17.7% 17.7% 160% 166% 15.7% 18,6% 172% 16.6% 18.0% 16.8% 18.6% 17.8% lg.4% 19.1% 17.4%
joint Ploonitin, (‘one (MW} 792 843 112 1246 843 403 1117 1137
loin! P!oonin (‘one Renerve ‘nIoniin 17,7% 37.7% 160% 14.6% 15.7% 16.1% 14.8% 35.3% 15.6% 15.6% 174% 16.6% 18.3% 36.855 15.2%
2(129
A comparison of the DEC and [)EP Combined Base Case resource requirements to the JointPlanning Scenario requirements illustrates the ability to defer CC and C”!’ resources over the 2014through 2028 planning horizon. Consequently, the Joint Planning Scenario also results in a loweroverall reserve margin. This is confirmed by a review of the reserve margins for the CombinedBase Case as compared to the Joint Planning Scenario, which averaged 1 7.6% and 16.0%,respectively, from the first resource need in 201 7 through 2028. ‘l’he lower reserve margin in theJoint Planning Scenario indicates that DEC and DEP are more efficiently and economically meetingcapacity needs. This is reflected in a total PVRR savings of $0.4 billion for the Joint PlanningScenario as compared to the l3ase Case through 2028.
48
B. Quantitative Analysis Summary
‘l’he quantitative analysis resulted in several key takeaways that impact near—term decision— makingas well as planning br the longer term.
[he Base Case and Environmental I ocus Scenario show optimal port(b lios that recognizethe need fbr new generation in 201 7 to meet the minimum reserve margin requirement.The results of this analysis show that this need is best met with CC generation
2. ‘[‘he ability to jointly plan with [)EP provides customer savings by allowing For thedeferral of new generation resources over the 2014 through 2028 planning horizon.
3. New nuclear generation is selected as an economic resource for the Rase Case andEnvironmental Focus Scenario. In the 1 5-year planning horizon, a 5.9% ownership in theV.C. Summer in 2018 and 2020 and the addition of the Lee Nuclear in 2024 and 2026were selected.
‘[he Base Case and Environmental Focus Scenario analyses support 100% ownership of LeeNuclear by l)EC. However the Company continues to consider the benefits of’ regional nucleargeneration. The idea of sharing new baseload generation resources between multiple parties allowsbr resource additions to he better matched with load growth and lbr new construction risk to heshared among the parties. ‘Ibis results in positive benefits fbr the Company’s customers. l)ukeEnergy Corporation is in discussions with Santee Cooper concerning the potential acquisition of a10% ownership interest in the new nuclear units at V.C. Summer Units 2 and 3. The parties arediscussing the commercial tenns and currently have not reconciled differences and no contract hasbeen signed. Any participation in the V.C. Summer project is premised on successful resolution ofoutstanding commercial items and continued demonstration of’ customer benefits. The parties areworking towards a final decision in the next several months. If l)uke Energy was to procure anownership interest in V.C. Summer Units 2 and 3, the ownership is expected to be shared betweenDEC and [)EP on a load ratio basis. ‘T’he benefits of co-ownership of the Lee Nuclear facility withDEP were also illustrated with the ability to jointly plan as represented in the Joint PlanningScenario described above.
‘I’here are several challenges that have impacted the schedule for the Lee Nuclear lhcility. In March20 12, the NRC issued a request for information letter to operating power reactor licensees regardingrecommendations of’ the Near—Term ‘[‘ask Force review of insights from the [‘ukushinia 1)ai—ichiaccident. In April 2012, the NRC staff subsequently requested DEC to update the Lee Nuclear site-specific seismic analysis to incorporate the new Central and Eastern United States (CEUS) SeismicSource Characterization model (published as NUREG-2 115 in January 2012). Work on a new LeeNuclear site-specific analysis implementing the new CEUS seismic model is underway. However,completion of’ the new seismic analysis is not expected hefbre January 201 4. This negativelyimpacts the schedule tbr NRC issuance of the Lee Nuclear COL. Completion of the new site-
49

specific seismic analysis will delay Lee COL issuance until second quarter 2016. Accordingly,1)uke Energy Carolinas has moved the commercial operation date ft)r Lee Nuclear Unit 1 to 2024.
In addition, the N RU issued an updated Waste Confidence Rule in 2010 aIlirm ing that the ageiicyhas reasonable assurance utility spent fuel can he safely stored fhr at least 60 years after a powerreactors operating license expires. Waste conlidence is central to the agency’s ability to license newreactors and renew the operating licenses of existing reactors. On June 8, 2012, the U.S. Court ofAppeals of the T)istrict of Columbia Circuit issued a decision vacating the updated WasteConfidence Rule and remanding it to the NRC fur further proceedings. The Court held that theNRC’s analysis was insufficient to support its findings that the permanent storage will be available‘when necessary” and that spent fuel can safely be stored on-site at nuclear plants fur 60 years aflerthe expiration of a plant’s license. In response to the remand decision, numerous parties filed apetition to suspend final decisions in all pending reactor licensing proceedings pending completionof remanded waste confidence proceedings in new nuclear and license renewal proceedings pendingbefore the NRC. On August 7, 2012, the NRC issued an order on the petition stating that: (1) it isconsidering all options for resolving the waste confidence issues, which could include generic orsite specific actions, but has not yet determined a course of action, (2) it will not issue licensesdependent on the Waste Confidence Rule until the Court’s remand is appropriately addressed,however, this determination extends only to final license issuance, and (3) all licensing reviews andproceedings should continue to move forward. The NRC expects this issue to be resolved in August2014. Waste Confidence must he resolved to support issuance of the Lee Nuclear C’OL. Ilowever,based on current schedules, this is not expected to impact issuance of the Lee Nuclear COL.
The PVRR results presented in the IRP analysis were based on a 1 5-year planning horizon, but theeconomics supporting new nuclear were extended to 2052 to capture the long-term benefits of thelow production cost and carbon-free generation. It is important to note that while V.C. Summer andLee Nuclear facilities were selected economically, they would also serve as replacement carbon-freehaseload generation if existing nuclear generation is retired in the future. In 2033, the currentoperating license for Oconee Nuclear Station expires. At this time, the Company has not made adecision concerning seeking a second license extension for this plant. Oconee Nuclear Station is asignificant part of DEC’s generation portfolio representing over 2,500 MW of capacity and annualenergy output of approximately 20,000 GWh. As such, it is important to start to examine theimpacts of any potential retirement of’ Oconee Nuclear Station as compared to new nucleargeneration to assist the Company as it considers seeking a second license extension.
One ol’the major benefits of having additional nuclear generation is the lower system CO2 footprint.Assuming regional nuclear planning with L)EP, DEC procures its load ratio share of’ the I O%interest of VU. Summer and sharing Lee Nuclear Stations, the resulting reduction in CO2 emissionsis approximately 6 million tons of CO2 for DEC and [)EP by 2028 (from a 2013 baseline). ‘[his
50
illustrates that for the Company to achieve material system reductions in CO2 emissions, it must addnew nuclear generation to the future resource portfolio.
The Company’s planning process must he dynamic and adaptable to changing conditions. ‘[hisresource plan is the mOSt appropriate resource plan at this point in time. However, good businesspractice requires DLX’ to continue to study the options and make adjustments as necessary andpractical to reflect improved information and changing circumstances. Consequently. a strongbusiness planning framework is truly an evolving process that can never he considered complete.
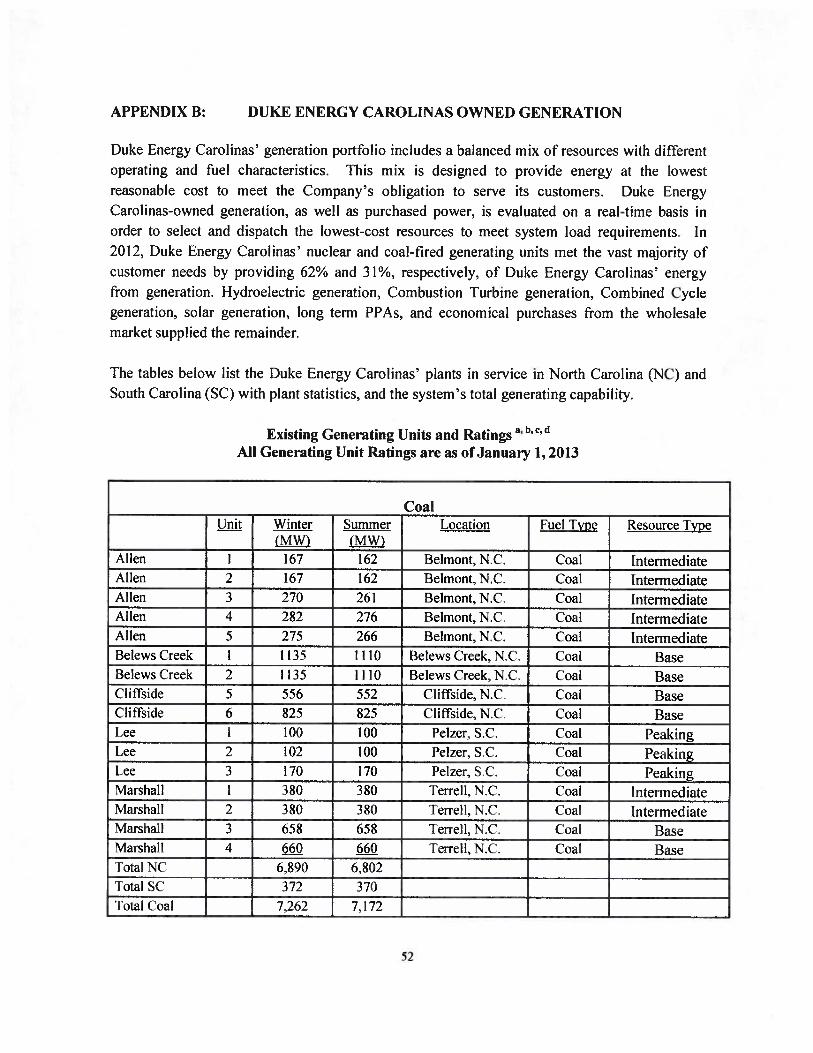
APPENDIX B: DUKE ENERGY CAROLINAS OWNED GENERATION
Duke Fnergy Carolinas generation portfolio includes a balanced mix of resources with differentoperating and fuel characteristics. This mix is designed to provide energy at the lowestreasonable cost to meet the Companys obligation to serve its customers. [)uke EnergyCarolinas-owned generation, as well as purchased power, is evaluated on a real-time basis inorder to select and dispatch the lowest-cost resources to meet system load requirements. In
2012, Duke Energy Carolinas’ nuclear and coal-flred generating units met the vast majority of
customer needs by providing 62°/o and 3 1%, respectively, of l)uke Energy Carolinas’ energyfrom generation. I lydroelectric generation, Combustion Turbine generation, Combined Cyclegeneration, solar generation, long term PPAs, and economical purchases from the wholesale
market supplied the remainder.
The tables below list the Duke F.nergy Carolinas’ plants in service in North Carolina (NC) andSouth Carolina (SC) with plant statistics, and the system’s total generating capability.
Existing Generating Units and RatingsAll Generating Unit Ratings are as of January 1, 2013
_____
CoalUnit Winter Summer Location Fuel Type Resource Type
(MW) (MW)Allen 1 167 162 Belmont, NC. Coal IntermediateAllen 2 167 162 Belmont,N.C. Coal IntermediateAllen 3 270 261 Belmont, NC. Coal IntermediateAllen 4 282 276 Belmont, NC. Coal IntermediateAllen 5 275 266 Belmont, NC. Coal IntermediateBelews Creek 1 1 135 1 1 lO Belews Creek, NC. Coal BaseBelews Creek 2 I 135 1 I 10 Belews Creek, NC. Coal I3aseCliffside 5 556 552 Cliflside, N.C. Coal BaseCliffside 6 825 825 Cliffside, N.C. Coal BaseLee I 100 100 Pelzer, S.C. Coal PeakingLee 2 102 100 Pelzer, S.C. Coal PeakingLee 3 170 170 Pelzer. S.C. Coal PeakingMarshall 1 380 380 Terrell, NC. Coal IntermediateMarshall 2 380 380 Terrell, NC. Coal IntermediateMarshall 3 658 658 Tenell, NC. Coal BaseMarshall 4 660 660 Terrell, NC. Coal BaseTotal NC 6.890 6,802Total SC 372 370
‘lotal Coal 7,262 7,172
52
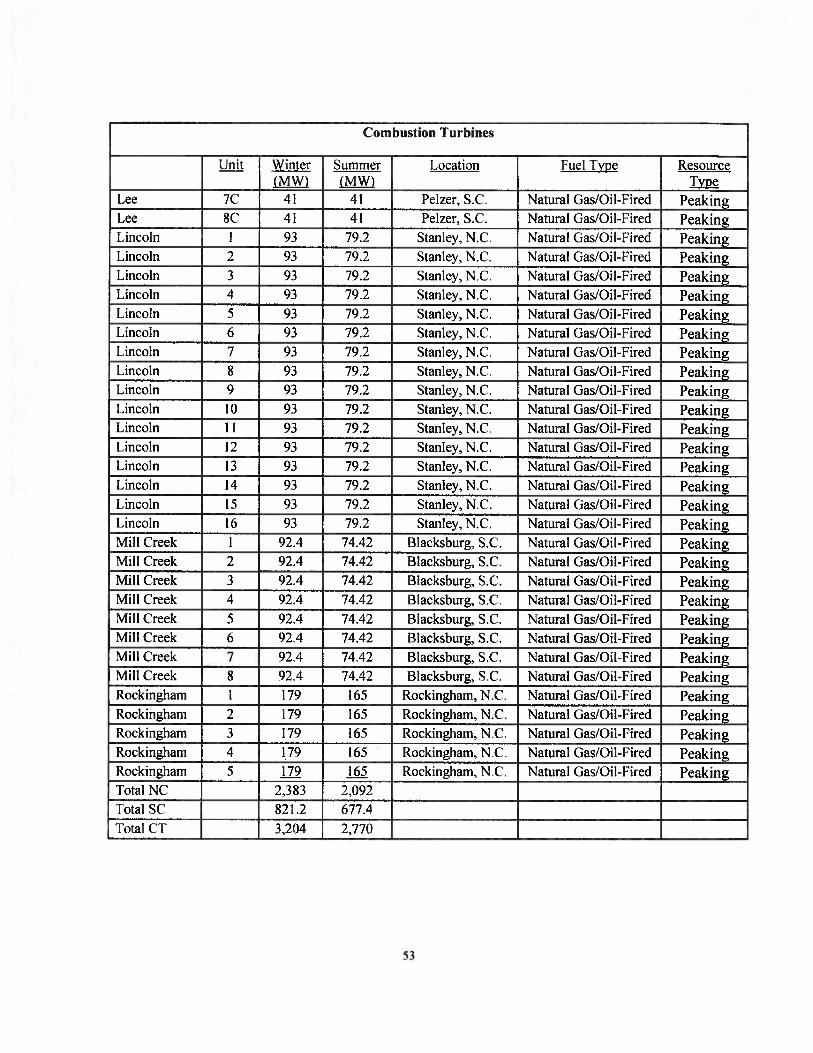
Combustion Turbines
Unit Winter Summer Location Fuel Fype Resource(MW) (MW)
Lee 7C 41 41 Pelzer, S.C. Natural Gas/Oil-Fired PeakingLee 8C 41 41 Pelzer, S.C. Natural Gas/Oil-Fired PeakingLincoln 1 93 79.2 Stanley, NC. Natural Gas/Oil-Fired PeakingLincoln 2 93 79.2 Stanley, NC. Natural Gas/Oil-Fired PeakingLincoln 3 93 79.2 Stanley. NC. Natural Gas/Oil-Fired PeakingLincoln 4 93 79.2 Stanley, N.C. Natural Gas/Oil-Fired PeakingLincoln 5 93 79.2 Stanley, N.C. Natural Gas/Oil-Fired PeakingLincoln 6 93 79.2 Stanley, NC’. Natural (las/Oil-Fired PeakingLincoln 7 93 79.2 Stanley, NC. Natural Gas/Oil-Fired PeakingLincoln 8 93 79.2 Stanley, N.C. Natural Gas/Oil-Fired PeakingLincoln 9 93 79.2 Stanley, NC. Natural Gas/Oil-Fired PeakingLincoln 10 93 79.2 Stanley, N.C. Natural Gas/Oil-Fired PeakingLincoln 1 1 93 79.2 Stanley, N.C. Natural Gas/Oil-Fired PeakingLincoln 12 93 79.2 Stanley, .C. Natural Gas/Oil-Fired PeakingLincoln 13 93 79.2 Stanley, N.C. Natural Gas/Oil-Fired PeakingLincoln 14 93 79.2 Stanley, N.C. Natural Gas/Oil-Fired PeakingLincoln 1 5 93 79.2 Stanley, NC. Natural Gas/Oil-Fired PeakingLincoln 16 93 79.2 Stanley, N.C. Natural Gas/Oil-Fired PeakingMill Creek 1 92.4 74.42 Blacksburg, S.C. Natural Gas/Oil-Fired PeakingMill Creek 2 92.4 74.42 Blacksburg, S.C. Natural Gas/Oil-Fired PeakingMill Creek 3 92.4 74.42 Blacksburg, S.C. Natural Gas/Oil-Fired PeakingMill Creek 4 92.4 74.42 Blacksburg, S.C. Natural Gas/C)il-Fired PeakingMill Creek 5 92.4 74.42 Blacksburg, S.C. Natural Gas/Oil-Fired PeakingMill Creek 6 92.4 74.42 Blacksburg, S.C. Natural Gas/Oil-Fired PeakingMill Creek 7 92.4 74.42 Blacksburg, S.C. Natural Gas/Oil-Fired PeakingMill Creek 8 92.4 74.42 Blacksburg, S.C. Natural Gas/Oil-Fired PeakingRockingham 1 179 165 Rockingham, NC. Natural Gas/Oil-Fired PeakingRockingham 2 179 165 Rockingharn, NC. Natural Gas/Oil-Fired PeakingRockingham 3 179 165 Rockingharn, NC. Natural (las/Oil-Fired PeakingRockingham 4 179 165 Rockingham, NC. Natural (las/Oil-Fired PeakingRockingharn 5 179 165 Rockingham, N.C’. Natural Gas/Oil-Fired PeakingTotal NC 2,383 2,092
Total SC 821.2 677.4
Total CT 3,204 2,770
53
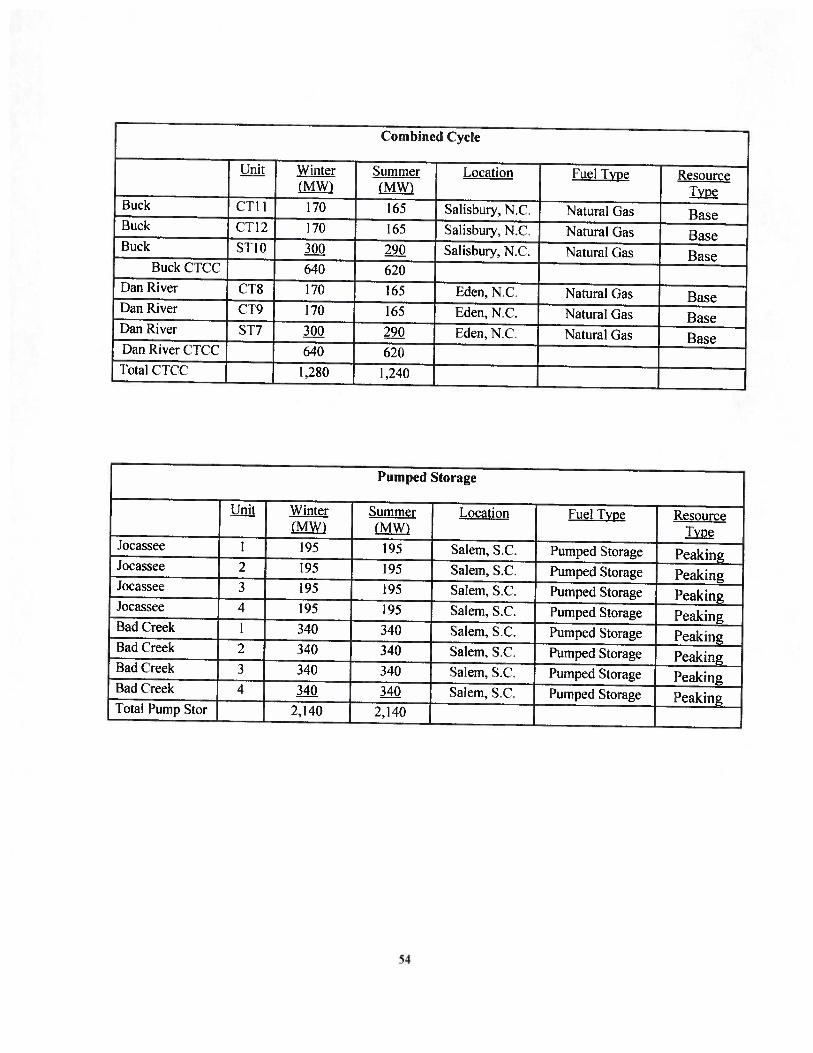
Combined Cycle
Unit Winter Summer Location Fuel Type Resource(MW) (MW)
Buck CT]] 170 165 Salisbury, N.C. Natural Gas BaseBuck CTI2 170 165 Salisbury. N.C. Natural Gas BaseBuck SilO 300 290 Salisbury, NC. Natural (las Base
Buck CTCC 640 620Dan River CT8 170 1 65 Eden, NC. Natural Gas BaseDan River CT9 170 165 Eden, NC. Natural Gas BaseDan River ST7 300 290 Eden. NC. Natural Gas BaseDan River CTCC 640 620Total CTCC 1,280 1 ,240
Pumped Storage
I Winter Summer Location Fuel Type Resource(MW) (MW) IYP
Jocassee I 195 195 Salem, S.C. Pumped Storage PeakingJocassee 2 195 195 Salem, S.C. Pumped Storage PeakingJocassec 3 195 195 Salem, S.C. Pumped Storage PeakingJocassee 4 195 195 Salem, S.C. Pumped Storage PeakingBad Creek I 340 340 Salem, S.C. Pumped Storage PeakingBad Creek 2 340 340 Salem, S.C. Pumped Storage PeakingBad Creek 3 340 340 Salem. SC’. Pumped Storage PeakingBad Creek 4 340 340 Salem, S.C. Pumped Storage PeakingTotal Pump Stor 2,140 2,140
54
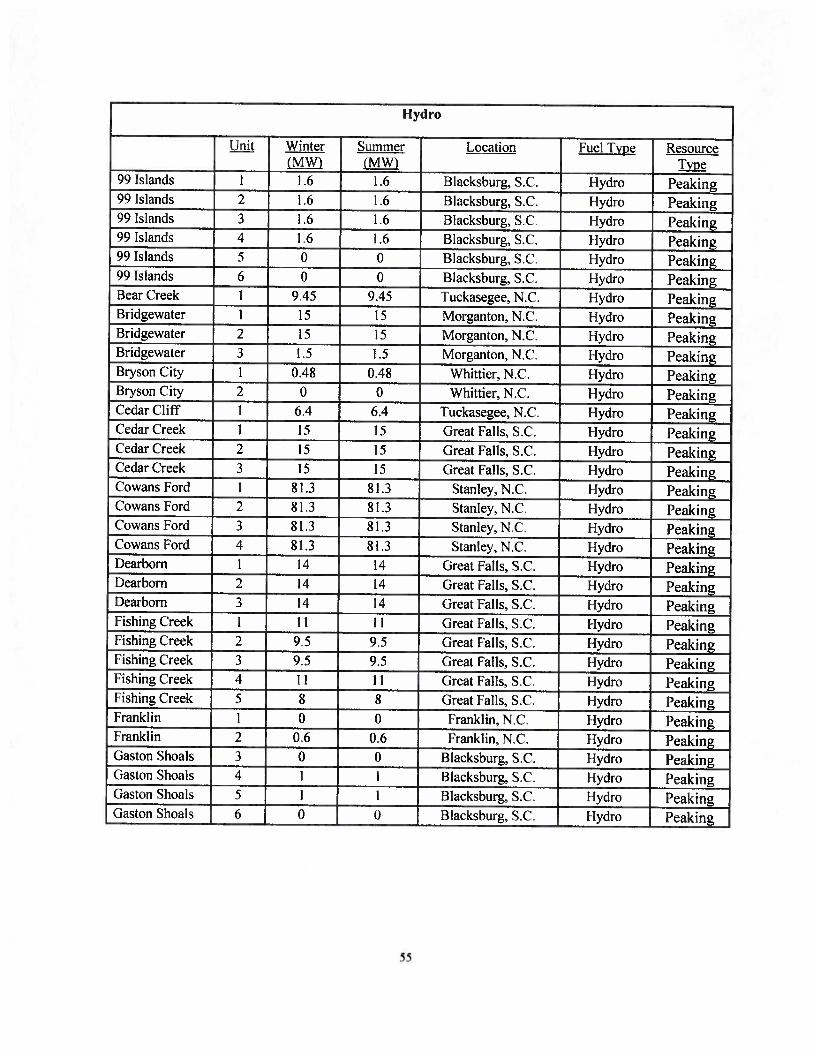
Hydro
Unit Winter Summer Location Fuel Type Resource(MW) (MW) Iyp
99 Islands 1 1 .6 1 .6 Blackshurg, S.C. Hydro Peaking99 Islands 2 1.6 1.6 Blackshurg, S.C. Hydro Peaking99 Islands 3 1 .6 1.6 Blacksburg, S.C. Hydro Peaking99 Islands 4 1 .6 1 .6 Blacksburg, S.C. Ilydro Peaking99 Islands 5 0 0 Blackshurg, S.C. Hydro Peaking99 Islands 6 0 0 Blackshurg, S.C. Hydro PeakingBear Creek 1 9.45 9.45 Tuckasegee, N.C. Hydro PeakingBridgewater I I 5 15 Morganton, N .U. Hydro PeakingBridgewater 2 15 15 Morganton,N.C. Hydro PeakingBridgewater 3 1.5 1 .5 Morganton, NC. Hydro PeakingBiyson City 1 0.48 0.48 Whittier, N.C. Hydro PeakingBryson City 2 0 0 Whittier, N.C. Hydro PeakingCedar Cliff 1 6.4 6.4 Tuckasegee, NC. Hydro PeakingCedar Creek 1 15 15 Great Falls, S.C. Hydro PeakingCedar Creek 2 15 15 Great Falls. S.C. [—lydro PeakingCedar Creek 3 15 15 Great Falls, S.C. Hydro PeakingCowans Ford 1 81.3 81.3 Stanley, N.C. Hydro PeakingCowans Ford 2 81 .3 8 I .3 Stanley, N.C. Hydro PeakingC’owans Ford 3 81.3 81.3 Stanley, NC’. 1-lydro PeakingCowans Ford 4 81.3 81 .3 Stanley, N.C. Hydro PeakingDearborn 1 14 14 Great Falls, S.C. Hydro PeakingDearborn 2 14 14 Great Falls, S.C. Hydro PeakingDearborn 3 14 14 Great Falls, S.C. Hydro PeakingFishing (‘reek 1 1 1 I I Great Falls, S.C. Hydro PeakingFishing Creek 2 9.5 9.5 Great Falls, S.C. Hydro PeakingFishing Creek 3 9.5 9.5 Great Falls, S.C. Hydro PeakingFishing Creek 4 1 1 I I Great Falls, S.C. Hydro PeakingFishing Creek 5 8 8 Great Falls, S.C. Hydro PeakingFranklin 1 0 0 Franklin, N.C. Hydro PeakingFranklin 2 0.6 0.6 Franklin, NC. Ilydro PeakingGaston Shoals 3 0 0 Blacksburg, S.C. Ilydro PeakingGaston Shoals 4 I 1 Blackshurg, S.C. I lydro PeakingGaston Shoals 5 I I Blackshurg. S.C. Ilydro PeakingGaston Shoals 6 1) 0 Blackshurg, S.C. [lydro Peaking

Hydro cont.
Unit Winter Summer Location Fuel Type Resource(MW) (MW) yp
Great Falls 1 3 3 Great Falls, S.C. 1-lydro PeakingGreat Falls 2 3 3 Great Falls, S.C. Hydro PeakingGreat Falls 3 0 0 Great Falls, S.C. l-{ydro PeakingGreat Falls 4 0 0 Great Falls, S.C. Flydro PeakingGreat Falls 5 3 3 Great Falls, S.C. Hydro PeakingGreat Falls 6 3 3 Great Falls, SC’. Hydro PeakingGreat FaIls 7 0 0 Great Falls, S.C. ilydro PeakingGreat Falls 8 0 0 Great Falls, S.C. [Tydro PeakingKeowee 1 76 76 Seneca, S.C. 1-lydro PeakingKeowee 2 76 76 Seneca, S.C. Hydro PeakingLookout Shoals 1 9.3 9.3 Statesville, N.C. Hydro Peaking1.ookout Shoals 2 9.3 9.3 Statesville, N.C. Flydro PeakingLookout Shoals 3 9.3 9.3 Statesville, NC. Ilydro PeakingMission I 0 0 Murphy, N.C. Hydro PeakingMission 2 0 0 Murphy, N.C. Hydro PeakingMission 3 0.6 0.6 Murphy, N.C. Hydro PeakingMountain Island 1 14 14 Mount Holly. NC. [-Jydro PeakingMountain Island 2 14 14 Mount holly, N.C. Flydro PeakingMountain Island 3 17 17 Mount Holly, N.C. Hydro PeakingMountain Island 4 1 7 17 Mount Holly, N.C. Flydro PeakingNantahala 1 50 50 Topton, N.C. Hydro PeakingOxford I 20 20 Conover, N.C. Hydro PeakingOxford 2 20 20 Conover, N.C. Ilydro PeakingQueens Creek I I .44 I .44 Topton, NC’. Hydro PeakingRhodhiss I 9.5 9.5 Rhodhiss, NC’. Hydro PeakingRhodhiss 2 1 1.5 I 1.5 Rhodhiss, N.C. I lydro PeakingRhodhiss 3 9 9 Rhodhiss, NC. Hydro PeakingRocky Creek I 0 0 Great Falls, S.C. Hydro PeakingRocky Creek 2 0 0 Great Falls, SC’. Hydro [‘cakingRocky Creek 3 0 0 Great Falls, S.C. Hydro PeakingRocky Creek 4 0 0 Great Falls, S.C. Hydro Peaking
56
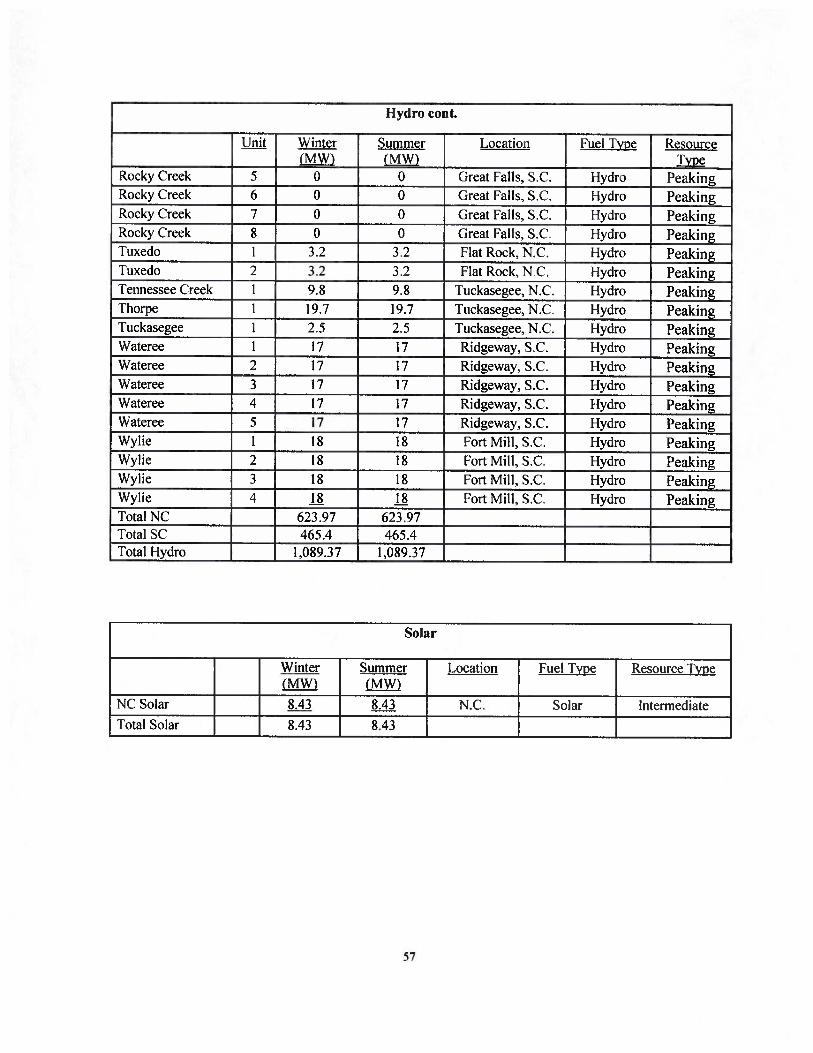
Hydro cont.
Unit Winter Summer Location Fuel Type Resource(MW) (MW) jyp
Rocky (‘reek 5 0 0 Great Falls, S.C. 1-lydro PeakingRocky Creek 6 0 0 Great Falls, S.C. [lydro PeakingRocky Creek 7 0 0 Great Falls, S.C. [Tydro PeakingRocky Creek 8 0 0 Great Falls, S.C. Hydro PeakingTuxedo 1 3.2 3.2 Flat Rock, N.C. Ilydro PeakingTuxedo 2 3.2 3.2 Flat Rock, NC, Hydro PeakingTennessee Creek 1 9.8 9.8 Tuckasegee, N.C. Hydro PeakingThorpe I 19.7 19.7 Tuckasegee, N.C. Hydro PeakingTuckasegee 1 2.5 2.5 Tuckasegee, N.C. Hydro PeakingWateree 1 17 17 Ridgeway, S.C. Hydro PeakingWateree 2 17 17 Ridgeway, S.C. Hydro PeakingWateree 3 17 17 Ridgeway, .C. Hydro PeakingWateree 4 17 17 Ridgeway, S.C. Hydro PeakingWateree 5 17 17 Ridgeway, S.C. Flydro PeakingWylie 1 18 18 FortMill,S.C. Hydro PeakingWylie 2 18 18 Fort Mill, S.C. Hydro PeakingWylie 3 18 18 Fort Mill, S.C. Hydro PeakingWylie 4 18 18 Fort Mill, S.C. Kydro PeakingTotal NC 623.97 623.97Total SC 465.4 465.4Total Kydro 1,089.37 1,089.37
Solai
Winter Summer Location Fuel Type Resource Type(MW) (MW)
NC Solar 8.43 8.43 NC’. Solar Intermediate
Total Solar 8.43 8.43
57

Nuclear
Unit Winter Summer Location Fuel Type Resource(MW) (MW) Iyp
McGuire 1 1 156 1 129 Huntersville, NC’. Nuclear BaseMcGuire 2 1 156 I 129 Huntersville, N.( Nuclear BaseCatawba 1 1163 1 129 York, s.C. Nuclear BaseCatawhu 2 1 163 1 129 York, S.C’. Nuclear BaseC)conee I 865 846 Seneca, S.C. Nuclear BaseC)conee 2 865 846 Seneca, SC’. Nuclear BaseOconee 3 865 846 Seneca, S.C. Nuclear BaseTotal NC 2,312 2,258Total SC 4,921 4,796Total Nuclear 7,233 7,054
Total Generation Capability
Winter Capacity (MW) Summer Capacity (MW)TOTAL DEC SYSTEM - NC. 13,497 13,025
TOTAL DEC SYSTEM - S.C. 8,720 8,449
TOTAL I)EC SYSTEM 22,217 21,473
Note a: Unit infbrmation is pro ided by State. hut resources are dispatched on a sstem—wide basis.
Note b: Suniiner and inter capability does not take into account reductions due to future environmental emissioncontrols.
Note C: Catawba (.inits I and 2 capacit reflects 100% of the stations capabilits. and does not factor in the NorthCarolina Municipal Power Agenc ill’s (NCMPA# I) decision to sell or utilize its 832 MW retained ownership inCatawha.
Note d: ‘I’he Catasha units multiple owners and their effective ownership percentages arc:
(atawba Owner Percent Of Ownership
Duke Energy Carolinas 19.246%
North Camlina Electric Membership 30754%Corporation ( NCEMC)
NCMPA#l 37,5%PMPA 12.5%
58
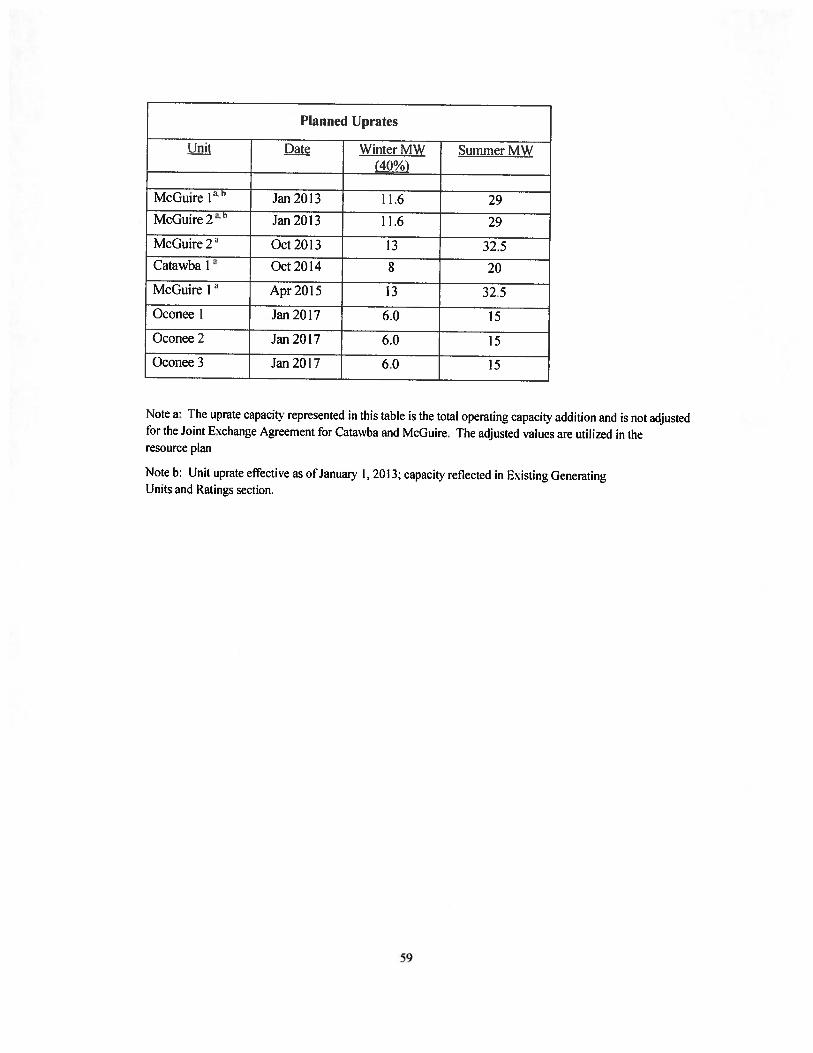
Planned Uprates
Unit Date Winter MW1 Summer MW(40%)
McGuire I Jan 2013 1 1 .6 29
McGuire 2 Jan 2013 11.6 29
McGuire 2 a Oct 2013 13 32.5
Catawba 1 Oct 2014 8 20
McGuire I’ Apr 2015 13 32.5
Oconee I Jan2017 6.0 15
Oconee 2 Jan 2017 6.0 15
Oconee3 Jan2017 6.0 15
Note a: The uprate capacit represented in this table is the total operating capacity addition and is not adjustedfor the Joint Exchange Agreement for Catawba and McGuire. The adjusted values are utilized in theresource plan
Note b: I. mit Liprate effective as ofJanuary I, 201 3 capacity reflected in Existing GeneratingUnits and Ratings section.
59
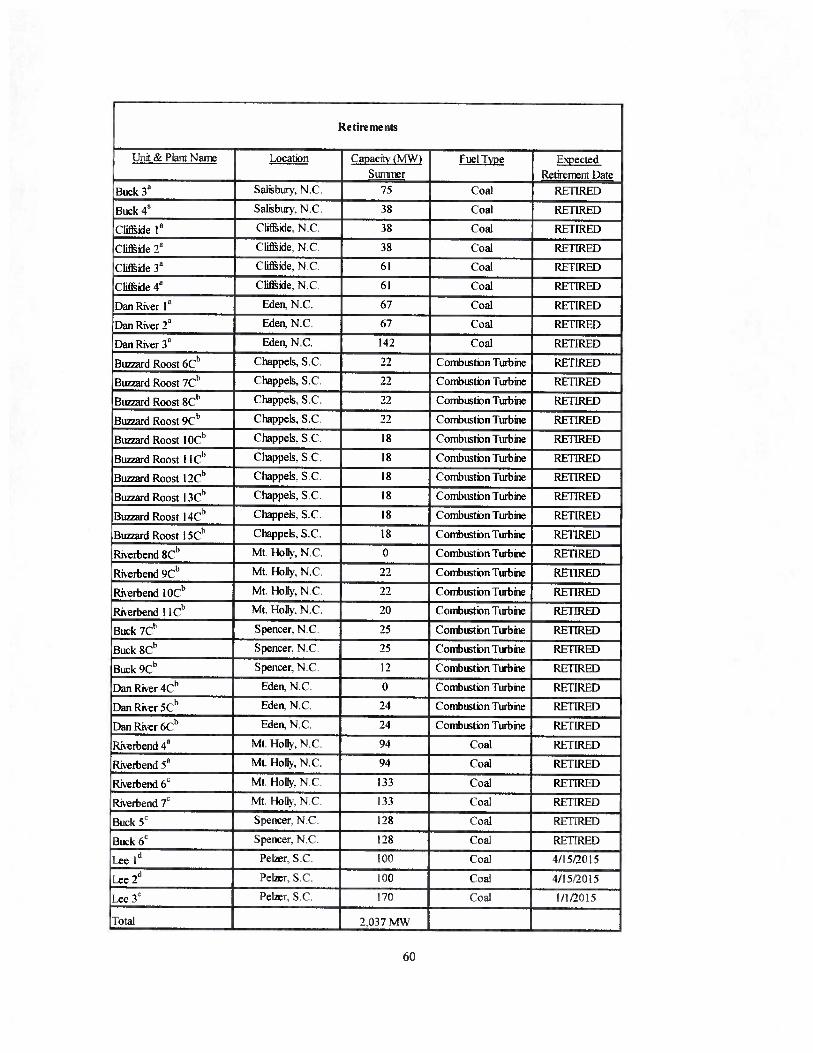
Retirements
Unit & Plant Name Location Capacit’, (MW) Fuel Type ExpectedSummer Retirement Date
Buck 3 Sahshur,’, NC. 75 Coal RETIREE)
Buck 4a Salishui-’,. NC. 38 Coal RETIREI)
Cli1ide la (‘hiliode. NC. 38 Coal RFTIRE[)
Cliflide 2” (‘lifliode. NC. 38 Coal RETIRET)
Clifide 3” (Ii0ide. N C 61 Coal RETIRED
Cliide 4” (‘liPiode. NC. 61 Coal RETIREE)
Dan Riser I” Eden. NC. 67 Coal RETIRED
Dan Riser 2” Eden. NC. 67 Coal RETIRED
Dan Riser 3’ Eden. NC. 142 Coal RETIRED
Buzzard Roost 6C” (‘0pp. S.C. 22 Combustion Turbine RETIRED
Buzzard Roost 7C5 Chappels. S.C. 22 Combustion Turbine RETIRED
Buzzard Roost 8C” Chappels. S.C. 22 Combu.stion Turbine RETIRED
Buzzard Roost 9C’ Chappels. S.C. 22 Combustion Turbine RETIRED
Buzzard Roost bC’ Chappels. S.C. 18 Combustion Turbine RETIRED
Buzzard Roost I IC” Chappels. S.C. 18 (‘ombustion Turbine RETIRED
Buzzard Roost l2C” Chappels. S.C. 18 Combustion Turbine RET[RED
Buzzard Roost 1 IC Chappels, S.C. 18 Combustion Turbine RETIREE)
Buzzard Roost I 4C” (Shappels. S. C. 18 Combustion Turbine RETIRED
Buzzard Roost I SCb Chappels. S.C. IS CombLLstion Turbine RET[RED
Riverbend SC” Mt l1oH. N C. 0 Combustion [iwbine RETIRED
Riverbend 9Ch Mt. [loll’,. NC. 22 Combustion Turbine RETIRED
Riverbend i 0C Mt. Holly. N C 22 Combustion I’urbine RETIREE)
Ri’erbend I IC5 Mt. Holk. NC. 20 Combustion Turbine RETIRED
Buck 7C5 Spencer. NC. 25 Combustion Turbine RETIRED
Buck 8C” Spencer. NC. 25 Combustion Turbine RETIRED
Buck 9C” Spencer, NC. 12 Combustion Turbine RETERE[)
Dan River 4Ct Edei. NC. 0 Combustion Turbine RETIRED
Dan Riser 5C5 Eden. NC. 24 Combustion Turbine RETIRE[)
Dan Riser 6C” Eden. NC. 24 Combustion Turbine RETIRED
Riserbend 4’ Mi. holly, NC. 94 Coal RETIRED
Riserbend ‘ Mt. [loll’,, NC’. 94 Coal RETiRED
Riverhend 6” Mi. Holly. NC. 133 Coal RETIRED
Riserbencl 7” Mt. Holls, N C. 133 Coal RETIRED
F3uck s” Spencer N.C. 128 Coal RETIREE)
Buck 6” Spencer. NC. 128 Coal RETIRE[)
Lee I” Peir. S.C. 100 Coal 4/15/20 5
Lee 2 PeIir. S.C. 100 (‘oal 4/15/2015
Lee 3” Pelzer. S.C. 170 Coal /1/2015
Total 2,037 MW
60

Note a: Retirement assumptions associated with the conditions in the NCUC Order in Docket No. E-7. Sub 790.a CPCN to build Cliffside Unit 6.
\jte h: The old fleet combustion turbines retirement dates were accelerated in 2009 based on derates. aailabilit ofreplacement parts and the general condition o[ the remaining units.
Note c: the decismn was made to retire Buck 5 & 6 and Riverbend 6 & 7 earb on April 1. 2013. The original e’ipectedretirement date was April 15, 2015.
Note d: I,ee Steam I Jnits I through 3 are planned to be retired as indicated in the table.Note e: Ihe coii ersion of the I ee 3 coal unit to a natural gas unit is planned tbr April o12() IS.
61

Operating License Renewal
Planned Operating License Renewal
Original Operating Date of Extended OperatingPlant & Unit Name Location License Expiration Approval License Expiration
Catawba Unit I York, SC 12/6/2024 12/5/2003 12/5/2043
Catawba Unit 2 York, SC 2/24/2026 12/5/2003 1 2/5/2043
McGuire Unit I Iluntersville, NC 6/12/202! 12/5/2003 6/12/2041
McGuire Unit 2 Huntersville, NC 3/3/2023 12/5/2003 3/3/2043
Oconee Unit 1 Seneca, SC 2/6/2013 5/23/2000 2/6/2033
Oconee Unit 2 Seneca, SC 10/6/2013 5/23/2000 10/6/2033
Oconee Unit 3 Seneca, SC 7/19/20 14 5/23/2000 7/19/2034
Bad Creek (PS)(1-4) Salem, SC N/A 8/1/1 977 7//31/2027
Jocassee (PS) (1-4) Salem, SC N/A 9/1/1966 8/31/2016
C’owans Ford (1-4) Stanley, NC 8/31/2008 Pending 8/31/2064 (Est)
Keowee (1&2) Seneca. SC N/A 9/1/1966 8/31/2016
Rhodhiss (1-3) Rhodhiss, NC 8/31/2008 Pending 8/31/2064 (Est)
Bridge Water (1-3) Morganton, NC 8/31/2008 Pending 8/31/2064 (Est)
Oxford (1&2) Conover, NC 8/31/2008 Pending 8/31/2064 (Est)
Lookout Shoals (1-3) Statesville. XC 8/31/2008 Pending 8/31/2064 (Est)
Mountain Island (1-4) Mount Holly, NC 8/3 1/2008 Pending 8/31/2064 (Est)
Wylie(l-4) Fort Mill, SC 8/31/2008 Pending 8/31/2064(Est)
Fishing Creek ( 1-5) Great Falls, SC 8/31/2008 Pending 8/31/2064 (Est)
Great Falls (1 -8) Great Falls, SC 8/3 1/2008 Pending 8/31/2064 (Est)
Dearborn ( I -3) Great Falls, SC 8/3 1/2008 Pending 8/3 1/2064 (Est)
Rocky Creek (1-8) Great Falls, SC 8/31/2008 Pending 8/31/2064 (Est)
Cedar Creek (1-3) Great Falls, SC 8/31/2008 Pending 8/31/2064 (Est)
Wateree (1-5) Ridgeway, SC 8/31/2008 Pending 8/31/2064 (Est)
Gaston Shoals (3-6) Blacksburg, SC 12/31/1993 6/1/1996 5/3 1/2036
Tuxedo ( I &2) Flat Rock, NC N/A N/A N/A
Ninety Nine (1-6) Blackshurg, Sc, 12/3 1/1993 6/1/1996 5/31/2036
Cedar Cliff(1) luckasegee, NC Ii3 1/2006 5/1/201 I 4/30/2041
Bear Creek (1) l’uckasegee, NC 1/31/2006 5/1/2011 4/30/2041
lennessee Creek ( I) luckasegee, NC 1/31/2006 5/1/201 1 4/30/2041
Nantahala (1) Topton, NC 2/28/2006 2/1/20 12 1/31/2042
62
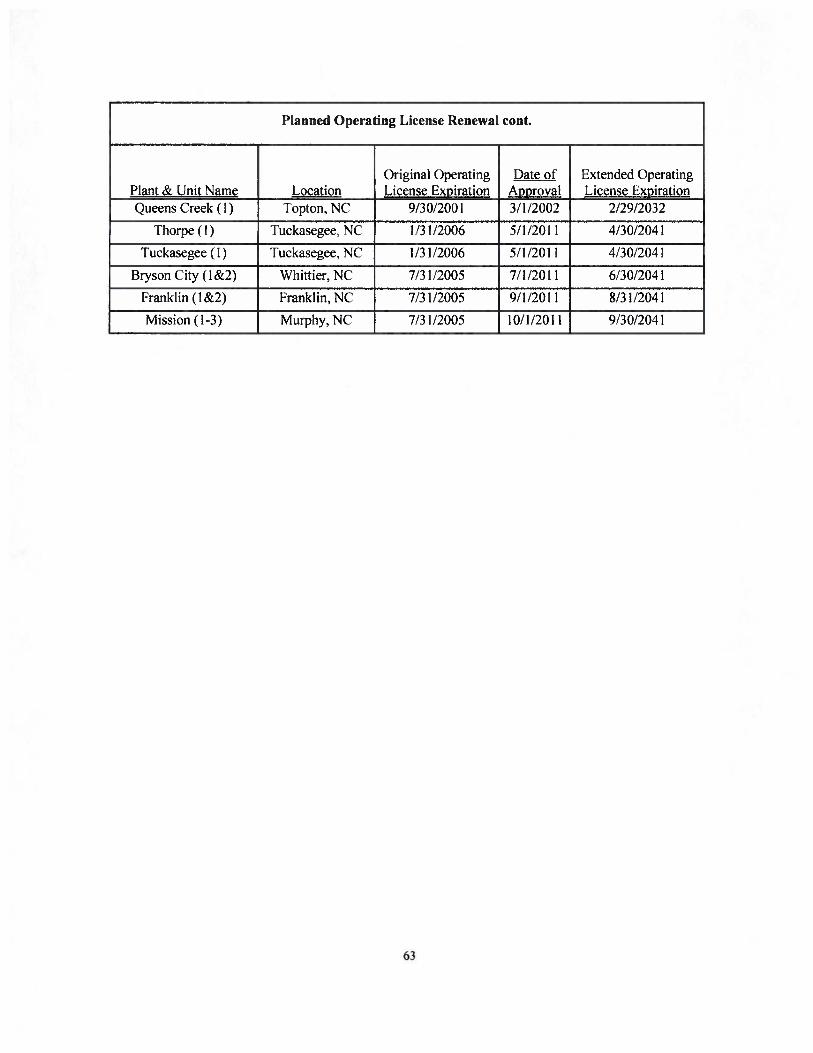
Planned Operating License Renewal cont.
( )riginal Operating Date of Extended (.)peratingPlain & Unit Name Location License Expiration Approval License ExpirationQueens Creek (1) Tupton, NC 9/30/200! 3/1/2002 2/29/2032
Thorpe (I) luckasegee. NC 1/3 1/2006 5/1/20! 1 4/30/2041
Tuckasegee ( I) ‘[uckasegee, NC 1/3 1/2006 5/1/201 I 4/30/204!
Bryson City (l&2) Whittier, NC 7/31/2005 7/1/2011 6/30/2041
Franklin (1&2) Franklin, NC 7/31/2005 9/1/2011 8/31/2041
Mission (1-3) Murphy, NC 7/3 1/2005 10/1/201 I 9/30/204 I
63
API[NDIX C: ELECTRIC LOAD FORECAST
MethodoIoy
The 1)uke Energy Carolinas’ spring 2013 forecast provides projections of the energy and peak
demand needs for its service area. The forecast covers the time period of 2014 through 2028 and
represent the needs of the lollowing customer classes:
• Residential
• Commercial
• Industrial
• Other Retail
• Wholesale
Long-term electricity usage is determined by economic and demographic trends. The spring 2013
forecast was developed using industry-standard linear regression techniques, which relate electricity
usage to such variables as income, electricity prices, industrial production index along with weather
and population. DEC has used regression analysis since 1979 and this technique has yielded
consistently reasonable resu Its over the years.
[he economic projections used in the spring 2013 ibrecast are obtained from Moody’s Analytics, a
nationally recognized economic fbreeasting firm, and include economic forecasts fbr the states ofNorth Carolina and South Carolina.
The retail forecast consists of the three major classes: residential, commercial and industrial.
The residential class sales forecast is comprised of two proiections. ‘l’he first is the number of
residential customers, which is driven by population. [he second is energy usage per customer,
which is driven by weather, regional economic and demographic trends, electric price and appliance
efficiencies. The usage per customer threcast is essentially flat through much of the forecast
horizon, SO most growth is primarily due to customer increases. ‘[he projected growth rate ofresidential sales in the spring 2013 forecast from 20 14-2028 is 1.2%.
Commercial electricity usage changes with the level of regional economic activity, such as personal
income or commercial employment, and the impact of weather. ‘[he three largest sectors in the
Commercial class are offices, education and retail. Commercial is expected to he the fastest
growing class, with a projected sales growth rate of 1 .8%.
The industrial class forecast is impacted by the level of manufacturing output, exchange rates,
electric prices and weather. The long term structural decline that has occurred in the ‘I’extile industry
is expected to moderate in the forecast horizon, with an overall projected sales decline of 1 .2%,
64

compared to an average decline of 7.2% from 1997-201 2 in the Other Industrial sector, severalindustries such as autos, rubber & plastics and primary metals are projected to show strong growth.Overall, other industrial sales are expected to grow 0.9% over the forecast horizon. Including allindustrial classes, the overall sales growth rate of the total industrial class is 0.6% over the forecasthorizon.
County population projections are obtained from the North Carolina Office of State Budget and
Management as well as the South Carolina Budget and Control Board. These are then used toderive the total population forecast for the 51 counties that comprise the DEC service area.
Weather impacts are incorporated into the models by using Fleating Degree Days and CoolingDegree Days with a base temperature of 65 degrees. The forecast of degree days is based on a 1 0-year average, which is updated every year.
Peak demands are forecasted by an econometric model where the key variables are:
• Degree Hours from 1pm - 5pm on Day of Peak• Minimum Morning Degree Hours on Day of Peak• Annual Weather Adjusted Sales
Assumptions
The primary long-term drivers of electricity growth are economic and demographic factors. Thetable below includes the historical and projected average annual growth rates of several key driversfrom DEC’s spring 2013 forecast.
1992-2012 2012-2032
Real Gi)P 2.9% 3.0%
Real Income 3.1% 2.8%
Population 1.6% 1.0%
In addition to economic and demographic trends, the Ibrecast also incorporates the expected impactsof utility sponsored energy efficient programs, as well as projected effects of electric vehicles andsolar technology.
The residential fbrecast also uses the Energy lnfhrmation Administration (EIA) appliance efficiencyand saturation projections by Census regions, in an effbrt to more fully reflect the ongoing naturallyoccurring energy efficiency trends as well as government mandates. The utility-sponsored EEprograms are over and above the naturally occurring trend.
65

Wholesale
Table C—I below contains iniormation concerning E)EC’s wholesale contracts. [he description
tull indicates that the Company provides all of the needs of’ the wholesale customer. Partial’
refers to those customers where DEC only provides some of the customers needs. ‘Fixed’ refers to
a constant load shape.
For resource planning purposes, the contracts below are assumed to he renewed through the end of
the planning horiion unless there is definitive knowledge the contract will not he renewed. The
values in the table are net MW, i.e. they reflect projected loads after the buyer’s own generation has
been subtracted.
66

Tab
leC
-IW
ho
lesa
leC
ontr
acts
Con
cord
l)al
las
I)ue
Vv’e
st
Fore
st(‘
itv
(irc
env’
ood
IIii
hlan
ds
Kin
gsM
ount
ain
Ioc
kha
rt
Pros
peri
ty
Wes
tern
Car
olin
a
Blu
eR
idge
FMC
Cen
tral
Ilay
woo
dL
MC
NC
! MC
NC
EM
C
Pied
mon
iFM
C
PMPA
Rut
herf
brd
IMC
Part
ial
Req
uire
men
ts
Part
ial
Req
uire
men
ts
Part
ial
Req
uire
men
ts
Part
ial
Req
uire
men
ts
Full
Req
uire
men
ts
Full
Req
uire
men
ts
Part
ial
Req
uire
men
ts
Part
ial
Req
uire
men
ts
Part
ial
Req
uire
men
ts
Full
Req
uire
men
ts
Ini
lR
equi
rem
ents
Par
tial
Req
uire
men
ts
Full
Req
uire
men
ts
Fixe
dL
oad
Shap
e
Bac
ksta
nd
Full
Req
uire
men
ts
Bae
ksta
nd
Part
ial
Req
uire
men
ts
2009
-201
8
2009
-202
8
2009
-201
8
2009
-202
8
2010
-201
8
2010
-202
9
2009
-201
8
2009
-201
8
2009
-202
8
2010
-202
1
2010
-203
1
2013
-203
0
2009
-202
1
2009
-203
8
1985
-204
3
2010
-203
1
2014
-202
0
2010
-203
I
169
172
174
1111
12
22
2
1819
19
5354
55
99
9
2121
22
5051
52
22
2
66
6
229
233
237
244
374
509
2323
24
7272
72
116
116
116
8889
90
4747
47
189
204
208
22 6
241
649 24 72 116 92 47 212
Who
lesa
leC
ontr
acts
Com
mit
men
t(M
W)
Cus
tom
erP
rodu
ctT
erm
2013
2014
2015
2016
2017
2018
2019
2020
2021
2022
167 11 2 18 53 9 21 50 2 6
225
120 23 72 95 87 0
185
177
180
212
215
217
220
1212
1212
1313
22
22
22
1920
2020
2121
5657
5858
5960
99
99
1010
2230
3030
3154
7576
7778
23
33
3
66
66
624
524
925
325
726
1
793
900
918
936
953
2425
2525
2672
7272
7272
116
116
116
116
116
9394
9697
9947
4747
4747
217
221
226
230
235
Historical Values
Two major events occurred in the past decade that significantly impacted DEC sales. One was therecession of 2008-2009, which was the most severe since the Great Depression. ilie second is theongoing re—structuring of the textile industry, which began in the late I 990s.The average growth rate in retail sales from 1997-2007, excluding textiles, was 2.2%. From 2007-
20 12, the average growth has been -0.1 %, primarily due to the effects of the recession.In Tables C-2 & C-3 below the history of DEC customers and sales are shown.The values in Table C-3 are not weather adjusted.
Table C-2
Retail Customers (Thousands, Annual Average)2003 2004 2005 2006 2007 2008 2009 2010 2011 2012
Residential1,872 1,901 1,935 1,972 2,016 2,052 2,059 2,072 2,081 2,092
Commercial307 313 319 325 331 334 333 334 336 339
Industrial8 8 7 7 7 7 7 7 7 7
OtherII 12 13 13 13 14 14 14 14 14
R)tal2,198 2,234 2,275 2,317 2,368 2,407 2,413 2,427 2,439 2,452
Table C-3
Electricity Sales (GWh Sold - Years Ended December 31)2003 2004 2005 2006 2007 2008 2009 2010 2011 2012
Residential23,947 25,150 26,108 25,816 27,459 27,335 27,273 30,049 28,323 26,279
Commercial24,355 25,204 25,679 26,030 27,433 27,288 26,977 27,968 27,593 27,476
Industrial24,764 25,209 25,495 24,535 23,948 22,634 19,204 20,618 20,783 20,978
Other270 269 269 271 278 284 287 287 287 290
Total Retail73,336 75,833 77,550 76,653 79,118 77,541 73,741 78,922 76,985 75,022
Wholesale1,448 1,542 1,580 1,694 2,454 3,525 3,788 5,166 4,866 5,176
Total System74,784 77,374 79,130 78,347 81,572 81,066 77,528 84,088 81,851 80,199
68
Results
A tabulation of the utility’s Ibrecasts for a 15—year period, including peak loads for summer andwinter seasons of each year and annual energy forecasts, both with and without the impact of’ utility—sponsored EL programs are shown below in Fables C-4 and C-6.
Load duration curves, with and without utihly—sponsored EL programs, follow fables C-4 and C-6,and are shown as Charts C-5 and C’- 7.
‘Ihe values in these tahies reflect the loads that I)uke Energy Carolinas is contractually obligated toprovide and cover the period from 2014 to 2028.
The lorecast of the needs of the retail and wholesale customer classes from 2014—2028, notincluding the impact of [)[C EL programs, projects a compound annual growth rate of I .9% in thesummer peak demand, while winter peaks are forecasted to grow at 1 .9%. The forecasted
compound annual growth rate for energy is 1 .9% helbre energy efficiency program impacts aresubtracted.
if the impacts of l)EC LE programs are included, the projected compound annual growth rate lbr
the summer peak demand is 1 .5%, while winter peaks are forecasted to grow at a rate of 1 .5%. Theforecasted compound annual growth rate for energy is 1.5% afler the impacts of EL are subtracted.
As a note, all of the loads and energy in the tables and charts below are at the generator.
69
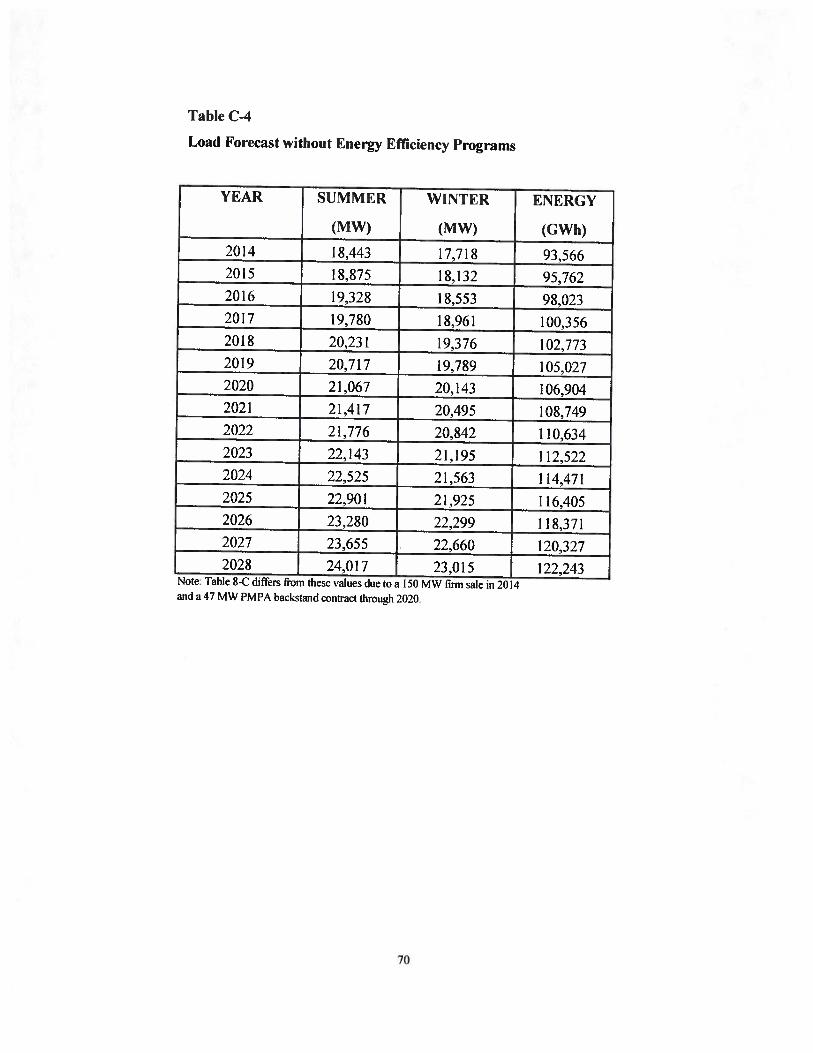
Table C-4
Load Forecast without Energy Efficiency Programs
YEAR SUMMER WINTER ENERGY
(MW) (MW) (GWh)
2014 18,443 17,718 93,5662015 18,875 18,132 95,7622016 19,328 18,553 98,0232017 19,780 18,961 100,3562018 20,231 19,376 102,7732019 20,717 19,789 105,0272020 21,067 20,143 106,9042021 21,417 20,495 108,7492022 21,776 20,842 110,6342023 22,143 21,195 112,5222024 22,525 21,563 114,4712025 22,901 21,925 116,4052026 23,280 22,299 1 18,3712027 23,655 22,660 120,3272028 24,017 23,015 122,243
Note. Table 8-C differs from these alues due to a 150 MW fim sale in 20 4and a 47 MW PMPA hacksiand contract through 2020
70
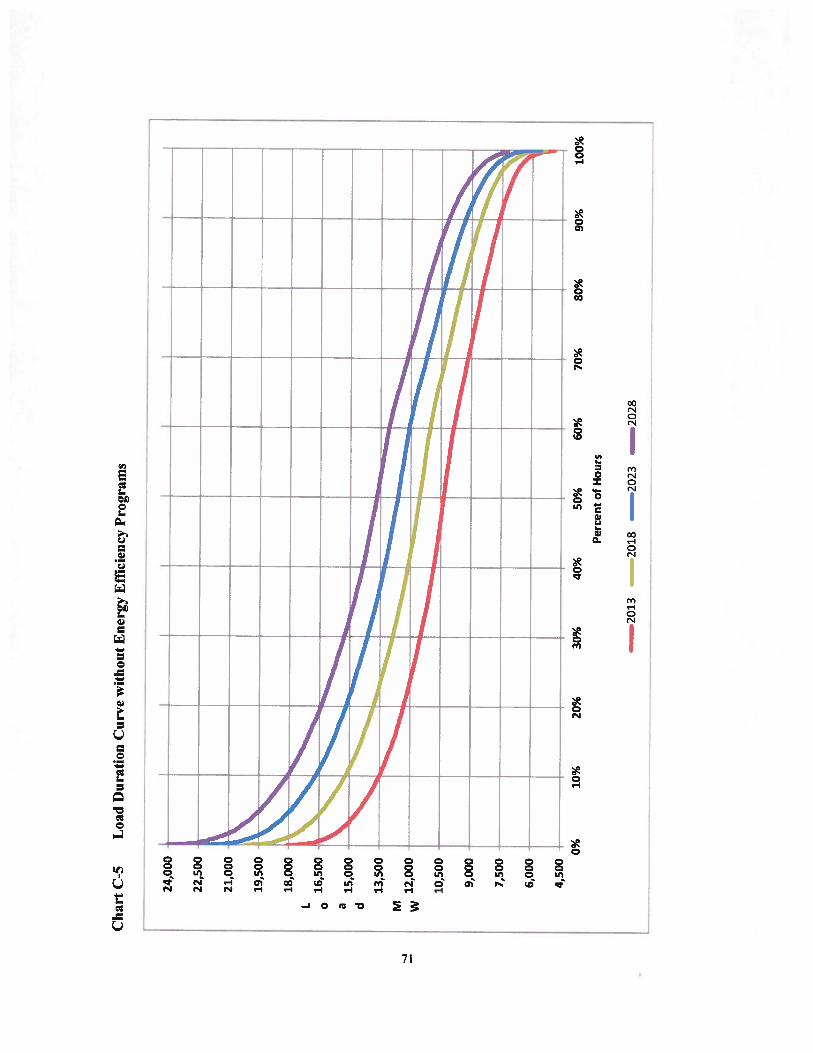
Char
tC
-5L
oad
Dura
tion
Curv
ew
ith
ou
tE
ner
gy
Eff
icie
ncy
Pro
gra
ms
24,0
00
22,5
00
21,0
00
19,500
________
_______
18,0
00
16,5
O0
_____
____
d15
,000
c:,_—
•-
10,5
00
9,000
-_
__
___
7,50
0
__________
“I’h’
6,00
0
4,50
0
0%10
%20
%30
%40
%50
%60
%70
%80
%90
%10
0%
Per
cen
tof
Hou
rs
-2
O1
320
182
02
3—
2028

Table C-6Load Forecast with Energy Efficiency Programs
YEAR SUMMER WINTER ENERGY
(MW) (MW) (GWh)
2014 18,332 17,654 92,9432015 18,691 18,009 94,7212016 19,053 18,359 96,4752017 19298 18,685 98,226
19,741 18,979 100,0322019 20,117 19,304 101,6782020 20,359 19,571 102,9482021 20,598 19,834 104,1872022 20,848 20,093 105,4692023 21,104 20,359 106,7482024 21,378 20,640 108,0892025 21,643 20,913 109,4182026 21,922 21,206 110,8252027 22,209 21,496 112,2942028 22,496 21,790 113,769
Note: Table 8-C differs from these values due to a 150 MW firm sale in 2014and a 47 MW PMPA hackstand contract throuh 2020.
72

Char
tC
-7L
oad
Dura
tion
Curv
ew
ith
Ene
rgy
Eff
icie
ncy
Pro
gra
ms
24,0
00
22,5
00
21,0
00
19
,500
18,0
00
I o1
6,5
00
a ci15,0
00
13,5
00
M w12,0
00
10,5
00
9,0
00
7,5
00
6,0
00
4,5
00
0%10
%20
%30
%40
%50
%60
%70
%80
%
Per
cen
tof
Ho
urs
90%
100%
—2013
20
18
—2023
—2028
APPENDiX D: ENERGY EFFICIENCY AND DEMANI) SIDE MANAGEMENT
Current Energy Efficiency and Demand-Side Management Programs
In May 2007, I)EC filed its application for approval of Energy Efficiency and Demand SideManagement programs under its save-a-walt initiative. The Company received the final order forapproval ftw these programs from the NCUC in July 201 0 and from the Public Service Commission
of South Carolina (PSCSC) in May 2009.
E)FC uses EE and DSM programs to help manage customer demand in an efficient, cost-effectivemanner. These programs can vary’ greatly in their dispatch characteristics, size and duration of loadresponse, certainty of load response, and level and frequency of customer participation. In general,programs are offered in two primary categories: EE programs that reduce energy consumption andDSM programs that reduce peak demand (demand-side management or demand response programsand certain rate structure programs). Following are the EE and DSM programs currently availablethrough DEC.
• Residential Energy Assessments Program
• Low Income Energy Efficiency and Weatherization Assistance Program• Residential Neighborhood Program
• Energy Efficiency Education Program for Schools
• Residential Smart Program
• Appliance Recycling Program
• My Home Energy Report
• Residential Retrofit Pilot Program (‘Closed to New Participants)
• Smart Energy Now (SEN) Pilot (On/v Available in NC• Smart $aver’ for Non-Residential C Listomers
• Power Manager’
• Interruptible Power Service (Closed to New Participants,)
• Standby Generator Control (‘Closed to New Participants)• PowerShare’
A new portfilio tiling with essentially the same set of programs was made in March 2013 in N.C.and Aug. 201 3 in S.C. Pending approval of this new portiilio, a revised set of programs will heincluded in the 2014 IRP.
Energy Efficiency Programs
‘l’hese programs are typically non-dispatchable education or incentive programs. Energy andcapacity savings are achieved by changing customer behavior or through the installation of more
74
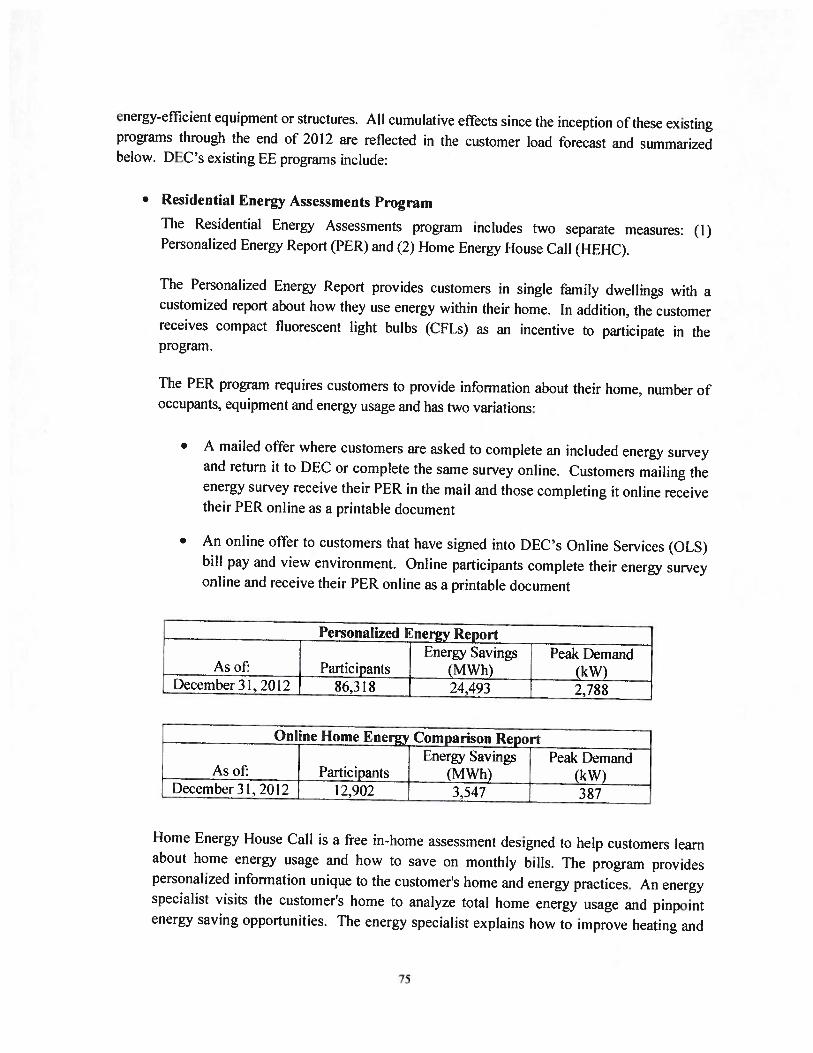
energy—efficient equipment or structures. All cumulative eflècts since the inception of these existingprograms through the end of 2012 are reflected in the customer load forecast and summarizedbelow. i)E(”s existing EL programs include:
• Residential Energy Assessments rrogram
The Residential Energy Assessments program includes two separate measures: (1)Personalized Energy Report (PER) and (2)1 Tome Energy fiouse Call (EIEHC).
The Personalized Energy Report provides customers in single family dwellings with acustomized report about how they use energy within their home. In addition, the customerreceives compact fluorescent light bulbs (CFLs) as an incentive to participate in theprogram.
The PER program requires customers to provide information about their home, number ofoccupants, equipment and energy usage and has two variations:
• A mailed offer where customers are asked to complete an included energy surveyand return it to [)EC or complete the same survey online. Customers mailing theenergy survey receive their PER in the mail and those completing it online receivetheir PER online as a printable document
• An online offer to customers that have signed into I)EC’s Online Services (OLS)bill pay and view environment. Online participants complete their energy surveyonline and receive their PER online as a printable document
Participants86,318
Peak I)em and(kW)2,788
Online Home Energy Comparison ReportEnergy Savings Peak Demand
As of: Participants (MWh) (kW)I)ecemher 31, 2012 12,902 3,547 387
home Energy house Call is a free in—home assessmcnl designed to help customers learnabout home energy usage and how to save on monthly hills. The program providespersonalized information unique to the customer’s home and energy practices. An energyspecialist visits the customer’s home to analyze total home energy usage and pinpointenergy saving opportunities. The energy specialist explains how to improve heating and
AsofDecember 31, 201 2
Personalized Energy ReportEnergy Savings
(MWh)24,493
75

cooling comfort levels, check for air leaks, examine insulation levels, review appliancesand helps the customer preserve the environment for the future and keep electric COStS
low. A customized repoi-t is prepared explaining the steps the customer can take toincrease efficiency. As part of’ the Home Energy HoUSe Call program, customers alsoreceive an Energy Efliciency Starter Kit. At the request of the customer, the energyspecialist will install the efficiency items included in the kit to allow the customer tobegin saving immediately.
Home Energ House CallEnergy Savings Peak Demand
As of: Participants (MWh) (kW)1)ecemher 31, 2012 21,293 20,732 3,846
• Low Income Energy Efficiency and Weatherization Assistance ProgramThe purpose of this program is to assist low income residential customers with energyefficiency measures to reduce energy usage through energy efficiency kits or assistance inthe cost of’ Eb equipment or weatherization measures.
Low Income Energy Efficiency and Weatherization ProgramEnergy Savings Peak Demand
As of Participants (MWh) (kW)December31, 2012 14,047 7,506 793
• Residential Neighborhood Program
The Residential Neighhorhood Program targets low income neighborhoods for directinstallation of high impact EE measures such as CE’Ls, pipe and water heater wraps, lowflow aerators and showerheads, Heating, Ventilation and Air Conditioning (HVAC) filtersand air infiltration sealing, as well as energy efficiency education. As of I)ec. 31, 2012 thisprogram had not yet been implemented.
• Energy Efficiency Education Program for Schools
The purpose of this program is to educate students about sources of’ energy and energyefliciency in homes and schools through a curriculum provided to public and privateschools. This curriculum includes lesson plans, energy efliciency materials, and energyaudits.
76
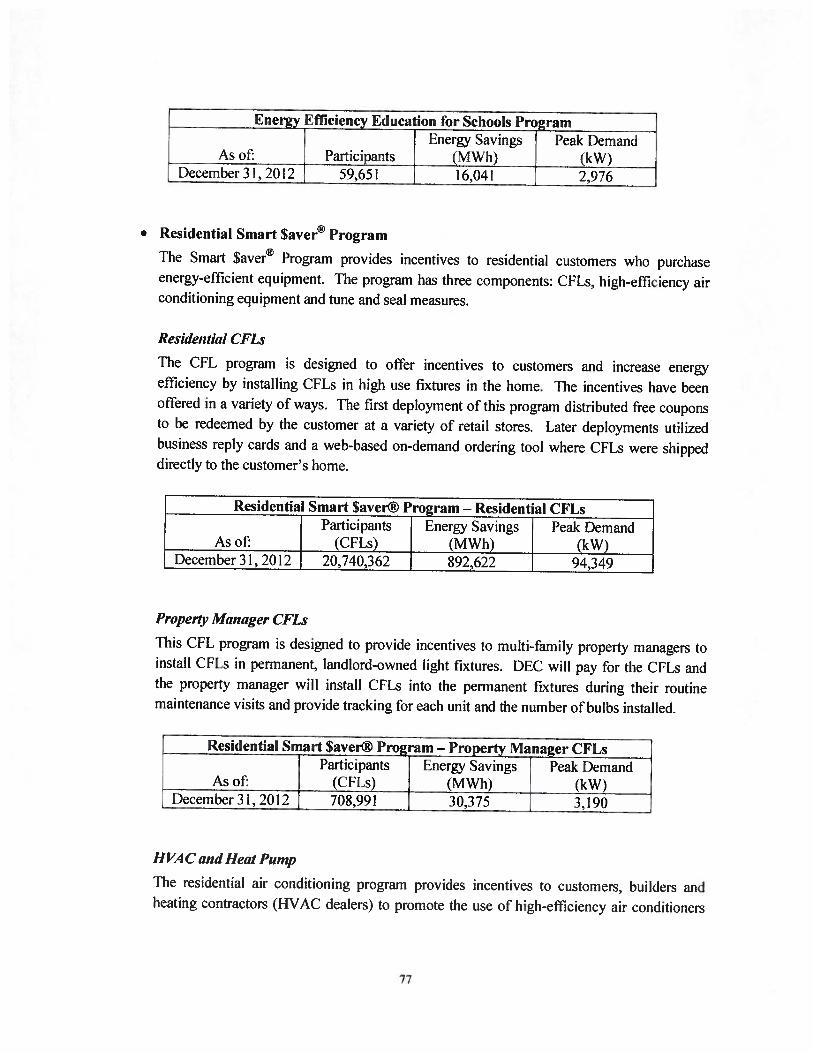
Energy Efficiency Education for Schools ProgramEnergy Savings Peak Demand
As of’: Participants (MWh) (kW)December 31, 2012 59,651 16,041 2,976
• Residential Smart $aver’ Program
The Smart $aver Program provides incentives to residential customers who purchaseenergy-efficient equipment. The program has three components: CFl.s, high-ef’ficiency airconditioning equipment and tune and seal measures.
Residential CFLs
The CFL program is designed to oflèr incentives to customers and increase energyefficiency by installing C’FLs in high use fixtures in the home. The incentives have beenoffered in a variety of ways. The first deployment of this program distributed free couponsto be redeemed by the customer at a variety ol retail stores. Later deployments utilizedbusiness reply cards and a web-based on-demand ordering tool where CFLs were shippeddirectly to the customer’s home.
Residential Smart $aver® Program — Residential CFLsParticipants Energy Savings Peak Demand
As ofi (CFLs) (MWh) (kW)December 31, 2012 20,740,362 892,622 94,349
Propei Manager (FLs
‘[his CFI.. program is designed to provide incentives to multi-family property managers toinstall CF’Ls in permanent. landlord—owned light fixtures. DEC will pay fin’ the CELs andthe property manager will install CFLs into the permanent fixtures during their routinemaintenance visits and provide tracking for each unit and the number of bulbs installed.
Residential Smart Saver® Program — Property Manager CFLsParticipants Energy Savings Peak 1)emand
As of: (CFLs) (MWh) (kW)1)ecernher 31, 2012 708,991 30,375 3,190
HV4C and Heat Pump
The residential air conditioning program provides incentives to customers, builders andheating contractors (HVAC dealers) to promote the use of high—efliciency air conditioners
77
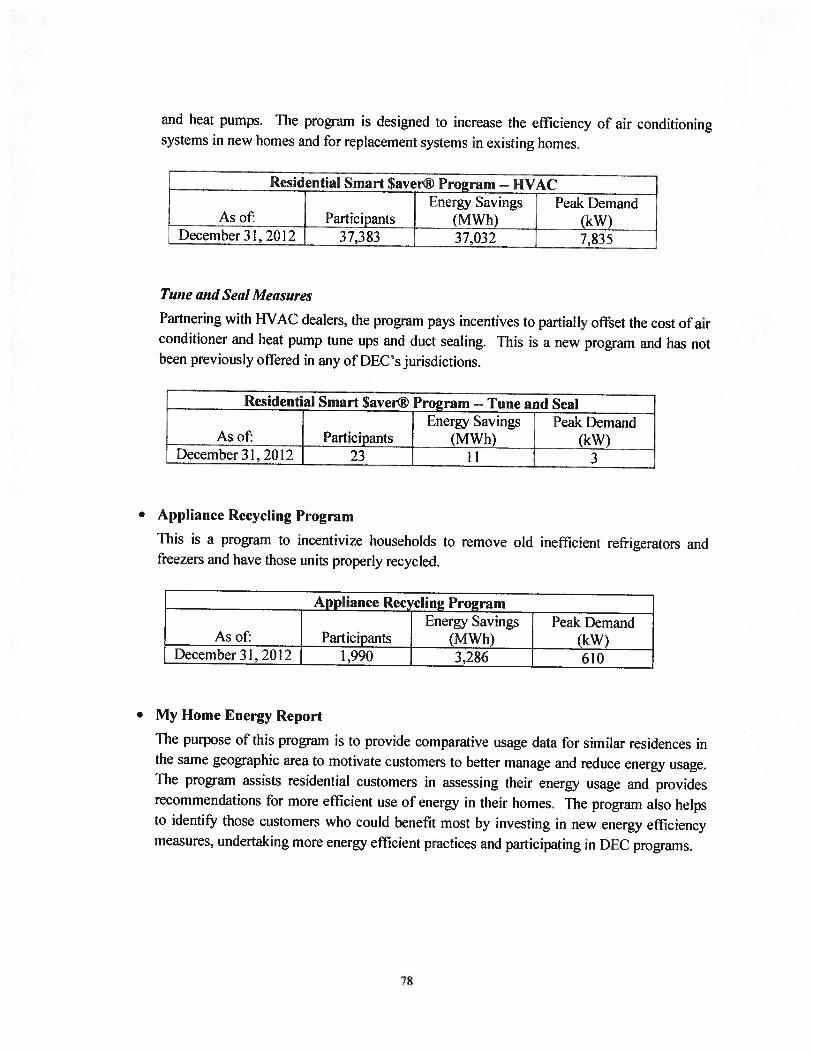
and heat pumps. The program is designed to increase the efficiency of air conditioningsystems in new homes and for replacement systems in existing homes.
Residential Smart $aver® Program -- HVACEnergy Savings Peak Demand
As of: Participants (MWh) (kW)December 31, 2012 37,383 37,032 7,835
Tune and Seal Ilieasures
Partnering with HVAC dealers, the program pays incentives to partially oftset the cost of airconditioner and heat pump tune ups and duct sealing. This is a new program and has notbeen previously ollered in any of DEC’s jurisdictions.
Residential Smart Saver® Program -- Tune anti SealEnergy Savings Peak Demand
As of Participants (MWh) (kW)l)ecember 31, 2012 23 1 1 3
• Appliance Recycling Program
E’his is a program to incentivize households to remove old inefficient refrigerators andfreezers and have those units properly recycled.
Appliance Recycling ProgramEnergy Savings Peak [)emand
As of: Participants (MWh) (kW)December 31, 2012 1,990 3,286 610
• My Home Energy Report
‘Flie purpose of this program is to provide comparative usage data for similar residences inthe same geographic area to motivate customers to better manage and reduce energy usage.‘The program assists residential customers in assessing their energy usage and providesrecommendations tor more efficient use of energy in their homes. ‘[‘he program also helpsto identify those customers who could benefit most by investing in new energy efficiencymeasures, undertaking more energy efficient practices and participating in DEC programs.
78

My Home Energy Report ProgramCapability Summer Capability
As of: Participants (MWh) (kW)[jecember 31, 2012 702,215 160,021 33,857
• Residential Retrofit Pilot Program (Closed to New Participants)
The Residential Retrofit pilot program is designed to assist residential customers inassessing their energy usage. The program is also designed to provide recommendations formore efficient use of energy in their homes and to encourage the installation ol energyefficient improvements by offsetting a portion of the cost of implementing therecommendations from the assessment.
Residential Retrofit Pilot ProgramEnergy Savings Peak Demand
As of: Participants (MWh) (kW)I)ecem her 3 1, 201 2 94 4 I 0 68
• Smart Energy Now (SEN) Pilot (Only Available in N.C.)
The SEN pilot program is designed to reduce energy consumption within the commercialoffice space located in Charlotte City Center through community engagement leading tobehavioral modification. In order to enable building managers and occupants to effectivelymake these behavioral modifications, they will be provided with additional energyconsumption infbrmation and actionable efficiency recommendations.
Smart Energy Now Pilot ProgramEnergy Savings Peak Demand
As of: Participants (MWh) (kW);. December 31,2012 70 14,108 2,649
• Smart Saver® for Non-Residential Customers
The purpose of this program is to encourage the installation of high—efficiency’ equipment innew and existing non—residential establishments. The program provides incentive paymentsto ofiset a portion of the higher cost of energy—efficient equipment. 1’he following types of’equipment are eligible for incentives as part of the Prescriptive program: high—efficiencylighting, high—efficiency air conditioning equipment, high—efficiency motors, high—efficiencypumps, variable frequency drives, food services and pmcess equipment. Customerincentives may be paid for other high-efficiency equipment as detennined by the Companyto he evaluated on a case-by-case basis through the Custom program.
79
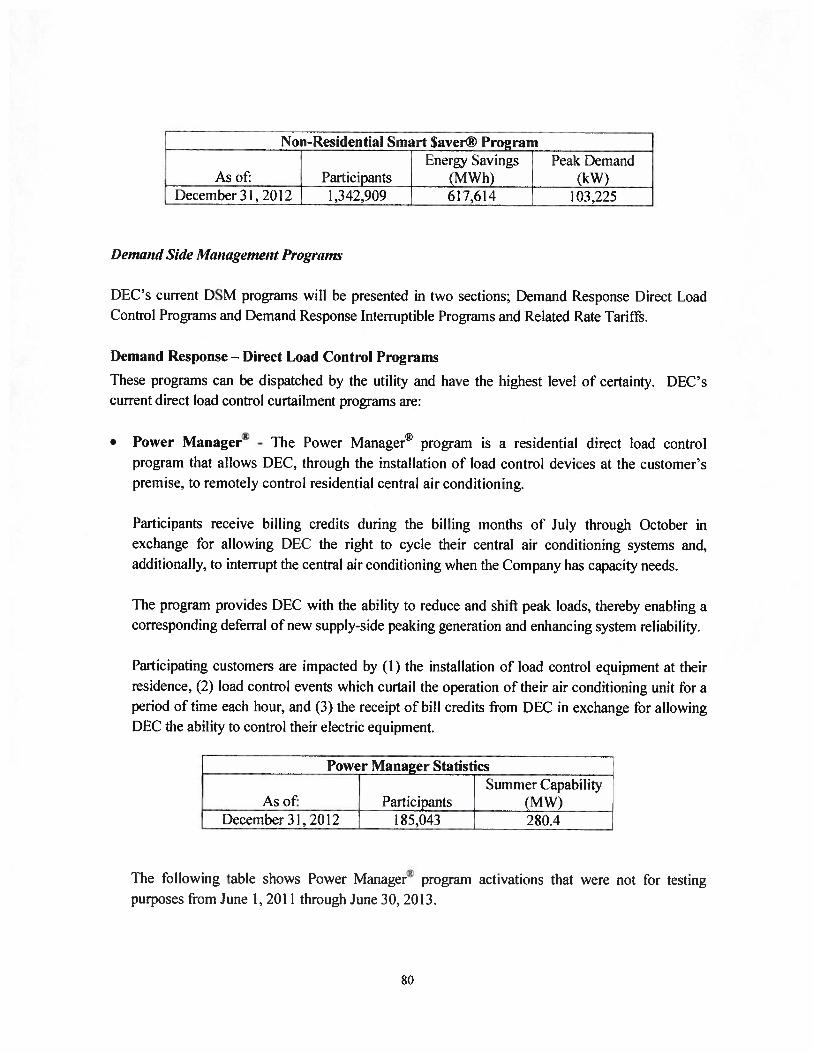
Non-Residential Smart Saver® rrogramEnergy Savings Peak Demand
As of: Participants (MWh) (kW)
[ December 31, 2012 1,342,909 617,614 103,225
Deniand Side Maiuigemenl Programs
DEC’s current I)SM programs will he presented in two sections: I)ernand Response [)irect LoadControl Programs and 1)emand Response Interruptible Programs and Related Rate Tarift.
Demand Response Direct Load Control Programs
These programs can he dispatched by the utility and have the highest level of certainty. I)EC’s
current direct load control curtailment programs arc:
• Power Managers’ - The Power Manager program is a residential direct load controlprogram that allows [)EC, through the installation of load control devices at the customer’spremise, to remotely control residential central air conditioning.
Participants receive hilling credits during the hilling months of July through October inexchange for allowing DEC the right to cycle their central air conditioning systems and,additionally, to interrupt the central air conditioning when the Company has capacity needs.
The program provides DEC with the ability to reduce and shift peak loads, thereby enabling acorresponding deferral of new supply-side peaking generation and enhancing system reliability.
Participating customers ai-e impacted by (I ) the installation of load control equipment at theirresidence, (2) load control events which curtail the operation ol their air conditioning unit fbr aperiod of time each hour, and (3) the receipt of bill credits from [)EC in exchange for allowingDEC the ability to control their electric equipment.
Power Manager StatisticsSummer Capability
As of: Participants (MW)December 3 I, 201 2 1 85,043 280.4
The following table shows Power Manager program activations that were not fbr testingpurposes from J tine 1, 2011 through June 30, 201 3.
80

Power Nllanagerk ActivationsI Duration MW Load
Start Time nd Time (N’linutes) Red uction*June 21,2011 — 2:30 PM June 21,2011 — 5:00 PM 150 101July11, 2011 —2:30 PM July 11,2011—6:00 PM 210 101July 13. 201 1 — 2:30 PM July 13, 201 1 — 6:00 PM 210 102July 20, 2011 — 2:30 PM July 20, 2011 — 5:00 PM 150 108July 21, 2011 —2:30 PM July 21,2011 —5:0() PM 150 115July 29, 201 1 — 2:30 PM July 29, 201 1 — 5:00 PM 150 1 10
August 2, 201 I — 3:30 PM August 2, 201 1 — 6:00 PM 150 1 15June 29, 2012— 2:30 PM June 29, 2012— 5:00 PM 150 152July9,2012—1:3OPM July9,2012—5:OOPM 210 113
July 17,2012—2:3OPM July 17,2012—5:00 PM 150 141Ju1y26,2012—2:3OPM Ju1y26,2012—6:OOPM 210 143July 27, 2012— 1:30PM July27, 2012—4:00 PM 150 152
* iir Loud Reduction i the clecruge loud reduction ‘a! (he generu!or
clock hours.over the event period for fit!!
Demand Response — Interruptible Programs and Related Rate Structures‘liese programs rely either on the customer’s ability to respond to a utility—initiated signalrecuesting curtailment or on rates with price signals that provide an economic incentive to reduce orshill load. ‘Timing. frequency and nature ot the load response depend on customers’ actions aflernotification of an event or after receiving pricing signals. [)uke Energy Carolinas’ currentinterruptible and time—ofuse rate structure curtailment programs include:
• Interruptible Power Service (IS) (North Carolina Only) - Participants agree contractually toreduce their electrical loads to specified levels upon request by DEC. If customers fail to doso during an interruption, they receive a penalty for the increment of demand exceeding thespecified level.
‘[he Ibllowing table shows IS program activations that were not fbr testing PUPOSC5 from June1,2011 through June 30. 2013.
81
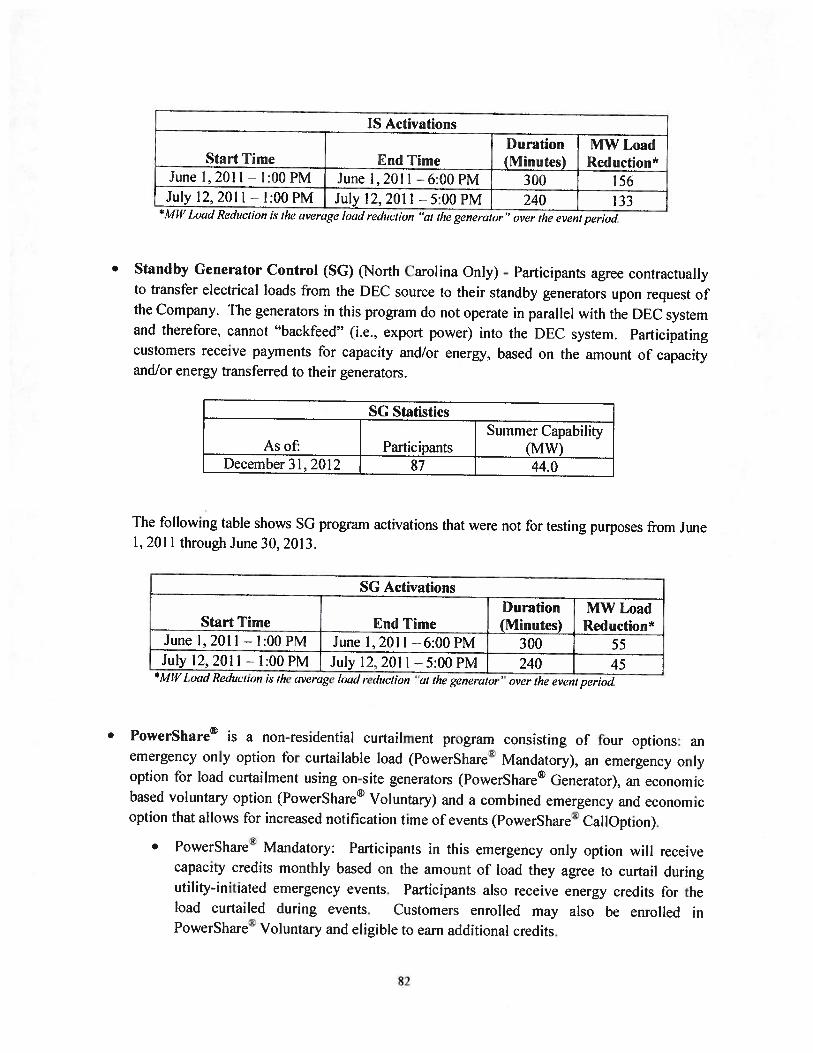
IS ActivationsDuration MW Load
Start Time End Time (Minutes) Red uction*June I, 2011 —1:00 PM June 1,2011 —6:00 PM 300 156July 12, 2011 1:00 PM July 12, 2011 — 5:00 PM 240 133
*?fJJ. Load Rehieiion i.c ihe average load reduction at the generator’’ over the event period
Standby Cenerator Control (SC) (North Carolina Only) - Participants agree contractuallyto transfer electrical loads from the 1)EC source to their standby generators upon request ofthe Company. The generators in this program do not operate in parallel with the DEC systemand therefore, cannot ‘hackfeed” (i.e., export power) into the DEC system. Participatingcustomers receive payments for capacity and/or energy, based on the amount of capacityand/or energy transferred to their generators.
SC StatisticsSummer Capability
As oF Participants (MW)December 31, 2012 87 44.0
The following table shows SG program activations that were not for testing purposes 1mm June1,2011 through June 30, 2013.
SC ActivationsDuration MW Load
Start Time End Time (Minutes) Red uction*June 1,2011 — 1:00 PM June 1,2011 —6:00PM 300 55July 12, 201 1 1:00 PM July 12.201 1 — 5:00 PM 240 45
*1111 Load Reduction iv the overage loud reduction ‘at 11i’ generalor’’ over the even! period.
• PowerShare is a non-residential curtailment program consisting of Four options: anemergency only option For curtai lable load (PowerShare Mandatory), an emergency onlyoption for load curtailment using oil—site generators (PowerShare Generator), an economicbased voluntary option (PowerShare Voluntary) and a combined emergency and economicoption that allows for increased notification time of events (PowerShare CallOption).
• PowerShare Mandatory: Participants in this emergency only option will receivecapacity credits monthly based on the amount of load they agree to curtail duringutility-initiated emergency events. Participants also receive energy credits for theload curtailed during events. (ustorners enrolled may also he enrolled inPowerShare Voluntary and eligible to earn additional credits.
82
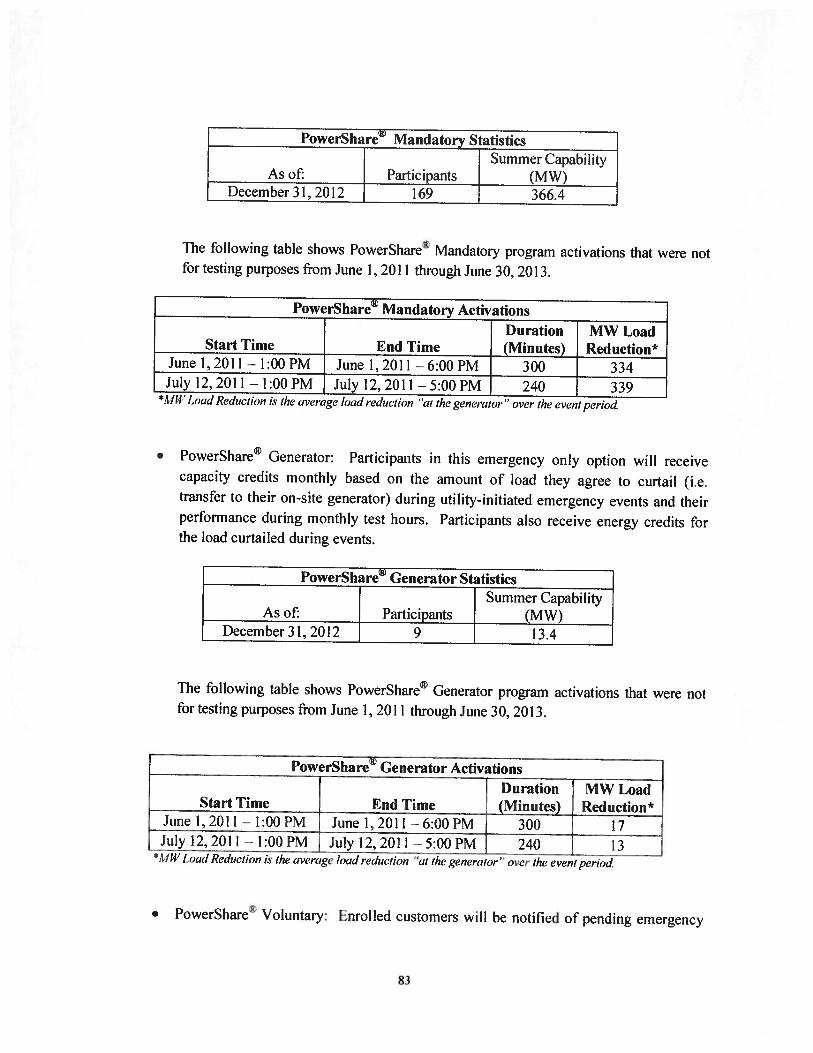
PowerShare Mandatory StatisticsSummer Capability
As of: Participants (MW)December3l,2012 169 366.4
The tollowing table shows PowerShare Mandatory program activations that were 1101tbr testing purposes from .June 1, 2011 through June 30, 2013.
PowerShare Mandatory ActivationsI)uration MW Load
Start Time End Time (Minutes) Red uction*June 1,2011 — 1:00 PM June 1,2011 — 6:00 PM 300 334July 12, 2011— 1:00PM .luly 12,2011 —5:00 PM 240 339
*11W Load 1?ednc/ion is the average load reduction ai the generator’ over the event period
• PowerShare1 Generator: Participants in this emergency only option will receivecapacity credits monthly based on the amount of load they agree to curtail (i.e.transfer to their on—site generator) during utility—initiated emergency events and theirertbrrnance during monthly test hours. Participants also receive energy credits fbrthe load curtailed during events.
PowerShare Generator StatisticsSummer Capability
As of: Participants (MW)December 31, 2012 9 13.4
‘[he following table shows PowerShare Generator program activations that were nottor testing purposes from June 1, 2011 through June 30, 2013.
lowerShare5Generator ActivationsJDuration MW Load
Start Time End Time (Minutes) Reduction*June 1, 201 1 — 1:00 PM June I, 201 1 — 6:00 PM { 300 17July 12,2011 — 1:00 PM July 12,2011—5:00 PM 240 13
*111;’ load l?eth,eiion is the average /00(1 ,‘e1uetion at the generator’’ over the even! ji’ioc1
• PowerShare Voluntary: Enrolled customers will he notilied of pending emergency
83
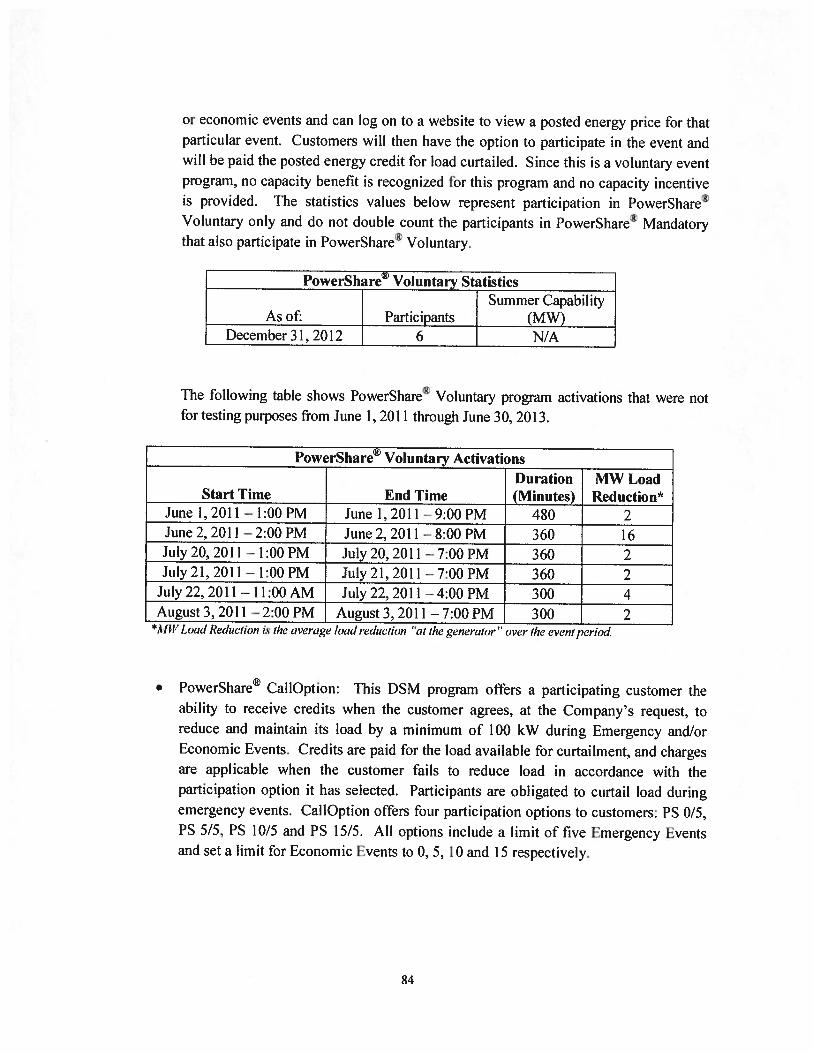
or economic events and can log on to a website to view a posted energy price tbr thatparticular event. Customers will then have the option to participate in the event andwill be paid the posted energy credit for load curtailed. Since this is a voluntary eventprogram, no capacity benefit is recognized for this program and no capacity incentive
is provided. The statistics values below represent participation in PowerShareR
Voluntary only and do not double count the participants in PowerShare3Mandatorythat also participate in PoerShare’ Voluntary.
PowerShare Voluntary StatisticsSummer Capability
As of: Participants (MW)December 3 1. 2012 6 N/A
The following table shows PowerSharek Voluntary program activations that were notfbr testing purposes from June 1, 2011 through June 30, 2013.
PowerShare Voluntary ActivationsDuration MW Load
Start Time End Time (Minutes) Reduction*June 1,2011 — 1:00 PM June 1,2011 —9:00 PM 480 2June2, 2011 —2:00PM June 2, 2011 —8:00PM 360 16July 20, 201 1 — 1:00 PM July 20, 201 1 — 7:00 PM 360 2July 21,2011 — 1:00 PM July 21,2011—7:00 PM 360 2
July 22, 201 1 — I 1 :00 AM July 22, 201 1 — 4:00 PM 300 4August 3, 201 1 — 2:00 PM August 3. 2011 — 7:00 PM 300 2
itIfl’ Load l?eduction is the average loud reduction al the generator” over the event jc’riod
PowerSharek CallOption: This DSM program offers a participating customer theability to receive credits when the customer agrees, at the Company’s request, toreduce and maintain its load by a minimum of 100 kW during Emergency and/orEconomic Events. Credits are paid for the load available for curtailment, and chargesare applicable when the customer fails to reduce load in accordance with theparticipation option it has selected. Participants are obligated to curtail load duringemergency events. CallOption offers four participation options to customers: PS 0/5,PS 5/5, PS 10/5 and PS 1 5/5. All options include a limit of live Emergency Eventsand set a limit for Economic Events to 0, 5, 10 and 15 respectively.
84
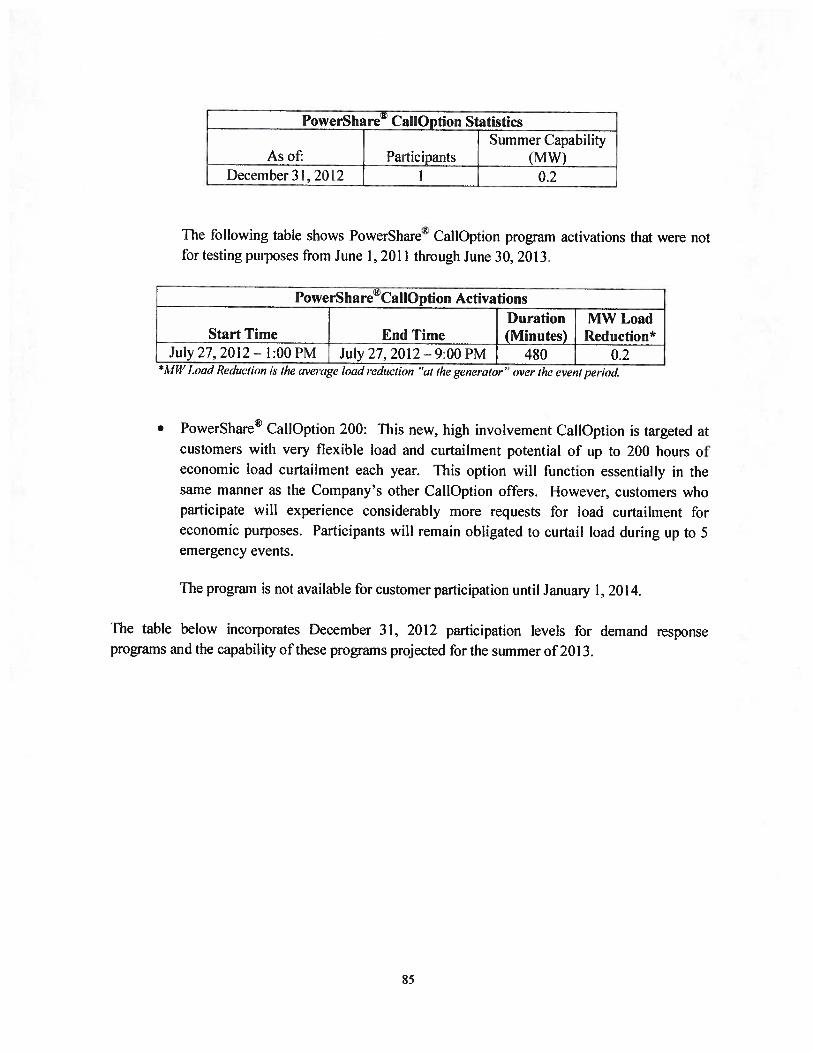
PowerShare CallOption StatisticsSummer Capability
As of: Participants (MW)December 3 1, 201 2 1 0.2
Fhe following table shows PowerShare’ CallOption program activations that were not
br testing purposes from June 1, 2011 through June 30, 201 3.
PowerSha re®CallOption ActivationsDuration MW Load
• Start Time End Time (Minutes) ReductiozJJuly 27,2012 — 1:00 PM .luly 27, 2012— 9:00 PM 480 0.2Ill Load Reduciion is the average load reduction “at the generator• over ihe eve,?, period.
. PowerSharek CallOption 200: This new, high involvement CallOption is targeted atcustomers with very flexible load and curtailment potential of up to 200 hours ofeconomic load curtailment each year. This option will flmnction essentially in thesame manner as the Company’s other CallOption otters. however, customers Whoparticipate will experience considerably more requests for load curtailment lhreconomic purposes. Participants will remain obligated to curtail load during up to 5emergency events.
The program is not available Ihr customer participation until January 1, 2014.
The table below incorporates l)ecember 31, 2012 participation levels for demand responseprograms and the capability of these programs projected for the summer of 2013.
85
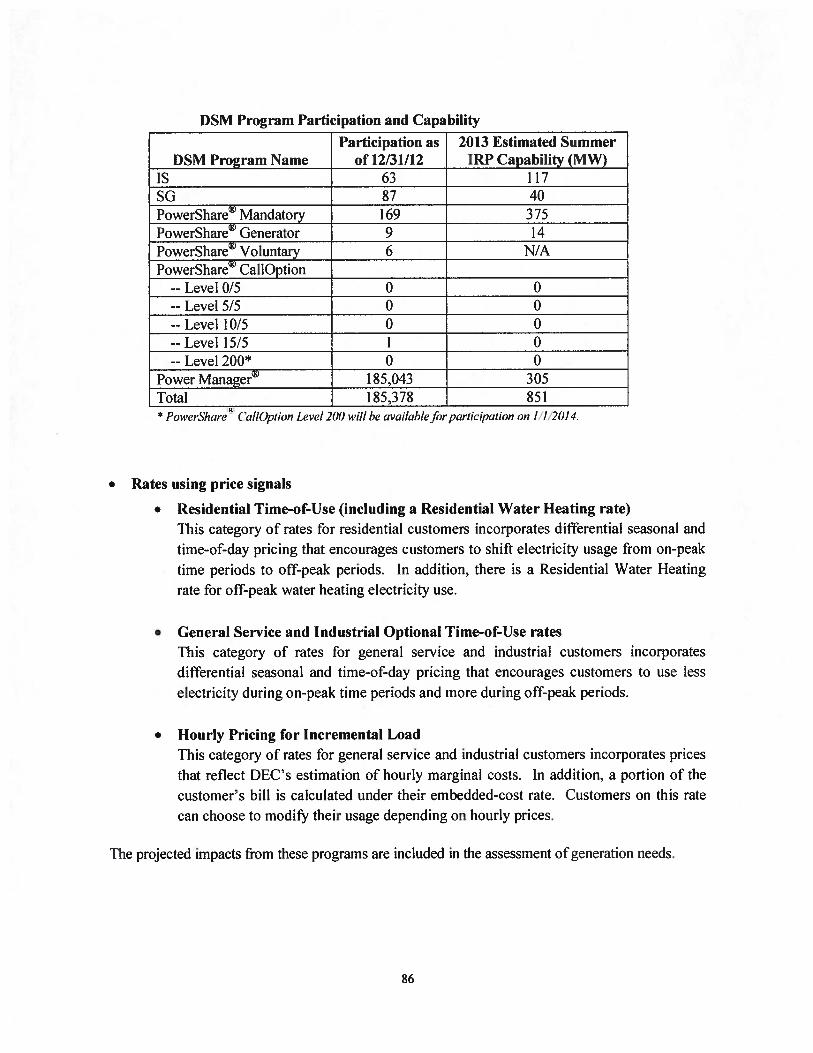
DSM Program Participation and Capability
1 Participation as 2013 Estimated SummerDSM Program Name of 12/31/12 IRP Capability (MW)
15 63 117SG 87 40PowerShare Mandatory 169 375PowerShare Generator 9 14PowerShare’ Voluntary 6 N/APowerShare CallOption
-- Level 0/5 0 0-- Level 5/5 0 0-- Level 10/5 0 0-- Level 15/5 1 0-- Level 200* 0 0
Power Manager 185,043 305Total 185,378 851* PowerShare
R
(illOption level 200 will he available for partici[xthon on I I 2014.
Rates using price signals
• Residential Time-of-Use (including a Residential Water Heating rate)
This category of rates for residential customers incorporates differential seasonal and
time-of-day pricing that encourages customers to shift electricity usage from on-peak
time periods to off-peak periods. In addition, there is a Residential Water Heating
rate for offpeak water heating electricity use.
• General Service and Industrial Optional Time-of-Use rates
This category of rates for general service and industrial customers incorporates
differential seasonal and time-of-day pricing that encourages customers to use less
electricity during on-peak time periods and more during off-peak periods.
• Hourly Pricing for Incremental Load
This category of rates for general service and industrial customers incorporates prices
that reflect DEC’s estimation of hourly marginal costs. In addition, a portion of the
cuStomer’s bill is calculated under their embedded-cost rate. Customers on this rate
can choose to modit’ their usage depending on hourly prices.
The projected impacts from these programs are included in the assessment of generation needs.
86

Summary of Prospective Program Opportunities
A new portlblio filing with essentially the same set of programs was made in March 2013 in NC
and August 2013 in SC. Pending approval of this new portfolio a revised set of programs will he
included in the 2014 IRP. Included in this new portfolio filing are enhancements to existing
programs along with the following program that has not been previously offered:
Energy Management and Information Services Pilot
This pilot is designed to provide qualified commercial and industrial customers with a
systematic approach to reduce energy and peak demand. The company will provide the
customer with an energy management and information system and an on-site energy
assessment to help the customer identi1’ and implement a bundle of low cost operational
and maintenance-based energy efficiency measures.
Future EF and DSM programs
in addition, DEC is continually seeking to enhance its ER and DSM portfolio by: (I ) adding new or
expanding existing programs to include additional measures, (2) program modifications to account
for changing market conditions and new measurement and verification (M&V) results, and (3) other
EE pilots. Estimates of the impacts of these yet-to-he-developed programs have been included in
this year’s analysis of generation needs.
EE and DSM Program Screening
The Company uses the DSMore model to evaluate the costs, benefits, and risks of EE and [)SM
programs and measures. DSMore is a financial analysis tool designed to estimate of the capacity
and energy values of EE and DSM measures at an hourly level across distributions of weather
conditions and/or energy costs or prices. By examining projected program performance and cost
effectiveness over a wide variety of weather and cost conditions, the Company is in a better position
to measure the risks and benefits of employing ER and [)SM measures versus traditional generation
capacity additions, and further, to ensure that l)SM resources are compared to supply side resources
on a level playing field.
Ihe analysis of energy efficiency and demand side management cost-effectiveness has traditionally
focused primarily on the calculation of specific metrics, often referred to as the California Standard
tests: Utility Cost Test (UCT), Rate Impact Measure (RIM) Test, Total Resource Cost (TRC) l’est
and Participant Test. DSMore provides the results of those tests for any type of EE or DSM
program.
• The (JCT compares utility benefits (avoided costs) to the costs incurred by the utility to
implement the program, and does not consider other benefits such as participant savings or
societal impacts. This test compares the cost (to the utility) to implement the measures with
87

the savings or avoided costs (to the utility) resulting from the change in magnitude and/orthe pattern of electricity consumption caused by implementation of the program. Avoidedcosts are considered in the evaluation of cost-effectiveness based Ofl the projected cost ofpower, including the projected cost of the utility’s environmental compliance h)r knownregulatory requirements. The cost—effectiveness analyses also incorporate avoidedtransmission and distribution costs, and load (line) losses.
• The RIM ‘I’est, or non—participants test, indicates if rates increase or decrease over the long—run as a result of implementing the program.
• The ‘iRC ‘Fest compares the total benefits to the utility and to participants relative to thecosts to the utility to implement the program along with the costs to the participant. Thebenefits to the utility are the same as those computed under the [JCT. ‘1ie benefits to theparticipant are the same as those computed under the Participant ‘lest, however, customerincentives are considered to be a pass-through benefit to customers. As such, customerincentives or rebates are not included in the TRC.
• The Participant ‘Fest evaluates programs from the perspective of the program’s participants.‘[he benefits include reductions in utility hills, incentives paid by the utility and any state.federal or local tax benefits received.
‘l’he use of multiple tests can ensure the development ofa reasonable set of cost-effective l)SM andEE programs and indicate the likelihood that customers will participate.
Energy Efficiency and Demand-Side Management Program Forecasts
In 2011 , DEC commissioned a new EE market potential study to obtain new estimates of’ thetechnical, economic and achievable potential for EE savings within the l)EC service area. ‘[he finalreport was prepared by Forefront Economics Inc. and H. Gil Peach and Associates, EEC and wascompleted on February 23, 2012 and included an achievable potential for planning year 5 and aneconomic potential for planning year 20.
In early 2013, this market potential study was updated by Forefront Economics Inc. to estimate theachievable potential on an annual basis throughout the 20 year horizon in order to align the forecastmethodology with the integrated resources planning being done for l)EP.
The results of’ this achievable potential were blended together with the l)EC iirecast Ihr the 5-yearplanning horizon to create an overall forecast that used a similar methodology to the 2012 DEC IRPfbr the first 5 years. For years 6 through 20, DEC used methodology that was more like that usedby DEP in its 2012 IRP.
88
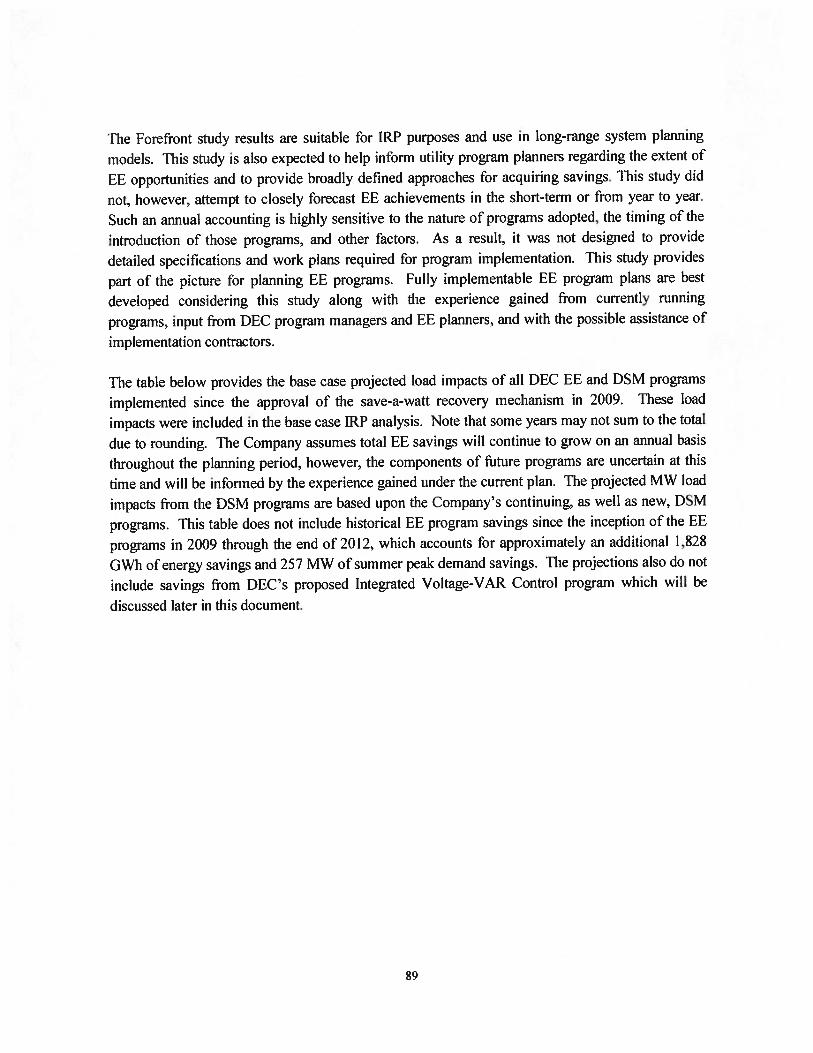
The Forefront study results are suitable fbr IRP puiposes and use in long-range system planning
models. This study is also expected to help inform utility program planners regarding the extent of
FE opportunities and to provide broadly delined approaches for acquiring savings. This study did
not, however, attempt to closely forecast FE achievements in the short-term or from year to year.
Such an annual accounting is highly sensitive to the nature of programs adopted, the timing of the
introduction of those programs, and other fhctors. As a result, it was not designed to provide
detailed specifications and work plans required for program implementation. This study provides
part of the picture for planning FE programs. Fully implementable EE program plans are best
developed considering this study along with the experience gained from currently running
programs, input from DEC program managers and EE planners, and with the possible assistance of
implementation contractors.
1ie table below provides the base case projected load impacts of all DEC FE and DSM programs
implemented since the approval of the save-a-watt recovery mechanism in 2009. These load
impacts were included in the base case [RP analysis. Note that some years may not sum to the total
due to rounding. The Company assumes total EE savings will continue to grow on an annual basis
throughout the planning period, however, the components of future programs are uncertain at this
time and will be informed by the experience gained under the current plan. The projected MW load
impacts from the DSM programs are based upon the Company’s continuing, as well as new, DSM
programs. This table does not include historical EE program savings since the inception of the FE
programs in 2009 through the end of 2012, which accounts for approximately an additional 1,828
GWh of energy savings and 257 MW of summer peak demand savings. The projections also do not
include savings from DEC’s proposed Integrated Voltage-VAR Control program which will he
discussed later in this document.
89
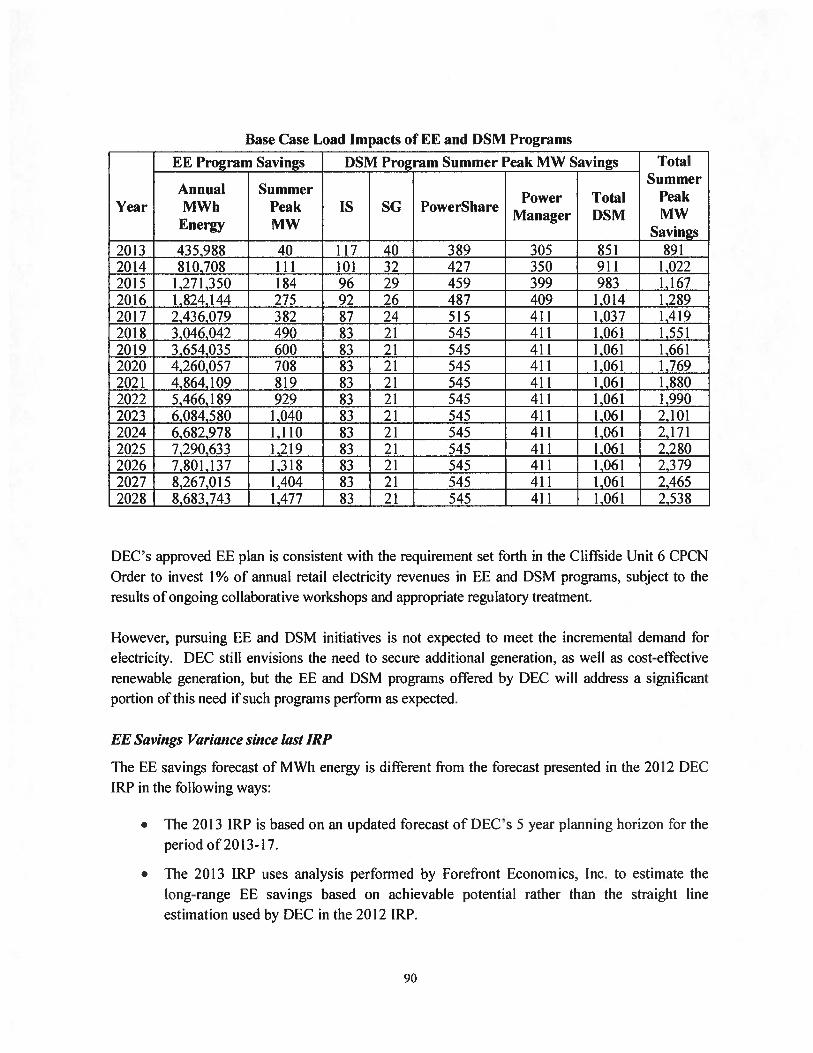
Base Case Load Impacts of EF and DSM Programs
EE Program Savings DSM Program Summer Peak MW Savings TotalSummer
Annual SummerPower Total Peak
Year MWh Peak IS SG PowerShareManager DSM MW
Energy MW Savings2013 435,988 40 117 40 389 305 851 8912014 810,708 111 101 32 427 350 911 1,0222015 1,271,350 184 96 29 459 399 983 1,1672016 1,824,144 275 92 26 487 409 1,0142017 2,436,079 382 87 24 515 411 1,0372018 3,046,042 490 83 21 545 411 1,061_2019 3,654,035 600 83 2 — 545 — ,6612020 4,260,057 708 83 2 — 545 — ,7692021 4,864,109 819 83 2 545 11 — ,8802022 5,466,189 929 83 2 545 ,9902023 6,084,580 1,040 83 21 545 4 — 2,1012024 6,682,978 1,110 83 545 4 1,061 2,1712025 7,290,633 1,219 83 21 545 4 2,2802026 7,801,137 1,318 83 21 545 4 1,061 2,3792027 8,267,015 1,404 83 21 545 4 1,061 2,4652028 8,683,743 1,477 83 21 545 4 1,061 2,538
[)EC’s approved FE plan is consistent with the requirement set Ihrth in the Clifliide Unit 6 CPCN
Order to invest 1% of annual retail electricity revenues in FE and DSM programs, subject to the
results of ongoing collaborative workshops and appropriate regulatory treatment.
However, pursuing FE and 1)SM initiatives is not expected to meet the incremental demand forelectricity. [)EC still envisions the need to secure additional generation, as well as cost-effective
renewable generation, hut the FE and DSM programs offered hy [)EC will address a significant
portion of this need if such programs perform as expected.
EE Savings Variance since last IRP
The EE savings tbrecast of MWh energy is diiièrent from the forecast presented in the 2012 DEC
IRP in the following ways:
• The 2013 IRP is based on an updated forecast of DEC’s 5 year planning horizon for the
period of 2013-17.
• The 2013 IRP uses analysis performed by Forefront Economics, Inc. to estimate the
long-range FE savings based on achievable potential rather than the straight line
estimation used by E)EC in the 2012 IRP.
90

‘[‘he implementation of these two changes in methodology results in a base case MWh forecast thatis higher than that presented in the 2012 [)EC’ IRP, however, the overall shape of the forecastchanges froni a straight line expectation in 2012 to a curve that shows a gradual decrease in theamount of incremental achievable MWh beginning in about 2025.
High EE Savings Projection
[)EC also prepared a high Ll savings projection designed to meet the following EnergyEfficiency Pertbrmance Targets for five years, as set forth in the December 8, 2011 SettlementAgreement between Environmental Defense Fund, the South Carolina Coastal (onservationLeague and Southern Alliance for Clean Energy, and Duke Energy Corporation, ProgressEnergy, Inc., and their public utility subsidiaries Duke Energy Carolinas LLC and CarolinaPower & Light C’ompany, d/h/a Progress Energy Carolinas. Inc.
• An annual savings target of’ 1% of the previous year’s retail electricity sales beginning in2015; and
• A cumulative savings target of 7% of retail electricity sales over the five year lime periodof 2014 through 2018.
For the purposes of this IRP, the high FE savings prqjection is being treated as a resourceplanning sensitivity that will also serve as an aspirational target ft)r fljture FE plans andprograms. The high FE savings projections are well beyond the level of savings attained by[)EC in the past and higher than the forecasted savings contained in the new market potentialstudy. The effbrt to meet them will require a substantial expansion of DEC’s currentCommission-approved FE portfolio. New programs and measures must he developed, approvedby regulators, and implemented within the next few years. More importantly, significantlyhigher levels of customer participation must he generated. Additionally, flexibility will herequired in operating existing programs in order to quickly adapt to changing market conditions,code and standard changes, consumer demands, and emerging technologies.
At this time there is too much uncertainty in the development of new technologies that willimpact fttture programs and/or enhancements to existing programs, as well as in the ability tosecure high levels of customer participation, to risk using the high FE savings projection in thebase assumptions for developing the 2013 IRP. I lowever, the high FE savings forecast wasincluded in the Environmental locus Scenario. DEC expects that as steps are made over timetoward actually achieving higher levels of program participation and savings, then the FEsavings forecast used for integrated resource planning purposes will continue to he revised in
future lRPs to reflect the most realistic projection of EE savings.
9’
Programs Evaluated but Rejected
I)uke Energy Carolinas has not rejected any cost-ettective programs as a result of its EE and l)SM
program screening.
Looking to the Future
• Grid Modernization (Smart Grid Impacts)
I)uke Energy is pill-suing implementation of grid modernization throughout the enterprise
with a vision ot creating a sustainable energy future fbr our customers and our business by
being a leader of innovative approaches that will modernize the grid.
DEC is reviewing an Integrated Volt—VAR Control (IVVC) project that will better manage
the application and operation of voltage regulators (the Volt) and capacitors (the VAR) on
the DEC distribution system. In general, the project tends to optimize the operation of these
devices, resulting in a “t1atteniig” of the voltage profile across an entire circuit, starting at
the substation and continuing out to the farthest endpoint on that circuit. This flattening of
the voltage profile is accomplished by automating the substation level voltage regulation and
capacitors, line capacitors and line voltage regulators while integrating them into a single
control system. Ibis control system continuously monitors and operates the voltage
regulators and capacitors to maintain the desired ‘flat” voltage profile. Once the system is
operating with a relatively flat voltage profile across an entire circuit, the resulting circuit
voltage at the substation can then he operated at a lower overall level. Lowering the circuit
voltage at the substation results in an immediate reduction of system loading. Through
application of IVVC and reduced system voltage, DEC is thereby reducing load and system
demand.
The deployment of an IVVC program tbr DEC is anticipated to take approximately 5 years
following project approval. This IVVC program is projected to i-educe future distribution
system demand by 0.20% in 2015, 0.4% in 2016, 0.6% in 2017,0.8% in 2018 and 1.00% in
2019 and following years.
92
APPENDIX E: FUEL SUPPLY
[)uke Energy Carolinas’ current fuel usage consists primarily of coal and uranium. Oil and gas
have traditionally been used fir peaking generation, hut natural gas has begun to 1ay a more
important role in the fuel mix due to lower pricing and the addition of the Buck and Dan River
Combined Cycle plants. These additions will further increase the importance of gas to the
Company’s generation poiitolio, A brief overview and issues pertaining to each fuel type are
discussed below.
Natural GasFollowing a tumultuous year (2012) for North American gas producers, 2013 is signaling a return to
market stability. Near term prices have recovered from their sub $2/MMBtu lows to settle into the
$3.50 - $4.00 range. Inventories are hack in neutral territory, gas directed rig counts remain at 18
year lows and yet, the size of the low cost resource base continues to expand. Looking fbrward, the
gas market is expected to remain relatively stable and the improving economic picture will allow the
supply / demand balance to tighten and prices to continue to firm at sustainable levels. New gas
demand from the power sector is likely to get a small boost between now and 201 5 from coal
retirements which are tied to the implementation of the Environmental Protection Agency (EPA)
MATS rule covering mercury and acid gasses. This increase is expected to he followed by new
demand in the industrial and LNG export sectors which both ramp up in the 201 6 — 2020 tirneframe.
The long term fundamental gas price outlook is little changed from the 201 2 Ibrecast even though it
includes higher overall demand. The North American gas resource picture is a story of
unconventional gas production dominating the gas industry. Shale gas now accounts for about 38%
of natural gas production today, rising to over hal I by 2019.
The US power sector still represents the largest area of potential new demand, hut growth is
expected to be uneven. After absorbing about 8.8 hcfd of new gas demand tied to coal
displacements in the power dispatch in 2012, higher gas prices have reversed the trend. Looking
forward, direct price competition is expected between gas and coal on the margin. A 2015 bump in
gas demand is expecled when EPA’s MATS rule goes into efThct and utilities retire a significant
amount of coal (38 GW’s in this outlook).
CoalOn average, the 201 3 l)uke fundamental outlook fur coal prices is lower than the 2012 outlook, with
the exception of Central Appalachian ((‘APP) sourced coal which is higher in the near-term
primarily as a result of deterioration in mine productivity. Since 2008, Central Appalachian
underground mine productivity (tons per man-hour) has declined by 28%, surfhce mine productivity
by 23% this combination equates to roughly a $5 per ton increase in labor costs alone.
93
Coal burned in power generation accounts for roughly 80% of all domestic coal production, export
steam coal I 0%, metallurgical coal for both domestic consumption and export 8%, with the balance
consumed in industrial and commercial applications. ‘lhe coal Ibrecast assumes a long—term decline
in power generation Il’om coal following the introduction of the assumed carbon tax in 2020.
Exports of metallurgical coals from the East (CAPP and NAPP) are projected to remain constant
while export steam coal grows steadily. ibis growth assumption is driven by superior productivity
in Illinois Basin (lLE3) and Powder River Basin (PRI3) with delivery of lLE3 to Atlantic markets via
the Gulf of Mexico and delivery of PRI3 to the Pacific markets via terminals planned fbi’
Washington state and British Columbia.
Nuclear Fuel
To provide fuel for Duke Energy Carolinas’ nuclear fleet, the Company maintains a diversified
portfolio of natural uranium and downstream services supply contracts from around the world.
Requirements fbi’ uranium concentrates, conversion services and enrichment services are
primarily met through a portfolio of long-term supply contracts. The contracts are diversified by
supplier, country of origin and pricing. In addition, Duke Energy Carolinas staggers its
contracting so that its portfolio of long—term contracts covers the majority of fleet fuel
requirements in the near-term and decreasing portions of’ the fuel requirements over time
thereafter. By staggering long—term contracts over time, the Company’s purchase price for
deliveries within a given year consists of a blend of contract prices negotiated at many different
periods in the markets, which has the eft’ect ol’ smoothing out the Company’s exposure to pt-ice
volatility. Diversifying fuel suppliers reduces the Companys exposure to possible disruptions
from any single source of supply. Near-term requirements not met by long-term supply contracts
have been and are expected to he fulfilled with spot market purchases.
Due to the technical complexities of’changing suppliers of fuel fabrication services, l)uke Energy
Carolinas generally sources these services to a single domestic supplier on a plant-by-plant basis
using mit lti-year contracts.
As fuel with a low cost basis is used and lower-priced legacy contracts are replaced with contracts at
higher market prices, nuclear fuel expense is expected to increase in the future. Although the costs
olcertam components of nuclear fuel are expected to increase in future years. nuclear fuel costs on a
kWh basis will likely continue to be a fraction of the kWh cost of thssil fuel, Iiierefbre, customers
will continue to benefit from the C’ompany’s diverse generation mix and the strong performance of’
its nuclear fleet through lower fuel costs than would otherwise result absent the significant
contribution of’ nuclear generation to meeting customers’ demands.
94

AIIENDIX F: SCREENING OF GENERATION ALTERNATIVES
The Company screens gencration technologies prior to pertorming detailed analysis in order todevelop a manageable set ot possible generation alternatives. Generating technologies arescreened from both a technical perspective, as well as an economic perspective. In thetechnical screening, technology opiions are reviewed to determine technical limitations.commercial availability issues and feasibility in the [)uke Energy Carolinas service territory.Economic screening is performed using a relative dollar per kilowatt-year ($/kW-yr) versuscapacity factor screening curves. The technologies must he viable from both technically andeconomically in order to he passed on to the detailed analysis phase of the LRP process.
Technical Screening
The first step in the Cornpanys supply-side screening process for the IRP is a technical screening ofthe technologies to eliminate those that have technical limitations, commercial availability issues. orare not feasible in the I)uke Energy Carolinas service territory. A brief explanation of thetechnologies excluded at this point and the basis fbr their exclusion follows:
• Geothermal was eliminated because there are no suitable geothermal resources in theregion to develop into a power generation project.
• Advanced energy storage technologies (Lead Acid, Li-ion, Sodium Ion, ZincBromide, Fly Wheels, Pumped Storage, etc) remain relatively expensive, as comparedto conventional generation sources, but the benefits to a utility such as the ability toshill load and firm renewable generation are obvious. Research, development, anddemonstration continue within Duke Energy Corporation. Duke Energy GenerationServices has installed a 36 MW advanced acid lead battery at the Notrees wind farmin Texas that began commercial operation in December 2012. I)uke Energy hasinstalled a 75 kW battery in Indiana which is integrated with solar generation andelectric vehicle charging stations. 1)uke Energy also has other storage system testswithin its Envision Energy demonstration in Charlotte, which includes twoCommunity Energy Storage (CES) systems of 24 kW, and three substationdemonstrations less than 1 MW each.
• Compressed Air Energy Storage (CALS), although demonstrated on a utility scaleand generally commercially available, is not a widely applied technology and remainsrelatively expensive. The high capital requirements for these resources arise from thefact that suitable sites that possess the proper geological lbrniations and conditionsnecessary fhr the compressed air storage reservoir are relatively scarce.
95
• Small modular nuclear reactors (SMR) are generally defined as having capabilities of
less than 300 MW. In 2012, U.S. Department of Energy (I)OE) solicited bids for
companies to participate in a small modular reactor grant program intending to
promote the accelerated commercialization of’ SMR tecimologies to help meet the
nation’s economic energy security and climate change objectives.” The focus of the
grant is the hrst-of-a-kmd engineering associated with NRC design certification and
licensing effbrts in order to demonstrate the ability to achieve NRC design
certification and licensing to support SMR plant deployment on a domestic site by
2022. The grant was awarded to Babcock & Wilcox (B&W) who will lead the effort
in partnership with ‘[VA and Bechtel. It is estimated that this project may lead to the
development of “plug and play” type nuclear reactor applications that are about one—
third the size of current reactors. These are expected to become commercially
available around 2022. Duke will he monitol’ing the progress of the SMR project for
potential consideration and evaluation for future resource planning.
• Fuel Cells. although originally envisioned as being a competitor for combustion
turbines and central power plants, are now targeted to mostly distributed power
generation systems. The size of the distributed generation applications ranges from a
few kW to tens of’ MW in the long-term. Cost and perfiwmance issues have generally
limited their application to niche markets and/or subsidized installations. While a
medium level of research and development continues, this technology is not
commercially available ft)r utility—scale application.
• Poultry waste and swine waste digesters remain relatively expensive and are often
faced with operational and/or permitting challenges. Research, development, and
demonstration continue, hut these technologies remain generally too expensive or
face obstacles that make them impractical energy choices outside of specific
mandates calling ibr use of these technologies.
• Offshore wind, although demonstrated on a utility scale and commercially available,
is not a widely applied technology and not easily permitted. This technology remains
expensive and has yet to actually he constructed anywhere in the United States.
Currently, the Cape Wind project in Massachusetts has been approved with assistance
from the ièderal government hut has not begun construction. [he Company is a
contributor to the l)OE—sponsorcd C’OW IC’ S.
Economic Screening
[he C’ompany screens all technologies using relative dollar per kilowatt-year ($/kW-yr) versus
capacity factor screening curves. The screening within each general class (Baseload,
96

Peaking/Intermediate, and Renewables), as well as the final screening across the general classes,uses a spreadsheet-based screening curve model developed by Duke Energy. This model isconsidered proprietaly, confidential and competitive inlormation by Duke Energy.
This screening curve analysis model includes the total costs associated with owning andmaintaining a technology type over its lifttime and computes a levelized $/kW-year value over arange of capacity factors. The Company repeats this process for each supply technology to hescreened resulting in a family of lines (curves). ‘[‘he lower envelope along the curves represents theleast costly supply options tbr various capacity factors or unit utilizations. Some technologies havescreening curves limited to their expected operating range on the individual graphs. Lines thatnever become part of the lower envelope, or those that become part of the lower envelope only atcapacity factors outside of their relevant operating ranges, have a very low probability of being partof the least cost solution, and generally can be eliminated from further analysis.
The Company selected the technologies listed below fbr the screening curve analysis. While EPA’sMATS and Greenhouse (las (GIRl) New Source regulations may eflëctively preclude new coalflred generation, Duke Energy Carolinas has included SCPC and IGCC’ technologies with carbon(‘CS of 800 pounds/net MWFI as options for base load analysis consistent with the proposed EPANew Source Performance Standard (NSPS) rules. Additional detail on the expected impacts fromEPA regulations to new coal-fired options is included in Appendix F.
• Base load — 825 MW Supercritical Pulverized Coal with CC’S• Base load —618 MW IGCC with CCS
Base load —2 x 1,1 17 MW Nuclear units (API 000)• I3ase load —680 MW — 2xl Combined Cycle (Inlet Chiller and Fired)• Base load— 843 MW — 2x1 Advanced Combined Cycle (Inlet Chiller and Fired)• Base load — 1,275 MW — 3x I Advanced Combined Cycle (In let Chiller and Fired)• Peaking/Intermediate— 174 MW 4 x LM6000 C’Ts• Peaking/Intermediate — 805 MW 4 x 7FA.05 Ci’s• Renewable — 150 MW Wind - On-Shore• Renewable —25 MW Solar PV
Information Sources
The cost and performance data fbi- each technology being screened is based on research andinformation from several sources. These sources include, hut may not he limited to, the followinginternal Departments: [)uke Energy’s New Generation Project I)evelopment, Emerging1 echnologies, and Analytical Engineering. The thllowing external sources may also he utilized:proprietary third-party engineering studies, the EPRI l’echnology Assessment Guide (TAG®), andEIA. In addition, fuel and operating cost estimates are developed internally by Duke Energy, orfrom other sources such as those mentioned above, or a combination of the two. Electric Power
97
Research Institute (EPRI) information or other information or estimates from external studies are
not site-specific, but generally reflect the costs and operating parameters for installation in the
Carolinas. Finally, every effort is made to ensure that capital, O&M and fuel costs and other
parameters are current and include similar scope across the technologies being screened. The
supply-side screening analysis uses the same fuel prices for coal and natural gas, and NON, SO2, and
CO2 allowance prices as those utilized downstream in the detailed analysis (discussed in Appendix
A). Screening curves were developed fi’r each technology to show the economics with and without
carbon costs.
Screening Results
The results of the screening within each category are shown in the figures below. Results of the
baseload screening show that combined cycle generation is the least-cost haseload resource. With
lower gas prices, larger capacities and increased efficiency, combined cycle units have become
more cost-effective at higher capacity factors. Supercritical pulverized coal generation closes the
gap with combined cycle generation only if carbon capture sequestration and CO2 costs are
excluded. The baseload curves also show that nuclear generation may be a cost effective option at
high capacity factors with CO2 costs included.
The peaking/intermediate technology screening included F-frame combustion turbines and fast start
aero-derivative combustion turbines. The screening curves show the F-frame CTs to be the most
economic peaking resource unless there is a special application that requires the fast start capability
of the aero-derivative Cl’s.
The renewable screening curves show solar is a more economic alternative than wind generation.
Solar and wind projects are technically constrained from achieving high capacity factors making
them unsuitable tbr intermediate or baseload duty cycles. Solar projects, like wind, are not
dispatchable and therefore less suited to provide consistent peaking capacity. Aside from their
technical limitations, solar and wind technologies are not currently economically competitive
generation technologies without state and federal subsidies. ‘l’hese renewable resources do play an
important role in meeting the Company’s NC REPS requirements.
The screening curves are useful (hr comparing costs of resource types at various capacity factors hut
cannot he utilized for determining a long—term resource plan because future units must he optimized
with an existing system containing various resource types. In the quantitative analysis phase, the
Company further evaluates those technologies from each of’ the three general categories screened
which had the lowest levelized busbar cost for a given capacity factor range within each of these
categories.
98
C0NF
DENT
A. 680 MW - 2x1 Combined Cycle (lylet Chiller and Fired) .—W.—Combned Cycle Adnanced Class 2u2x1 Inlet Chiller * Duct Fired
843 MW — 2x1 Adnanced Combined Cycle (Inlet Chiller and Fired) 823 MW Supercrilcul Prrlvenzed CnaI
825 MW Supercritical PuIuer*ed Coal wI CCS 8008/nMWHR 618 MW 16CC
618 MW IGCC w/CCS 8001*/nM WHR 16CC 2x 1,117 MW Nuclear unitr (AP1000)
C0NF
DENTI
AL
>
Capacity Factor
Baseload Technologies Screening 2013 - 2033 (without
Capacity Factor
600 MW — 2u1 Combaned Cycle (Inlet Chrller and Feed) —‘—Cembmed Cycle Aduancetl Class 2n2x1 Inlet CI*IIer a Duct P,red
‘-eu—843 MW — 2u1 Aduarcrod Combined Cycle (Inlet Chiller and Fired) 825 MW Supercritical Fulneezed Coal
825 MW S*yercritica’ yoluerised Coal m/ CCS 800#/eMWHR 618 MW 16CC
610 MW 16CC w/CCS SOyuInMWl-lR IGCC 2 x 1,117 MW Nuclear untls (AP1OW)
99

C0NFIDENT
AL
C0NF
DENT
AL
Capacity Factor
—+—174 MW 4 x 1M6000 CTS -4W-8O5 MW 40 7FA.O5 CTs
Peak! Intermediate Technologies Screening 2013 - 2033 (without CO)
Capacity Factor
—t—174 MW 4 a 1M6000 Cis ——305 MW 4a 7FA.05 crs
100
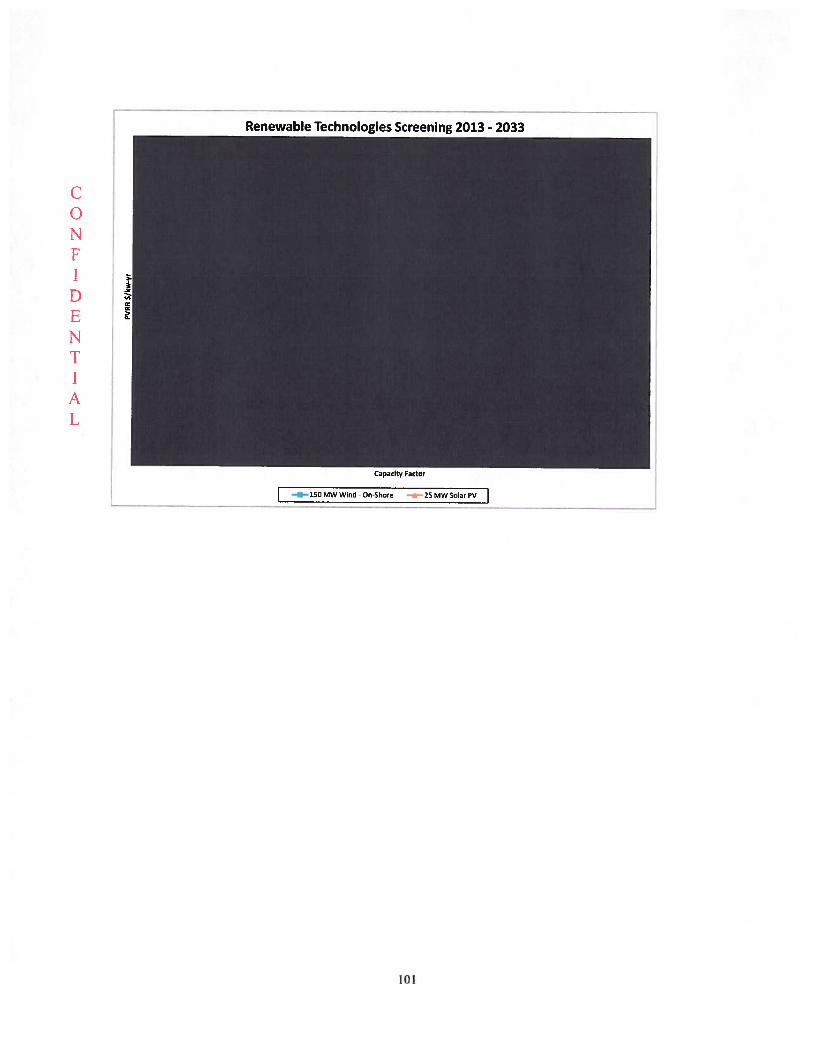
C0NF
DENTI
AL
Renewable Technologies Screening 2013 - 2033
Capacity Factor
150 MW Wird On-Shore 25 MW Solar PV
I0I
APPENDIX C: ENVIRONMENTAL COMPLIANCE
Legislative anti Regulatory Issues
Duke Energy Carolinas, which is subject to the jurisdiction of federal agencies including the
VERC, EPA, and the N RC, as well as state comnussions and agencies, is potentially impacted by
state and federal legislative and regulatory actions. This section provides a high-level
description of several issues I)uke Energy Carolinas is actively monitoring or engaged in that
could potentially influence the Company’s existing generation portfolio and choices fbi’ new
generation resources.
Air Quality
Duke Energy Carolinas is required to comply with numerous state and 1deral air emission
regulations, including the current Clean Air Interstate Rule (CAIR) NO and SO2 cap-and-trade
program, and the 2002 North Carolina Clean Smokestacks Act (NC’ CSA).
As a result of complying with the NC CSA, Duke Energy Carolinas will reduce SO2 emissions
by approximately 75% by 2013 from 2000 levels, The law also required additional reductions in
NO emissions in 2007 and 2009, beyond those required by CA1R, which Duke Energy
C:arolinas has achieved. [his landmark legislation, which was passed by the North Carolina
General Assembly in June of 2002, calls for some ol’ the lowest state-mandated emission levels
in the nation, and was passed with Duke Energy Carolinas’ input and support.
‘[‘he charts below show the significant downward trend in both NO\ and SO2 emissions through
2012 as a result of’ actions taken at I)EC’ facilities.
102

Chart C-i DEC NO Emssions
180.000
160.000
140.000
1 20.000
1 00.000
80.000
60.000
40.000
20.000
0
Duke Energy Carolinas Coal-Fired PlantsAnnual Nitrogen Oxides Emissions (tons)
1995199619971998199920002001 200220032004200520062007200820920020112012
Overall reduction of 89% from 1997 to 2012attributed to controls to meet FederalRequirements and NC Clean Air Legislation.
Chart C-2 I)EC SO2 Emissions
350.000
300,000
250.000
200.000
150.000
100.000
50.000
Duke Energy Carolinas Coal-Fired PlantsAnnual Sulfur Dioxide Emissions (tons)
1995199619971998199920002001 2002200320042005200620072008200920102011 2012
95 % Reduction from 2000 to 2012 attributed to scrubbersinstalled to meet NC Clean Air Legislation.
A DSSIDi-S.
I..ci.aI
103
In addition to current programs and regulatory requirements, several new regulations are in variousstages of implementation and development that will impact operations for Duke Energy Carolinas inthe coming years. Some of the major rules include:
cross-State Air Pollution Rule and the clean Air Interstate Rule
The EPA finalized CAIR in May 2005. The (‘AIR limits total annual and summertime NOemissions and annual SO2 emissions from electric generating facilities across the Eastern U.S.through a two-phased cap-and-trade program. In [)ecem her 2008, the United States 1)istrictCourt for the District of Columbia issued a decision remanding CAIR to the EPA, allowingCAIR to remain in effect until EPA develops a replacement regulation.
In August 2011, a replacement fbr CAIR was finalized CSAPR, however, on December 30. 2011the CSAPR was stayed by the U.S. Court of Appeals for the D.C. Circuit. Numerous petitions forreview of the CSAPR were filed with the D.C. Circuit Court. On August 21, 201 2, by a 2-1decision, the D.C. Circuit vacated the CSAPR. The Court also directed the EPA to continueadministering the CAIR that Duke Energy Carolinas has been complying with since 2009 pendingcompletion of a remand rulemaking to replace CSAPR with a valid rule. CAIR requires additionalPhase II reductions in SO2 and NO emissions beginning in 201 5. The court’s decision to vacatethe CSAPR leaves the future of the rule uncertain. The EPA filed a petition with the D.C. Circuitfhr en bane rehearing of the CSAPR decision, which the court denied. EPA then filed a petitionwith the Supreme Court asking that it review the I).C. Circuit’s decision. On June 24, 2013 theSupreme Court granted review of the D.C. Circuit’s August 21, 2012 decision. [he Court willreview the three issues presented in EPA’s petition. Barring unforeseen developments, the Courtcould issue its decision by .June 2014. The Supreme Court’s order granting review does not changethe legal status of CSAPR: CSAPR does not have legal eFfect at this time, and EPA is required tocontinue to administer the CAIR.
l)uke Energy Carolinas cannot predict the outcome of the review process or how it could affectfuture emission reduction requirements that might apply as a result of a potential CSAPRreplacement rulemaking. If the Supreme Court aliims the D.C. Circuit’s decision on all issues, it islikely to take beyond 2015 for a replacement rulemaking to become effective which means thatPhase II of CAIR would take effect on January 1,2015. No risk thr compliance with CAIR Phase Ior Phase II exists, as such, no additional controls are planned. If the review process results in theC’SAPR being g reinstated, it is unclear when EPA might move to implement the rule. Regardlessof the timing, however, there is no risk for compliance with CSAPR Phase I or Phase II, as such: noadditional controls would be required.
104
Mercury and Air Toxics Standard (‘M4 TS)
In February 2008, the United States Court of Appeals for the 1)istrict of Columbia issued its
opinion, vacating the Clean Air Mercury Rule (CAMR). EPA announced a proposed Utility
Boiler Maximum Achievable Control Technology (MACI’) rule in March 2011 to replace the
CAMR. The EPA published the final rule, known as the MATS, in the Federal Register on
[:eL,rtiaiy 16, 2012, MATS regulates Hazardous Air Pollutants (HAP) and establishes unit—level
emission limits or mercury, acid gases, and non—mercury metals. and sets work practice standards
fbr organics for coal and oil-lired electric generating units. Compliance with the emission limits
will be required by April 16, 2015. Permitting authorities have the discretion to grant up to a 1-year
compliance extension, on a case-by-case basis, to sources that are unable to install emission controls
heibre the compliance deacll inc.
Numerous petitions for review of the final MATS rule have been filed with the United States Court
of Appeals for the District of Columbia. Briefing in the case has been completed. Oral arguments
have not been scheduled. A court decision in the case is not likely until the first quarter of 2014.
Duke Energy Carolinas cannot predict the outcome of the litigation or how it might affect the
MATS requirements as they apply to operations.
Based on the emission limits established by the MATS rule, compliance with the MA’FS rule has
driven several tiriit retirements and will drive the retirement or fuel conversion of several more non-
scrubbed coal-fired generating units in the Carolinas by April 2015. Compliance with MATS will
also require various changes to units that have had emission controls added over the last several
years to meet the emission requirements of the NC CSA.
National Ambient Air Quality Standards (NAAQS)
8 Hour Ozone Standard
In March 2008, EPA revised the 8 Flour Ozone Standard by lowering it from 84 to 75 parts per
billion (ppb). In September of 2009, EPA announced a decision to reconsider the 75 pph standard
in response to a court challenge from environmental groups and their own belief’ that a lower
standard was us1ified. However, EPA announced in September 2011 that it would retain the 75
pph primary standard until it is reconsidered under the next 5-year review cycle. It could he mid-
2014 hethre the EPA proposes a revision to the 75 pph standard and mid—2015 heibre it finalizes a
new standard unless ongoing legal action results in a court ordered schedule requiring the Agency to
act sooner.
On May 21, 2012 EPA finalized the area designations for the 2008 75 ppb 8-hour ozone standard.
The Charlotte area, the only area in North Carolina designated nonattainment, is now classified as a
“marginal” nonattainment area, which establishes l)ecemher 31, 2015 as its attainment date. For
105

marginal nonattainment areas, states are not required to prepare an attainment demonstration. EPAin its final rule states that it perlbrmed an analysis that indicates that the majority of areas classified
as marginal will be able to attain the 75 pph standard in 201 5 due to fderal and state emission
reduction programs already in place. If the Charlotte area’s air quality does not qualit’ it to bereclassified as attainment, the area can still qualify for the first of two possible one—year extensions
of the attainment date if it has no more than one exceedance of the standard in 201 5. Alternatively,
should the Charlotte area not attain the standard by its attainment date and not qualify fbr all
extension, it could be humped up to the next higher classification, which fbr Charlotte would hemoderate. 1’his would require North Carolina to develop an attainment SFP to bring the Charlotte
area into attainment with the standard by I.)ecember 31, 201 8.
SO2 Standards
On June 22, 2010 EPA established a 75 pph I-hour SO2 NAAQS and revoked the annual and 24-hour SO2 standards. EPA finalized initial nonattamment area designations in ‘113[) 2013. No areas
ill the Carolinas were designated nonattainment.
On February 6, 2013 the EPA released a document that updated its strategy for addressing all areas
that it did not initially designate as nonattamment ill July 2013. ‘tile document indicated that EPA
will allow states to use modeling or monitoring to evaluate the impact of large SO2 emitting sources
relative to the 75 pph standard. The document also laid out a schedule k)r implementing the
standard.
‘tile EPA plans on undertaking notice and comment rulemaking to codify the implementation
requirements fhr the 75 pph standard. ‘[here is no schedule fbr EPA to propose or finalize the
rulemaking, and the outcome of the rulemaking could be different from what EPA put forth in its
February 6, 201 3 document.
Particulate Mailer (PM) Staiidard
In September 2006, the EPA announced its decision to revise the PM25 NAAQS standard. ‘l’he
daily standard was reduced from 65 ug/in3 (micrograms per cubic meter) to 35 ug/m3. The annualstandard remained at 1 5 ug/m3.
EPA finalized designations ft)r the 2006 daily standard in October 2009, which did not include
any nonattainment areas in the I)uke Energy Carolinas service territory. In February 2009, the
D.C Circuit unanimously remanded to EPA the Agency’s decision to retain the annual 15 ug/m3primary PM2 s NAAQS and to equate the secondary PM2 5 NAAQS with the primary NAAQS.
EPA began undertaking new rulemaking to revise the standards consistent with the Court’s
decision.
106
On December 14, 2012 the EPA finalized a rule that lowered the annual PM75 standard to 12
ug/m3 and retained the 35 ug/m3 daily PM25 standard. ‘lhe EPA plans to finalize area
designations by December 2014. Stales with nonattainment areas will be required to submit
State Implementation Plans (SIPs) to EPA in early 201 8, with the initial attainment date in 2020.
The EPA has indicated that it will likely use 2011 — 2013 air quality data to make final
designations.
To date neither the annual nor the daily PM2 standard has directly driven emission reduction
requirements at Duke Energy Carolinas facilities. Ilie reduction in SO2 and NOx emissions to
address the PM25 standards has been achieved through the CAIR and the NC CSA. It is unclear
if the new lower annual PM2.5 standard will require additional SO2 or NOx emission reduction
requirements at any Duke Energy Carolinas generating facilities.
Greenhouse Gas Regulation
The EPA has been active in the regulation of Gl-lGs. In May 2010, the EPA finalized what is
commonly referred to as the ‘l’ailoring Rule. This rule sets the emission thresholds to 75,000
tons/year of’ CO2 for determining when a modified major stationary source is subject to Prevention
of Significant [)eterioration (PSI)) permitting for greenhouse gases. The Tailoring Rule went into
effect beginning January 2, 2011. Being subject to PSD permitting requirements for CO2 will
require a Best Available Control Technology (BACT) analysis and the application of BACT for
GHGs. BACT will he determined by the state permitting authority. Since it is not known il or
when, a Duke Energy Carolinas generating unit might undertake a modification that triggers PSD
permitting requirements Ihr G[1(Is and exactly what might constitute BACI’, the potential
implications of this regulatory requirement are unknown.
On April 13, 2012, a proposed rule to establish GIIG NSPS for new electric utility steam generating
units (EGUs) was published in the Federal Register. The proposed Gl-lG NSPS applies only to new
pulverized coal, IGCC and natural gas combined cycle units. Flie proposed NSPS is an output-
based emission standard of 1,000 lb C02/gross MWh of’ electricity generation. The proposal was
very controversial because it set the same emission standard for new natural gas and new coal-fired
electric generating units. The only way a new coal unit could meet the proposed standard is with
carbon capture and storage technology. The President has directed EPA to re-propose the rule by
September 20, 2013. The requirements ota re—proposed rule are not known.
The President has directed EPA to propose (‘02 emission guidelines for existing electric generating
units by June 1, 2014, and finalize guidelines by June 1, 2015. Once EPA finalizes emission
guidelines for existing sources, the states will be required to develop the regulations that will apply
to covered sources, based on the emission performance standards established by EPA in its
guidelines.
107

It is highly unlikely that legislation mandating reductions in GHG emissions or establishing a
carbon tax will he passed by the 113th Congress which began on January 3, 2013. Beyond 2014 the
prospects lhr enactment o1 any federal legislation mandating reductions in 0110 emissions or
establishing a carbon tax are highly uncertain.
Water Quality and By-product Issues
CWA 316(b) cooling Water Intake Structures
Federal regulations in Section 3 16(b) of the Clean Water Act may necessitate cooling water intake
modifications fbr existing Facilities to minimize impingement and entrainment of aquatic organisms.
EPA published its proposed rule on April 20, 2011.
The proposed rule establishes mortality reduction requirements due to both fish impingement and
entrainment and advances one prelèrred approach and three alternatives. The EPA’s preferred
approach establishes aquatic pi-otection requirements and new on-site facility additions for existing
facilities with a design intake flow of’2 million gallons per day (mgd) or more from rivers, streams,
lakes, reservoirs, estuaries, oceans, or other U.S. waters that utilize at least 25% of’ the water
withdrawn for cooling purposes.
The most recent EPA settlement agreement now calls tbr the EPA to finalize the 316(b) rule by
November 4, 2013. IF the rule is finalized as proposed, initial submittals, station details, study
plans, etc, for some facilities would he due in mid—late 2014. If required, modifications to the
intakes to comply with the impingement reqLnrements could he required as early as late 201 6.
Within the proposed rule, EPA did not provide a compliance deadline for meeting the entrainment
requirements.
Steam Electric Effluent Guidelines
In September 2009, EPA announced plans to revise the steam electi-ic eflluent limitation
guidelines. I’he steam electric effluent limitation guidelines are technology—based, in that limits are
based on the capability of the best technology available. On April 19. 2013, the EPA Acting
Administrator signed the proposed revisions to the Steam Electric Effluent Limitations Guidelines
(ELGs). The proposal was published in the l’ederal Register on June 7, 2013 with comments due to
EPA by the extended date of’ September 20, 201 3. I. nder the current revision of the consent decree,
the EPA has agreed to issue a final rule by May 22, 2014. The EPA has proposed eight different
regulatory options for the rule, of which four are listed as preferred by EPA. The eight regulatory
options vary in stringency and cost, and propose revisions or develop new standards tbr seven waste
streams. including wastewater from air pollution control equipment and ash transport water. The
proposed revisions are focused primarily on coal generating units, but some revisions would be
O8
applicable to all steam electric generating units, including natural gas and nuclear—fueled generating
fticilities. After the final rulemaking, effluent limitation guideline requirements will he included in a
stations National Pollutant I)ischarge Elimination System (NPDFS) permit renewals. Portions of
the rule would he implemented immediately after the efièctive date of the rule upon the renewal of’
wastewater discharge permits, while other portions of’ the rule will he implemented upon the
renewal of the wastewater discharge permits after July, 2017. EPA expects that all facilities will he
in compliance ith the rule by July 2022. ‘Ilie deadline to comply will depend upon each station’s
permit renewal schedule.
coal combustion Residuals
Following Tennessee Valley Authoritys (‘l’VA) Kingston ash (like failure in [)ecemher 2008, EPA
began to assess the integrity of’ ash dikes nationwide and to begin developing a rule to manage coal
combustion residuals (CCR5). CCRs primarily include fly ash, bottom ash and Flue Gas
Desulfurization (FOE)) byproducts (gypsum). Since the 2008 TVA dike failure, numerous ash dike
inspections have been completed by EPA and an enormous amount of’ input has been received by
EPA as it developed proposed regulations. In June 2010, EPA published its proposed rule regarding
CCRs. The proposed rule otièrs two options: 1) a hazardous waste classification under Resource
Conservation Recoveiy Act (RCRA) Subtitle C; and 2) a non-hazardous waste classitication under
RCRA Subtitle D, along with dam safety and alternative rules. l3oth options would require strict
new requirements regarding the handling, disposal and potential re—use ability of CCRs. The
proposal will likely result in more conversions to dry handling of ash, more landfills, the closing 01’
lining of existing ash ponds and the addition of new wastewater treatment systems. Final
regulations are not expected to he issued by EPA until 2014 or later. EPA’s regulatory
classification of CCRs as hazardous or non-hazardous will he critical in developing plans for
handling CCRs. Ilowever, under either option of the proposed rule, the impact to I)uke Energy
Carolinas is likely to be significant. I3ased on a 2014 final rule date, compliance with new
regulations is generally expected to begin around 2019.
109

APPFNDIX H: NON-UTILITY CENFRATION AND WHOLESALE
ibis appendix contains holesale sales contracts, firm wholesale purchased power contracts andnon—utility generation contracts.
110

Tab
le11
.-iW
hole
sale
Sal
esC
ontr
acts
Com
mit
men
t(M
W)
Cust
om
erP
rodu
ctT
erm
2013
2014
2015
2016
2017
2018
2019
2020
2021
2022
Who
lesa
leC
ontr
acts
Con
cord
Part
ial
Req
uire
men
ts20
09-2
018
Dal
las
Part
ial
Req
uire
men
ts20
09-2
028
1)ue
Wes
tPa
rtia
lR
equi
rem
ents
2009
-201
8
Fore
stC
ity
Part
ial
Req
uire
men
ts20
09-2
028
Gre
enw
ood
Full
Req
uire
men
ts20
10-2
018
Ilio
hlan
dsFu
llR
equi
rem
ents
2010
-202
9
Kin
gsM
ount
ain
Part
ial
Req
uire
men
ts20
09-2
0!8
Ioc
khar
tPa
rtia
lR
equi
rem
ents
2009
-201
8
Pro
sper
itPa
rtia
lR
equi
rtm
ents
2009
-202
8
Wes
tern
Car
olin
aFu
llR
equi
rem
ents
2010
-202
1
Blu
eR
idge
FMC
Full
Req
uire
men
ts20
10-2
031
Cen
tral
Part
ial
Req
uire
men
ts20
13-2
030
IIav
woo
dIM
CFu
llR
equi
rem
ents
2009
-202
1
NC
FM
CFi
xed
load
Shap
e20
09-2
038
NC
EM
CB
aest
and
1985
-204
3
Pied
mon
tE
MC
Full
Req
uire
men
ts20
10-2
031
PMPA
Bae
ksta
nd20
14-2
020
Rut
herf
ord
FMC
Part
ial
Req
uire
men
ts20
10-2
031
167
169
172
174
177
180
212
215
217
220
1111
1112
1212
1212
1313
22
22
22
22
22
1818
1919
1920
2020
2121
5353
5455
5657
5858
5960
99
99
99
99
1010
2121
2122
2222
3030
3031
5050
5152
5354
7576
7778
22
22
22
33
33
66
66
66
66
66
225
229
233
237
241
245
249
253
257
261
120
244
374
509
649
793
900
918
936
953
2323
2324
2424
2525
2526
7272
7272
7272
7272
7272
9511
611
611
611
611
611
611
611
611
6
8788
8990
9293
9496
9799
047
4747
4747
4747
4747
185
189
204
208
212
217
221
226
230
235

Table H-2 Firm Wholesale Purchased Power Contracts
Volume ofPrimary Summer Purchases
Purchased Fuel Calacity Capacity (MWh)Power Contract jy (MW) Designation Location I’errn Jul 12-Jun 13
CherokeeCounty
Gas 86 Peaking (iafThey SC 12/31/2020 650 627C ogeneration
Partners,_LLC_I
SEPA Ilydro 8 Peaking 12/31/2021 12,883system
Note: The capacities shown are deIi ered to the [)EC’ sy stem and may differ from the contracted amount.Renewahies purchases are listed in the NC REPS Compliance Plan in the Attachment to this IRP.
112
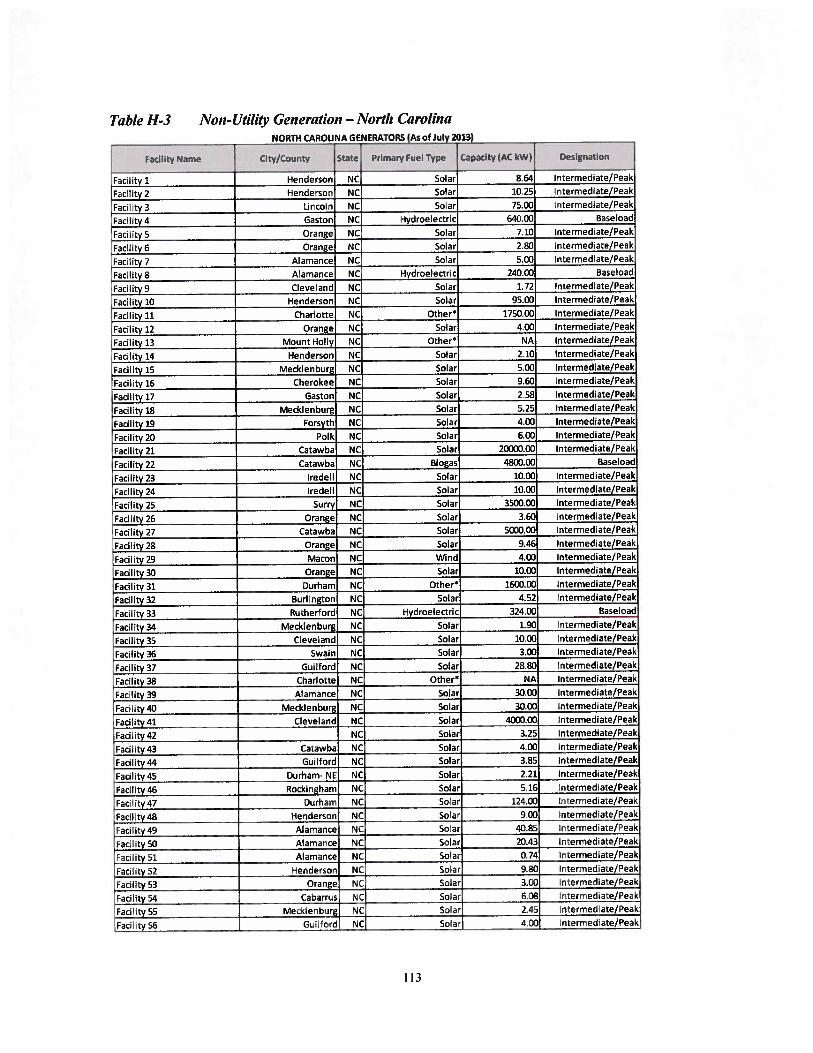
Table H-3 Non-Utility Generation — North CarolinaNORTH CAROUNA GENERATORS (As of July 20131
Facility Name City/County State Primary Fuel Type Capacity (AC kW) Designation
‘Facility 1 Henderson NC Solar 864 Intermediate/Peak
Facility 2 Henderson NC Solar 10.25 Intermediate/Peak
Facility 3 Lincoln NC Solar 75.00 Intermediate/Peak
Facility 4 Gaston NC Hydroelectric 640,00 8aseload
Facility 5 Orange NC Solar 7.10 Intermediate/Peak
Facility 6 Orange NC Solar 2.80 Intermediate/Peak
Facility 7 Alamance NC Solar 5.00 Intermediate/Peak
Facility 8 Alamance NC Hydroelectric 240.00 Baseload
Facility 9 Cleveland NC Solar 1.72 Intermediate/Peak
Facility 10 Henderson NC Solar 95.00 Intermediate/Peak
Facility 11 Charlotte NC Other* 1750.00 Intermediate/Peak
Facility 12 Orange NC Solar 4.00 Intermediate/Peak
Facility 13 Mount Holly NC Other* NA Intermediate/Peak
Facility 14 Henderson NC Solar 2.10 Intermediate/Peak
Facility 15 Mecklenburg NC Solar 5.00 Intermediate/Peak
Facility 16 Cherokee NC Solar 9.60 Intermediate/Peak
Facility 17 Gaston NC Solar 2.58 Intermediate/Peak
Facility 18 Mecklenburg NC Solar 5.25 Intermediate/Peak
Facility 19 Forsyth NC Solar 4.00 Intermediate/Peak
Facility 20 Polk NC Solar 6.00 Intermediate/Peak
Facility 21 Catawba NC Solar 20000.00 Intermediate/Peak
Facility 22 Catawba NC Biogas 4800.00 Baseload
‘Facility 23 Iredell NC Solar 10.00 Intermediate/Peak
Facility 24 Iredell NC Solar 10.00 Intermediate/Peak
Facility 25 Surry NC Solar 3500.00 Intermediate/Peak
Facility 26 Orange NC Solar 3.60 Intermediate/Peak
Facility 27 Catawba NC Solar 5000.00 Intermediate/Peak
Facility 28 Orange NC Solar 9.46 Intermediate/Peak
Facility 29 Macon NC Wind 4.00 Intermediate/Peak
Facility 30 Orange NC Solar 10.00 Intermediate/Peak
Facility 31 Durham NC Other* 1600.00 Intermediate/Peak
Facility 32 Burlington NC Solar 4.52 Intermediate/Peak
Facility 33 Rutherford NC Hydroelectric 324.00 Baseload
Facility 34 Meclclenburg NC Solar 1.90 Intermediate/Peak
Facility 35 Cleveland NC Solar 10.00 Intermediate/Peak
Facility 36 Swain NC Solar 3.00 Intermediate/Peak
Facility 37 Guilford NC Solar 28.80 Intermediate/Peak
Facility 38 Charlotte NC Other* NA Intermediate/Peak
Facility 39 Alamance NC Solar 30.00 Intermediate/Peak
Facility 40 Mecklenburg NC Solar 30.00 Intermediate/Peak
Facility 41 Cleveland NC Solar 4000.00 Intermediate/Peak
Facility 42 NC Solar 3.25 Intermediate/Peak
Facility 43 Catawba NC Solar 4.00 Intermediate/Peak
Facility 44 Guilford NC Solar 3.85 Intermediate/Peak
Facility 45 Durham- NE NC Solar 2.21 Intermediate/Peak
Facility 46 Rockingham NC Solar 5.16 Intermediate/Peak
Facility 47 Durham NC Solar 124.00 Intermediate/Peak
Facility 48 Henderson NC Solar 9.00 Intermediate/Peak
Facility 49 Alamance NC Solar 40.85 Intermediate/Peak
Facility 50 Alamance NC Solar 20.43 Intermediate/Peak
Facility 51 Alamance NC Solar 0.74 Intermediate/Peak
Facility 52 Henderson NC Solar 9.80 Intermediate/Peak
Facility 53 Orange NC Solar 3.00 Intermediate/Peak
Facility 54 Cabarrus NC Solar 6.08 Intermediate/Peak
Facility 55 Mecklenburg NC Solar 2.45 Intermediate/Peak
Facility 56 Guilford NC Solar 4.00 Intermediate/Peak
113
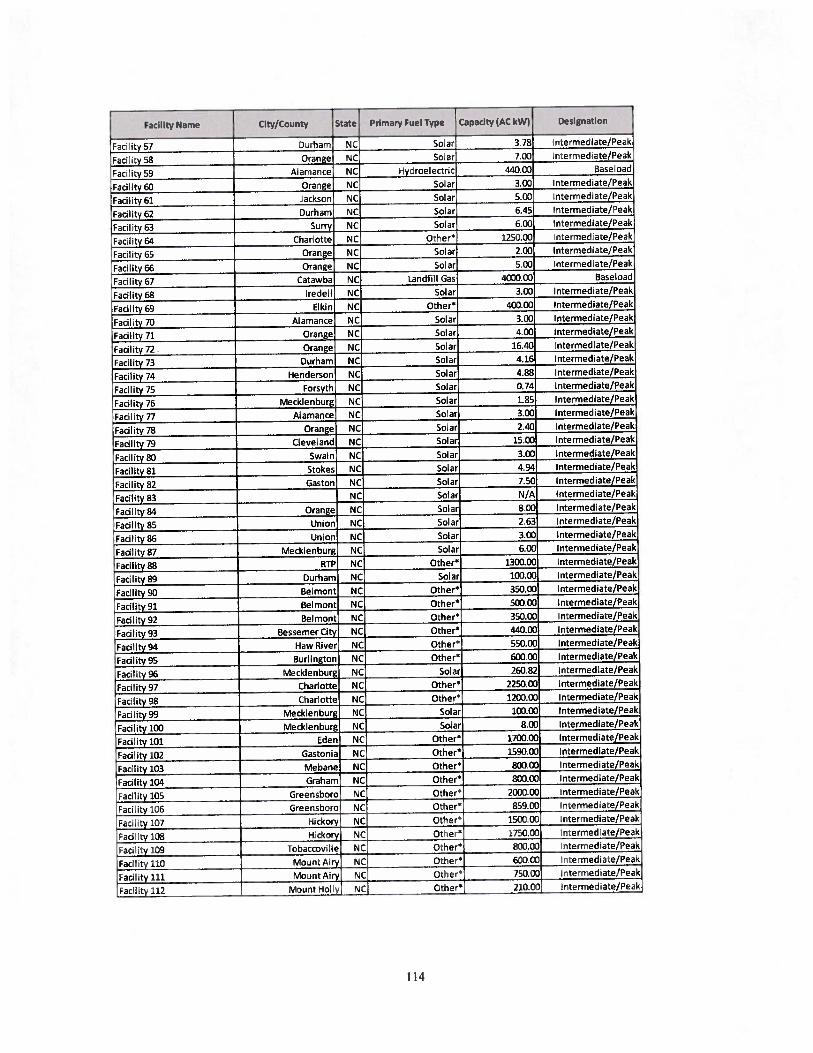
Facility Name City/County State Primary Fuel Type Capacity (AC kW) Designation
Facility 57 Durham NC Solar 378 Intermediate/Peak
Facility 53 Orange NC Solar 700 Intermediate/Peak
Facility 59 Alamance NC Hydroelectric 440.00 Saseload
Facility 60 Orange NC Solar 3.00 Intermediate/Peak
Facility 61 Jackson NC Solar 5.00 Intermediate/Peak
Facility 62 Ourham NC Solar 6.45 Intermediate/Peak
Facility 63 Surry NC Solar 6.00 Intermediate/Peak
Facility 64 Charlotte NC Other5 1250.00 Intermediate/Peak
Facility 65 Orange NC Solar 2.00 Intermediate/Peak
Facility 66 Orange NC Solar 5.00 Intermediate/Peak
Facility 67 Catawba NC Landfill Gas 4000.00 Baseload
Facility 68 Iredell NC Solar 3.00 Intermediate/Peak
Facility 69 Elkin NC Other5 400.00 Intermediate/Peak
Facility 70 Alamance NC Solar 3.00 Intermediate/Peak
Facility 71 Orange NC Solar 4.00 Intermediate/Peak
Facility 72 Orange NC Solar 16.40 Intermediate/Peak
Facility 73 Durham NC Solar 4.16 Intermediate/Peak
Facility 74 Henderson NC Solar 4.88 Intermediate/Peak
Facility 75 Forsyth NC Solar 0.74 Intermediate/Peak
Facility 76 Mecklenburg NC Solar 1.85 Intermediate/Peak
Facility 77 Alamance NC Solar 3.00 Intermediate/Peak
Facility 78 Orange NC Solar 2.40 Intermediate/Peak
Facility 79 Cleveland NC Solar 15.00 Intermediate/Peak
Facility 80 Swain NC Solar 3.00 Intermediate/Peak
Facility 81 Stokes NC Solar 4.94 Intermediate/Peak
Facility 82 Gaston NC Solar 7.50 Intermediate/Peak
Facility 83 NC Solar N/A Intermediate/Peak
Facility 84 Orange NC Solar 8.00 Intermediate/Peak
Facility 85 Union NC Solar 2.63 Intermediate/Peak
Facility 86 Union NC Solar 3.00 Intermediate/Peak
Facility 87 Mecklenburg NC Solar 6.00 Intermediate/Peak
Facility 88 RTP NC Other5 1300.00 Intermediate/Peak
Facility 89 Durham NC Solar 100.00 Intermediate/Peak
Facility 90 Belmont NC Other5 350.00 Intermediate/Peak
Facility 91 Belmont NC Other5 500.00 Intermediate/Peak
Facility 92 Belmont NC Other5 350.00 Intermediate/Peak
Facility 93 BessemerCitv NC Other* 440.00 Intermediate/Peak
Facility94 HawRiver NC Other* 550.00 Intermediate/Peak
Facility 95 Burlington NC Other* 600.00 Intermediate/Peak
Facility 96 Mecklenburg NC Solar 260.82 Intermediate/Peak
Facility 97 Charlotte NC Other* 2250.00 Intermediate/Peak
Facility 98 Charlotte NC Others 1200.00 Intermediate/Peak
Facility 99 Mecklenburg NC Solar 100.00 Intermediate/Peak
Facility 100 Mecklenburg NC Solar 8.00 Intermediate/Peak
Facility 101 Eden NC Other* 1700.00 Intermediate/Peak
Facility 102 Gastonia NC Other* 1590.00 Intermediate/Peak
Facility 103 Mebane NC Other* 800.00 Intermediate/Peak
Facility 104 Graham NC Others 800.00 Intermediate/Peak
Facility 103 Greensboro NC Others 2000.00 Intermediate/Peak
Facility 106 Greensboro NC Other* 859.00 Intermediate/Peak
Facility 107 Hickory NC Other* 1500.00 Intermediate/Peak
Facility 108 Hickory NC Others 1750.00 Intermediate/Peak
Facility 109 Tobaccoville NC Other* 800.00 Intermediate/Peak
Facility 110 Mount Airy NC Other 600.00 Intermediate/Peak
Facility 111 Mount Airy NC Other 750.00 Intermediate/Peak
Facility 112 Mount Holly NC Other* 210.00 Intermediate/Peak
114
Facility Name City/County State Primary Fuel Type Capacity (AC kW) Designation
Facility 113 Guilford NC Solar 4.00 Intermediate/Peak
Facility 114 Cleveland NC Solar 0.86 Intermediate/Peak
Facility 115 Durham NC Solar 30.00 Intermediate/Peak
Facility 116 Durham NC Wind 3.00 Intermediate/Peak
Facility 117 Rutherford NC Hydroelectric 1600.00 Baseload
Facility 118 Surry NC Landfill Gas 1600.00 Baseload
Facility 119 Charlotte NC Other* 420.00 Intermediate/Peak
Facility 120 Rockingham NC Solar 169.00 Intermediate/Peak
Facility 121 Davie NC Solar 10.00 Intermediate/Peak
Facility 122 Cabarrus NC Landfill Gas 11500.00 Baseload
Facility 123 Henderson NC Solar 10.00 Intermediate/Peak
Facility 124 orange NC Solar 9.90 Intermediate/Peak
Facility 125 Orange NC Solar 3.01 Intermediate/Peak
Facility 126 Forsyth NC Solar 2.82 Intermediate/Peak
Facility 127 Rowan NC Solar 5.76 Intermediate/Peak
Facility 128 Orange NC Solar 4.00 Intermediate/Peak
Facility 129 Wake NC Solar 7.60 Intermediate/Peak
Facility 130 Wake NC Solar 6.08 Intermediate/Peak
Facility 131 Forsyth NC Solar 1.72 Intermediate/Peak
Facility 132 Durham NC Solar 3.44 Intermediate/Peak
Facility 133 Durham NC Solar 2.28 Intermediate/Peak
Facility 134 Catawba NC Solar 2.58 Intermediate/Peak
Facility 135 Henderson NC Solar 4.94 Intermediate/Peak
Facility 136 Gaston NC Solar 3.00 Intermediate/Peak
Facility 137 Orange NC Solar 3.60 Intermediate/Peak
Facility 138 Stokes NC Solar 1.44 Intermediate/Peak
Facility 139 Durham NC Solar 4.00 Intermediate/Peak
Facility 140 Iredell NC Solar 4.58 Intermediate/Peak
Facility 141 Transylvania NC Solar 5.16 Intermediate/Peak
Facility 142 Henderson NC Wind 1.20 Intermediate/Peak
Facility 143 Guilford NC Solar 6.02 Intermediate/Peak
Facility 144 Rowan NC Solar 4.30 Intermediate/Peak
Facility 145 Stokes NC Solar 3.60 Intermediate/Peak
Facility 146 Mecklenburg NC Solar 1.12 Intermediate/Peak
Facility 147 Cleveland NC Solar 5.16 Intermediate/Peak
Facility 14.8 Forsyth NC Solar 2.58 Intermediate/Peak
Facility 149 Caldwell NC Solar 6.00 Intermediate/Peak
Facility 150 Cleveland NC Solar 2.28 Intermediate/Peak
Facility 151 Orange NC Solar 7.60 Intermediate/Peak
Facility 152 Mecklenburg NC Solar 0.70 Intermediate/Peak
Facility 153 Rowan NC Solar 6.00 Intermediate/Peak
Facility 154 Rowan NC Wind 1.00 Intermediate/Peak
Facility 155 Jackson NC Solar 5.46 Intermediate/Peak
Facility 156 Union NC Solar 3.50 Intermediate/Peak
Facility 157 Henderson NC Solar 3.00 Intermediate/Peak
Facility 158 Orange NC Solar 2.50 Intermediate/Peak
Facility 159 Mecklenburg NC Solar 94.08 Intermediate/Peak
Facility 160 Davidson NC Landfill Gas 1600.00 Baseload
Facility 161 Lexington NC Others 300.00 Intermediate/Peak
Facility 162 Lexington NC Other* 750.00 Intermediate/Peak
Facility 163 Forsyth NC Solar 0.70 Intermediate/Peak
Facility 164 Guilford NC Solar 72.00 Intermediate/Peak
Facility 165 Durham NC Solar 2.50 Intermediate/Peak
Facility 166 Mecklenburg NC Solar 30.00 Intermediate/Peak
Facility 167 Rowan NC Solar 4.00 Intermediate/Peak
Facility 168 Durham NC Solar 30.00 Intermediate/Peak
115

FacilityName City/County State PrimaryFuelType Capacity(ACkW) Designation
Facility 169 Jackson NC Solar 3.60 Intermediate/PeakFacility 170 GuHford NC Solar 6.72 Intermediate/PeakFacility 171 Cabarrus NC Solar 3.44 Intermediate/PeakFacility 172 Jackson NC Solar 4.41 Intermediate/PeakFacility 173 Wilkes NC Solar 2.76 Intermediate/PeakFacility 174 Forsyth NC Solar 2.23 Intermediate/PeakFacility 175 Mecklenburg NC Solar 2.15 Intermediate/PeakFacility 176 Rockingharn NC - Solar 5000.00 Intermediate/PeakFacility 177 Orange NC Solar 3.87 Intermediate/PeakFacility 178 Mecklenburg NC Solar 5.00 Intermediate/PeakFacility 179 Cleveland NC Solar 4000.00 Intermediate/PeakFacility 180 NC Solar 4.30 Intermediate/PeakFacility 181 Mecklenburg NC Solar 4.00 Intermediate/PeakFacility 182 Guilford NC Solar 2.58 Intermediate/PeakFacility 183 Iredell NC Solar 6.02 Intermediate/PeakFacility 184 Macon NC Solar 4.50 Intermediate/PeakFacility 185 Alexander NC Solar 0.70 Intermediate/PeakFacility 186 Orange NC Solar 3.00 Intermediate/PeakFacility 187 Rockingham NC Solar 1.60 Intermediate/PeakFacility 188 Burke NC Solar 3.00 Intermediate/PeakFacility 189 Alamance NC Solar 3.00 Intermediate/PeakFacility 190 Catawba NC Solar 2.50 Intermediate/PeakFacility 191 Polk NC Solar 3.60 Intermediate/PeakFacility 192 Rockingham NC Solar 3.87 Intermediate/PeakFacility 193 Guilford NC Solar 3.00 Intermediate/PeakFacility 194 Forsyth NC Solar 10.56 Intermediate/PeakFacility 195 Durham NC Other* 5500.00 Intermediate/PeakFacility 196 Durham NC Other* 13400.00 Intermediate/PeakFacility 197 Durham NC Other* 2250.00 Intermediate/Peak
Facility 198 Orange NC Solar 10.68 Intermediate/Peak
Facility 199 Davidson NC Engine Dynamometer N/A Intermediate/PeakFacility 200 Cherokee NC Solar 13.72 Intermediate/PeakFacility 201 NC Solar 5.16 Intermediate/PeakFacility 202 Orange NC Solar 4.00 Intermediate/PeakFacility 203 Macon NC Solar 8.60 Intermediate/PeakFacility 204 Orange NC Solar 6.00 Intermediate/PeakFacility 205 Mecklenburg NC Solar 3.00 Intermediate/PeakFacility 206 Mecklenburg NC Solar 4.00 Intermediate/PeakFacility 207 Orange NC Solar 3.00 Intermediate/PeakFacility 208 Orange NC Solar 3.00 Intermediate/PeakFacility 209 Durham NC Solar 4.00 Intermediate/PeakFacility 210 Mecklenburg NC Solar 4.58 Intermediate/PeakFacility 211 Alamance NC Solar 5.00 Intermediate/PeakFacility 212 Guilford NC Solar 4.80 Intermediate/PeakFacility 213 McDowell NC Solar 18.00 Intermediate/Peal’Facility 214 Caldwell NC Solar 1.40 Intermediate/PeakFacility 215 Durham NC Solar 75.00 Intermediate/PeakFacility 216 Durham NC Solar 52.90 Intermediate/Peal’Facility 217 NC Solar 50.00 Intermediate/PeakFacility 218 Durham NC Solar 30.00 Intermediate/PeakFacility 219 Monroe NC Other* 400.00 Intermediate/PeakFacility 220 Union NC Solar 4.00 Intermediate/PeakFacility 221 Durham NC Solar 2.16 Intermediate/PeakFacility 222 Guilford NC Solar 5.00 Intermediate/PeakFacility 223 Durham NC Solar 5.00 Intermediate/PeakFacility 224 Wake NC Solar 2.82 Intermediate/Peak
116
Facility Name City/County State Primary Fuel Type Capacity (AC kW) Designation
Facility 225 Henderson NC Solar - 4.90 Intermediate/Peak
Facty 226 Mecklenburg NC Solar 2.85 Intermediate/Peak
Facility 227 Charlotte NC 0ther 10000.00 Intermediate/Peak
Facility 228 Guilford NC Solar 14.40 Intermediate/Peak
Facilty 229 Forsyth NC So ar 2.38 Intermediate/Peak
Facity 230 McDowell NC Solar 4.00 Intermediate/Peak
Facility 231 Alamance NC Solar 2.70 Intermediate/Peak
Facility 232 Charlotte NC Other* 300.00 Intermediate/Peak
Facility 233 Burke NC Solar 24.00 Intermediate/Peak
Facility 234 Winston-Salem NC Other* 1800.00 Intermediate/Peak
Facility 235 Forsyth NC Solar 2.30 Intermediate/Peak
Faclity 236 Catawba NC Solar 4.50 Intermediate/Peak
Facility 237 Mecklenburg NC Solar 11.77 Intermediate/Peak
Facility 238 Orange NC Solar 5.00 Intermediate/Peak
Faculty 239 Orange NC Solar 5.00 Intermediate/Peak
Facility 240 Rowan NC Solar 82.00 Intermediate/Peak
Facility 241 Mecklenburg NC Solar 8.00 Intermediate/Peak
Facility 242 Henderson NC Solar 5.00 Intermediate/Peak
Facility 243 Guilford NC Solar 1.75 Intermediate/Peak
Facility 244 Transylvania NC Solar 2.80 Intermediate/Peak
Facility 245 Polk NC Solar 3.00 Intermediate/Peak
FacIlity 246 Surrv NC Solar 10.00 Intermediate/Peak
Facility 247 Jackson NC Solar 2.58 Intermediate/Peak
Facility 24.8 Cabarrus NC Landfill Gas 5000.00 Baseload
Facility 249 Gaston NC Landfill Gas 4800.00 Baseload
Facility 250 Guilford NC Solar 2.16 Intermediate/Peak
Facility 251 Durham NC Solar 700.00 Intermediate/Peak
Facility 252 Greensboro NC Other* 125.00 Intermediate/Peak
Facility 253 Guilford NC Solar 0.86 Intermediate/Peak
Facility 254 Orange NC Solar 6.00 Intermediate/Peak
Facility 255 Burke NC Solar 6.00 Intermediate/Peak
Facility 256 Henderson NC Solar 2.82 Intermediate/Peak
Faclity 257 Cabarrus NC Solar 4.30 Intermediate/Peak
Facility 258 Polk NC Solar 2.14 Intermediate/Peak
Facility 259 Mecklenburg NC Solar 1.96 Intermediate/Peak
Facility 260 Wilkes NC Solar 2.58 Intermediate/Peak
Facility 261 Swain NC Solar 7.00 Intermediate/Peak
Facility 262 McDowell NC Solar 2.50 Intermediate/Peak
Facility 263 Guilford NC Solar 4.16 Intermediate/Peak
Facility 264 Orange NC Solar 1.64 Intermediate/Peak
Facility 255 Durham NC Solar 307.43 Intermediate/Peak
Facility 266 Catawba NC Solar 1.40 Intermediate/Peak
IFacility 267 Mecklenburg NC Soar 1.72 Intermediate/Peak
Facility 268 Polk NC Solar 2.15 Intermediate/Peak
Facility 269 Guilford NC Solar 50.00 Intermediate/Peak
Facility 270 Macon NC Solar 4.30 Intermediate/Peak
Facility 271 Lincoln NC Solar 0.70 Intermediate/Peak
Facility 272 Cabarrus NC Solar 3.01 Intermediate/Peak
Facility 273 Forsyth NC Solar 8.00 Intermediate/Peak
Facility 274 Rutherford NC Solar 2.58 Intermediate/Peak
Facility 275 Orange NC Solar 4.20 Intermediate/Peak
Facility 276 Orange NC Solar 3.15 Intermediate/Peak
Facility 277 Alexander NC Hydroelectric 365.00 Baseload
Facility 278 Forsyth NC Solar 14.80 Intermediate/Peak
Facility 279 Gaston NC Hydroelectric 820.00 Baseload
Facility 280 Guilford NC Solar 7.50 Intermediate/Peak
117

Facility Name City/County State Primary Fuel Type Capacity (AC kW) Designation
Facility 281 Wilkes NC Solar 4.00 Intermediate/Peak
Facility 282 Cabarrus NC Solar 5.20 Intermediate/Peak
Facility 283 Alamance NC Hydroelectric 1500.00 Baseload
Facility 284 Alamance NC Solar 2.00 Intermediate/Peak
Facility 285 Durham NC Solar 3.01 Intermediate/Peak
Facility 286 Orange NC Solar 3.30 Intermediate/Peak
Facility 287 Orange NC Solar 7.00 Intermediate/Peak
Facility 288 Mecklenburg NC Engine Dynamometer N/A Intermediate/Peak
Facility 289 Guilford NC Solar 108.00 Intermediate/Peak
Facility 290 Mecklenburg NC Solar 2.15 Intermediate/Peak
Facility 291 Davidson NC Solar 1.29 Intermediate/Peak
Facility 292 Durham NC Solar 3.00 Intermediate/Peak
Facility 293 Alamance NC Solar 4.00 Intermediate/Peak
Facility 294 Lincoln NC Solar 2.15 Intermediate/Peak
Facility 295 Orange NC Solar 3.00 Intermediate/Peak
Facility 296 Research Triangle Park NC Other* 10900.00 Intermediate/Peak
Facility 297 Mecklenburp NC Solar 790.00 Intermediate/Peak
Facility 298 Mecklenburg NC Solar 3.60 Intermediate/Peak
Facility 299 Hickory NC Other* 1040.00 Intermediate/Peak
Facility 300 Rockingham NC Hydroelectric 500.00 Baseload
Facility 301 Lincoln NC Solar 10.00 Intermediate/Peak
Facility 302 Henderson NC Solar 6.00 Intermediate/Peak
Facility 303 Henderson NC Solar 6.00 Intermediate/Peak
Facility 304 Orange NC Solar 9.17 Intermediate/Peak
Facility 305 Orange NC Solar 5.00 Intermediate/Peak
Facility 306 Mecklenburg NC Solar 5.00 Intermediate/Peak
Facility 307 Polk NC Solar 5.16 Intermediate/Peak
Facility 308 Surrv NC Solar 12.26 Intermediate/Peak
Facility 309 Mecklenburg NC Solar 4.00 Intermediate/Peak
Facility 310 Durham NC Solar 3.60 Intermediate/Peak
Facility 311 Mecklenburg NC Solar 4.00 Intermediate/Peak
Facility 312 Guilford NC Solar 2.50 Intermediate/Peak
Facility 313 Macon NC Solar 3.00 Intermediate/Peak
Facility 314 Mecklenburg NC Solar 1.75 Intermediate/Peak
Facility 315 Stokes NC Solar 2.58 Intermediate/Peak
Facility 316 Polk NC Solar 6.65 Intermediate/Peak
Facility 317 Alamance NC Solar 2.00 Intermediate/Peak
Facility 318 Alamance NC Solar 4.90 Intermediate/Peak
Facility 319 Durham NC Solar 2.21 Intermediate/Peak
Facility 320 Mecklenburg NC Solar 1.40 Intermediate/Peak
Facility 321 Rockingham NC Solar 0.76 Intermediate/Peak
Facility 322 Rockingham NC Solar 90.00 Intermediate/Peak
Facility 323 Jackson NC Solar 2.58 Intermediate/Peak
Facility 324 Rutherford NC Solar 4.18 Intermediate/Peak
Facility 325 Durham- NE NC Solar 2.21 Intermediate/Peak
Facility 326 Iredell NC Solar 7.96 Intermediate/Peak
Facility 327 Wilkes NC Solar 4.20 Intermediate/Peak
Facility 328 Transylvania NC Solar 0.70 Intermediate/Peak
Facility 329 Henderson NC Solar 4.00 Intermediate/Peak
Facility 330 Durham NC Solar 2.48 Intermediate/Peak
Facility 331 Durham NC Solar 1.25 Intermediate/Peak
Facility 332 NC Solar 3.23 Intermediate/Peak
Facility 333 Orange NC Solar 6.45 Intermediate/Peak
Facility 334 NC Solar 3.60 Intermediate/Peak
Facility 335 Alamance NC Solar 2.00 Intermediate/Peak
Facility 336 Jackson NC Solar 3.00 Intermediate/Peak
118
Facility Name City/County State Primary Fuel Type Capacity (AC kW) Designation
Facility 337 Orange NC Solar 4.00 Intermediate/PeakFacility 338 Durham NC Solar 3.00 Intermedate/PeakFacility 339 NC Solar 2.58 Intermediate/PeakFacility 340 Alamance NC Solar 324 Intermediate/PeakFacility 341 Rowan NC Solar 4.00 lntermedate/PeakFacility 342 Cherokee NC Solar 7.60 Intermediate/PeakFacility 343 Forsyth NC Solar 3.99 Intermediate/PeakFacility 344 Wake NC Solar 2.50 Intermediate/PeakFacility 345 Cabarrus NC Solar 9.80 Intermediate/PeakFacility 346 Henderson NC Solar 4.00 Intermediate/PeakFacility 347 Guilford NC Solar 4.00 Intermediate/PeakFacility 348 Orange NC Solar 9,80 Intermediate/PeakFac ity 349 Orange NC Solar 4.00 Intermediate/PeakFacilty 350 Yadkin NC Solar 4.00 Intermediate/PeakFacility 351 Cleveland NC Wind 1.20 Intermediate/PeakFacility 352 Durham NC Solar 3.60 Intermediate/PeakFacility 353 Mecklenburg NC Solar 3.04 Intermediate/PeakFacility 354 Durham NC Solar 3.44 Intermediate/Peal’Facility 355 Alamance NC Solar 2.00 Intermediate/PeakFacility 356 Durham NC Solar 2.82 Intermediate/PeakFacility 357 Randolph NC Solar 2.00 Intermediate/PeakFacility 358 Gui’ford NC Solar 2.00 Intermediate/PeakFacility 359 Forsyth NC Solar 2.85 Intermediate/PeakFacility 360 Henderson NC Solar 6.45 Intermediate/PeakFacility 361 Forsyth NC Solar 2.85 Intermediate/PeakFacility 362 Henderson NC Solar 10.00 Intermediate/PeakFacility 363 Orange NC Solar 7.80 Intermediate/PeakFacility 364 Polk NC Solar 4.32 Intermediate/PeakFacility 365 Henderson NC Solar 7.31 Intermediate/PeakFacility 366 Union NC Solar 3.00 Intermediate/PeakFacility 367 Henderson NC Solar 2.58 Intermediate/PeakFacility 368 Iredell NC Solar 3.3 Intermediate/PeakFacility 369 Forsyth NC Solar 6.ct Intermediate/PeakFacility 370 Cabarrus NC Solar 4.30 Intermediate/PeakFacility 371 Cabarrus NC Solar 9.00 Intermediate/PeakFacility 372 Wilkes NC Solar 4.73 Intermediate/PeakFacility 373 Catawba NC Solar 15.20 Intermediate/PeakFacility 374 Catawba NC Solar 6.00 Intermediate/PeakFacility 375 Durham NC Solar 6.00 Intermediate/PeakFacility 376 McDowell NC Solar 0.76 Intermediate/PeakFacility377 Forsyth NC Solar 5.00 Intermediate/PeakFacility 378 Rutherfordton NC Solar 0.86 Intermediate/PeakFaciity 379 Stokes NC Solar 4.30 Intermediate/PeakFachity 380 Mecklenburg NC Solar 5.00 Intermediate/PeakFacility 381 Orange NC Solar 1.20 Intermediate/PeakFacility 382 Henderson NC Solar 2.28 Intermediate/PeakFacility 383 Rockingham NC Solar 4.30 Intermediate/PeakFacility 384 Burke NC Solar 2.00 Intermediate/PeakFacility 383 orange NC Solar 2.58 Intermediate/PeakFacility 386 McDowell NC Solar 3.00 Intermediate/PeakFacility 387 Stokes NC Solar 5. Intermediate/PeakFacility 388 Durham NC Solar 3.25 Intermediate/Peal’Facility 389 Orange NC Solar 2.00 Intermediate/PeakFacility 390 Macon NC Solar 1.44 Intermediate/PeakFacility 391 Macon NC Wind 1.00 Intermediate/PeakFacility 392 lredell NC Solar 4.00 Intermediate/Peak
119
Facility Name City/County State Primary Fuel Type Capacity (AC kW) Designation
Facility 393 Surry NC Solar 4.60 !nterrnedate/Peak
Facility 394 Hickory NC Other 500.00 Intermediate/PeakFacility 395 Mecklenburg NC Solar 9.00 Intermediate/Peak
Facility 396 Charlotte NC Other* 200.00 Intermediate/Peak
Facility 397 Durham NC Other* 1000.00 Intermediate/Peak
Facility 398 Cherokee NC Solar 3.01 Intermediate/Peak
Facility 399 McDowell NC Solar 3.57 Intermediate/Peak
Facility400 Burke NC Solar 2.58 Intermediate/Peak
Facility 401 Durham NC Solar 2.50 Intermediate/Peak
Facility 402 Durham NC Solar 7.00 Intermediate/Peak
Facility 403 Guilford NC Solar 3.68 Intermediate/PeakFacility4o4 Rowan NC Solar 2.00 Intermediate/Peak
Facility4os Durham NC Solar 4.00 Intermediate/PeakFaci!ity4O6 Forsyth NC Solar 4.20 Intermediate/Peak
Facility 407 Guilford NC Solar 35.48 Intermediate/Peak
Facility 408 Alexander NC Solar 1.94 Intermediate/Peak
Facility 409 Wake NC Solar 6.87 Intermediate/PeakFacility 410 Forsyth NC Solar 6.00 Intermediate/Peak
Facility 411 Gullford NC Solar 4.91 Intermediate/PeakFacility 412 Mecklenburg NC Solar 3.50 Intermediate/Peak
Facility 413 Henderson NC Hydroelectric 6.00 BaseloariFacility 414 Wilkesboro NC Other* 600.00 Intermediate/PeakFacility 415 Durham NC Solar 3.84 Intermediate/PeakFacility 416 Henderson NC Solar 2.50 Intermediate/Peak
Facility 417 Forsyth NC Solar 2.58 Intermediate/PeakFacility 418 Cleveland NC Solar 135.00 Intermediate/PeakFacility4l9 Durham NC Solar 2.15 Intermediate/PeakFacility 420 Orange NC Solar 3.60 Intermediate/PeakFacility 421 Alamance NC Solar 2.10 Intermediate/PeakFacility 422 Mecklenburg NC Solar 6.75 Intermediate/PeakFacility 423 Orange NC Solar 5.00 Intermediate/PeekFacility 424 Orange NC Solar 2.40 Intermediate/PeakFacility 425 Orange NC Solar 5.56 Intermediate/PeakFacility 426 Rowan NC Solar 1.70 Intermediate/PeeFacility 427 Union NC Solar 2.94 Intermediate/Peak
Facility 428 Guilforcl NC Solar 3.00 Intermediate/Peak
Facility 429 Davie NC Solar 7.85 Intermediate/PeakFacility 430 Orange NC Solar 4.00 Intermediate/PeakFacility 431 Durham NC Solar 5.16 Intermediate/PeakFacility 432 Guilford NC Solar 4.00 Intermediate/PeakFacility 433 Durham NC Solar 3.00 Intermediate/PeakFacility 434 Davidson NC Solar 3.45 Intermediate/PeakFacility 435 Mecklenburg NC Solar 2.58 Intermediate/PeaFacility 436 Orange NC Solar 4.00 Intermediate/PeaFacility 437 Cleveland NC Solar 4.70 Intermediate/PeaFacility438 Mecklenburg NC Solar 3.50 Intermediate/PeakFacility 439 Mecklenburg NC Solar 4.00 Intermediate/PeakFacility 440 Iredell NC Solar 60.00 Intermediate/PeakFacility 441 Wake NC Solar 2.21 Intermediate/PeakFacility 442 Randolph NC Solar 2.58 Intermediate/PeakFacility 443 Alamance NC Solar 2.40 Intermediate/PeakFacility 444 Forsyth NC Solar 3.15 Intermediate/PeakFacility 445 Henderson NC Solar 2.70 Intermediate/PeakFacility 446 Wake NC Solar 2.21 Intermediate/PeakFacility 447 Orange NC Solar 5.16 Intermediate/PeakFacility 448 Mecklenburg NC Solar 3.15 Intermediate/Peak
120

Facility Name City/County State Primary Fuel Type Capacity (AC kW) Designation
Facility44g Mecklenburg NC Solar 3.44 Intermediate/Peak
Facility 450 Mecklenburg NC Solar 0.70 Intermediate/Peak
Facility45l Surry NC Solar 1000.00 Intermediate/Peak
Facility 452 Rockingham NC Hydroelectric 1275.00 Baseload
Facility 453 Rockingham NC Hydroelectric 951.00 Baseload
Facility 454 Marion NC Other* 650.00 Intermediate/Peak
Facility455 Hickory NC Olher* 500.00 Intermediate/Peak
Facility 456 Catawba NC Solar 8.17 Intermediate/Peak
Facilty 457 Mecklenburg NC Solar 49.00 Intermediate/Peak
bFaciiity4s8 Charlotte NC Other* 2200.00 Intermediate/Peak
Facility 459 Mecklenburg NC Solar 12.00 Intermediate/Peak
Facility 460 Hendersonville NC Other* 1000.00 Intermediate/Peak
Facility 461 Cabarrus NC Solar 4.00 Intermediate/Peak
Facility 462 Concord NC Other* 2950.00 Intermediate/Peak
Facility 463 Rutherford NC Solar 1.96 Intermediate/Peak
Facility 464 Mecklenburg NC Solar 5.76 Intermediate/Peak
Facility 465 Orange NC Solar 1.32 Intermediate/Peak
Facility 466 Yadkin NC Solar 7.80 Intermediate/Peak
Facility 467 Yadkin NC Solar 7.10 Intermediate/Peak
Facility 468 Mecklenburg NC Solar 1.89 Intermediate/Peak
Facility 469 Jackson NC Solar 2.76 Intermediate/Peak
Facility47o Yadkin NC Solar 6.00 Intermediate/Peak
Facility47l Rutherford NC Solar 1.94 Intermediate/Peak
Facility 472 Iredell NC Solar 2.80 Intermediate/Peak
Facility 473 Davidson NC Solar 4.32 Intermediate/Peak
Facility474 Durham NC Solar 3.23 Intermediate/Peak
Facility475 Gaston NC Hydroelectric 1800.00 Baseload
Facility476 Davie NC Solar 5000(X) Intermediate/Peak
Facility 477 Durham NC Solar 3.00 Intermediate/Peak
Facility 478 Stokes NC Solar 4.00 Intermediate/Peak
Facility479 Greensboro NC Other 700.00 Intermediate/Peak
Facility 480 Greensboro NC Other* 2500.00 intermediate/Peak
Facility4sl Greensboro NC Other* 1280.00 Intermediate/Peak
Facility 482 Durham NC Landfill Gas 3180.00 Baseload
Facility483 Mecklenburg NC Solar 4.80 Intermediate/Peak
Facility 484 Durham NC Solar 2.58 Intermediate/Peak
Facility 485 Mecklenburg NC Solar 4.00 Intermediate/Peak
Facility 486 Catawba NC Solar 5.00 Intermediate/Peak
Facility 487 Gaston NC Solar 635.00 Intermediate/Peak
Facility48R Mecklenburg NC Solar 30.00 Intermediate/Peak
Facility 489 Winston-Salem NC Other* 400.00 Intermediate/Peak
Facility 490 Durham NC Solar 28.00 Intermediate/Peak
Facility 491 Concord NC Other* 680.00 Intermediate/Peak
Facility 492 Butner NC Other* 1250.00 Intermediate/Peak
Facility 493 Morganton NC Other* 200.00 Intermediate/Peak
Facility 494 Catawba NC Solar 135,00 Intermediate/Peak
Facility 495 Orange NC Solar 3.60 Intermediate/Peak
Facility 496 Union NC Solar 2.63 Intermediate/Peak
Facility497 Cabarrus NC Solar 4.00 Intermediate/Peak
Facility 498 Rowan NC Solar 10.00 Intermediate/Peak
Facility 499 Polk NC Hydroelectric 5500.00 Baseload
Facility 500 Alamance NC Solar 221.76 Intermediate/Peak
Facility 501 Orange NC Solar 18.48 Intermediate/Peak
Facility 502 Orange NC Solar 18.48 Intermediate/Peak
Facility 503 Davidson NC Solar 1500.00 Intermediate/Peak
Facility 504 Mecklenburg NC Solar 8.40 Intermediate/Peak
121
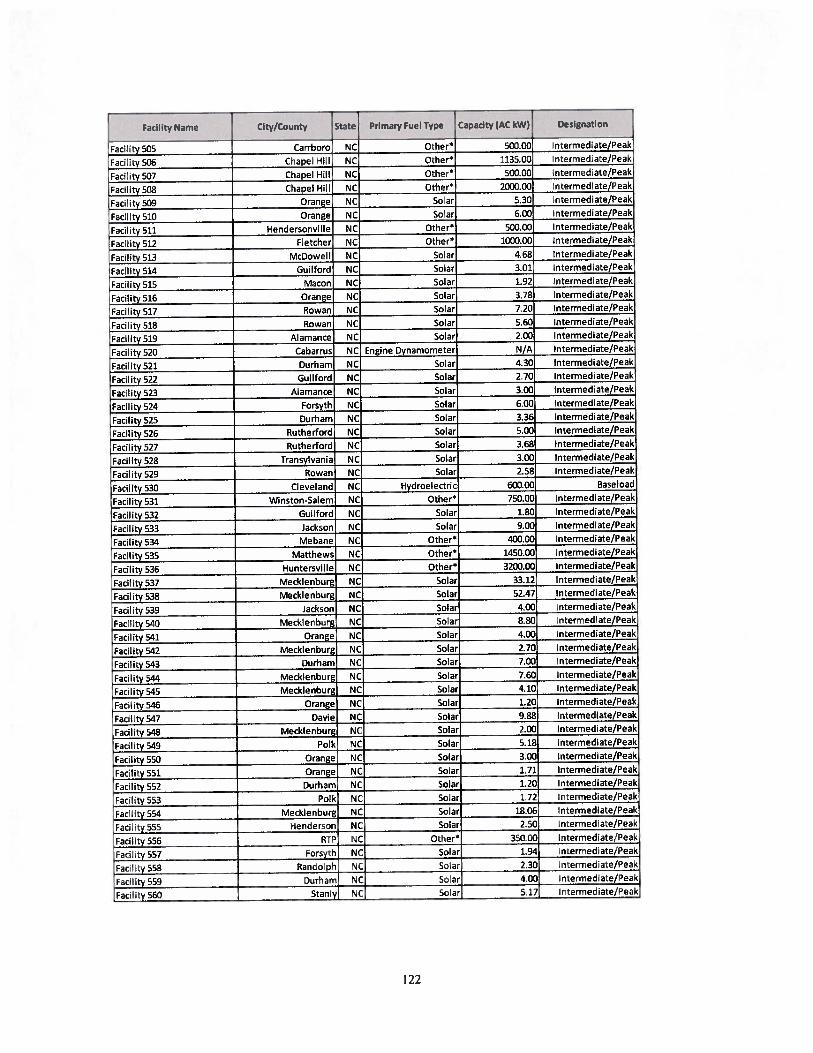
Facility Name City/County State Primary Fuel Type Capacity (Ac kW) Designation
Facility 505 Carrboro NC Other* 500.00 Intermediate/Peak
Facility 506 Chapel Hill NC Other* 1135.00 nterieda:e/Peak
Facility 507 Chapel Hill NC Other* 500.00 .ntermediate/Peak
Facility 508 Chapel Hill NC Other* 2000.00 Intermediate/Peak
Facility 509 Orange NC Solar 5.30 Intermediate/Peak
Facility 510 Orange NC Solar 6.00 Intermediate/Peak
Facility 511 Hendersonville NC Other* 500.00 Intermediate/Peak
Facility 512 Fletcher NC Other* 1000.00 Intermediate/Peak
Facility 513 McDowell NC Solar 4.68 Intermediate/Peak
Facility 514 Guilford NC Solar 3.01 Intermediate/Peak
Facility 515 Macon NC Solar 1.92 Intermediate/Peak
Facility 516 Orange NC Solar 3.78 Intermediate/Peak
Facility 517 Rowan NC Solar 7.20 Intermediate/Peak
Facility 518 Rowan NC Solar 5.60 Intermediate/Peak
Facility 519 Alarriance NC Solar 2.00 Intermediate/Peak
Facility 520 Cabarrus NC Engine Dynamometer N/A Intermediate/Peak
Facility 521 Durham NC Solar 4.30 Intermediate/Peak
Facility 522 Guilford NC Solar 2.70 Intermediate/Peak
Facility 523 Alamance NC Solar 3.00 Intermediate/Peak
Facility 524 Forsyth NC Solar 6.00 Intermediate/Peak
Facility 525 Durham NC Solar 3.36 Intermediate/Peak
Facility 526 Rutherford NC Solar 5.00 Intermediate/Peak
Facility 527 Rutherford NC Solar 3.68 Intermediate/Peak
Facility 528 Transylvania NC Solar 3.00 Intermediate/Peak
Facility 529 Rowan NC Solar 2.58 Intermediate/Peak
Facility 530 Cleveland NC Hydroelectric 600.00 Baseload
Facility 531 Winston-Salem NC Other* 750.00 Intermediate/Peak
Facility 532 Guilford NC Solar 1.80 Intermediate/Peak
Facility 533 Jackson NC Solar 9.00 Intermediate/Peak
Facility 534 Mebane NC Other* 400.00 Intermediate/Peak
Facility 535 Matthews NC Other* 1450.00 Intermediate/Peak
Facility 536 Huntersville NC Others 3200.00 Intermediate/Peak
Facility 537 Mecklenburg NC Solar 33.12 Intermediate/Peak
Facility 538 Mecklenburg NC Solar 52.47 Intermediate/Peak
Facility 539 Jackson NC Solar 4.00 Intermediate/Peak
Facility 540 Mecklenburg NC Solar 8.80 Intermediate/Peak
Facility 541 Orange NC Solar 4.00 Intermediate/Peak
Facility 542 Mecklenburg NC Solar 2.70 Intermediate/Peak
Facility 543 Durham NC Solar 7.00 Intermediate/Peak
Facility 544 Mecklenburg NC Solar 7.60 Intermediate/Peak
Facility 545 Mecklenburg NC Solar 4.10 Intermediate/Peak
Facility 546 Orange NC Solar 1.20 Intermediate/Peak
Facility 547 Davie NC Solar 9.88 Intermediate/Peak
Facility 548 Mecklenburg NC Solar 2.00 Intermediate/Peak
Facility 549 Polk NC Solar 5.18 Intermediate/Peak
Facility 550 Orange NC Solar 3.00 Intermediate/Peak
Facility 551 Orange NC Solar 1.71 Intermediate/Peak
Facility 552 Durham NC Solar 1.20 Intermediate/Peak
Facility 553 Polk NC Solar 1.72 Intermediate/Peak
Facility 554 Mecklenburg NC Solar 18.06 Intermediate/Peak
Facility 555 Henderson NC Solar 250 Intermediate/Peak
Facility 556 RTP NC Other* 350.00 Intermediate/Peak
Facility 557 Forsyth NC Solar 1.94 Intermediate/Peak
Facility 558 Randolph NC Solar 2.30 Intermediate/Peak
Facility 559 Durham NC Solar 4.00 Intermediate/Peak
Facility 500 Stanly NC Solar 5.17 Intermediate/Peak
122
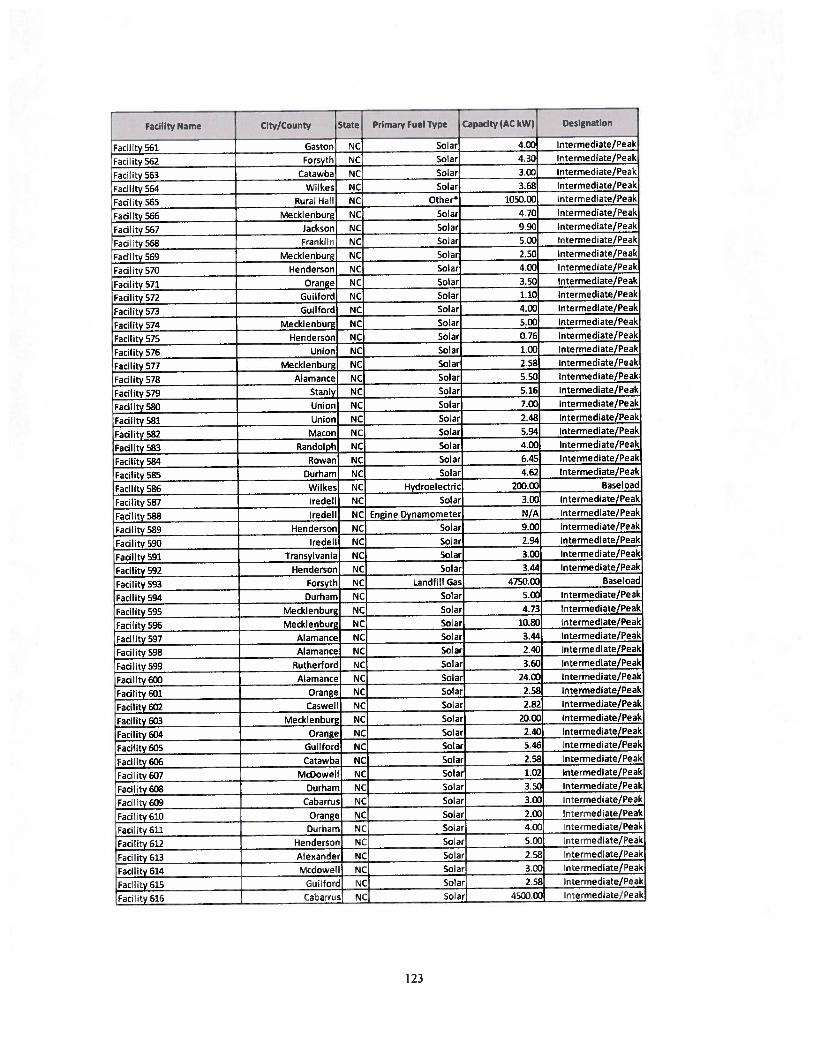
Facility Name City/County State Primary Fuel Type Capacity (AC kW) Designation
Facility 561 Gaston NC Solar 4.00 Intermediate/Peak
Fac6ity 562 Forsyth NC Solar 430 Intermediate/Peak
Facility 563 Catawba NC Solar 300 Intermediate/Peak
Facility 564 Wilkes NC Solar 3.68 Intermediate/Peak
Facility 365 Rural Hall NC Other* 105000 Intermediate/Peak
Facility 566 Mecklenburg NC Solar 4.70 Intermediate/Peak
Facility 567 Jackson NC Solar 9.90 Intermediate/Peak
Facility 568 Franklin NC Solar 5.00 Intermediate/Peak
Facility 569 Mecklenburg NC Solar 2.50 Intermediate/Peak
Facility 570 Henderson NC Solar 4.00 Intermediate/Peak
Facility 571 orange NC Solar ISO Intermediate/Peak
Facility 572 Guilford NC Solar 1.10 Intermediate/Peak
Facility 573 Guilford NC Solar 4.00 Intermediate/Peak
Facility 574 Mecklenburg NC Solar 500 Intermediate/Peak
Facility 575 Henderson NC Solar 0.76 Intermediate/Peak
Facility 576 Union NC Solar 1.00 Intermediate/Peak
Facility 577 Mecklenburg NC Solar 2.58 Intermediate/Peak
Facility 578 Alamance NC Solar 5.50 Intermediate/Peak
Facility 579 Stanly NC Solar 5.16 Intermediate/Peak
Facility 580 Union NC Solar 7.00 Intermediate/Peak
Facility 581 Union NC Solar 2.48 Intermediate/Peak
Facility 582 Macon NC Solar 5.94 Intermediate/Peak
Facility 583 Randolph NC Solar 4.00 Intermediate/Peak
Facility 584 Rowan NC Solar 6.45 Intermediate/Peak
Facility 585 Durham NC Solar 4.62 Intermediate/Peak
Facility 586 Wilkes NC Hydroelectric 200.00 Baseload
Facility 587 Iredell NC Solar 3.00 Intermediate/Peak
Facility 588 Iredell NC Engine Dynamometer N/A Intermediate/Peak
Facility 589 Henderson NC Solar 9.00 Intermediate/Peak
Facility 590 Iredell NC Solar 2.94 Intermediate/Peak
Facility 591 Transylvania NC Solar 3.00 Intermediate/Peak
Facility 592 Henderson NC Solar 3.44 Intermediate/Peak
Facility 593 Forsyth NC Landfill Gas 4750.00 Baseload
Facility 594 Durham NC Solar 5.00 Intermediate/Peak
Facility 595 Mecklenburg NC Solar 4.73 Intermediate/Peak
Facility 596 Mecklenburg NC Solar 10.80 Intermediate/Peak
Facility 597 Alamance NC Solar 3.44 Intermediate/Peak
Facility 598 Alamance NC Solar 2.40 Intermediate/Peak
Facility 599 Rutherford NC Solar 3.60 Intermediate/Peak
Facility 600 Alamance NC Solar 24.00 Intermediate/Peak
Facility 601 Orange NC Solar 2.58 Intermediate/Peak
Facility 602 Caswell NC Solar 2.82 Intermediate/Peak
Facility 603 Mecklenburg NC Solar 20.00 Intermediate/Peak
Facility 604 Orange NC Solar 2.40 Intermediate/Peak
Facility 605 Guilford NC Solar 5.46 Intermediate/Peak
Facility 606 Catawba NC Solar 2.58 Intermediate/Peak
Facility 607 McDowell NC Solar 1.02 Intermediate/Peak
Facility 608 Durham NC Solar 3.50 Intermediate/Peak
Facility 609 Cabarrus NC Solar 3.00 Intermediate/Peak
Facility 610 Orange NC Solar 2.00 Intermediate/Peak
Facility 611 Durham NC Solar 4.00 Intermediate/Peak
Facility 612 Henderson NC Solar 5.00 Intermediate/Peak
Facility 613 Alexander NC Solar 2.58 Intermediate/Peak
Facility 614 Mcdowell NC Solar 3.00 Intermediate/Peak
Facility 615 Guilford NC Solar 2.58 Intermediate/Peak
Facility 616 Cabarrus NC Solar 4500.00 Intermediate/Peak
123
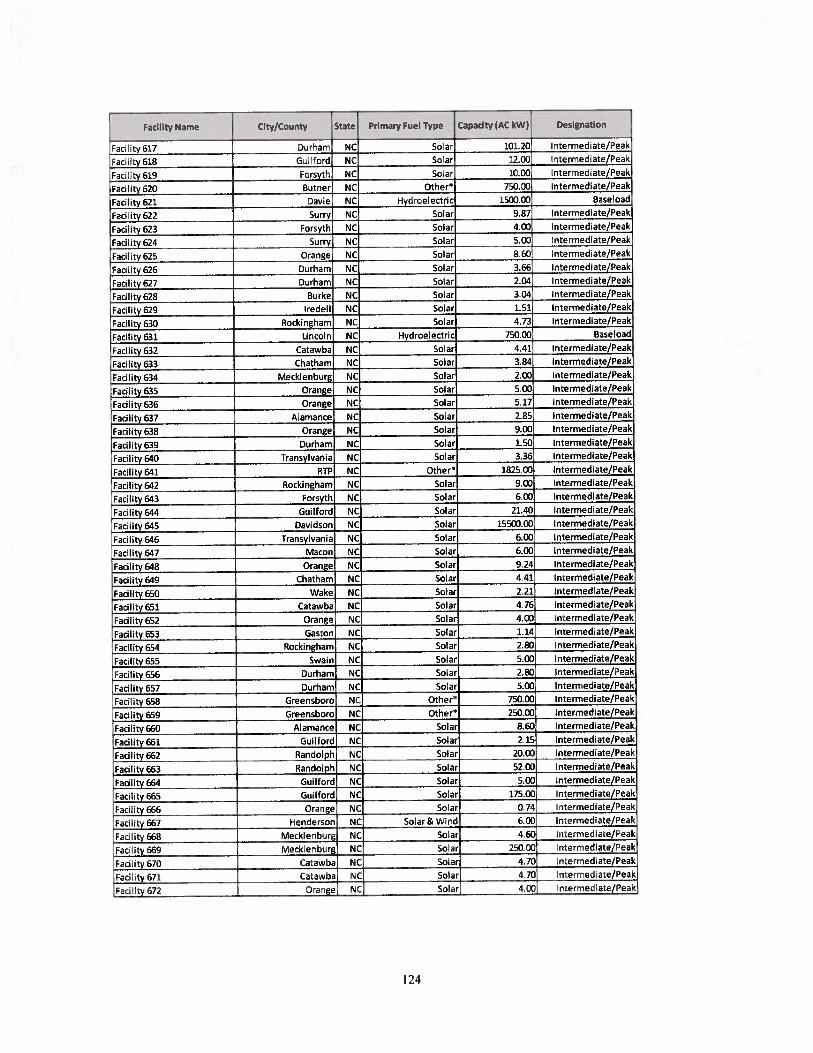
Facility Name City/County State Primary Fuel Type Capacity (AC kW) Designation
Facility 517 Durham NC Solar 101.20 Intermediate/Peak
Facility 618 Guilford NC Solar 12.00 Intermediate/Peak
Facility 619 Forsyth NC Solar 10.00 Intermediate/Peak
Facility 620 Butner NC Other* 750.00 Intermediate/Peak
Facility 521 Davie NC Hydroelectric 1500.00 Baseload
Facility 622 Surry NC Solar 9.87 lnterrriediate/Peak
Facility 623 Forsyth NC Solar 4.00 Intermediate/Peak
Facility 624 Surry NC Solar 5.00 Intermediate/Peak
Facility 625 Orange NC Solar 8.60 Intermediate/Peak
Facility 626 Durham NC Solar 3.66 Intermediate/Peak
Facility 627 Durham NC Solar 2.04 Intermediate/Peak
Facility 628 Burke NC Solar 3.04 Intermediate/Peak
Facility 629 Iredell NC Solar 1.51 Intermediate/Peak
Facility 630 Rockingham NC Solar 4.73 Intermediate/Peak
Facility 631 Lincoln NC Hydroelectric 750.00 Baseload
Facility 632 Catawba NC Solar 4.41 Intermediate/Peak
Facility 633 Chatham NC Solar 3.84 Intermediate/Peak
Facility 634 Mecklenburg NC Solar 2.00 Intermediate/Peak
Facility 635 Orange NC Solar 5.00 Intermediate/Peak
Facility 635 Orange NC Solar 5.17 Intermediate/Peak
Facility 637 Alamance NC Solar 2.85 Intermediate/Peak
Facility 638 Orange NC Solar 9.00 Intermediate/Peak
Facility 639 Durham NC Solar 1.50 Intermediate/Peak
Facility 640 Transylvania NC Solar 3.36 Intermediate/Peak
Facility 641 RTP NC Other* 1825.00 Intermediate/Peak
Facility 642 Rockingham NC Solar 9.00 Intermediate/Peak
Facility 643 Forsyth NC Solar 6.00 Intermediate/Peak
Facility 644 Guilford NC Solar 21.40 Intermediate/Peak
Facility 645 Davidson NC Solar 15500.00 Intermediate/Peak
Facility 646 Transylvania NC Solar 6.00 Intermediate/Peak
Facility 647 Macon NC Solar 6.00 Intermediate/Peak
Facility 648 Orange NC Solar 9.24 Intermediate/Peak
Facility 649 Chatham NC Solar 4.41 Intermediate/Peak
Facility 650 Wake NC Solar 2.21 Intermediate/Peak
Facility 651 Catawba NC Solar 4.76 Intermediate/Peak
Facility 652 Orange NC Solar 4.00 Intermediate/Peak
Facility 653 Gaston NC Solar 1.14 Intermediate/Peak
Facility 654 Rockingham NC Solar 2.80 Intermediate/Peak
Facility 655 Swain NC Solar 5.00 Intermediate/Peak
Facility 656 Durham NC Solar 2.80 Intermediate/Peak
Facility 657 Durham NC Solar 5.00 Intermediate/Peak
Facility 658 Greensboro NC Other 750.00 Intermediate/Peak
Facility 659 Greensboro NC Other* 250.00 Intermediate/Peak
Facility 660 Alamance NC Solar 8.60 Intermediate/Peak
Facility 561 Guilford NC Solar 2.15 Intermediate/Peak
Facility 662 Randolph NC Solar 20.00 Intermediate/Peak
Facility 663 Randolph NC Solar 52.00 Intermediate/Peak
Facility 664 Guilford NC Solar 5.00 Intermediate/Peak
Facility 665 Guilford NC Solar 175,00 Intermediate/Peak
Facility 666 Orange NC Solar 0.74 Intermediate/Peak
Facility 667 Henderson NC Solar & Wind 5,00 Intermediate/Peak
Facility 668 Mecklenburg NC Solar 4.60 Intermediate/Peak
Facility 669 Mecklenburg NC Solar 250.00 Intermediate/Peak
Facility 670 Catawbe NC Solar 4.70 Intermediate/Peak
Facility 671 Catawba NC Solar 4.70 Intermediate/Peak
Facility 672 Orange NC Solar 4,00 Intermediate/Peak
124

Facility Name City/County State Primary Fuel Type Capacity (AC kW) Designation
Facility 673 Durham NC Solar 2.28 Intermediate/Peak
Facility 674 Polk NC Solar 6.IXI Intermediate/Peak
Facility 675 Alamance NC Solar 1.90 Intermediate/Peak
Facility 676 NC Solar 4.58 Intermediate/Peak
Facility 677 Mecklenburg NC Solar 2.58 Intermediate/Peak
Facility 678 Henderson NC Solar 1.94 Intermediate/Peak
Facility 679 Union NC Solar 4.30 Intermediate/Peak
Facility 680 Randolph NC Solar 3.98 Intermediate/Peak
Facility 681 Cabarrus NC Solar 4.05 Intermediate/Peak
Facility 682 Cabarrus NC Solar 4.00 Intermediate/Peak
Facility 683 Swain NC Solar 2.52 Intermediate/Peak
Facility 684 Rutherfordton NC Solar 2.80 Intermediate/Peak
Facility 685 Orange NC Solar 5.00 Intermediate/Peak
Facility 686 Mecklenburg NC Solar 4.95 Intermediate/Peak
Facility 687 Durham NC Solar 4.95 Intermediate/Peak
Facility 688 Orange NC Solar 1.48 Intermediate/Peak
Facility 689 Randolph NC Solar 4.00 Intermediate/Peak
Facility 690 Orange NC Solar 9.00 Intermediate/Peak
Facility 691 Orange NC Solar 9.00 Intermediate/Peak
Facility 692 Gullford NC Solar 3.01 Intermediate/Peak
Facility 693 Mecklenburg NC Solar 3.29 Intermediate/Peak
Facility 694 Burke NC Solar 2.58 Intermediate/Peak
Facility 695 Lincoln NC Solar 9.00 Intermediate/Peak
Facility 696 Orange NC Solar 3.80 Intermediate/Peak
Facility 697 Rutherford NC Hydroelectric 3600.00 Baseload
Facility 698 North Wilkesboro NC Other5 1250.00 Intermediate/Peak
Facility 699 Jackson NC Solar 5.00 Intermediate/Peak
Facility 700 Valdese NC Other5 600.00 Intermediate/Peak
Facility 701 Wilkesboro NC Other5 750.00 Intermediate/Peak
Facility 702 Yadkinville NC Other5 1200.00 Intermediate/Peak
Facility 703 Reidsville NC Other5 750.00 Intermediate/Peak
çlity 704 Mooresville NC Other 750.00 Intermediate/Peak
Facility 705 Brevard NC Other5 1000.00 Intermediate/Peak
Facility 706 Guilford NC Solar 30.00 Intermediate/Peak
Facility 707 Cherokee NC Other5 12500.00 Intermediate/Peak
Facility 708 Mecklenburg NC Solar 18.00 Intermediate/Peak
Facility 709 Durham NC Solar 4.00 Intermediate/Peak
Facility 710 Catawba NC Solar 5000.00 Intermediate/Peak
Facility 711 - North Wilkesboro NC Other 155.00 Intermediate/Peak
Facility 712 Mecklenburg NC Solar 4.80 Intermediate/Peak
Facility 713 Union NC Solar 6.02 Intermediate/Peak
Facility 714 Orange NC Solar 20.00 Intermediate/Peak
Facility 715 NC Landfill Gas 1059.00 Baseload
Facility 716 Durham NC Solar 112.00 Intermediate/Peak
Facility 717 Durham NC Solar 51.00 Intermediate/Peak
Facility 718 Durham NC Solar 4.00 Intermediate/Peak
Facility 719 Chatham NC Solar 2.70 Intermediate/Peak
Facility 720 Salisbury NC Other5 1500.00 Intermediate/Peak
Facility 721 Mecklenburg NC Solar 5.70 Intermediate/Peak
Facility 722 Mecklenburg NC Solar 4.00 Intermediate/Peak
Facility 723 Forsyth NC Solar 1.92 Intermediate/Peak
Facility 724 MeckIenbur NC Solar 27.47 Intermediate/Peak
Facility 725 Orange NC Solar 14.51 Intermediate/Peak
Facility 726 Winston-Salem NC Others 3750.00 Intermediate/Peak
Facility 727 Winston-Salem NC Other 3000.00 Intermediate/Peak
Facility 728 Winston-Salem NC Other* 3000.00 Intermediate/Peak
125
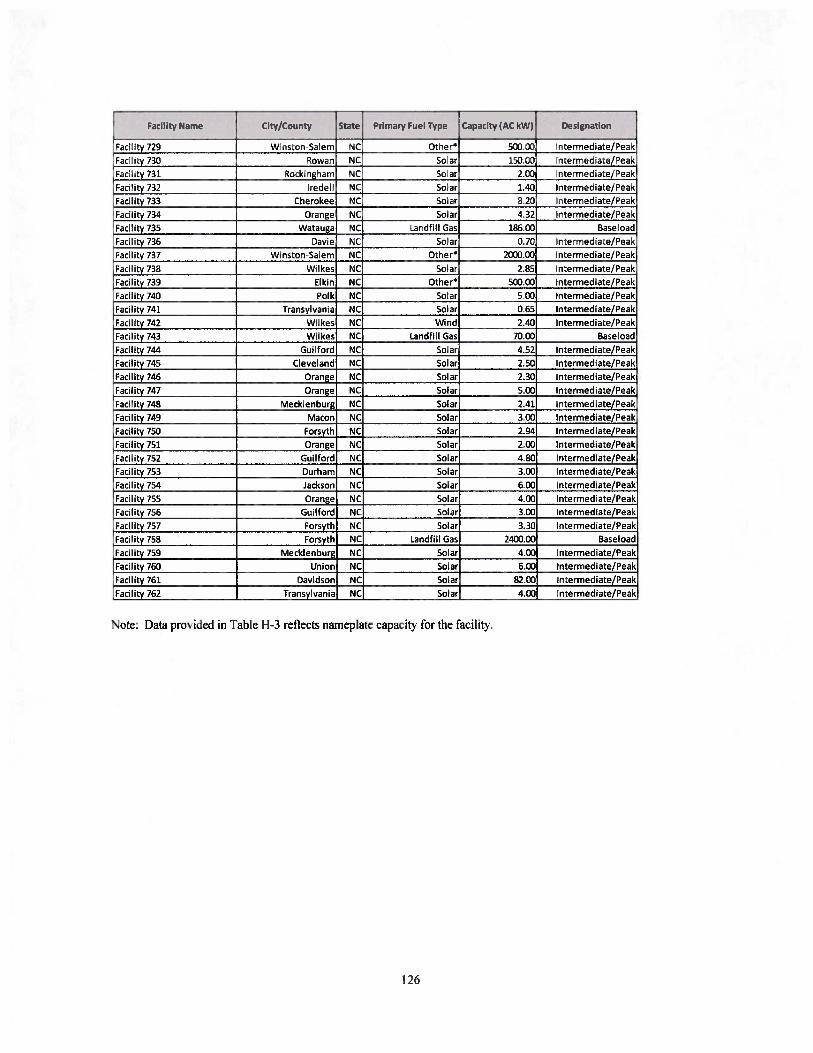
Facility Name City/County State Primary Fuel Type Capacity (AC kW) Designation
Facility 729 Winston-Salem NC Other* 500.00 Intermediate/Peak
Facility 730 Rowan NC Solar 150.00 Intermediate/Peak
Facility 731 Rockingham NC Solar 2.00 Intermediate/Peak
Facility 732 Iredell NC Solar 1.40 Intermediate/Peak
Facility 733 Cherokee NC Solar 8.20 Intermediate/Peak
Facility 734 Orange NC Solar 4.32 Intermediate/Peak
Facility 735 Watauga NC Landfill Gas 186.00 Baseload
Facility 736 Davie NC Solar 0.70 Intermediate/Peak
Facility 737 Winston-Salem NC Other* 2000.00 Intermediate/Peak
Facility 738 Wilkes NC Solar 2.85 Intermediate/Peak
Facility 739 Elkin NC Other* 500.00 Intermediate/Peak
Facility 740 Polk NC Solar 5.00 Intermediate/Peak
Facility 741 Transylvania NC Solar 0.65 Intermediate/Peak
Facility 742 Wilkes NC Wind 2.40 Intermediate/Peak
Facility 743 Wilkes NC Landfill Gas 70.00 Baseload
Facility 744 Guilford NC Solar 4.52 Intermediate/Peak
Facility 745 Cleveland NC Solar 2.50 Intermediate/Peak
Facility 746 Orange NC Solar 2.30 Intermediate/Peak
Facility 747 Orange NC Solar 5.00 Intermediate/Peak
Facility 748 Mecklenburg NC Solar 2.41 Intermediate/Peak
Facility 749 Macon NC Solar 3.00 Intermediate/Peak
Facility 750 Forsyth NC Solar 2.94 Intermediate/Peak
Facility 751 Orange NC Solar 2.00 Intermediate/Peak
Facility 752 Guilford NC Solar 4.80 Intermediate/Peak
Facility 753 Durham NC Solar 3.00 Intermediate/Peak
Facility 754 Jackson NC Solar 6.00 Intermediate/Peak
Facility 755 Orange NC Solar 4.00 Intermediate/PeakFacility 756 Guilford NC Solar 3.00 Intermediate/Peak
Facility 757 Forsyth NC Solar 3.30 Intermediate/Peak
Facility 758 Forsyth NC Landfill Gas 2400.00 Baseload
Facility 759 Mecklenburg NC Solar 4.00 Intermediate/Peak
Facility 760 Union NC Solar 6.00 Intermediate/Peak
Facility 761 Davidson NC Solar 82.00 Intermediate/Peak
Facility 762 Transylvania NC Solar 4.00 Intermediate/Peak
Note: Data pros ided in lahie [1-3 reflects nameplate capacity for the facility.
126

Table H-4 Non-Utility Generation- South Caroliiia
SOUTH CAROLINA GENERATORS
Facility Name City/County State Primary Fuel Type Capacity (kW) Designation
Facility 763 Cherokee SC Natural Gas 100000.00 Intermediate/Peak
Facility 764 Greenville SC Solar 21.00 Intermediate/Peak
Facility 755 Spartanburg SC Solar 15.00 Intermediate/Peak
Facility 766 SC Solar 0.76 Intermediate/Peak
Facility 767 Anderson SC Solar 10.00 Intermediate/Peak
Facility 768 Greenville SC Hydroelectric 600.00 Baseload
Facility 769 Laurens SC Hydroelectric 6300.00 Baseload
Facility 770 Greenville SC Solar 1.94 Intermediate/Peak
Facility 771 Pickens SC Solar 2.35 Intermediate/Peak
Facility 772 Spartanburg SC Solar 94.08 Intermediate/Peak
Facility 773 Spartanburg SC Solar 0.76 Intermediate/Peak
Facility 774 Greenville SC Solar 2.15 Intermediate/Peak
Facility 775 Spartanburg SC Solar 5.52 Intermediate/Peak
Facility 776 Greenville SC Solar 1.68 Intermediate/Peak
Facility 777 York SC Solar 2.80 Intermediate/Peak
Facility 778 Lancaster SC Solar 5.00 Intermediate/Peak
Facility 779 Pickens SC Solar 11.00 Intermediate/Peak
Facility 780 Oconee SC Solar 3.60 Intermediate/Peak
Facility 781 Greenville SC Solar 1.80 Intermediate/Peak
Facility 782 Piclcens SC Solar 42.00 Intermediate/Peak
Facility 783 Laurens SC Solar 6.00 Intermediate/Peak
Facility 784 Greenville SC Solar 5.00 Intermediate/Peak
Facility 785 Greenwood SC Others 1500.00 Intermediate/Peak
Facility 786 Spartanburg SC Hydroelectric 1250.00 Baseload
Facility 787 Pickens SC Solar 4.50 Intermediate/Peak
Facility 788 Laurens SC Solar 0.76 Intermediate/Peak
Facility 789 Greenville SC Solar 2.28 Intermediate/Peak
Facility 790 Spartanburg SC Solar 3.01 Intermediate/Peak
acuity 791 Greenwood SC Solar 2.76 Intermediate/Peak
Facility 792 Spartanburg SC Solar 0.74 Intermediate/Peak
Facility 793 Greenville SC Solar 2.53 Intermediate/Peak
Facility 794 Spartanburg SC Solar 2.80 Intermediate/Peak
Facility 795 SC Solar N/A Intermediate/Peak
Facility 796 York SC Solar 2.85 Intermediate/Pea
Facility 797 Pickens SC Solar 9.00 Intermediate/Pea
Facility 798 Greenville SC Solar 0.76 Intermediate/Pea
Facility 799 Oconee SC Solar 10.08 Intermediate/Pea
Facility 800 Spartanburg SC Engine Dynamometer N/A Intermediate/Pea
FacilitySOl Greenville SC Solar 29.83 Intermediate/Pea
Facility 802 Greenville SC Solar 1(X).CXJ Intermediate/Pea
Facility8o3 Greenville SC Solar 4.30 Intermediate/Pea
Facility 804 Spartanburg SC Solar 2.15 Intermediate/Pea
Facility 805 Laurens SC Solar 5.64 Intermediate/Pea
Facility 806 Spartanburg SC Solar 3.00 Intermediate/Pea
Facility 807 Spartanburg SC Landfill Gas 3200.00 Baseload
Facility 808 Greenville SC Solar 30,10 Intermediate/Peak
Facility 809 SC Solar 5.16 Intermediate/Peak
Facility 810 Spartanburg SC Hydroelectric 1600.00 Baseload
Facility 811 Greenville SC Solar 49.00 Intermediate/Peak
Facility 812 Oconee SC Solar 56.70 Intermediate/Peak
Facility 813 Greenville SC Solar 4.30 Intermediate/Pea
Facility 814 York SC Solar 2.10 Intermediate/Pea
Facility 815 Spartanburg SC Solar 0.76 Intermediate/Pea
Facility 816 Spartanburg SC Solar 0.19 Intermediate/Peak
Facility8l7 Oconee SC Solar 4.00 Intermediate/Peak
Facility 818 Laurens SC Solar 1.94 Intermediate/Pea
Facility 819 Pickens SC Solar 1.05 Intermediate/Pea
127

Facility Name City/County State Primary Fuel Type Capacity (kWJ Designation
Facility 820 York SC Solar 541 Intermediate/Peak
Facility 821 Greenville SC Solar 8.00 Intermediate/Peak
Facility 822 Greenville SC Solar 4.84 Intermediate/Peak
Facility 823 Piclcens SC Solar 4.20 Intermediate/Peak
Facility 824 Pickens SC Solar 2.62 Intermediate/Peak
Facility 825 York SC Solar 2.99 Intermediate/Peak
Facility 826 Greenville SC Solar 5.89 Intermediate/Peak
Facility827 Greenville SC Solar 3.36 Intermediate/Peak
Facility 828 Pickens SC Solar 4.133 Intermediate/Peak
Facility 829 Greenville SC Solar 2.94 Intermediate/Peak
Facility 830 Pickens SC Solar 15.60 Intermediate/Peak
Facility 831 Greenville SC Solar 1.94 Intermediate/Peak
Facility 832 Oconee SC Solar 4.73 Intermediate/Peak
Facility 833 Clinton SC Other* 447.00 Intermediate/Peak
Facility 834 Anderson SC Solar 3.44 Intermediate/Peak
Facility 835 Greenville SC Solar 1.30 Intermediate/Peak
Facility 836 Spartanbur SC Landfill Gas 1600.00 Baseload
Facility 837 Spartanburg SC Solar 3.85 Intermediate/Peak
Facility 838 Spartanburg SC Solar 0.86 Intermediate/Peak
Facility 839 Laurens SC Solar 8.60 Intermediate/Peak
Facility 840 Spartanburg SC Solar 2.85 Intermediate/Peak
Facility 841 Greenville SC Solar 3.82 Intermediate/Peak
Facility 842 Spartanburg SC Solar 6.00 Intermediate/Peak
Facility 843 Spartanburg SC Solar 3.78 Intermediate/Peak
Facility 844 Greenville SC Solar 1.04 Intermediate/Peak
Facility 845 Anderson SC Solar 6.14 Intermediate/Peak
Facility 846 Spartanburg SC Solar 0.74 Intermediate/Peak
Facility 847 Greenville SC Solar 14.00 Intermediate/Peak
Facility 848 Anderson SC Hydroelectric 3500.00 Baseload
Facility 849 Greenville SC Hydroelectric 2400.00 Baseload
Facility 850 Laurens SC Hydroelectric 1500.00 Baseload
Facility 851 Greenville SC Solar 3.01 Intermediate/Peak
Facility 852 Greenwood SC Solar
-
7.52 Intermediate/Peak
Facility 853 Anderson SC Hydroelectric 2020.00 Baseload
Facility 854 Anderson SC Hydroelectric 3300.00 Baseload
Facility 855 Pickens SC Solar 6.58 Intermediate/Peak
Facility 856 Greenville SC Solar 2.38 Intermediate/Peak
Facility 857 Spartanburg SC Solar 1.47 Intermediate/Peak
Facility 858 Greenville SC Solar 6.72 intermediate/Peak
Facility 859 York SC Solar 2.50 Intermediate/Peak
Facility 860 Greenville SC Solar 3.01 Intermediate/Peak
Facility 861 Anderson SC Solar 2.38 Intermediate/Peak
Facility 862 Chester SC Solar 2.47 Intermediate/Peak
Facility 863 Greenville SC Solar 4.68 Intermediate/Peak
Facility 864 York SC Solar 0.70 Intermediate/Peak
Facility 865 Kershaw SC 0ther 1875.00 Intermediate/Peak
Facility 866 Greenville SC Solar 19.40 Intermediate/Peak
Facility 867 Spartanburg SC Other* S00.O0 Intermediate/Peak
Facility 868 Spartanburg SC Solar 2.20 Intermediate/Peak
Facility 869 Spartanburg SC Wind 1.20 Intermediate/Peak
Facility 870 Spartanburg SC Other* 2432.00 Intermediate/Peak
Facility 871 Spartanburg SC Hydroelectric 1000.00 Baseload
Facility 872 Greenville SC Solar 8.00 intermediate/Peak
Facility 873 Greenville SC Solar 0.76 intermediate/Peak
Facility 874 Spartanburg SC Solar 4.20 Intermediate/Peak
Facility 875 Greenville SC Solar 3.00 Intermediate/Peak
Facility 876 Greenville SC Solar 4.00 Intermediate/Peak
128
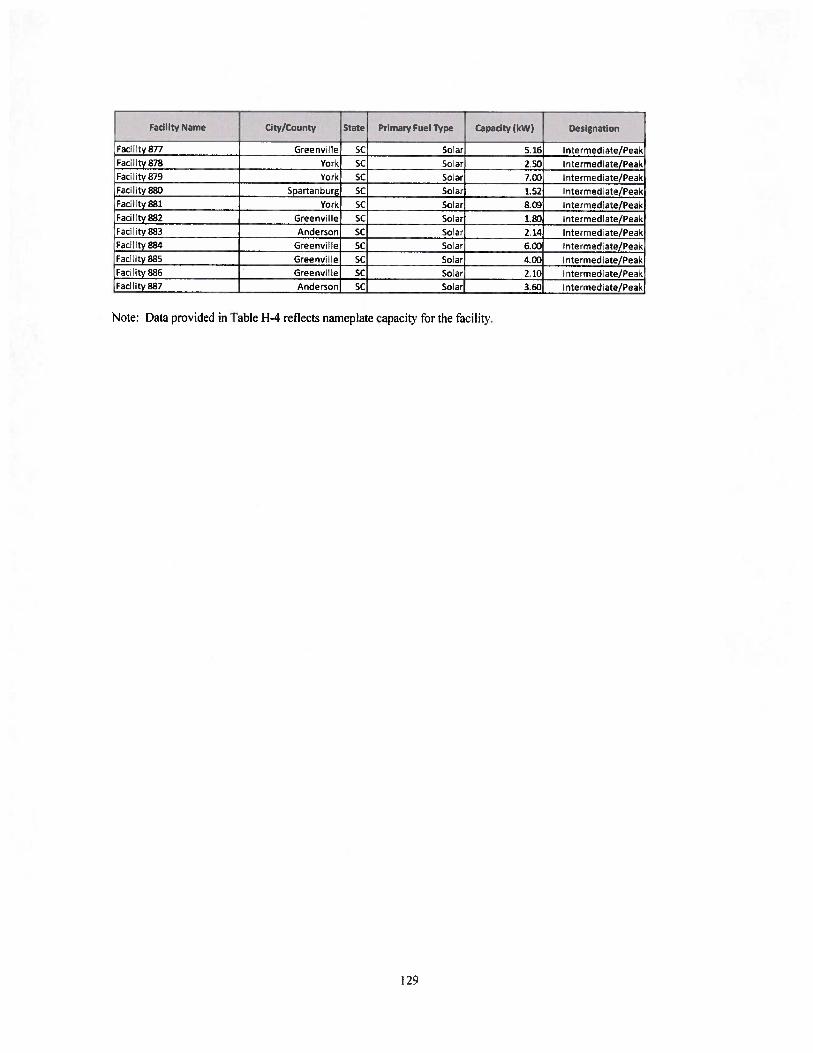
Facility Name City/County State Primary Fuel Type Capacity (kW) Designation
Facilty 877 Greenville SC Soar 5.26 Intermedate/PeakFacility 878 York SC Solar 2.50 Intermediate/PeakFaclity 879 York SC Solar 7.00 Intermediate/PeakFacility8so Spartanburg SC Solar 1.52 Intermedate/PeakFac:11ty881 York SC Solar 8.09 Intermediate/PeakFacility 882 Greenville SC Solar 1.80 Intermediate/PeakFacility 883 Anderson SC Solar 2.14 Intermediate/PeakFacility 884 Greenville SC Solar 6.00 Intermediate/PeakFacility 885 Greenville SC Solar 4.00 Intermediate/PeakFacility 885 Greenville SC Solar 2.10 Intermediate/PeakFacility 887 Anderson SC Solar 3.60 Intermediate/Peak
Note: Data proided iii Fable [1-4 reflects nameplate capacity for the facility.
129

APPENDIX I: TRANSMISSION PLANNED OR UNDER CONSTRUCTION
This appendix lists the planned transmission line additions and discusses the adequacy of l)EC’s
transmission system. The transmission additions are sub—divided into two (2) tables. Table 1—I lists
the transmission line projects that DEC has agreed to construct as part of its merger commitments.
Table 1—2 lists the line projects that were planned to meet reliability needs. This appendix also
provides infbrmation pursuant to the North Carolina Utility COfllflhiSSiOfl Rule R8—62.
Table [-1: Duke/Progress Merger Mitigation Project
YEAR PROJECT CAPACITY
2014 Antioch 500/230 KV Transfonner t pgrades 1680 MVA/Translbrmer
Table 1-2: DEC Transmission Line Additions (Non merger related)
Rule R8-62: Certilicates of environmental compatibility and public convenience and necessity
fbr the construction of electric transmission lines in North Carolina.
(p) Plans for the construction of transmission lines in North carolina (161 kV and above) shall
be incorporated in filings made pursuant to Commission Rule R8—60. In addition, each public
utility or person covered by this rule shall provide the tbllowing infonnation on an annual basis
no later than September 1:
(I) For existing lines, the infiwmation required on FERC Form I, pages 422, 423, 424,
and 425. except that the information reported on pages 422 and 423 may he reported every
five years.
Please refer to the Company’s FERC Form No. I liled with NCUC in April, 2013.
130

(p) Plans for the construction of transmission lines in North Carolina (161 kV and above) shall
he incorporated in filings made pursuant to Commission Rule R8—60. In addition, each public
utility or person covered by this rule shall provide the following information on an annual basis
no later than September 1:
(2) For lines under construction, the tbllowing:
a. Commission docket number;
h. Location of end point(s);
c. length;
d. range of right-of-way width;
e. range of tower heights;
f. number of circuits;
g. operating voltage;
h. design capacity;
i. date construction started;
j. projected in-service date;
There are presently no plans for construction of any 161 kV and above transmission lines.
DEC Transmission System Adequacy
Duke Energy Carolinas monitors the adequacy and reliability of its transmission system and
interconnections through internal analysis and participation in regional reliability groups. Internal
transmission planning looks 1 0 years ahead at available generating resources and projected load to
identil’ transmission system upgrade and expansion requirements. Corrective actions are planned
and implemented in advance to ensure continued cost-effective and high-quality service. The DEC
transmission model is incorporated into models used by regional reliability groups in developing
plans to maintain interconnected transmission system reliability. DEC works with DEP, NCEMC
and ElectriCitics to develop an annual NC Transmission Planning Collaborative (NCTPC) plan for
the DEC and DEP systems in both North and South Carolina. In addition, transmission planning is
coordinated with neighboring systems including South Carolina Electric & Gas (SCE&G) and
Santee Cooper under a number of mechanisms including legacy interchange agreements between
SCE&G. Santee Cooper, DEP, and DEC.
The Company monitors transmission system reliability by evaluating changes in load, generating
capacity, transactions and topography. A detailed annual screening ensures compliance with DECs
Transmission Planning Guidelines for voltage and thermal loading. The annual screening uses
methods that comply with SERC policy and NERC Reliability Standards and the screening results
131

identif’ the need for future transmission system expansion and upgrades and are used as inputs into
the DEC — Power Delivery optimization process. The Power Delivery optimization process
evaluates problem—solution alternatives and their respective priority, scope, cost, and liming. l’he
optimization process enables Power Delivery to produce a multi—year work plan and budget to fund
a portfolio of projects which provides the greatest benefit for the dollars invested.
iransmission planning and requests for transmission service and generator interconnection are
interrelated to the resource planning process. DEC currently evaluates all transmission reservation
requests for impact on transfer capability, as well as compliance with the Company’s Transmission
Planning Guidelines and the FERC Open Access Transmission Tariff (OAIT). The Company
performs studies to ensure transfer capability is acceptable to meet reliability needs and customers’
expected use of the transmission system. The Power Delivery optimization process is also used to
manage projects for improvement of transfer capability. Generator interconnection requests are
studied in accordance with the Large and Small Generator interconnection Procedures in the 0A1’T.
SERC audits DEC every three years for compliance with NERC’ Reliability Standards. Specifically,
the audit requires DEC to demonstrate that its transmission planning practices meet NERC
standards and to provide data supporting the Company’s annual compliance filing certifications.
SERC conducted a NERC Reliability Standards compliance audit of DEC in May 2011. The scope
of this audit included Transmission Planning Standards TPL—002—0.a and TPL— 003-Oa. For both
Standards, [)EC received “No Findings” from the audit team.
DEC participates in a number of regional reliability groups to coordinate analysis of regional, sub
regional and inter—balancing authority area transfer capability and interconnection reliability. The
reliability groups’ purpose is to:
• Assess the interconnected system’s capability to handle large firm and non-firm
transactions for purposes of economic access to resources and system reliability;
• Ensure that planned future transmission system improvements do not adversely affect
neighboring systems; and
• Ensure interconnected system compliance with NERU Reliability Standards.
Regional reliability groups evaluate transfer capability and compliance with NERC’ Reliability
Standards for the upcoming peak season and five- and ten-year periods. ‘l’he groups also perform
computer simulation tests for high transtCr levels to verify satisfuctory transfer capability.
132

Application of the practices and procedures described above have ensured DEC’s transmissionsystem is expected to continue to provide reliable service to its native load and firm transmissioncustomers.
133
ALLFNDlX J: ECONOMIC DEVELOIMENT
Customers Served Under Economic Development
In the NC[C Order issued in l)ocket No. E-l00, Sub 73 dated November 28, 1994. the NCLC
ordered North (‘awlina utilities to review the combined effects of existing economic
development rates within the approved [RP process and file the results in its short-term action
plan. The incremental load (demand) for which customers are receiving credits under economic
development rates and/or self-generation deferral rates (Rider EC), as well as economic
redevelopment rates (Rider ER) as oLlune 2013 is:
Rider EC:134 MW for North Carolina
60 MW for South Carolina
Rider ER:2 MW for North Carolina0 MW for South Carolina
‘34

ALNI)IX K: CROSS-REFERENCE OF IRI REQUIREMENTS
The following table cross—references ERP regulatory requirements for NC R8—60 iii North Carolina
and S.C. Code Anti. § 58-37—10 in South Carolina, and identities where those requirements are
discussed in the IRP.
Requirement Location Reference Lpdated
15-’, ear Forecast ofLoad. (“apacit and Reser es (‘h 8. Tables SC & [) NC R8-60 (c) I Yes
Comprehensi e analysis ofall resource options Ch 4, 5 & 8. App A NC R8-6U (c) 2 Yes
Assessment of Purch ed Posser Table II. I NC’ R8-60 (d) Yes
Assessment ofAltemative Supply-Side Energy Resources (Ii 5. App B & [) NC R8-60 (e) Yes
Assessment of Demand-Side Management CTh 4. App 1) NC’ R8-60 (t’) Yes
Evaluation ofResource Options Ch 8. App A. C & F NC R8-60 (g) Yes
Shori-ferm Action Plan Ch 9 NC RS-60 (h) S Yes
REPS Compliance Plan Attachment NC R8-60 (h) 4 Yes
Forecasts ofLoad. Suppl -Side Resources, and Demand-Side
Resources
lO- ear l-listorv ofC’ustomers and Fnerg Sales App C NC: R8-60 (i) 1(i) Yes
15-year Forecast sv & w/o Energ Elflcienc CTh 3 & App C’ NC R8-6() (I) 1(u) Yes
Description ofSupply-Side Resources Ch 6 & App A NC R8-60 (i) 1(m) Yes
Generating Facilities
Esting Generation Cli 2. App B NC’ R8-61) (it 2(i) Yes
Planned Generat ion Cli 8 & App A NC R8-60 (i) 2(n) Yes
Non Utility Generation Cli 5. App H NC R8-60 (i) 2(iii) Yes
Resen e Margins Cli 7. 8, Table 8.D NC R8-60 (i) 3 Yes
Wholesale Contracts tbr the Purchase and Sale ofPosser
Wholesale Purchased Poser (‘ontracts App l’l NC R8-6O (i) 4(il Yes
Request Ii Proposal (‘Ii 9 NC’ R8-60 (I) 4(h) Yes
* Wholesale Power Sales (‘ontracts App C’ & H NC’ R8-6O (i) 4(iii) Yes
‘transmission Facilities Cli 2. 7 & App I NC R8-60 (i) 5 Yes
Energy Efticien c and I )eman (I-SIdC M an agernen
Existing Programs (‘Ii 4 & App D NC R8-60 (i) 6(i) Yes
* Future Programs Ch 1 & App [) NC’ R8-60 (i) (5ii) Yes
* Rejected Programs App D NC’ R8-60 (i) 4(iii) Yes
Consumer Education Programs App I) NC R8-60 (i) 4(ii I Yes
Assessment o fAlteniative Supply-Side Energ Resources
(‘urrent and Future Altematis e Supph -Side Resources (Ii 5. App F NC RS-60 6) 7(i) Yes
* Rejected Alteniaii e Suppl -Side Resources Cli 5. App F NC’ R8-60 (I) 7(ü) Yes
E aluation of Resource Options (Quantitative Anal sis) App A NC’ R8-60 (i) S Yes
l.e elized [3us-bar (‘osts App F NC’ R8-6O (i) 5) Yes
Smart Grid Impacts App I) NC R8-6() (i) Irt Yes
l.egislatie and Regulato Issues App G Yes
Greenhouse Gas Reduction (‘ompliance Plan App G Yes
Other In tbnnation ( Economic De elopnient) App J Yes
135
DUKEENERGY®CAROLINAS
The Duke Energy Carolinas
N.C. Renewable Energy &Energy Efficiency Portfolio
Standard (NC REPS)Compliance Plan
October 15, 2013
136
NC REPS Compliance Plan
Table of Contents
I. Introduction 138
II. REPS Compliance Obligation 139
ill. REPS Compliance Plan 140
A. Solar Energy Resources 140
B. Swine Waste-to-Energy Resources 141
C. Poultry Waste-to-Energy Resources 141
I). General Requirement Resources 142
E. Summary of Renewable Resources 145
IV. Cost Implications of REPS Compliance Plan 145
A. Current aid Projected Avoided Cost Rates 145
B. Projected Total NC Retail and Wholesale Sales 146
And Year-End Customer Accounts
C. Projected Annual Cost Cap Comparison of Total and 147
Incremental Costs, REPS Rider and Fuel Cost impact
EXHIBIT A (CONIiI)ENTIAL) 148
EX1I1BITB 151
137
I. INTRODUCTION
Duke Energy Carolinas, EEC (L)uke Energy Carolinas or the Company) submits its annual Renewable
Energy and Energy I- Iliciency Portfolio Standard (NC REPS or REPS) Compliance Plan (Compliance
Plan) in accordance with N.C. Gen. Stat. § 62—1 33.8 and North Carolina Utilities Commission (the
Commission) Rule R8—67(b). [his Compliance Plan, set forth in detail in Section 11 and Section III,
provides the required intormation and outlines the Conipanys projected plans to comply with NC REPS
for the period 2013 to 2015 (the Planning Period). Section IV addresses the cost implications of the
Company’s REPS Compliance Plan.
In 2007, the North Carolina General Assembly enacted Session Law 2007-397 (Senate Bill 3), codified
in relevant part as N.C. (jen. Stat. § 62-133.8, in order to:
(I) [)iversify the resources used to reliably meet the energy needs of consumers in the State;
(2) Provide greater energy security through the use of indigenous energy resources available
within the State;
(3) Encourage private investment in renewable energy and energy efficiency; and
(4) Provide improved air quality and other benefits to energy consumers and citizens of the State.
As part of the broad policy initiatives listed above, Senate Bill 3 established the NC REPS, which
requires the investor—owned utilities, electric membership corporations or co—operatives, and
municipalities to procure or produce renewable energy, or achieve energy efficiency savings, in amounts
equivalent to specified percentages of their respective retail megawatt-hour (MWh) sales from the prior
calendar year.
Duke Energy Carolinas seeks to advance these State policies and comply with its REPS obligations
through a diverse portfolio of cost-effective renewable energy and energy efficiency resources.
Specifically, the key components of l)uke Energy Carolinas’ 2013 Compliance Plan include: (1)
introduction of energy eflhciency programs that will generate savings thai can he counted towards the
Company’s REPS obligation; (2) purchases of renewable energy certificates (RECs); (3) continued
operations of company—owned renewable fhcilities; and (4) research studies to enhance the Company’s
ability to comply with its REPS obligations in the future. [he Company believes that these actions
yield a diverse portfolio of qualifying resources and alJow a flexible mechanism for compliance
with the requirements of N.C. Gen. Stat. § 62-133.8.
In addition, the Company has undertaken, and will continue to undertake, specific regulatory and
operational initiatives to support REPS compliance, including: (1) submission of regulatory applications
to pursue reasonable and appropriate renewable energy and energy efficiency initiatives in support of the
Company’s REPS compliance needs; (2) solicitation, review, and analysis of proposals from renewable
energy suppliers ollering RECs amid diligent pursuit of the most attractive opportunities, as appropriate;
138
and (3) development and implementation of administrative pmcesses to manage the Companys REPS
compliance operations, such as procuring and managing renewable resource contracts, accounting for
RECs, safely interconnecting renewable energy suppliers, repolling renewable generation to the North
Carolina Renewable Energy [racking System (NC-RE1’S), and tbrecasting renewable resource
availability and cost in the future.
l’he Company believes these actions collectively constitute a thorough and prudent plan for compliance
with NC REPS and demonstrate the Company’s commitment to pursue its renewable energy and energy
efficiency strategies for the benefit of its customers.
II. REPS COMPLIANCE OBLIGATION
Duke Energy Carolinas calculates its NC REPS Compliance Obligations3in 2013, 2014, and 20] 5 based
on interpretation of the statute (N.C. Gen. Stat. § 62-1 33.8), the Commission’s rules implementing
Senate 13111 3 (Rule R8-67), and subsequent Commission orders, as applied to the Company’s actual or
forecasted retail sales in the Planning Period, as well as the actual and fbrecasted retail sales of those
wholesale customers br whom the Company is supplying REPS compliance. The (‘ompany’s
wholesale customers fur which it supplies REPS compliance services are Rutherfurd Electric
Membership Corporation, Blue Ridge Electric Membership Corporation. City of I)allas, Forest City,
City of Concord, Town of Highlands, and the City of Kings Mountain (collectively referred to as
Wholesale or Wholesale Customers)4.Table I below shows the Company’s retail and Wholesale
customers’ REPS Compliance Obligation.
For the purposes of this Compliance Plan. Compliance Obligation is more specificall defined as the sum of Duke
Energ Carolinas native load obligations fur both the Compan s retail sales and for v holesale native load priority
customers retail sales for whom the Compan is suppl ing REPS compliance. All references to the respecti\e Set-
Aside requirements. the General Requirements. and REPS Compliance Obligation of the Compam include the aggregate
obligations of both Duke Energy Carolinas and the Wholesale Customers. Also. for purposes of this Compliance Plan, all
references to the compliance activities and plans of the Compan shall encompass such acti ities and plans being
undertaken h\ Duke Enere Carolinas on behalf of the Wholesale Customers.
For purposes of this Compliance Plan. Retail Sales is defined as the sum of Duke Energy Carolinas retail sales and the
retail sales of the wholesale customers fbr whom the compan is suppling REPS compliance.
139

Table 1: Duke Energy Carolinas’ NC REPS Compliance Obligation
Previous Total RetailPrevious Year Sales for Solar Swine Poultry REPS Total REPS
Year DEC Wholesale REPS Set- Set- Set- Requiremen Compliance
Complianc Retail Sales Retail Sales Compliance Aside Aside Aside t Obligation
e Year (MWh) (MWhs) (MWhs) (RECs) (RECs) (REC5) (%) (REC5)
2013 54555,907 4,006,605 58,562,512 40,994 40,994 75,678 3% 1,756875
2014 55,232,870 3,928,975 59,161,845 41413 41,413 313,682 3% 1,774,855
2015 55,756,164 3,987,615 59,743,779 83,641 83,641 405,824 6% 3584,627
Note: Obligation is determined by prior-year MWh sales. ‘thus, retail sales figures for compliance years 2014 and 2015 are
estimates.
As shown in Table 1, the Company’s requirements in the Planning Period include the solar energy
resource requirement (Solar Set-Aside), swine waste resource requirement (Swine Set-Aside), and
poultry waste resource requirement (Poultry Set-Aside). In addition, the Company must also ensure that,
in total, the RECs that it produces or procures, combined with energy efficiency savings, is an amount
equivalent to 3% of its prior year retail sales in compliance years 201 3 and 2014, and 6% of its prior year
retail sales in compliance year 2015. The Company refers to this as its Total Obligation. For
clarification, the Company refers to its Total Obligation, net of the Solar, Swine, and Poultry Set-Aside
requirements, as its General Requirement.
III. REPS COMPLIANCE PLAN
In accordance with Commission Rule R8-67h(1)(i), the Company describes its planned actions to
comply with the Solar, Swine, and Poultry Set-Asides, as well as the General Requirement below. The
discussion first addresses the Company’s efforts to meet the Set-Aside requirements and then outlines
the Company’s efforts to meet its General Requirement in the Planning Period.
A. SOLAR ENlRCY RESOURCES
Pursuant to NC. Gen. Stat. § 62-133.8(d), the Company must produce or procure solar RECs equal
to a minimum of 0.07% of the prior year total electric energy in megawatt-hours (MWh) sold to
retail customers in North Carolina in 2013 and 2014, rising to a minimum olO. l4% in 2015.
Based on the Company’s actual retail sales in 2012. the Solar Set-Aside is approximately 40,994
RECs in 2013. Based on forecasted retail sales, the Solar Set-Aside is projected to be
approximately 41,413 RECs and 86,641 RECs in 2014 and 2015, respectively.
The Company’s plan for meeting the Solar Set-Aside in the Planning Period is consistent with its
plan from the previous year, as described in further detail below.
l40

1. Solar Photovoitaic Distributed Generation (PVDG) Program
The L)uke Energy PVI)G Program, approved by the Commission in 2009, refers to solar installations
across multiple sites, totaling approximately ten (10) megawatts (DC’) of installed capacity. The
Company continues to operate these ihcilities Ill Support of our REPS compliance obligations, and the
hicilities remain an integral part of tile Company’s renewable portfolio.
2. Solar PPAs and Solar REC Purchase Agreements
Duke Energy Carolinas has executed multiple solar REC purchase agreements with third parties for tile
purchase of’ solar RECs. ‘I’hese agreements include contracts with multiple in-state and out-ol-state
counterparties to procure solar RECs 110111 both photovoltaic (PV) and solar water heating installations.
Additional details with respect to the REQ purchase agreements are set forth in Exhibit A.
3. Review of Company’s Solar Set-Aside Plan
‘l’he Company has made and continues to make reasonable efihrts to meet the Solar Set-Aside
requirement in tile Planning Period, and remains confident that it will he able to comply with this
requirement. ‘Eherelore, the Company sees minimal risk in meeting the Solar Set-Aside and will
continue to monitor tile development and progress of’ solar initiatives and take appropriate actions as
necessary.
B. SWINE WASTE-TO-ENERGY RESOURCES
Pursuant to N.C. Gen. Stat. § 62-133.8(e), for calendar years 2013 and 2014, at least 0.07% of prior year
total retail electric energy sold in aggregate by utilities in North Carolina must he supplied by energy
derived from swine waste. In 201 5, at least 0. 14% of prior year total retail electric energy sold in
aggregate by utilities in North Carolina must he supplied by energy derived from swine waste. The
Company’s Swine Set-Aside is estimated to he 40,994 REC’s in 2013. 41.413 RECs in 2014, and
83.641 RECs in 2015.
In spite (11’ Duke Energy Carolinas’ active and diligent eflbrts to secure resources to comply with its
Swine Set—Aside requirements, the Company has been unable to secure sufficient volumes of RECs to
meet its pro—rata share of’ tile swine set—aside requirements in 201 3. ‘Ihe Company remains actively
engaged in seeking additional resources and continues to make every reasonable effort to comply with
the Swine waste set—aside requirements. The C’ompanys ability to comply in 2014 and 2015 remains
highly uncertain and subject to multiple variables, particularly relating to counterparty achievement of
projected delivery requirements and commercial operation milestones. Additional details with respect to
See Order (;ranling (‘c’r!ifieale o/ I’uh/ie (‘onveniene and \eee,ssi!v .uhfec! In (‘andition. Docket No. E-7. Sub 856
(Ma) 2009).
141

the Company’s compliance efforts and REC purchase agreements are set forth in Exhibit A and the
Company’s tn-annual progress reports, filed confidentially in [)ocket E-100 Suhi 13A.
I)ue to its expected non-compliance in 2013, the Company will submit a motion to the Commission for
approval of a request to relieve the Company from compliance with the swine-waste requirements until
calendar year 2014 by delaying the compliance obligation br a one year period.
C. POUITRY WASTE-TO-ENERGY RESOURCES
Pursuant to N.C. Gen. Stat. § 62-133.8(f) and as amended by NCUC 0rler on Pro Rata Allocation of
Aggregate Swine and Poultry Waste Requirements and Motion jar (‘larUication in Docket E-100.
SubI 13, fbr calendar years 2013, 2014, and 2015, at least 170,000 MWh, 700,000 MWh, and 900,000
MWh, respectively, of the prior year total electric energy sold to retail electric customers in the State or
an equivalent amount of energy shall be produced or procured each year from poultry waste, as defined
per the Statute and additional clarif’ing Orders. As the Company’s retail sales share of the State’s total
retail megawatt-hour sales is approximately 45%, the Company’s Poultry Set-Aside is estimated to be
75,678 RECs in 2013, 313,682 RECs in 2014, and 405,824 in 2015.
In spite of Duke Energy Carolinas’ active and diligent efforts to secure resources to comply with its
Poultry Set-Aside requirements, the Company has been unable to secure suflicient volumes of RECs to
meet its pro-rata share of the poultry set-aside requirements in 2013 and 2014, The Company remains
actively engaged in seeking additional resources and continues to make every reasonable effort to
comply with the poultry waste set-aside requirements. ‘The Company’s ability to comply in 201 5
remains highly uncertain and subject to multiple variables, particularly relating to counterparty
achievement of projected delivery requirements and commercial operation milestones. Additional
details with respect to the Company’s compliance etibrts and REC purchase agreements are set forth in
Exhibit A and the Company’s tn-annual progress reports, filed confidentially in Docket E-100 Suhi l3A.
Due to its expected non—compliance in 2013, the Company will suhmnU a motion to the Commission fhr
approval of a request to relieve the Company from compliance with the poultry-waste requirements until
calendar year 2014 by delaying the compliance obligation fbr a one year period.
D. GENERAL REQUIREMENT RESOURCES
Pursuant to N.C. Gen. Stat. § 62—133.8, [)uke Energy Carolinas is required to comply with its Total
Obligation in 2013 and 2014 by submitting for retirement a total volume of RECs equivalent to 3% of
retail sales in North Carolina in the prior year, rising to 6% of retail sales in 2015: approximately
1,756,875 RECs in 2013, 1,774,855 RECs in 2014. and 3,584,627 RECs in 2015. ‘[‘his requirement, net
of the Solar, Swine, and Poultry Set-Aside requirements, is estimated to he I ,599,2 13 RECs in 2013,
142
1,378,364 RECs in 2014, and 3,011,555 in 2015.6 The various resource options available to the
Company to meet the General Requirement are discussed below, as well as the Company’s plan to
meet the General Requirement with these resources.
1. Energy Efficiency
During the Planning Period, the Company plans to meet 25% of the Total Obligation FE savings, which
is the maximum allowable amount under N.C. Gen. Stat. § 62-133.7(h)(2)c. This will he accomplished
by utilizing EE savings from the Company’s Commission-approved programs which began in
2009. Because the Company’s first General Requirement began in 2012, EE savings was banked during
the years 2009-2011 for future use. The Company will also continue to develop and offer its customers
new and innovative EE programs in the future that will deliver savings and count towards its future NC
REPS requirements.
Please refer to Appendix D, for descriptions of the Company’s Energy Efficiency programs.
Pursuant to Commission Rule R8—67b(l )(iii), the Company has attached a list of those EE measures that
it plans to use toward REPS compliance, including projected impacts, as Exhibit B.
2. Hydroelectric Power
Duke Energy Carolinas plans to use hydroelectric power from three sources to meet the General
Requirement in the Planning Period: (I) Duke-owned hydroelectric stations that are approved as
renewable energy facilities; (2) Wholesale Customers’ Southeastern Power Administration (SEPA)
allocations; and (3) hydroelectric generation suppliers whose facilities have received Qualii’ing Facility
(QF or QF Hydro) status. The Company has received Commission approval for ten of its hydroelectric
stations as renewable energy facilities. The Company continues to evaluate the use of the RECs
generated by these facilities to meet the General Requirements of Duke Energy Carolinas’ Wholesale
Customers. pursuant to N.C. Gen. Stat. § 62-133.8(c)(2)c and 62-.33.8(c)(2)d. Wholesale Customers
may also hank and utilize hydroelectric resources arising from their full allocations of SEPA. When
supplying compliance for the Wholesale Customers, the Company will ensure that hydroelectric
resources do not comprise more than 30% of each Wholesale Customers’ respective compliance
portfolio, pursuant to N.C’. Gen. Stat. § 62-133.8(c)(2)c. In 2012, the Company also received
Commission approval lbr a new, incremental capacity addition at another of its hydrolacilities,
[3ridgewater. The Company intends to apply RECs generated by this lhcility toward the General
Requirements of Duke Energy Carolinas’ retail customers. In addition, the Company is purchasing RECs
from multiple QF Hydro facilities in the Carolinas and will use RECs from these facilities toward
If the Commission grants relief from the 2013 swine-waste and poultr\ -waste obligations, the Company’s Total
Obligation would not changed hut its General ReqiLirenlent ould increase as the Swine and Poultry Set Asides would not
he netted against the lotal Obligation in compliance \ear 2013.
143

General Requirements of’ Duke Energy Carolinas retail customers. Please see Exhibit A for more
information on each of these contracts.
3. Biomass Resources
Duke Energy Carolinas plans to meet a portion ot the General Requirement through a variety of hiornass
resources, including landfill gas to energy, combined—heat and power. and direct combustion of hiomass
fuels. The Company is purchasing RECs from multiple biomass facilities in the Carolinas, including
landfill gas to energy facilities and hiomass-flieled combined heat and power facilities, all of which
quali1’ as renewable energy facilities. Please see Exhibit A for more information on each of these
contracts.
Duke Energy Carolinas notes, however, that reliance on direct-combustion biornass has decreased in
long—term planning horizons. ‘[his reduction is in part due to continued uncertainties around the
developable potential of such resources in the Carolinas and the projected availability of other forms of
renewable resources to offiset the need for hiomass.
4. Wind
Duke Energy Carolinas plans to meet a portion of the General Requirement with RECs from wind
facilities. As discussed in the Company’s 2013 IRP, the C’ompany believes it is reasonable to expect
that land-based wind will he developed in both North and South Carolina in the next decade.
However, in the short-term, extension of the federal tax subsidy available to new wind generation
facilities remains uncertain. While the company expects to rely upon wind resources for our REPS
compliance effhrt, the extent and timing of’ that reliance will likely vary commensurately with
changes to supporting policies and prevailing market prices. ‘[he Company also has observed that
opportunities may exist to transmit land-based wind energy resources into the Carolinas from other
regions, which could supplement the amount of wind that could be developed within the Carolinas.
5. Use of Solar Resources for General Requirement
Duke Energy Carolinas plans to meet a portion of the General Requirement with RECs from solar
facilities. As discussed in the Company’s 2013 IRP, the Company views the downward trend in solar
equipment and installation costs over the past several years as a positive development. Additionally. new
solar facilities also benefit from generous supportive federal and state policies that are expected to be in
place through the middle of this decade. While uncertainty remains around possible alterations or
extensions of policy support, as well as the pace of future cost declines, the Company fully expects solar
resources to contribute to our compliance efforts beyond the solar set-aside minimum threshold fbr NC
REPS during the Planning Period.
144

6. Review of Company’s General Requirement Plan
‘The Company has contracted for or otherwise procured sufficient resources to meet its General
Requirement in the Planning Period. Based on the known iniormation available at the time of this tiling,
the Company is confident that it will meet this General Requirement during the Planning Period and
submits that the actions and plans described herein represent a reasonable and prudent plan for meeting
the General Requirement.
E. SUMMARY OF RENEWABLE RESOURCES
The Company has evaluated, procured, and/or developed a variety of types of renewable and energy
efficiency resources to meet its NC REPS requirements within the compliance Planning Period. As
noted above, several risks and uncertainties exist across the various types of resources and the associated
parameters of the NC REPS requirements. The Company continues to carefully monitor opportunities
and unexpected developments across all facets of its compliance requirements. Duke Energy Carolinas
submits that it has crafled a prudent, reasonable plan with a diversified balance of renewable resources
that will allow the Company to comply with its NC REPS obligation over the Planning Period.
IV. COST IMPLICATIONS OF REPS COMPLIANCE PLAN
A. CURRENT AND PROJECTED AVOII)ED COST RATES
The current avoided cost rates represent the annualized avoided cost rates in Schedule PP-N (NC),
I)istribution Interconnection, approved in the Commission’s Order Establishing Standard Rates and
Contract 7’rms for Quali/i’ing Facilities, issued in Docket No. E-l00, Sub 127 (July 27, 2011). The
projected avoided cost rates represent the annualized avoided cost rates proposed by the Company in
[)ocket No. E- 100, Sub I 36.
Table 2: Annualized Capacity and Energy Rates (cents per kWh)
2013 2014 2015
(Current) (Projected) (Projected)
Variable Rate 5480 4.940 4940
5Year 5,630 5.150 5.150
10 Year 6.280 5.480 5.480
15 Year 6.630 5.800 5.800
145
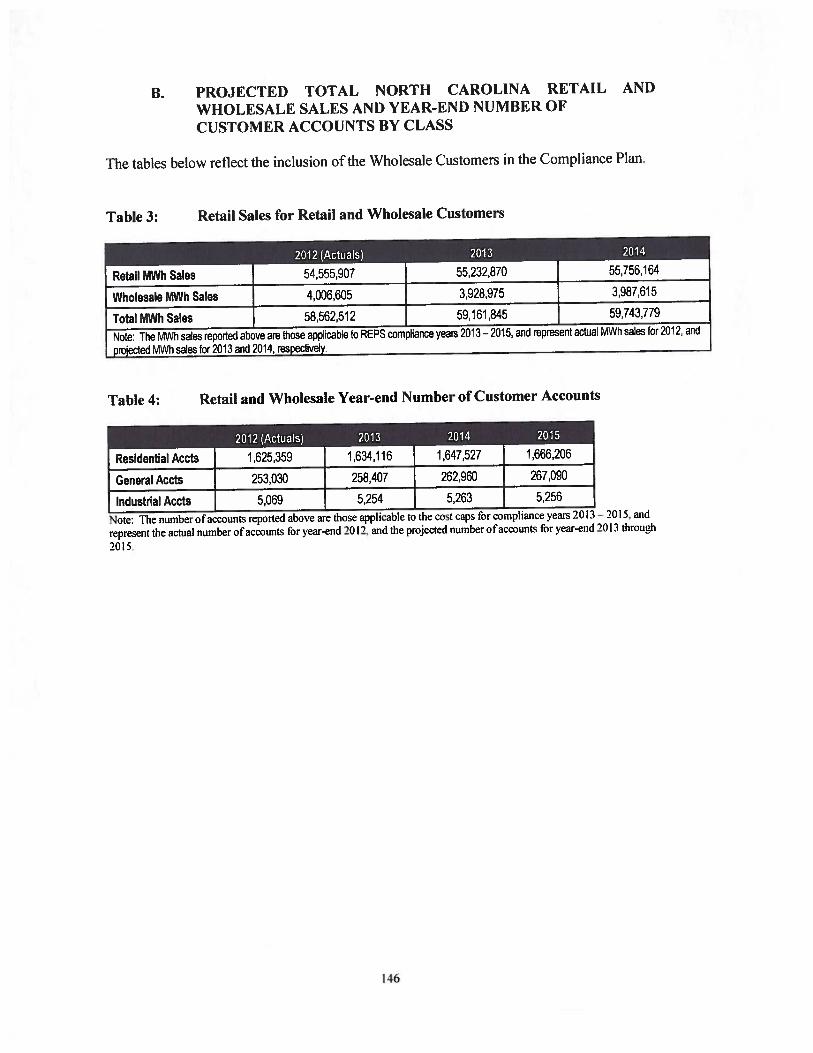
B. PROJECTED TOTAL NORTH CAROLINA RETAIL AND
WHOLESALE SALES AND YEAR-END NUMBER OF
CUSTOMER ACCOUNTS BY CLASS
The tables below reflect the inclusion olthe Wholesale Customers in the Compliance Plan.
Table 3: Retail Sales for Retail and Wholesale Customers
Retail MWh Sales 54,555,907 55,232,870 55,756,164
Wholesale MWh Sales 4,006,605 3,928,975 3,987,615
Total MWh Sales 58,562,512 59161,845 59,743,779
Note: The MWh sales reported above are those applicable to REPS compliance years 2013- 2015, and represent actual MWh sales for 2012, and
projected MWh sales for 2013 and 2014, respectively.
Table 4: Retail and Wholesale Year-end Number of Customer Accounts
2012 (Actuals) 2013 2014 2015
Residential Accts 1,625,359 1,634,116 1,647,527 1,666,206
[neral Accts 253,030 258,407 262960 267,090
Industrial Accts 5,069 5,254 5,263 5,256
Note: The number of accounts reported above are those applicable to the cost caps for compliance years 2013— 2015. and
represent the actual iumher of accounts for ear-end 2012. and the projected number of accounts fir year-end 2013 through
2015
2012 (Actuals) 2013 2014
146

C. PROJECTED ANNUAL COST CAP COMPARISON OF TOTAL ANDINCREMENTAL COSTS, REPS RIDER AND FUEL COST IMPACT
Projected compliance costs tbr the Planning Period are presented in the cost tables below bycalendar year. The cost cap data is based on the number of accounts as reported above.
Table 5: Projected Annual Cost Caps and Fuel Related Cost Impact
Total projected REPS compliance costs $ 32,969,472 $ 46,126,516 $ 50,567,253
Recovered through the Fuel Rider $ 24,690,757 $ 33,996,739 $ 35,985,121
Total incremental costs (REPS Rider) $ 8,278,714 $ 12,129,777 $ 14,582,132
Total Including GRTand Regulatory Fee $ 8,575,016 $ 12,563,910 $ 15,104,036
Projected Annual Cost Caps (REPS Rider) $ 63,600,083 $ 64,543,124 $ 106,425,364
2013 2014 2015
147

EXHIBIT ADuke Energy Carolinas, LLC’s 2013 REPS Compliance Plan
Duke Energy Carolinas’ Renewable Resource Procurement from 3rd Parties(signed contracts)
IBECIN CONFIDENTIALI
Resurce Supi DnrtEn Estimated RECa_____
T otal Solar RE C Piwchases
148

Cønt!actRsource SuDl1r Diuahc Estind RECs
2C Yars
10 Y13
ic Yar
20 Yai20 Iai
20 Yai20 Y.ax
Totil Swir RE CPurchase
149
ContractResour Sulier Duzahx Estizmt1 REC
I 2C13 2C14Hydro flectnc Ronrs
* Indicates bundle purchase of R[Cs and energy, as opposed to RE(’-only purchase.
lEND CONFIDENTIALI
2C15
T oilHIro Purchases
150
EXHIBIT B
Duke Energy Carolinas, LLC’s 2013 REPS Compliance PlanDuke Energy Carolinas, LLC’s EE Programs and Projected REPS Impacts
Forecasted Annual Energy Efficiency Impacts for the REPS CompliancePlanning Period 2013, 2014, 2015 (MWh)
Sub Total
Non Residential Programs
Sub Total
200,650
213,697
213,697
92,366
223,834
223,834
2013 T715Residential_Programs
Residential Energy Assessments 4,935 4,116 4,116Smart Saver® for Residential Customers 48,562 37,080 39,667Low Income Energy Efficiency and Weatherization Assistance 1,842 1,842 1,832Energy Efficiency Education Program for Schools 5,318 5,297 5,297Appliance Recycle 30,429 34,868 34,868Residential Neighborhood Low Income Program 8,454 7,655 7,017My Home Energy Report 101,110 1,508 3,061
Smart Saver® for Non.Res Customers
95,858
Total 414,346 316,200 330,885
235,026
235,026
151