“energy balance” of the power sector of georgia: part …pdf.usaid.gov/pdf_docs/pnadk354.pdf ·...
TRANSCRIPT
Advisory Assistance to the Ministry of Energy of Georgia P.E.D. IQC – Contract No. DOT-I-00-04-00020-00 Task Order #800
“ENERGY BALANCE” OF THE POWER SECTOR OF GEORGIA: PART 1. ANALYSIS AND PROPOSALS
August 31, 2006
This publication was produced for review by the United States Agency for International Development. It was prepared by Paul Ballonoff, CORE International, Inc.

Advisory Assistance to the Ministry of Energy of Georgia P.E.D. IQC – Contract No. DOT-I-00-04-00020-00 Task Order #800
“ENERGY BALANCE” OF THE POWER SECTOR
OF GEORGIA: PART 1. ANALYSIS AND PROPOSALS
Disclaimer The author’s views expressed in this publication do not necessarily reflect the views of the United States Agency for International Development or the United States Government.

“ENERGY BALANCE” OF GEORGIA POWER SECTOR PART 1: ANALYSIS AND PROPOSALS
Page 3 of 172
ANALYSIS OF “ENERGY BALANCE” OF
THE POWER SECTOR OF GEORGIA
PART 1: ANALYSIS AND PROPOSALS1
CONTENTS
EXECUTIVE SUMMARY ................................................................................................... 5
I. PURPOSE, PHILOSOPHY AND TECHNIQUE OF THIS ANALYSIS:................... 7 1.A. SCOPE OF THE PRESENT DOCUMENT ............................................................... 7
1.B. CONCEPTUAL FOUNDATIONS............................................................................. 7
1.C. DESCRIPTION OF THE GEORGIAN POWER SYSTEM ..................................... 9
1.D. COMPARISON OF MUST-RUN VS. LEAST COST............................................. 12
1.D.1 Description of Analysis Performed........................................................................ 12
1.D.2 Must-Run Base Case.............................................................................................. 12
1.D.3. Least Cost Base Case ............................................................................................. 18
1.E. IMPACT OF ADDITIONAL CAPACITY AND LOAD GROWTH....................... 21
1.E.1 Description of Analysis Performed ........................................................................ 21
1.E.2 Must-run Case Variations....................................................................................... 22
1.E.3 Least Cost Case Variations..................................................................................... 26
1.F COMPARISON OF LEAST COST AND MUST-RUN CASES ............................. 31
2. PROBLEMS OF SYSTEM RELIABILITY: ............................................................... 33 2A. IMPACT OF SUPPLY INTERRUPTIONS IN GEORGIA ...................................... 33
2.B. RELIANCE ON INTERCONNECTION AS A SOURCE OF RELIABILITY....... 36
2.B.1 Effect of Imports on Reliability .............................................................................. 36
2.C. GAS GENERATION AS A SOURCE OF REGIONAL RELIABILITY................ 38
3. HYDROLOGICAL CONDITIONS AND HYDRO POWER RELIABILITY......... 38 3.A BASIS OF ANALYSIS OF HYDROLOGICAL VARIABILITY........................... 38
3.B REQUIREMENTS FOR LEVELS OF RELIABILITY ........................................... 38
3.C. COST ABOVE KHUDONI TO MEET RELIABILITY CONDITIONS................. 38
3.D. REVENUE POTENTIAL FROM CAPACITY REQUIRED TO MEET
RELIABILITY CONDITIONS ........................................................................................ 38
4. ANALYSIS OF EXPORT CAPACITY........................................................................ 38 4.A. GEORGIAN EXPORT CAPABILITY .................................................................... 38
4.A.1 Alternative Conditions Studied.............................................................................. 38
4.A.2 Summary Of Basic Results ..................................................................................... 38
4.A.3 Analysis Of Differences In Scenarios ..................................................................... 38
4.B. AVAILABLE SOURCES OF EXPORT CAPABILITY......................................... 38
4.C PREVIOUS STUDIES OF REGIONAL MARKETS .............................................. 38
4.C.1 The Caucasus Regional Energy Needs Assessment, January 2000 ....................... 38
1 This publication was produced by CORE International, Inc. under the USAID Advisory
Assistance to the Ministry of Energy of Georgia project, by contractor CORE International. Part 1 “Analysis And Proposals” was prepared by Chief of Party Paul Ballonoff. The analysis rests on a model of operation of the Georgian power system prepared by Paul Ballonoff based on models developed initially for a USAID project in Ukraine, and adapted for Georgia by project engineer Bidzina Kekelia. The many generous Georgian energy sector institutions who assisted by providing data for this study are identified in Annex A. DISCLAIMER: All opinions are those of the authors or the project alone, and do not necessarily reflect any viewpoint or opinion of USAID nor the US Government.

“ENERGY BALANCE” OF GEORGIA POWER SECTOR PART 1: ANALYSIS AND PROPOSALS
Page 4 of 172
4.C.2 Final Report On Strengthening Regional Energy Linkages, March 15, 2001 ....... 38
4.C.3 Report on Regional Oil And Gas Sector In Transition, May 2005 ........................ 38
4.C.4 Transition Country Coal and Electricity Prospects ................................................ 38
5. CONCLUSIONS ............................................................................................................. 38
ANNEX A: GDM MODEL DOCUMENTATION .......................................................... 38 A.1 THEORY OF THE GDM MODEL.......................................................................... 38
A.2 OPERATION OF THE GDM MODEL.................................................................... 38
A.2.1 Introduction – Georgian Power System ................................................................. 38
A.2.2 General Inputs ........................................................................................................ 38
A.2.3 Data Sources .......................................................................................................... 38
A.2.4 Basic Operating Principles..................................................................................... 38
A.2.5 Output Sheets ......................................................................................................... 38
ANNEX B. ANALYSIS OF HYDROLOGICAL VARIABILITY................................. 38 B.1 Method of Estimating Risk ........................................................................................ 38
B.2 Definition of Reliability ............................................................................................ 38
B.3 Summary Description of the Data:............................................................................ 38
ANNEX C: SCENARIO NUMERICAL TABLES FROM MUST-RUN
BASE CASE .................................................................................................................... 38
ANNEX D: SCENARIO NUMERICAL TABLES FROM LEAST COST
BASE CASE .................................................................................................................... 38
ANNEX E: TABLES SUMMARIZING AND COMPARING MUST-RUN AND
LEAST COST BASE CASES ........................................................................................ 38
ANNEX F. MONTHLY DISPATCH GRAPHS: MUST-RUN
BASE CASE (IMERETI ON)........................................................................................ 38
ANNEX G. MONTHLY DISPATCH GRAPHS: LEAST COST BASE CASE
(IMERETI ON) ............................................................................................................... 38
ANNEX H . MONTHLY DISPATCH GRAPHS: COMPARING MUST-RUN AND
LEAST COST BASE CASES (IMERETI ON)............................................................ 38
ANNEX I. MONTHLY DISPATCH GRAPHS: MUST-RUN
BASE CASE (IMERETI OFF) ...................................................................................... 38
ANNEX J. MONTHLY DISPATCH GRAPHS: MUST-RUN WITH NO IMPORTS
(IMERETI ON) ............................................................................................................... 38
ANNEX K: TABLES OF OUTPUT OF SCENARIOS SHOWING MONTHLY
DISPATCHES FROM, HYDRO, THERMAL AND IMPORT, AND SHOWING
NET AVAILABLE EXPORT CAPABILITY OF GEORGIA DOMESTIC HYDRO
AND THERMAL GENERATION................................................................................ 38

“ENERGY BALANCE” OF GEORGIA POWER SECTOR PART 1: ANALYSIS AND PROPOSALS
Page 5 of 172
EXECUTIVE SUMMARY
The Ministry of Energy of Georgia has requested that the USAID supported project Advisory Assistance to the Ministry of Energy of Georgia2 offer its vision of energy strategy concepts for Georgia. This document is the second major segment of the reply to that request. Previous, in May 2006, we issued “Natural Gas Strategy for Georgia” in two parts. That analysis concentrated on natural gas issues inter-fuel comparisons of natural gas and hydro-power for Georgia. The present document offers a broader analysis of power system strategic issues generally, including a deeper look at power sector issues implied by the earlier analysis. The immediate study “Analysis of ‘Energy Balance’ of The Power Sector of
Georgia”, consists of two major subparts. The immediate document is entitled “Part 1: Analysis and Proposals”. Part 1 is a detailed analysis of dispatch scenarios for the power system of Georgia, under present and alternative conditions. Included in Part 1 is an analysis of the effect of hydrological variability on the possible reliance of Georgia on that abundant resource, the effects of alternative scenarios of load growth on how to meet that load, the effects of possible transmission system interruptions, and the importance of regional markets. This last topic is divided into studies of the export capacity of Georgia, and analysis of the effect on Georgia if there were no imports available. Bound separately is “Part 2: History of Georgian Energy Balance”. Part 2 contains a detailed documentation of history of Georgian energy balances, for all fuels, from 1960 to the present. The authors also address certain basic economic and geopolitical issues affecting the energy balance of Georgia. Part 2 is intentionally done as an independent separate study, to provide additional insights. The two present studies reinforce each other by providing a broader and deeper analysis than if only one was undertaken. The present study does not claim to be a complete “energy strategy”, nor an analysis of particular trading partners, contract terms nor recommendation for dispatch of particular units at particular hours. Part 1 concentrates on two principal issues. First, we analyze the capability of Georgia to operate as a predominantly hydro-power based system, and the risks in adopting that strategy. Those “risks” include possible benefits, in form of additional generation capacity, of a particular sort. Thus, second, when combined with the analysis of possible export capacities,
2 The contractor for this project is CORE International, Inc. This study was prepared by the
staff of the project, under the direction of Chief of Party Paul Ballonoff, with the close support of CORE International principal staff. DISCLAIMER: All opinions in either study are those of the authors or the project alone, and do not necessarily reflect any viewpoint or opinion of USAID nor the US Government.

“ENERGY BALANCE” OF GEORGIA POWER SECTOR PART 1: ANALYSIS AND PROPOSALS
Page 6 of 172
our study finds a surprising conclusion: Georgia may be able to export not just energy, but “reliability” as a separate and defined service. Following our Gas Analysis, we demonstrate, but in more depth, that Georgia should prefer use of hydro power, to natural gas, as a source of electric generation for most domestic purposes. Our detailed analysis of hydrological conditions shows that this can be a feasible solution, even in low water conditions. Reliance on hydro would minimize domestic requirements for external sources of natural gas, and thus increase energy security for the country. Issues of capital cost for hydro power were discussed in the earlier Gas Analysis.

“ENERGY BALANCE” OF GEORGIA POWER SECTOR PART 1: ANALYSIS AND PROPOSALS
Page 7 of 172
I. PURPOSE, PHILOSOPHY AND TECHNIQUE OF THIS ANALYSIS:
1.A. SCOPE OF THE PRESENT DOCUMENT
The present document is one of several related studies on energy
strategic planning issues for Georgia, requested to be created by CORE International in the scope of its work under the USAID project “Advisory Assistance to the Ministry of Energy of Georgia”. This task has two principal origins, and thus, two principal components. In June 2005 the Ministry of Energy requested that the project provide assistance in documenting energy statistics related to Georgian energy supply and demand analysis; asked that the project prepare its own vision of an “energy balance” for Georgia that can assure energy security3 for the country; and asked the project to train the staff of the Ministry in the techniques used in that analysis. In December 2005 the Ministry also requested that the project provide analysis of alternatives related to the supply of natural gas to Georgia. This second study is inherently part of the first, but was also requested as a separate document, and with greater urgency.
CORE International is responding to those Ministry requests as follows. A previous two part study focused on gas policy, but also considered interactions with hydro power when there was a choice between them. The present document analyzes in depth, the possible alternatives for design of the power system of Georgia, and especially the question of increased reliance on use of hydro power. The companion document is an independently written documentation of the history of, and the economic and political issues affecting, Georgian energy balances for all sources of energy.
1.B. CONCEPTUAL FOUNDATIONS
Starting in Soviet times, Georgia maintained a document called an “energy
balance”, which summarized the sources and uses of energy, for all purposes. A new “energy balance” was created each year, or on longer intervals, and played an important part in the economic planning process. In the power sector, this document still exists under that name, “energy balance”, and is even recognized in the recent Amendments to the Law of Georgia on Electricity and Natural Gas. In that law, the Ministry of Energy is given authority to “approve” an annual energy balance for the wholesale electricity market of Georgia (or its successor operations). The energy balance was previously a planning document - it was an act requiring compliance. Thus the current document by that same name may be interpreted as effectively giving the Ministry of Energy planning authority especially for production and wholesale dispatch of generation sources, and allocation of their outputs.
In a market economy, that is a rather peculiar power to be held or exercised by, a Government agency. This is true for several reasons. First, in a
3 The Ministry did not define “security”. For discussion of definition of this term, see Footnote
2 to our Gas Strategy for Georgia, Part 1, May 2006..

“ENERGY BALANCE” OF GEORGIA POWER SECTOR PART 1: ANALYSIS AND PROPOSALS
Page 8 of 172
market economy decisional authority is dispersed among the actual market participants. The well established topic known as “microeconomics” has long demonstrated that freely exercised choices by independent firms, result in the most economically efficient allocation of resources, and in particular, selects both the most economically efficient sources of supply, and the most economically efficient allocation of consumption. No government action is required to achieve this result, as long as no artificial obstructions (including, no obstructions caused by government) prevent it.
A government planning document that purports to be a required annual
“energy balance” for a power sector is an even more peculiar document, since to operate an efficient and reliable power system, actual decisions are made on a much more frequent basis than annually. While some longer term contracts for supply may exist, the actual operations depend not on annual or even monthly decisions, but on daily and hourly (or even shorter period) specific actions. Thus, the most efficient “energy balance” at the level of the market must be determined not annually, but hourly. Since the actual conditions change hourly, any document issued in advance purporting to “plan for” a one year period, with detail instructions that far in advance, will necessarily be wrong the first hour after it is issued, and remain wrong for the full year, except by accident. Studies can only indicate likely patterns, and no detailed advance study can anticipate all of the actual conditions that may occur. On the other hand, proceeding with out any such analysis assures that the actions taken have no rational foundation and thus may cause worse than chance results. An example of how statistical variability can be explicitly taken to account, in forming rational choices, is given by our analysis of hydrological variability, in Chapter 3, and Annex B.
More appropriate therefore, is that the Ministry of Energy or a similar body,
regularly and rigorously analyze potential combinations and scenarios for provision of energy, with the purpose of establishing policies that encourage economically efficient and reliable supply. That is, rather than establish a mandatory annual “energy balance” as a single normative act, that the Government instead should study alternative forms of meeting market demand, and understand the obstacles that may prevent the normal market operations to achieve either economically efficient, or reliable, supply. In that framework, the “energy balance” is an analytical tool, not a planning document. To do such analysis requires study of many alternatives, under varied assumptions. The added fact of large scale hourly variability also requires that even if the period for analysis is one year, that the underlying unit of analysis for performing the calculations be not more than one hour.
This study therefore uses the term “energy balance” in that analytical
sense. To implement that form of analysis, we have created an analytical model of the hourly operation of the Georgian wholesale power supply market. We call that model the “Georgian Generation Dispatch Model” or GDM. The GDM is documented in Annex A of this report. The concept of the GDM however can be summarized very simply. For each month of the year, the GDM uses a “typical daily load” of 24 separate hours, based on actually experienced load in each month in previous years. For each such hour, the model then finds the least cost way to meet that load, given capabilities of domestic generation units available,

“ENERGY BALANCE” OF GEORGIA POWER SECTOR PART 1: ANALYSIS AND PROPOSALS
Page 9 of 172
the imports then available, and realistic constraints on the abilities of certain units (especially major hydro units) to serve as “peaking” or regulating plants. Since the model assumes “least cost” order of selection of units in each hour, (after must-run constraints, if any, are met) the generation prices input to the model are quite important. Presently in Georgia, the prices for generation are set by regulated tariffs (internally) and by agreements for imports. The assumed prices used in the GDM for this study are the actual tariffs and prices known as of June 2006. However, the model could also be used to study alternatives, such as freely bid prices, or purely contracted domestic prices, if those were in effect.
The model allows to select (on a monthly basis) which units are deemed
“available” and with what MW capacities. The GDM also allows specifying that certain units are to be run despite their rank order of unit price. This would be elected for example, if we know that certain units are mandated to run by contract, or if they are mandated to run for some other reason. This status is called “must-run”. The term means, that if a unit designated as “must-run” is also available, then it will be dispatched first in each hour. Only after all must-run units have been dispatched, will the GDM then dispatch units in order of “least cost” (taking first the least priced generation, or import tariff, and proceeding in least cost order until the load is met).
This ability to model quite different modes of operation is a key to the value
of the GDM for understanding policy options for the power system of Georgia. In the present concept of annually mandated energy balances, it has been the practice to require that certain thermal powered units be operated in certain months of the winter period, in a must-run condition. That is, those units are required to be dispatched even if less costly hydro power or imports are available. It may be that such dispatch has been practiced in anticipation of reliability issues. But whatever the reason, the potential for a significant impact of this choice should be apparent.
Thus, while we examine other scenarios for specific purposes, we focus a
principal part of the study on the comparison between “must-run” operation, and “least cost” operation. In particular, the base case for all of our scenarios is the current must-run operation that forces certain thermal units to be run in the winter months.
1.C. DESCRIPTION OF THE GEORGIAN POWER SYSTEM
The power system of Georgia is illustrated by the schematic map on the
following page. The overall description is straightforward. The larger existing and planned generation units are hydro power plants, located in the western half of the country (the left portion of the map). The principal existing hydro unit in western Georgia is the Enguri station (currently about 800 MW capacity), at the approximately 120 degree bend of the red line. The principal panned hydro unit is the Khudoni station, about 630 MW< just north of Enguri.
The principal thermal units (principally at or near the Gardabani station, potentially up to about 700 MW if all are available), and also the larger loads (in and near the cities of Tbilisi and Rustavi) are located in the east, on or near the

“ENERGY BALANCE” OF GEORGIA POWER SECTOR PART 1: ANALYSIS AND PROPOSALS
Page 10 of 172
broken edged 5-sided semi-circle of the red line toward the bottom right of the map. These are all tied together by the high voltage “backbone” system (the solid red line), and supported by other high voltage lines of lower capacity (the blue lines). In the west, many of the current “intermediate” size hydro plants (between 50 to 300 MW each), and the planned expansion of the Namakhvani Cascade, lie largely within this blue colored part of the network.
The dotted red line in the south is the planned South Georgia high voltage
transmission line, intended for reliability and increased export capacity of the system. The solid red line running horizontally across the center of the map -- the Imereti line – thus ties the eastern loads and the western generation. If that line fails, then the major hydro generation, and any imports from Russia in the west, are isolated from the loads in the east. Loss of the Imereti line would also loss capacity to import power from Russian, via the Kavkazioni line, that goes straight north vertically from the Enguri station.
The principal issues studied here are thus easily defined by the above
discussion. If the system is properly connected, then the loads of Georgia can be principally met from hydro, and the eastern thermal units unused or available for export or reliability services. If the Imereti line is out of service, then the country is divided into two isolated systems: that in the east, served entirely by domestic thermal and imports from Armenia, Azerbaijan and Russia; and that in the west, served by domestic hydro when those plants operate, or by imports from Russia and/or Turkey. Load growth may occur through out the system, but as principal industry and population are located toward the east, the load growth is also expected to be concentrated in the east. One conclusion of the analysis is thus also almost self-evident from the map: increasing reliability of the east-west transmission backbone may be the single most useful act that can be taken. We however, value the effects of that and other options, on average per kwh operating costs of the system. The GDM embodies this structure as described in Annex B.1.

“ENERGY BALANCE” OF GEORGIA POWER SECTOR PART 1: ANALYSIS AND PROPOSALS
Page 11 of 172

“ENERGY BALANCE” OF GEORGIA POWER SECTOR PART 1: ANALYSIS AND PROPOSALS
Page 12 of 172
Water % of Avg. 100%
Th. Must Run Yes
Khudoni No
Namakhvani No
Tvishi, Zhoneti No
Water % of Avg. 100%
Th. Must Run No
Khudoni No
Namakhvani No
Tvishi, Zhoneti No
1.D. COMPARISON OF MUST-RUN VS. LEAST COST
1.D.1 Description of Analysis Performed
Within each major part of our two basic scenarios (must-run and least cost)
we have performed 16 distinct scenarios. First, we considered the existing load, and then 4 additional scenarios with load increasing by a total of 10% increments. In those variants, we assumed the same monthly-hourly load shapes, but that the entire load increased by 10% in each hour.4 Then, for each load level, we looked at the effect of additional increments of planned new domestic hydro power plants. In the first increment, we add the Khudoni HPP. Then, we add the Namakhvani HPP, and finally add the remaining parts of the Namakhvani Cascade. We separated the two parts of the cascade since they are expected to e built in stages. However, when the last stage of Namakhvani Cascade is added, the practical result on many measures (such as average system cost) however, was minimal, as the analysis below will show. Thus, these combinations led to creating 16 scenarios, in each of the must-run and least cost dispatch modes.
The particular selection of case parameters for each scenario is indicated
on the top of the summary out-put pages, by a box as illustrated below. The top line of the box shows “Water % of Average”. That parameter means that the water level assumed for the particular run is the average historic water level, which also, is approximately the water level average of recent years.5 The next line shows whether the
scenario assumed thermal units in a must-run mode (“Th. must run” shows “Yes”), or if the scenario is in a least cost mode (Th. must run shows “No”). The next three lines show whether the indicated units are included (“Yes”), or not include (“No”) in the particular scenario. The two scenarios whose summary tabs
are given above (with current load levels and without the additional hydro units), are also the base cases against which other later scenarios are compared. Other details are summarized in the examples below. Detail output summaries from the scenario runs are given in Annexes G through I for the examples discussed in Chapter 1.
1.D.2 Must-Run Base Case
Table 1-1 below summarizes the results of the must-run base case
scenario. The individual scenario summary tables used later and in Annexes D and E are in this format. While the underlying results are hourly dispatch by 4 The GDM permits also reshaping the load, or making different growth assumptions for each
month, and study of the consequences. However, we had no current information that would have led to modeling changed load shapes. 5 In all 32 of the scenarios described in this chapter, this value is set at 100%; the parameter
is only used in the hydrological comparisons analysis of Chapter 4.

“ENERGY BALANCE” OF GEORGIA POWER SECTOR PART 1: ANALYSIS AND PROPOSALS
Page 13 of 172
month (represented in the graphs in Annexes G, H, I, J and K) it is convenient to summarize the results in an annual table.
Table 1-1 represents approximately the actual current operating conditions. Certain thermal units are set as must-run in winter months, Enguri is operated as in recent years, and loads are shaped as in recent years. The average generation cost including all of thermal, domestic hydro and imports used, is 4.28 tetri per kWh. While 45% of the total volume is domestic hydro, only about 20% of the cost of generation is hydro. This reflects that domestic hydro is priced well below replacement costs and well below the cost if imports. Domestic thermal units are about 18% of the volume, but about 36% of the cost, the exact opposite pattern to domestic hydro, and reflecting that it costs more to operate domestic thermal units (at current gas prices) than to import power.
The lower portion of the table discusses available export capacity. That is,
it reflects the amount of energy available from domestic units which was not dispatched for domestic uses by the model. The fact that domestic hydro power remains unused reflects in part, that thermal is forced to be used in the base case under current energy balance decisions, but also reflects that some amounts of hydro power may be available (due to water flow conditions) only at times when the total domestic load is less than the available power. Other implications of the computation of net energy available for export will be discussed later in this analysis, in Chapter 4.

“ENERGY BALANCE” OF GEORGIA POWER SECTOR PART 1: ANALYSIS AND PROPOSALS
Page 14 of 172
TABLE 1-1 MUST-RUN BASE CASE OUTPUT SUMMARY
The bottom of each such table has a short summary of the total domestic
hydro unit capacity assumed by the particular scenario. “Installed” refers to the rating of the units, while “Effective” refers to the assumed actual operating capacity of the units. This information is given simply to summarize the condition, but is not otherwise analyzed here.
The hourly patterns of use for each month of course differ substantially from
the aggregate of the table, and form each other. Annex C shows the monthly patterns of dispatch by fuel type, imports, and major units, for each of the 12 months. To provide summary descriptions of those patterns in the main text, here and elsewhere we will present and discuss the patterns shown in the months of September and April (also included in monthly graphs of the Annexes), and on the peak day of December 31 (which graph is not repeated in the Annexes. These periods offer useful illustrations since the three represent diverse periods of the year: in September, the system can normally be dispatched entirely from hydro and imports; on the peak day of December 31, all resources may be required; and in April, changing conditions may apply.
SCENARIO OUTPUT SUMMARY BASE CASE
Tetri/kwh Water % of Avg. 100%
Weighted Average Generation Cost Dispatched 4.26 Th. Must Run Yes
Weighted Average Cost Hydro 2.00 Khudoni No Weighted Average Cost Thermal 8.24 Namakhvani No Weighted Average Cost Imports 5.02 Tvishi, Zhoneti No
Sources of Generation: Total Average MWH % of Total KWH Cost Lari (1000) Volume
Domestic Hydro 3,621,002 20.03 45.30%
Domestic Thermal 1,505,381 82.41 18.83%
Imports 2,867,225 50.19 35.87%
Total 7,993,608 42.60 100.00%
Costs of Generation: Total Total Cost % of Total KWH Gel (Million) Cost
Domestic Hydro 3,621,002 72.54 21.30%
Domestic Thermal 1,505,381 124.06 36.44%
Imports 2,867,225 143.90 42.26%
Total 7,993,608 340.50 100.00%
Export Capacity: Total % of Total KWH Volume
Domestic Hydro 519,554 10.74%
Domestic Thermal 4,320,019 89.26%
Total 4,839,573 100.00%
Hydro Capacity (MW) Installed Effective Total 2,734 1,720.85
Peaking 2,111 1,305.00 Run of River 622 415.85
“ENERGY BALANCE” OF GEORGIA POWER SECTOR PART 1: ANALYSIS AND PROPOSALS
Page 15 of 172
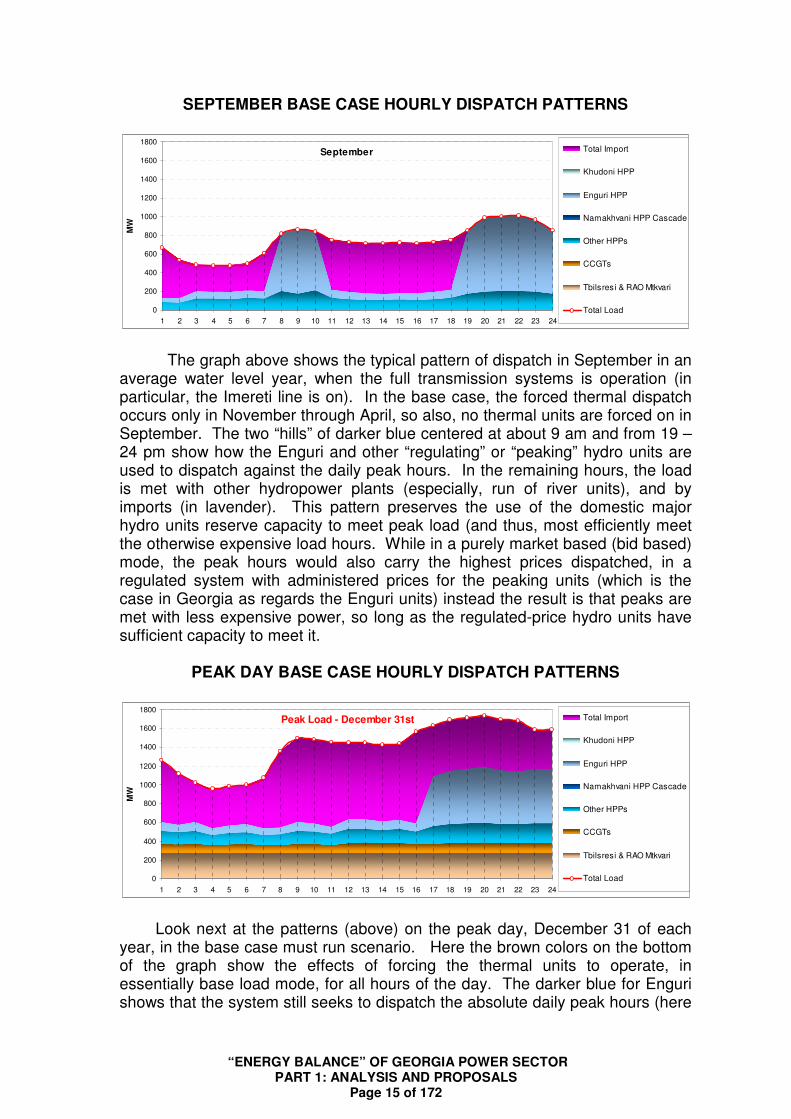
SEPTEMBER BASE CASE HOURLY DISPATCH PATTERNS
September
0
200
400
600
800
1000
1200
1400
1600
1800
1 2 3 4 5 6 7 8 9 10 11 12 13 14 15 16 17 18 19 20 21 22 23 24
MW
Total Import
Khudoni HPP
Enguri HPP
Namakhvani HPP Cascade
Other HPPs
CCGTs
Tbilsresi & RAO Mtkvari
Total Load
The graph above shows the typical pattern of dispatch in September in an average water level year, when the full transmission systems is operation (in particular, the Imereti line is on). In the base case, the forced thermal dispatch occurs only in November through April, so also, no thermal units are forced on in September. The two “hills” of darker blue centered at about 9 am and from 19 – 24 pm show how the Enguri and other “regulating” or “peaking” hydro units are used to dispatch against the daily peak hours. In the remaining hours, the load is met with other hydropower plants (especially, run of river units), and by imports (in lavender). This pattern preserves the use of the domestic major hydro units reserve capacity to meet peak load (and thus, most efficiently meet the otherwise expensive load hours. While in a purely market based (bid based) mode, the peak hours would also carry the highest prices dispatched, in a regulated system with administered prices for the peaking units (which is the case in Georgia as regards the Enguri units) instead the result is that peaks are met with less expensive power, so long as the regulated-price hydro units have sufficient capacity to meet it.
PEAK DAY BASE CASE HOURLY DISPATCH PATTERNS
Peak Load - December 31st
0
200
400
600
800
1000
1200
1400
1600
1800
1 2 3 4 5 6 7 8 9 10 11 12 13 14 15 16 17 18 19 20 21 22 23 24
MW
Total Import
Khudoni HPP
Enguri HPP
Namakhvani HPP Cascade
Other HPPs
CCGTs
Tbilsresi & RAO Mtkvari
Total Load
Look next at the patterns (above) on the peak day, December 31 of each
year, in the base case must run scenario. Here the brown colors on the bottom of the graph show the effects of forcing the thermal units to operate, in essentially base load mode, for all hours of the day. The darker blue for Enguri shows that the system still seeks to dispatch the absolute daily peak hours (here

“ENERGY BALANCE” OF GEORGIA POWER SECTOR PART 1: ANALYSIS AND PROPOSALS
Page 16 of 172
from about 18:00 to 24)00 hours), but there is sufficient capacity to only meet part of that peak, and, little available to meet the almost as severe peak that occurs around 9:00 hours. Thus, the balance is met by imports (lavender color).
APRIL BASE CASE HOURLY DISPATCH PATTERNS
April
0
200
400
600
800
1000
1200
1400
1600
1800
1 2 3 4 5 6 7 8 9 10 11 12 13 14 15 16 17 18 19 20 21 22 23 24
MW
Total Import
Khudoni HPP
Enguri HPP
Namakhvani HPP Cascade
Other HPPs
CCGTs
Tbilsresi & RAO Mtkvari
Total Load
In April, water has begun to return to Enguri (and other units with storage
capacity), while the extremes of hourly demand have lessened, as winter electric heating and lighting loads on the system also drop. Thermal power continues to be forced-dispatched at a base load operating mode (the brown color). But the proportion of each hour that can be met by domestic hydro, especially Enguri, is much higher and more even through the day. Enguri provides some small amount of peaking capability near 9:00 hours and in late evening, and in early morning hours almost completely displaces all imports.
Tetri/kwh
Weighted Average Generation Cost Dispatched 4.26 Weighted Average Cost Hydro 2.00
Weighted Average Cost Thermal 8.24 Weighted Average Cost Imports 5.02
Note from the summary table given earlier, reproduced above, that in the
base case, the annual weighted average cost of generation is 4.26 tetri per kwh, the average cost of the hydro actually uses (including Enguri at the regulated low rates in place in June 2006) is only 2 tetri/kwh, the cost f imports averages 5.02 tetri/kwh, and the cost of thermal, at June 2006 tariffs, is 8.24/ kwh. As the graphs above illustrate, this occurs since the system is forced to take thermal power. As will be apparent in the comparison below, this significantly raises the cost of energy dispatched.
The allocation of sources and relative total costs of energy dispatched, on
an annual total basis is also shown in the earlier summary table, and repeated below:

“ENERGY BALANCE” OF GEORGIA POWER SECTOR PART 1: ANALYSIS AND PROPOSALS
Page 17 of 172
Sources of Generation: Total Average MWH % of Total
KWH Cost Lari (1000) Volume
Domestic Hydro 3,621,002 20.03 45.30%Domestic Thermal 1,505,381 82.41 18.83%
Imports 2,867,225 50.19 35.87%
Total 7,993,608 42.60 100.00%
Costs of Generation: Total Total Cost % of Total
KWH Gel (Million) Cost
Domestic Hydro 3,621,002 72.54 21.30%Domestic Thermal 1,505,381 124.06 36.44%
Imports 2,867,225 143.90 42.26%
Total 7,993,608 340.50 100.00%
Thermal provides about 19% of the total energy (and, does that only in the months of November through April, when it is a much higher percentage of those months), but contributed over 36% of the annual costs, while hydro provides about 45% of the energy, but only 21% of the costs, with the balance taken by imports. The monthly averages are as follows:
BASE CASE MONTHLY AVERAGE KWH COST AND ALLOCATIONS OF HOURS DISPATCHED
GWH: Dispatched Sept. Oct Nov Dec Jan Feb Mar Apr May Jun Jul Aug Total
Hydro: 328 321 304 282 269 148 173 292 334 347 395 427 3,620 Thermal: - - 264 269 272 240 266 194 - - - - 1,506
Internal Generation: 328 321 568 551 542 387 439 487 334 347 395 427 5,126
Import: 203 291 114 299 286 311 317 205 286 209 186 162 2,867 Total 531 612 682 849 828 698 755 692 620 556 582 590 7,994
Avg. Cost /kwh Sept. Oct Nov Dec Jan Feb Mar Apr May Jun Jul Aug Total
Tetri/kwh 3.14 3.44 4.91 5.05 5.11 5.49 5.46 4.63 3.38 3.13 2.97 2.83 4.26 Notice that despite the artificially lower cost of domestic hydro, due to
regulation, the highest average costs still occur in the winter months. The highest cost months are February and March, ay near 5.5 tetri per kwh. This reflects the high percentage of both thermal must0rum and imports, in those months. The lowest cost months are July and August, just under 3 tetri/kwh, when the system can be operated almost entirely from domestic hydro. (The within month average costs for thermal, hydro and import are not given in the monthly table, since they are essentially the same in each month, as in the annual summary already given. It is the monthly (indeed, hourly) mix which changes the average cost that results.
In sum, the total annual purchase cost of energy for operation of the system in the must-run mode, is 340 million Lari, or about $189 million.

“ENERGY BALANCE” OF GEORGIA POWER SECTOR PART 1: ANALYSIS AND PROPOSALS
Page 18 of 172
1.D.3. Least Cost Base Case
The lease cost base case makes all of the same operational assumptions,
except, the forced dispatch of thermal units in the months November through April is removed. Instead, the GDM model picks only the least cost operations from among only available units, including thermal when required on a least cost basis. The least cost base case also assume that all of the principal transmission, including therefore, that the Imereti line, is operating normally. The summary result on annual totals of the least cost base case is given in Table 1-2 below:
Note first that the effect of least cost dispatch on average costs is
significant. The table above shows that the average annual cost of electricity drops from 4.26 tetri/kwh, to 3.66 tetri/ kwh, a drop of 0.60 Tetri/kwh. This causes a drop of about 14% in total cost, from 340 million Lari down to about 292 million Lari. The drop in cost is caused by the fact that on a least cost basis, thermal is almost never dispatched. (Though a small amount of thermal capacity is needed on the peak day, as the graphs below will illustrate). The amounts previously must-run dispatched from thermal, are instead dispatched from imports, which are cheaper. A corresponding effect, to be discussed in Chapter 4, is that this also makes available the thermal capacity for export or other uses. This is reflected in the summary table, which compared to the must-run base case summary Table 1-1, increases the energy available from thermal units by about 1.5 million kwh. This is a substantial and valuable resource if used correctly.

“ENERGY BALANCE” OF GEORGIA POWER SECTOR PART 1: ANALYSIS AND PROPOSALS
Page 19 of 172
TABLE 1-2 LEAST COST BASE CASE OUTPUT SUMMARY
SCENARIO OUTPUT SUMMARY BASE CASE - PURE LEAST COST
Tetri/kwh Water % of Avg. 100%Weighted Average Generation Cost Dispatched 3.66 Th. Must Run No
Weighted Average Cost Hydro 2.00 Khudoni No
Weighted Average Cost Thermal - Namakhvani No
Weighted Average Cost Imports 5.03 Tvishi, Zhoneti No
Sources of Generation: Total Average MWH % of Total
KWH Cost Lari (1000) Volume
Domestic Hydro 3,602,898 20.00 45.07%
Domestic Thermal - - 0.00%Imports 4,390,710 50.26 54.93%
Total 7,993,608 36.62 100.00%
Costs of Generation: Total Total Cost % of Total
KWH Gel (Million) Cost
Domestic Hydro 3,602,898 72.07 24.62%
Domestic Thermal - - 0.00%Imports 4,390,710 220.66 75.38%
Total 7,993,608 292.73 100.00%
Export Capacity: Total % of Total
KWH Volume
Domestic Hydro 537,658 8.45%Domestic Thermal 5,825,400 91.55%
Total 6,363,058 100.00%
Hydro Capacity (MW) Installed Effective
Total 2,734 1,720.85
Peaking 2,111 1,305.00
Run of River 622 415.85
The monthly effects are summarized in the tables below. The first table,
giving he amounts which change in total generation and unit price, shows the effect already noted: that energy displaced from thermal is substituted by imports. (The small entries for domestic hydro are an artifact of the model structure and the dispatchability of units and import lines, not a prediction of a significant change in use of domestic hydro):
CHANGE IN KWH COST AND ALLOCATIONS OF HOURS BETWEEN MR AND LC CASES
GWH: Dispatched Sept. Oct Nov Dec Jan Feb Mar Apr May Jun Jul Aug Total
Hydro: - - 8 (10) (7) (7) (12) 10 - - - - (17)
Thermal: - - (264) (269) (272) (240) (266) (194) - - - - (1,506)
Internal Generation: - - (256) (279) (279) (246) (279) (184) - - - - (1,523)
Import: - - 256 279 279 246 279 184 - - - - 1,523
Total - - - - - - - - - - - - -
Avg. Cost /kwh Sept. Oct Nov Dec Jan Feb Mar Apr May Jun Jul Aug Total
Tetri/kwh - - (1.27) (0.98) (1.04) (1.07) (1.08) (0.93) - - - - (0.60)
Note that the winter months, which are the months in which thermal is currently force-dispatched, have lower average costs by about 1 tetri/kwh each. The percentage effects are summarized in the table immediately following. In the months in which change occurs, the effect is from 20% to 25% monthly.6
6 The difference between the monthly and yearly value (an average of 14%) also strongly
demonstrates why pricing should be done based on the time when the costs are incurred.

“ENERGY BALANCE” OF GEORGIA POWER SECTOR PART 1: ANALYSIS AND PROPOSALS
Page 20 of 172
LEAST COST MONTHLY AVERAGE KWH COST AND ALLOCATIONS OF HOURS DISPATCHED
GWH: Dispatched Sept. Oct Nov Dec Jan Feb Mar Apr May Jun Jul Aug Total
Hydro: 328 321 311 272 263 141 160 303 334 347 395 427 3,603
Thermal: - - - - - - - - - - - - - Internal Generation: 328 321 311 272 263 141 160 303 334 347 395 427 3,603
Import: 203 291 370 578 565 557 595 389 286 209 186 162 4,391 Total 531 612 682 849 828 698 755 692 620 556 582 590 7,994
Avg. Cost /kwh Sept. Oct Nov Dec Jan Feb Mar Apr May Jun Jul Aug Total
Tetri/kwh 3.14 3.44 3.64 4.07 4.08 4.42 4.38 3.70 3.38 3.13 2.97 2.83 3.66
% CHANGE IN KWH COST AND ALLOCATIONS OF HOURS BETWEEN MR AND LC CASES
GWH: Dispatched Sept. Oct Nov Dec Jan Feb Mar Apr May Jun Jul Aug Total
Hydro: 0.0% 0.0% 2.6% -3.6% -2.4% -4.5% -7.1% 3.5% 0.0% 0.0% 0.0% 0.0% -0.5%
Thermal: 0.0% 0.0% -100.0% -100.0% -100.0% -100.0% -100.0% -100.0% 0.0% 0.0% 0.0% 0.0% -100.0%
Internal Generation: 0.0% 0.0% -45.2% -50.7% -51.5% -63.6% -63.5% -37.8% 0.0% 0.0% 0.0% 0.0% -29.7%
Import: 0.0% 0.0% 225.2% 93.4% 97.7% 79.4% 88.0% 90.0% 0.0% 0.0% 0.0% 0.0% 53.1%
Total 0.0% 0.0% 0.0% 0.0% 0.0% 0.0% 0.0% 0.0% 0.0% 0.0% 0.0% 0.0% 0.0%
Avg. Cost /kwh Sept. Oct Nov Dec Jan Feb Mar Apr May Jun Jul Aug Total
Tetri/kwh 0.0% 0.0% -25.8% -19.4% -20.3% -19.5% -19.7% -20.1% 0.0% 0.0% 0.0% 0.0% -14.0%
Comparing the monthly dispatch graphs for September, for the peak day and for April, show the detailed operational effect of use of pure least cost dispatch. The September graph is essentially identical to the must0run case, since in the must-run case, no thermal units were forced to run in September, and none are taken on a least cost basis.
SEPTEMBER LEAST COST HOURLY DISPATCH PATTERNS
September
0
200
400
600
800
1000
1200
1400
1600
1800
1 2 3 4 5 6 7 8 9 10 11 12 13 14 15 16 17 18 19 20 21 22 23 24
MW
Total Import
Khudoni HPP
Enguri HPP
Namakhvani HPP Cascade
Other HPPs
CCGTs
Tbilsresi & RAO Mtkvari
Total Load
The opposite pattern occurs in April. In the must run case, thermal units were intentionally dispatch in April. but in the least cost case, none are selected in April. Instead, in April, as in all other months in which thermal units are forced in the must-run case, lower cost imports and increased hydro is used. Domestic hydro is taken when available, first, based on cost, and then imports. Thermal, being higher cost, is never selected.

“ENERGY BALANCE” OF GEORGIA POWER SECTOR PART 1: ANALYSIS AND PROPOSALS
Page 21 of 172
APRIL LEAST COST HOURLY DISPATCH PATTERNS
April
0
200
400
600
800
1000
1200
1400
1600
1800
1 2 3 4 5 6 7 8 9 10 11 12 13 14 15 16 17 18 19 20 21 22 23 24
MW
Total Import
Khudoni HPP
Enguri HPP
Namakhvani HPP Cascade
Other HPPs
CCGTs
Tbilsresi & RAO Mtkvari
Total Load
PEAK DAY LEAST COST HOURLY DISPATCH PATTERNS
Peak Load - December 31st
0
200
400
600
800
1000
1200
1400
1600
1800
1 2 3 4 5 6 7 8 9 10 11 12 13 14 15 16 17 18 19 20 21 22 23 24
MW
Total Import
Khudoni HPP
Enguri HPP
Namakhvani HPP Cascade
Other HPPs
CCGTs
Tbilsresi & RAO Mtkvari
Total Load
The only except for use of thermal in the least cost case is that, on the extreme peaks of the peak day, December 31 of each year, then a small amount of thermal is required for a portion of the peak hours, as shown in the graphs below. While this fact is significant, and demonstrates that in the Georgian system some amount of thermal generation is required for extreme cases of peak regulation, the amount is not sufficient to even affect the reported annual total in the summary tables of total output. The total required, and only on the peak day, is about 200 MW, and only for about 7.5 hours. Note that, if Enguri had only a bit more capacity (such as may result from the ongoing rehabilitation efforts), or essentially any additional domestic thermal were available, then thermal units would not be dispatched at all, even on extreme conditions in peak day hours.
1.E. IMPACT OF ADDITIONAL CAPACITY AND LOAD GROWTH
1.E.1 Description of Analysis Performed
As noted, a total of 16 scenarios were run in both the must-run and the
least cost cases. These were the base case capacity plus there variants of increased capacity (Khudoni, Namakhvani itself, and the remainder of the Namakhvani Cascade), and the current total system demand, and variants adding 10%, 20% and 30% to total demand, in all hours of each month. Detail

“ENERGY BALANCE” OF GEORGIA POWER SECTOR PART 1: ANALYSIS AND PROPOSALS
Page 22 of 172
summaries of the 16 cases are given in Annex C for must-run, and in Annex E for least cost.
Annex F then has nine tables. The first three tables in Annex F summarize the variations among the 16 cases for the must-run condition, respectively for their effect on weighted average cost of generation dispatched, on allocation of sources of generation by fuel type, and on cost of generation. The tables all separate effects also by fuel type (thermal, domestic hydro, imports). The second set of three tables similarly summarizes the least cost case. Finally the last set of three tables compares the two base cases, by subtracting the must-run values from the least cost values. Thus, in the comparison tables, a positive entry means the least cost variant is higher on that measure, and a negative entry means the least cost variant is lower on that measure.
1.E.2 Must-run Case Variations
We discuss first the effect of adding capacity in the must-run case. The
intended first addition of capacity is the completion of the Khudoni HPP, an about 638 MW storage hydro plant on the Enguri river, upstream from the existing Enguri HPP. The results of this change are summarized in Table 1-3 (also found in Annex C).
Comparing Table 1-3 to Table 1-1, the weighted average cost of energy dispatched decreases from about 4.26 tetri/kwh to about 4.18 tetri/kwh. Detail comparison of the entries in the two tables shows why this occurs. The amount of thermal dispatched remains constant; it is still forced in the November through April period. But, the model substitutes domestic hydro, from Khudoni, for imports, in any hours when it can do so. Domestic hydro as a percentage of total Georgian load increases from about 45% to about 69% of total source of supply, while decreases reliance on imports by the same amounts.

“ENERGY BALANCE” OF GEORGIA POWER SECTOR PART 1: ANALYSIS AND PROPOSALS
Page 23 of 172
TABLE 1-3: MUST-RUN CASE WITH KHUDONI AND CURRENT LOAD
SCENARIO OUTPUT SUMMARY BASE CASE
Tetri/kwh Water % of Avg. 100%
Weighted Average Generation Cost Dispatched 4.18 Th. Must Run Yes
Weighted Average Cost Hydro 2.90 Khudoni Yes
Weighted Average Cost Thermal 8.25 Namakhvani No
Weighted Average Cost Imports 5.02 Tvishi, Zhoneti No
Sources of Generation: Total Average MWH % of Total
KWH Cost Lari (1000) Volume
Domestic Hydro 5,514,396 28.97 68.99%
Domestic Thermal 1,538,317 82.45 19.24%Imports 940,895 50.19 11.77%
Total 7,993,608 41.76 100.00%
Costs of Generation: Total Total Cost % of Total
KWH Gel (Million) Cost
Domestic Hydro 5,514,396 159.76 47.86%
Domestic Thermal 1,538,317 126.84 38.00%Imports 940,895 47.22 14.15%
Total 7,993,608 333.82 100.00%
Export Capacity: Total % of Total
KWH Volume
Domestic Hydro 1,003,201 18.96%Domestic Thermal 4,287,083 81.04%
Total 5,290,283 100.00%
Hydro Capacity (MW) Installed Effective
Total 3,372 2,358.95
Peaking 2,749 1,943.10
Run of River 622 415.85
The overall effect of this on weighted average cost of generation however is
modest, because of the prices assumed for Khudoni. Since our separate more detailed analyses7 of the Khudoni HPP and of the Namakhvani Cascade demonstrated that the Khudoni HPP can only be financed if most of the output is priced at the import price, we have assumed in the GDM that all incremental output from new major hydro units is prices just under that of imports. Clearly, a targeted regulatory policy would lead to exactly such effects. By assuming the price for Khudoni or other new plants is only a small amount lower than for imports, we simulate the quantitative effect, and avoid making judgments about likely regulatory policies. (Our advised policy however is that all output should be priced at not less than its actual cost of production, including all capital costs with a normal profit, and all operating costs. In a pure market, this is likely to result that domestic hydro will be at least, slightly lower cost than imports, since the transmission costs of import, at least, are avoided.) This also explains why the average cost of domestic hydro in Table 1-3 is slightly higher than in Table 1-1; the increased use of domestic hydro of high cost, increases the weighted average cost of domestic hydro. But the increases in domestic use are off-
7 See: Prefeasibility Study of the Khudoni HPP, completed July 2005), and Prefeasibility Study of the
Namakhvani Cascade, completed July 2006.

“ENERGY BALANCE” OF GEORGIA POWER SECTOR PART 1: ANALYSIS AND PROPOSALS
Page 24 of 172
setting higher cost imports, so the average cost of all generation dispatched against domestic load, decreases.
We do not include tables for the two increments of capacity with the units of
Namakhvani, since as can be seen in the tables in Annex C or the summary tables in Annex F, the incremental effects are small. In effect, the addition of the Namakhvani Cascade, in the GDM model, is to increase capacity for export, so long as domestic load remains constant.
Now consider the effect of increasing load in the base case, without adding
additional domestic capacity. This result is summarized in Table 1-4. In this case, compared to Table 1-1, average cost of energy dispatched increases to 4.43 tetri/kwh. This occurs since all available domestic energy is already dispatched by the GDM. But the GDM picks least cost dispatch unless some other dispatch is forced by must-run conditions. Since the least cost increment of capacity is thus imports, the GDM meets the increased load from imports. The volume of imports increases from about 2,867 million kwh (about 36% of volume and 42% of costs) to 5,089 million kwh (about 50% of volume and 56.5% of total cost. Since the imports cost is higher than the previous average, the average cost of the new mist is of course also higher. Table for the intermediate steps (10% and 20% increases) are given n Annex C, and summarized in Annex F, and show this increase in volumes and average costs occurs in about equal proportions per percentage of increased load. In absence of new capacity, there is no other choice.
Finally, in Table 1-5, we show the effect of adding all of the planned
capacity, and an increment of 30% in domestic load. As before, essentially all of the cost effects are created by the addition of Khudoni, and the detail is available in Annex C. In summary, adding load sill increases average cost, but by a lesser amount. Id does so, since adding load means that the marginally added increments are also higher cost than the previously used units: whether new hydro or increased imports. However, as before, we assume that domestic new hydro is at least slightly lower cost than imports, thus, the cost increase effect is somewhat lower than if no new domestic resources were added. The use of imports now reaches about 26% of the total, instead of 50%, while domestic hydro increases to about 41% of supply.

“ENERGY BALANCE” OF GEORGIA POWER SECTOR PART 1: ANALYSIS AND PROPOSALS
Page 25 of 172
TABLE 1-4: MUST-RUN BASE CASE, LOAD INCREASED 30%
SCENARIO OUTPUT SUMMARY 30% GROWTH - BASE CASE
Tetri/kwh Water % of Avg. 100%
Weighted Average Generation Cost Dispatched 4.43 Th. Must Run YesWeighted Average Cost Hydro 2.00 Khudoni No
Weighted Average Cost Thermal 8.24 Namakhvani No
Weighted Average Cost Imports 5.02 Tvishi, Zhoneti No
Sources of Generation: Total Average MWH % of Total
KWH Cost Lari (1000) Volume
Domestic Hydro 3,611,819 20.05 35.36%
Domestic Thermal 1,513,387 82.42 14.82%Imports 5,089,625 50.23 49.83%
Total 10,214,831 44.33 100.00%
Costs of Generation: Total Total Cost % of Total
KWH Gel (Million) Cost
Domestic Hydro 3,611,819 72.41 15.99%
Domestic Thermal 1,513,387 124.74 27.55%Imports 5,089,625 255.65 56.46%
Total 10,214,831 452.79 100.00%
Export Capacity: Total % of Total
KWH Volume
Domestic Hydro 528,737 10.92%Domestic Thermal 4,312,013 89.08%
Total 4,840,750 100.00%
Hydro Capacity (MW) Installed Effective
Total 2,734 1,720.85
Peaking 2,111 1,305.00
Run of River 622 415.85

“ENERGY BALANCE” OF GEORGIA POWER SECTOR PART 1: ANALYSIS AND PROPOSALS
Page 26 of 172
TABLE 1-5: MUST-RUN WITH NEW CAPACITY AND 30% LOAD INCREASE
SCENARIO OUTPUT SUMMARY 30% GROWTH - BASE CASE
Tetri/kwh Water % of Avg. 100%
Weighted Average Generation Cost Dispatched 4.34 Th. Must Run YesWeighted Average Cost Hydro 3.33 Khudoni Yes
Weighted Average Cost Thermal 8.25 Namakhvani YesWeighted Average Cost Imports 5.02 Tvishi, Zhoneti Yes
Sources of Generation: Total Average MWH % of Total
KWH Cost Lari (1000) Volume
Domestic Hydro 7,052,091 33.32 69.04%
Domestic Thermal 1,536,835 82.45 15.05%Imports 1,625,905 50.19 15.92%
Total 10,214,831 43.40 100.00%
Costs of Generation: Total Total Cost % of Total
KWH Gel (Million) Cost
Domestic Hydro 7,052,091 235.00 53.01%Domestic Thermal 1,536,835 126.72 28.58%
Imports 1,625,905 81.60 18.41%
Total 10,214,831 443.31 100.00%
Export Capacity: Total % of Total
KWH Volume
Domestic Hydro 920,761 17.68%Domestic Thermal 4,288,565 82.32%
Total 5,209,326 100.00%
Hydro Capacity (MW) Installed Effective
Total 3,772 2,758.95
Peaking 3,149 2,343.10
Run of River 622 415.85
1.E.3 Least Cost Case Variations
In all of the above tables, the amount of thermal dispatched is exactly the
same. That occurs since, as discussed earlier, on a least cost basis, there is essentially no reason to dispatch thermal for domestic load, except for a small amount and only on the single system peak day. As we show here, when the system is operated entirely on least cost, then average costs drop very significantly, and as even a small amount of new domestic hydro capacity is added, the need for thermal even on a peak day, goes to zero, even with an increase of 30% in total load. Table 1-2 showed the effect on the least cost case of pure least cost with existing capacity and existing load. Comparing to Table 1-3, the average cost of generation drops by 0.60 tetri, to 3.66 tetri/kwh, a drop of 14% Table 1.6 below then shows he effect of adding the capacity of Khudoni is to further lower average cost by 0.10 tetri/kwh. The analysis is similar to the base case effect under the must run condition. The increment of Khudoni adds some ability to further offset impost, at a lower cost. In the least cost case, adding Khudoni of itself does not have a large impact on cost, since the largest impact was simply
“ENERGY BALANCE” OF GEORGIA POWER SECTOR PART 1: ANALYSIS AND PROPOSALS
Page 27 of 172
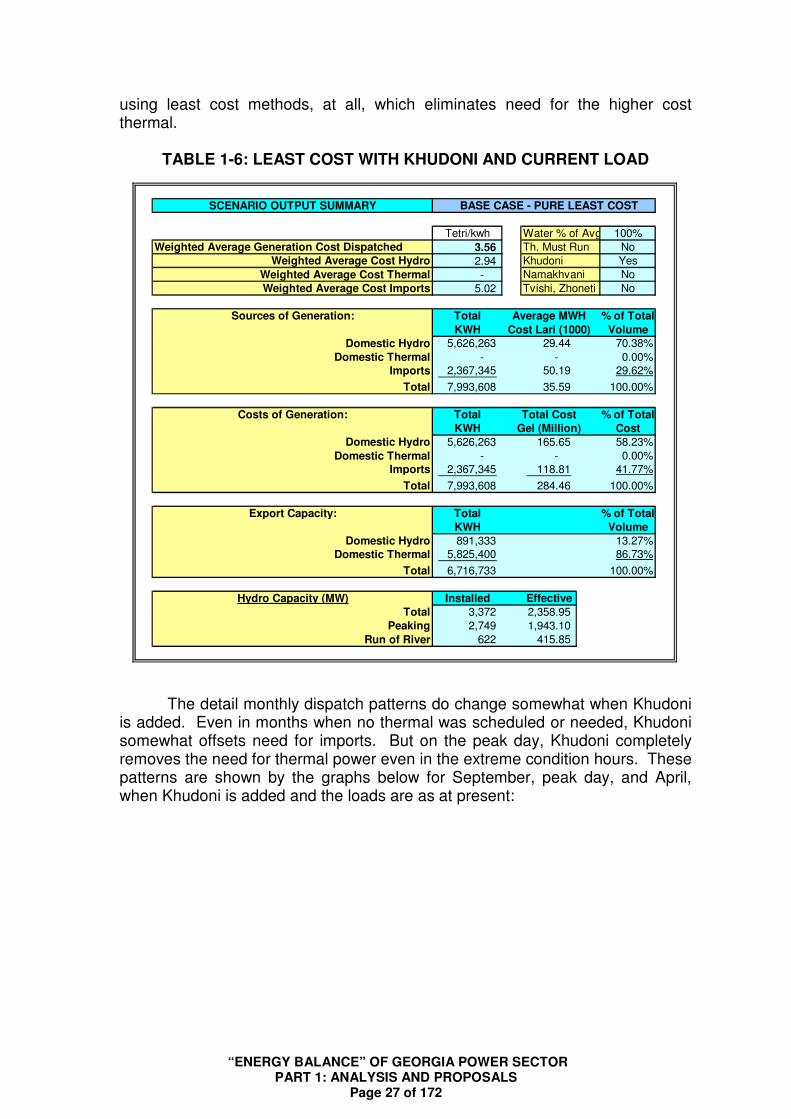
using least cost methods, at all, which eliminates need for the higher cost thermal.
TABLE 1-6: LEAST COST WITH KHUDONI AND CURRENT LOAD
SCENARIO OUTPUT SUMMARY BASE CASE - PURE LEAST COST
Tetri/kwh Water % of Avg. 100%Weighted Average Generation Cost Dispatched 3.56 Th. Must Run No
Weighted Average Cost Hydro 2.94 Khudoni Yes
Weighted Average Cost Thermal - Namakhvani No
Weighted Average Cost Imports 5.02 Tvishi, Zhoneti No
Sources of Generation: Total Average MWH % of Total
KWH Cost Lari (1000) Volume
Domestic Hydro 5,626,263 29.44 70.38%
Domestic Thermal - - 0.00%Imports 2,367,345 50.19 29.62%
Total 7,993,608 35.59 100.00%
Costs of Generation: Total Total Cost % of Total
KWH Gel (Million) Cost
Domestic Hydro 5,626,263 165.65 58.23%
Domestic Thermal - - 0.00%Imports 2,367,345 118.81 41.77%
Total 7,993,608 284.46 100.00%
Export Capacity: Total % of Total
KWH Volume
Domestic Hydro 891,333 13.27%Domestic Thermal 5,825,400 86.73%
Total 6,716,733 100.00%
Hydro Capacity (MW) Installed Effective
Total 3,372 2,358.95 Peaking 2,749 1,943.10
Run of River 622 415.85
The detail monthly dispatch patterns do change somewhat when Khudoni is added. Even in months when no thermal was scheduled or needed, Khudoni somewhat offsets need for imports. But on the peak day, Khudoni completely removes the need for thermal power even in the extreme condition hours. These patterns are shown by the graphs below for September, peak day, and April, when Khudoni is added and the loads are as at present:

“ENERGY BALANCE” OF GEORGIA POWER SECTOR PART 1: ANALYSIS AND PROPOSALS
Page 28 of 172
The hourly graph for September when Khudoni is added is as follows:
September
0
200
400
600
800
1000
1200
1400
1600
1800
1 2 3 4 5 6 7 8 9 10 11 12 13 14 15 16 17 18 19 20 21 22 23 24
MW
Total Import
Khudoni HPP
Enguri HPP
Namakhvani HPP Cascade
Other HPPs
CCGTs
Tbilsresi & RAO Mtkvari
Total Load
The hourly graph for the peak day, December 31, with Khudoni, is as follows:
Peak Load - December 31st
0
200
400
600
800
1000
1200
1400
1600
1800
1 2 3 4 5 6 7 8 9 10 11 12 13 14 15 16 17 18 19 20 21 22 23 24
MW
Total Import
Khudoni HPP
Enguri HPP
Namakhvani HPP Cascade
Other HPPs
CCGTs
Tbilsresi & RAO Mtkvari
Total Load
And the graph for April when Khudoni is present with current load, is as follows:
April
0
200
400
600
800
1000
1200
1400
1600
1800
1 2 3 4 5 6 7 8 9 10 11 12 13 14 15 16 17 18 19 20 21 22 23 24
MW
Total Import
Khudoni HPP
Enguri HPP
Namakhvani HPP Cascade
Other HPPs
CCGTs
Tbilsresi & RAO Mtkvari
Total Load
The effect of further adding the units of the Namakhvani Cascade is to then further offset the need for imports in all periods. We do not give the graphs for the current load case when Namakhvani is added.
When load is added, then the effect on loads from adding capacity is again
that in the least cost case, adding domestic capacity obviously offsets the need for imports. The details are given in Tables 1-7 below, for the case when Khudoni is not built, and thus all increments come from Imports. Because the

“ENERGY BALANCE” OF GEORGIA POWER SECTOR PART 1: ANALYSIS AND PROPOSALS
Page 29 of 172
total load is increased, using capacity whose marginal cost is near the import price, the average cost increases, from 3.66 tetri/kwh to 4.07 tetri/kwh.
TABLE 1-7: LEAST COST BASE CASE, LOAD INCREASED 30%
SCENARIO OUTPUT SUMMARY 30% GROWTH - PURE LEAST COST
Tetri/kwh Water % of Avg. 100%
Weighted Average Generation Cost Dispatched 4.07 Th. Must Run NoWeighted Average Cost Hydro 2.00 Khudoni No
Weighted Average Cost Thermal 8.19 Namakhvani No
Weighted Average Cost Imports 5.06 Tvishi, Zhoneti No
Sources of Generation: Total Average MWH % of Total
KWH Cost Lari (1000) Volume
Domestic Hydro 3,494,891 20.03 34.21%
Domestic Thermal 187,650 81.86 1.84%Imports 6,532,290 50.58 63.95%
Total 10,214,831 40.70 100.00%
Costs of Generation: Total Total Cost % of Total
KWH Gel (Million) Cost
Domestic Hydro 3,494,891 70.01 16.84%
Domestic Thermal 187,650 15.36 3.69%Imports 6,532,290 330.37 79.46%
Total 10,214,831 415.75 100.00%
Export Capacity: Total % of Total
KWH Volume
Domestic Hydro 645,665 10.28%Domestic Thermal 5,637,750 89.72%
Total 6,283,415 100.00%
Hydro Capacity (MW) Installed Effective
Total 2,734 1,720.85
Peaking 2,111 1,305.00
Run of River 622 415.85
Table 1-8 then shows the case when if Khudoni is added, and load has increased by 30%. In this case, the primary effect is to offset additional imports. The net added effect on cost is comparatively small compared to Table 1-7 since it is also assumed that Khudoni requires a price near the import price to be sustainable economically, but still noticeable, since Khudoni offsets in particular the more expensive components of imports. Thus there is a drop of about 0.20 tetri/kwh from adding Khudoni and substituting for imports (at the assume prices). Adding additional capacity does not further enhance this effect, though some additional imports are offset also by Namakhvani. The details are given in Annex D.

“ENERGY BALANCE” OF GEORGIA POWER SECTOR PART 1: ANALYSIS AND PROPOSALS
Page 30 of 172
TABLE 1-8: LEASTCOST WITH KHUDONI, AND 30% LOAD INCREASE
SCENARIO OUTPUT SUMMARY 30% GROWTH - PURE LEAST COST
Tetri/kwh Water % of Avg. 100%Weighted Average Generation Cost Dispatched 3.87 Th. Must Run No
Weighted Average Cost Hydro 3.02 Khudoni Yes
Weighted Average Cost Thermal - Namakhvani No
Weighted Average Cost Imports 5.03 Tvishi, Zhoneti No
Sources of Generation: Total Average MWH % of Total
KWH Cost Lari (1000) Volume
Domestic Hydro 5,879,461 30.16 57.56%
Domestic Thermal - - 0.00%Imports 4,335,370 50.32 42.44%
Total 10,214,831 38.72 100.00%
Costs of Generation: Total Total Cost % of Total
KWH Gel (Million) Cost
Domestic Hydro 5,879,461 177.32 44.84%
Domestic Thermal - - 0.00%Imports 4,335,370 218.15 55.16%
Total 10,214,831 395.47 100.00%
Export Capacity: Total % of Total
KWH Volume
Domestic Hydro 638,136 9.87%Domestic Thermal 5,825,400 90.13%
Total 6,463,536 100.00%
Hydro Capacity (MW) Installed Effective
Total 3,372 2,358.95 Peaking 2,749 1,943.10
Run of River 622 415.85
More interesting however is that with increased load growth, then on the peak day (only) a need for additional thermal appears, when only Khudoni is added:
Peak Load - December 31st
-300
200
700
1200
1700
2200
1 2 3 4 5 6 7 8 9 10 11 12 13 14 15 16 17 18 19 20 21 22 23 24
MW
Total Import
Khudoni HPP
Enguri HPP
Namakhvani HPP Cascade
Other HPPs
CCGTs
Tbilsresi & RAO Mtkvari
Total Load
And, this need for thermal (only on the December 31 peak day) remains in
some hours, but at bit lower level, even if Namakhvani is also added:

“ENERGY BALANCE” OF GEORGIA POWER SECTOR PART 1: ANALYSIS AND PROPOSALS
Page 31 of 172
Peak Load - December 31st
-300
200
700
1200
1700
2200
1 2 3 4 5 6 7 8 9 10 11 12 13 14 15 16 17 18 19 20 21 22 23 24
MW
Total Import
Khudoni HPP
Enguri HPP
Namakhvani HPP Cascade
Other HPPs
CCGTs
Tbilsresi & RAO Mtkvari
Total Load
1.F COMPARISON OF LEAST COST AND MUST-RUN CASES
It is clear that use of pure least cost would reduce the need for thermal
energy in Georgia, and would significantly reduce system total operating costs for energy. This is an expected result, and one of the principal reasons that least cost dispatch (for all power other than contract power) is the preferred mode in nearly all systems. Though, in systems with bid prices rather than tariff cost-based prices, the same result occurs from dispatch based on least bid price. (Indeed that result is more efficient economically than is least cost dispatch from tariffs based on regulatory visions of “cost”).
We can also conclude that except on the peak day, using least cost dispatch on an interconnected system with imports available, there is no need to dispatch thermal units at all on the Georgian grid. In Chapter 2, we will analyze the impact if imports were not available. However, the fact that on the peak day (December 31) there remains a need to dispatch a few hours of thermal power (at about 200 MW) emphasizes that even with an interconnected regional grid, there is still at least some need for use of domestic thermal power for reliability purposes. The fact that thermal already exists as a resource in Georgia, and can be used for reliability, is therefore actually a valuable asset, which will be discussed further in Chapter 4.
The modeling shows that when capacity is added, the principal effects on
Georgian costs are felt from the first major increment of capacity added (the “marginal unit of capacity”). As we do not have a cost basis for raking new hydro projects, we thus relied only on the assumed sequencing of projects used also by the Government. In our models, therefore, the “marginal unit” was selected to be the Khudoni HPP. Any equivalent amount of capacity with that cost structure would have the same effect. The models also show that any capacity added beyond the first major addition, has some, but minimal, additional effect on Georgian domestic prices. But incremental domestic capacity does have an important effect on export capacity, as also discussed in Chapter 4.
Finally, load growth will tend to increase system average operations costs,
in both cases (relative to the starting base case conditions). But those effects are mitigated if the major new hydro units are added. Under least cost dispatch, which is also the dispatch rule in our GDM model when “must-run” conditions are not applied, the principal effect of adding new units is first to offset imports. This

“ENERGY BALANCE” OF GEORGIA POWER SECTOR PART 1: ANALYSIS AND PROPOSALS
Page 32 of 172
occurs as a result of the assumption of the GDM that new domestic hydro will cost (at least) slightly less than imports as a result, at least, of lack of need for transmission fees for imports.
Assuming still lower prices for new hydro, such as may result from non-cost
based regulation, would produce the same effect as to rank order dispatch of units. All results could vary of course, if regulation determined prices, of if prices varied significantly from our assumptions for other reasons. The GDM assumes current prices and tariffs as of June 2006. Implicitly, it also assumes that the import price reflects a regional market prices, which assumption is supported by the fact that our separate modeling of new hydro capacity and operating costs is approximately the import price per kwh. That is, the import price if also assumed as an export price, is also a price for new hydro capacity sufficient to pay for expected real costs of capital including return of and on investment.

“ENERGY BALANCE” OF GEORGIA POWER SECTOR PART 1: ANALYSIS AND PROPOSALS
Page 33 of 172
2. PROBLEMS OF SYSTEM RELIABILITY:
2A. IMPACT OF SUPPLY INTERRUPTIONS IN GEORGIA
The terms “reliability”, and “security” in a power system each have several
different, though somewhat related, technical meanings. The simplest meaning that encompasses them all is uninterrupted delivery of energy to consumers, in a manner that does not damage consumer devices. The consumer may not care, but the system planner or manager must care, about the details of how that is achieved. At the most basic, the equipment itself must be in good working order. But especially in power systems, the interconnected nature of the systems, and the subtleties of the physics behind the systems, means much more than simply well operating electrical devices. The present study concentrates principally on understanding just the more obvious components of reliability: adequate quantities of energy, delivered at the times required, at the least cost manner. We thus also do not treat in this study, outside of this chapter, some important components of reliability, which in turn can affect the results found here. Consider here first the differences between reliability (in terms of delivery “at all” of energy) of the high voltage transmission system, of the lower voltage local distribution (delivery) systems, and of consumer judgments that may result from their actions. In Georgia, as noted above, most of the energy producing capacity is hydro power and lies in the west of the country. Most of the load, and most of the fast-reacting thermal capacity, resides in the east. In Georgia there is presently just one main high voltage transmission line connecting the western and eastern portions of the country, the Imereti Line. If the line is working properly, then the least cost operation of the dispatch of energy, relying principally on hydro power, is feasible. Annexes G, H and I give the monthly (typical day hourly patters) of dispatch by fuel type when the Imereti line is “on”. These tables also support the analysis given of the two dispatch rules studied in Chapter 1: “must run” and “least cost”. Annex I however shows what happens on hours of typical days, by month, when the Imereti line is interrupted. The patterns are obviously radically different. Since, loss of the Imereti line necessarily implies use of imports from connections in the eastern part o the country, or use of and/or additional thermal units located also in the eastern part of Georgia, we show in Annex I only the example when the thermal units are “mist run” in winter months. The most critical differences therefore occur in the non-winter months, when thermal would not otherwise be operating for “base load” operation. Recall that the GDM model dispatches all units in least cost order, after the must-run schedules have been met. So in months when there was no unit scheduled for must-run, the results of both cases are the same: pure least cost).

“ENERGY BALANCE” OF GEORGIA POWER SECTOR PART 1: ANALYSIS AND PROPOSALS
Page 34 of 172
September
-200
0
200
400
600
800
1000
1200
1400
1600
1800
1 2 3 4 5 6 7 8 9 10 11 12 13 14 15 16 17 18 19 20 21 22 23 24
MW
Total Import
Khudoni HPP
Enguri HPP
Namakhvani HPP Cascade
Other HPPs
CCGTs
Tbilsresi & RAO Mtkvari
Total Load
The graph above (taken from Annex I) illustrates the effect on September hours when the Imereti line is not available in that period. The previously shown graphs for September had essentially all of the load served by domestic Georgian hydro units located in western Georgia. But in the example above, essentially all of the load is served instead by imports via lines in the east, or by use of domestic thermal that was not otherwise used at all. Notice also, as may be inferred from the hours between 1 am and 6 am, the GDM picks imports first, and only uses domestic thermal when the load rises further. These increments are expensive: domestic thermal costs from about 2 tetri to abut 5 tetri per kwh. imports cost about 5.2 tetri/kwh; while domestic thermal has a tariff of at about 8.5 tetri/kwh. One way to envision the value of a reliable transmission grid, and also of use of western Georgia hydro capacity, is to look at the entire system for a year, if the Imereti line did not exist. This is done in the table below, based on comparison of the output of Annex I to that f the must-run base case, Annex F.
TABLE 2-1 COMPARISON OF PRODUCTION COSTS WITH AND WITHOUT IMERETI LINE
Comparison of Generaiton Costs /kwh
Lari/kwh Sept. Oct Nov Dec Jan Feb Mar Apr May Jun Jul Aug Avg.
Imereti On 3.14 3.44 4.91 5.05 5.11 5.49 5.46 4.63 3.38 3.13 2.97 2.83 4.13Imereit off 6.06 5.88 6.13 6.45 6.29 6.28 6.28 6.39 5.95 5.99 5.98 5.95 6.14
Increment Outage 2.92 2.44 1.22 1.40 1.18 0.79 0.82 1.77 2.57 2.86 3.01 3.12 2.01% of kwh Cost Increment 93.2% 71.0% 24.7% 27.7% 23.0% 14.4% 15.0% 38.2% 75.9% 91.3% 101.0% 110.0% 57.1%
Incremental Cost Of Replacement:
Million Lari Sept. Oct Nov Dec Jan Feb Mar Apr May Jun Jul Aug Avg.
Monthly 48.49 54.69 37.14 57.51 51.22 65.42 58.05 47.90 54.58 48.88 47.42 46.49 51.48Daily 1.62 1.76 1.24 1.86 1.65 2.34 1.87 1.60 1.76 1.58 1.53 1.50 1.69Hourl 0.07 0.07 0.05 0.08 0.07 0.10 0.08 0.07 0.07 0.07 0.06 0.06 0.07
The impact of not having western Georgian power is thus stunning. In
many months this would doubt the cost of energy, and on average, would increase it by about 57%. The average monthly cost of replacement energy is about 51.48 million Gel, or about 617 million Gel annually. Clearly, the value of an operating high voltage transmission grid in Georgia is very high. A more limited analysis is to look just at the impact of lost high voltage transmission capacity however could also be valued on the more limited basis of just the cost of the replacement power in the hours when interrupted. Table 2-?/

“ENERGY BALANCE” OF GEORGIA POWER SECTOR PART 1: ANALYSIS AND PROPOSALS
Page 35 of 172
below reports high voltage transmission system outage data for the most recently available four years 2002 through the first seven months of 2005. The first block (on the left) shows the total number of kwh that were not supplied due to interruptions of the high voltage system (generally though most of this is on the Imereti line). Since the total system consumes about 8 GWH, the values shown here, even in the largest years, are less than ¼ of 1% of that actual consumption. If we consider only that effect, then the other two blocks estimate the impacts of those interruptions. The middle block assumes that the replacement cost of energy is to use thermal. In fact, based on visual review of charts in Annex I, this occurs perhaps half of the hours; the rest are imported. But even so, imports also cost more than any domestic hydro power. The table above summarizes the amount, cost and economic value of energy that was not delivered due to unscheduled outages of the transmission system. (Thus, this does not consider outages due to unscheduled distribution system failures, nor, loss of generation capacity.) The annual range of cost to replace this lost transmission of energy is between about 10,000,000 and 20,000,000 Gel. This is, interestingly enough, also about the value of the directly measured lost production within the economy, from non-availability of that exact amount of energy.
TABLE 2-2 ANNUAL ECONOMIC VALUE AND REPLACEMENT COST OF UNSCHEDULED OUTAGES
ON THE HIGH VOLTAGE TRANSMISSION SYSTEM8
YEAR
Total GSE Other Total GSE Other Total GSE Other
2002200220022002 10,374 1,511 8,864 8,818 1,284 7,534 9,467 1,378 8,088
2003200320032003 22,377 698 21,679 19,020 593 18,427 20,419 636 19,782
2004200420042004 15,301 2,252 13,049 13,006 1,914 11,092 13,962 2,055 11,907
2005*2005*2005*2005* 10,252 1,472 8,780 8,714 1,251 7,463 9,355 1,343 8,011
* 7 MONTHS
ECONOMIC VALUE AND REPLACEMENT COST OF
UNSCHEDULED TRANSMISSION SYSTEM OUTAGES
Nonsupplied Energy
kWh (Millions)
Cost of Replacement
Energy (Gel, 1000)
Value of Nonsupplied
Energy (Gel, 1000)
The above amount however is simply the loss due to measured outages of the high voltage system. In 2005 the BP pipeline commissioned a study of the cost of all unreliability on the Georgia grid. That is, they measured not simply the losses from measured unserved load associated with particular identified high voltage system interruptions, but also, the much larger loss that arises from all sources of cost induced by unstable supply. These include costs for industry (and others) to create and maintain back-up generation units; the effects of unserved energy from distribution as well as transmission outages; damages to equipment from unstable quality of voltage and frequency; loss of production by decisions to not operate for periods when outages expected; replacement cots
8 Data on kwh outages by year from GSE. Value of outages estimated from data in the BP
unreliability study cited in next footnote. Cost of replaced value assumes approximately 8.5 tetri/kwh, assuming that short term unscheduled outages are principally replaced by gas-fired generation.

“ENERGY BALANCE” OF GEORGIA POWER SECTOR PART 1: ANALYSIS AND PROPOSALS
Page 36 of 172
for lost or damaged economic production; lost investment opportunities when new industry decides to not locate in Georgia due to poor quality electricity supply; and other such costs. They estimate the loss in production capacity alone annually as about 365 million Gel.9 – a conservative estimate since it omits the other forms of losses documented in that study. That however is a significant portion loss from the existing Georgian GNP. It is about half of the value of operation of the Imereti line simply to bring power from western Georgia. Thus, the economic impact of the perception of unreliability of Georgian power supply is far in excess of the cost of replacing power in cases of interruption. The perception of unreliability itself loses 50% of the value of having production in western Georgia, and of having a transmission system in place to deliver it. This puts into perspective the seemingly high capital costs of the new generation in the west (up to perhaps $500 million for the Namakhvani HPP project, or an estimated upwards of about $650 million for Khudoni HPP project); the perhaps $300 million for the South Georgia transmission line; and the cost of otherwise desired technical improvements to the GSE transmission system -- In the Ministry of Energy “Action Plan 2005-2008”, the total capital cost for all technically desirable transmission system improvement projects (other than the South Georgia Line) add to about $297 million.10 In comparison, 365 million Gel value of the perception of unreliability is equal to about $197 million. Thus, the incremental value of reliability is far in excess of the direct cost either of replacement power, or the capital cost to assure a reliable transmission grid. The effect of a perception of reliability on increased GNP of Georgia would pay for the South Georgia Line in less than 2 years; would pay for all of the conceived GSE high voltage transmission improvements other than South Georgia Line in less than 2 years; would pay for Namakhvani in about 3 years or less; and pay for Khudoni in probably under 4 years. Otherwise stated, the value of good management is immeasurable.
2.B. RELIANCE ON INTERCONNECTION AS A SOURCE OF RELIABILITY
2.B.1 Effect of Imports on Reliability
The value of an interconnected network is perhaps most easily seen when
the system is dispatched as if no imports were available (that is, no transmission interties existed to adjacent country grids). Monthly typical day dispatch graphs in Annex J illustrate the results. Those graphs are run with the must-run base case, with current capacity in place, and with all transmission lines turned “off” in the GDM model. Comparing for the month of September, note that the model reserves the domestic hydro capacity when possible for meeting daily peak hours and then fills in the other hours with domestic thermal generation. In effect, in September, when the load can still be met from domestic resources, domestic thermal units substitute for imports.
9 From, Executive Summary, Unreliable Electricity Supply: An Analysis of Impacts on the
Georgian Economy, Center for Strategic Studies Draft Report for BP, August 16, 2005. 10
See Action Plan 2005 – 2008, Table 9-18.

“ENERGY BALANCE” OF GEORGIA POWER SECTOR PART 1: ANALYSIS AND PROPOSALS
Page 37 of 172
September
0
200
400
600
800
1000
1200
1400
1600
1800
1 2 3 4 5 6 7 8 9 10 11 12 13 14 15 16 17 18 19 20 21 22 23 24
MW
Total Import
Khudoni HPP
Enguri HPP
Namakhvani HPP Cascade
Other HPPs
CCGTs
Tbilsresi & RAO Mtkvari
Total Load
However, in the months of November through March, at least some hours in each day are not able to be met from domestic resources at all. This is not a matter of cost; but of absolute unavailability of generation resources to meet the load. On the peak day, December 31, every hour has a shortage. The model even in the winter reserves available dispatchable hydro capacity for meeting peak hours. The greatest shortages then occur in the day hours, between about 9 am and 4 pm.
Peak Load - December 31st
0
200
400
600
800
1000
1200
1400
1600
1800
1 2 3 4 5 6 7 8 9 10 11 12 13 14 15 16 17 18 19 20 21 22 23 24
MW
Total Import
Khudoni HPP
Enguri HPP
Namakhvani HPP Cascade
Other HPPs
CCGTs
Tbilsresi & RAO Mtkvari
Total Load
In November only a few hours are unmet in full, but in December through March, significant outages occur in about half of all hours, as illustrated by the graph for March with no available imports:
March
0
200
400
600
800
1000
1200
1400
1600
1800
1 2 3 4 5 6 7 8 9 10 11 12 13 14 15 16 17 18 19 20 21 22 23 24
MW
Total Import
Khudoni HPP
Enguri HPP
Namakhvani HPP Cascade
Other HPPs
CCGTs
Tbilsresi & RAO Mtkvari
Total Load

“ENERGY BALANCE” OF GEORGIA POWER SECTOR PART 1: ANALYSIS AND PROPOSALS
Page 38 of 172
In April, there is then again just enough hydro to meet the load without imports, but this requires continuing to use thermal units to the fullest availability possible in most hours:
April
0
200
400
600
800
1000
1200
1400
1600
1800
1 2 3 4 5 6 7 8 9 10 11 12 13 14 15 16 17 18 19 20 21 22 23 24
MW
Total Import
Khudoni HPP
Enguri HPP
Namakhvani HPP Cascade
Other HPPs
CCGTs
Tbilsresi & RAO Mtkvari
Total Load
These patterns are reflected in the costs of generation by month, summarized in the table below. In the Months of December through March, there are total shortages of up to 10% of the total energy required. Since the model seeks first to dispatch hydro for certain purposes, the results also implicitly allocate the shortage in those months, between unavailability of hydro, and of thermal units. In the extreme month, February, over 10% of all required energy can not be met, but in that same period, over 18% of the required hydro is not met (and thus about 6% of the desired thermal). These facts show that at present, with no imports, the system could not meet its energy requirements in the winter.
ANALYSIS OF OUTAGES WHEN NO IMPORTS ARE AVAILABLE
DISPATCHED Sept. Oct Nov Dec Jan Feb Mar Apr May Jun Jul Aug
Hydro: 331,294 309,367 316,281 349,036 326,096 221,192 241,010 306,825 328,166 306,081 380,470 400,432Thermal: 200,053 302,607 365,340 500,149 501,452 476,812 514,385 384,815 291,710 249,900 201,035 189,100
Internal Generation: 531,347 611,974 681,621 849,185 827,548 698,004 755,395 691,640 619,876 555,981 581,505 589,532Import: 0 0 0 0 0 0 0 0 0 0 0 0
NET AVAILABLE
Hydro: 58,056 57,811 41,239 -28,841 -25,436 -41,094 -33,797 27,581 56,211 73,515 66,181 72,879Thermal: 278,747 192,153 113,460 -5,389 -6,692 -29,932 -19,625 93,985 203,050 228,900 293,725 305,660
Internal Generation: 336,803 249,964 154,700 -34,230 -32,128 -71,026 -53,423 121,567 259,261 302,415 359,906 378,539
OUTAGE PERCENTAGES
Hydro: 0.000% 0.000% 0.000% -8.263% -7.800% -18.578% -14.023% 0.000% 0.000% 0.000% 0.000% 0.000%Thermal: 0.000% 0.000% 0.000% -1.077% -1.334% -6.278% -3.815% 0.000% 0.000% 0.000% 0.000% 0.000%
Internal Generation: 0.000% 0.000% 0.000% -4.031% -3.882% -10.176% -7.072% 0.000% 0.000% 0.000% 0.000% 0.000%
In contrast, however, in all of the months April through November, there is additional generation capacity available, but which is not dispatched since without transmission lines, there is no export market for that energy. This is true in November as well, despite that in some hours in November, there is also a shortage. This occurs since in those hours despite that all available units are dispatched; there is still a shortage of capacity on an hourly basis. Of the load which can be met, over 52% of energy must be met by thermal capacity, representing over 81% of total costs. All of the available export capacity is of course unused. The cost of energy served is about 5.29 tetri/kwh, an increase of nearly 20%, while still incurring shortages.

“ENERGY BALANCE” OF GEORGIA POWER SECTOR PART 1: ANALYSIS AND PROPOSALS
Page 39 of 172
Clearly, the presence of transmission interties to neighboring countries, and the ability to trade on those ties, has great value to Georgia. Part 2.D.1 emphasizes that this value can be further increased, by opening the markets to additional regional trades.
2.C. GAS GENERATION AS A SOURCE OF REGIONAL RELIABILITY
There is a very clear pattern in all of the scenarios reviewed in Parts 1
and 2 of this study, supported by related studies in our previous study of natural gas issues. It is this:: If the load can be met on an inter-tied grid, based on least cost principles, then the preferred energy source for all purposes is hydro. This is true despite the higher capital cost of hydro units; we have included that capital cost into the assumed pricing for newer hydro units, and the units are still dispatched ahead of gas units. However, all of the studies also show the following: given the present capacities, a major interruption of the system (loss of the Imereti line, loss of imports) necessarily forces dispatch of thermal units. In the next section, we discuss whether and how hydro power can provide a source of reliability against low hydrological conditions. But even in the presence of larger domestic hydro generation capacity, interruption of the Imereti line would cause reliance on thermal units. Georgia is planning to correct that condition (as well as to provide additional export capacity), by transmission system improvements including the South Georgia 500 kV line. As the transmission system of Georgia itself becomes more reliable, the occurrence of loss of connectivity events should become very infrequent. As additional hydro capacity is built, that capacity will also offset thermal as a seasonal or daily load “peaking” capacity In the gas study, we concluded from these facts that therefore no additional gas fired units need to be built for the Georgian load. However, thermal units do presently exist, and the remaining thermal units in Georgia could apparently be refurbished at modest costs compared to building new thermal units. This implies that Georgia has two significant resources it can offer to the regional markets. The first is well understood: additional hydro generation capacity. But the second is that by making the domestic Georgian grid more reliable, the Georgian thermal units are then freed to provide reliability on a regional basis. It may be counter intuitive to think of Georgia as a source of reliability, but the analysis clearly implies that is an important service that Georgia can offer to regional grids. Thus, we continue this discussion in Part 4C, after collecting the diverse parts of the analysis of this study on all forms of exportable energy and capacity.

“ENERGY BALANCE” OF GEORGIA POWER SECTOR PART 1: ANALYSIS AND PROPOSALS
Page 40 of 172
3. HYDROLOGICAL CONDITIONS AND HYDRO POWER RELIABILITY
3.A BASIS OF ANALYSIS OF HYDROLOGICAL VARIABILITY
In the previous study, “A Natural Gas Strategy for Georgia, Part 1”, CORE
International argued that the comparative economics of hydro-power generation vs. natural gas generation for Georgia, strongly favored use of hydro power. That conclusion however is clearly subject to the risk of variation in water level, and the consequences of that variation. This in this chapter we analyze the know variations in water flow conditions in Georgia, and their consequences.
Our approach is as follows. In Annex B we report and analyze the statistical properties of a 50 year history of flow rates on the Enguri River at the intake to the Enguri HPP reservoir. Based on that analysis, we estimate risk factors for variation of water levels meeting alternative levels or reliability. Based on that, we estimate how much additional generation is needed to compensate for each of the levels or design reliability. The detail of that analysis is given in Annex B. We here explore the consequences of that water level variation, on the economics of design and operation of the Georgian power system.
For this study we selected four levels of reliability: (1) that the water conditions will not be below the average more often than one year in 5; (2) that the water conditions will not be below the average by more than one year in 10; (3) that the water conditions will not be below the average more often than one year in 20; (4) that the water conditions will not be below the average for more than one year in 100.
For each of the above reliability criteria, we estimate the amount of additional capacity that would be needed, on the assumption that the entire load of Georgia was met by hydro power. Since in fact, in normal operations, at least some of the load is met by imports and thermal, we are intentionally over-estimating the risk to hydro operations, in the extreme case that Georgia sought to operate in a completely self-sufficient manner, using nothing by domestically generated hydro. This analytical assumption is not a policy recommendation; it is simply a useful tool to estimate of the extreme condition risked by reliance on hydro.
We use the Enguri HPP input data as the basis for this analysis for several reasons. First, it is the only data available. But also it is a principal record of water flow in a major drainage, in western Georgia. That same drainage would also serve the proposed Khudoni HPP, which is up stream from the Enguri HPP, and also on the Enguri River. Khudoni HPP in turn is the principal reference plant for additional hydro power construction in Georgia. Therefore, the flow variations on the Enguri River are directly relevant to analysis

“ENERGY BALANCE” OF GEORGIA POWER SECTOR PART 1: ANALYSIS AND PROPOSALS
Page 41 of 172
of the Khudoni HPP. Second, most major existing and proposed hydro power generation in Georgia also lie in western Georgia. While we do not have flow records for other drainages, we know they all flow from adjacent portions of the same range of the Caucasus mountains, and all take the southern flow from that range. Thus, it is a reasonable assumption that the relative flow variation on the Enguri River is typical of all of western Georgia, and thus, of most Georgian hydro power capacity.
3.B REQUIREMENTS FOR LEVELS OF RELIABILITY
Table 3-1 below reports the results of the analysis of Annex ?. The
column “Total” reflects the annual total GWH that would be additionally needed, to replace domestic hydro generation, if the entire Georgian system were operated from domestic hydro power, and the water levels were reduced by each of the four levels of reliability. Each month is then an allocated share of the annual total, reflecting the MWG uses in that month. That is, the table gives the annual design criteria (allocated to months) required to meet that level of reliability, by provision of additional output. On the assumption this entire load would also be met from hydro, then Table 2 computes the amount of added hydro GWH required, at typical operating conditions for hydro, in excess of the capacity of the Khudoni HPP. (For this purpose, the Khudoni HPP is taken as 630 MW).
Note that the data in Tables 1 and 2 is classified into three rows for each criteria. As discussed in Annex ?, these reflect sub-components of the data. The data includes one 51 year set from 1922 through 1982, and a second 5 year set from 1999 through 2003. Thus, separately, each portion of the data has slightly different characteristics than when all data are combined. We display all three subparts of the analysis here (the full data set, and the results if only one or the other sub-set were used), since the data also display what is essentially a psychological effect. Since the monthly totals in these tables are just allocations of the annual, note this pattern in the annual totals: in each case, the amount required to meet the reliability criteria, is slightly higher in the small data set (1999 – 2003) than in the larger data set (1922-1982), and in turn, the fully data set has somewhat lower values than either sub-set. This occurs since sub-sets of a data series have higher variances than does the entire series. That the smallest sub-set (1999- 2003) has the highest values, reflects that when one bases judgment only on recent experience (small data sets) the variance “seems higher” than when full data is used. While this is entirely a statistical phenomena, the psychological effect that the people who judge based only on personal recent experience, may believe the risk of reliance on hydro poses a higher risk, than it actually poses.
3.C. COST ABOVE KHUDONI TO MEET RELIABILITY CONDITIONS
Recall first that this study, and the underlying GDM dispatch model,
assumes that new domestic hydro is priced at essentially the same price as the import price; the price for domestic hydro is set slightly lower to force dispatch first of domestic hydro. The result of that assumption is that the cost of meeting load in excess of the capacity of Khudoni is essentially the same, whether that

“ENERGY BALANCE” OF GEORGIA POWER SECTOR PART 1: ANALYSIS AND PROPOSALS
Page 42 of 172
load is met by new domestic hydro, or by imports. The per kwh price assumed for this purpose in this Chapter is 5 tetri.
Thus, Table 3-3 shows the cost of meeting load in excess of Khudoni, in each month and the annual total, at each risk level. That cost would be incurred whether the load is met by imports or by other new domestic hydro.
Table 3-4 then estimates the required increment in MW of capacity (at typical operating conditions for hydro) needed to supply that load, and the maximum capital cost of such capacity assuming a construction cost of $1.3 million per MW. Now recall that the Namakhvani Cascade system is a set of units, whose total is 450 MW. The annotations in Table 3-4 thus also show that all of the 0ne year in five, One year in ten, and one year in 20 reliability conditions could be met easily with only components of the Namakhvani Cascade. The One year in 100 criteria can be met with the Namakhvani Cascade, and less than 100 MW of all other new hydro power capacity. Indeed only 58 MW of other capacity is required when the full hydro-flow data set is considered.
3.D. REVENUE POTENTIAL FROM CAPACITY REQUIRED TO MEET RELIABILITY CONDITIONS
The analysis given above is in terms of the costs and capacities required
to meet the risk of low water conditions if the domestic Georgian system were designed to potentially operate only on hydro power. If this were done, however, then there is also a corresponding benefit. Corresponding to the risk of low water, is the nearly symmetric risk of high water conditions. In those periods, any additional hydro power built would have excess capacity. If that output were then sold on the international market (presumed to have the same price as the import price) then the existence of capacity created for reliability, is to create capacity (and energy) that could be sold on a “spot” basis, when available.
Table 3-5 therefore computes the potential revenues from exports, of such spot- sales of energy. The entries in this table should be understood as the maximum possible revenues, if the extreme that determines the reliability condition indicated, occurs condition, but does so as a wet year, not a dry year. Thus, in many years, a significant amount of additional revenue might be earned from operation of these hydro-reliability units.

“ENERGY BALANCE” OF GEORGIA POWER SECTOR PART 1: ANALYSIS AND PROPOSALS
Page 43 of 172
TABLE 3-1: ADDITIONAL OUTPUT REQUIRED TO MEET RELIABILITY CONDITIONS
Jan Feb Mar Apr May Jun Jul Aug Sep Oct Nov Dec Total
GWH Monthly Deviation for One Year in 5 Criterion
1929-1981 155 131 141 129 116 104 109 110 99 114 127 159 1,495
1999-2003 164 139 150 137 123 110 115 117 105 121 135 169 1,587 All Data 154 130 141 129 115 104 108 110 99 114 127 158 1,489
GWH Monthly Deviation for One Year in 10 Criterion
1929-1981 199 168 181 166 149 133 140 142 128 147 164 204 1,919
1999-2003 211 178 192 176 158 142 148 150 135 156 174 216 2,037
All Data 198 167 181 165 148 133 139 141 127 146 163 203 1,911
GWH Monthly Deviation for One Year in 20 Criterion
1929-1981 237 200 216 198 177 159 166 169 152 175 195 243 2,286 1999-2003 251 212 229 210 188 169 177 179 161 186 207 258 2,427
All Data 236 199 215 197 177 158 166 168 151 174 194 242 2,277
GWH Monthly Deviation for One Year in 100 Criterion
1929-1981 311 262 284 260 233 209 219 222 200 230 256 319 3,005 1999-2003 330 278 301 276 247 222 232 235 212 244 272 339 3,189 All Data 310 261 283 259 232 208 218 221 199 229 255 318 2,992
GWH Additional Hydro Output Required to Meet Reliability Condition, GWH

“ENERGY BALANCE” OF GEORGIA POWER SECTOR PART 1: ANALYSIS AND PROPOSALS
Page 44 of 172
TABLE 3-2: OUTPUT IN EXCESS OF KHUDONI REQUIRED TO MEET RELIABILITY CONDITIONS
Jan Feb Mar Apr May Jun Jul Aug Sep Oct Nov Dec Total
GWH Monthly Deviation for One Year in 5 Criterion
1929-1981 -17 -14 -15 -14 -12 -11 -12 -12 -11 -12 -14 -17 (161) 1999-2003 -7 -6 -7 -6 -5 -5 -5 -5 -5 -5 -6 -7 (69) All Data -17 -15 -16 -14 -13 -12 -12 -12 -11 -13 -14 -18 (167)
GWH Monthly Deviation for One Year in 10 Criterion
1929-1981 27 23 25 23 20 18 19 19 17 20 22 28 263
1999-2003 39 33 36 33 30 26 28 28 25 29 32 40 381 All Data 26 22 24 22 20 18 19 19 17 20 22 27 255
GWH Monthly Deviation for One Year in 20 Criterion
1929-1981 65 55 60 55 49 44 46 47 42 48 54 67 631
1999-2003 80 67 73 67 60 54 56 57 51 59 66 82 771 All Data 64 54 59 54 48 43 45 46 41 48 53 66 621
GWH Monthly Deviation for One Year in 100 Criterion
1929-1981 140 118 128 117 105 94 98 100 90 103 115 143 1,349
1999-2003 159 134 145 133 119 107 112 113 102 117 131 163 1,534 All Data 138 117 126 116 104 93 97 99 89 102 114 142 1,336
Required Reserve Energy Above Capacity of Khudoni

“ENERGY BALANCE” OF GEORGIA POWER SECTOR PART 1: ANALYSIS AND PROPOSALS
Page 45 of 172
TABLE 3-3: COST OF ENERGY IN EXCESS OF KHUDONI REQUIRED TO MEET RELIABILITY CONDITIONS
Jan Feb Mar Apr May Jun Jul Aug Sep Oct Nov Dec Total
GWH Monthly Deviation for One Year in 5 Criterion
1929-1981 (0.83) (0.70) (0.76) (0.69) (0.62) (0.56) (0.58) (0.59) (0.53) (0.61) (0.68) (0.85) (8.032) 1999-2003 (0.36) (0.30) (0.33) (0.30) (0.27) (0.24) (0.25) (0.25) (0.23) (0.26) (0.29) (0.37) (3.447) All Data (0.87) (0.73) (0.79) (0.72) (0.65) (0.58) (0.61) (0.62) (0.56) (0.64) (0.71) (0.89) (8.356)
GWH Monthly Deviation for One Year in 10 Criterion
1929-1981 1.36 1.15 1.24 1.14 1.02 0.92 0.96 0.97 0.87 1.01 1.12 1.40 13.161
1999-2003 1.97 1.66 1.80 1.65 1.48 1.32 1.39 1.40 1.27 1.46 1.62 2.02 19.047 All Data 1.32 1.11 1.20 1.10 0.99 0.89 0.93 0.94 0.85 0.98 1.09 1.35 12.746
GWH Monthly Deviation for One Year in 20 Criterion
1929-1981 3.27 2.75 2.98 2.73 2.45 2.19 2.29 2.33 2.10 2.41 2.69 3.35 31.542
1999-2003 3.99 3.37 3.64 3.34 2.99 2.68 2.80 2.84 2.56 2.95 3.29 4.10 38.555 All Data 3.21 2.71 2.93 2.69 2.41 2.16 2.26 2.29 2.06 2.38 2.65 3.30 31.047
GWH Monthly Deviation for One Year in 100 Criterion
1929-1981 6.98 5.89 6.38 5.84 5.23 4.69 4.91 4.98 4.48 5.16 5.75 7.17 67.465
1999-2003 7.94 6.70 7.25 6.63 5.95 5.33 5.58 5.66 5.10 5.87 6.54 8.15 76.682 All Data 6.92 5.83 6.31 5.78 5.18 4.65 4.86 4.93 4.44 5.12 5.70 7.10 66.814
Import Price per kwh, Lari: 0.05 Assumed Capacity Factor: 30%
Cost Per Month of Energy In Excess of Khudoni at Import Price, Lari (millions)

“ENERGY BALANCE” OF GEORGIA POWER SECTOR PART 1: ANALYSIS AND PROPOSALS
Page 46 of 172
TABLE 3-4: CAPACITY AND MAXIMUM CAPITAL COST IN EXCESS OF KHUDONI
REQUIRED TO MEET RELIABILITY CONDITIONS
MW Cost
GWH Monthly Deviation for One Year in 5 Criterion
1929-1981 (61) (79.46)$
1999-2003 (26) (34.10)$
All Data Capacity In Excess of Khudoni Not Needed (64) (82.67)$
GWH Monthly Deviation for One Year in 10 Criterion
1929-1981 100 130.21$ 1999-2003 145 188.44$
All Data Can be met with One Unit of Namakhvani 97 126.10$
GWH Monthly Deviation for One Year in 20 Criterion
1929-1981 240 312.06$ 1999-2003 293 381.44$ All Data Can be met with Two Units of Namakhvani 236 307.16$
GWH Monthly Deviation for One Year in 100 Criterion
1929-1981 513 667.46$ 1999-2003 584 758.65$ All Data Can be met with Namakhvani Plus Assorted Added Run of River Hydros 508 661.03$
Extimated Maximum Cost Per MW of Capacity
Maximum Capital Cost Of Hydro Capacity Other than Khudoni to Meet Reliability Criteria, $ (millions)
1,300,000$

“ENERGY BALANCE” OF GEORGIA POWER SECTOR PART 1: ANALYSIS AND PROPOSALS
Page 47 of 172
TABLE 3-5: POTENTIAL REVENUES FROM SALES OF SPOT-ENERGY IN HIGH WATER CONDITIONS FROM UNITS BUILT TO ASSURE RELIABILITY IN LOW WATER CONDITIONS
Jan Feb Mar Apr May Jun Jul Aug Sep Oct Nov Dec Total31 28 31 30 31 30 31 31 30 31 30 31
GWH Monthly Deviation for One Year in 5 Criterion
1929-1981 9.40 7.93 8.58 7.86 7.04 6.32 6.61 6.70 6.04 6.95 7.74 9.65 90.81 1999-2003 8.93 7.53 8.15 7.46 6.69 6.00 6.27 6.36 5.73 6.60 7.35 9.16 86.23 All Data 9.44 7.96 8.61 7.89 7.07 6.34 6.63 6.72 6.06 6.98 7.77 9.68 177.04
GWH Monthly Deviation for One Year in 10 Criterion
1929-1981 9.93 8.38 9.07 8.30 7.44 6.67 6.98 7.08 6.38 7.35 8.18 10.19 95.94
1999-2003 10.54 8.89 9.62 8.81 7.90 7.08 7.41 7.51 6.77 7.80 8.68 10.82 101.83 All Data 9.89 8.34 9.03 8.27 7.41 6.64 6.95 7.05 6.35 7.31 8.15 10.15 197.77
GWH Monthly Deviation for One Year in 20 Criterion
1929-1981 11.84 9.98 10.80 9.89 8.87 7.95 8.32 8.43 7.60 8.75 9.75 12.14 114.32
1999-2003 12.56 10.60 11.47 10.50 9.41 8.44 8.83 8.95 8.07 9.29 10.35 12.89 121.34 All Data 11.78 9.94 10.76 9.85 8.83 7.92 8.28 8.39 7.57 8.71 9.71 12.09 235.66
GWH Monthly Deviation for One Year in 100 Criterion
1929-1981 15.55 13.12 14.20 13.00 11.65 10.45 10.93 11.08 9.99 11.50 12.81 15.96 150.25
1999-2003 16.51 13.92 15.07 13.80 12.37 11.09 11.60 11.76 10.60 12.21 13.60 16.94 159.46 All Data 15.49 13.06 14.14 12.94 11.60 10.40 10.88 11.03 9.94 11.45 12.76 15.89 309.71
Export Price per kwh, Lari: 0.05 Assumed Capacity Factor: 30%
Revenue from Excess Energy In Wet Years, Lari (millions)

“ENERGY BALANCE” OF GEORGIA POWER SECTOR PART 1: ANALYSIS AND PROPOSALS
Page 48 of 172
4. ANALYSIS OF EXPORT CAPACITY
4.A. GEORGIAN EXPORT CAPABILITY11
4.A.1 Alternative Conditions Studied
Georgia currently derives its domestic power supply from three sources:
domestically produced hydro power from local rivers, domestically generated thermal power using domestically based units and imported fuels, and imported power. Depending on how those hydro and thermal units are scheduled and dispatched, Georgia already has more energy production capability available (on an annual basis) than is required for its energy consumption needs. The additional energy capability exists for two reasons. In part it is to provide a reserve margin, in part compensating for lower reliability of the transmission system. And in part it corrects for the present lack of ability to store sufficient water to meet peak conditions from dispatchable storage hydro plants. To meet inter seasonal scheduling requirements, to better meet transmission reliability requirements, and to provide exportable power, Georgia is also considering construction of certain larger new hydro power plants, as well as new transmission lines.
We therefore here analyze what may be the export capacity (energy available for export in excess of that dispatched to meet domestic loads) from Georgia. This should be studied given different conditions of dispatch of the domestic system, and with potential addition of the contemplated new hydro power units. We therefore analyzed the effect on Georgian electrical energy export capability under six scenarios: three variations of supply, with each of those variants under two dispatch conditions.
The three supply scenarios are as follows. First, we assumed the current production capabilities of all units in Georgia, including dispatch levels of hydro units from experience in recent years. Next, we added the Khudoni Hydro Power Plant assumed at a 630 MW rated capacity, and dispatched in parallel with the Enguri unit on the same basin. Finally, to the current capability we added both Khudoni and the Namakhvani Cascade Hydro Power Plants.
For each of those supply scenarios, we examined two conditions of dispatch. First, we assumed the current practice of forced dispatch of the thermal units especially in winter periods; presumably this forced “must run” condition on domestic thermal is to compensate for existing unreliability of the transmission grid, and/or to reduce the need for (less expensive, but possibly also less reliable) imports. All units other than thermal units are dispatched on a least cost basis against demand. Second, we looked at each scenario with pure least cost dispatch. This simulates a condition when internal transmission reliability is increased, so that
11
The material in this section was previously used in the White Paper on Export Capacity issued by the project in June 2006.

“ENERGY BALANCE” OF GEORGIA POWER SECTOR PART 1: ANALYSIS AND PROPOSALS
Page 49 of 172
also, internal loads might be met with stored hydro capacity in peak periods, rather than forced use of domestic thermal generation.
For purposes of unit pricing, required for least cost dispatch modeling, we assumed the tariffs in effect as of May 1 2006, except that for the incremental hydro power units (Khudoni and Namakhvani) we assumed a price of 5 tetri per kwh, just slightly lower than most import. Previous studies (such as the CORE International Prefeasibility Study for the Khudoni HPP) show that a price equivalent to the import price is required to construct the new HPP’s in Georgia. The effects of these assumptions are that when the choice exists, domestic hydro will be dispatched before imports on a least cost basis. Using the May 1 prices also implicitly assumes that the gas price for thermal generation is the old price, not over $65/1000M3. However, even at that lower fuel price, thermal energy was already more expensive than all domestic hydro and import energy. Thus, using a still higher price for domestic thermal generation would not have changed any outcomes in terms of which units are dispatched in what order. Thus, it does not affect the analysis of export capacity based on availability of units in the different scenarios.
4.A.2 Summary Of Basic Results
The results of our analysis are organized by pairs, with odd numbers (1, 3,
and 5) for the “thermal must-run” scenarios, and even numbers (2, 4, and 6) for the corresponding “least cost” dispatch scenarios. The results are given in Table 1, below, and in Annex 1, which is a set of 12 tables with bar charts of monthly data, following the main report. The bar charts in Annex 1 show the actually dispatched, and the net available energy, in each month, by fuel type (hydro, thermal, import), with totals in MWH.
Table 1 gives the basic results. In doing so, it also shows a possibly counterintuitive fact: while the implicit presumption may be that “export” means, “hydro-power export”, the greatest portion of available capacity, not otherwise dispatched for domestic need in Georgia, is thermal. This is true in all six scenarios. It is even more true in the three even numbered (least cost dispatch) scenarios. The increment in available thermal capacity in those scenarios occurs since least cost dispatch takes cheaper imports or local hydro for internal use, before taking thermal.

“ENERGY BALANCE” OF GEORGIA POWER SECTOR PART 1: ANALYSIS AND PROPOSALS
Page 50 of 172
TABLE 4-1: BASIC RESULTS OF SIX SCENARIOS
Results of simulations using the GDM. The small negative values reflect that the GDM model takes units or imports in discrete blocks. The presence of the small numbers is thus an artifact of this modeling assumption, and not a basic property of the scenario.
Hydro Thermal Total Hydro Thermal Total
1Current Conditions,
Thermal Must-run863,643 4,303,316 5,166,958
2Current Conditions,
Thermal Least Cost833,533 5,825,400 6,658,933 (30,109) 1,522,084 1,491,975
3Add Khudoni, Thermal
Must-run1,895,008 4,288,404 6,183,412 1,031,365 (14,912) 1,016,453
4Add Khudoni, Thermal
Least Cost1,579,047 5,825,400 7,404,447 715,404 1,522,084 2,237,488
5
Add Khudoni and
Namakhvani, Thermal
Must-run
2,874,098 4,277,387 7,151,485 2,010,456 (25,929) 1,984,527
6
Add Khudoni and
Namakhvani, Thermal
Least Cost
2,338,475 5,825,400 8,163,875 1,474,833 1,522,084 2,996,917
Scenario
Change Compared to Base Case Annual Total Export Available - MWH
Thus, one somewhat surprising but immediate implication of this study is that Georgia may consider exporting reliability services, using thermal units. This might be done on a “firm” basis, if the operators were willing to commit their units to particular contracts, or, on an as-needed basis, capable of responding to power demands quickly, at an appropriately set price. The price would be higher than the price of the market for energy, but that is a normal and proper condition for units held in reserve primarily for reliability purposes.
Second, as the additional units for Khudoni and then Namakhvani are added, the increment in available hydro export capacity does not increase by as much as the capacity of the unit. This occurs because the GDM model dispatches those units first to domestic demand (though at essentially the import price) before taking imported power. Also, for the same reason, as the system is switched from must0run for the thermals to pure least cost, then the addition of new domestic generation (at just slightly lower cost than import) displaces some of the import that would otherwise have replaced thermal in the least cost dispatch, without the new HPP’s. This result reinforces the conclusion of the previous paragraph.

“ENERGY BALANCE” OF GEORGIA POWER SECTOR PART 1: ANALYSIS AND PROPOSALS
Page 51 of 172
It also has an additional implication. While adding new hydro units does increase Georgian export capacity from hydro (by potentially 1.47 million MWH to 2.0 million MWH in scenarios 6 and 5 respectively), the principal, or certainly co-equal effect, is to replace service of Georgian demand from all sources (thermal or import) with Georgian domestically based hydro. This of course can also increase Georgian energy “security” if the measure of such security is the contingent capacity for self-sufficiency of generation. By building hydro, and/or by switching its dispatch rule to pure least cost, Georgia increases both, its export capacity, and, its internal supply security.
There is a further implication of this analysis. One of the difficulties often associated with use of hydro-power is that long term contractors will want “firm” (that is highly reliably assured) delivery of capacity and energy. But foreign buyers will question two facets of such hydro supply from Georgia: is the contracted quantity of power and capacity itself actually available, and how can they assure that it will be available. In a separate study to be provided in summer 2006, the CORE International project will assess the question of water availability on a long term basis. However the fact that in every scenario, far more capacity is available from thermal than from hydro, implies this: Georgia can export highly reliable power and energy, by using a combination of hydro and thermal (as reliability back-up). In doing so, the export entity would need to assure that a proper price is paid that includes the contingent capacity costs (of the thermal units) as well as the normal running and capital costs of all units.
4.A.3 Analysis Of Differences In Scenarios
The change in export capacity between scenarios comes from two sources:
increments in generation capacity if new hydro plants are built, and, reductions in the internal need for use of thermal as least cost dispatch releases internal thermal generation capability for other uses. Table 2 summarizes those effects. Even without new hydropower capacity, simply doing least cost dispatch releases about 1.5 Million MWH in annual capacity from thermal generation units12. As examination of the detail (monthly dispatch and available tables at the end of this report) shows, this released capacity is also largely made available in the winter months, when such capacity might also have its highest value in providing system reliability and backup to neighboring systems. In Scenario 2, this internal capacity release occurs entirely through substitution by imports. But note in Table 2 that that as more new capacity is built, in Scenarios 4 and 6, that the relative effect of moving to least cost dispatch is proportionately less. That is, as seen from Table 1, the amount of exportable thermal capacity is the same in Scenarios 2, 4 and 6, but the attribution of the origin of that to using least cost dispatch is proportionately less, as more internal capacity is built. Alternatively stated, the relative importance of new
12
Implicitly, the net savings from using sources other than domestic thermal places a value on creating internal reliability through strengthening the transmission system. Analysis of that effect will be given in our “energy balance” study later in summer 2006.

“ENERGY BALANCE” OF GEORGIA POWER SECTOR PART 1: ANALYSIS AND PROPOSALS
Page 52 of 172
capacity as a source of available export, increases, as more of it is built. This is a natural and expected result.
TABLE 4-2: SOURCES OF DIFFERENCES IN EXPORT CAPABILITY RESULTING FROM SIX SCENARIOS
Capacity
Effect
Least Cost
Effect
Total
Effect
1Current Conditions,
Thermal Must-run
2Current Conditions,
Thermal Least Cost1,491,975 1,491,975
3Add Khudoni, Thermal
Must-run1,016,453
4Add Khudoni, Thermal
Least Cost1,221,035 2,237,488
5
Add Khudoni and
Namakhvani, Thermal
Must-run
1,984,527
6
Add Khudoni and
Namakhvani, Thermal
Least Cost
1,012,390 2,996,917
Scenario
Sources of Change
The above analysis implies that much of the effect of either change in dispatch, or adding new capacity, is in increasing or decreasing the amount of imports. Table 4-2 summarizes the corresponding effects, on changes in imports, as new capacity is built, and/or, as dispatch rules change to assuring least cost Georgian dispatch. Both of these have the effect of substituting domestic Georgian generation (principally hydro) for imports to meet domestic Georgian needs. Comparing Scenarios 1 and 2, with no new generation, then the effect of least cost dispatch is to increase imports, by releasing internal thermal capacity for export. However, as new generation is built, the contrast between Scenarios 3 vs. 4, and between Scenarios 5 vs. 6, show that the effect of using least cost dispatch (while also adding new capacity) is also to reduce imports. However, the proportionate effect, is less since internal substitution provides a larger share of the domestic load in Georgia. (The relative benefit from the substitution for thermal by either imports or new hydro however is similar, as the GDM model prices new domestic hydro at just slightly less than the cost of imports.)

“ENERGY BALANCE” OF GEORGIA POWER SECTOR PART 1: ANALYSIS AND PROPOSALS
Page 53 of 172
Thus, we offer one final inference from this study. Adding new hydro generation within Georgia does not increase hydro export capability by as much as the increase in hydro capacity. Instead, by offsetting the need for use of thermal capacity for internal reliability uses, it increases thermal export capability, and also reduces the need for use of imports. However, by reducing imports, thus also releasing it to other uses, addition of new hydro capacity also indirectly increases supply to the region, and thus also, improves the relative supply security of Georgia, by better assuring that regional demands can be met.
TABLE 4-3: EFFECT OF SCENARIOS ON IMPORTS
Total,
Using Must
Run
Total,
Using
Least Cost
Change in
Imports
With Must
Run, And
New Units
Change in
Imports
With Least
Cost, And
New Units
1Current Conditions,
Thermal Must-run1,369,220
2Current Conditions,
Thermal Least Cost2,861,195
3Add Khudoni,
Thermal Must-run431,575 (937,645)
4Add Khudoni,
Thermal Least Cost1,652,610 (1,208,585)
5
Add Khudoni and
Namakhvani, Thermal
Must-run
174,700 (256,875)
6
Add Khudoni and
Namakhvani, Thermal
Least Cost
1,187,090 (465,520)
Scenario
Analysis of Imports
The conclusions of the above paragraph are subtle but important. New
hydro within Georgia is often discussed as if providing “export capability” while simultaneously presumptively providing inexpensive internal hydro. It can not simultaneous do both. If the capacity is exported, it is not available for internal use. But also, the capital costs for new hydro must be paid, and are comparable to the current average unit cost of imports. Thus, the principal effect of building new hydro within Georgia would be to increase Georgian internal capability, thus increase “supply security” in that sense. It will do so at the same cost as at present for imports. The principal internal cost benefit to Georgia can come by substitution of either new hydro, or of imports, for thermal generation.
However, certainly as well, the increments in export capacity reflected in Table 2 add an important benefit Comparing Scenarios 4 and 6, the net exportable

“ENERGY BALANCE” OF GEORGIA POWER SECTOR PART 1: ANALYSIS AND PROPOSALS
Page 54 of 172
capability added is about 1 million MWH from each of Khudoni and Namakhvani. At a price of about 5 Tetri, each increment represents a value of about 50 Million Lari (about $27.8 Million) in export revenues to Georgia. If the additional capacity from released thermal can also (or instead) be sold, at a proper price, that would further increase value of exports from Georgia.
4.B. AVAILABLE SOURCES OF EXPORT CAPABILITY
The analysis above strongly implies that Georgian can gain a great deal by
involvement in regional markets, often in surprising ways. Thus, in Part 4.B.1 below we summarize and discuss the specific implications of the present study for regional markets, while in Parts 4.C we summarize results of previous studies of benefits of regional markets.
The discussion above, and the most common discourse, treats incremental hydro capacity as if it were “built for export”. But it is also often discussed as if it were a source of presumably less expensive internal generation. But the same kwh of energy can not be simultaneously sold as export an consumed internally. I may do one or the other. Thus, if we examine in details the effect of choice of domestic dispatch rule, on the allocation of internally generated power, with present and expected future Georgian total loads, to the domestic and export markets, we get a rather different view. Tables 4-4 and 4-5 summarize the results of Annexes D and E, and the discussion of Chapter 1, as relate to exportable capacity. Totals are given in Table 4-4, and percentage differences in Table 4-5. The tables are organized into six blocks as follows: the first (top) block is the present condition, with present loads, the existing generation units, and the present “must-run” condition on thermal units. This is treated as the reference case for all comparisons in Table 4-5. The next block in each table is the result of adding all planned new capacity, with the existing loads. The third block is the must-rune dispatch rule, wit all the new capacity, and also, 30% growth in load. The next three blocks summarize these same conditions, but with least cost in place of must-run dispatch rules. The results are startling: the greatest amount of exportable hydro power occurs when the must-run dispatch is used, after all new hydro plants are operating, and with no load growth. All other cases have lower exportable hydro. In particular, all of the least cost cases have less exportable hydro since they are allocating hydro power first to the domestic market. This then releases all or nearly all of the thermal power for export, and reduces the amount of exportable hydro power. Note, especially, that in the GDM model, we price new internal hydro at essentially the same price as hydro exports, which is necessary to pay for the hydro units at all. But also, despite this “high” domestic price for hydro, the average costs in all of the least cost scenarios is less than the average cost in all of the corresponding must0-run scenarios. This occurs since in the least cost scenarios, domestic thermal is replaced by domestic hydro, thus lowering domestic costs. The greatest total

“ENERGY BALANCE” OF GEORGIA POWER SECTOR PART 1: ANALYSIS AND PROPOSALS
Page 55 of 172
exportable energy occurs in the unrealistic scenario that all the new units are built, and there is no domestic load growth. There is a second source of exportable hydro power that arises if the new hydro units are built. The GDM assumes “normal” year operations in most of our runs. But in wet years, as new plants are completed, additional exportable energy exists in those years. This volumes effect was estimated in Chapter 3.D by Table 3-1, since the volumes in wet years are approximately the same as the reduced volumes in dry years. If we assume the design criteria is to build enough capacity to meet the one-year-in 20 reliability standard, then in wet years, this makes available an additional about 2,277,000 MWH. This adds at lest 0ne-third to the total exportable energy in all of the scenarios in Tables 4.4, and more than doubles the available exportable hydro capacity, even in the scenarios with highest hydro export capacity.. There is however a significant different between the hydro energy available up to that amount in wet years, and the energy available as excess from “normal year operations”. It is must more uncertain whether the additional “wet year” energy will exist. But, in a properly functioning market, “firm” or assured delivery energy has a higher value than does uncertain or “interruptible” supply of energy. This is therefore the form in which the considerable amount of domestic thermal released for export, has its value. By coupling promised sales of “wet year hydro” with reserve capacity of the thermal units up to a given limit, the wet year hydro, which ahs essentially zero cost to produce, can be matched with the reserve capacity from thermal, and sold as firm energy. It can be sold at not less than the regional market price (the basis for the computations in Table 3-3), and in a properly functioning market, might even be sold at higher than the market price, since the reliability of that form of sales is very high.

“ENERGY BALANCE” OF GEORGIA POWER SECTOR PART 1: ANALYSIS AND PROPOSALS
Page 56 of 172
TABLE 4-4. CHANGES IN EXPORTABLE VOLUMES BY SCENARIO
MUST RUN EXISTING UNITSWater % of Avg. 100% Export Capacity: Total % of TotalTh. Must Run Yes KWH VolumeKhudoni No Domestic Hydro 519,554 10.74%Namakhvani No Domestic Thermal 4,320,019 89.26%
Tvishi, Zhoneti No Total 4,839,573 100.00%
MUST RUN WITH PLANNED UNITSWater % of Avg. 100% Export Capacity: Total % of TotalTh. Must Run Yes KWH VolumeKhudoni Yes Domestic Hydro 1,732,945 28.80%Namakhvani Yes Domestic Thermal 4,283,359 71.20%
Tvishi, Zhoneti Yes Total 6,016,304 100.00%
30% GROWTH - MUST RUN WITH PLANNED UNITSWater % of Avg. 100% Export Capacity: Total % of TotalTh. Must Run Yes KWH VolumeKhudoni Yes Domestic Hydro 920,761 17.68%Namakhvani Yes Domestic Thermal 4,288,565 82.32%
Tvishi, Zhoneti Yes Total 5,209,326 100.00%
LEAST COST EXISTING UNITSWater % of Avg. 100% Export Capacity: Total % of TotalTh. Must Run No KWH VolumeKhudoni No Domestic Hydro 537,658 8.45%Namakhvani No Domestic Thermal 5,825,400 91.55%
Tvishi, Zhoneti No Total 6,363,058 100.00%
LEAST COST WITH PLANNED UNITSWater % of Avg. 100% Export Capacity: Total % of TotalTh. Must Run No KWH VolumeKhudoni Yes Domestic Hydro 1,315,954 18.43%Namakhvani Yes Domestic Thermal 5,825,400 81.57%
Tvishi, Zhoneti Yes Total 7,141,354 100.00%
30% GROWTH - LEAST COST WITH PLANNED UNITSWater % of Avg. 100% Export Capacity: Total % of TotalTh. Must Run No KWH VolumeKhudoni Yes Domestic Hydro 849,146 12.72%Namakhvani Yes Domestic Thermal 5,825,400 87.28%
Tvishi, Zhoneti Yes Total 6,674,546 100.00%

“ENERGY BALANCE” OF GEORGIA POWER SECTOR PART 1: ANALYSIS AND PROPOSALS
Page 57 of 172
TABLE 4-5: PERCENTAGE CHANGES
IN SOURCES AND AMOUNTS OF EXPORTABLE VOLUMES
MUST RUN EXISTING UNITSWater % of Avg. 100% Export Capacity: Total % of TotalTh. Must Run Yes KWH VolumeKhudoni No Domestic HydroNamakhvani No Domestic Thermal
Tvishi, Zhoneti No Total
MUST RUN WITH PLANNED UNITSWater % of Avg. 100% Export Capacity: Total % of TotalTh. Must Run Yes KWH VolumeKhudoni Yes Domestic Hydro 1,213,391 103.12%Namakhvani Yes Domestic Thermal (36,660) -3.12%
Tvishi, Zhoneti Yes Total 1,176,731 100.00%
30% GROWTH - MUST RUN WITH PLANNED UNITSWater % of Avg. 100% Export Capacity: Total % of TotalTh. Must Run Yes KWH VolumeKhudoni Yes Domestic Hydro 401,207 108.51%Namakhvani Yes Domestic Thermal (31,454) -8.51%
Tvishi, Zhoneti Yes Total 369,753 100.00%
LEAST COST EXISTING UNITSWater % of Avg. 100% Export Capacity: Total % of TotalTh. Must Run No KWH VolumeKhudoni No Domestic Hydro 18,104 8.45%Namakhvani No Domestic Thermal 1,505,381 91.55%
Tvishi, Zhoneti No Total 1,523,485 100.00%
LEAST COST WITH PLANNED UNITSWater % of Avg. 100% Export Capacity: Total % of TotalTh. Must Run No KWH VolumeKhudoni Yes Domestic Hydro 796,400 8.45%Namakhvani Yes Domestic Thermal 1,505,381 81.57%
Tvishi, Zhoneti Yes Total 2,301,781 100.00%
30% GROWTH - LEAST COST WITH PLANNED UNITSWater % of Avg. 100% Export Capacity: Total % of TotalTh. Must Run No KWH VolumeKhudoni Yes Domestic Hydro 329,592 8.45%Namakhvani Yes Domestic Thermal 1,505,381 87.28%
Tvishi, Zhoneti Yes Total 1,834,973 100.00%

“ENERGY BALANCE” OF GEORGIA POWER SECTOR PART 1: ANALYSIS AND PROPOSALS
Page 58 of 172
In addition, doing this would require less than half of the available energy
producing capacity of the thermal units, which is, from table 4-4, about 5,825,400 MWH annually. Reserving capacity to create 2,277,000 MWH still leaves ability to crate about 2,548,400 MWH. This capacity can in turn be sold, domestically or internationally, as a reliability service.13 The cost of reservation would keep the plants ready for use, and they would be dispatched (at the additional cost of the fuel used) when needed for replacing lost production from other units.
The analysis thus shows the surprising result that the most valuable export capability that Georgia can sell regionally, is reliability, including very reliable hydro power (generated in the highly uncertain “wet years”) when backed by thermal reserve. We thus discuss that topic in Chapter 4.B.2 next.
4.C PREVIOUS STUDIES OF REGIONAL MARKETS
4.C.1 The Caucasus Regional Energy Needs Assessment, January 2000
In 2000 the USAID subcontractors AED (Academy for Educational
Development) and Hagler Bailly in the course of work on the Strengthening Regional Energy Linkages Program, produced a report dedicated to the Caucasus Regional Energy Needs Assessment. In their work they provide the analyses of an investigation on the potential benefits of greater regional cooperation in the power systems of the three States of the Caucasus region: Georgia, Armenia and Azerbaijan.
The document reviews the existing situation, in all three countries to 2000 that impacted operations of the three power systems serving the Caucasus region. The report identifies the potential benefits from greater coordination between the three Caucasus countries power systems like: Economy sales and purchases of electricity; Firm sales and purchases of electricity; Emergency coordination and mutual support/reserve sharing; Multi-country projects to meet regional power system needs and Improved power supply reliability. Assessment of the potential benefits from greater coordination of the power systems, included the possibility of improved interaction with the Turkish power system; identified the barriers to that greater coordination; and offered recommendations on several follow-up activities for the Regional Energy Linkages project.
The report provides principles that address critical matters for regional cooperation such as political, legal, and regulatory issues, and economic and engineering feasibilities. Based on the recommendations provided by the consultants each country in pooling arrangement must recognize their obligations to the other pool members. The most fundamental obligation is the understanding and
13
Note, that our discussion here is in terms of annual energy output, whereas contracting for reliability in practice will require matching of both capacity (MW) and energy (MWH), as ell as load shape.

“ENERGY BALANCE” OF GEORGIA POWER SECTOR PART 1: ANALYSIS AND PROPOSALS
Page 59 of 172
recognition by all participants that the entire pool arrangement is based on mutual trust, mutual sharing of costs and benefits and mutual accommodation of each participants needs. The report does not propose a specific coordination plan or pool arrangement; it provides the guidelines that the parties can follow in coming to an agreement that will provide a working pool arrangement to the mutual benefit to all.
The report also recommends that the regulatory commissions in each country continue to have jurisdiction over the operation of that country’s local utility organization. That includes local company activities related to its participation in any coordination or pool arrangement. The report also recognizes that any agreement developed by the parties will have to withstand legal review. In addition the pool must have the ability to monitor the operation of the generation and transmission facilities and to control the operation of these facilities that required installation of the appropriate substation measuring devices and remote terminal units; adequate computer control system facilities for the display of information, operator interaction and recording of essential operating data. It is recommended that this equipment be installed before the systems could operate in an integrated manner.
In establishing close regional coordination the report advises that the Countries should take specific steps in order to improve the existing conditions of the utilities and to get the following benefits: 1) Operation of the thermal plants at a more efficient level (i.e., as units are dispatched more optimally in line with their equipment configuration, the actual efficiency of the units should increase); 2) Capturing seasonal differences between the generation systems. For instance, Georgia’s seasonal peaking hydropower could be used to back down the use of thermal plants in both Azerbaijan and Armenia during the Spring and Summer periods that could also assist with scheduling maintenance; 3) Capturing the differences between the Caucasus countries’ load shapes and those of nearby countries such as Turkey. While all of the Caucasus power systems and the Turkish power system are winter peaking, there are nonetheless differences in the load shapes that should permit for more effective utilization of the regional generating capacity to meet regional needs, thus helping to lower production costs. The time zone difference between Turkey and the Caucasus may offer some advantages for economic power exchange; 4) Operating the Caucasus’ power systems in parallel regime offers the potential to reduce the reserves needed in the region There is a limit to the power transfer capacity between each nation but in the event of a power system emergency some amelioration could result by sharing of reserves for the region;. 5) Improved power system development plans, while this area is potentially difficult to achieve it also offers the greatest potential benefits. Each of the three Caucasus

“ENERGY BALANCE” OF GEORGIA POWER SECTOR PART 1: ANALYSIS AND PROPOSALS
Page 60 of 172
countries has developed its own power system development plan. No consideration has been given to the possible benefits that could be achieved through import of power from other nations and development/promotion of projects designed to meet regional needs. Each country is interested in maintaining a generating capacity fully sufficient to meet its own needs. It is unlike that any of the countries would agree to place the reliability of its power supply on project located outside of its territory; 6) Improved supply of electricity to alleviate shortages in both Georgia and Azerbaijan is technically feasible through greater regional power transfers. Georgia and to lesser extent Azerbaijan were in a supply deficit situation in 2000. However taking into account the regions’ supply resources and transmission interties, there was sufficient supply available to meet the region’s energy needs. The main difficulty was more of an economic character; 7) Improved power quality through system synchronization and restoration of system frequency to 50 Hz would reduce “wear and tear” on the power system equipment, motors, etc. There would also be substantial improvement in stabilizing voltage thus resulting in an improvement in overall power quality throughout the region.
4.C.2 Final Report On Strengthening Regional Energy Linkages, March 15, 2001
USAID contractor AED with the support of Hagler Bailly Services, Parsons
Energy and Chemicals and International Resources group Ltd, implemented a project to promote greater cooperation among the energy sectors of the Caucasus countries Georgia, Azerbaijan and Armenia (1999-2000). The project’s primary objective was to develop better awareness among the Governments of the three Countries and utilities within each nation about the benefits that can be achieved through closer cooperation in the energy field and the steps to be taken to gain these benefits. The project focused primarily on electric power and to a lesser extent, natural gas.
The primary objective of the final report on Strengthening Regional Energy Linkages, produced in March 2001 is to establish a baseline of conditions in which regional benefits could be documented. Number of workshops and executive seminars were held in 2000 where the following topics were discussed: 1) Inter-tie capabilities (transmission facilities required), 2) optimization of the hydro resources in each country of the Caucasus region, 3) the payment and exchange of power flows between the various parties, including the countries outside the region to maximize the benefits.
AED in this report presents the standard approach to evaluation of regional benefits in power systems that consider the evaluation of costs associated with each individual country in meeting the expected demand on the system. This

“ENERGY BALANCE” OF GEORGIA POWER SECTOR PART 1: ANALYSIS AND PROPOSALS
Page 61 of 172
includes all production costs from generation, transmission costs, and the estimated capital costs associated with meeting that demand over a period of time.
Each Caucasus Country was evaluated on meeting system loads on hourly bases for a period of fifteen years (2000-2015). In the case Georgia and Azerbaijan, with significant periods of blackouts and load reductions, amounts of un-served energy were estimated and then quantified. After each country was evaluated, then three countries were combined into one load demand per hour and the generation from each country was assigned to meet that demand, keeping in mind any constraints on the transmission network, if any. The types of benefits that were quantified were 1) Amounts of un-served energy with an assigned value per kWh; 2) A value for selling power to a neighboring country based on the expected market value of such energy; 3) Cost reductions in power supply by substitution of energy from a low cost provider from a high cost unit in a neighboring system; 4)Operating cost savings resulting from a particular constraint under individual operating parameters versus regional operation; 5) Recovery of reservoirs on storage hydro units in order to optimize operations in future years; 6) Reduction in capital requirement for future years through optimization of resources.
4.C.3 Report on Regional Oil And Gas Sector In Transition, May 2005
This report “Regional Oil And Gas Sector In Transition: Challenges And The
Role Of The EBRD – Energy Operations Policy May 2005” was prepared by the Centre for Global Energy Studies and was commissioned by the office of the Chief Economist (OCE) at the European Bank for Reconstruction and Development (EBRD) as part of the process of updating the Bank’s Energy Operations Policy (EOPP). Among other activities the EOPP covers the activities of Regional integration, cooperation and trade.
The report covers the important topic of Avoiding Transit Countries.(by Russia). A key feature of Russia’s oil transportation policy in recent years has been to reduce the country’s dependence on transit countries to move its oil to export terminals. Decisions on the construction of major new oil and gas export routes appear to have had more to do with avoidance of transit countries than with simple economics of export shipments. The Baltic Pipeline System (oil) and the Glue Stream Pipeline (gas) are both good of examples of this policy in action. The former reduced dependence on Latvia and Lithuania for Russian oil exports through Baltic Sea, while the latter created a gas export route to Turkey (and perhaps eventually Southern Europe) that avoided Ukraine, Romania and Bulgaria. Keeping transit fee revenue within Russia has been more important than reducing such costs to a minimum. For Russia, Such concerns are expected to continue to inform oil export pipeline policy choices. The Russian decision to build the Baltic Pipeline System resulted in part from the fact that oil exporters had faced high transit and port fees charged by Latvia on oil exported via Ventspils (the Western Pipeline system), which would have been far more cost effective than the Baltic Pipeline System and would have required a much smaller initial investment of around $ 120

“ENERGY BALANCE” OF GEORGIA POWER SECTOR PART 1: ANALYSIS AND PROPOSALS
Page 62 of 172
million for pipeline, port and terminal facilities, compared with the $ 460 million cost of the first phase of the Baltic Pipeline System, at least, was not a least cost solution to problem of oil experts through the Baltic Sea. Netback values calculated for various export options show the cost of exporting oil from Timan Pechore to Rotterdam via the Baltic Pipeline System to be $ 2.50/bbl higher that the cost of exporting the same oil via Ventspils.
For other oil producing countries in the FSU, avoidance of transit countries for their oil exports is impossible, since all are landlocked. However, in some cases there has been a determination to avoid crossing Russian territory. Azerbaijan, strongly supported by the US government, has followed a policy of avoiding the construction of major new export pipelines for oil and gas across the territory of Russia. A similar policy has not been possible for Kazakhstan, given its location, its long border with Russia and its large ethnically Russian population. Kazakhstan’s dependence on Russia as a transit route for its oil exports has caused some difficulties in the past and continues to do so as far as the CPC pipeline from Tengiz to the Black Sea is concerned. The Russian government is unhappy with the return it is receiving from its investment in the pipeline and is blocking proposals to expand the route’s capacity until it wins agreement for an increase in transit tariffs along the route.
The report also defines alternative sources of supply. Security of oil and gas supplies has become a major concern for republics of the FSU and for former satellite states in Central and Eastern Europe. All are dependent to a significant degree on energy supplies (particularly of natural gas) from Russia, or that must transit Russia. As Leijonhielm and Latsson (study 2004) point out, the Baltic States, Bulgaria, Croatia, Finland, Greece and Slovakia are most at risk, relying on Russia for 100% of their supplies. They are point out that Moldova and Belarus are highly dependent on gas supplies from Russia, but what they do not go on to say is that even those gas supplies to these two countries that do not originate in Russia have to pass through the country. Leijonhielm and Larsson’s study enumerates many examples of Russia using gas supplies to neighboring counties as a lever to gain political and /or economic influence of former satellite states. Georgia, Ukraine, Moldova and the Baltic republics are all identified as having suffered in this way. Recently, oil supplies to Lithuania’s Mazeikaiai refinery and Butinge export terminal have been reduced as Transneft has expanded capacity on its Baltic Pipeline System. While oil supplies can usually be replaced with purchases from other suppliers such a switch is not without cost. Pipeline deliveries of Russian crude to refineries in Central and Eastern Europe are generally at prices well below those earned in Northwest Europe or Mediterranean or Northwest European markets. In the gas of gas, securing alternative supplies is generally impossible, since the only pipelines are those carrying gas from or through Russia.
Some refiners, most notable those close to ports through which they can import oil, have sought to secure oil supplies through strategic relationships with Russian partners, or through the sale of a stake in the plant to a Russian oil

“ENERGY BALANCE” OF GEORGIA POWER SECTOR PART 1: ANALYSIS AND PROPOSALS
Page 63 of 172
company. Thus, Lukoil, Slavneft, TNK-BP and Yukos all control refining assets outside Russia in state of the FSU of Eastern Europe. These relationships guarantee a supply of crude oil for the host country (it is hoped) and investment in upgrading the refineries. For the Russian companies they provide and increased export allocation, since deliveries to these refineries generally fall outside their export quota allocations. They also provide a route for boosting crude oil exports, with some of the crude that is supposedly to be refined actually being exported by the refinery in its unprocessed state.
Security of energy (oil and gas) supplies in the energy-poor countries in the EBRD’s area of operations could perhaps be enhanced by the development of a truly competitive energy sector in Russia. However, this would have to include real competition to Gazprom and the removal from state control of oil pipeline operator Transneft. In the cases of both oil and gas the trunk pipeline network would have to be operated on an open-access basis, free from any political influence over oil and gas transportation. It seems unlikely that this will happen in the foreseeable future. Control over oil and gas supply through its pipeline system is too important as a tool for regional policy and for regulation of the oil industry for the Russian Government to be prepared to forego it any time soon.
The Cross-border oil and gas projects are discussed in the given report. Cross-border oil and gas project (those involving the development of and oil or gas field that straddles an international border) have become an increasingly important issue for the states of the FSE, particularly in the Caspian Sea region. Following the agreement between Russia and Kazakhstan on a mutual border in the Caspian, a number of geological structures straddling the border were identified for joint exploration and development by Russian and Kazak companies. These projects could help to cement ties between the two countries, or they could become the source of lengthy disputes. Initially it seemed as though the former would be the case, with quick agreement on which companies would be responsible for leading the project on each of the identified blocks. However, since then Russian companies have sought tax breaks from the government of Kazakhstan and little real progress has yet been made on any of the projects. Elsewhere.
Conflicting claims to a field in the south Caspian between Azerbaijan and Turkmenistan have led to repeated flare-ups between Baku and Ashgabad. The field, called Kapaz in Azerbaijan and Serdar in Turkmenistan, has repeatedly been the subject of dispute between the two countries. In 1997, Azerbaijan’s Socar signed a deal with Russia’s Lukoil and Rosneft to develop the field, which was annulled in the wake of protests from Turkmenistan. In 1998-1999, Turkmenistan sought to involve US oil major Mobil in a project to develop the field, but this deal solo lapsed. In January 2005, Turkmenistan again sought to involve foreign partners in the development of Sedar, granting exploration rights to Canadian oil company Buried Hill Energy, which was represented in discussions with the Turkmenbashi by former Canadian Prime Minister Jean Chretien. Turkmenistan has also laid claim to

“ENERGY BALANCE” OF GEORGIA POWER SECTOR PART 1: ANALYSIS AND PROPOSALS
Page 64 of 172
the Azeri and Chirag fields (known in Turkmenistan as Khazar and Osman), currently being developed by a BP-led consortium under PSA signed with Azerbaijan. In the case of these two countries, cross-border oil and gas projects have been a source of conflict, rather than of co-operation, and seem likely to remain so.
4.C.4 Transition Country Coal and Electricity Prospects14
This research was commissioned by the EBRD as a Background paper for its
Energy Policy Paper scheduled to be presented to the EBRD Board early in 2006. The paper reviews the prospects for the electricity and coal sectors in transition countries in the context of overall growth in demand for primary energy.
The paper emphasizes the fact that the general increase in oil and linked energy prices in 2004 would result in higher gas prices in future and it would equal to 100% increase compared with 1990 in real terms. In contrast the price of coal was either stable or falling right up to 2004, so that there has been a fundamental shift in the relative prices of these and other fuels. These changes have caused major implications for the mix of new investment in electricity generation and over the next 50 years. This report focuses on examining the consequences of the shift in relative fuels prices, both for electricity sector and for coal sector, especially against the background of a revival of growth in the demand for all resources of energy and for electricity in particular.
According to the report the archetypal transition applies to CIS Countries with rapid growth in energy use up to 1988-1990 followed by the decline that reached a trough in 1997-1998. Since then energy use has been growing at a rate of 2.5% annually as a consequence of the recovery in GDP. It reflects the larger decline in energy consumption from 1990 to 1998.
According the report, the future of energy intensity for the CIS Countries is harder to predict. The very sharp decline in GDP of most countries following the transition was accompanied by a much slower adjustment in energy use. Provided that there is no reversal of the trend to link user prices to cost recovery or import/export parity levels, then it seems likely that the decline in the average energy intensity for the CIS countries will continue.
In the CIS countries natural gas accounted for more then one-half of primary energy use in 2002-52%, up from 30% in 1980. Its penetration was forecasted to continue but much more slowly, reaching 56% of the market in 2020.
14
See: Prospects For The Electricity And Coal Sectors In Transition Countries, Prepared By Gordon Hughes, Department Of Economics, University Of Edinburgh , and Economic & Statistical Services Ltd

“ENERGY BALANCE” OF GEORGIA POWER SECTOR PART 1: ANALYSIS AND PROPOSALS
Page 65 of 172
The category of other primary energy includes hydro, nuclear and renewable energy. Its share has been increased in both the CEB/SEE and CIS countries from 5-6% of primary energy use in 1980 to about 12% in 2002. The increasing share is primarily due to the expansion of nuclear power, through the contraction in the use of fossil fuels has been a factor. The projections suggest that the share of other primary energy will not change significantly in either sub-region up to 15-20 years. Since there are limited opportunities for increasing the amount of hydro power, the growth in use of other primary energy is expected to come almost entirely from the new nuclear power plants. The proportion of primary energy supply represented by non-traditional forms of renewable energy in small-about 1.6% for the whole region – and is not expected to reach 2% before 2030.
It has to be mentioned that the consistent data on the age of structure of existing plants is not available. On the bases of proportions of thermal generating plant for each group of countries that was more than 30 years old in 2003 varied from 47% for South East Europe to 56% for the CIS-since the analyses rely in part upon data for the former Soviet Union, it is not possible to subdivide the CIS figures between Russia and the rest of CIS. Majority of the existing assets is more than 40 years old that urgently need rehabilitation to supply the growing level of demand over the next 8 years. According to authors, under the current conditions there is no sign that the electricity sector in Russia or the rest of CIS has either the financial or institutional capacity to implement major investment programs.
As for the coal sector in transition counties, the prospects flow directly from the analysis of the choice between coal, gas and nuclear power in the expansion or replacement of generating plants. If transition countries participate fully in the EU’s trading scheme for CO2 emissions, then coal will have no long term future as a fuel for power generation. The main issue would be how to manage the unavoidable contraction and closure of the industry in the remainder of the region.

“ENERGY BALANCE” OF GEORGIA POWER SECTOR PART 1: ANALYSIS AND PROPOSALS
Page 66 of 172
5. CONCLUSIONS
This document is Part 1 of a two part study. Part 2, bound separately,
reviews the history of Georgian energy balances for all fuels since 1960. Part 1 analyzes strategic issues in operation of the power system of Georgia. Part 1 complements our conclusions on the relative merits of hydro vs. gas fired power supply, found in Part 1 of our May 2006 study on natural gas strategy issues for Georgia.
The present study reaches several conclusions. The strongest is this: operation of the Georgian power system on a least cost dispatch basis (that does not force to operate thermal units out of their cost-based “merit order”), can save a very significant percentage of the total operating cost of the Georgian system. Doing so requires improvements to the Georgian high voltage transmission system, to allow more reliable dispatch of western Georgian energy for loads in the east.
Our gas study implied that it would be more economic to plan to meet the entire Georgian domestic load from hydro resources; provided that hydrologic variability was also properly met. Chapter 3, and Annex B therefore analyze in detail the historical experience of hydrological condition variability in Georgia, and its impact on system operations. We estimate the MW of additional hydro capacity that would be required to meet various reliability standards, if the system sought to be self-sufficient based on hydro power. The standards studied were that “low water” conditions not affect the Georgian operations for more than: one in five years, one in ten years, one in twenty years, and one in one-hundred years. The analysis shows that building the Khudoni HPP and at least parts of the Namakhvani Cascade, would approximately meet the one-in twenty year reliability criteria. Thus, it is quite feasible to design and operate the Georgian system essentially entirely from hydro resource, so that on average, imports would be needed for reliability only about one year in twenty, assuming a reliable domestic transmission grid.
But even if Georgia were physically “self-sufficient” in energy supply, one would not design nor operate the system as an isolated grid. Previous studies, reviewed in Chapter 4.C, emphasized the value of creating a regional “market”, in which economic trades can occur. (Those studies also discuss issues and problems in creating regional energy markets, and effects of regional integration, such as on coal markets, not otherwise studied here.) The fact that even without such organized international market, existing Georgian operation is much lower cost and much more reliable than if isolated, strongly supports the argument that additional, large, benefits would result from better regional market structures.
The analysis also shows that reliability of the Georgian system is much higher, and the operational costs lower, than if it were operated as an isolated system. Indeed, as demonstrated especially in Chapter 2.B, even with the required

“ENERGY BALANCE” OF GEORGIA POWER SECTOR PART 1: ANALYSIS AND PROPOSALS
Page 67 of 172
upgrades of its high voltage transmission network to assure internal reliability, the Georgian grid would today experience severe shortages without use of imports.
Several parts of this study, summarized in Chapter 4.B, show that Georgia already has significant exportable electricity resources. Somewhat surprisingly, those exportable resources are predominantly thermal power, not, hydro power generation. This occurs especially if the Georgian system were operated on a least cost dispatch basis, but even if operated with the present forced dispatch of thermal capacity in certain periods. This is also true if the currently proposed major hydro additions to the Georgian grid (the Khudoni and Namakhvani HPP projects) were built. It is also true, if the Georgian load increases by up to 30% in the next 5 to 10 years, as some analysis expect.
This has important implications. The new hydro units are often discussed as if built for export of energy, and indeed, they require a price comparable to the import price to be financed at all. However, the new hydro units could also be operated in large part to offset imports, and if a similar price is paid, (as would be required to finance them), it is not necessary to think of the new units as being “built for export”.
As well, because the predominant capacity available in Georgia in excess of domestic requirements is gas fired, and because gas units can be dispatched in ways that can assure a more reliable operation, owners and operators of Georgian thermal units should consider that what they have to sell is better described as “reliability”, not “thermal energy”.
Thermal units, as a reliability service, can also be combined with the possibility of relatively large volumes of hydro from “wet years”. That is, highly reliable thermal capacity could be combined with the “excess production” from proposed new hydro units. Because “wet year” production occurs only due to climatic conditions, it may seem a too-unreliable source to be sold to customers requiring firm (highly reliable) power supplies. But if that energy is “packaged” with thermal capacity, the combination might be sold as a very reliable source of “firm” energy. The total cost of this energy would be less than the cost of generating thermal-based electricity, since in the “wet” years, a large volume of hydro power, requiring no fuel cost, could be substituted for thermal. (And, restating, a key to being able to sell firm energy, and reliability, internationally, is that the domestic Georgian transmission grid itself be reinforced and made more reliable, to assure that the thermal units can be available for such uses.)
Thus, in discussing creating “packages” of thermal power and “excess wet year” energy, to create a very reliable export of firm energy, we also discussed doing so using only the “wet year” “excess” energy, which would result from meeting the one in twenty year standard.

“ENERGY BALANCE” OF GEORGIA POWER SECTOR PART 1: ANALYSIS AND PROPOSALS
Page 68 of 172
The study implies that the currently planned new hydro units (principally Khudoni HPP, and the Namakhvani Cascade) are adequate to meet Georgian load growth up to about 30%. We have not performed a forecast of load growth. But 30% growth is about what other analysts expect within the net decade.
Finally, this study is also intended as an example and “handbook” for the use of the GDM model for the Ministry of Energy. Annex A provides documentation of that model. A fully developed copy of the model has been delivered to the Ministry of Energy, and several detailed seminars have been conducted for the operating staff of the Ministry, on how to use the model for analysis such as demonstrated here.

“ENERGY BALANCE” OF GEORGIA POWER SECTOR PART 1: ANALYSIS AND PROPOSALS
Page 69 of 172
ANNEX A: GDM MODEL DOCUMENTATION
A.1 THEORY OF THE GDM MODEL
The underlying theory of the Georgia Generation Dispatch Model (GDM) is
direct and simple. First, as discussed in the main text, for a generation model to be useful at all, even for general planning purposes, it should simulate operation of the system on not less frequent than an hourly basis. This is because load variations on a real power system change continuously. One hour is probably the longest interval that can realistically simulate operational decisions that occur moment to moment, and certainly can change every few minutes at least in small ways. Thus the GDM does all analysis in terms of matching load for each hour. In doing so, the GDM models, for each month, as a typically 24 hour daily load shape, based on actual past total system hourly load in Georgia for those months. Months are then weighted by the number of day in the month, to get monthly totals, or annual totals of monthly data.
Next, consider the selection of which units operate at each hour. Generation units in any power system are dispatch by one of two methods: either each unit is started and stopped by an ad hoc “manual” instruction (called a “must-run” instruction); or, any unit not selected as a “must-run”, is instead selected on the basis of some rule of sequencing. Commonly, that rule is to select first those which are “least cost”. by some definition. The method of definition of cost may vary in different systems or at different times, but the principle of ranking units by such measure is nearly universal. Thus, the GDM ranks all units that are not must-run, by their “cost” as defined for that run of the model. It selects units starting from the least cost first. It then takes incremental units of capacity by the least cost next available unit, until sufficient units are dispatched to meet exactly the system total load for that hour. This procedure is known generally as “merit order dispatch”. The last unit thus selected, that is, the highest cost unit actually dispatched) for the hour, is called the “marginal unit”. And the specific per kwh cost of that unit is called the “marginal cost” of the system for that hour
Definition of “cost” for this purpose varies widely. For example, cost may refer to a tariff per kwh defined by a regulator, it may refer to some formula for computing cost (such as a fuel heat rate conversion formula), it may refer simply to bids (offers of sales at a price) made by generators. The GDM is capable of doing merit order dispatch based on most if not all of such possible definitions of cost. For the present analysis, the costs assumed are the most current (as of June 2006) GNERC determined tariff per kwh for each unit; for those hydro units not yet built, approximately the current import price for energy is used. Application of import price as the tariff per kwh of new units is justified by separate models of the new projects, which show they require approximately the current import price, to break even on their total capital costs. But the GDM can also simulate operation based

“ENERGY BALANCE” OF GEORGIA POWER SECTOR PART 1: ANALYSIS AND PROPOSALS
Page 70 of 172
entirely on bid prices, or on contract prices. Thus, the same GDM could be used in the future in Georgia by the Ministry of Energy, to study the practical implications of many different market “designs”.
The benefits of using a least cost criteria are however, intuitive and obvious. Creating a theory of dispatch by least cost criteria can also be demonstrated to result in physical rules for the selection of unit, and for the decision of exactly how much of load to place on each unit, which results in both the highest technical and economic efficiency simultaneously. We do not review here the well developed theory called “microeconomics”, which demonstrates that use of least cost for determining allocation of resources (for example, here, for allocating which units are dispatched) also results in the most economically efficient result.
There are three other important features of power system operations that are not part of the GDM, or are included in selective ways.
First, the design and operation of the transmission and distribution grids (called “load flow” for modeling purposes) can affect which units are selected. In particular, if a particular transmission line fails, will strongly affect which units are available or the possibility of dispatching them. While the GDM does not model load flow, it does allow us to selectively “disconnect” units, import or export lines, by choice of a parameter which, if set to 0, makes that unit or line “unavailable”, and if set to 1 makes it “fully available”. This device was used for example, to see the effect of absence of imports, by setting all international ties as 0 availability. Similarly to simulate an outage of the Imereti line, a major internal line within Georgia, the GDM includes a simple “switch” (a 0-1 choice parameter) that “turns off” all units whose production is lost to the main grid, if the Imereti line fails.
Second, in a more advanced model doing marginal cost dispatch, each unit might be modeled in detail, and its output taken within fine boundaries of fuel use efficiency. In a thermal based system, that feature is especially important. But to ease the computational burden of the model, the GDM simply dispatches, or not, the entire unit. This can result in dispatching “too much” capacity at the marginal unit. Thus, in such cases, the model automatically reallocates this “excess” over the larger or peaking units dispatched for that hour, and “backs them down” proportionately, until the exact load is actually dispatched.
Finally, an actual dispatch operation will have certain units or portions of load of units, which can be controlled by the dispatch operator, for purely technical reasons on the system. These total load are usually a very small portion of the system load at any hour. However, the units can be considered nether “must rune”, since they are used selectively, nor “least cost”, since if the characteristics of that unit are need for technical reasons at a given moment, the fact it may cost more than the current marginal unit, does not affect whether it is dispatched. The GDM does not attempt to simulate this form of system behavior. If it did, the result would be to raise total system cost by a small amount, but also, probably by a similar small

“ENERGY BALANCE” OF GEORGIA POWER SECTOR PART 1: ANALYSIS AND PROPOSALS
Page 71 of 172
amount in all scenarios. Thus, since it will not likely affect the kinds of judgments that the GDM is employed to understand, the absence of this refinement also is not a practical limit on the use of the model.
A.2 OPERATION OF THE GDM MODEL
Below is a description of the GDM used for simulations supporting this study.
The Generation Dispatch Model of Georgian Power System was to assist the Ministry of Energy of Georgia in analysis of various power system development scenarios and making strategic decisions. Its initial aim was to evaluate effects of new power market structure proposed by the Ministry of Energy in early 2005. It simulates Georgian power system generation dispatch and yields a technical picture so financial performance figures based on (a) generation Tariffs, (b) Pure Marginal Price Market and (c) Competitive, Non-Competitive & Controlling Sub-Markets.
A.2.1 Introduction – Georgian Power System
The Dispatch Model was specifically designed for Georgian Power System. The Georgian Power System is predominantly driven by hydropower. When the Caucasus region, including Georgia, was part of the Soviet Union, the Georgian grid formed part of Southern Caucasus regional power system (united grid of three Caucasus republics – Armenia, Azerbaijan and Georgia), which often operated independently from the Russian grid. Georgian hydropower was used to cover peak demands while Armenia’s nuclear and Azerbaijan’s thermal power plants carried base load of the regional system. After the break up of Soviet Union each country started to operate its power system independently. As a result Georgia was left with insufficient power generation for the winter period, due to lack of water in rivers in winter months. As for thermal power generation (mostly concentrated in Gardabani, southeast from Tbilisi) – it was always more expensive and problematic to arrange for uninterrupted fuel supply for the plants.
The current Georgian power system (see Part 1.C map) is an imbalanced system with most of its generation concentrated in Enguri and Rioni river basins in the western part of the country and highest load of Tbilisi and industrial Rustavi in the east. High voltage transmission grid with just one strong backbone 500 KV line is constantly carrying high energy flow from west to east. Any disturbance in the operation of this single 500 KV transmission line leads to grid stability and whole system reliability issues. e Model can provide simulation results calculating available export potential, power plant dispatch pattern for various conditions, etc.
A.2.2 General Inputs
(Sheets: Parameters-Financial, Parameters-Tech, PlantData-kWh, PlantData-Level, PlantData-General, Plant Tariffs, Hourly Loads)

“ENERGY BALANCE” OF GEORGIA POWER SECTOR PART 1: ANALYSIS AND PROPOSALS
Page 72 of 172
All inputs and variables in the model are color coded in blue. Inputs are concentrated on following sheets (sheet tabs are also colored in blue): Parameters-Financial, Parameters-Tech, PlantData-kWh, PlantData-Level, PlantData-General, Plant Tariffs, and Hourly Loads.
A.2.3 Data Sources
(Sheets: Parameters-Tech, PlantData-kWh, PlantData-Level, PlantData-General, Plant Tariffs, Hourly Loads)
Necessary data on Georgian Power System was obtained from following key power system organizations: Ministry of Energy of Georgia, GNERC, GSE, GWEM and Telasi. Hourly Loads – were provided by GSE and Telasi. Most simulations were done
with Georgian Power System hourly load data from 2004. Hourly load values for the 15th day of each month, plus Peak Load of December 31st were chosen (13 sets of 24 hour values).
Plant Data – was provided by the Ministry of Energy, GSE, GNERC and
GWEM. These are installed & current capacities of the power plants and number & size of units of each plant.
Plant Tariffs – were taken from GNERC’s resolutions (namely from Resolution
#18, May 15, 2006). See sheet Plant Tariffs. Historical Generation (kWh) Volumes for each month starting from Jan 2000
till May 2006 were provided by GWEM. These are used to calculate average monthly generation of each power plant and define their average outputs and availability factors (see sheet PlantData-kWh).
Historical Reservoir Levels – for Enguri, Zhinvali and Khrami I HPPs were
provided by GSE. See sheet PlantData-Level. HPP Peak Power Output Dependency on Reservoir Level – for Enguri,
Zhinvali and Khrami I HPPs were provided by GSE. See sheet PlantData-Level.
A.2.4 Basic Operating Principles
(Sheets: Parameters-Tech, PlantData-kWh, PlantData-Level, PlantData-General, Sep thru Aug and Peak Load)
The main principle in dispatching generators in this model is Economic Dispatch. The cheapest available generator is dispatched first. This is achieved by

“ENERGY BALANCE” OF GEORGIA POWER SECTOR PART 1: ANALYSIS AND PROPOSALS
Page 73 of 172
automatic sorting according to the following criteria: (1) Must Run unit/plant, (2) Cheapest kWh Tariff (including VAT) and (3) Actual Peak Power. Only after all available for that moment capacity from the cheapest power plant is fully used, the next cheapest plant is dispatched. Dispatched plants’ capacities are stacked until their cumulative output exceeds hourly system load for that hour (see columns Cumulative Peak Capacity & Cumulative Off-Peak Capacity on sheets Sep thru Aug and Peak Load).
There are 13 sheets (Sep thru Aug and Peak Load) on which the main calculations/simulations are performed. Hourly Overdispatch Error – may occur each hour when model stacks power
plants in order to meet power system load for that hour. When last dispatched plant capacity is added to the cumulative capacity of all dispatched plants for given hour, total cumulative capacity may exceed the system load. In this case Overdispatch Error is subtracted from Peaking power plants’ outputs for that hour according to each peaking plant’s percentage share in cumulative capacity for that hour.
Peak & Off-Peak Hours – are defined as a percentage difference between
those two for each month separately. This distinction between Peak & Off-Peak Hours was necessary to more accurately simulate dispatch pattern of Peaking (large regulating reservoir) hydro power plants in the system (see sheet Parameters-Tech).
Power Plant Dispatch Commands – in columns under Typical Hourly Loads on
sheets Sep thru Aug and Peak Load are defined as follows: o 0 – Power Plant is NOT dispatched for that hour o 1 – Power Plant is dispatched in Off-Peak Hour o 2 – Power Plant is dispatched in Peak Hour
Peak & Off-Peak Capacities – as mentioned before, distinction between Peak
& Off-Peak Capacities was necessary to more accurately simulate dispatch pattern of Peaking (large regulating reservoir) hydro power plants in the system. At Peak Hours power plants are dispatched at their current Peak Output rating. Currently only Enguri and Zhinvali HPPs employ this technique in the Model.
o Peak Capacities for Peaking Power Plants are defined from relationship between reservoir level and Maximum Allowable Output of the plant (see sheet PlantData-Level). o Off-Peak Capacities for Peaking Power Plants are calculated as follows: For each month Power Plant’s dispatched Peak Outputs are multiplied on number of Peak Hours and number of days in that month. This gives us monthly kWh generation during peak hours by those plants. The result is then subtracted from Average Historical kWh

“ENERGY BALANCE” OF GEORGIA POWER SECTOR PART 1: ANALYSIS AND PROPOSALS
Page 74 of 172
Generation for respective month. Remaining kWh generation for that month is divided on number of Off-Peak Hours in that month, which yields average Off-Peak power output of the plant. Whenever plant is dispatched in Off-Peak hours in given month, its Off-Peak Capacity calculated according to the abovementioned technique is used. These calculations are done on sheet PlantData-General in monthly Actual Off-Peak Power columns.
Availability Factors – are used for determining power outputs of Run-of-River
and some Peaking (excluding Enguri and Zhinvali) hydro power plants in various months. Their current ratings are multiplied on aggregate seasonal availability factors.
Hourly Load Growth Factor – lifts or lowers all hourly loads in each month by
multiplying Hourly Load values by this factor. Must Run Units – are defined as units/plants needed to be run even though
they are not the cheapest plants in the system.
A.2.5 Output Sheets
(Sheets: H Gen Graphs, H Market Prices, AnnualTotals–Dispatched, AnnualTotals–Available, Summary Data)
Sheet H Gen Graphs – provides graphical and numerical outputs of key power
plant dispatch patterns for each month, plus for the Peak Load of Dec 31st. This sheet is based on two previous sheets (H Gen Data 1 & H Gen Data 2) which in turn collect hourly output values for each dispatched power plant from 13 sheets: Sep thru Aug & Peak Load.
Sheet H Market Prices – collects hourly marginal prices for Pure Market and
Sub-Market cases from 13 sheets: Sep thru Aug & Peak Load. Sheet AnnualTotals–Dispatched – collects monthly volumes of kWh
generation and revenues (for all three cases: Tariff, Pure Market and Sub-Market marginal prices) for each Dispatched power plant and sums up for the whole year.
Sheet AnnualTotals–Available – collects monthly volumes of kWh generation
available after dispatch of domestic Georgian loads. ---- Sheets Scenario Sheets & Parameters -- summarize outputs from other
sheets, and/or provide parameters for definition of scenarios.

“ENERGY BALANCE” OF GEORGIA POWER SECTOR PART 1: ANALYSIS AND PROPOSALS
Page 75 of 172
ANNEX B. ANALYSIS OF HYDROLOGICAL VARIABILITY
Hydro power is a predominant present and potential future generation source
in Georgia. Thus the question of whether it is possible to hydro power to serve the entire load, makes it necessary to understand the risks to system operations from climatic variations in water conditions. We here analyze the risks of hydrological variations, and how they affect the amount of capacity that would be required to mitigate those risks.
B.1 Method of Estimating Risk
The concept of this study is straightforward. The largest hydro unit in
Georgia is the Enguri HPP, on the Enguri River, and the largest planned unit, Khudoni, is also on that river. The other larger anticipated units also are in western Georgia, and share very similar geographic and climatic conditions. Thus, the variation in water conditions on the Enguri River may provide a good basis for understanding the risks to available volumes or water needed to operate principal hydro power plants in Georgia. We thus use an approximately 50 year record of monthly water flow conditions on the Enguri River to analyze levels of risk of availability of water. We then estimate the equivalent effect of lower water availability, on generation capacity, for different levels of risk.
We estimate level of risk by statistical analysis of the available data. For each month, we estimate a parameter known as the “standard deviation” of variation of a experienced water flow, above and below the mean value of that flow rate. If the distribution has a sufficiently “normal” shape, then the standard deviation can be interpreted as a measure of the range of variation, in relationship to the percentage of times a variation occurs within that range. For example, the percentage of values that will fall within a range of one standard deviation from the mean value is 66%. The percentage of time that the experience will fall within a range of plus or minus 2 standard deviations from the mean is 95%. Note that if 95% of the values fall within 2 standard deviations, that also means that not more than 5%, or not more than one in 20, fall outside that range. Our basic data is yearly events (for each month). Thus if we find the average and measure a range of 2 standard deviations, then in not more than one year in 20 will the flow rate for that month fall outside of that range.
B.2 Definition of Reliability
Using this measure, we may determine a reliability standard. For this study
we select four levels of reliability: (1) that the water conditions will not be below the average more often than one year in 5; (2) that the water conditions will not be below the average by more than one year in 10;

“ENERGY BALANCE” OF GEORGIA POWER SECTOR PART 1: ANALYSIS AND PROPOSALS
Page 76 of 172
(3) that the water conditions will not be below the average more often than one year in 20; (4) that the water conditions will not be below the average for more than one year in 100.
To estimate these risk levels, we compute the average and the standard
deviation of water flow conditions for each month. For each level of risk (percentage of years the event may occur) we compute the level of variation that corresponds to that level of risk, by using an appropriate multiple of the standard deviation. We then use that amount of variation, as a percentage of average conditions, to estimate the amount of hydro power production capacity needed to maintain the same level of output as the average, even in lower water conditions.
B.3 Summary Description of the Data:
The underlying data uses for study of variability of water conditions is a set of
56 years of water flow data (measured as m3/sec average monthly value of water flow at the measuring station) on the Enguri river, reported in Table 10 below. This is broken as a set of 51 years of monthly data from 1921-1981, and an additional 5 years from 1999 through 2003.15 The presence of two somewhat disconnected bodies of data however allow to view sub-segments for comparative purposes, in establishing the percentages of variation used to define the four levels of reliability defined above.
Tables 1 through 4 summarize the statistical analysis of the data, deriving the monthly and annual reliability criteria as defined earlier. There are two important subtleties of this analysis, in the relationship between annual and monthly data. The first effect is most easily understood from Table 4, the percentages of variance about the average, for each reliability criterion. That table shows that the annual total column has a smaller variance in each criterion, than do any of the monthly variances. This is essentially a statistical effect of aggregation of data. Each month is a portion of the annual total. When the months are aged to find the total annual flow, the effect is to dampen the monthly variations. That is, the percentage variation of water flow on an annual basis is less than that of any particular month, since the variations in months tend to “cancel” each other; the months are not perfectly auto-correlated in water conditions.
This fact however is directly related to how the major storage hydro units operate, and thus, to the selection of the annual and not the monthly variances, for computing reliability criteria. Because water is stored in wet months, but used in dry months, the monthly variances in water intake do not directly relate to the ability to dispatch the unit through the year. Instead, it is the annual total volume entering the reservoir that determines the annual total kwh that may be determined. Thus, the
15
Additional partial year data for 2004 is reported on the tables but not used in the analysis. As most of the data is old, and had no documentation as to reliability, we simply accept it at face value.

“ENERGY BALANCE” OF GEORGIA POWER SECTOR PART 1: ANALYSIS AND PROPOSALS
Page 77 of 172
relevant measure of variance for risk determination is the annual variance percentages, and, the relevant physical measure against which this must be computed in the annual total kwh generated, not, the MW capacity in a direct sense.
Thus, Table 5 computes the annual total GWH that must be generated to offset the loss of operational capacity in low water years at each level of criteria in each month of the annual cycle. Table 5 is the basis for the analysis in the main text and is further discussed there.
Tables 6 through 9 show some technical characteristics of the underlying data. Tables 6 and 7 show the average, maximum and minimum flow conditions as data and as graphs. Tables 8 and 9 graph the trend based on aggregate total flows (the simple sums of monthly average m3/sec flows) as a surrogate for total water available per year. These show that the operation in recent years is at, but slightly, below the average of the full data set, and that the data in the recent years is also somewhat wetter than the forecast of the long term trend without that data. However, the long term trend is for somewhat lowered annual total flow rates. Recent years averages are slightly lower than full data sample average. But that is proper since the slope (long term trend) is slightly down, thus recent years should be below the long term average. From Table 1, the “skew” measure shows that years that are above the average (“wet years”) are slightly wetter on average than are the years below the average.
Note: the study estimates annual total flow volumes indirectly. The actual annual total flow would be computed as the sum of: the monthly average flow rate per second times the number of seconds for each month, and then adding these 12 total over all twelve months. However, we get approximately the same result in percentage terms, by simply taking as the yearly total, the simple sum of the average monthly flow rates per second, as is done in the analysis behind Tables 1 through 4. To derive the approximate total annual flow from this total, multiply the total in Table 1, by the number of seconds in a year, and then divide by 12. As the computations are all linear in these factors, this affects the absolute level of the values shown in the “full year” column in Tables 1 through 3, but does not affect the percentages in Table 4, which is the foundation for subsequent analysis

“ENERGY BALANCE” OF GEORGIA POWER SECTOR PART 1: ANALYSIS AND PROPOSALS
Page 78 of 172
TABLE B-1: SUMMARY OF HYDROLOGICAL VARIATION IN M3/SEC OF THE ENGURI RIVER AT THE IN-FLOW TO ENGURI HPP RESERVOIR.
Hydrologic Variation Data Summary
Year Range Slope Average Median Skew
1929-1981 -5.099 1,774.7 1,761.5 0.479
1999-2003 3.864 1,783.4 1,721.0 0.521
All Data -2.740 1,775.5 1,761.1 0.468
Year Range Std Dev 5 10 20 100
1929-1981 259.01 331.918 426.0 507.6 667.155
1999-2003 276.24 353.999 454.4 541.4 711.537
All Data 257.99 330.620 424.4 505.7 664.545
Year Range 5 10 20 100
- x SD 1.28151 1.64485 1.95996 2.57583
1929-1981 0.813 0.8 0.7 0.624
1999-2003 0.802 0.7 0.7 0.601
All Data 0.814 0.8 0.7 0.626Selected Criterion: 81% 75% 70% 62%
Annual Total Water Conditions
Exceeds Design by 0ne Year Per:
As Percent of Average

“ENERGY BALANCE” OF GEORGIA POWER SECTOR PART 1: ANALYSIS AND PROPOSALS
Page 79 of 172
TABLE B-2: STATISTICAL CHARACERISTICS OF THE HISTORY OF ENGURI RIVER FLOW CONDITIONS
Jan Feb Mar Apr May Jun Jul Aug Sep Oct Nov Dec Full Year
Monthly Average
1929-1981 37.16 36.13 49.42 134.23 267.00 306.72 329.15 253.62 148.06 96.55 68.64 48.06 1774.73
1999-2003 39.80 44.00 51.60 159.40 269.40 354.00 327.40 219.40 116.20 87.80 75.00 39.40 1783.40
All Data 37.39 36.81 49.60 136.40 267.21 310.79 329.00 250.67 145.31 95.79 69.19 47.32 1775.48
Monthly Standard Deviation
1929-1981 9.69 9.54 15.81 41.80 64.02 66.49 57.97 50.20 35.43 36.10 25.66 13.34 259.01
1999-2003 15.01 18.87 30.37 28.32 62.18 69.70 80.24 12.10 39.89 34.82 22.08 12.40 276.24
All Data 10.10 10.63 17.12 41.24 63.33 67.48 59.31 49.03 36.58 35.78 25.26 13.39 257.99
Full Year surrogate estimated as sum of monthly average flow rates.
To estimate actual annual total annual flow multiply this number by the number of seconds in a year and divide by 12.Since analysis uses percentages based on variances, this does not affect resulting percentage range of variation.
Statistical Characteristics of History of Enguri River Flow Conditions:
Averages and Standard Deviations, Data in m3/sec.

“ENERGY BALANCE” OF GEORGIA POWER SECTOR PART 1: ANALYSIS AND PROPOSALS
Page 80 of 172
TABLE B-3: PARAMETERS FOR RELIABILITY CRITERIA BASED ON HYDROLOGICAL HISTORY OF ENGURI RIVER FLOWS
Jan Feb Mar Apr May Jun Jul Aug Sep Oct Nov Dec Full Year
Monthly Deviation for One Year in 5 Criterion
1929-1981 12.41 12.23 20.25 53.57 82.04 85.21 74.29 64.34 45.40 46.27 32.88 17.10 331.92
1999-2003 19.23 24.18 38.92 36.29 79.68 89.32 102.82 15.50 51.12 44.63 28.29 15.89 354.00
All Data 12.94 13.62 21.94 52.85 81.16 86.48 76.01 62.83 46.88 45.86 32.37 17.16 330.62
Monthly Deviation for One Year in 10 Criterion
1929-1981 15.93 15.69 26.00 68.75 105.30 109.37 95.35 82.58 58.27 59.39 42.20 21.95 426.03
1999-2003 24.68 31.03 49.95 46.58 102.27 114.64 131.98 19.90 65.61 57.28 36.32 20.40 454.37
All Data 16.61 17.49 28.16 67.84 104.17 110.99 97.56 80.64 60.17 58.86 41.54 22.02 424.36
Monthly Deviation for One Year in 20 Criterion
1929-1981 18.99 18.70 30.98 81.93 125.47 130.32 113.62 98.40 69.44 70.76 50.28 26.15 507.64
1999-2003 29.41 36.98 59.52 55.50 121.86 136.61 157.26 23.71 78.18 68.25 43.27 24.31 541.41
All Data 19.79 20.84 33.55 80.83 124.12 132.26 116.25 96.09 71.69 70.13 49.50 26.24 505.66
Monthly Deviation for One Year in 100 Criterion
1929-1981 24.95 24.58 40.71 107.67 164.90 171.27 149.32 129.32 91.26 93.00 66.08 34.37 667.15
1999-2003 38.65 48.60 78.23 72.94 160.15 179.53 206.67 31.16 102.75 89.70 56.87 31.94 711.54
All Data 26.01 27.38 44.09 106.24 163.13 173.82 152.77 126.28 94.22 92.17 65.06 34.49 664.55
Parameters for Selected Reliability Design for Enguri HPP Based on Hydrological History

“ENERGY BALANCE” OF GEORGIA POWER SECTOR PART 1: ANALYSIS AND PROPOSALS
Page 81 of 172
TABLE B-4: PARAMETERS FOR RELIABILITY CRITERIA BASED ON HYDROLOGICAL HISTORY OF ENGURI RIVER FLOWS
EXPRESSED AS PERCENTAGES OF OPERATING CAPACITY OF ENGURI HPP
Jan Feb Mar Apr May Jun Jul Aug Sep Oct Nov Dec Full Year
Percent Monthly Deviation for One Year in 5 Criterion
1929-1981 0.67 0.66 0.59 0.60 0.69 0.72 0.77 0.75 0.69 0.52 0.52 0.64 0.81
1999-2003 0.52 0.45 0.25 0.77 0.70 0.75 0.69 0.93 0.56 0.49 0.62 0.60 0.80
All Data 0.65 0.63 0.56 0.61 0.70 0.72 0.77 0.75 0.68 0.52 0.53 0.64 0.81
Percent Monthly Deviation for One Year in 10 Criterion
1929-1981 0.57 0.57 0.47 0.49 0.61 0.64 0.71 0.67 0.61 0.38 0.39 0.54 0.76
1999-2003 0.38 0.29 0.03 0.71 0.62 0.68 0.60 0.91 0.44 0.35 0.52 0.48 0.75
All Data 0.56 0.52 0.43 0.50 0.61 0.64 0.70 0.68 0.59 0.39 0.40 0.53 0.76
Percent Monthly Deviation for One Year in 20 Criterion
1929-1981 0.49 0.48 0.37 0.39 0.53 0.58 0.65 0.61 0.53 0.27 0.27 0.46 0.71
1999-2003 0.26 0.16 -0.15 0.65 0.55 0.61 0.52 0.89 0.33 0.22 0.42 0.38 0.70
All Data 0.47 0.43 0.32 0.41 0.54 0.57 0.65 0.62 0.51 0.27 0.28 0.45 0.72
Percent Monthly Deviation for One Year in 100 Criterion
1929-1981 0.33 0.32 0.18 0.20 0.38 0.44 0.55 0.49 0.38 0.04 0.04 0.28 0.62
1999-2003 0.03 -0.10 -0.52 0.54 0.41 0.49 0.37 0.86 0.12 -0.02 0.24 0.19 0.60
All Data 0.30 0.26 0.11 0.22 0.39 0.44 0.54 0.50 0.35 0.04 0.06 0.27 0.63
Parameters in Percentages for Selected Reliability Design for Enguri HPP

“ENERGY BALANCE” OF GEORGIA POWER SECTOR PART 1: ANALYSIS AND PROPOSALS
Page 82 of 172
TABLE B-5: PARAMETERS FOR RELIABILITY CRITERIA BASED ON HYDROLOGICAL HISTORY OF ENGURI RIVER FLOWS
EXPRESSED AS MW OF REQUIRED ADDITIONAL OPERATING CAPACITY NEEDED TO OFFSET LOSS OF CAPACITY IN LOWER FLOW CONDITIONS
Jan Feb Mar Apr May Jun Jul Aug Sep Oct Nov Dec Full Year
GWH Monthly Deviation for One Year in 5 Criterion
1929-1981 154.77 130.54 141.28 129.35 115.93 103.98 108.76 110.26 99.37 114.45 127.48 158.82 1495.00
1999-2003 164.27 138.55 149.94 137.29 123.04 110.36 115.43 117.02 105.47 121.47 135.30 168.56 1586.71
All Data 154.10 129.98 140.67 128.79 115.43 103.53 108.28 109.78 98.94 113.96 126.93 158.13 1488.53
GWH Monthly Deviation for One Year in 10 Criterion
1929-1981 198.65 167.56 181.33 166.03 148.80 133.46 139.59 141.52 127.55 146.90 163.62 203.85 1918.87
1999-2003 210.84 177.83 192.46 176.21 157.93 141.65 148.15 150.20 135.37 155.92 173.66 216.35 2036.58
All Data 197.79 166.83 180.55 165.31 148.16 132.89 138.99 140.90 127.00 146.27 162.91 202.96 1910.56
GWH Monthly Deviation for One Year in 20 Criterion
1929-1981 236.71 199.66 216.07 197.84 177.31 159.03 166.33 168.63 151.99 175.05 194.97 242.90 2286.47
1999-2003 251.23 211.90 229.33 209.97 188.18 168.79 176.54 178.97 161.31 185.79 206.93 257.80 2426.73
All Data 235.68 198.79 215.14 196.98 176.54 158.34 165.61 167.90 151.33 174.29 194.13 241.85 2276.57
GWH Monthly Deviation for One Year in 100 Criterion
1929-1981 311.09 262.39 283.97 260.00 233.02 209.00 218.60 221.62 199.74 230.05 256.23 319.22 3004.94
1999-2003 330.17 278.49 301.39 275.95 247.32 221.82 232.01 235.21 212.00 244.16 271.95 338.81 3189.27
All Data 309.74 261.26 282.74 258.87 232.01 208.10 217.65 220.66 198.88 229.06 255.12 317.84 2991.93
Allocated Monthy Percentages of Annual Total, Based on Monthly Dispatch
Parameters in GWH Additional Output to Meet Design Condition

“ENERGY BALANCE” OF GEORGIA POWER SECTOR PART 1: ANALYSIS AND PROPOSALS
Page 83 of 172
TABLE B-6: AVERAGE YEAR, MAXIMIMUM YEAR AND MINIMUM YEAR FLOW CONDITIONS BASED ON HYDROLOGICAL HISTORY OF ENGURI RIVER FLOWS
Jan Feb Mar Apr May Jun Jul Aug Sep Oct Nov Dec Total Pct.
Average Values 37.2 36.1 49.4 134.2 266.7 305.9 327.2 251.0 147.7 96.4 68.1 47.91,767.8
Max Flood Year
Values46.0 55.6 78.1 229.0 426.0 471.0 433.0 262.0 199.0 113.0 146.0 60.5 2,519 135.30%
Min Flood Year
Values33.3 29.1 34.6 88.2 232.0 256.0 196.0 195.0 96.8 55.7 38.5 38.2 1,146 61.52%
Max as % 124% 154% 158% 171% 160% 154% 132% 104% 135% 117% 214% 126% 143%
Min as % 90% 81% 70% 66% 87% 84% 60% 78% 66% 58% 57% 80% 65%
Enguri HPP Basin Inflow, Enguri River In Reservoir of the Enguri HPP

“ENERGY BALANCE” OF GEORGIA POWER SECTOR PART 1: ANALYSIS AND PROPOSALS
Page 84 of 172
TABLE B-7: GRAPH OF MONTHLY VALUES OF AVERAGE YEAR, MAXIMIMUM YEAR AND MINIMUM YEAR FLOW CONDITIONS
BASED ON HYDROLOGICAL HISTORY OF ENGURI RIVER FLOWS
1928-1981 Enguri Inflow
0.0
50.0
100.0
150.0
200.0
250.0
300.0
350.0
400.0
450.0
500.0
Jan Feb Mar Apr May Jun Jul Aug Sep Oct Nov Dec
Average Values Max Flood Year Values Min Flood Year Values

“ENERGY BALANCE” OF GEORGIA POWER SECTOR PART 1: ANALYSIS AND PROPOSALS
Page 85 of 172
TABLE B-8: GRAPH OF TREND OF TOTAL ANNUAL FLOW BASED ON SIMPLE SUM OF MONTHLY RATES
0
500
1,000
1,500
2,000
2,500
3,000
1929
1931
1933
1935
1937
1939
1941
1943
1945
1947
1949
1951
1953
1955
1957
1959
1961
1963
1965
1967
1969
1971
1973
1975
1977
1979
1981
2000
2002
Series1
Linear (Series1)

“ENERGY BALANCE” OF GEORGIA POWER SECTOR PART 1: ANALYSIS AND PROPOSALS
Page 86 of 172
TABLE B-9: GRAPH OF VARIATIONS FROM THE TREND OF TOTAL ANNUAL FLOW BASED ON SIMPLE SUM OF MONTHLY RATES
-600.0
-400.0
-200.0
0.0
200.0
400.0
600.0
800.0
1,000.0
1929 1934 1939 1944 1949 1954 1959 1964 1969 1974 1979 2001
Series1
Linear (Series1)

“ENERGY BALANCE” OF GEORGIA POWER SECTOR PART 1: ANALYSIS AND PROPOSALS
Page 87 of 172
TABLE B-10: HISTORY OF INFLOW TO ENGURI HPP RESERVOIR
Year month Jan Feb Mar Apr May Jun Jul Aug Sep Oct Nov Dec Sums
Amount
Above or
Below
Average
Above
Average
1928 - - - - 250.0 265.0 222.0 112.0 130.0 90.0 39.6 36.9 1,1461929 27.8 25.0 27.2 114.0 370.0 218.0 448.0 376.0 259.0 164.0 63.2 44.4 2,137 361.1 1.0
1930 38.0 38.1 56.8 103.0 247.0 288.0 354.0 273.0 110.0 108.0 78.3 64.0 1,758 -17.3 0.0
1931 54.0 40.8 83.4 118.0 258.0 262.0 289.0 202.0 157.0 100.0 62.0 37.3 1,664 -112.0 0.01932 26.5 25.8 32.8 228.0 358.0 373.0 302.0 262.0 181.0 77.0 44.5 25.7 1,936 160.8 1.0
1933 27.0 24.6 26.5 69.2 317.0 304.0 358.0 322.0 194.0 98.7 83.1 59.3 1,883 107.9 1.0
1934 37.1 31.9 66.9 114.0 253.0 249.0 310.0 268.0 160.0 85.5 55.7 39.7 1,671 -104.7 0.0
1935 33.3 36.9 44.3 134.0 256.0 247.0 323.0 301.0 183.0 107.0 50.3 33.7 1,750 -26.0 0.01936 32.5 29.4 38.5 166.0 236.0 296.0 353.0 244.0 113.0 190.0 82.0 58.3 1,839 63.2 1.0
1937 32.7 41.2 61.4 126.0 260.0 260.0 379.0 303.0 164.0 98.2 61.7 73.2 1,860 84.9 1.0
1938 38.6 32.2 36.8 166.0 236.0 301.0 366.0 264.0 204.0 71.2 55.1 35.6 1,807 31.0 1.0
1939 28.7 30.1 34.3 131.0 273.0 266.0 290.0 263.0 170.0 227.0 93.6 60.5 1,867 91.7 1.0
1940 53.6 41.9 45.7 237.0 250.0 349.0 381.0 355.0 150.0 107.0 116.0 81.8 2,168 392.5 1.01941 46.0 55.6 78.1 229.0 426.0 471.0 433.0 262.0 199.0 113.0 146.0 60.5 2,519 743.7 1.0
1942 40.0 41.4 41.6 82.6 232.0 280.0 387.0 350.0 150.0 107.0 116.0 81.8 1,909 133.9 1.0
1943 40.5 29.9 34.7 108.0 210.0 240.0 323.0 270.0 161.0 94.5 77.8 64.6 1,654 -121.5 0.0
1944 28.6 37.1 65.5 115.0 291.0 312.0 344.0 247.0 151.0 75.2 55.7 43.2 1,765 -10.2 0.0
1945 31.4 30.2 31.6 57.3 190.0 253.0 272.0 202.0 113.0 54.6 36.0 23.3 1,294 -481.1 0.0
1946 39.7 38.0 43.4 136.0 349.0 336.0 247.0 189.0 141.0 96.7 92.6 52.3 1,761 -14.8 0.0
1947 44.2 51.5 89.9 143.0 217.0 264.0 297.0 195.0 177.0 127.0 140.0 69.3 1,815 39.4 1.0
1948 62.2 49.3 43.7 139.0 306.0 373.0 290.0 236.0 129.0 96.2 57.8 40.8 1,823 47.5 1.0
1949 32.5 29.5 36.9 65.0 247.0 335.0 344.0 280.0 158.0 70.9 33.4 32.5 1,665 -110.8 0.01950 30.4 31.4 57.7 163.0 214.0 183.0 269.0 220.0 140.0 102.0 76.2 36.1 1,523 -252.7 0.0
1951 30.0 27.2 68.4 101.0 146.0 258.0 290.0 285.0 172.0 96.8 66.3 54.8 1,596 -180.0 0.0
1952 54.3 47.0 48.0 165.0 259.0 326.0 387.0 312.0 172.0 103.0 66.9 59.8 2,000 224.5 1.0
1953 47.4 50.0 48.5 162.0 385.0 429.0 410.0 383.0 204.0 112.0 60.7 55.3 2,347 571.4 1.0
1954 53.5 52.7 72.0 153.0 415.0 502.0 437.0 277.0 125.0 71.1 44.7 32.8 2,236 460.3 1.01955 30.5 41.6 57.0 119.0 241.0 274.0 229.0 180.0 106.0 83.8 51.5 44.6 1,458 -317.5 0.0
1956 42.4 43.0 43.1 172.0 296.0 457.0 381.0 360.0 192.0 87.1 82.4 52.0 2,208 432.5 1.0
1957 32.6 31.0 53.4 184.0 288.0 355.0 295.0 246.0 150.0 80.0 41.6 50.0 1,807 31.1 1.0
1958 39.7 35.0 55.6 149.0 376.0 391.0 309.0 250.0 128.0 60.0 37.4 29.2 1,860 84.4 1.0
1959 28.8 24.3 27.9 138.0 165.0 253.0 323.0 217.0 116.0 85.5 69.2 43.2 1,491 -284.6 0.01960 41.8 46.8 44.1 144.0 308.0 356.0 330.0 204.0 124.0 69.3 42.8 30.2 1,741 -34.5 0.0
1961 24.9 23.0 31.4 144.0 310.0 322.0 321.0 238.0 87.9 52.5 53.7 55.4 1,664 -111.7 0.0
1962 34.5 32.4 60.5 130.0 248.0 282.0 338.0 228.0 130.0 79.0 55.2 55.1 1,673 -102.8 0.0
1963 56.1 55.0 54.2 163.0 361.0 406.0 476.0 270.0 142.0 87.6 60.4 42.4 2,174 398.2 1.0
1964 34.2 32.7 45.1 104.0 227.0 410.0 296.0 198.0 161.0 91.2 61.6 42.8 1,704 -71.9 0.01965 31.2 28.8 44.5 124.0 264.0 299.0 295.0 231.0 128.0 62.8 51.4 45.4 1,605 -170.4 0.0
1966 49.3 42.6 47.0 113.0 228.0 334.0 425.0 283.0 232.0 56.7 84.6 31.0 1,926 150.7 1.0
1967 27.7 28.0 30.6 83.6 241.0 238.0 287.0 281.0 117.0 64.6 42.6 49.5 1,491 -284.9 0.0
1968 38.8 32.1 54.0 218.0 373.0 305.0 328.0 238.0 130.0 126.0 62.2 39.0 1,944 168.6 1.0
1969 33.3 29.1 34.6 88.2 232.0 256.0 196.0 195.0 96.8 55.7 38.5 38.2 1,293 -482.1 0.01970 29.5 39.1 60.5 191.0 240.0 295.0 364.0 244.0 155.0 126.0 90.0 59.5 1,894 118.1 1.0
1971 41.8 30.2 51.5 107.0 256.0 274.0 326.0 211.0 146.0 57.8 55.1 50.4 1,607 -168.7 0.0
1972 33.5 29.5 35.8 163.0 238.0 297.0 301.0 201.0 131.0 215.0 112.0 48.8 1,806 30.1 1.0
1973 26.5 27.3 31.1 81.6 178.0 226.0 264.0 210.0 89.8 61.4 58.2 45.6 1,300 -476.0 0.0
1974 25.7 24.8 44.3 60.2 205.0 310.0 283.0 186.0 81.6 66.2 47.0 34.3 1,368 -407.4 0.01975 25.7 22.5 43.8 135.0 168.0 258.0 330.0 207.0 125.0 105.0 54.4 38.0 1,512 -263.1 0.0
1976 34.5 33.4 45.5 165.0 254.0 274.0 276.0 244.0 143.0 109.0 52.7 46.4 1,678 -98.0 0.0
1977 23.6 27.5 47.4 121.0 189.0 230.0 217.0 240.0 145.0 101.0 58.7 45.7 1,446 -329.6 0.0
1978 38.4 45.5 64.8 95.6 214.0 267.0 372.0 276.0 136.0 101.0 68.6 40.7 1,720 -55.9 0.0
1979 40.1 51.8 59.6 158.0 315.0 338.0 305.0 248.0 145.0 78.1 116.0 52.7 1,907 131.8 1.01980 33.6 31.0 41.6 132.0 264.0 278.0 352.0 210.0 160.0 112.0 81.6 65.7 1,762 -14.0 0.0
1981 60.2 58.1 95.5 106.0 271.0 296.0 343.0 205.0 112.0 89.0 93.0 51.0 1,780 4.3 1.0
1999 20.0 19.0 20.0 120.0 200.0 310.0 268.0 211.0 90.0 76.0 70.0 30.0 1,434 -341.5 0.0
2000 52.0 61.0 54.0 190.0 290.0 360.0 350.0 211.0 112.0 60.0 57.0 60.0 1,857 81.5 1.0
2001 57.0 61.0 65.0 160.0 210.0 350.0 345.0 215.0 94.0 55.0 58.0 41.0 1,711 -64.5 0.02002 32.0 49.0 94.0 182.0 303.0 466.0 440.0 220.0 186.0 113.0 79.0 30.0 2,194 418.5 1.0
2003 38.0 30.0 25.0 145.0 344.0 284.0 234.0 240.0 99.0 135.0 111.0 36.0 1,721 -54.5 0.0
2004 28.0 33.0 110.0 145.0 273.0 426.0 352.0 305.0 114.0 76.0 - - 1,862
2005 35.1 37.0 - - - - - - - - - - 27.0
Enguri HPP Basin Inflow, Enguri River In Reservoir of the Enguri HPP

“ENERGY BALANCE” OF GEORGIA POWER SECTOR PART 1: ANALYSIS AND PROPOSALS
Page 88 of 172
ANNEX C: SCENARIO NUMERICAL TABLES FROM MUST-RUN BASE CASE
SCENARIO OUTPUT SUMMARY BASE CASE
Tetri/kwh Water % of Avg. 100%
Weighted Average Generation Cost Dispatched 4.26 Th. Must Run Yes
Weighted Average Cost Hydro 2.00 Khudoni No
Weighted Average Cost Thermal 8.24 Namakhvani No
Weighted Average Cost Imports 5.02 Tvishi, Zhoneti No
Sources of Generation: Total Average MWH % of TotalKWH Cost Lari (1000) Volume
Domestic Hydro 3,621,002 20.03 45.30%
Domestic Thermal 1,505,381 82.41 18.83%Imports 2,867,225 50.19 35.87%
Total 7,993,608 42.60 100.00%
Costs of Generation: Total Total Cost % of Total
KWH Gel (Million) CostDomestic Hydro 3,621,002 72.54 21.30%
Domestic Thermal 1,505,381 124.06 36.44%Imports 2,867,225 143.90 42.26%
Total 7,993,608 340.50 100.00%
Export Capacity: Total % of Total
KWH Volume
Domestic Hydro 519,554 10.74%Domestic Thermal 4,320,019 89.26%
Total 4,839,573 100.00%
Hydro Capacity (MW) Installed Effective
Total 2,734 1,720.85
Peaking 2,111 1,305.00
Run of River 622 415.85

“ENERGY BALANCE” OF GEORGIA POWER SECTOR PART 1: ANALYSIS AND PROPOSALS
Page 89 of 172
SCENARIO OUTPUT SUMMARY 10% GROWTH - BASE CASE
Tetri/kwh Water % of Avg. 100%
Weighted Average Generation Cost Dispatched 4.31 Th. Must Run Yes
Weighted Average Cost Hydro 2.00 Khudoni No
Weighted Average Cost Thermal 8.24 Namakhvani No
Weighted Average Cost Imports 5.02 Tvishi, Zhoneti No
Sources of Generation: Total Average MWH % of TotalKWH Cost Lari (1000) Volume
Domestic Hydro 3,662,234 20.03 41.93%
Domestic Thermal 1,508,937 82.42 17.28%Imports 3,562,845 50.19 40.79%
Total 8,734,016 43.11 100.00%
Costs of Generation: Total Total Cost % of Total
KWH Gel (Million) CostDomestic Hydro 3,662,234 73.34 19.48%
Domestic Thermal 1,508,937 124.36 33.03%Imports 3,562,845 178.81 47.49%
Total 8,734,016 376.52 100.00%
Export Capacity: Total % of Total
KWH Volume
Domestic Hydro 478,322 9.98%Domestic Thermal 4,316,463 90.02%
Total 4,794,785 100.00%
Hydro Capacity (MW) Installed EffectiveTotal 2,734 1,720.85
Peaking 2,111 1,305.00
Run of River 622 415.85

“ENERGY BALANCE” OF GEORGIA POWER SECTOR PART 1: ANALYSIS AND PROPOSALS
Page 90 of 172
SCENARIO OUTPUT SUMMARY 20% GROWTH - BASE CASE
Tetri/kwh Water % of Avg. 100%Weighted Average Generation Cost Dispatched 4.36 Th. Must Run Yes
Weighted Average Cost Hydro 2.00 Khudoni No
Weighted Average Cost Thermal 8.24 Namakhvani No
Weighted Average Cost Imports 5.02 Tvishi, Zhoneti No
Sources of Generation: Total Average MWH % of TotalKWH Cost Lari (1000) Volume
Domestic Hydro 3,683,948 20.04 38.88%
Domestic Thermal 1,514,211 82.42 15.98%Imports 4,276,265 50.19 45.13%
Total 9,474,424 43.62 100.00%
Costs of Generation: Total Total Cost % of Total
KWH Gel (Million) CostDomestic Hydro 3,683,948 73.82 17.86%
Domestic Thermal 1,514,211 124.81 30.20%Imports 4,276,265 214.64 51.94%
Total 9,474,424 413.26 100.00%
Export Capacity: Total % of Total
KWH Volume
Domestic Hydro 456,608 9.58%Domestic Thermal 4,311,189 90.42%
Total 4,767,798 100.00%
Hydro Capacity (MW) Installed Effective
Total 2,734 1,720.85
Peaking 2,111 1,305.00
Run of River 622 415.85

“ENERGY BALANCE” OF GEORGIA POWER SECTOR PART 1: ANALYSIS AND PROPOSALS
Page 91 of 172
SCENARIO OUTPUT SUMMARY 30% GROWTH - BASE CASE
Tetri/kwh Water % of Avg. 100%
Weighted Average Generation Cost Dispatched 4.43 Th. Must Run YesWeighted Average Cost Hydro 2.00 Khudoni No
Weighted Average Cost Thermal 8.24 Namakhvani No
Weighted Average Cost Imports 5.02 Tvishi, Zhoneti No
Sources of Generation: Total Average MWH % of TotalKWH Cost Lari (1000) Volume
Domestic Hydro 3,611,819 20.05 35.36%
Domestic Thermal 1,513,387 82.42 14.82%Imports 5,089,625 50.23 49.83%
Total 10,214,831 44.33 100.00%
Costs of Generation: Total Total Cost % of Total
KWH Gel (Million) CostDomestic Hydro 3,611,819 72.41 15.99%
Domestic Thermal 1,513,387 124.74 27.55%Imports 5,089,625 255.65 56.46%
Total 10,214,831 452.79 100.00%
Export Capacity: Total % of Total
KWH Volume
Domestic Hydro 528,737 10.92%Domestic Thermal 4,312,013 89.08%
Total 4,840,750 100.00%
Hydro Capacity (MW) Installed Effective
Total 2,734 1,720.85
Peaking 2,111 1,305.00
Run of River 622 415.85

“ENERGY BALANCE” OF GEORGIA POWER SECTOR PART 1: ANALYSIS AND PROPOSALS
Page 92 of 172
SCENARIO OUTPUT SUMMARY BASE CASE
Tetri/kwh Water % of Avg. 100%
Weighted Average Generation Cost Dispatched 4.18 Th. Must Run Yes
Weighted Average Cost Hydro 2.90 Khudoni Yes
Weighted Average Cost Thermal 8.25 Namakhvani No
Weighted Average Cost Imports 5.02 Tvishi, Zhoneti No
Sources of Generation: Total Average MWH % of Total
KWH Cost Lari (1000) Volume
Domestic Hydro 5,514,396 28.97 68.99%
Domestic Thermal 1,538,317 82.45 19.24%Imports 940,895 50.19 11.77%
Total 7,993,608 41.76 100.00%
Costs of Generation: Total Total Cost % of Total
KWH Gel (Million) Cost
Domestic Hydro 5,514,396 159.76 47.86%
Domestic Thermal 1,538,317 126.84 38.00%Imports 940,895 47.22 14.15%
Total 7,993,608 333.82 100.00%
Export Capacity: Total % of Total
KWH Volume
Domestic Hydro 1,003,201 18.96%Domestic Thermal 4,287,083 81.04%
Total 5,290,283 100.00%
Hydro Capacity (MW) Installed Effective
Total 3,372 2,358.95
Peaking 2,749 1,943.10
Run of River 622 415.85

“ENERGY BALANCE” OF GEORGIA POWER SECTOR PART 1: ANALYSIS AND PROPOSALS
Page 93 of 172
SCENARIO OUTPUT SUMMARY 10% GROWTH - BASE CASE
Tetri/kwh Water % of Avg. 100%
Weighted Average Generation Cost Dispatched 4.23 Th. Must Run Yes
Weighted Average Cost Hydro 2.94 Khudoni Yes
Weighted Average Cost Thermal 8.25 Namakhvani No
Weighted Average Cost Imports 5.02 Tvishi, Zhoneti No
Sources of Generation: Total Average MWH % of Total
KWH Cost Lari (1000) Volume
Domestic Hydro 5,690,484 29.42 65.15%
Domestic Thermal 1,540,307 82.46 17.64%Imports 1,503,225 50.19 17.21%
Total 8,734,016 42.35 100.00%
Costs of Generation: Total Total Cost % of Total
KWH Gel (Million) Cost
Domestic Hydro 5,690,484 167.41 45.26%
Domestic Thermal 1,540,307 127.01 34.34%Imports 1,503,225 75.44 20.40%
Total 8,734,016 369.86 100.00%
Export Capacity: Total % of Total
KWH Volume
Domestic Hydro 827,113 16.18%Domestic Thermal 4,285,093 83.82%
Total 5,112,206 100.00%
Hydro Capacity (MW) Installed Effective
Total 3,372 2,358.95
Peaking 2,749 1,943.10
Run of River 622 415.85

“ENERGY BALANCE” OF GEORGIA POWER SECTOR PART 1: ANALYSIS AND PROPOSALS
Page 94 of 172
SCENARIO OUTPUT SUMMARY 20% GROWTH - BASE CASE
Tetri/kwh Water % of Avg. 100%Weighted Average Generation Cost Dispatched 4.29 Th. Must Run Yes
Weighted Average Cost Hydro 2.98 Khudoni Yes
Weighted Average Cost Thermal 8.25 Namakhvani No
Weighted Average Cost Imports 5.02 Tvishi, Zhoneti No
Sources of Generation: Total Average MWH % of Total
KWH Cost Lari (1000) Volume
Domestic Hydro 5,806,496 29.81 61.29%
Domestic Thermal 1,539,368 82.46 16.25%Imports 2,128,560 50.19 22.47%
Total 9,474,424 42.94 100.00%
Costs of Generation: Total Total Cost % of Total
KWH Gel (Million) Cost
Domestic Hydro 5,806,496 173.07 42.54%
Domestic Thermal 1,539,368 126.93 31.20%Imports 2,128,560 106.83 26.26%
Total 9,474,424 406.83 100.00%
Export Capacity: Total % of Total
KWH Volume
Domestic Hydro 711,101 14.23%Domestic Thermal 4,286,032 85.77%
Total 4,997,133 100.00%
Hydro Capacity (MW) Installed Effective
Total 3,372 2,358.95
Peaking 2,749 1,943.10
Run of River 622 415.85

“ENERGY BALANCE” OF GEORGIA POWER SECTOR PART 1: ANALYSIS AND PROPOSALS
Page 95 of 172
SCENARIO OUTPUT SUMMARY 30% GROWTH - BASE CASE
Tetri/kwh Water % of Avg. 100%
Weighted Average Generation Cost Dispatched 4.35 Th. Must Run YesWeighted Average Cost Hydro 3.01 Khudoni Yes
Weighted Average Cost Thermal 8.25 Namakhvani No
Weighted Average Cost Imports 5.02 Tvishi, Zhoneti No
Sources of Generation: Total Average MWH % of Total
KWH Cost Lari (1000) Volume
Domestic Hydro 5,891,461 30.10 57.68%
Domestic Thermal 1,538,535 82.45 15.06%Imports 2,784,835 50.19 27.26%
Total 10,214,831 43.46 100.00%
Costs of Generation: Total Total Cost % of Total
KWH Gel (Million) Cost
Domestic Hydro 5,891,461 177.35 39.95%
Domestic Thermal 1,538,535 126.86 28.57%Imports 2,784,835 139.76 31.48%
Total 10,214,831 443.97 100.00%
Export Capacity: Total % of Total
KWH Volume
Domestic Hydro 626,136 12.74%Domestic Thermal 4,286,865 87.26%
Total 4,913,001 100.00%
Hydro Capacity (MW) Installed Effective
Total 3,372 2,358.95
Peaking 2,749 1,943.10
Run of River 622 415.85

“ENERGY BALANCE” OF GEORGIA POWER SECTOR PART 1: ANALYSIS AND PROPOSALS
Page 96 of 172
SCENARIO OUTPUT SUMMARY BASE CASE
Tetri/kwh Water % of Avg. 100%
Weighted Average Generation Cost Dispatched 4.17 Th. Must Run Yes
Weighted Average Cost Hydro 3.13 Khudoni Yes
Weighted Average Cost Thermal 8.25 Namakhvani Yes
Weighted Average Cost Imports 5.02 Tvishi, Zhoneti No
Sources of Generation: Total Average MWH % of Total
KWH Cost Lari (1000) Volume
Domestic Hydro 6,239,907 31.30 78.06%
Domestic Thermal 1,542,041 82.46 19.29%Imports 211,660 50.19 2.65%
Total 7,993,608 41.67 100.00%
Costs of Generation: Total Total Cost % of Total
KWH Gel (Million) Cost
Domestic Hydro 6,239,907 195.31 58.64%
Domestic Thermal 1,542,041 127.15 38.17%Imports 211,660 10.62 3.19%
Total 7,993,608 333.09 100.00%
Export Capacity: Total % of Total
KWH Volume
Domestic Hydro 1,732,945 28.80%Domestic Thermal 4,283,359 71.20%
Total 6,016,304 100.00%
Hydro Capacity (MW) Installed Effective
Total 3,582 2,568.95
Peaking 2,959 2,153.10
Run of River 622 415.85

“ENERGY BALANCE” OF GEORGIA POWER SECTOR PART 1: ANALYSIS AND PROPOSALS
Page 97 of 172
SCENARIO OUTPUT SUMMARY 10% GROWTH - BASE CASE
Tetri/kwh Water % of Avg. 100%
Weighted Average Generation Cost Dispatched 4.23 Th. Must Run Yes
Weighted Average Cost Hydro 3.23 Khudoni Yes
Weighted Average Cost Thermal 8.25 Namakhvani Yes
Weighted Average Cost Imports 5.02 Tvishi, Zhoneti No
Sources of Generation: Total Average MWH % of Total
KWH Cost Lari (1000) Volume
Domestic Hydro 6,647,870 32.28 76.11%
Domestic Thermal 1,542,541 82.46 17.66%Imports 543,605 50.19 6.22%
Total 8,734,016 42.25 100.00%
Costs of Generation: Total Total Cost % of Total
KWH Gel (Million) Cost
Domestic Hydro 6,647,870 214.56 58.14%
Domestic Thermal 1,542,541 127.20 34.47%Imports 543,605 27.28 7.39%
Total 8,734,016 369.04 100.00%
Export Capacity: Total % of Total
KWH Volume
Domestic Hydro 1,324,982 23.63%Domestic Thermal 4,282,859 76.37%
Total 5,607,841 100.00%
Hydro Capacity (MW) Installed Effective
Total 3,582 2,568.95
Peaking 2,959 2,153.10
Run of River 622 415.85

“ENERGY BALANCE” OF GEORGIA POWER SECTOR PART 1: ANALYSIS AND PROPOSALS
Page 98 of 172
SCENARIO OUTPUT SUMMARY 20% GROWTH - BASE CASE
Tetri/kwh Water % of Avg. 100%Weighted Average Generation Cost Dispatched 4.29 Th. Must Run Yes
Weighted Average Cost Hydro 3.29 Khudoni Yes
Weighted Average Cost Thermal 8.25 Namakhvani Yes
Weighted Average Cost Imports 5.02 Tvishi, Zhoneti No
Sources of Generation: Total Average MWH % of Total
KWH Cost Lari (1000) Volume
Domestic Hydro 6,881,936 32.88 72.64%
Domestic Thermal 1,538,273 82.45 16.24%Imports 1,054,215 50.19 11.13%
Total 9,474,424 42.85 100.00%
Costs of Generation: Total Total Cost % of Total
KWH Gel (Million) Cost
Domestic Hydro 6,881,936 226.28 55.73%
Domestic Thermal 1,538,273 126.84 31.24%Imports 1,054,215 52.91 13.03%
Total 9,474,424 406.02 100.00%
Export Capacity: Total % of Total
KWH Volume
Domestic Hydro 1,090,916 20.28%Domestic Thermal 4,287,127 79.72%
Total 5,378,044 100.00%
Hydro Capacity (MW) Installed Effective
Total 3,582 2,568.95
Peaking 2,959 2,153.10
Run of River 622 415.85

“ENERGY BALANCE” OF GEORGIA POWER SECTOR PART 1: ANALYSIS AND PROPOSALS
Page 99 of 172
SCENARIO OUTPUT SUMMARY 30% GROWTH - BASE CASE
Tetri/kwh Water % of Avg. 100%
Weighted Average Generation Cost Dispatched 4.34 Th. Must Run YesWeighted Average Cost Hydro 3.33 Khudoni Yes
Weighted Average Cost Thermal 8.25 Namakhvani Yes
Weighted Average Cost Imports 5.02 Tvishi, Zhoneti No
Sources of Generation: Total Average MWH % of Total
KWH Cost Lari (1000) Volume
Domestic Hydro 7,052,091 33.32 69.04%
Domestic Thermal 1,536,835 82.45 15.05%Imports 1,625,905 50.19 15.92%
Total 10,214,831 43.40 100.00%
Costs of Generation: Total Total Cost % of Total
KWH Gel (Million) Cost
Domestic Hydro 7,052,091 235.00 53.01%
Domestic Thermal 1,536,835 126.72 28.58%Imports 1,625,905 81.60 18.41%
Total 10,214,831 443.31 100.00%
Export Capacity: Total % of Total
KWH Volume
Domestic Hydro 920,761 17.68%Domestic Thermal 4,288,565 82.32%
Total 5,209,326 100.00%
Hydro Capacity (MW) Installed Effective
Total 3,582 2,568.95
Peaking 2,959 2,153.10
Run of River 622 415.85
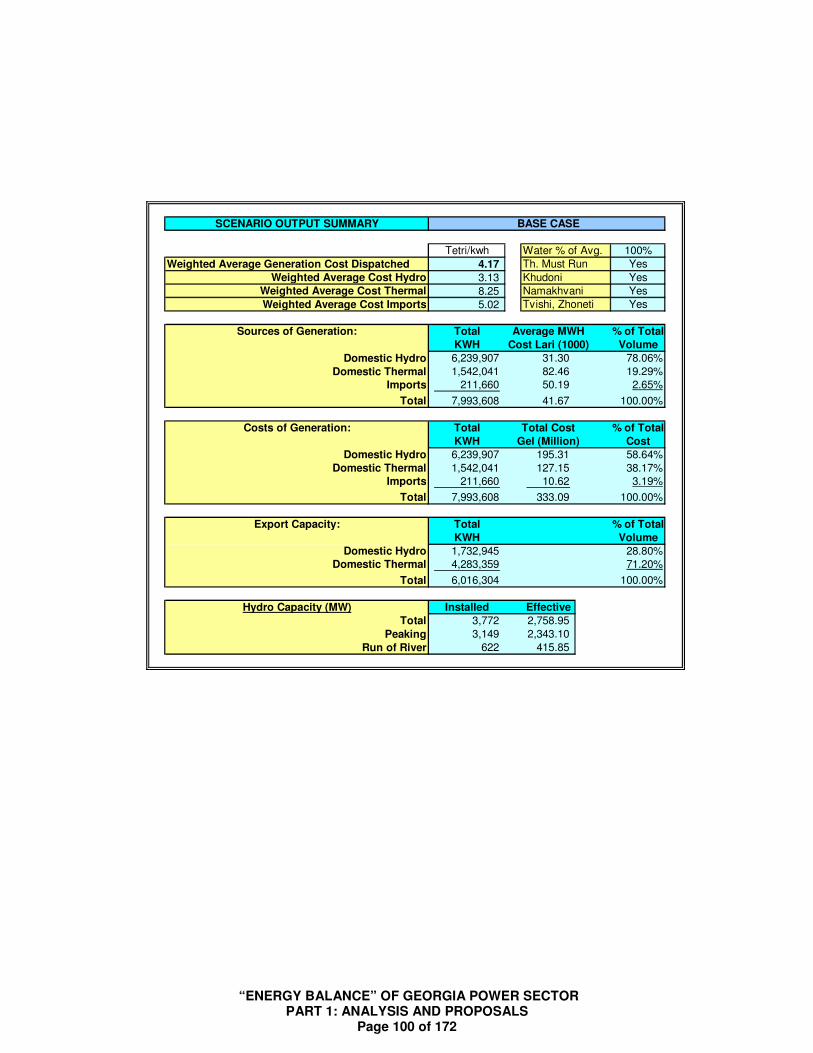
“ENERGY BALANCE” OF GEORGIA POWER SECTOR PART 1: ANALYSIS AND PROPOSALS
Page 100 of 172
SCENARIO OUTPUT SUMMARY BASE CASE
Tetri/kwh Water % of Avg. 100%
Weighted Average Generation Cost Dispatched 4.17 Th. Must Run Yes
Weighted Average Cost Hydro 3.13 Khudoni YesWeighted Average Cost Thermal 8.25 Namakhvani Yes
Weighted Average Cost Imports 5.02 Tvishi, Zhoneti Yes
Sources of Generation: Total Average MWH % of Total
KWH Cost Lari (1000) Volume
Domestic Hydro 6,239,907 31.30 78.06%
Domestic Thermal 1,542,041 82.46 19.29%Imports 211,660 50.19 2.65%
Total 7,993,608 41.67 100.00%
Costs of Generation: Total Total Cost % of Total
KWH Gel (Million) Cost
Domestic Hydro 6,239,907 195.31 58.64%Domestic Thermal 1,542,041 127.15 38.17%
Imports 211,660 10.62 3.19%
Total 7,993,608 333.09 100.00%
Export Capacity: Total % of Total
KWH Volume
Domestic Hydro 1,732,945 28.80%Domestic Thermal 4,283,359 71.20%
Total 6,016,304 100.00%
Hydro Capacity (MW) Installed Effective
Total 3,772 2,758.95
Peaking 3,149 2,343.10
Run of River 622 415.85

“ENERGY BALANCE” OF GEORGIA POWER SECTOR PART 1: ANALYSIS AND PROPOSALS
Page 101 of 172
SCENARIO OUTPUT SUMMARY 10% GROWTH - BASE CASE
Tetri/kwh Water % of Avg. 100%
Weighted Average Generation Cost Dispatched 4.23 Th. Must Run Yes
Weighted Average Cost Hydro 3.23 Khudoni YesWeighted Average Cost Thermal 8.25 Namakhvani YesWeighted Average Cost Imports 5.02 Tvishi, Zhoneti Yes
Sources of Generation: Total Average MWH % of Total
KWH Cost Lari (1000) Volume
Domestic Hydro 6,647,870 32.28 76.11%
Domestic Thermal 1,542,541 82.46 17.66%Imports 543,605 50.19 6.22%
Total 8,734,016 42.25 100.00%
Costs of Generation: Total Total Cost % of Total
KWH Gel (Million) Cost
Domestic Hydro 6,647,870 214.56 58.14%Domestic Thermal 1,542,541 127.20 34.47%
Imports 543,605 27.28 7.39%
Total 8,734,016 369.04 100.00%
Export Capacity: Total % of Total
KWH Volume
Domestic Hydro 1,324,982 23.63%Domestic Thermal 4,282,859 76.37%
Total 5,607,841 100.00%
Hydro Capacity (MW) Installed Effective
Total 3,772 2,758.95
Peaking 3,149 2,343.10
Run of River 622 415.85

“ENERGY BALANCE” OF GEORGIA POWER SECTOR PART 1: ANALYSIS AND PROPOSALS
Page 102 of 172
SCENARIO OUTPUT SUMMARY 20% GROWTH - BASE CASE
Tetri/kwh Water % of Avg. 100%Weighted Average Generation Cost Dispatched 4.29 Th. Must Run Yes
Weighted Average Cost Hydro 3.29 Khudoni Yes
Weighted Average Cost Thermal 8.25 Namakhvani YesWeighted Average Cost Imports 5.02 Tvishi, Zhoneti Yes
Sources of Generation: Total Average MWH % of Total
KWH Cost Lari (1000) Volume
Domestic Hydro 6,881,936 32.88 72.64%
Domestic Thermal 1,538,273 82.45 16.24%Imports 1,054,215 50.19 11.13%
Total 9,474,424 42.85 100.00%
Costs of Generation: Total Total Cost % of Total
KWH Gel (Million) Cost
Domestic Hydro 6,881,936 226.28 55.73%
Domestic Thermal 1,538,273 126.84 31.24%Imports 1,054,215 52.91 13.03%
Total 9,474,424 406.02 100.00%
Export Capacity: Total % of Total
KWH Volume
Domestic Hydro 1,090,916 20.28%Domestic Thermal 4,287,127 79.72%
Total 5,378,044 100.00%
Hydro Capacity (MW) Installed Effective
Total 3,772 2,758.95
Peaking 3,149 2,343.10
Run of River 622 415.85
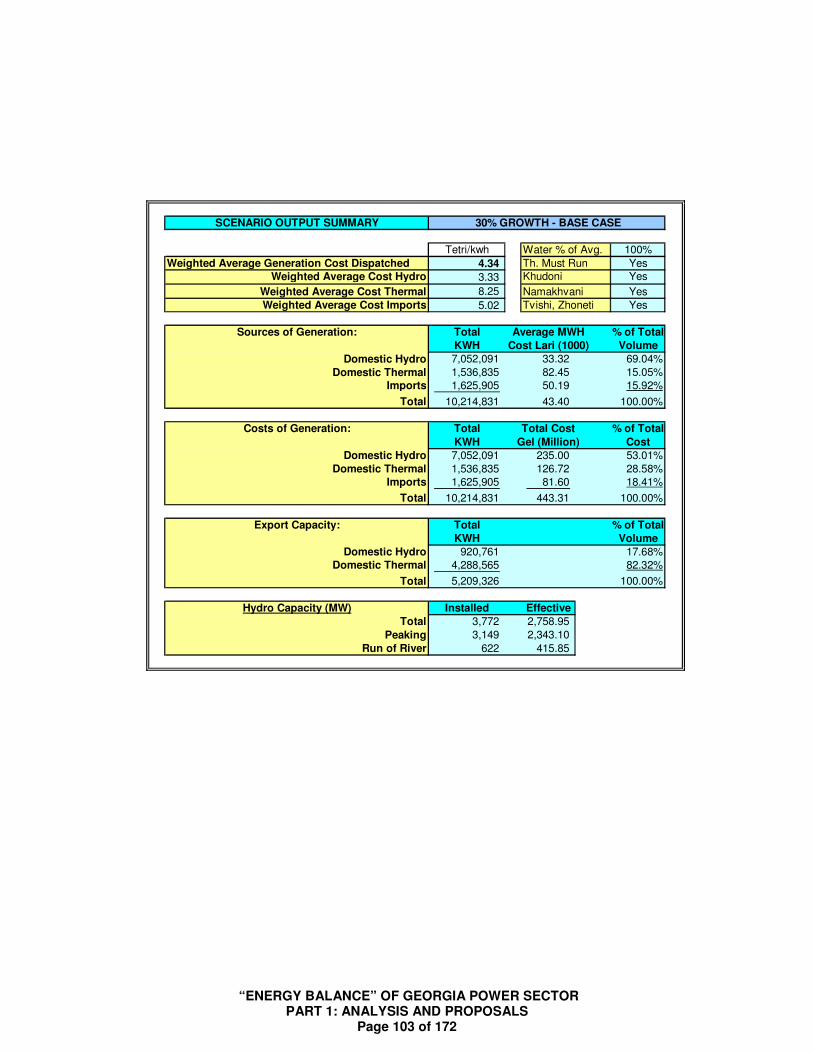
“ENERGY BALANCE” OF GEORGIA POWER SECTOR PART 1: ANALYSIS AND PROPOSALS
Page 103 of 172
SCENARIO OUTPUT SUMMARY 30% GROWTH - BASE CASE
Tetri/kwh Water % of Avg. 100%
Weighted Average Generation Cost Dispatched 4.34 Th. Must Run YesWeighted Average Cost Hydro 3.33 Khudoni Yes
Weighted Average Cost Thermal 8.25 Namakhvani YesWeighted Average Cost Imports 5.02 Tvishi, Zhoneti Yes
Sources of Generation: Total Average MWH % of Total
KWH Cost Lari (1000) Volume
Domestic Hydro 7,052,091 33.32 69.04%
Domestic Thermal 1,536,835 82.45 15.05%Imports 1,625,905 50.19 15.92%
Total 10,214,831 43.40 100.00%
Costs of Generation: Total Total Cost % of Total
KWH Gel (Million) Cost
Domestic Hydro 7,052,091 235.00 53.01%Domestic Thermal 1,536,835 126.72 28.58%
Imports 1,625,905 81.60 18.41%
Total 10,214,831 443.31 100.00%
Export Capacity: Total % of Total
KWH Volume
Domestic Hydro 920,761 17.68%Domestic Thermal 4,288,565 82.32%
Total 5,209,326 100.00%
Hydro Capacity (MW) Installed Effective
Total 3,772 2,758.95
Peaking 3,149 2,343.10
Run of River 622 415.85

“ENERGY BALANCE” OF GEORGIA POWER SECTOR PART 1: ANALYSIS AND PROPOSALS
Page 104 of 172
ANNEX D: SCENARIO NUMERICAL TABLES FROM LEAST COST BASE CASE
SCENARIO OUTPUT SUMMARY BASE CASE - PURE LEAST COST
Tetri/kwh Water % of Avg. 100%
Weighted Average Generation Cost Dispatched 3.66 Th. Must Run No
Weighted Average Cost Hydro 2.00 Khudoni No
Weighted Average Cost Thermal - Namakhvani No
Weighted Average Cost Imports 5.03 Tvishi, Zhoneti No
Sources of Generation: Total Average MWH % of Total
KWH Cost Lari (1000) Volume
Domestic Hydro 3,602,898 20.00 45.07%
Domestic Thermal - - 0.00%Imports 4,390,710 50.26 54.93%
Total 7,993,608 36.62 100.00%
Costs of Generation: Total Total Cost % of Total
KWH Gel (Million) Cost
Domestic Hydro 3,602,898 72.07 24.62%
Domestic Thermal - - 0.00%Imports 4,390,710 220.66 75.38%
Total 7,993,608 292.73 100.00%
Export Capacity: Total % of Total
KWH Volume
Domestic Hydro 537,658 8.45%Domestic Thermal 5,825,400 91.55%
Total 6,363,058 100.00%
Hydro Capacity (MW) Installed Effective
Total 2,734 1,720.85
Peaking 2,111 1,305.00
Run of River 622 415.85

“ENERGY BALANCE” OF GEORGIA POWER SECTOR PART 1: ANALYSIS AND PROPOSALS
Page 105 of 172
SCENARIO OUTPUT SUMMARY 10% GROWTH - PURE LEAST COST
Tetri/kwh Water % of Avg. 100%
Weighted Average Generation Cost Dispatched 3.80 Th. Must Run No
Weighted Average Cost Hydro 2.00 Khudoni No
Weighted Average Cost Thermal - Namakhvani No
Weighted Average Cost Imports 5.04 Tvishi, Zhoneti No
Sources of Generation: Total Average MWH % of Total
KWH Cost Lari (1000) Volume
Domestic Hydro 3,574,631 20.03 40.93%
Domestic Thermal - - 0.00%Imports 5,159,385 50.37 59.07%
Total 8,734,016 37.95 100.00%
Costs of Generation: Total Total Cost % of Total
KWH Gel (Million) Cost
Domestic Hydro 3,574,631 71.59 21.60%
Domestic Thermal - - 0.00%Imports 5,159,385 259.87 78.40%
Total 8,734,016 331.46 100.00%
Export Capacity: Total % of Total
KWH Volume
Domestic Hydro 565,925 8.85%Domestic Thermal 5,825,400 91.15%
Total 6,391,325 100.00%
Hydro Capacity (MW) Installed Effective
Total 2,734 1,720.85
Peaking 2,111 1,305.00
Run of River 622 415.85

“ENERGY BALANCE” OF GEORGIA POWER SECTOR PART 1: ANALYSIS AND PROPOSALS
Page 106 of 172
SCENARIO OUTPUT SUMMARY 20% GROWTH - PURE LEAST COST
Tetri/kwh Water % of Avg. 100%Weighted Average Generation Cost Dispatched 3.92 Th. Must Run No
Weighted Average Cost Hydro 2.00 Khudoni No
Weighted Average Cost Thermal 8.19 Namakhvani No
Weighted Average Cost Imports 5.05 Tvishi, Zhoneti No
Sources of Generation: Total Average MWH % of Total
KWH Cost Lari (1000) Volume
Domestic Hydro 3,550,344 20.02 37.47%
Domestic Thermal 47,790 81.86 0.50%Imports 5,876,290 50.49 62.02%
Total 9,474,424 39.23 100.00%
Costs of Generation: Total Total Cost % of Total
KWH Gel (Million) Cost
Domestic Hydro 3,550,344 71.09 19.13%
Domestic Thermal 47,790 3.91 1.05%Imports 5,876,290 296.67 79.82%
Total 9,474,424 371.68 100.00%
Export Capacity: Total % of Total
KWH Volume
Domestic Hydro 590,213 9.27%Domestic Thermal 5,777,610 90.73%
Total 6,367,823 100.00%
Hydro Capacity (MW) Installed Effective
Total 2,734 1,720.85
Peaking 2,111 1,305.00
Run of River 622 415.85

“ENERGY BALANCE” OF GEORGIA POWER SECTOR PART 1: ANALYSIS AND PROPOSALS
Page 107 of 172
SCENARIO OUTPUT SUMMARY 30% GROWTH - PURE LEAST COST
Tetri/kwh Water % of Avg. 100%
Weighted Average Generation Cost Dispatched 4.07 Th. Must Run NoWeighted Average Cost Hydro 2.00 Khudoni No
Weighted Average Cost Thermal 8.19 Namakhvani No
Weighted Average Cost Imports 5.06 Tvishi, Zhoneti No
Sources of Generation: Total Average MWH % of Total
KWH Cost Lari (1000) Volume
Domestic Hydro 3,494,891 20.03 34.21%
Domestic Thermal 187,650 81.86 1.84%Imports 6,532,290 50.58 63.95%
Total 10,214,831 40.70 100.00%
Costs of Generation: Total Total Cost % of Total
KWH Gel (Million) Cost
Domestic Hydro 3,494,891 70.01 16.84%
Domestic Thermal 187,650 15.36 3.69%Imports 6,532,290 330.37 79.46%
Total 10,214,831 415.75 100.00%
Export Capacity: Total % of Total
KWH Volume
Domestic Hydro 645,665 10.28%Domestic Thermal 5,637,750 89.72%
Total 6,283,415 100.00%
Hydro Capacity (MW) Installed Effective
Total 2,734 1,720.85
Peaking 2,111 1,305.00
Run of River 622 415.85

“ENERGY BALANCE” OF GEORGIA POWER SECTOR PART 1: ANALYSIS AND PROPOSALS
Page 108 of 172
SCENARIO OUTPUT SUMMARY BASE CASE - PURE LEAST COST
Tetri/kwh Water % of Avg. 100%Weighted Average Generation Cost Dispatched 3.56 Th. Must Run No
Weighted Average Cost Hydro 2.94 Khudoni Yes
Weighted Average Cost Thermal - Namakhvani No
Weighted Average Cost Imports 5.02 Tvishi, Zhoneti No
Sources of Generation: Total Average MWH % of Total
KWH Cost Lari (1000) Volume
Domestic Hydro 5,626,263 29.44 70.38%
Domestic Thermal - - 0.00%Imports 2,367,345 50.19 29.62%
Total 7,993,608 35.59 100.00%
Costs of Generation: Total Total Cost % of Total
KWH Gel (Million) Cost
Domestic Hydro 5,626,263 165.65 58.23%
Domestic Thermal - - 0.00%Imports 2,367,345 118.81 41.77%
Total 7,993,608 284.46 100.00%
Export Capacity: Total % of Total
KWH Volume
Domestic Hydro 891,333 13.27%Domestic Thermal 5,825,400 86.73%
Total 6,716,733 100.00%
Hydro Capacity (MW) Installed Effective
Total 3,372 2,358.95 Peaking 2,749 1,943.10
Run of River 622 415.85

“ENERGY BALANCE” OF GEORGIA POWER SECTOR PART 1: ANALYSIS AND PROPOSALS
Page 109 of 172
SCENARIO OUTPUT SUMMARY 10% GROWTH - PURE LEAST COST
Tetri/kwh Water % of Avg. 100%Weighted Average Generation Cost Dispatched 3.67 Th. Must Run No
Weighted Average Cost Hydro 2.97 Khudoni Yes
Weighted Average Cost Thermal - Namakhvani No
Weighted Average Cost Imports 5.02 Tvishi, Zhoneti No
Sources of Generation: Total Average MWH % of Total
KWH Cost Lari (1000) Volume
Domestic Hydro 5,739,256 29.72 65.71%
Domestic Thermal - - 0.00%Imports 2,994,760 50.19 34.29%
Total 8,734,016 36.74 100.00%
Costs of Generation: Total Total Cost % of Total
KWH Gel (Million) Cost
Domestic Hydro 5,739,256 170.57 53.16%
Domestic Thermal - - 0.00%Imports 2,994,760 150.31 46.84%
Total 8,734,016 320.88 100.00%
Export Capacity: Total % of Total
KWH Volume
Domestic Hydro 778,341 11.79%Domestic Thermal 5,825,400 88.21%
Total 6,603,741 100.00%
Hydro Capacity (MW) Installed Effective
Total 3,372 2,358.95 Peaking 2,749 1,943.10
Run of River 622 415.85

“ENERGY BALANCE” OF GEORGIA POWER SECTOR PART 1: ANALYSIS AND PROPOSALS
Page 110 of 172
SCENARIO OUTPUT SUMMARY 20% GROWTH - PURE LEAST COST
Tetri/kwh Water % of Avg. 100%Weighted Average Generation Cost Dispatched 3.78 Th. Must Run No
Weighted Average Cost Hydro 3.00 Khudoni Yes
Weighted Average Cost Thermal - Namakhvani No
Weighted Average Cost Imports 5.02 Tvishi, Zhoneti No
Sources of Generation: Total Average MWH % of Total
KWH Cost Lari (1000) Volume
Domestic Hydro 5,829,574 30.00 61.53%
Domestic Thermal - - 0.00%Imports 3,644,850 50.22 38.47%
Total 9,474,424 37.78 100.00%
Costs of Generation: Total Total Cost % of Total
KWH Gel (Million) Cost
Domestic Hydro 5,829,574 174.90 48.86%
Domestic Thermal - - 0.00%Imports 3,644,850 183.06 51.14%
Total 9,474,424 357.95 100.00%
Export Capacity: Total % of Total
KWH Volume
Domestic Hydro 688,023 10.56%Domestic Thermal 5,825,400 89.44%
Total 6,513,423 100.00%
Hydro Capacity (MW) Installed Effective
Total 3,372 2,358.95
Peaking 2,749 1,943.10
Run of River 622 415.85

“ENERGY BALANCE” OF GEORGIA POWER SECTOR PART 1: ANALYSIS AND PROPOSALS
Page 111 of 172
SCENARIO OUTPUT SUMMARY 30% GROWTH - PURE LEAST COST
Tetri/kwh Water % of Avg. 100%Weighted Average Generation Cost Dispatched 3.87 Th. Must Run No
Weighted Average Cost Hydro 3.02 Khudoni Yes
Weighted Average Cost Thermal - Namakhvani No
Weighted Average Cost Imports 5.03 Tvishi, Zhoneti No
Sources of Generation: Total Average MWH % of Total
KWH Cost Lari (1000) Volume
Domestic Hydro 5,879,461 30.16 57.56%
Domestic Thermal - - 0.00%Imports 4,335,370 50.32 42.44%
Total 10,214,831 38.72 100.00%
Costs of Generation: Total Total Cost % of Total
KWH Gel (Million) Cost
Domestic Hydro 5,879,461 177.32 44.84%
Domestic Thermal - - 0.00%Imports 4,335,370 218.15 55.16%
Total 10,214,831 395.47 100.00%
Export Capacity: Total % of Total
KWH Volume
Domestic Hydro 638,136 9.87%Domestic Thermal 5,825,400 90.13%
Total 6,463,536 100.00%
Hydro Capacity (MW) Installed Effective
Total 3,372 2,358.95 Peaking 2,749 1,943.10
Run of River 622 415.85

“ENERGY BALANCE” OF GEORGIA POWER SECTOR PART 1: ANALYSIS AND PROPOSALS
Page 112 of 172
SCENARIO OUTPUT SUMMARY BASE CASE - PURE LEAST COST
Tetri/kwh Water % of Avg. 100%Weighted Average Generation Cost Dispatched 3.55 Th. Must Run No
Weighted Average Cost Hydro 3.26 Khudoni YesWeighted Average Cost Thermal - Namakhvani YesWeighted Average Cost Imports 5.02 Tvishi, Zhoneti No
Sources of Generation: Total Average MWH % of Total
KWH Cost Lari (1000) Volume
Domestic Hydro 6,656,898 32.57 83.28%Domestic Thermal - - 0.00%
Imports 1,336,710 50.19 16.72%
Total 7,993,608 35.52 100.00%
Costs of Generation: Total Total Cost % of Total
KWH Gel (Million) Cost
Domestic Hydro 6,656,898 216.81 76.37%Domestic Thermal - - 0.00%
Imports 1,336,710 67.09 23.63%
Total 7,993,608 283.89 100.00%
Export Capacity: Total % of Total
KWH Volume
Domestic Hydro 1,315,954 18.43%Domestic Thermal 5,825,400 81.57%
Total 7,141,354 100.00%
Hydro Capacity (MW) Installed Effective
Total 3,582 2,568.95 Peaking 2,959 2,153.10
Run of River 622 415.85

“ENERGY BALANCE” OF GEORGIA POWER SECTOR PART 1: ANALYSIS AND PROPOSALS
Page 113 of 172
SCENARIO OUTPUT SUMMARY 10% GROWTH - PURE LEAST COST
Tetri/kwh Water % of Avg. 100%Weighted Average Generation Cost Dispatched 3.67 Th. Must Run No
Weighted Average Cost Hydro 3.30 Khudoni YesWeighted Average Cost Thermal - Namakhvani YesWeighted Average Cost Imports 5.02 Tvishi, Zhoneti No
Sources of Generation: Total Average MWH % of Total
KWH Cost Lari (1000) Volume
Domestic Hydro 6,846,996 32.98 78.39%Domestic Thermal - - 0.00%
Imports 1,887,020 50.19 21.61%
Total 8,734,016 36.70 100.00%
Costs of Generation: Total Total Cost % of Total
KWH Gel (Million) Cost
Domestic Hydro 6,846,996 225.81 70.45%Domestic Thermal - - 0.00%
Imports 1,887,020 94.70 29.55%
Total 8,734,016 320.52 100.00%
Export Capacity: Total % of Total
KWH Volume
Domestic Hydro 1,125,856 16.20%Domestic Thermal 5,825,400 83.80%
Total 6,951,256 100.00%
Hydro Capacity (MW) Installed Effective
Total 3,582 2,568.95 Peaking 2,959 2,153.10
Run of River 622 415.85

“ENERGY BALANCE” OF GEORGIA POWER SECTOR PART 1: ANALYSIS AND PROPOSALS
Page 114 of 172
SCENARIO OUTPUT SUMMARY 20% GROWTH - PURE LEAST COST
Tetri/kwh Water % of Avg. 100%Weighted Average Generation Cost Dispatched 3.77 Th. Must Run No
Weighted Average Cost Hydro 3.33 Khudoni YesWeighted Average Cost Thermal - Namakhvani YesWeighted Average Cost Imports 5.02 Tvishi, Zhoneti No
Sources of Generation: Total Average MWH % of Total
KWH Cost Lari (1000) Volume
Domestic Hydro 6,989,834 33.28 73.78%Domestic Thermal - - 0.00%
Imports 2,484,590 50.19 26.22%
Total 9,474,424 37.71 100.00%
Costs of Generation: Total Total Cost % of Total
KWH Gel (Million) Cost
Domestic Hydro 6,989,834 232.61 65.10%Domestic Thermal - - 0.00%
Imports 2,484,590 124.70 34.90%
Total 9,474,424 357.31 100.00%
Export Capacity: Total % of Total
KWH Volume
Domestic Hydro 983,019 14.44%Domestic Thermal 5,825,400 85.56%
Total 6,808,419 100.00%
Hydro Capacity (MW) Installed Effective
Total 3,582 2,568.95 Peaking 2,959 2,153.10
Run of River 622 415.85

“ENERGY BALANCE” OF GEORGIA POWER SECTOR PART 1: ANALYSIS AND PROPOSALS
Page 115 of 172
SCENARIO OUTPUT SUMMARY 20% GROWTH - PURE LEAST COST
Tetri/kwh Water % of Avg. 100%Weighted Average Generation Cost Dispatched 3.86 Th. Must Run No
Weighted Average Cost Hydro 3.36 Khudoni Yes
Weighted Average Cost Thermal - Namakhvani YesWeighted Average Cost Imports 5.02 Tvishi, Zhoneti No
Sources of Generation: Total Average MWH % of Total
KWH Cost Lari (1000) Volume
Domestic Hydro 7,123,706 33.57 69.74%Domestic Thermal - - 0.00%
Imports 3,091,125 50.20 30.26%
Total 10,214,831 38.60 100.00%
Costs of Generation: Total Total Cost % of Total
KWH Gel (Million) Cost
Domestic Hydro 7,123,706 239.16 60.65%Domestic Thermal - - 0.00%
Imports 3,091,125 155.18 39.35%
Total 10,214,831 394.34 100.00%
Export Capacity: Total % of Total
KWH Volume
Domestic Hydro 849,146 12.72%Domestic Thermal 5,825,400 87.28%
Total 6,674,546 100.00%
Hydro Capacity (MW) Installed Effective
Total 3,582 2,568.95 Peaking 2,959 2,153.10
Run of River 622 415.85

“ENERGY BALANCE” OF GEORGIA POWER SECTOR PART 1: ANALYSIS AND PROPOSALS
Page 116 of 172
SCENARIO OUTPUT SUMMARY BASE CASE - PURE LEAST COST
Tetri/kwh Water % of Avg. 100%
Weighted Average Generation Cost Dispatched 3.55 Th. Must Run No
Weighted Average Cost Hydro 3.26 Khudoni Yes
Weighted Average Cost Thermal - Namakhvani Yes
Weighted Average Cost Imports 5.02 Tvishi, Zhoneti Yes
Sources of Generation: Total Average MWH % of Total
KWH Cost Lari (1000) Volume
Domestic Hydro 6,656,898 32.57 83.28%
Domestic Thermal - - 0.00%Imports 1,336,710 50.19 16.72%
Total 7,993,608 35.52 100.00%
Costs of Generation: Total Total Cost % of Total
KWH Gel (Million) Cost
Domestic Hydro 6,656,898 216.81 76.37%
Domestic Thermal - - 0.00%Imports 1,336,710 67.09 23.63%
Total 7,993,608 283.89 100.00%
Export Capacity: Total % of Total
KWH Volume
Domestic Hydro 1,315,954 18.43%Domestic Thermal 5,825,400 81.57%
Total 7,141,354 100.00%
Hydro Capacity (MW) Installed Effective
Total 3,772 2,758.95
Peaking 3,149 2,343.10
Run of River 622 415.85

“ENERGY BALANCE” OF GEORGIA POWER SECTOR PART 1: ANALYSIS AND PROPOSALS
Page 117 of 172
SCENARIO OUTPUT SUMMARY 10% GROWTH - PURE LEAST COST
Tetri/kwh Water % of Avg. 100%
Weighted Average Generation Cost Dispatched 3.67 Th. Must Run No
Weighted Average Cost Hydro 3.30 Khudoni Yes
Weighted Average Cost Thermal - Namakhvani Yes
Weighted Average Cost Imports 5.02 Tvishi, Zhoneti Yes
Sources of Generation: Total Average MWH % of Total
KWH Cost Lari (1000) Volume
Domestic Hydro 6,846,996 32.98 78.39%
Domestic Thermal - - 0.00%Imports 1,887,020 50.19 21.61%
Total 8,734,016 36.70 100.00%
Costs of Generation: Total Total Cost % of Total
KWH Gel (Million) Cost
Domestic Hydro 6,846,996 225.81 70.45%
Domestic Thermal - - 0.00%Imports 1,887,020 94.70 29.55%
Total 8,734,016 320.52 100.00%
Export Capacity: Total % of Total
KWH Volume
Domestic Hydro 1,125,856 16.20%Domestic Thermal 5,825,400 83.80%
Total 6,951,256 100.00%
Hydro Capacity (MW) Installed Effective
Total 3,772 2,758.95
Peaking 3,149 2,343.10
Run of River 622 415.85

“ENERGY BALANCE” OF GEORGIA POWER SECTOR PART 1: ANALYSIS AND PROPOSALS
Page 118 of 172
SCENARIO OUTPUT SUMMARY 20% GROWTH - PURE LEAST COST
Tetri/kwh Water % of Avg. 100%Weighted Average Generation Cost Dispatched 3.78 Th. Must Run No
Weighted Average Cost Hydro 3.03 Khudoni Yes
Weighted Average Cost Thermal - Namakhvani Yes
Weighted Average Cost Imports 5.02 Tvishi, Zhoneti Yes
Sources of Generation: Total Average MWH % of Total
KWH Cost Lari (1000) Volume
Domestic Hydro 5,888,884 30.25 62.16%
Domestic Thermal - - 0.00%Imports 3,585,540 50.21 37.84%
Total 9,474,424 37.81 100.00%
Costs of Generation: Total Total Cost % of Total
KWH Gel (Million) Cost
Domestic Hydro 5,888,884 178.17 49.74%
Domestic Thermal - - 0.00%Imports 3,585,540 180.03 50.26%
Total 9,474,424 358.20 100.00%
Export Capacity: Total % of Total
KWH Volume
Domestic Hydro 1,233,099 17.47%Domestic Thermal 5,825,400 82.53%
Total 7,058,499 100.00%
Hydro Capacity (MW) Installed Effective
Total 3,772 2,758.95
Peaking 3,149 2,343.10 Run of River 622 415.85

“ENERGY BALANCE” OF GEORGIA POWER SECTOR PART 1: ANALYSIS AND PROPOSALS
Page 119 of 172
SCENARIO OUTPUT SUMMARY 30% GROWTH - PURE LEAST COST
Tetri/kwh Water % of Avg. 100%
Weighted Average Generation Cost Dispatched 3.86 Th. Must Run NoWeighted Average Cost Hydro 3.36 Khudoni Yes
Weighted Average Cost Thermal - Namakhvani Yes
Weighted Average Cost Imports 5.02 Tvishi, Zhoneti Yes
Sources of Generation: Total Average MWH % of Total
KWH Cost Lari (1000) Volume
Domestic Hydro 7,123,706 33.57 69.74%
Domestic Thermal - - 0.00%Imports 3,091,125 50.20 30.26%
Total 10,214,831 38.60 100.00%
Costs of Generation: Total Total Cost % of Total
KWH Gel (Million) Cost
Domestic Hydro 7,123,706 239.16 60.65%
Domestic Thermal - - 0.00%Imports 3,091,125 155.18 39.35%
Total 10,214,831 394.34 100.00%
Export Capacity: Total % of Total
KWH Volume
Domestic Hydro 849,146 12.72%Domestic Thermal 5,825,400 87.28%
Total 6,674,546 100.00%
Hydro Capacity (MW) Installed Effective
Total 3,772 2,758.95
Peaking 3,149 2,343.10
Run of River 622 415.85

“ENERGY BALANCE” OF GEORGIA POWER SECTOR PART 1: ANALYSIS AND PROPOSALS
Page 120 of 172
ANNEX E: TABLES SUMMARIZING AND COMPARING MUST-RUN AND LEAST COST BASE CASES
COMBINED SUMMARY OF SCENARIO OUTPUTS: BASE CASE VARIATIONS SCENARIO RESULTS: WEIGHTED AVERAGE COST OF GENERATION DISPATCHED
SCENARIO VARIANT BASE CASE LOAD BASE CASE LOAD PLUS 10% BASE CASE LOAD PLUS 20% BASE CASE LOAD PLUS 30% CUMULATIVE EFFECT
Th. Must Run Yes Yes Yes Yes Yes Yes Yes Yes Yes Yes Yes Yes Yes Yes Yes Yes Yes Yes Yes Yes
Khudoni No Yes Yes Yes No Yes Yes Yes No Yes Yes Yes No Yes Yes Yes No Yes Yes Yes
Namakhvani No No Yes Yes No No Yes Yes No No Yes Yes No No Yes Yes No No Yes Yes
Tvishi, Zhoneti No No No Yes No No No Yes No No No Yes No No No Yes No No No Yes
WEIGHTED AVERAGE COST OF GENERATION DISPATCHED
REPORTED DATA:
Average Generation Cost 4.26 4.18 4.17 4.17 4.31 4.23 4.23 4.23 4.36 4.29 4.29 4.29 4.43 4.35 4.34 4.34
Average Cost Hydro 2.00 2.90 3.13 3.13 2.00 2.94 3.23 3.23 2.00 2.98 3.29 3.29 2.00 3.01 3.33 3.33
Average Cost Thermal 8.24 8.25 8.25 8.25 8.24 8.25 8.25 8.25 8.24 8.25 8.25 8.25 8.24 8.25 8.25 8.25 Average Cost Imports 5.02 5.02 5.02 5.02 5.02 5.02 5.02 5.02 5.02 5.02 5.02 5.02 5.02 5.02 5.02 5.02
ANALYSIS OF DATA:
Absolute Change Within Load Levels
Average Generation Cost (0.08) (0.01) - (0.08) (0.01) - (0.07) (0.01) - (0.09) (0.01) -
Average Cost Hydro 0.89 0.23 - 0.94 0.29 - 0.98 0.31 - 1.01 0.32 -
Average Cost Thermal 0.00 0.00 - 0.00 0.00 - 0.00 (0.00) - 0.00 (0.00) -
Average Cost Imports (0.00) (0.00) - (0.00) (0.00) - (0.00) (0.00) - (0.00) (0.00) - Absolute Change Between Load Levels
Average Generation Cost 0.05 0.06 0.06 0.06 0.05 0.06 0.06 0.06 0.07 0.05 0.05 0.05 0.17 0.17 0.17 0.17 Average Cost Hydro (0.00) 0.04 0.10 0.10 0.00 0.04 0.06 0.06 0.00 0.03 0.04 0.04 0.00 0.11 0.20 0.20
Average Cost Thermal 0.00 0.00 0.00 0.00 0.00 (0.00) (0.00) (0.00) (0.00) (0.00) (0.00) (0.00) 0.00 0.00 (0.00) (0.00)
Average Cost Imports 0.00 0.00 0.00 0.00 0.00 0.00 0.00 0.00 0.00 0.00 0.00 0.00 0.00 0.00 0.00 0.00
Percentage Change Within Load Levels
Average Generation Cost -2.0% -0.2% 0.0% -1.8% -0.2% 0.0% -1.6% -0.2% 0.0% -1.9% -0.1% 0.0%
Average Cost Hydro 44.6% 8.0% 0.0% 46.9% 9.7% 0.0% 48.8% 10.3% 0.0% 50.2% 10.7% 0.0% Average Cost Thermal 0.1% 0.0% 0.0% 0.0% 0.0% 0.0% 0.0% 0.0% 0.0% 0.0% 0.0% 0.0% Average Cost Imports 0.0% 0.0% 0.0% 0.0% 0.0% 0.0% 0.0% 0.0% 0.0% -0.1% 0.0% 0.0%
Percentage Change Between Load Levels
Average Generation Cost 1.2% 1.4% 1.4% 1.4% 1.2% 1.4% 1.4% 1.4% 1.6% 1.2% 1.3% 1.3% 4.1% 4.1% 4.2% 4.2%
Average Cost Hydro 0.0% 1.5% 3.1% 3.1% 0.1% 1.3% 1.9% 1.9% 0.0% 1.0% 1.3% 1.3% 0.1% 3.9% 6.5% 6.5% Average Cost Thermal 0.0% 0.0% 0.0% 0.0% 0.0% 0.0% 0.0% 0.0% 0.0% 0.0% 0.0% 0.0% 0.0% 0.0% 0.0% 0.0%
Average Cost Imports 0.0% 0.0% 0.0% 0.0% 0.0% 0.0% 0.0% 0.0% 0.1% 0.0% 0.0% 0.0% 0.1% 0.0% 0.0% 0.0%

“ENERGY BALANCE” OF GEORGIA POWER SECTOR PART 1: ANALYSIS AND PROPOSALS
Page 121 of 172
COMBINED SUMMARY OF SCENARIO OUTPUTS: BASE CASE VARIATIONS SCENARIO RESULTS: SOURCES OF GENERATION - GWH
SCENARIO VARIANT BASE CASE LOAD BASE CASE LOAD PLUS 10% BASE CASE LOAD PLUS 20% BASE CASE LOAD PLUS 30% CUMULATIVE EFFECT
Th. Must Run Yes Yes Yes Yes Yes Yes Yes Yes Yes Yes Yes Yes Yes Yes Yes Yes Yes Yes Yes Yes
Khudoni No Yes Yes Yes No Yes Yes Yes No Yes Yes Yes No Yes Yes Yes No Yes Yes Yes
Namakhvani No No Yes Yes No No Yes Yes No No Yes Yes No No Yes Yes No No Yes Yes
Tvishi, Zhoneti No No No Yes No No No Yes No No No Yes No No No Yes No No No Yes
SOURCES OF GENERATION - GWH
REPORTED DATA:Domestic Hydro 3.62 5.51 6.24 6.24 3.66 5.69 6.65 6.65 3.68 5.81 6.88 6.88 3.61 5.89 7.05 7.05
Domestic Thermal 1.51 1.54 1.54 1.54 1.51 1.54 1.54 1.54 1.51 1.54 1.54 1.54 1.51 1.54 1.54 1.54
Imports 2.87 0.94 0.21 0.21 3.56 1.50 0.54 0.54 4.28 2.13 1.05 1.05 5.09 2.78 1.63 1.63
Total 7.99 7.99 7.99 7.99 8.73 8.73 8.73 8.73 9.47 9.47 9.47 9.47 10.21 10.21 10.21 10.21 ANALYSIS OF DATA:
Absolute Change Within Load Levels
Domestic Hydro 1.89 0.73 - 2.03 0.96 - 2.12 1.08 - 2.28 1.16 - Domestic Thermal 0.03 0.00 - 0.03 0.00 - 0.03 (0.00) - 0.03 (0.00) -
Imports (1.93) (0.73) - (2.06) (0.96) - (2.15) (1.07) - (2.30) (1.16) -
Total - - - - - - - - - - - -
Absolute Change Between Load Levels
Domestic Hydro 0.04 0.18 0.41 0.41 0.02 0.12 0.23 0.23 (0.07) 0.08 0.17 0.17 (0.01) 0.38 0.81 0.81 Domestic Thermal 0.00 0.00 0.00 0.00 0.01 (0.00) (0.00) (0.00) (0.00) (0.00) (0.00) (0.00) 0.01 0.00 (0.01) (0.01)
Imports 0.70 0.56 0.33 0.33 0.71 0.63 0.51 0.51 0.81 0.66 0.57 0.57 2.22 1.84 1.41 1.41
Total 0.74 0.74 0.74 0.74 0.74 0.74 0.74 0.74 0.74 0.74 0.74 0.74 2.22 2.22 2.22 2.22
Percentage Change Within Load Levels
Domestic Hydro 52.3% 13.2% 0.0% 55.4% 16.8% 0.0% 57.6% 18.5% 0.0% 63.1% 19.7% 0.0%
Domestic Thermal 2.2% 0.2% 0.0% 2.1% 0.1% 0.0% 1.7% -0.1% 0.0% 1.7% -0.1% 0.0%Imports -67.2% -77.5% 0.0% -57.8% -63.8% 0.0% -50.2% -50.5% 0.0% -45.3% -41.6% 0.0%
Total 0.0% 0.0% 0.0% 0.0% 0.0% 0.0% 0.0% 0.0% 0.0% 0.0% 0.0% 0.0%Percentage Change Between Load Levels
Domestic Hydro 1.1% 3.2% 6.5% 6.5% 0.6% 2.0% 3.5% 3.5% -2.0% 1.5% 2.5% 2.5% -0.3% 6.8% 13.0% 13.0%Domestic Thermal 0.2% 0.1% 0.0% 0.0% 0.3% -0.1% -0.3% -0.3% -0.1% -0.1% -0.1% -0.1% 0.5% 0.0% -0.3% -0.3%
Imports 24.3% 59.8% ##### ##### 20.0% 41.6% 93.9% 93.9% 19.0% 30.8% 54.2% 54.2% 77.5% 196.0% 668.2% 668.2%
Total 9.3% 9.3% 9.3% 9.3% 8.5% 8.5% 8.5% 8.5% 7.8% 7.8% 7.8% 7.8% 27.8% 27.8% 27.8% 27.8%

“ENERGY BALANCE” OF GEORGIA POWER SECTOR PART 1: ANALYSIS AND PROPOSALS
Page 122 of 172
COMBINED SUMMARY OF SCENARIO OUTPUTS: BASE CASE VARIATIONS SCENARIO RESULTS: COSTS OF GENERATION - LARI, MILLIONS
SCENARIO VARIANT BASE CASE LOAD BASE CASE LOAD PLUS 10% BASE CASE LOAD PLUS 20% BASE CASE LOAD PLUS 30% CUMULATIVE EFFECT
Th. Must Run Yes Yes Yes Yes Yes Yes Yes Yes Yes Yes Yes Yes Yes Yes Yes Yes Yes Yes Yes Yes
Khudoni No Yes Yes Yes No Yes Yes Yes No Yes Yes Yes No Yes Yes Yes No Yes Yes Yes
Namakhvani No No Yes Yes No No Yes Yes No No Yes Yes No No Yes Yes No No Yes Yes
Tvishi, Zhoneti No No No Yes No No No Yes No No No Yes No No No Yes No No No Yes
COSTS OF GENERATION - LARI, MILLIONS
REPORTED DATA:
Domestic Hydro 73 160 195 195 73 167 215 215 74 173 226 226 72 177 235 235 Domestic Thermal 124 127 127 127 124 127 127 127 125 127 127 127 125 127 127 127
Imports 144 47 11 11 179 75 27 27 215 107 53 53 256 140 82 82 Total 340 334 333 333 377 370 369 369 413 407 406 406 453 444 443 443
ANALYSIS OF DATA:
Absolute Change Within Load Levels
Domestic Hydro 87.2 35.6 - 94.1 47.2 - 99.3 53.2 - 104.9 57.7 - Domestic Thermal 2.8 0.3 - 2.6 0.2 - 2.1 (0.1) - 2.1 (0.1) -
Imports (96.7) (36.6) - (103.4) (48.2) - (107.8) (53.9) - (115.9) (58.2) - Total (6.7) (0.7) - (6.7) (0.8) - (6.4) (0.8) - (8.8) (0.7) -
Absolute Change Between Load Levels
Domestic Hydro 0.8 7.7 19.2 19.2 0.5 5.7 11.7 11.7 (1.4) 4.3 8.7 8.7 (0.1) 17.6 39.7 39.7 Domestic Thermal 0.3 0.2 0.0 0.0 0.4 (0.1) (0.4) (0.4) (0.1) (0.1) (0.1) (0.1) 0.7 0.0 (0.4) (0.4)
Imports 34.9 28.2 16.7 16.7 35.8 31.4 25.6 25.6 41.0 32.9 28.7 28.7 111.8 92.5 71.0 71.0 Total 36.0 36.0 36.0 36.0 36.7 37.0 37.0 37.0 39.5 37.1 37.3 37.3 112.3 110.1 110.2 110.2
Percentage Change Within Load Levels
Domestic Hydro 120.2% 22.3% 0.0% 128.3% 28.2% 0.0% 134.5% 30.7% 0.0% 144.9% 32.5% 0.0%Domestic Thermal 2.2% 0.2% 0.0% 2.1% 0.1% 0.0% 1.7% -0.1% 0.0% 1.7% -0.1% 0.0%
Imports -67.2% -77.5% 0.0% -57.8% -63.8% 0.0% -50.2% -50.5% 0.0% -45.3% -41.6% 0.0%Total -2.0% -0.2% 0.0% -1.8% -0.2% 0.0% -1.6% -0.2% 0.0% -1.9% -0.1% 0.0%
Percentage Change Between Load Levels
Domestic Hydro 1.1% 4.8% 9.9% 9.9% 0.6% 3.4% 5.5% 5.5% -1.9% 2.5% 3.9% 3.9% -0.2% 11.0% 20.3% 20.3%Domestic Thermal 0.2% 0.1% 0.0% 0.0% 0.4% -0.1% -0.3% -0.3% -0.1% -0.1% -0.1% -0.1% 0.5% 0.0% -0.3% -0.3%
Imports 24.3% 59.8% 156.8% 156.8% 20.0% 41.6% 93.9% 93.9% 19.1% 30.8% 54.2% 54.2% 77.7% 196.0% 668.2% 668.2%Total 10.6% 10.8% 10.8% 10.8% 9.8% 10.0% 10.0% 10.0% 9.6% 9.1% 9.2% 9.2% 33.0% 33.0% 33.1% 33.1%

“ENERGY BALANCE” OF GEORGIA POWER SECTOR PART 1: ANALYSIS AND PROPOSALS
Page 123 of 172
COMBINED SUMMARY OF SCENARIO OUTPUTS: LEAST COST DISPATCH CASE VARIATIONS SCENARIO RESULTS: WEIGHTED AVERAGE COST OF GENERATION DISPATCHED
SCENARIO VARIANT BASE CASE LOAD BASE CASE PLUS 10% BASE CASE PLUS 20% BASE CASE PLUS 30% CUMULATIVE EFFECT
Th. Must Run No No No No No No No No No No No No No No No No No No No No
Khudoni No Yes Yes Yes No Yes Yes Yes No Yes Yes Yes No Yes Yes Yes No Yes Yes Yes
Namakhvani No No Yes Yes No No Yes Yes No No Yes Yes No No Yes Yes No No Yes Yes
Tvishi, Zhoneti No No No Yes No No No Yes No No No Yes No No No Yes No No No Yes
SCENARIO RESULTS: WEIGHTED AVERAGE COST OF GENERATION DISPATCHED
REPORTED DATA:
Average Generation Cost 3.66 3.56 3.55 3.55 3.80 3.67 3.67 3.67 3.92 3.78 3.77 3.78 4.07 3.87 3.86 3.86 Average Cost Hydro 2.00 2.94 3.26 3.26 2.00 2.97 3.30 3.30 2.00 3.00 3.33 3.03 2.00 3.02 3.36 3.36
Average Cost Thermal - - - - - - - - 8.19 - - - 8.19 - - - Average Cost Imports 5.03 5.02 5.02 5.02 5.04 5.02 5.02 5.02 5.05 5.02 5.02 5.02 5.06 5.03 5.02 5.02
ANALYSIS OF DATA:
Absolute Change Within Load Levels
Average Generation Cost (0.10) (0.01) - (0.12) (0.00) - (0.14) (0.01) 0.01 (0.20) (0.01) -
Average Cost Hydro 0.94 0.31 - 0.97 0.33 - 1.00 0.33 (0.30) 1.01 0.34 - Average Cost Thermal - - - - - - (8.19) - - (8.19) - - Average Cost Imports (0.01) (0.00) - (0.02) (0.00) - (0.03) (0.00) 0.00 (0.03) (0.01) -
Absolute Change Between Load Levels
Average Generation Cost 0.13 0.12 0.12 0.12 0.13 0.10 0.10 0.11 0.15 0.09 0.09 0.08 0.41 0.31 0.31 0.31 Average Cost Hydro 0.00 0.03 0.04 0.04 (0.00) 0.03 0.03 (0.27) 0.00 0.02 0.03 0.33 0.00 0.07 0.10 0.10
Average Cost Thermal - - - - 8.19 - - - 0.00 - - - 8.19 - - - Average Cost Imports 0.01 0.00 0.00 0.00 0.01 0.00 0.00 0.00 0.01 0.01 0.00 (0.00) 0.03 0.01 0.00 0.00
Percentage Change Within Load Levels
Average Generation Cost -2.8% -0.2% 0.0% -3.2% -0.1% 0.0% -3.7% -0.2% 0.2% -4.9% -0.3% 0.0%
Average Cost Hydro 47.2% 10.6% 0.0% 48.4% 11.0% 0.0% 49.8% 10.9% -9.1% 50.5% 11.3% 0.0% Average Cost Thermal 0.0% 0.0% 0.0% 0.0% 0.0% 0.0% -100.0% 0.0% 0.0% -100.0% 0.0% 0.0% Average Cost Imports -0.1% 0.0% 0.0% -0.4% 0.0% 0.0% -0.5% -0.1% 0.0% -0.5% -0.2% 0.0%
Percentage Change Between Load Levels
Average Generation Cost 3.6% 3.2% 3.3% 3.3% 3.4% 2.8% 2.8% 3.0% 3.7% 2.5% 2.4% 2.1% 11.1% 8.8% 8.7% 8.7% Average Cost Hydro 0.1% 0.9% 1.3% 1.3% 0.0% 0.9% 0.9% -8.3% 0.0% 0.5% 0.9% 11.0% 0.2% 2.4% 3.1% 3.1%
Average Cost Thermal 0.0% 0.0% 0.0% 0.0% 0.0% 0.0% 0.0% 0.0% 0.0% 0.0% 0.0% 0.0% 0.0% 0.0% 0.0% 0.0%
Average Cost Imports 0.2% 0.0% 0.0% 0.0% 0.2% 0.1% 0.0% 0.0% 0.2% 0.2% 0.0% 0.0% 0.6% 0.3% 0.0% 0.0%

“ENERGY BALANCE” OF GEORGIA POWER SECTOR PART 1: ANALYSIS AND PROPOSALS
Page 124 of 172
COMBINED SUMMARY OF SCENARIO OUTPUTS: LEAST COST DISPATCH CASE VARIATIONS SCENARIO RESULTS: SOURCES OF GENERATION - GWH
SCENARIO VARIANT BASE CASE LOAD BASE CASE LOAD PLUS 10% BASE CASE LOAD PLUS 20% BASE CASE LOAD PLUS 30% CUMULATIVE EFFECT
Th. Must Run No No No No No No No No No No No No No No No No No No No No
Khudoni No Yes Yes Yes No Yes Yes Yes No Yes Yes Yes No Yes Yes Yes No Yes Yes Yes
Namakhvani No No Yes Yes No No Yes Yes No No Yes Yes No No Yes Yes No No Yes Yes
Tvishi, Zhoneti No No No Yes No No No Yes No No No Yes No No No Yes No No No Yes
SCENARIO RESULTS: SOURCES OF GENERATION - GWH
REPORTED DATA:Domestic Hydro 3.60 5.63 6.66 6.66 3.57 5.74 6.85 6.85 3.55 5.83 6.99 5.89 3.49 5.88 7.12 7.12
Domestic Thermal - - - - - - - - 0.05 - - - 0.19 - - - Imports 4.39 2.37 1.34 1.34 5.16 2.99 1.89 1.89 5.88 3.64 2.48 3.59 6.53 4.34 3.09 3.09
Total 7.99 7.99 7.99 7.99 8.73 8.73 8.73 8.73 9.47 9.47 9.47 9.47 10.21 10.21 10.21 10.21 ANALYSIS OF DATA:
Absolute Change Within Load Levels
Domestic Hydro 2.02 1.03 - 2.16 1.11 - 2.28 1.16 (1.10) 2.38 1.24 - Domestic Thermal - - - - - - (0.05) - - (0.19) - -
Imports (2.02) (1.03) - (2.16) (1.11) - (2.23) (1.16) 1.10 (2.20) (1.24) - Total - - - - - - - - - - - -
Absolute Change Between Load Levels
Domestic Hydro (0.03) 0.11 0.19 0.19 (0.02) 0.09 0.14 (0.96) (0.06) 0.05 0.13 1.23 (0.11) 0.25 0.47 0.47 Domestic Thermal - - - - 0.05 - - - 0.14 - - - 0.19 - - -
Imports 0.77 0.63 0.55 0.55 0.72 0.65 0.60 1.70 0.66 0.69 0.61 (0.49) 2.14 1.97 1.75 1.75
Total 0.74 0.74 0.74 0.74 0.74 0.74 0.74 0.74 0.74 0.74 0.74 0.74 2.22 2.22 2.22 2.22 Percentage Change Within Load Levels
Domestic Hydro 56.2% 18.3% 0.0% 60.6% 19.3% 0.0% 64.2% 19.9% -15.8% 68.2% 21.2% 0.0%Domestic Thermal 0.0% 0.0% 0.0% 0.0% 0.0% 0.0% -100.0% 0.0% 0.0% -100.0% 0.0% 0.0%
Imports -46.1% -43.5% 0.0% -42.0% -37.0% 0.0% -38.0% -31.8% 44.3% -33.6% -28.7% 0.0%Total 0.0% 0.0% 0.0% 0.0% 0.0% 0.0% 0.0% 0.0% 0.0% 0.0% 0.0% 0.0%
Percentage Change Between Load Levels
Domestic Hydro -0.8% 2.0% 2.9% 2.9% -0.7% 1.6% 2.1% -14.0% -1.6% 0.9% 1.9% 21.0% -3.0% 4.5% 7.0% 7.0%Domestic Thermal 0.0% 0.0% 0.0% 0.0% 0.0% 0.0% 0.0% 0.0% 292.7% 0.0% 0.0% 0.0% 0.0% 0.0% 0.0% 0.0%
Imports 17.5% 26.5% 41.2% 41.2% 13.9% 21.7% 31.7% 90.0% 11.2% 18.9% 24.4% -13.8% 48.8% 83.1% 131.2% 131.2%Total 9.3% 9.3% 9.3% 9.3% 8.5% 8.5% 8.5% 8.5% 7.8% 7.8% 7.8% 7.8% 27.8% 27.8% 27.8% 27.8%

“ENERGY BALANCE” OF GEORGIA POWER SECTOR PART 1: ANALYSIS AND PROPOSALS
Page 125 of 172
COMBINED SUMMARY OF SCENARIO OUTPUTS: LEAST COST DISPATCH CASE VARIATIONS SCENARIO RESULTS: COSTS OF GENERATION - LARI, MILLIONS
SCENARIO VARIANT BASE CASE LOAD BASE CASE LOAD PLUS 10% BASE CASE LOAD PLUS 20% BASE CASE LOAD PLUS 30% CUMULATIVE EFFECT
Th. Must Run No No No No No No No No No No No No No No No No No No No No
Khudoni No Yes Yes Yes No Yes Yes Yes No Yes Yes Yes No Yes Yes Yes No Yes Yes Yes
Namakhvani No No Yes Yes No No Yes Yes No No Yes Yes No No Yes Yes No No Yes Yes
Tvishi, Zhoneti No No No Yes No No No Yes No No No Yes No No No Yes No No No Yes
SCENARIO RESULTS: COSTS OF GENERATION - LARI, MILLIONS
REPORTED DATA:
Domestic Hydro 72.1 165.6 216.8 216.8 71.6 170.6 225.8 225.8 71.1 174.9 232.6 178.2 70.0 177.3 239.2 239.2 Domestic Thermal - - - - - - - - 3.9 - - - 15.4 - - -
Imports 220.7 118.8 67.1 67.1 259.9 150.3 94.7 94.7 296.7 183.1 124.7 180.0 330.4 218.2 155.2 155.2 Total 292.7 284.5 283.9 283.9 331.5 320.9 320.5 320.5 371.7 358.0 357.3 358.2 415.7 395.5 394.3 394.3
ANALYSIS OF DATA:
Absolute Change Within Load Levels
Domestic Hydro 93.6 51.2 - 99.0 55.2 - 103.8 57.7 (54.4) 107.3 61.8 - Domestic Thermal - - - - - - (3.9) - - (15.4) - -
Imports (101.9) (51.7) - (109.6) (55.6) - (113.6) (58.4) 55.3 (112.2) (63.0) - Total (8.3) (0.6) - (10.6) (0.4) - (13.7) (0.6) 0.9 (20.3) (1.1) -
Absolute Change Between Load Levels
Domestic Hydro (0.5) 4.9 9.0 9.0 (0.5) 4.3 6.8 (47.6) (1.1) 2.4 6.5 61.0 (2.1) 11.7 22.4 22.4 Domestic Thermal - - - - 3.9 - - - 11.4 - - - 15.4 - - -
Imports 39.2 31.5 27.6 27.6 36.8 32.8 30.0 85.3 33.7 35.1 30.5 (24.9) 109.7 99.3 88.1 88.1 Total 38.7 36.4 36.6 36.6 40.2 37.1 36.8 37.7 44.1 37.5 37.0 36.1 123.0 111.0 110.4 110.4
Percentage Change Within Load Levels
Domestic Hydro 129.9% 30.9% 0.0% 138.3% 32.4% 0.0% 146.0% 33.0% -23.4% 153.3% 34.9% 0.0%Domestic Thermal 0.0% 0.0% 0.0% 0.0% 0.0% 0.0% -100.0% 0.0% 0.0% -100.0% 0.0% 0.0%
Imports -46.2% -43.5% 0.0% -42.2% -37.0% 0.0% -38.3% -31.9% 44.4% -34.0% -28.9% 0.0%Total -2.8% -0.2% 0.0% -3.2% -0.1% 0.0% -3.7% -0.2% 0.2% -4.9% -0.3% 0.0%
Percentage Change Between Load Levels
Domestic Hydro -0.7% 3.0% 4.2% 4.2% -0.7% 2.5% 3.0% -21.1% -1.5% 1.4% 2.8% 34.2% -2.8% 7.0% 10.3% 10.3%
Domestic Thermal 0.0% 0.0% 0.0% 0.0% 0.0% 0.0% 0.0% 0.0% 292.7% 0.0% 0.0% 0.0% 0.0% 0.0% 0.0% 0.0%Imports 17.8% 26.5% 41.2% 41.2% 14.2% 21.8% 31.7% 90.1% 11.4% 19.2% 24.4% -13.8% 49.7% 83.6% 131.3% 131.3%
Total 13.2% 12.8% 12.9% 12.9% 12.1% 11.6% 11.5% 11.8% 11.9% 10.5% 10.4% 10.1% 42.0% 39.0% 38.9% 38.9%

“ENERGY BALANCE” OF GEORGIA POWER SECTOR PART 1: ANALYSIS AND PROPOSALS
Page 126 of 172
COMPARISION OF BASE CASE AND LEAST COST SCENARIO OUTPUTS: LEAST COST COMPARED TO BASE CASE WEIGHTED AVERAGE COST OF GENERATION
SCENARIO VARIANT BASE CASE LOAD BASE CASE PLUS 10% BASE CASE PLUS 20% BASE CASE PLUS 30% CUMULATIVE EFFECT
Khudoni No Yes Yes Yes No Yes Yes Yes No Yes Yes Yes No Yes Yes Yes No Yes Yes Yes
Namakhvani No No Yes Yes No No Yes Yes No No Yes Yes No No Yes Yes No No Yes Yes
Tvishi, Zhoneti No No No Yes No No No Yes No No No Yes No No No Yes No No No Yes
WEIGHTED AVERAGE COST OF GENERATION DISPATCHED
REPORTED DATA:
Average Generation Cost (0.60) (0.62) (0.62) (0.62) (0.52) (0.56) (0.56) (0.56) (0.44) (0.52) (0.51) (0.50) (0.36) (0.47) (0.48) (0.48) Average Cost Hydro (0.00) 0.05 0.13 0.13 (0.00) 0.03 0.07 0.07 (0.00) 0.02 0.04 (0.26) (0.00) 0.01 0.02 0.02
Average Cost Thermal (8.24) (8.25) (8.25) (8.25) (8.24) (8.25) (8.25) (8.25) (0.06) (8.25) (8.25) (8.25) (0.06) (8.25) (8.25) (8.25) Average Cost Imports 0.01 0.00 0.00 0.00 0.02 0.00 0.00 0.00 0.03 0.00 0.00 0.00 0.03 0.01 0.00 0.00
ANALYSIS OF DATA:
Absolute Change Within Load Levels
Average Generation Cost (0.02) 0.00 - (0.04) 0.01 - (0.08) 0.00 0.01 (0.11) (0.00) - Average Cost Hydro 0.05 0.08 - 0.03 0.04 - 0.02 0.02 (0.30) 0.01 0.02 -
Average Cost Thermal (0.00) (0.00) - (0.00) (0.00) - (8.19) 0.00 - (8.19) 0.00 - Average Cost Imports (0.01) 0.00 - (0.02) (0.00) - (0.03) (0.00) 0.00 (0.02) (0.01) -
Absolute Change Between Load Levels
Average Generation Cost 0.08 0.06 0.06 0.06 0.08 0.05 0.04 0.05 0.08 0.04 0.03 0.03 0.23 0.14 0.14 0.14 Average Cost Hydro 0.00 (0.02) (0.06) (0.06) (0.00) (0.01) (0.03) (0.33) (0.00) (0.01) (0.01) 0.29 0.00 #### #### ####
Average Cost Thermal (0.00) (0.00) (0.00) (0.00) 8.19 0.00 0.00 0.00 0.00 0.00 0.00 0.00 8.18 #### 0.00 0.00 Average Cost Imports 0.01 0.00 (0.00) (0.00) 0.01 0.00 (0.00) 0.00 0.01 0.01 0.00 (0.00) 0.03 0.01 0.00 0.00
Percentage Change Within Load Levels
Average Generation Cost -0.47% 0.05% 0.00% -1.04% 0.12% 0.00% -1.76% 0.04% 0.22% -2.53% -0.11% 0.00%
Average Cost Hydro 2.50% 2.75% 0.00% 1.50% 1.37% 0.00% 1.04% 0.68% -9.20% 0.35% 0.64% 0.00%
Average Cost Thermal -0.05% -0.01% 0.00% -0.05% 0.00% 0.00% -99.35% 0.00% 0.00% -99.36% 0.00% 0.00% Average Cost Imports -0.14% 0.00% 0.00% -0.36% 0.00% 0.00% -0.51% -0.07% 0.05% -0.43% -0.23% 0.00%
Percentage Change Between Load Levels
Average Generation Cost 1.9% 1.4% 1.4% 1.4% 1.8% 1.1% 1.0% 1.2% 1.7% 1.0% 0.8% 0.6% 5.3% 3.3% 3.1% 3.1% Average Cost Hydro 0.1% -0.6% -1.8% -1.8% -0.1% -0.4% -0.9% -10.3% 0.0% -0.5% -0.5% 8.7% 0.1% -1.4% -3.1% -3.1%
Average Cost Thermal 0.0% 0.0% 0.0% 0.0% 99.3% 0.0% 0.0% 0.0% 0.0% 0.0% 0.0% 0.0% 99.3% 0.0% 0.0% 0.0%
Average Cost Imports 0.2% 0.0% 0.0% 0.0% 0.2% 0.1% 0.0% 0.0% 0.1% 0.2% 0.0% 0.0% 0.6% 0.3% 0.0% 0.0%

“ENERGY BALANCE” OF GEORGIA POWER SECTOR PART 1: ANALYSIS AND PROPOSALS
Page 127 of 172
COMPARISION OF BASE CASE AND LEAST COST SCENARIO OUTPUTS: LEAST COST COMPARED TO BASE CASE SOURCES OF GENERATION - GWH
SCENARIO VARIANT BASE CASE LOAD BASE CASE PLUS 10% BASE CASE PLUS 20% BASE CASE PLUS 30% CUMULATIVE EFFECT
Khudoni No Yes Yes Yes No Yes Yes Yes No Yes Yes Yes No Yes Yes Yes No Yes Yes Yes
Namakhvani No No Yes Yes No No Yes Yes No No Yes Yes No No Yes Yes No No Yes Yes
Tvishi, Zhoneti No No No Yes No No No Yes No No No Yes No No No Yes No No No Yes
SOURCES OF GENERATION - GWH
REPORTED DATA:Domestic Hydro (0.02) 0.11 0.42 0.42 (0.09) 0.05 0.20 0.20 (0.13) 0.02 0.11 (0.99) (0.12) (0.01) 0.07 0.07
Domestic Thermal (1.51) (1.54) (1.54) (1.54) (1.51) (1.54) (1.54) (1.54) (1.47) (1.54) (1.54) (1.54) (1.33) (1.54) (1.54) (1.54)
Imports 1.52 1.43 1.13 1.13 1.60 1.49 1.34 1.34 1.60 1.52 1.43 2.53 1.44 1.55 1.47 1.47 Total - - - - - - - - - - - - - - - -
ANALYSIS OF DATA:
Absolute Change Within Load Levels
Domestic Hydro 0.13 0.31 - 0.14 0.15 - 0.16 0.08 (1.10) 0.10 0.08 - Domestic Thermal (0.03) (0.00) - (0.03) (0.00) - (0.07) 0.00 - (0.21) 0.00 -
Imports (0.10) (0.30) - (0.11) (0.15) - (0.08) (0.09) 1.10 0.11 (0.09) -
Total - - - - - - - - - - - -
Absolute Change Between Load Levels
Domestic Hydro (0.07) (0.06) (0.22) (0.22) (0.05) (0.03) (0.09) (1.19) 0.02 (0.04) (0.04) 1.06 (0.10) #### #### ####
Domestic Thermal (0.00) (0.00) (0.00) (0.00) 0.04 0.00 0.00 0.00 0.14 0.00 0.00 0.00 0.18 #### 0.01 0.01 Imports 0.07 0.07 0.22 0.22 0.00 0.02 0.09 1.19 (0.16) 0.03 0.03 (1.07) (0.08) 0.12 0.34 0.34
Total - - - - - - - - - - - - - - - -
Percentage Change Within Load Levels
Domestic Hydro 3.59% 5.53% 0.00% 3.72% 2.64% 0.00% 4.25% 1.46% -16.00% 2.91% 1.42% 0.00%
Domestic Thermal -2.19% -0.24% 0.00% -2.08% -0.15% 0.00% -4.82% 0.07% 0.00% -14.06% 0.11% 0.00%Imports -3.38% -32.03% 0.00% -2.95% -9.85% 0.00% -1.96% -4.04% ###### 2.12% -3.06% 0.00%
Total 0.00% 0.00% 0.00% 0.00% 0.00% 0.00% 0.00% 0.00% 0.00% 0.00% 0.00% 0.00%Percentage Change Between Load Levels
Domestic Hydro -1.9% -1.1% -3.5% -3.5% -1.3% -0.5% -1.4% -17.9% 0.5% -0.6% -0.5% 15.5% -2.7% -2.1% -4.9% -4.9%Domestic Thermal -0.2% -0.1% 0.0% 0.0% 2.8% 0.1% 0.3% 0.3% 9.3% 0.1% 0.1% 0.1% 11.9% 0.0% 0.3% 0.3%
Imports 2.5% 6.9% 103.2% 103.2% 0.1% 1.6% 16.0% 218.5% -3.7% 1.6% 3.3% -101.1% -1.6% 4.5% 20.9% 20.9%
Total 0.0% 0.0% 0.0% 0.0% 0.0% 0.0% 0.0% 0.0% 0.0% 0.0% 0.0% 0.0% 0.0% 0.0% 0.0% 0.0%

“ENERGY BALANCE” OF GEORGIA POWER SECTOR PART 1: ANALYSIS AND PROPOSALS
Page 128 of 172
COMPARISION OF BASE CASE AND LEAST COST SCENARIO OUTPUTS: LEAST COST COMPARED TO BASE CASE COSTS OF GENERATION - LARI, MILLIONS
SCENARIO VARIANT BASE CASE LOAD BASE CASE PLUS 10% BASE CASE PLUS 20% BASE CASE PLUS 30% CUMULATIVE EFFECT
Khudoni No Yes Yes Yes No Yes Yes Yes No Yes Yes Yes No Yes Yes Yes No Yes Yes Yes
Namakhvani No No Yes Yes No No Yes Yes No No Yes Yes No No Yes Yes No No Yes Yes
Tvishi, Zhoneti No No No Yes No No No Yes No No No Yes No No No Yes No No No Yes
COSTS OF GENERATION - LARI, MILLIONS
REPORTED DATA:
Domestic Hydro (0.5) 5.9 21.5 21.5 (1.8) 3.2 11.3 11.3 (2.7) 1.8 6.3 (48.1) (2.4) (0.0) 4.2 4.2 Domestic Thermal (124.1) (126.8) (127.2) (127.2) (124.4) (127.0) (127.2) (127.2) (120.9) (126.9) (126.8) (126.8) (109.4) (126.9) (126.7) (126.7)
Imports 76.8 71.6 56.5 56.5 81.1 74.9 67.4 67.4 82.0 76.2 71.8 127.1 74.7 78.4 73.6 73.6
Total (47.8) (49.4) (49.2) (49.2) (45.1) (49.0) (48.5) (48.5) (41.6) (48.9) (48.7) (47.8) (37.0) (48.5) (49.0) (49.0) ANALYSIS OF DATA:
Absolute Change Within Load Levels
Domestic Hydro 6.36 15.60 - 4.92 8.09 - 4.55 4.51 (54.45) 2.37 4.19 -
Domestic Thermal (2.78) (0.31) - (2.65) (0.19) - (6.03) 0.09 - (17.48) 0.14 - Imports (5.17) (15.13) - (6.20) (7.44) - (5.81) (4.44) 55.34 3.67 (4.81) -
Total (1.59) 0.16 - (3.93) 0.46 - (7.29) 0.16 0.89 (11.45) (0.48) - Absolute Change Between Load Levels
Domestic Hydro (1.28) (2.73) (10.24) (10.24) (0.97) (1.33) (4.92) (59.36) 0.33 (1.85) (2.17) 52.27 (1.92) (5.91) (17.33) (17.33) Domestic Thermal (0.30) (0.17) (0.04) (0.04) 3.47 0.08 0.36 0.36 11.52 0.07 0.12 0.12 14.69 (0.02) 0.44 0.44
Imports 4.30 3.27 10.96 10.96 0.98 1.37 4.36 59.70 (7.31) 2.16 1.79 (53.54) (2.04) 6.80 17.12 17.12
Total 2.72 0.38 0.67 0.67 3.47 0.11 (0.19) 0.70 4.54 0.38 (0.26) (1.15) 10.73 0.87 0.22 0.22 Percentage Change Within Load Levels
Domestic Hydro 8.8% 9.8% 0.0% 6.7% 4.8% 0.0% 6.2% 2.6% -24.1% 3.3% 2.4% 0.0%Domestic Thermal -2.2% -0.2% 0.0% -2.1% -0.1% 0.0% -4.8% 0.1% 0.0% -14.0% 0.1% 0.0%
Imports -3.6% -32.0% 0.0% -3.5% -9.9% 0.0% -2.7% -4.2% 104.6% 1.4% -3.4% 0.0%Total -0.5% 0.0% 0.0% -1.0% 0.1% 0.0% -1.8% 0.0% 0.2% -2.5% -0.1% 0.0%
Percentage Change Between Load Levels
Domestic Hydro -1.8% -1.7% -5.2% -5.2% -1.3% -0.8% -2.3% -27.7% 0.5% -1.1% -1.0% 23.1% -2.7% -3.3% -7.4% -7.4%
Domestic Thermal -0.2% -0.1% 0.0% 0.0% 2.8% 0.1% 0.3% 0.3% 9.2% 0.1% 0.1% 0.1% 11.8% 0.0% 0.3% 0.3%Imports 3.0% 6.9% 103.2% 103.2% 0.5% 1.8% 16.0% 218.8% -3.4% 2.0% 3.4% -101.2% -0.8% 4.9% 21.0% 21.0%
Total 0.8% 0.1% 0.2% 0.2% 0.9% 0.0% -0.1% 0.2% 1.1% 0.1% -0.1% -0.3% 2.4% 0.2% 0.1% 0.1%

“ENERGY BALANCE” OF GEORGIA POWER SECTOR PART 1: ANALYSIS AND PROPOSALS
Page 129 of 172
ANNEX F. MONTHLY DISPATCH GRAPHS: MUST-RUN BASE CASE (IMERETI ON)
September
0
200
400
600
800
1000
1200
1400
1600
1800
1 2 3 4 5 6 7 8 9 10 11 12 13 14 15 16 17 18 19 20 21 22 23 24
MW
Total Import
Khudoni HPP
Enguri HPP
Namakhvani HPP Cascade
Other HPPs
CCGTs
Tbilsresi & RAO Mtkvari
Total Load
October
0
200
400
600
800
1000
1200
1400
1600
1800
1 2 3 4 5 6 7 8 9 10 11 12 13 14 15 16 17 18 19 20 21 22 23 24
MW
Total Import
Khudoni HPP
Enguri HPP
Namakhvani HPP Cascade
Other HPPs
CCGTs
Tbilsresi & RAO Mtkvari
Total Load
November
0
200
400
600
800
1000
1200
1400
1600
1800
1 2 3 4 5 6 7 8 9 10 11 12 13 14 15 16 17 18 19 20 21 22 23 24
MW
Total Import
Khudoni HPP
Enguri HPP
Namakhvani HPP Cascade
Other HPPs
CCGTs
Tbilsresi & RAO Mtkvari
Total Load

“ENERGY BALANCE” OF GEORGIA POWER SECTOR PART 1: ANALYSIS AND PROPOSALS
Page 130 of 172
December
0
200
400
600
800
1000
1200
1400
1600
1800
1 2 3 4 5 6 7 8 9 10 11 12 13 14 15 16 17 18 19 20 21 22 23 24
MW
Total Import
Khudoni HPP
Enguri HPP
Namakhvani HPP Cascade
Other HPPs
CCGTs
Tbilsresi & RAO Mtkvari
Total Load
January
0
200
400
600
800
1000
1200
1400
1600
1800
1 2 3 4 5 6 7 8 9 10 11 12 13 14 15 16 17 18 19 20 21 22 23 24
MW
Total Import
Khudoni HPP
Enguri HPP
Namakhvani HPP Cascade
Other HPPs
CCGTs
Tbilsresi & RAO Mtkvari
Total Load
February
0
200
400
600
800
1000
1200
1400
1600
1800
1 2 3 4 5 6 7 8 9 10 11 12 13 14 15 16 17 18 19 20 21 22 23 24
MW
Total Import
Khudoni HPP
Enguri HPP
Namakhvani HPP Cascade
Other HPPs
CCGTs
Tbilsresi & RAO Mtkvari
Total Load

“ENERGY BALANCE” OF GEORGIA POWER SECTOR PART 1: ANALYSIS AND PROPOSALS
Page 131 of 172
March
0
200
400
600
800
1000
1200
1400
1600
1800
1 2 3 4 5 6 7 8 9 10 11 12 13 14 15 16 17 18 19 20 21 22 23 24
MW
Total Import
Khudoni HPP
Enguri HPP
Namakhvani HPP Cascade
Other HPPs
CCGTs
Tbilsresi & RAO Mtkvari
Total Load
April
0
200
400
600
800
1000
1200
1400
1600
1800
1 2 3 4 5 6 7 8 9 10 11 12 13 14 15 16 17 18 19 20 21 22 23 24
MW
Total Import
Khudoni HPP
Enguri HPP
Namakhvani HPP Cascade
Other HPPs
CCGTs
Tbilsresi & RAO Mtkvari
Total Load
May
0
200
400
600
800
1000
1200
1400
1600
1800
1 2 3 4 5 6 7 8 9 10 11 12 13 14 15 16 17 18 19 20 21 22 23 24
MW
Total Import
Khudoni HPP
Enguri HPP
Namakhvani HPP Cascade
Other HPPs
CCGTs
Tbilsresi & RAO Mtkvari
Total Load

“ENERGY BALANCE” OF GEORGIA POWER SECTOR PART 1: ANALYSIS AND PROPOSALS
Page 132 of 172
June
0
200
400
600
800
1000
1200
1400
1600
1800
1 2 3 4 5 6 7 8 9 10 11 12 13 14 15 16 17 18 19 20 21 22 23 24
MW
Total Import
Khudoni HPP
Enguri HPP
Namakhvani HPP Cascade
Other HPPs
CCGTs
Tbilsresi & RAO Mtkvari
Total Load
July
0
200
400
600
800
1000
1200
1400
1600
1800
1 2 3 4 5 6 7 8 9 10 11 12 13 14 15 16 17 18 19 20 21 22 23 24
MW
Total Import
Khudoni HPP
Enguri HPP
Namakhvani HPP Cascade
Other HPPs
CCGTs
Tbilsresi & RAO Mtkvari
Total Load
August
0
200
400
600
800
1000
1200
1400
1600
1800
1 2 3 4 5 6 7 8 9 10 11 12 13 14 15 16 17 18 19 20 21 22 23 24
MW
Total Import
Khudoni HPP
Enguri HPP
Namakhvani HPP Cascade
Other HPPs
CCGTs
Tbilsresi & RAO Mtkvari
Total Load

“ENERGY BALANCE” OF GEORGIA POWER SECTOR PART 1: ANALYSIS AND PROPOSALS
Page 133 of 172
ANNEX G. MONTHLY DISPATCH GRAPHS: LEAST COST BASE CASE (IMERETI ON)
September
0
200
400
600
800
1000
1200
1400
1600
1800
1 2 3 4 5 6 7 8 9 10 11 12 13 14 15 16 17 18 19 20 21 22 23 24
MW
Total Import
Khudoni HPP
Enguri HPP
Namakhvani HPP Cascade
Other HPPs
CCGTs
Tbilsresi & RAO Mtkvari
Total Load
October
0
200
400
600
800
1000
1200
1400
1600
1800
1 2 3 4 5 6 7 8 9 10 11 12 13 14 15 16 17 18 19 20 21 22 23 24
MW
Total Import
Khudoni HPP
Enguri HPP
Namakhvani HPP Cascade
Other HPPs
CCGTs
Tbilsresi & RAO Mtkvari
Total Load
November
0
200
400
600
800
1000
1200
1400
1600
1800
1 2 3 4 5 6 7 8 9 10 11 12 13 14 15 16 17 18 19 20 21 22 23 24
MW
Total Import
Khudoni HPP
Enguri HPP
Namakhvani HPP Cascade
Other HPPs
CCGTs
Tbilsresi & RAO Mtkvari
Total Load

“ENERGY BALANCE” OF GEORGIA POWER SECTOR PART 1: ANALYSIS AND PROPOSALS
Page 134 of 172
December
0
200
400
600
800
1000
1200
1400
1600
1800
1 2 3 4 5 6 7 8 9 10 11 12 13 14 15 16 17 18 19 20 21 22 23 24
MW
Total Import
Khudoni HPP
Enguri HPP
Namakhvani HPP Cascade
Other HPPs
CCGTs
Tbilsresi & RAO Mtkvari
Total Load
January
0
200
400
600
800
1000
1200
1400
1600
1800
1 2 3 4 5 6 7 8 9 10 11 12 13 14 15 16 17 18 19 20 21 22 23 24
MW
Total Import
Khudoni HPP
Enguri HPP
Namakhvani HPP Cascade
Other HPPs
CCGTs
Tbilsresi & RAO Mtkvari
Total Load
February
0
200
400
600
800
1000
1200
1400
1600
1800
1 2 3 4 5 6 7 8 9 10 11 12 13 14 15 16 17 18 19 20 21 22 23 24
MW
Total Import
Khudoni HPP
Enguri HPP
Namakhvani HPP Cascade
Other HPPs
CCGTs
Tbilsresi & RAO Mtkvari
Total Load

“ENERGY BALANCE” OF GEORGIA POWER SECTOR PART 1: ANALYSIS AND PROPOSALS
Page 135 of 172
March
0
200
400
600
800
1000
1200
1400
1600
1800
1 2 3 4 5 6 7 8 9 10 11 12 13 14 15 16 17 18 19 20 21 22 23 24
MW
Total Import
Khudoni HPP
Enguri HPP
Namakhvani HPP Cascade
Other HPPs
CCGTs
Tbilsresi & RAO Mtkvari
Total Load
April
0
200
400
600
800
1000
1200
1400
1600
1800
1 2 3 4 5 6 7 8 9 10 11 12 13 14 15 16 17 18 19 20 21 22 23 24
MW
Total Import
Khudoni HPP
Enguri HPP
Namakhvani HPP Cascade
Other HPPs
CCGTs
Tbilsresi & RAO Mtkvari
Total Load
May
0
200
400
600
800
1000
1200
1400
1600
1800
1 2 3 4 5 6 7 8 9 10 11 12 13 14 15 16 17 18 19 20 21 22 23 24
MW
Total Import
Khudoni HPP
Enguri HPP
Namakhvani HPP Cascade
Other HPPs
CCGTs
Tbilsresi & RAO Mtkvari
Total Load

“ENERGY BALANCE” OF GEORGIA POWER SECTOR PART 1: ANALYSIS AND PROPOSALS
Page 136 of 172
June
0
200
400
600
800
1000
1200
1400
1600
1800
1 2 3 4 5 6 7 8 9 10 11 12 13 14 15 16 17 18 19 20 21 22 23 24
MW
Total Import
Khudoni HPP
Enguri HPP
Namakhvani HPP Cascade
Other HPPs
CCGTs
Tbilsresi & RAO Mtkvari
Total Load
July
0
200
400
600
800
1000
1200
1400
1600
1800
1 2 3 4 5 6 7 8 9 10 11 12 13 14 15 16 17 18 19 20 21 22 23 24
MW
Total Import
Khudoni HPP
Enguri HPP
Namakhvani HPP Cascade
Other HPPs
CCGTs
Tbilsresi & RAO Mtkvari
Total Load
August
0
200
400
600
800
1000
1200
1400
1600
1800
1 2 3 4 5 6 7 8 9 10 11 12 13 14 15 16 17 18 19 20 21 22 23 24
MW
Total Import
Khudoni HPP
Enguri HPP
Namakhvani HPP Cascade
Other HPPs
CCGTs
Tbilsresi & RAO Mtkvari
Total Load

“ENERGY BALANCE” OF GEORGIA POWER SECTOR PART 1: ANALYSIS AND PROPOSALS
Page 137 of 172
ANNEX H . MONTHLY DISPATCH GRAPHS: COMPARING MUST-RUN AND LEAST COST BASE CASES (IMERETI ON)
(Only Graphs for Months that Differ in the Cases are Shown)
January
-1000
-800
-600
-400
-200
0
200
400
600
800
1000
1 2 3 4 5 6 7 8 9 10 11 12 13 14 15 16 17 18 19 20 21 22 23 24
MW
Total Load
Tbilsresi & RAO Mtkvari
CCGTs
Other HPPs
Namakhvani HPP Cascade
Enguri HPP
Khudoni HPP
Total Import
January
-1000
-800
-600
-400
-200
0
200
400
600
800
1000
1 2 3 4 5 6 7 8 9 10 11 12 13 14 15 16 17 18 19 20 21 22 23 24
MW
Total Load
Tbilsresi & RAO Mtkvari
CCGTs
Other HPPs
Namakhvani HPP Cascade
Enguri HPP
Khudoni HPP
Total Import
November
-2000
-1500
-1000
-500
0
500
1000
1 2 3 4 5 6 7 8 9 10 11 12 13 14 15 16 17 18 19 20 21 22 23 24
MW
Total Load
Tbilsresi & RAO Mtkvari
CCGTs
Other HPPs
Namakhvani HPP Cascade
Enguri HPP
Khudoni HPP
Total Import
December
-1000
-800
-600
-400
-200
0
200
400
600
800
1000
1 2 3 4 5 6 7 8 9 10 11 12 13 14 15 16 17 18 19 20 21 22 23 24
MW
Total Load
Tbilsresi & RAO Mtkvari
CCGTs
Other HPPs
Namakhvani HPP Cascade
Enguri HPP
Khudoni HPP
Total Import

“ENERGY BALANCE” OF GEORGIA POWER SECTOR PART 1: ANALYSIS AND PROPOSALS
Page 138 of 172
February
-1000
-800
-600
-400
-200
0
200
400
600
800
1000
1 2 3 4 5 6 7 8 9 10 11 12 13 14 15 16 17 18 19 20 21 22 23 24
MW
Total Load
Tbilsresi & RAO Mtkvari
CCGTs
Other HPPs
Namakhvani HPP Cascade
Enguri HPP
Khudoni HPP
Total Import
March
-1000
-800
-600
-400
-200
0
200
400
600
800
1000
1 2 3 4 5 6 7 8 9 10 11 12 13 14 15 16 17 18 19 20 21 22 23 24
MW
Total Load
Tbilsresi & RAO Mtkvari
CCGTs
Other HPPs
Namakhvani HPP Cascade
Enguri HPP
Khudoni HPP
Total Import
April
-1000
-800
-600
-400
-200
0
200
400
600
800
1000
1 2 3 4 5 6 7 8 9 10 11 12 13 14 15 16 17 18 19 20 21 22 23 24
MW
Total Load
Tbilsresi & RAO Mtkvari
CCGTs
Other HPPs
Namakhvani HPP Cascade
Enguri HPP
Khudoni HPP
Total Import

“ENERGY BALANCE” OF GEORGIA POWER SECTOR PART 1: ANALYSIS AND PROPOSALS
Page 139 of 172
ANNEX I. MONTHLY DISPATCH GRAPHS: MUST-RUN BASE CASE (IMERETI OFF)
September
-200
0
200
400
600
800
1000
1200
1400
1600
1800
1 2 3 4 5 6 7 8 9 10 11 12 13 14 15 16 17 18 19 20 21 22 23 24
MW
Total Import
Khudoni HPP
Enguri HPP
Namakhvani HPP Cascade
Other HPPs
CCGTs
Tbilsresi & RAO Mtkvari
Total Load
October
0
200
400
600
800
1000
1200
1400
1600
1800
1 2 3 4 5 6 7 8 9 10 11 12 13 14 15 16 17 18 19 20 21 22 23 24
MW
Total Import
Khudoni HPP
Enguri HPP
Namakhvani HPP Cascade
Other HPPs
CCGTs
Tbilsresi & RAO Mtkvari
Total Load
November
0
200
400
600
800
1000
1200
1400
1600
1800
1 2 3 4 5 6 7 8 9 10 11 12 13 14 15 16 17 18 19 20 21 22 23 24
MW
Total Import
Khudoni HPP
Enguri HPP
Namakhvani HPP Cascade
Other HPPs
CCGTs
Tbilsresi & RAO Mtkvari
Total Load

“ENERGY BALANCE” OF GEORGIA POWER SECTOR PART 1: ANALYSIS AND PROPOSALS
Page 140 of 172
December
0
200
400
600
800
1000
1200
1400
1600
1800
1 2 3 4 5 6 7 8 9 10 11 12 13 14 15 16 17 18 19 20 21 22 23 24
MW
Total Import
Khudoni HPP
Enguri HPP
Namakhvani HPP Cascade
Other HPPs
CCGTs
Tbilsresi & RAO Mtkvari
Total Load
January
0
200
400
600
800
1000
1200
1400
1600
1800
1 2 3 4 5 6 7 8 9 10 11 12 13 14 15 16 17 18 19 20 21 22 23 24
MW
Total Import
Khudoni HPP
Enguri HPP
Namakhvani HPP Cascade
Other HPPs
CCGTs
Tbilsresi & RAO Mtkvari
Total Load
February
0
200
400
600
800
1000
1200
1400
1600
1800
1 2 3 4 5 6 7 8 9 10 11 12 13 14 15 16 17 18 19 20 21 22 23 24
MW
Total Import
Khudoni HPP
Enguri HPP
Namakhvani HPP Cascade
Other HPPs
CCGTs
Tbilsresi & RAO Mtkvari
Total Load

“ENERGY BALANCE” OF GEORGIA POWER SECTOR PART 1: ANALYSIS AND PROPOSALS
Page 141 of 172
March
0
200
400
600
800
1000
1200
1400
1600
1800
1 2 3 4 5 6 7 8 9 10 11 12 13 14 15 16 17 18 19 20 21 22 23 24
MW
Total Import
Khudoni HPP
Enguri HPP
Namakhvani HPP Cascade
Other HPPs
CCGTs
Tbilsresi & RAO Mtkvari
Total Load
April
0
200
400
600
800
1000
1200
1400
1600
1800
1 2 3 4 5 6 7 8 9 10 11 12 13 14 15 16 17 18 19 20 21 22 23 24
MW
Total Import
Khudoni HPP
Enguri HPP
Namakhvani HPP Cascade
Other HPPs
CCGTs
Tbilsresi & RAO Mtkvari
Total Load
May
0
200
400
600
800
1000
1200
1400
1600
1800
1 2 3 4 5 6 7 8 9 10 11 12 13 14 15 16 17 18 19 20 21 22 23 24
MW
Total Import
Khudoni HPP
Enguri HPP
Namakhvani HPP Cascade
Other HPPs
CCGTs
Tbilsresi & RAO Mtkvari
Total Load

“ENERGY BALANCE” OF GEORGIA POWER SECTOR PART 1: ANALYSIS AND PROPOSALS
Page 142 of 172
June
0
200
400
600
800
1000
1200
1400
1600
1800
1 2 3 4 5 6 7 8 9 10 11 12 13 14 15 16 17 18 19 20 21 22 23 24
MW
Total Import
Khudoni HPP
Enguri HPP
Namakhvani HPP Cascade
Other HPPs
CCGTs
Tbilsresi & RAO Mtkvari
Total Load
July
-200
0
200
400
600
800
1000
1200
1400
1600
1800
1 2 3 4 5 6 7 8 9 10 11 12 13 14 15 16 17 18 19 20 21 22 23 24
MW
Total Import
Khudoni HPP
Enguri HPP
Namakhvani HPP Cascade
Other HPPs
CCGTs
Tbilsresi & RAO Mtkvari
Total Load
August
0
200
400
600
800
1000
1200
1400
1600
1800
1 2 3 4 5 6 7 8 9 10 11 12 13 14 15 16 17 18 19 20 21 22 23 24
MW
Total Import
Khudoni HPP
Enguri HPP
Namakhvani HPP Cascade
Other HPPs
CCGTs
Tbilsresi & RAO Mtkvari
Total Load

“ENERGY BALANCE” OF GEORGIA POWER SECTOR PART 1: ANALYSIS AND PROPOSALS
Page 143 of 172
ANNEX J. MONTHLY DISPATCH GRAPHS: MUST-RUN WITH NO IMPORTS (IMERETI ON)
September
0
200
400
600
800
1000
1200
1400
1600
1800
1 2 3 4 5 6 7 8 9 10 11 12 13 14 15 16 17 18 19 20 21 22 23 24
MW
Total Import
Khudoni HPP
Enguri HPP
Namakhvani HPP Cascade
Other HPPs
CCGTs
Tbilsresi & RAO Mtkvari
Total Load
October
0
200
400
600
800
1000
1200
1400
1600
1800
1 2 3 4 5 6 7 8 9 10 11 12 13 14 15 16 17 18 19 20 21 22 23 24
MW
Total Import
Khudoni HPP
Enguri HPP
Namakhvani HPP Cascade
Other HPPs
CCGTs
Tbilsresi & RAO Mtkvari
Total Load
November
0
200
400
600
800
1000
1200
1400
1600
1800
1 2 3 4 5 6 7 8 9 10 11 12 13 14 15 16 17 18 19 20 21 22 23 24
MW
Total Import
Khudoni HPP
Enguri HPP
Namakhvani HPP Cascade
Other HPPs
CCGTs
Tbilsresi & RAO Mtkvari
Total Load

“ENERGY BALANCE” OF GEORGIA POWER SECTOR PART 1: ANALYSIS AND PROPOSALS
Page 144 of 172
December
0
200
400
600
800
1000
1200
1400
1600
1800
1 2 3 4 5 6 7 8 9 10 11 12 13 14 15 16 17 18 19 20 21 22 23 24
MW
Total Import
Khudoni HPP
Enguri HPP
Namakhvani HPP Cascade
Other HPPs
CCGTs
Tbilsresi & RAO Mtkvari
Total Load
January
0
200
400
600
800
1000
1200
1400
1600
1800
1 2 3 4 5 6 7 8 9 10 11 12 13 14 15 16 17 18 19 20 21 22 23 24
MW
Total Import
Khudoni HPP
Enguri HPP
Namakhvani HPP Cascade
Other HPPs
CCGTs
Tbilsresi & RAO Mtkvari
Total Load
February
0
200
400
600
800
1000
1200
1400
1600
1800
1 2 3 4 5 6 7 8 9 10 11 12 13 14 15 16 17 18 19 20 21 22 23 24
MW
Total Import
Khudoni HPP
Enguri HPP
Namakhvani HPP Cascade
Other HPPs
CCGTs
Tbilsresi & RAO Mtkvari
Total Load

“ENERGY BALANCE” OF GEORGIA POWER SECTOR PART 1: ANALYSIS AND PROPOSALS
Page 145 of 172
March
0
200
400
600
800
1000
1200
1400
1600
1800
1 2 3 4 5 6 7 8 9 10 11 12 13 14 15 16 17 18 19 20 21 22 23 24
MW
Total Import
Khudoni HPP
Enguri HPP
Namakhvani HPP Cascade
Other HPPs
CCGTs
Tbilsresi & RAO Mtkvari
Total Load
April
0
200
400
600
800
1000
1200
1400
1600
1800
1 2 3 4 5 6 7 8 9 10 11 12 13 14 15 16 17 18 19 20 21 22 23 24
MW
Total Import
Khudoni HPP
Enguri HPP
Namakhvani HPP Cascade
Other HPPs
CCGTs
Tbilsresi & RAO Mtkvari
Total Load
May
0
200
400
600
800
1000
1200
1400
1600
1800
1 2 3 4 5 6 7 8 9 10 11 12 13 14 15 16 17 18 19 20 21 22 23 24
MW
Total Import
Khudoni HPP
Enguri HPP
Namakhvani HPP Cascade
Other HPPs
CCGTs
Tbilsresi & RAO Mtkvari
Total Load

“ENERGY BALANCE” OF GEORGIA POWER SECTOR PART 1: ANALYSIS AND PROPOSALS
Page 146 of 172
June
0
200
400
600
800
1000
1200
1400
1600
1800
1 2 3 4 5 6 7 8 9 10 11 12 13 14 15 16 17 18 19 20 21 22 23 24
MW
Total Import
Khudoni HPP
Enguri HPP
Namakhvani HPP Cascade
Other HPPs
CCGTs
Tbilsresi & RAO Mtkvari
Total Load
July
0
200
400
600
800
1000
1200
1400
1600
1800
1 2 3 4 5 6 7 8 9 10 11 12 13 14 15 16 17 18 19 20 21 22 23 24
MW
Total Import
Khudoni HPP
Enguri HPP
Namakhvani HPP Cascade
Other HPPs
CCGTs
Tbilsresi & RAO Mtkvari
Total Load
August
0
200
400
600
800
1000
1200
1400
1600
1800
1 2 3 4 5 6 7 8 9 10 11 12 13 14 15 16 17 18 19 20 21 22 23 24
MW
Total Import
Khudoni HPP
Enguri HPP
Namakhvani HPP Cascade
Other HPPs
CCGTs
Tbilsresi & RAO Mtkvari
Total Load

“ENERGY BALANCE” OF GEORGIA POWER SECTOR PART 1: ANALYSIS AND PROPOSALS
Page 147 of 172
ANNEX K: TABLES OF OUTPUT OF SCENARIOS SHOWING MONTHLY DISPATCHES FROM, HYDRO, THERMAL AND IMPORT, AND SHOWING NET AVAILABLE EXPORT CAPABILITY OF GEORGIA DOMESTIC HYDRO AND THERMAL GENERATION
AVAILABLE EXPORT CAPACITY: Assuming Existing Must-Run Dispatch of Thermal Units: 1. Current Conditions, Thermal Must-run 3. Add Khudoni, Thermal Must-run 5. Add Khudoni and Namakhvani, Thermal Must-run Assuming Georgian System Operated on Least Cost Dispatch: 2. Current Conditions, Thermal Least Cost 4. Add Khudoni, Thermal Least Cost 6. Add Khudoni and Namakhvani, Thermal Least Cost ACTUALLY DISPATCHED INTERNAL USAGE: Assuming Existing Must-Run Dispatch of Thermal Units: 1. Current Conditions, Thermal Must-run 3. Add Khudoni, Thermal Must-run 5. Add Khudoni and Namakhvani, Thermal Must-run Assuming Georgian System Operated on Least Cost Dispatch: 2. Current Conditions, Thermal Least Cost 4. Add Khudoni, Thermal Least Cost 6. Add Khudoni and Namakhvani, Thermal Least Cost

“ENERGY BALANCE” OF GEORGIA POWER SECTOR PART 1: ANALYSIS AND PROPOSALS
Page 148 of 172
AVAILABLE EXPORT CAPACITY: Assuming Existing Must-Run Dispatch of Thermal Units: 1. Current Conditions, Thermal Must-run
Monthly Available Excess (undispatched) Volumes
0
100,000
200,000
300,000
400,000
500,000
600,000
700,000
MWh
Thermal: 478,800 494,760 212,404 222,932 221,472 201,679 223,789 284,400 494,760 478,800 494,760 494,760
Hydro: 113,662 81,823 125,795 34,771 33,515 23,063 35,872 69,635 50,892 93,642 106,589 94,384
September October November December January February March April May June July August

“ENERGY BALANCE” OF GEORGIA POWER SECTOR PART 1: ANALYSIS AND PROPOSALS
Page 149 of 172
AVAILABLE EXPORT CAPACITY: Assuming Existing Must-Run Dispatch of Thermal Units: 3. Add Khudoni, Thermal Must-run
Monthly Available Excess (undispatched) Volumes
0
100,000
200,000
300,000
400,000
500,000
600,000
700,000
800,000
900,000
MWh
Thermal: 478,800 494,760 208,407 218,815 216,925 203,679 219,539 284,400 494,760 478,800 494,760 494,760
Hydro: 192,420 144,499 246,293 81,631 57,523 37,608 55,939 189,927 160,790 201,171 256,525 270,681
September October November December January February March April May June July August

“ENERGY BALANCE” OF GEORGIA POWER SECTOR PART 1: ANALYSIS AND PROPOSALS
Page 150 of 172
AVAILABLE EXPORT CAPACITY: Assuming Existing Must-Run Dispatch of Thermal Units: 5. Add Khudoni and Namakhvani, Thermal Must-run
Monthly Available Excess (undispatched) Volumes
0
100,000
200,000
300,000
400,000
500,000
600,000
700,000
800,000
900,000
1,000,000
MWh
Thermal: 478,800 494,760 208,407 218,343 214,707 197,841 217,049 284,400 494,760 478,800 494,760 494,760
Hydro: 280,830 193,830 348,095 129,473 91,216 29,552 70,041 287,901 280,012 323,490 408,132 431,525
September October November December January February March April May June July August
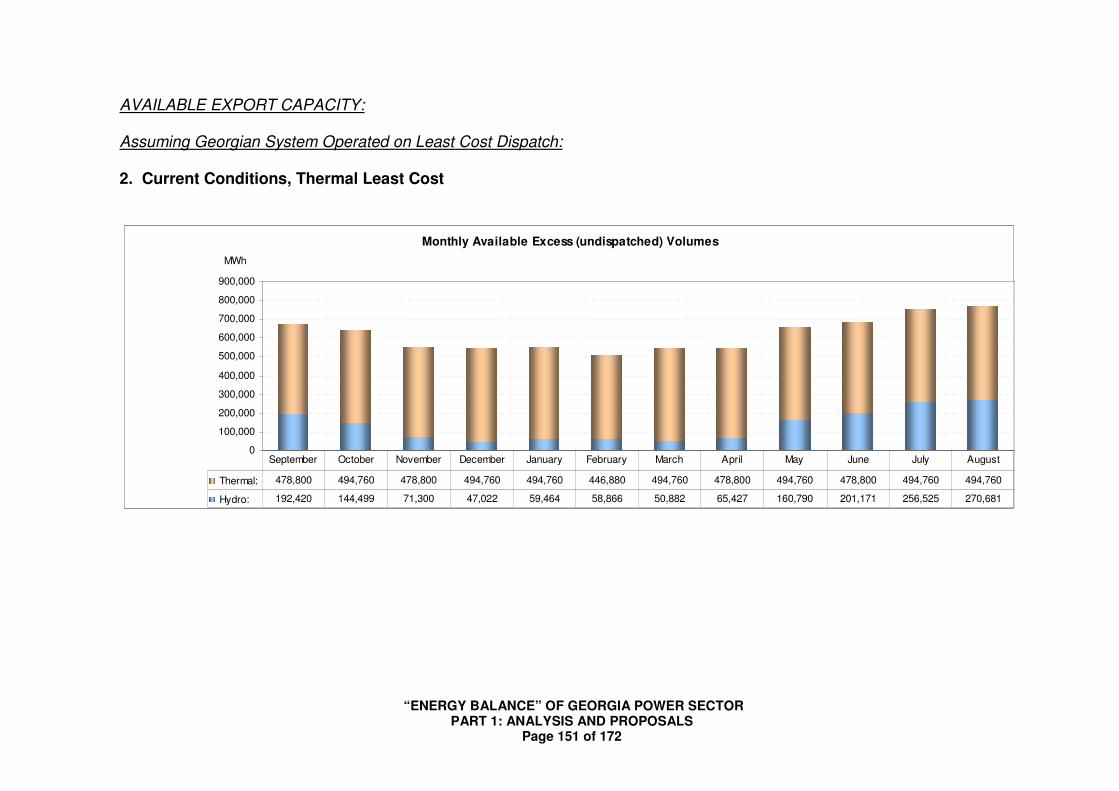
“ENERGY BALANCE” OF GEORGIA POWER SECTOR PART 1: ANALYSIS AND PROPOSALS
Page 151 of 172
AVAILABLE EXPORT CAPACITY: Assuming Georgian System Operated on Least Cost Dispatch: 2. Current Conditions, Thermal Least Cost
Monthly Available Excess (undispatched) Volumes
0
100,000
200,000
300,000
400,000
500,000
600,000
700,000
800,000
900,000
MWh
Thermal: 478,800 494,760 478,800 494,760 494,760 446,880 494,760 478,800 494,760 478,800 494,760 494,760
Hydro: 192,420 144,499 71,300 47,022 59,464 58,866 50,882 65,427 160,790 201,171 256,525 270,681
September October November December January February March April May June July August

“ENERGY BALANCE” OF GEORGIA POWER SECTOR PART 1: ANALYSIS AND PROPOSALS
Page 152 of 172
AVAILABLE EXPORT CAPACITY: Assuming Georgian System Operated on Least Cost Dispatch: 4. Add Khudoni, Thermal Least Cost
Monthly Available Excess (undispatched) Volumes
0
100,000
200,000
300,000
400,000
500,000
600,000
700,000
800,000
900,000
1,000,000
MWh
Thermal: 478,800 494,760 478,800 494,760 494,760 446,880 494,760 478,800 494,760 478,800 494,760 494,760
Hydro: 280,830 193,830 134,552 38,436 54,513 37,553 54,900 100,701 280,012 323,490 408,132 431,525
September October November December January February March April May June July August

“ENERGY BALANCE” OF GEORGIA POWER SECTOR PART 1: ANALYSIS AND PROPOSALS
Page 153 of 172
AVAILABLE EXPORT CAPACITY: Assuming Georgian System Operated on Least Cost Dispatch: 6. Add Khudoni and Namakhvani, Thermal Least Cost
Monthly Available Excess (undispatched) Volumes
0
100,000
200,000
300,000
400,000
500,000
600,000
700,000
800,000
900,000
1,000,000
MWh
Thermal: 478,800 494,760 478,800 494,760 494,760 446,880 494,760 478,800 494,760 478,800 494,760 494,760
Hydro: 280,830 193,830 134,552 38,436 54,513 37,553 54,900 100,701 280,012 323,490 408,132 431,525
September October November December January February March April May June July August

“ENERGY BALANCE” OF GEORGIA POWER SECTOR PART 1: ANALYSIS AND PROPOSALS
Page 154 of 172
ANNEX K: TABLES OF OUTPUT OF SCENARIOS SHOWING MONTHLY DISPATCHES FROM, HYDRO, THERMAL AND IMPORT, AND SHOWING NET AVAILABLE EXPORT CAPABILITY OF GEORGIA DOMESTIC HYDRO AND THERMAL GENERATION
AVAILABLE EXPORT CAPACITY: Assuming Existing Must-Run Dispatch of Thermal Units: 1. Current Conditions, Thermal Must-run 3. Add Khudoni, Thermal Must-run 5. Add Khudoni and Namakhvani, Thermal Must-run Assuming Georgian System Operated on Least Cost Dispatch: 2. Current Conditions, Thermal Least Cost 4. Add Khudoni, Thermal Least Cost 6. Add Khudoni and Namakhvani, Thermal Least Cost ACTUALLY DISPATCHED INTERNAL USAGE: Assuming Existing Must-Run Dispatch of Thermal Units: 1. Current Conditions, Thermal Must-run 3. Add Khudoni, Thermal Must-run 5. Add Khudoni and Namakhvani, Thermal Must-run Assuming Georgian System Operated on Least Cost Dispatch: 2. Current Conditions, Thermal Least Cost 4. Add Khudoni, Thermal Least Cost 6. Add Khudoni and Namakhvani, Thermal Least Cost

“ENERGY BALANCE” OF GEORGIA POWER SECTOR PART 1: ANALYSIS AND PROPOSALS
Page 155 of 172
AVAILABLE EXPORT CAPACITY: Assuming Existing Must-Run Dispatch of Thermal Units: 1. Current Conditions, Thermal Must-run
Monthly Available Excess (undispatched) Volumes
0
100,000
200,000
300,000
400,000
500,000
600,000
700,000
MWh
Thermal: 478,800 494,760 212,404 222,932 221,472 201,679 223,789 284,400 494,760 478,800 494,760 494,760
Hydro: 113,662 81,823 125,795 34,771 33,515 23,063 35,872 69,635 50,892 93,642 106,589 94,384
September October November December January February March April May June July August

“ENERGY BALANCE” OF GEORGIA POWER SECTOR PART 1: ANALYSIS AND PROPOSALS
Page 156 of 172
AVAILABLE EXPORT CAPACITY: Assuming Existing Must-Run Dispatch of Thermal Units: 3. Add Khudoni, Thermal Must-run
Monthly Available Excess (undispatched) Volumes
0
100,000
200,000
300,000
400,000
500,000
600,000
700,000
800,000
900,000
MWh
Thermal: 478,800 494,760 208,407 218,815 216,925 203,679 219,539 284,400 494,760 478,800 494,760 494,760
Hydro: 192,420 144,499 246,293 81,631 57,523 37,608 55,939 189,927 160,790 201,171 256,525 270,681
September October November December January February March April May June July August

“ENERGY BALANCE” OF GEORGIA POWER SECTOR PART 1: ANALYSIS AND PROPOSALS
Page 157 of 172
AVAILABLE EXPORT CAPACITY: Assuming Existing Must-Run Dispatch of Thermal Units: 5. Add Khudoni and Namakhvani, Thermal Must-run
Monthly Available Excess (undispatched) Volumes
0
100,000
200,000
300,000
400,000
500,000
600,000
700,000
800,000
900,000
1,000,000
MWh
Thermal: 478,800 494,760 208,407 218,343 214,707 197,841 217,049 284,400 494,760 478,800 494,760 494,760
Hydro: 280,830 193,830 348,095 129,473 91,216 29,552 70,041 287,901 280,012 323,490 408,132 431,525
September October November December January February March April May June July August

“ENERGY BALANCE” OF GEORGIA POWER SECTOR PART 1: ANALYSIS AND PROPOSALS
Page 158 of 172
AVAILABLE EXPORT CAPACITY: Assuming Georgian System Operated on Least Cost Dispatch: 2. Current Conditions, Thermal Least Cost
Monthly Available Excess (undispatched) Volumes
0
100,000
200,000
300,000
400,000
500,000
600,000
700,000
800,000
900,000
MWh
Thermal: 478,800 494,760 478,800 494,760 494,760 446,880 494,760 478,800 494,760 478,800 494,760 494,760
Hydro: 192,420 144,499 71,300 47,022 59,464 58,866 50,882 65,427 160,790 201,171 256,525 270,681
September October November December January February March April May June July August

“ENERGY BALANCE” OF GEORGIA POWER SECTOR PART 1: ANALYSIS AND PROPOSALS
Page 159 of 172
AVAILABLE EXPORT CAPACITY: Assuming Georgian System Operated on Least Cost Dispatch: 4. Add Khudoni, Thermal Least Cost
Monthly Available Excess (undispatched) Volumes
0
100,000
200,000
300,000
400,000
500,000
600,000
700,000
800,000
900,000
1,000,000
MWh
Thermal: 478,800 494,760 478,800 494,760 494,760 446,880 494,760 478,800 494,760 478,800 494,760 494,760
Hydro: 280,830 193,830 134,552 38,436 54,513 37,553 54,900 100,701 280,012 323,490 408,132 431,525
September October November December January February March April May June July August

“ENERGY BALANCE” OF GEORGIA POWER SECTOR PART 1: ANALYSIS AND PROPOSALS
Page 160 of 172
AVAILABLE EXPORT CAPACITY: Assuming Georgian System Operated on Least Cost Dispatch: 6. Add Khudoni and Namakhvani, Thermal Least Cost
Monthly Available Excess (undispatched) Volumes
0
100,000
200,000
300,000
400,000
500,000
600,000
700,000
800,000
900,000
1,000,000
MWh
Thermal: 478,800 494,760 478,800 494,760 494,760 446,880 494,760 478,800 494,760 478,800 494,760 494,760
Hydro: 280,830 193,830 134,552 38,436 54,513 37,553 54,900 100,701 280,012 323,490 408,132 431,525
September October November December January February March April May June July August

“ENERGY BALANCE” OF GEORGIA POWER SECTOR PART 1: ANALYSIS AND PROPOSALS
Page 161 of 172
ACTUALLY DISPATCHED INTERNAL USAGE: Assuming Existing Must-Run Dispatch of Thermal Units: 1. Current Conditions, Thermal Must-run
Monthly Dispatched Volumes
0
200,000
400,000
600,000
800,000
1,000,000
MWh
Import: 143,250 191,735 45,900 158,255 154,845 170,800 128,340 36,000 80,290 87,600 91,915 80,290
Thermal: 0 0 266,396 271,828 273,288 245,201 270,971 194,400 0 0 0 0
Hydro: 388,097 420,239 369,325 419,102 399,415 282,003 356,084 461,240 539,586 468,381 489,590 509,242
September October November December January February March April May June July August

“ENERGY BALANCE” OF GEORGIA POWER SECTOR PART 1: ANALYSIS AND PROPOSALS
Page 162 of 172
ACTUALLY DISPATCHED INTERNAL USAGE: Assuming Existing Must-Run Dispatch of Thermal Units: 3. Add Khudoni, Thermal Must-run
Monthly Dispatched Volumes
0
200,000
400,000
600,000
800,000
1,000,000
MWh
Import: 31,200 84,475 0 65,100 52,390 128,660 69,750 0 0 0 0 0
Thermal: 0 0 270,393 275,945 277,835 243,201 275,221 194,400 0 0 0 0
Hydro: 500,147 527,499 411,228 508,140 497,323 326,143 410,424 497,240 619,876 555,981 581,505 589,532
September October November December January February March April May June July August

“ENERGY BALANCE” OF GEORGIA POWER SECTOR PART 1: ANALYSIS AND PROPOSALS
Page 163 of 172
ACTUALLY DISPATCHED INTERNAL USAGE: Assuming Existing Must-Run Dispatch of Thermal Units: 5. Add Khudoni and Namakhvani, Thermal Must-run
Monthly Dispatched Volumes
0
200,000
400,000
600,000
800,000
1,000,000
MWh
Import: 0 27,280 0 27,280 7,440 77,980 34,720 0 0 0 0 0
Thermal: 0 0 270,393 276,417 280,053 249,039 277,711 194,400 0 0 0 0
Hydro: 531,347 584,694 411,228 545,488 540,055 370,986 442,964 497,240 619,876 555,981 581,505 589,532
September October November December January February March April May June July August

“ENERGY BALANCE” OF GEORGIA POWER SECTOR PART 1: ANALYSIS AND PROPOSALS
Page 164 of 172
ACTUALLY DISPATCHED INTERNAL USAGE: Assuming Georgian System Operated on Least Cost Dispatch: 2. Current Conditions, Thermal Least Cost
Monthly Dispatched Volumes
0
200,000
400,000
600,000
800,000
1,000,000
MWh
Import: 143,250 191,735 233,400 452,290 439,115 433,720 422,840 204,750 80,290 87,600 91,915 80,290
Thermal: 0 0 0 0 0 0 0 0 0 0 0 0
Hydro: 388,097 420,239 448,221 396,895 388,433 264,284 332,555 486,890 539,586 468,381 489,590 509,242
September October November December January February March April May June July August

“ENERGY BALANCE” OF GEORGIA POWER SECTOR PART 1: ANALYSIS AND PROPOSALS
Page 165 of 172
ACTUALLY DISPATCHED INTERNAL USAGE: Assuming Georgian System Operated on Least Cost Dispatch: 4. Add Khudoni, Thermal Least Cost
Monthly Dispatched Volumes
0
200,000
400,000
600,000
800,000
1,000,000
MWh
Import: 31,200 84,475 95,400 306,435 332,165 393,120 339,915 69,900 0 0 0 0
Thermal: 0 0 0 0 0 0 0 0 0 0 0 0
Hydro: 500,147 527,499 586,221 542,750 495,383 304,884 415,480 621,740 619,876 555,981 581,505 589,532
September October November December January February March April May June July August

“ENERGY BALANCE” OF GEORGIA POWER SECTOR PART 1: ANALYSIS AND PROPOSALS
Page 166 of 172
ACTUALLY DISPATCHED INTERNAL USAGE: Assuming Georgian System Operated on Least Cost Dispatch: 6. Add Khudoni and Namakhvani, Thermal Least Cost
Monthly Dispatched Volumes
0
200,000
400,000
600,000
800,000
1,000,000
MWh
Import: 0 27,280 56,850 212,660 250,790 335,020 297,290 7,200 0 0 0 0
Thermal: 0 0 0 0 0 0 0 0 0 0 0 0
Hydro: 531,347 584,694 624,771 636,525 576,758 362,984 458,105 684,440 619,876 555,981 581,505 589,532
September October November December January February March April May June July August

“ENERGY BALANCE” OF GEORGIA POWER SECTOR PART 1: ANALYSIS AND PROPOSALS
Page 167 of 172
ACTUALLY DISPATCHED INTERNAL USAGE:
Assuming Existing Must-Run Dispatch of Thermal Units: 1. Current Conditions, Thermal Must-run
Monthly Dispatched Volumes
0
200,000
400,000
600,000
800,000
1,000,000
MWh
Import: 143,250 191,735 45,900 158,255 154,845 170,800 128,340 36,000 80,290 87,600 91,915 80,290
Thermal: 0 0 266,396 271,828 273,288 245,201 270,971 194,400 0 0 0 0
Hydro: 388,097 420,239 369,325 419,102 399,415 282,003 356,084 461,240 539,586 468,381 489,590 509,242
September October November December January February March April May June July August

“ENERGY BALANCE” OF GEORGIA POWER SECTOR PART 1: ANALYSIS AND PROPOSALS
Page 168 of 172
ACTUALLY DISPATCHED INTERNAL USAGE: Assuming Existing Must-Run Dispatch of Thermal Units: 3. Add Khudoni, Thermal Must-run
Monthly Dispatched Volumes
0
200,000
400,000
600,000
800,000
1,000,000
MWh
Import: 31,200 84,475 0 65,100 52,390 128,660 69,750 0 0 0 0 0
Thermal: 0 0 270,393 275,945 277,835 243,201 275,221 194,400 0 0 0 0
Hydro: 500,147 527,499 411,228 508,140 497,323 326,143 410,424 497,240 619,876 555,981 581,505 589,532
September October November December January February March April May June July August

“ENERGY BALANCE” OF GEORGIA POWER SECTOR PART 1: ANALYSIS AND PROPOSALS
Page 169 of 172
ACTUALLY DISPATCHED INTERNAL USAGE: Assuming Existing Must-Run Dispatch of Thermal Units: 5. Add Khudoni and Namakhvani, Thermal Must-run
Monthly Dispatched Volumes
0
200,000
400,000
600,000
800,000
1,000,000
MWh
Import: 0 27,280 0 27,280 7,440 77,980 34,720 0 0 0 0 0
Thermal: 0 0 270,393 276,417 280,053 249,039 277,711 194,400 0 0 0 0
Hydro: 531,347 584,694 411,228 545,488 540,055 370,986 442,964 497,240 619,876 555,981 581,505 589,532
September October November December January February March April May June July August

“ENERGY BALANCE” OF GEORGIA POWER SECTOR PART 1: ANALYSIS AND PROPOSALS
Page 170 of 172
ACTUALLY DISPATCHED INTERNAL USAGE: Assuming Georgian System Operated on Least Cost Dispatch: 2. Current Conditions, Thermal Least Cost
Monthly Dispatched Volumes
0
200,000
400,000
600,000
800,000
1,000,000
MWh
Import: 143,250 191,735 233,400 452,290 439,115 433,720 422,840 204,750 80,290 87,600 91,915 80,290
Thermal: 0 0 0 0 0 0 0 0 0 0 0 0
Hydro: 388,097 420,239 448,221 396,895 388,433 264,284 332,555 486,890 539,586 468,381 489,590 509,242
September October November December January February March April May June July August

“ENERGY BALANCE” OF GEORGIA POWER SECTOR PART 1: ANALYSIS AND PROPOSALS
Page 171 of 172
ACTUALLY DISPATCHED INTERNAL USAGE: Assuming Georgian System Operated on Least Cost Dispatch: 4. Add Khudoni, Thermal Least Cost
Monthly Dispatched Volumes
0
200,000
400,000
600,000
800,000
1,000,000
MWh
Import: 31,200 84,475 95,400 306,435 332,165 393,120 339,915 69,900 0 0 0 0
Thermal: 0 0 0 0 0 0 0 0 0 0 0 0
Hydro: 500,147 527,499 586,221 542,750 495,383 304,884 415,480 621,740 619,876 555,981 581,505 589,532
September October November December January February March April May June July August

“ENERGY BALANCE” OF GEORGIA POWER SECTOR PART 1: ANALYSIS AND PROPOSALS
Page 172 of 172
ACTUALLY DISPATCHED INTERNAL USAGE: Assuming Georgian System Operated on Least Cost Dispatch: 6. Add Khudoni and Namakhvani, Thermal Least Cost
Monthly Dispatched Volumes
0
200,000
400,000
600,000
800,000
1,000,000
MWh
Import: 0 27,280 56,850 212,660 250,790 335,020 297,290 7,200 0 0 0 0
Thermal: 0 0 0 0 0 0 0 0 0 0 0 0
Hydro: 531,347 584,694 624,771 636,525 576,758 362,984 458,105 684,440 619,876 555,981 581,505 589,532
September October November December January February March April May June July August