energy balance and cancer survival michelle d. holmes, md, drph november 11, 2005
TRANSCRIPT

Energy Balance and Cancer Energy Balance and Cancer SurvivalSurvival
Michelle D. Holmes, MD, DrPH
November 11, 2005

Cancer Survivorship
• 62% 5 year survival over all adult cancers
• 8.9 million US cancer survivors– 22% breast cancer (2 million)– 19% prostate cancer (1.7 million)– 11% colorectal cancer (1 million)
Aziz; J Nutr 2002; 132: 3494S

Topics
• Energy balance
(obesity, weight gain, activity)• Breast Cancer• Colon Cancer
• Dietary fat and breast cancer

Breast Cancer

Energy BalanceObesity
BMI kg/m2 WHO definition Lbs, 5’4”
<21 underweight <122
21-24.9 normal weight 122-144
25-29.9 Overweight 145-173
30-34.9 Obese 174-203
35-39.9 Severe obesity 204-231
≥ 40 Morbid obesity ≥ 232

Source: Behavioral Risk Factor Surveillance System, CDC.
Obesity Trends* Among U.S. AdultsBRFSS, 1985
No Data <10% 10% – 14%
(*BMI ≥30, or ~ 30 lbs overweight for 5’ 4” person)
Source: Behavioral Risk Factor Surveillance System, CDC.
Obesity Trends* Among U.S. AdultsBRFSS, 1987
No Data <10% 10%– 14%
(*BMI ≥30, or ~ 30 lbs overweight for 5’ 4” person)
Energy BalanceObesity
1985 vs. 1987

Source: Behavioral Risk Factor Surveillance System, CDC.
Obesity Trends* Among U.S. AdultsBRFSS, 1985
No Data <10% 10% – 14%
(*BMI ≥30, or ~ 30 lbs overweight for 5’ 4” person)
Energy BalanceObesity
1985 vs. 1989
Source: Behavioral Risk Factor Surveillance System, CDC.
Obesity Trends* Among U.S. AdultsBRFSS, 1989
No Data <10% 10% – 14%
(*BMI ≥30, or ~ 30 lbs overweight for 5’ 4” person)

Source: Behavioral Risk Factor Surveillance System, CDC.
Obesity Trends* Among U.S. AdultsBRFSS, 1985
No Data <10% 10% – 14%
(*BMI ≥30, or ~ 30 lbs overweight for 5’ 4” person)
Energy BalanceObesity
1985 vs. 1991
Source: Behavioral Risk Factor Surveillance System, CDC.
Obesity Trends* Among U.S. AdultsBRFSS, 1991
No Data <10% 10% – 14% 15% – 19%
(*BMI ≥30, or ~ 30 lbs overweight for 5’ 4” person)

Source: Behavioral Risk Factor Surveillance System, CDC.
Obesity Trends* Among U.S. AdultsBRFSS, 1985
No Data <10% 10% – 14%
(*BMI ≥30, or ~ 30 lbs overweight for 5’ 4” person)
Energy BalanceObesity
1985 vs. 1993
Source: Behavioral Risk Factor Surveillance System, CDC.
Obesity Trends* Among U.S. AdultsBRFSS, 1993
No Data <10% 10% – 14% 15% – 19%
(*BMI ≥30, or ~ 30 lbs overweight for 5’ 4” person)

Source: Behavioral Risk Factor Surveillance System, CDC.
Obesity Trends* Among U.S. AdultsBRFSS, 1985
No Data <10% 10% – 14%
(*BMI ≥30, or ~ 30 lbs overweight for 5’ 4” person)
Energy BalanceObesity
1985 vs. 1995
Source: Behavioral Risk Factor Surveillance System, CDC.
Obesity Trends* Among U.S. AdultsBRFSS, 1995
No Data <10% 10% – 14% 15% – 19%
(*BMI ≥30, or ~ 30 lbs overweight for 5’ 4” person)

Source: Behavioral Risk Factor Surveillance System, CDC.
Obesity Trends* Among U.S. AdultsBRFSS, 1985
No Data <10% 10% – 14%
(*BMI ≥30, or ~ 30 lbs overweight for 5’ 4” person)
Energy BalanceObesity
1985 vs. 1997
Source: Behavioral Risk Factor Surveillance System, CDC.
Obesity Trends* Among U.S. AdultsBRFSS, 1997
No Data <10% 10%– 14% 15%– 19% ≥20
(*BMI ≥30, or ~ 30 lbs overweight for 5’ 4” person)

Source: Behavioral Risk Factor Surveillance System, CDC.
Obesity Trends* Among U.S. AdultsBRFSS, 1985
No Data <10% 10% – 14%
(*BMI ≥30, or ~ 30 lbs overweight for 5’ 4” person)
Energy BalanceObesity
1985 vs. 1999
Source: Behavioral Risk Factor Surveillance System, CDC.
Obesity Trends* Among U.S. AdultsBRFSS, 1999
No Data <10% 10% – 14% 15% – 19% ≥20
(*BMI ≥30, or ~ 30 lbs overweight for 5’ 4” person)

Source: Behavioral Risk Factor Surveillance System, CDC.
Obesity Trends* Among U.S. AdultsBRFSS, 1985
No Data <10% 10% – 14%
(*BMI ≥30, or ~ 30 lbs overweight for 5’ 4” person)
Energy BalanceObesity
1985 vs. 2001
Source: Behavioral Risk Factor Surveillance System, CDC.
Obesity Trends* Among U.S. AdultsBRFSS, 2001
No Data <10% 10% – 14% 15% – 19% 20% – 24% ≥25%
(*BMI ≥30, or ~ 30 lbs overweight for 5’ 4” person)

Source: Behavioral Risk Factor Surveillance System, CDC.
Obesity Trends* Among U.S. AdultsBRFSS, 1985
No Data <10% 10% – 14%
(*BMI ≥30, or ~ 30 lbs overweight for 5’ 4” person)
Energy BalanceObesity
1985 vs. 2003
Source: Behavioral Risk Factor Surveillance System, CDC.
Obesity* Trends Among U.S. AdultsBRFSS, 2003
(*BMI ≥30, or ~ 30 lbs overweight for 5’ 4” person)
No Data <10% 10% – 14% 15% – 19% 20% – 24% ≥25%

Obesity Decreased Survival
Author, date Comparison Mortality (HR)
Daling JR, 2001 4th vs 1st BMI quartile 2.5 (1.6-3.9)
Galanis DJ, 1998 1 BMI unit increase 9% increase
Newman SC, 1995 4th vs 1st BMI quartile 2.5 (1.2-5.2)
Zhang S, 1995 3rd vs 1st BMI tertile 1.5 (0.7-2.9)
Bastarrachea, 1994 Obese vs normal weight 1.33 (1.05-1.68)

Energy BalanceWeight Gain

Chemotherapy Weight Gain
Goodwin PJ, J Clin Oncol 1999; 17:120

Weight Gain → ↓Survival
Category of BMI Change
BMI loss Maintain Gain 0.5-<2.0
kg/m2
Gain ≥2.0 kg/m2
p
Never smokers, N 514 677 712 272
Breast cancer death 38 48 77 46
1.01
(0.65,1.58)
1.00 1.35
(0.93,1.95)
1.64
(1.07,2.51)
0.03
Kroenke CH, J Clin Onc 2005;23: 1370
Relative risk of breast cancer death by category of weight change among 5,204 women with breast cancer from the NHS

Exercise

• Improves body esteem and mood
• Enhances quality of life
• Can it improve survival?• Might prevent weight gain with chemotherapy• Might lower hormone levels known to stimulate
cancer growth
Exercise and Breast Cancer Survivors

Metabolic Equivalent ConversionsMETS for 1 hour of that activity
Normal pace walking (2-2.9 mph) 3
Brisk pace walking (3-3.9 mph) 4
Very brisk pace walking (4+ mph) 4.5
Jogging (slower than 10 minutes/mile) 7
Running (faster than 10 min/mile) 12
Bicycling 7
Tennis, squash, racquetball 7
Lap swimming 7
Calisthenics, ski or stair machine, other aerobic
6
Yoga, stretching, toning, lower intensity exercise
4
Other vigorous activities (lawn mowing) 6

NHS Study Participants
• Invasive breast cancer 1984-2002
• Stages I, II, III
• Activity assessment ≥ 2 years after diagnosis

Physical activity after diagnosis
– This is what a woman with breast cancer can change
Avoided women with occult metastatic disease
– Likely to affect activity levels

MET-hrs/week
< 3 3-8.9 9-14.9 15-23.9 24+ P-value
Deaths
RR
95% CI
188
1.00
-----
126
0.71
(0.56-0.89)
38
0.59
(0.41-0.84)
51
0.56
(0.41-0.77)
60
0.65
(0.48-0.88)
0.003
Breast Cancer Deaths 110 84 20 32 34
RR 1.00 0.80 0.50 0.56 0.60 0.004
95% CI ----- (0.60-1.06) (0.31-0.82) (0.38-0.84) (0.41-0.89)
Multivariate RR of Death, and Breast Cancer Death, by Physical Activity
Holmes MD, JAMA 2005;293:2479

Multivariate RR of Death from Breast Cancer, by Physical Activity,Stratified by
ER/PR status
MET-hrs/week
<9 ≥9
ER- and PR-
# deaths/N
RR (95% CI)
27/272
1.00 (- - -)
13/149
0.91 (0.43-1.96)
ER+ and PR+
# deaths/N
RR (95% CI)
99/955
1.00 (- - -)
36/609
0.50 (0.34-0.74)
P for interaction = 0.08

Mortality curves by exercise level

Mechanisms for Energy Balance Affecting Breast Cancer Survival
•Sex steroid hormones

Mean Serum Hormones x BMI in 503 Women with Breast Cancer
BMI
<22 22-25 25-27.5 27.5-30 >30 P
Estrone (pg/mL) 19.7 22.3 21.2 22.7 26.5 0.005
Estradiol (pg/mL) 4.7 8.3 8.0 10.6 10.7 0.002
DHEAS (ng/dL) 50.5 53.2 55.6 60.0 59.3 0.21
SHBG (nmol/L) 73.9 66.2 52.1 43.4 38.1 .0001
Testosterone(pg/mL) 94.5 188.1 127.4 126.0 176.5 .0001
Free estradiol (pg/mL) 0.10 0.18 0.20 0.28 0.28 .0001
Free testosterone(pg/mL) 2.1 2.9 4.0 4.6 7.6 .0001
McTiernan A, JCO 2003; 21:1961
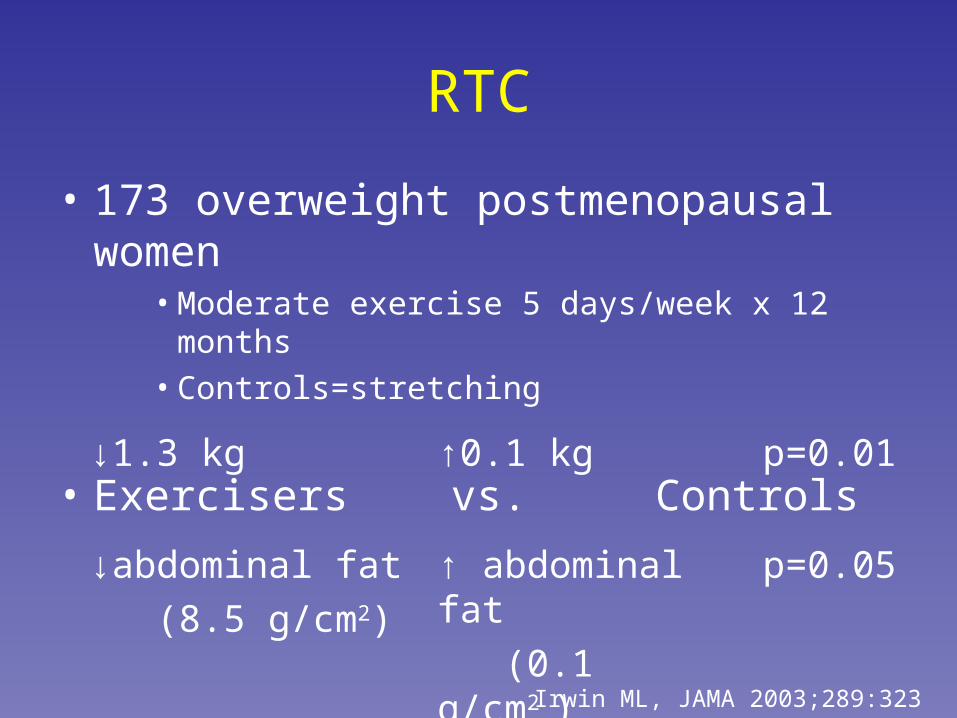
RTC
• 173 overweight postmenopausal women• Moderate exercise 5 days/week x 12 months• Controls=stretching
• Exercisers vs. Controls
Irwin ML, JAMA 2003;289:323
↓1.3 kg ↑0.1 kg p=0.01
↓abdominal fat
(8.5 g/cm2)
↑ abdominal fat
(0.1 g/cm2 )
p=0.05

Estradiol (pg/mL) levels
Exercisers Controls
Baseline 12 mos %∆ Baseline 12 mos %∆ Difference in %∆
Gained body fat
19.1 20.3 6.3 20.6 19.3 -6.3 12.6
Lost >2% fat 18.3 15.8 -13.7 16.9 17.7 4.7 -18.1
P=0.008
McTiernan A, CEBP 2004;13:1099

Colon Cancer

• Cohort study 3759 men & women• Stage II, III colon cancer• INT-0089 trial
– 4 treatment aims– No survival difference by treatment– f/u = 9.4 years
• Categorized by BMI (kg/m2) at time of Rx
• Meyerhardt, Cancer 2003
Energy Balance (Obesity)

Energy Balance (Obesity)
BMI
<21 21-24.9 25-27.49 27.5-29.9 ≥30 p
Women
Overall mortality
Disease recurrence
1.08
1.01
ref.
ref.
1.18
1.14
1.23
1.20
1.34(1.07-1.67)
1.24(0.98-1.59)
0.007
0.061
Men
Overall mortality
Disease recurrence
1.33
1.22
ref.
ref.
1.03
1.00
0.96
1.05
0.94(0.77-1.15)
0.98(0.79-1.23)
0.39
0.93
Adjusted HR (85% CI)By BMI

Mechanisms for Energy Balance Affecting Colon cancer survival
•Insulin/C-peptide/IGFs•Leptin/Adiponectin/Inflammatory markers

Energy intake, Physical activity, High Glycemic diet
PituitaryGH secretion IGF-I response to GH
Obesity Insulin resistance
Competentbeta-cell secretion C-peptideHyperinsulinemia(Fasting or Post-Prandial)
Bioactive IGF-I
Cell survival and proliferation
Direct effect?
IGFBP-1

0
1
2
3
4
5
No Diagnosis 1-9 11-15 >15
Years Since Diagnosis of Diabetes
Hu et al., JNCI 1999
RR Colon Cancer (NHS)
High insulinproduction Low insulin
production

C-peptide Levels & Colorectal Cancer Risk in Men (PHS)
0
0.5
1
1.5
2
2.5
3
3.5
Q1 Q2 Q3 Q4 Q5
Overall
Control for IR factors
Excluding cases Dx within five years of blood collection
RR
Plasma C-peptide
Ptrend <0.05
ref
Ma, et al. J Natl Cancer Inst 2004

Biological Function of White Adipose Tissue
appetite and energy balance (leptin)
haemostasis
insulin sensitivity (adiponectin)
immunity
blood pressure
lipid metabolism
Angiogenesis (VEGF)
inflammation ´-phase response (IL-6, CRP, TNF-)
(Trayhurn and Wood et al. 2004)
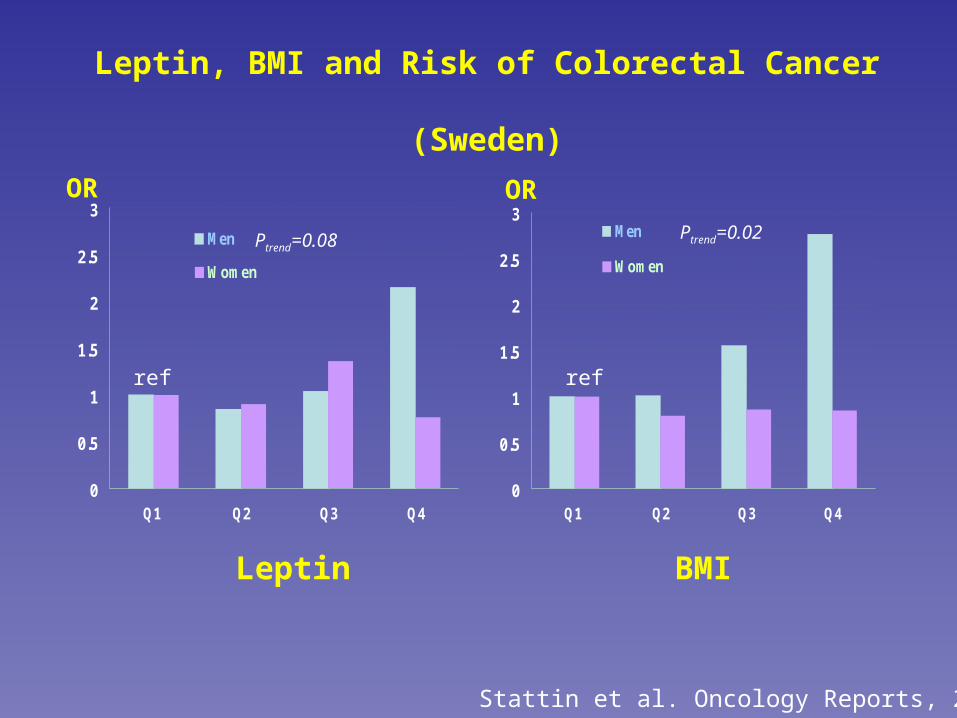
Leptin, BMI and Risk of Colorectal Cancer (Sweden)
0
0.5
1
1.5
2
2.5
3
Q1 Q2 Q3 Q4
Men
Women
0
0.5
1
1.5
2
2.5
3
Q1 Q2 Q3 Q4
Men
Women
Leptin BMI
Stattin et al. Oncology Reports, 2003
Ptrend=0.08Ptrend=0.02
ref ref
OR OR

Dietary Fat and Breast Cancer Survival

Cohort studies of fat intake and breast cancer survival, by timing of dietary assessment
(Author & year, N, Hazard Ratio)
Before
Jain, 1994 678 1.4 (1.2-1.8)
Zhang, 1995 698 2.1 (1.1-4.3)
After
Ewertz, 1991 2445 ---------------
Holmes, 1999 1982 ---------------
Mixed
Gregorio, 1985 933 1.44, p<0.01
Newman, 1986 300 -----------
Nomura, 1991 182 white 3.2 (1.2- 8.5)
Kyogoku, 1992 212 -----------
Holm, 1993 240 1.1 (1.0-1.5)
Rohan, 1993 412 -----------
Hebert, 1998 472 1.3 (1.0-1.6)
Goodwin, 2003 477 2.1
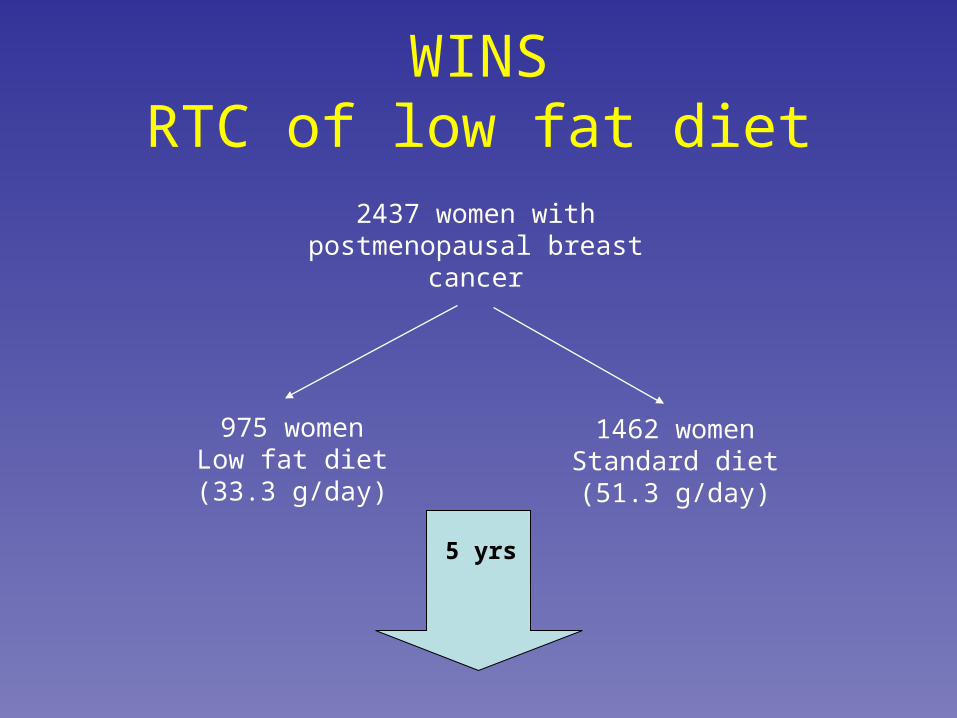
WINSRTC of low fat diet
2437 women with postmenopausal breast
cancer
975 womenLow fat diet(33.3 g/day)
1462 womenStandard diet(51.3 g/day)
5 yrs

WINSlow fat diet vs. control
RR (95% CI) p-value
All women 0.76 (0.60-1.00) 0.03
ER+ 0.85 (0.63-1.14) 0.28
ER- 0.58 (0.37-0.91) 0.02

WINS Trial
• Pilot studies showed– Good adherence to diet– Average weight decrease 2 kg– Average estradiol decrease 20%

Conclusions
• Adjuvant treatments for breast & colon cancer lowers disease mortality 25-40%
• Weight maintenance after breast cancer may lower disease mortality 40%∼
• Moderate exercise after breast & colon cancer may lower disease mortality 40-∼50%
Conclusions
• Advising weight maintenance and exercise after breast & colon cancer may help our patients as much as standard treatments.
• Important in our sedentary & obesigenic environment.