energy audit of sewage treatment plants
TRANSCRIPT

Energy Audit of Sewage Treatment Plants
By
Ashraf Aizzuddin b. Abd. Ralmi
Dissertation submitted in partial fulfillment of
the requirements for the
Bachelor of Engineering (Hons)
(Mechanical Engineering)
AUGUST2011
Universiti Teknologi PETRONAS
Bandar Seri Iskandar
31750 Tronoh
Perak Darul Ridzuan

Approved by,
CERTIFICATION OF APPROVAL
Energy Audit of Sewage Treatment Plants
by
Ashraf Aizzuddin b. Abd. Rahni
A project dissertation submitted to the
Mechanical Engineering Programme
Universiti Teknologi PETRONAS
in partial fulfilment of the requirement for the
BACHELOR OF ENGINEERING (Hons)
(MECHANICAL ENGINEERING)
(Ir. Dr. 1 ohd Shiraz Bin Aris)
UNIVERSITI TEKNOLOGI PETRONAS
TRONOH, PERAK
August 2011

CERTIFICATION OF ORIGINALITY
This is to certify that I am responsible for the work submitted in this project, that the
original work is my own except as specified in the references and acknowledgements,
and that the original work contained herein have not been undertaken or done by
Ashraf Aizzuddin b. Abd. Rahni
ii
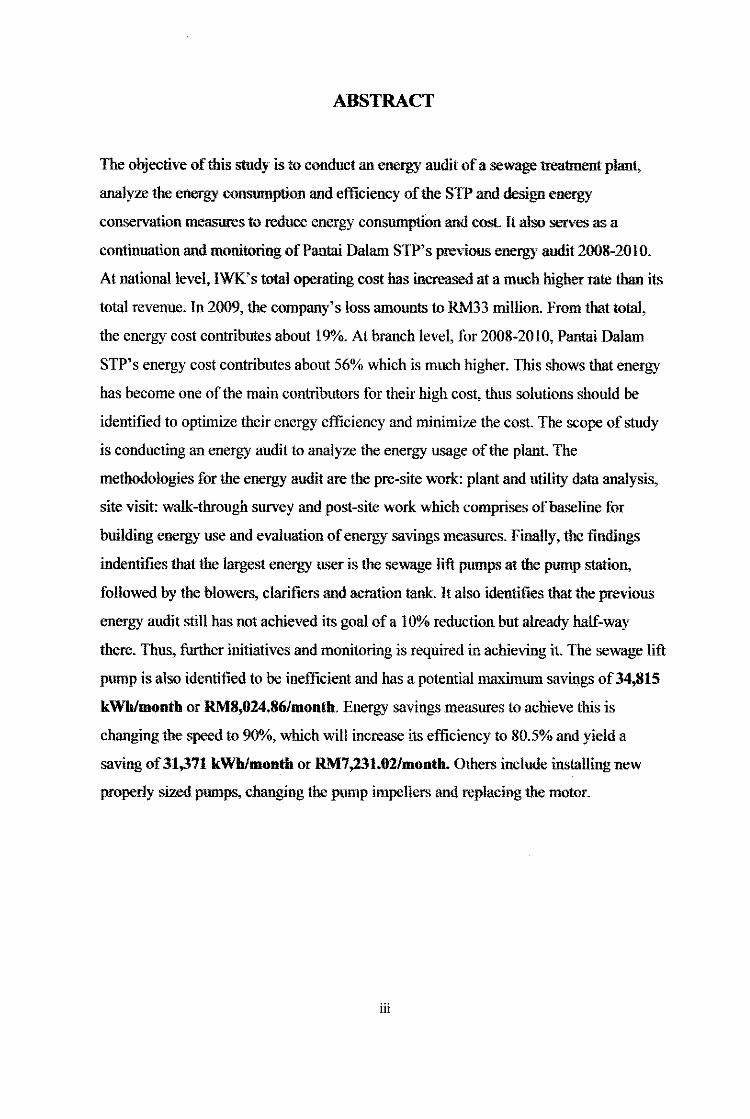
ABSTRACT
The objective of this study is to conduct an energy audit of a sewage treatment plant,
analyze the energy consumption and efficiency of the STP and design energy
conservation measures to reduce energy consumption and cost It also serves as a
continuation and monitoring of Pantai Dalam SIP's previous energy audit 2008-2010.
At national level, IWK's total operating cost bas increased at a much higher rate than its
total revenue. In 2009, the company's loss amounts to RM33 million. From that total,
the energy cost contributes about 19%. At branch level, for 2008-2010, Pantai Dalam
STP' s energy cost contributes about 56% which is much higher. This shows that energy
has become one of the main contributors for their high cost, thus solutions should be
identified to optimize their energy efficiency and minimize the cost. The scope of study
is conducting an energy audit to analyze the energy usage of the plant. The
methodologies for the energy audit are the pre-site work: plant and utility data analysis,
site visit: walk-through survey and post-site work which comprises of baseline for
building energy use and evaluation of energy savings measures. Finally, the findings
indentifies that the largest energy user is the sewage lift pumps at the pump station,
followed by the blowers, clarifiers and aeration tank. It also identifies that the previous
energy audit still bas not achieved its goal of a I 0% reduction but already half-way
there. Thus, further initiatives and monitoring is required in achieving it. The sewage lift
pump is also identified to be inefficient and has a potential maximum savings of 34,815
kWh/month or RM8,024.86/month. Energy savings measures to achieve this is
changing the speed to 90"/o, which will increase its efficiency to 80.5% and yield a
saving of31,371 kWh/month or RM7,23l.02/month. Others include installing new
properly sized pumps, changing the pump impellers and replacing the motor.
iii

ACKNOWLEDGEMENT
I would like to take this opportunity to firstly thank my supervisor, Ir. Dr. Mohd Shirnz
Bin Aris, who have guided me through this project. I would also like to thank the panel
of examiners, Ms. Clrin Y ee Sing and Mr. Kamal Ariff Zainal Abidin, for their
important feedbacks. Besides that, thank you too to other UTP staffs, especially Mr.
Azami b. Buyong who is in charge of the UTP STP for his guidance and the technicians
for their assistance. Special thanks also to the Pantai Dalam STP staffs, especially Mr.
Lokman AI Hakim for his assistance at the plant. Finally, thank you to everyone else
who have helped me in completing this project whether directly or indirectly.
iv

TABLE OF CONTENTS
CERTIFICATION .
ABSTRACT.
ACKNOWLEDGEMENT .
CHAPTER!:
CHAPTER2:
CHAPTER3:
CHAPTER4:
INTRODUCTION
1.1 Background
1.2 Problem Statement
1.3 Objectives and Scope of Study
LITERATURE REVIEW
2.1 Energy Audit
2.2 Sewage Treatment Plant .
METHODOLOGY .
3.1 Project Activities .
3.2 Key Milestones .
RESULTS AND DISCUSSION
4.1 Plant and Utility Data Analysis
4.1.1 Plant Analysis
4.1.2 Utility Data Analysis
4.2 Walk-Through Survey
4.3 Baseline for Building Energy Use
4.4 Evaluation of Energy Savings Measures.
v
I
1!1
IV
1
1
1
2
3
3
4
6
6
7
9
9
9
13
14
15
17

CHAPTERS:
REFERENCES
APPENDICES
LIST OF FIGURES
CONCLUSION AND RECOM.MENDATION
5.1 Conclusion
5.2 Recommendations
Figure 2.1 Typical IWK sewerage treatment plant
Figure 2.2 Electricity requirements for activated sludge wastewater
Figure 3.1 FYP I Gantt chart
Figure 3.2 FYP II Gantt chart
Figure 4.1 Map location
Figure 4.2 Plant overview
Figure 4.3 Process overview
Figure 4.4 SENTRON PAC3200 Power Meter
20
20
20
21
22
5
5
7
8
9
10
12
15
Figure 4.5 Energy consumption and electricity cost per cubic meter of influent 16
Figure 4.6 Energy use distribution 17
Figure 4. 7 Sewage lift pump operating points 18
Figure 4.8 Sewage lift pumps 19
LIST OFT ABLES
Table 4.1 Utility data
Table 4.2 Power consumption data
vi
14
14

ABBREVIATIONS AND NOMENCLATURES
BEP Best efficiency point
EPRI Electric Power Research Institue
IWK Indah Water Konsortium Sdn. Bhd.
SAIC Science Applications International Corporation
SS Suspended solids
STP Sewage treatment plant
1NB Tenaga Nasional Berhad
vii
1. BACKGROUND
CHAPTERl
INTRODUCTION
Acconling to Malaysia Green Technology Corporation (2010), one oftbe National
Energy Policies is to promote the efficient utilization of energy and to discourage
wasteful and non-productive patterns of energy consumption [I]. Thus, energy
efficiency is an important component as the world moves towards green technology
and becoming more efficient. Energy, which also equals to cost, is growing rapidly
in demand to cater the rising population and development. According to the Energy
Commission report, for the first half of 20 l 0 the industrial sector comprises the
largest segment (44%) ofTNB's energy sales [2]. Thus, the need to monitor and
manage the energy usage is important, especially in the industrial sector. An
objective and effective method to achieve this is by doing an energy audit. In this
study, the industry is scaled down to a sewage treatment plant, and the chosen STP is
Indah Water Konsortium Sdn. Bhd. Pantai Dalam branch.
2. PROBLEMSTATEMENT
According to IWK Sustainability Report (2008-2009), at national level IWK's total
oper.tting cost has increased at a much higher rate than its total revenue [3]. It had
exceeded the revenue, resulting in unsustainability. From 1998 to 2009, it has
increased by 634% while the revenue increased by only 155%.1 In the end, the
company's loss amounts to RM33 million. From that total, the energy cost
contributes about 19"/o. At branch level, according to Pantai Oalam STP' s previous
energy audit 2008-20 l 0 the energy cost contribution is much higher which is 56%
[4]? This is primarily due to the increase in number ofSTPs and electricity tariff rate,
which is estimated to be the mean High Voltage Peak/Off-Peak Industrial Tariff rate
ofRM0.23051k Wh for IWK. This clearly shows that energy has become one of the
1 Refer appendix 1.1 2 Reter appendix 1.2
1

main contributors for the high cost, thus a solution should be designed to optimize its
efficiency and minimize its cost.
3. OBJECTIVES AND SCOPE OF STUDY
The objective of this project is to conduct an energy audit of a sewage treatment
plant, spe~ifically tbe Pantai Dalam STP. The energy audit will analyze the energy
consumption and efficiency. It also serves as a continuation and monitoring of the
Pantai Dalam STP's previous energy audit 2008-2010. Finally, energy conservation
measures will be identified to reduce energy consumption and cost. The scope of
study is conducting an energy audit to analyze the energy usage of the plant.
2

1. ENERGY AUDIT
CHAPTER2
LITERATURE REVIEW
According to Malaysia Green Technology Corporation, "Energy audits are a
systematic study or survey to identity how energy is being used in a building or a
plant. It is also a useful procedure to find out the best options for energy conservation.
Energy audits provide an analysis of the amount of energy consumed during a given
period in the form of electricity, gas, fuel, oil or steam. Using that information, it is
also possible to list how the energy was used according to the various processes in a
plant or at the various outlets in a building. The next step in an energy audit then is to
identity the potential for ener&>y savings accurately".
According to Albert a11d William (2008), energy audit is defined as a process to
evaluate where a building or plant uses energy, and identifY opportunities to reduce
consumption [5]. They also state that they are many types of energy audits. The most
common ones are:
a) Levell: Walk-through or preliminary audit
The simplest and quickest type of audit which involves minimal interviews
with site operating personnel, a brief review of facility utility bills and other
operating data, and a short on-site visit to identity area where simple and
ine:>.lJCnsive energy conservation measures can he taken. Basically, only
major problem areas will be uncovered. Corrective measures are briefly
described and quick estimares of implementation cost, potential operating
cost savings, and simple payback periods are provided. Includes an evaluation
of energy consumption data to analyze energy use patterns and provide
comparisons to industry benchmarks for similar facilities.
3

b) Level2: Standard or general audit
A comprehensive energy analysis that expands on the preliminary audit
described above by collecting more detailed information about fucility
operation and performing a more detailed evaluation of energy conservation
measures identified. Utility bills are collected for a 12 to 36 month period to
allow the auditor to evaluate the facility's energy/demand rate structures, and
energy usage profiles. Additional metering of specific energy-.:oosuming
systems is often performed to supplement utility data and to quantifY energy
use and efficiency of various systems. In-depth interviews with facility
operating personnel are conducted to provide a better understanding of major
energy consuming systems as well as insight into variations in daily and
annual energy consumption and demand. It also .includes the development of
a baseline for energy use and evaluation of energy savings and cost
effectiveness of appropriate energy conservation measures.
c) Level3: Detailed or investment-grade audit
The most comprehensive and time consuming audit that expands on the
general audit described above by providing a dynamic model of energy use
characteristics of both the existing facility and all energy conservation
measures identified. It includes the use of instruments to measure energy use,
sophisticated computer simulation programs and more rigorous economical
evaluation of energy conservation measures
2. SEWAGETREATMENTPLANT
According to IWK (20 11 ), their sewage treatment methods consist of [ 6]:
l. Physical unit operation: use applications of physical forces e.g. screening
2. Chemical unit process: involves addition of chemicals or by chemical
reactions e.g. disintection
3. Biological unit processes: involves biological activity e.g. oxidation pond
4

Figure 2.1 below shows the general sewage treatment flow in an STP.
Figure 2.1 Typical IWK sewerage treatment plant
Figure 2.2 below shows the Science Applications International Corporation (2006)
study results for energy consumptions average of activated sludge wastewater
treatment plant [7].
---'9 14.J'II.
Figure 2.2 Electricity requirements for activated sludge wastewater
This is used as an industry benchmark for identifying large energy users. From the
figure, the largest energy consumer is aeration. Pumping and anaerobic digestion
should also be given emphasis. Thus, these are the areas that will be targeted and
focused in the audit. For the pumps., Electric Power Research lnstitue ( 1998) points
out that a pump testing can be done by referring the manufacturer's performance
curve to determine its operating point [8]. The flow or differential head across the
pump (the pressure readings at the inlet and outlet) is measured. For a pump, its
selection is important to avoid overdesigning or causing excessive tlow. The ideal
pump design is to allow efficient operation at average flow conditions.
5

CHAPTER3
METHODOWGY
1. Project Activities
For this project, a standard energy audit wilt be perfonned. The speeific activities for
each procedures of the energy andit are listed below.
l) Pre-Site Work: Plant and Utility Data Analysis
• Obtain and review drawings and layouts.
• Collect I year of utility data to identity historical energy use pattern.
2) Site Visit: Walk-Through Survey
• Collect energy consumption data of major energy use equipment.
• The method used is recording the meter panel readings.
• 5 .readings at an .interval of I hour each will be taken.
• The pressure readings of the sewage lift pumps will also be taken from
the pressure gauges using the same steps.
3) Post-Site Work:
i) Baseline for Plant Energy Use
• Develop an energy use distribution.
• Develop a baseline model for plant energy use.
ii) Evaluation of Energy Savings Measures
• Evaluate the energy use pattern, distribution and cause of energy loss.
• Evaluate the cost-effectiveness of energy conservation measures using an
economical analysis method.
6

2. Key Milestones
Figure 3.1 below shows the key milestones for FYP I.
No Dflaii/Wtek 5 6 7 8 9 10 11 12 13 1 5eleetlon of ProJect Topic
2 Preliminary Research Work
3 Submission of Preliminary Report I
4 Project Work: I Walk·through Audit (UTP STP) ...
~~ 5 Sumlssion of Progress Report
....§... Seminar
7 PrOJect Work: i. Standard Energy Audit (IWK STP) Building and utility Data Analysis Walk-through Sur.ey Baseline for Building Energy Use
I I 8 Submission of Interim Report Final Drat\
I I 9 Oral Presentation During studY week I
Figure 3.1 FYP I Gantt chart
7
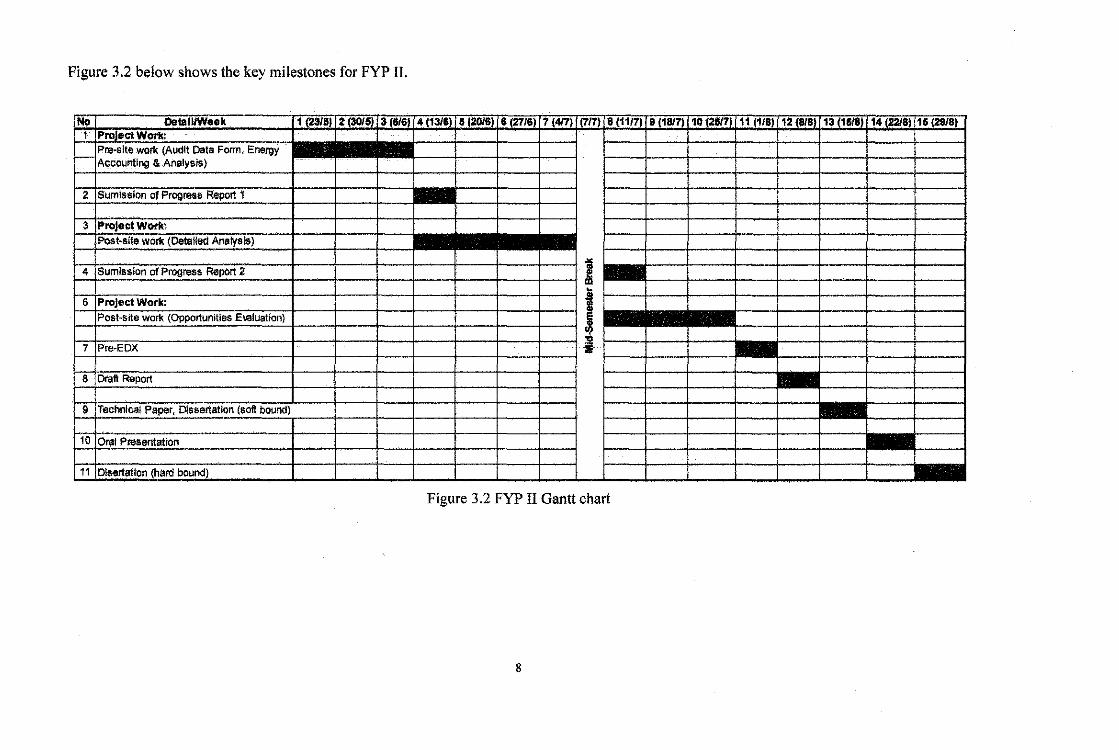
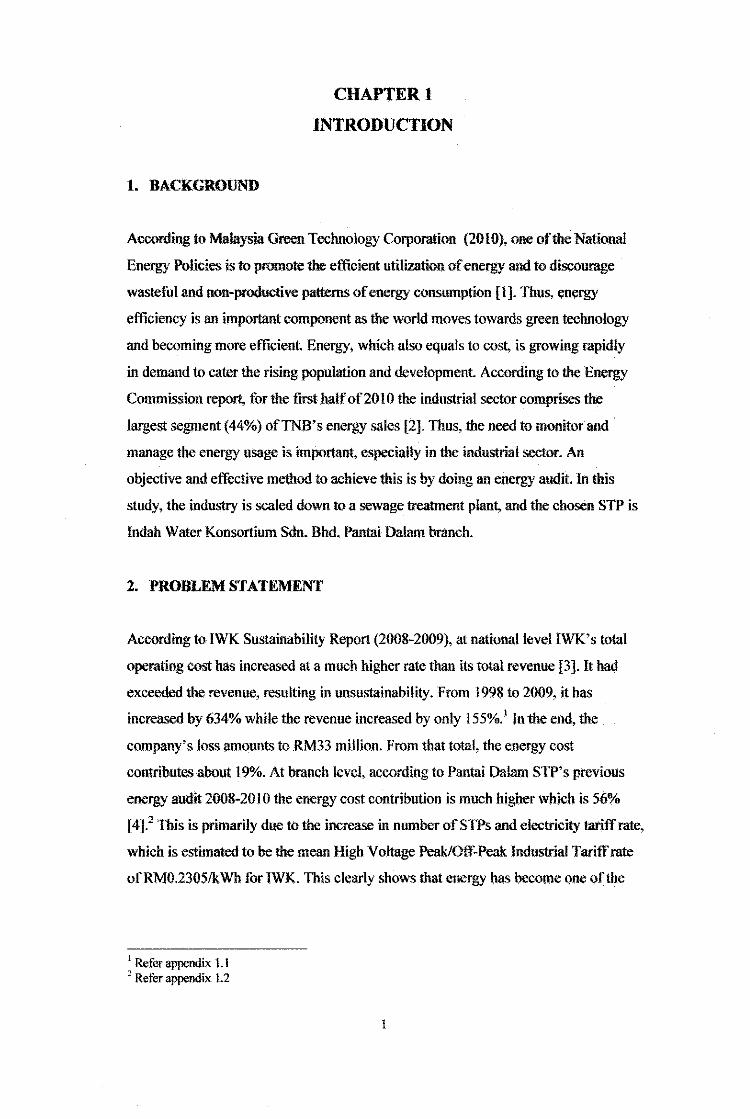
Figure 3.2 below shows the key milestones for FYP II.
No DetaiUWeek 11 123/&IIZ 130/51• a t&/61 4 (13/&l 5 (2016) 6 2716) 7 (417) {7n) 8 {11/7) 9 (1817) 10 {26/7 11 (1/8 12 18181 13 1818 14 12218) 16 {29/8) 1 PraectWork: ~
r- Pre·slt~ work (Audit Data Form, Energy .. Accounting & Analysis) ·
2 Sumlssion of Progress Report 1 ~ 3 Project Work: ........... Post·site work (Detailed Analysis)
4 Sumisslon of Progress Report 2 ~~ 6 Project Work: I Post·site work (Opportunities Evaluation)
"l 7 P..,.EDX j I
8 Draft Report
9 Technical Paper, Dissertation (soft bound)
10 Drel Presentation
11 Disertatlon (hard bound)
Figure 3.2 FYP II Gantt chart
8

CHAPTER4
RESULTS AND DISCUSSION
1. Plaat aud Utility Data Analysis
1.1 Plant Analysis
Figure 4.1 below shows the location of the STP which is situated at the Pantai Dalam
district in Kuala Lumpur.
Figure 4.1 Map location
According to the staffs, the Pantai Dalam STP covers most of the areas in Kuala
Lumpur. Bernama reported that in 20 I 0 it had undergone a capacity upgrading
process to handle sewerage treatment for a population of 1.8 million people from just
approximately 900,000 people, nearly double the amount. This is to cater the rapid
population increase. The service area sewage which is a series of ponds is collected
and conveyed to the Pantai Dalam STP at the opposite side across the highway
through the pump station. The effluent is lastl) discharged to the Klang River. Figure
4.2 below shows the Pantai Dalam plant overview which comprises of administration
buildings and process buildings.

l r-
1\i =: ~:
16
I= -
il:l li
?'?'
• p.
:n I">
II .. I">
::u!:.. ~ G) .... .E
;"•
~~ -Ci.J t':' a.. w n l~o-~~~ 1::
'o ~
~~ \ .....
.t..
•) r ' 0..
I .. \ •tJ
''·~~ m
G)
> 0 .... c ~ 0
~ -N «i e :s .~ ~
., = ~~ ~~
~ m ~ ~

Previously it used the pond as an oxidation pond but now it had been replaced with
various technologies to ensure a more efficient process. The new pump station (I)
replaces the old one (2). The staffs there explained that the peak operation time is at
11.00 a.m. The discharge process is around 9.00 a.m. thus it takes the waste about 2
hours to arrive at the plant. The whole process takes about a total of 12 hours. Figure
4.3 below shows the process overview.
II
~ Q) .E Q) ;> 0 Vl Vl Q) 0 M 0 -... (l.
("")
~ Q) ... :::! eo ti:

The fii'St main process is the pump station (I) where sewage enters here from 2800
rnrn diameter of trunk sewer and it is stored and transferred to the distribution well
before it flows to the grit chamber (2) and existing plant by the lift pumps. The role
of the grit chamber is to remove grit contained in sewage to avoid damaging
subsequent process equipment.
Then it flows to the primary clarifiers (3) which clariflel" and remove small, light
particles, suspended solids (SS) and biochemical o:r.:ygen demand (BOD) from
sewage which passes through while maintaining horizontal velocities below the
scouring velocity and to reduce treatment load from subsequent biological treatment
facilities.
Next is the aeration tank (4) which has staged aeration process is to remove BOD, SS
and nitrogen is employed. The mixed liquor from the aeration tank then enters the
secondary clarifier (5) which clarifies the activated sludge and the treated water.
The gravity thickener ( 6) utilizes gravity force to separate water from sludge. Next is
the digester (7) which purpose is to further stabilize the thickened sludge coming
from the mechanical thickener (8) and gravity thickener which is stored in thickened
sludge holding tank (9) in anaerobic condition. Finally is the tanker sludge facility
(lO) which receives tanker sludge from domestic desludging.
1.2 Utility Data Analysis
Table 4.1 below shows the Pantai Dalam STP utility data for 1 year.
13

Table 4.1 Utility data
Monti! Inflow {m3) Energy consumption (kWh) Beclricity cost(RM)
Jan '10 1,813,330 1,294,982.40 385,616.88 Feb '10 1,671,520 1,181,061.28 367,540.49 Mar'10 1,945,250 1,348,293.44 387,242.89 Apr'10 1,792,<160 1,324,927.15 379,443.40 May'10 1,724,300 1,311,279.97 378,016.15 Jun'10 1,944,930 1,228,972.56 379,322.22 Jul '10 2,484,630 1 ,550,517. 70 379,321.40 Aug'10 2,188,640 1,542,878.37 445,626.80 Mar'11 2,306,400 1,600,232.09 328,068.70 Apr'11 2,146,750 1,589,231.10 399,132.30 May'11 1,918,730 1,224,368.56 396,088.80 Jun '11 2,153,750 1,334,512.80 365,484.00 Average 2,007,558 1,3n,&04.79 382,515.34
Total 24,090,690 16,531,257.42 4,590,904.03
Four months of energy consumption data (September ' I 0 - February 'II) was not
available due to SCAD A server breakdown. The average flow is about 2 million
m3 /month, average energy consumption is about 1.4 GWhlmonth and electricity cost
is about RM380,000/month. The observation that several higher energy consumption
yields a lower cost is most probably due to most of its operations are running during
off-peak period which results in a lower tariff.
2. Walk-through Survey
Table 4.2 below shows the power consumption data for each facility.
Table 4.2 Power consumption data3
Facility Total average Total energy
power(kW) (kWh/day) Sewage lift pump 456 10954 Blower 351 8418 Clarifier & aeration tank 13(] 3120 Grit chamber 5 132 Utility water 18 420 Sludge thickener 32 775 Sludge digestion 15 369 Digested sludge dewatering 28 669 Tanker sludge dewatering 2 49
Total 1038 24905
3 Refer appendix 4.1 for full data
14

The highest power consumer is the pump, followed by the blower. clarifier and
aeration tank. The values differ from the previous energy audit4 as the previous one
was fully taken with the SENTRON PAC3200 Power Meters (as shown in Figure 4.4
below) and data loggers, thus are actually more accurate. However, they were not
available this time, thus an alternative method bad to be used. The daily fluctuations
and non--continuous readings also caused tbe differences. However, it can still be
used as a reference, and some of the readings were quite similar too such as the grit
chamber. The different facility categories are also according to the meter panel labels,
while the previous audit used different ones. The meter panels also did not
distinguish the clarifier and aeration tank process, thus the combined total fur both
processes was taken. The blowers are separated even though it is also a part of the
aeration process. This actually shows that the blower is the main energy consumer in
the process.
Figure 4.4 SENTRON PAC3200 Power Meter
3. Baseline for Plant Energy Use
Figure 4.5 below shows an overall energy baseline for electric energy use and cost
per cubic meter of influent treated for the l2 month period.
4 Refer to appendix 4.2
15

0.80 --- - - ---0.10 • • .__.
·~ 0 .60 .... _
0 .50 ----0.40
0.30
U.lU
0.10
0.00 --..... ---r--- T T - T
Jan Feb Mar Apr May Jun Jul'lO Aug Mar Apr Way Jun '10 '10 '10 '10 '13 '10 '10 '11 '11 ·:1 '11
Month
-.-kWh/m3 -e- RM/m3
Figure 4.5 Energy consumption and electricity cost per cubic meter of influent
Here the trend is the consumption k Wh/m3 increases in the middle of the year in
April '1 0 then decre,ases in June '1 0. It increases again in August '1 0 and decreases
again in May ' 11. The average energy consumption per cubic meter from August ' J 0
to June' 11 is 0.68 kWh/m3. Comparing this to the previous energy audir which
averaged 0.72 kWh/m3, it is 5.6% lower. Thus the previous goal of a 10% reduction
or 0.64 kWh/m3 was still not fully achieved but already balf-way there. Therefore,
the need to further monitor and push efforts in achieving it is required. On the other
hand, the cost RM/m3 shows a quite similar fluctuation but in a smaller scale and
generally more stable, which is again most probably due to the increase mostly
happening during off-peak periods as it did not largely affect the cost. Figure 4.6
below shows the energy use distribution.
s Refer lo appendix 4.3

Clarifier & aeration tank
13%
Figure 4.6 Energy use distribution
The highest energy consumer is the sewage lift pump and blower. Although the %
is quite different than the SAJC study, it is still quite the same in tenns of the
major energy consumers. The% is however quite similar and consistent with the
previous energy audit6 results. Thus, it confirms the major eneTg)' users of the
plant. It also shows that the manual readings are still reliable to be used as a
reference.
4. Evaluation of Energy Savings Measures
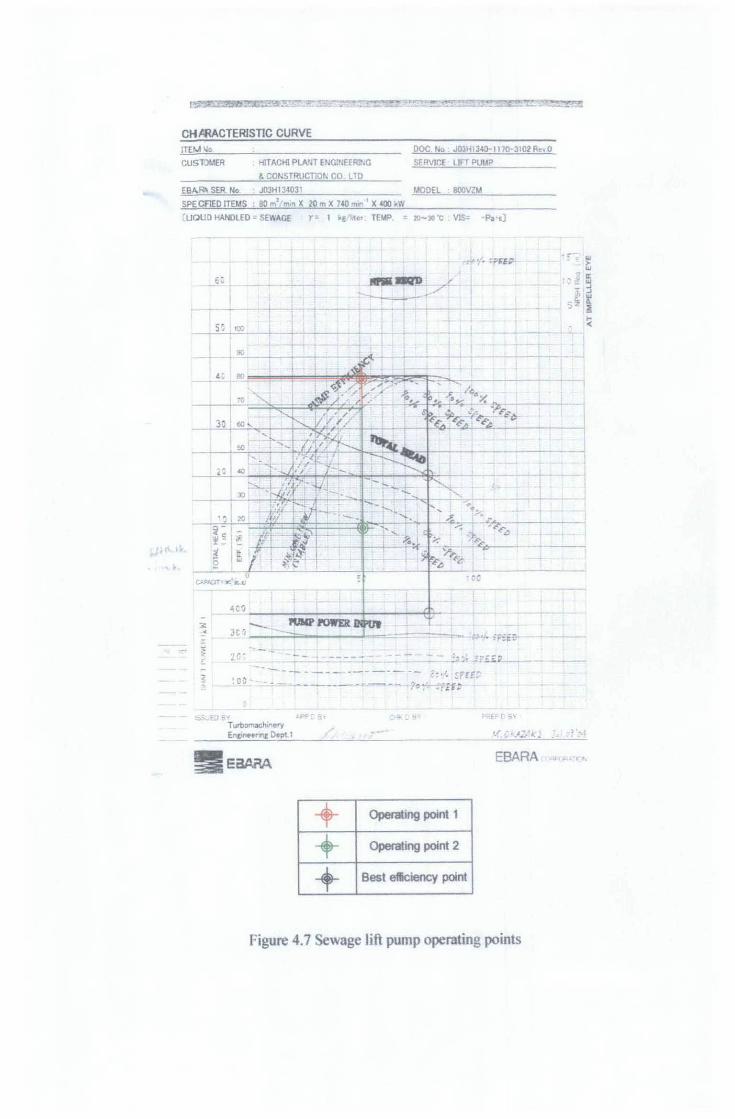
As the pump is identified as the hjghest power consumer. it is further evaluated.
Figure 4. 7 shows the operating points of the pumps on the characteristic curve.
6 Refer to appendix 4.2
17
• k
CH~CTERISTIC CURVE ITEMIJo
CUSlJMER ; HITACHI PLANl ENGINEERING
DOC. No J03H1340-1176-3102 Ra,O
SERVICE· liFT PUMP
& CONSTRIJCTIOJI. CO. L TO
ESA.R\ SER No. · JOJH134031 MODEL . 800VZM
SPE Cf!ED ITEMS : 80 m' I""" X 20 m X 740 mm"' X 400 kW
(UQUD HANDLED = SEWAGE r = 1 kgtl,te• • TEMP 20-30 'C VIS= -Pa ·s)
T
- + ----- ---------·- -- ~ ... ~ tF!E: I C;) ··- .!-~-:...-.---------~--- .. ;;~~--· -=i·EfC
t~ .. r1::• ·.~:e:t Turl:>.,...,hiner"i Encint!enng Dept 1 t:
EBARA. ,,...,..-n.
+ Operating point 1
+ Operating point 2
+ Best efficiency point
Figure 4. 7 Sewage lift pump operating points
From the analysis7, it is identified that the pumps are only running at 69% efficiency.
Thus, it is quite far from the best efficiency point8 which is 82%. Thus it is identified
that the pump bas a potential maximum energy savings of34,815 kWiallDoath or
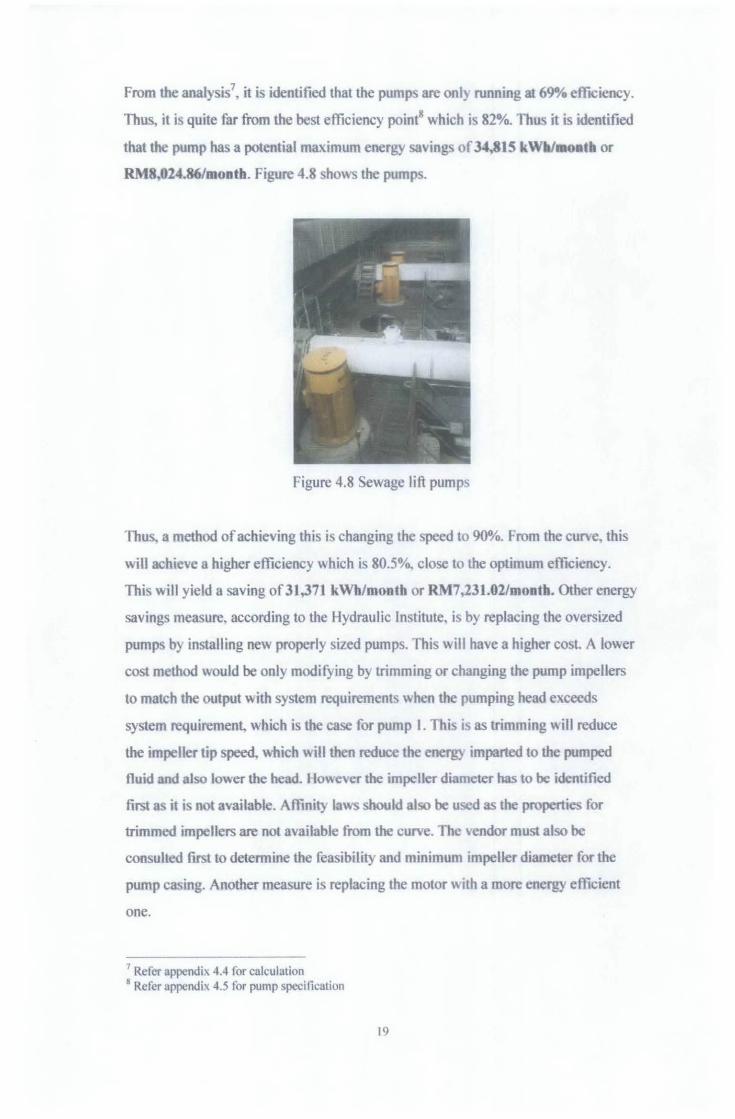
RM8,024.86/montb. Figure 4.8 shows the pumps.
Figure 4.8 Sewage lift pumps
Thus, a method of achieving this is changing the speed to 90%. From the curve, this
will achieve a higher efficiency which is 80.5%, close to the optimum efficiency.
This will yield a saving of31,371 kWh/month or RM7,231.02/montb. Other energy
savings measure, according to the Hydraulic Institute, is by replacing the oversized
pumps by installing new properly sized pumps. This will have a higher cost. A lower
cost method would be only modifying by trimming or changing the pump impellers
to match the output with system requirements when the pumping head exceeds
system requirement, which is the case for pump I. This is as trimming will reduce
the impeller tip s~ which will then reduce the energy imparted to the pumped
fluid and also lower the head. However the impeller diameter has to be identified
first as it is not available. Affinity laws should also be used as the properties for
trimmed impellers are not available from the curve. The vendor must also be
consulted first to determine the feasibility and minimum impeller diameter for the
pump casing. Another measure is replacing the motor with a more energy efficient
one.
7 Refer appendix 4.4 for calculation 8 Refer appendix 4.5 for pump specification
19
CHAPTERS
CONCLUSION AND RECOMMENDATIONS
1. Conclusion
The result indentifies that the largest energy user is the sewage lift pumps at the
pump station. This is followed by the blowers, clarifiers and aeration tank. This also
concurs with the previous energy audit results. Thus, energy saving measure should
focus on those areas.
Besides that, it also identifies that the previous energy audit's goal for a 10%
reduction or 0.64 kWh/m3 was still not fully achieved but already half-way there.
Thus, further initiatives and monitoring is required.
Finally, the sewage lift pump analysis identified that it is operating inefficiently. This
is the main cause for its energy loss. It is indicated that the pump has a potential
maximum energy savings of34,815 kWh/month or RM8,024.86/montb. Energy
savings measures to achieve this is changing the speed to 90%, which will increase
its efficiency to 80.5% and yield a saving of 31,371 kWh/month or
RM7 ,231.02/mooth. Others include installing new properly sized pumps, changing
the pump impellers and replacing the motor.
2. Recommendations
Future project work recommended is conducting tertiary level audit for further
monitoring and analysis. This is to ensure the previous energy audit goal is achieved
and for further steps to increase the efficiency of sewage lift pump and other major
areas.
20
REFERENCES
l. Malaysia Green Technology Corporation Official Site, 2010,
http://www.greentechmalaysia.my/
2. Energy Commission, Interim Report on the Pelformance of the Electricity
Supply Services in Malaysia for the First Half Year of 20 I 0
3. IWK Sustainability Report 2008-2009, Towards Green Agenda
4. Pantai Dalam Energy Cost Saving Continuous Improvement Project
5. Albert T. & William J. Y. 2008, Handbook of Energy Audits, U.S.A., The
Fairmont Press, Inc
6. Indah Water Konsortium Sdn. Bhd. Official Site, 2011,
http://www .iwk.com.my/index.htm
7. Water and Wastewater Energy Best Practice Guidebook, Science
Applications International Corporation (SAIC), 2006
8. EPRI, Energy Audit Manual for Water/Wastewater Facilities, 1999
9. Energy Assessment Report for County of Hawaii Hilo Wastewater Treatment
Plant, U.S. Environmental Protection Agency Region, April 14 2010
21

APPENDICES
Appendix l.J JWK Revenue and Cost Structure Chart
Year 1998 Year 2009 100 ---- -·- --------·--1-·-----Cosl-·-·----... ---
! (IIM723d)
700 ---~- l
'
~ -------------
I i 400 -------------------- f·-·•· i ! c !
300 -·-- --------------·+~-. llevw'IJe !
(IIM114 ml) ; 200 -- -- -----t't----- -·-·+- ••
Cost ! (IIM103ml)
0
COST • ~c.. • Oo:p doll IIIIVEN!J! •s..age•-L-__ • __ :--' __ .,_ .. _ .... ______ • __ ..... ___ ..,... ____ __J == . O!Mr--
22

Appendix 1.2 Previous energy audit: Pantai Dalam major expenses 2008-20 I 0
Data Sludge Disposal Energy Consumption Polymer Consumption Water Consumption Administration Cost Labour Cost M&E Maintenance/Repairs Solid Waste Disposal Security
labour Cost 8%
Polymer Consumption
6%
23
RM 140,400 375.000 42,000
885 25,932 56,300 15,000 5,000 16,000
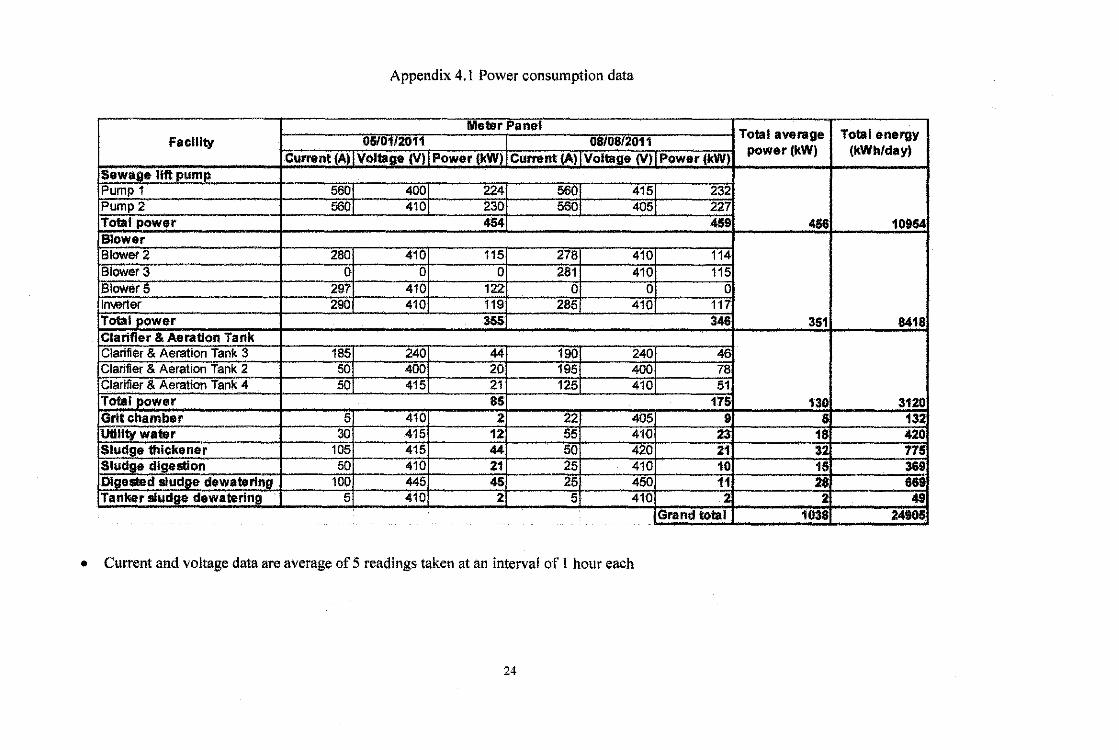
Appendix 4.1 Power consumption data
Meter Panel Total average Total energy
Facility 0510112011 I 0810812011 Current (A) I Voltage (VII Power (kW) I Currant (A) Voltage (V)I Power (kW
power(kW) (kWh/day)
Sawage lift pump Pump 1 5601 4001 224 560 415 232 Pump2 5601 4101 230 5601 4051 227 Total power 454 459 456 10954 Blower Blower2 280 410 115 278 410 114 Blower3 0 0 0 281 410 115 .Blower 5 297 410 122 0 0 0 lnwrter 290 410 119 285 410 117 Total power 355 346 351 8418 Clarifier & Aeration Tank Clarifier & Aeration Tank 3 185 240 44 190 240 46 Clarifier & Aeration Tank 2 50 400 20 195 400 78 Clarifier & Aeration Tank 4 50 415 21 125 410 51 Total power 85 175 130 3120 Grit chamber 5 410 2 22 405 9 5 132 utility water 30 415 12 55 410 23 18 420 Sludge thickener 105 415 44 50 420 21 32 775 Sludge digestion 50 410 21 25 410 10 it 369 Digested sludge dewatering 100 445 45 25 450 11 669 Tanker sludge dewatering 5 410 2 5 410 2 2 49
~dtotal 1038 ~--- 2_490_!
--~--·-------
• Current and voltage data are average of 5 readings taken at an interval of 1 hour each
24

Appendix 42 Previous energy audit Pantai Dalam power consumption data and
energy use distribution 2008-2010
Facility
Aeration Tank Pump Station Secondary Clarffier Mechanical & GrcMty Thickener Dewatering Digester Primary Clarifier Tanker Sludge Grit Chamber Measuring Tank Odour Scrubber
Secondary Clarifier
6%
Total
25
Total energy (kWh/day)
21,453.00 19,600.00
2,941.40 1,829.28 1,110.75
737.00 486.28 360.00 120.88 105.60 96.00
48,840.18

Appendix 4.3 Previous energy audit: Pantai Dalam energy consumption per cubic
meter of influent and project objective
- :.oo ,----·--·-----·-----~·-·~--~~~~~--··------·-~ .. ----~--"~~1
-~~------ ---·---~-· ------·~ I i
11 0.90 i ~~--==-=+
' ~:~~ l;A ·-~~~~~ • ., I a. 0.50 -r--·----·~--~--~--------------~--.---~-------.----~ E . ::s 0.40 --j~------·~-----------------------------------------
~ 0.30 +---- -------~-----------------;! O.LU -[ -----------~--------------------·--- i b 0.10 j __
c: ... 0.00 +---~-------- ~--·-~·----·
uo "' uo uo w "' "' "' "' "' Uo 0 0 0 0 '? 9 :1 9 '? 0 9 9 :1 9 9 7 7 - 1 " ·;;;:; 0.
, c u '0 0. , c u 'ijj
" ~ 0 ~ "' ~ 0 ~ " ~
:;;; 2: ~ '"' z 2 2: ~
" z 2 2: ~
V> V>
Month _j
Project objective:
To optimize energy consumption while maintaining full compliance with EQA
requirement through PDCA cycle approach
Goal setting:
To reduce energy power consumption per cubic meter of influent by 10% from
current usage by December 2009
Before projec.t started=> 0.72 kWhlm3
Target to reduce by 10% => 0.64 kWh/m3

Appendix 4.4 Calculation for Sewage Lift Pump Operating Points
Pressure (kPa) Sewage lift pump
01107/2011 15107/2011 0810812011 Average Pump 1 400 390 395 395 Pump2 90 90 90 90
• Pressure data are average of 5 readings taken at an interval of I hour each
Average raw sewage specific gravity, SGavg ~ 1-1.02
Head, H
H1 ~40.3 m
H2:9.2m
P(bar)X10.2
SGsewage
3.95X10.2 0.9x10.2
1 1
Average flowrate, Oavg 2,199,817m3 month day h -'---'---X--X- X--
month 30days 24h 60min
= 50.9 m3/min
Thus, at l 00% speed the efficiency ( 11) is,
1Ja ~69%
1J0 = 82%
kW;n =305kW
Savings
Where Savings
kW;n
t
1/a
1/o
= kW;n X t X (1 -TJa11Jo)
= energy savings (kWh/month)
= input electrical energy (k W)
= monthly operating hours
=actual system efficiency, calculated from field measurements
= optimal system efficiency
27
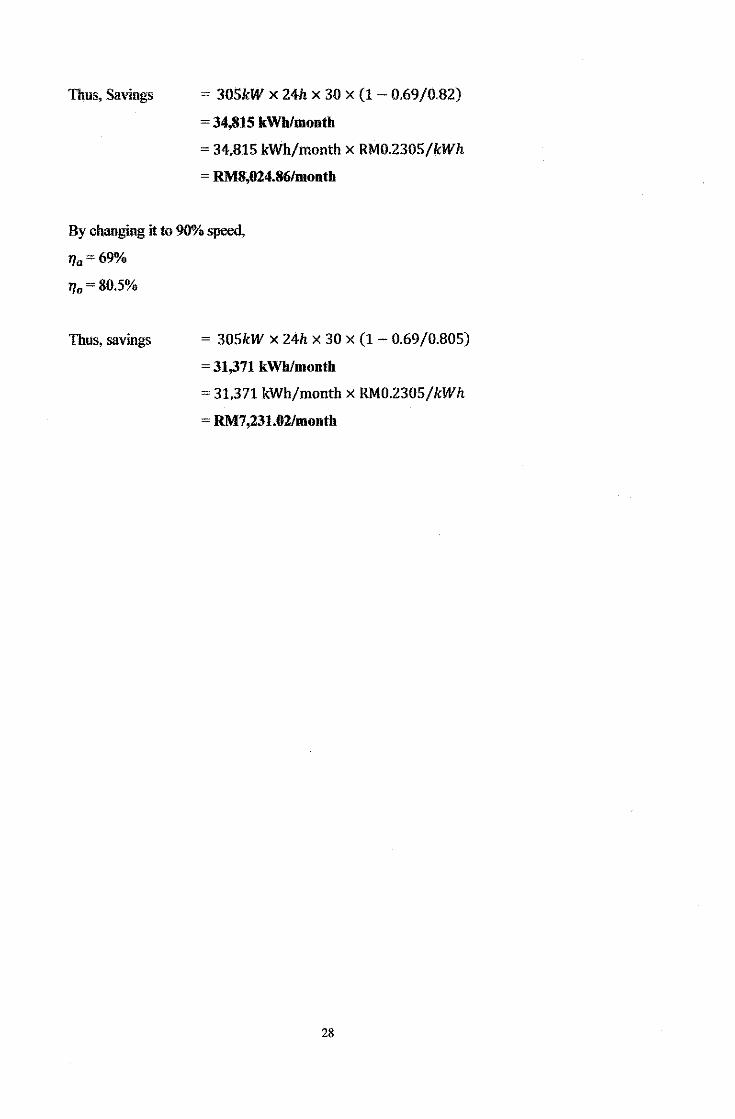
Thus, Savings = 305kW X 24h X 30 X (1- 0.69/0.82)
= 34,815 kWh/month
= 34,815 kWh/month x RM0.2305/kWh
= RM8,024.86/month
By changing it to 90% speed,
1/a = 69"/o
1/0 = 80.5%
Thus, savings = 305kW X 24h X 30 X {1- 0.69/0.805)
= 31,371 kWh/month
= 31,371 kWh/month x RM0.2305/kWh
= RM7,231.02/montb
28

Appendix 4.5 Pump specification
Equ~ntNIII11l Contact Specbton (CS)
(TenderS n) Sewage litPulllJ lemno. M1-007-1
Equ~ntnane Sewage Lilt PulllJ PulllJ1ype Vertcal Shalt Mixed Flow PulllJ PulllJ bore dianeer Dia.800mm Discharge bN 80m3/nin Tolalhead 20m
Mcmr~ 400kW PUlllJ ebncy Min.80% Drivilg mellod Electic rmbr Operalon Aubrnafl: operaion will pulllJ
well level and manual swithing Arrangement One-loor type Coklmn lengfl 10.4m
(between pulllJ base and sucion end) No. ofinl!rmediale bearing 3 Mobrlfpe 3-phase squirrel cage inducion ll!Jbr Mom o!Jllut 400kW Mollr eiciency Min. 92% atraild load Power supply 415Vx50Hzx3phase No. of poles SP Starting mellod Sollslar1!r COlllJiefon dail Sepember, 2007 Manulachlrer Ebara Corporaion
29