energy audit of higgins laboratory · this project consisted of performing an energy audit of...
TRANSCRIPT

1
Energy Audit of Higgins Laboratory
April 28, 2009
Mark Dupuis
Brandon Habin
David Cancel
Advisors
Head of Electrical and Computer Engineering ~ AK 203
Fred J Looft
&
Assistant Professor of Interdisciplinary & Global Studies Division ~ Project Center 2nd
Floor
J. Scott Jiusto
2
Abstract
This project consisted of performing an energy audit of Higgins Laboratory in order to
address current electric consumption, and provide suggestions towards reducing future electric
waste. At the conclusion of the audit, it was decided the first key step that needs to be taken is to
develop an ongoing relationship with National Grid, in order to begin taking advantage of their
incentive and payback programs for renovations and audits. All the incandescent bulbs should be
replaced with LEDs and lighting levels across the building reduced. Occupancy sensors should
be installed in all major rooms, and all computer control units should be equipped with a true
shutoff mechanism. Conservative estimates on payback periods for the shutoff mechanism is
under 5 months, and for the LEDs is 2 months.

3
Acknowledgments
We would like to thank the following individuals for their invaluable aid. They helped to
answer questions, keep us focused, and motivate us to achieve the full potential this project was
capable of. Without these people the project would not have been possible.
Fred J. Looft
J. Scott Jiusto
Marylou G. Horanzy
Lawrence B. Riley
Christopher L. Salter
Robert A. Brown
Michael C. Lane
Gloria Boudreau
Charles J. Kornik
Norman F Hutchins
Brian D. Wilson
Comfy Chairs in Higgins Laboratory!

4
Table of Contents
Abstract .......................................................................................................................................... 2
Acknowledgments ......................................................................................................................... 3
Chapter 1 Executive Summary .................................................................................................. 7
1.1 Introduction ...................................................................................................................... 7
1.2 Background ...................................................................................................................... 7
1.3 Project Statement ............................................................................................................. 8
1.4 Methods............................................................................................................................ 9
1.5 Recommendations .......................................................................................................... 11
Chapter 2 Background ............................................................................................................. 15
2.1 Intro ................................................................................................................................ 15
2.2 United States Energy Use History ................................................................................. 15
2.3 Creating Sustainable, Energy Efficient, Green Buildings ............................................. 17
2.4 WPI History and Background ........................................................................................ 19
2.5 Demographics ................................................................................................................ 23
2.6 Higgins Demographics and Background ....................................................................... 24
2.7 Previous Energy Project ................................................................................................. 25
2.8 Energy Audit .................................................................................................................. 25
2.9 Heating, Ventilation, Air Conditioning ......................................................................... 27
2.10 Lighting .......................................................................................................................... 30
2.11 Federal and State Laws .................................................................................................. 31
2.12 Computers ...................................................................................................................... 32
2.13 Understanding the National Grid and Direct Energy Bills and Charges ....................... 33
2.14 Summary ........................................................................................................................ 36
Chapter 3 Methodology ........................................................................................................... 37
3.1 Introduction .................................................................................................................... 37
3.2 Step One: Utility and Building Data Analysis ............................................................... 37

5
3.3 The Walkthrough ........................................................................................................... 37
3.4 Higgins Baseline Energy Use ........................................................................................ 38
3.5 Determining Results and Conclusions ........................................................................... 38
Chapter 4 Results ..................................................................................................................... 39
4.1 Results Introduction ....................................................................................................... 39
4.2 Layout of Higgins Labs ................................................................................................. 39
4.3 Case Study Introduction ................................................................................................. 39
4.4 Office Room 250............................................................................................................ 40
4.5 Auditorium Room 218 ................................................................................................... 43
4.6 Classroom Room 114 ..................................................................................................... 46
4.7 Conference Room 201 ................................................................................................... 49
4.8 Conference Room 102 ................................................................................................... 50
4.9 Computer Lab Room 230............................................................................................... 52
4.10 Controls Lab Room 248 ................................................................................................. 55
4.11 Bathroom Room 118 ...................................................................................................... 56
4.12 Hallways Rooms 156-158 .............................................................................................. 57
4.13 Meter Readings .............................................................................................................. 58
4.14 WPI Electricity Use/Cost Profile ................................................................................... 58
4.15 Higgins Laboratory HVAC ............................................................................................ 60
4.16 Higgins Laboratories ...................................................................................................... 62
4.17 A day in the Life of Higgins Laboratories ..................................................................... 63
Chapter 5 Analysis................................................................................................................... 64
5.1 Introduction .................................................................................................................... 64
5.2 Office Room 250............................................................................................................ 64
5.3 Auditorium room 218 .................................................................................................... 65
5.4 Classroom 114 ............................................................................................................... 66
5.5 Conference Room 201 ................................................................................................... 67
5.6 Conference Room 102 ................................................................................................... 68
6
5.7 Computer Lab Room 230............................................................................................... 69
5.8 Controls Lab Room 248 ................................................................................................. 70
5.9 Bathroom Room 118 ...................................................................................................... 71
5.10 Hallways Rooms 156-158 .............................................................................................. 72
5.11 Higgins Labs Meter Readings ........................................................................................ 73
5.12 CCU and Computer Analysis......................................................................................... 73
5.13 National Grid Incentive Programs ................................................................................. 74
5.14 Actual Cost of Electricity............................................................................................... 75
5.15 HVAC Analysis ............................................................................................................. 76
Chapter 6 Conclusions and Suggestions .................................................................................. 78
6.1 Introduction .................................................................................................................... 78
6.2 Lighting Suggestions ..................................................................................................... 78
6.3 Computer Suggestions ................................................................................................... 79
6.4 CCU and Projector Suggestion ...................................................................................... 80
6.5 National Grid Relationship ............................................................................................ 81
6.6 HVAC Conclusions ....................................................................................................... 82
Works Cited……………………………………………………………………………………..83
Appendices ……………………………………………………………………………………...85
Appendix A ……………………………………………………………………………………..85
Appendix B ……………………………………………………………………………………..89
Appendix C ……………………………………………………………………………………..97
Appendix D ……………………………………………………………………………………..98
Appendix E …………………………………………………………………………………….105
Appendix F …………………………………………………………………………………….107
Appendix G …………………………………………………………………………………….107
Appendix H …………………………………………………………………………………….110
Appendix I ……………………………………………………………………………………..115
Appendix J ……………………………………………………………………………………..119
Appendix K …………………………………………………………………………………….137
Appendix L …………………………………………………………………………………….143
Appendix M ……………………………………………………………………………………162

7
Chapter 1 Executive Summary
1.1 Introduction
Energy consumption has become a growing concern for many institutions including
Worcester Polytechnic Institute (WPI). The campus has already taken several steps towards
reducing its electricity use and becoming a more ―greener‖ campus. These steps are evident in
the construction of the new buildings: East Hall and The Bartlett Center. East Hall, the newest
residence hall recently constructed, was aimed to achieve Leadership in Energy and
Environmental Design (LEED) silver certification, a step above basic LEED certification which
certifies a certain level of environmental sustainability. The Bartlett Center, which is registered
with the U. S. Green Building Council, uses innovative architectural methods to reduce the load
on its lighting and air-conditioning systems. Also, the Sustainability Taskforce, which is
comprised of students, faculty, and staff appointed directly by the president of WPI, has
launched the availability of Zipcars for faculty, staff, and students, and has equipped the Alumni
Field with three large solar powered LED path lights. While this group continues their efforts to
monitor, reduce cost, and reduce energy usage at WPI, there is however, much more room to
improve the environmental impact of the already present buildings. WPI is a leading technical
institution, and as such, should serve as an example for integrating technology with
environmental responsibility by tracking its electricity use.
1.2 Background
In the past, there have been a number of groups that have done their Interactive
Qualifying Projects (IQP‘s) focusing on energy issues. A group in 2007 performed a project on
―Monitoring Electricity Consumption on the WPI Campus‖ which covers similar topics to what
is being proposed in this paper. The report, which was prepared for the Plant Services
Department at WPI, evaluated the present status of WPI‘s electricity monitoring system on a
building-by-building basis. It included a comprehensive report of the electricity meter
functionality for several dormitories and academic buildings and also presented a short and long-
term plan to improve the school‘s ability to monitor its electricity consumption. Their project
idea never came to full fruition and it was concluded that many of the meters were not
functioning properly, and until they were repaired, a breakdown of percent electrical usage by
each building was not possible. Unfortunately for them (and us), there was no single point-source
for information on WPI‘s present electricity metering system and there was ambiguity among the
administration about which meters were working, what they were recording, and for what
buildings they provided data for. Furthermore, no analysis of electricity usage data to observe

8
any emerging trends has been done, so they had to start from scratch. Currently, there is no plan
to install up-to-date energy monitoring systems, but it is necessary to install such systems in at
least all of WPI‘s main facilities in order to track WPI‘s electricity consumption and identify
unnecessary expenditure.
1.3 Project Statement
Unlike the project of 2007, which studied the electrical consumption of the entire WPI
campus, this project focuses on just one of the buildings: Higgins Laboratories. According to one
of the graphs illustrated in the 2007 project, Higgins Labs is shown to be a main consumer of
electricity, as can be seen in Figure 1.1, which ultimately led to our decision.
Figure 1.1 Average Usage/Day of WPI's Main campus (Mwh/day)
This project built upon some of what the first started and ultimately carried their ideas
further. Given the short 6 week time span for this audit, and knowing that performing a detailed
energy audit for a building as large as Higgins would be a very time consuming and complex
process, it was very important to figure out early on what were the important elements that
needed to be addressed. It was decided that the Heating Ventilation and Air Conditioning
(HVAC) systems, lighting systems, and computing systems were to get the most attention.

9
Ultimately, the energy audit of Higgins Labs broke down the electric consumption of the
building and is shown in Figure 1.2.
Figure 1.2
1.4 Methods
For the analysis of the present HVAC system, the equipment schedule/specifications
schematic was obtained for Higgins Labs. We also met with Norman F. Hutchins, head of the
HVAC systems here at WPI, on more than one occasion. He informed us that during weekdays
the system is turned on at 6 a.m. and is left running until 9 p.m. when it is completely shut off.
During weekends, the system is turned on at 7 a.m. and shut off at 3:30 p.m. and on vacations
and holidays the system is completely off. In the equipment schedule, there were over 80 motors
listed that ran all of the pumps and ventilation systems. The summation of their individual
contributions added up to a total of 1945.34 kWh for a weekday daily power consumption and
1102.36 kWh for a weekend daily power consumption. (Table 1.1).
HVAC39.42%
Flourescent Light Bulbs
18.80%
Computers4.19%
Incandescent Bulbs1.53%
Projectors0.67%
CCUs0.27%
Other35.12%
Higgins Labs Total Electric Consumption by Component

10
Table 1.1 HVAC System Motors and Their Corresponding Power Draws
Quantity HP
Voltage
Req. Instantaneous Weekday Run Weekend Run Weekday Daily Weekend Daily
(V) Power Draw (kW) Time (hr) Time (hr)
Power Draw
(kWh) Power Draw (kWh)
8 1/3 120 1.99 15 8.5 29.83 16.90 13 3/4 120 7.27 15 8.5 109.06 61.80
6 1 120 4.47 15 8.5 67.11 38.03
6 1 1/2 120 6.71 15 8.5 100.67 57.05 20 1/4 120 3.73 15 8.5 55.93 31.69
4 2 120 5.97 15 8.5 89.48 50.71 1 2 1/2 120 1.86 15 8.5 27.96 15.85
2 3 120 4.47 15 8.5 67.11 38.03
1 20 120 14.91 15 8.5 223.71 126.77 1 5 120 3.73 15 8.5 55.93 31.69
9 1/6 120 1.12 15 8.5 16.78 9.51
6 1 208 4.47 15 8.5 67.11 38.03 3 7 1/2 208 16.78 15 8.5 251.67 142.62
2 5 208 7.46 15 8.5 111.85 63.38
3 20 208 44.74 15 8.5 671.13 380.31
Total Power
Draw: 129.69 kW 1945.34 kWh 1102.36 kWh
After performing a general energy audit, this project develops an energy profile of the
average class room, lecture hall, office, computer laboratory, and machine shop through several
case studies which focuses primarily on their own individual energy consumption and patterns of
use. A Kill-A-Watt meter was used in order to determine the electrical consumption, in
kilowatts, by each and every device plugged into a 120 volt outlet. Each piece of equipment was
classified based upon its electrical consumption. The CAD drawings of the floor plans for
Higgins Labs were obtained and used to classify each room as an auditorium, standard
classroom, office, computer lab, laboratory, machine shop, conference room, bathroom, hallway,
stairway or closet. For each room, all switches, lights, and any electronics or pieces of equipment
such as computers and projectors were catalogued by number and by electricity consumption.
The intensity of lighting was determined for each room and hallway using a Lux-Meter and
compared to Occupational Safety and Health Administration (OSHA) standards to illustrate over
lit areas. Simultaneously, readings were taken periodically from the main electricity meter in
Higgins‘ basement for a period of 7 days in order to develop a baseline for the electrical use at
Higgins Labs. Additionally, for one day, the electricity meter was monitored every hour on the
hour to develop a profile for ―A Day in the Life of Higgins Labs.‖ This information was
tabulated and used to allocate, with a certain degree of accuracy, the electrical consumption of
the HVAC, lighting, and computer systems in Higgins Labs.

11
WPI uses over 10,000 kWh per month and has a demand of over 200 kW, putting the
campus in the G-3 category of billing rates. WPI currently purchases electricity from National
Grid, who sends an employee to take a meter reading from 183 West Street once a month. The
bills are comprised of a variety of different charges that fluctuate throughout the year. The
individual charges that WPI incurs from National Grid are presented here in this paper in detail
for your convenience and comprehension. This data helps in evaluating where the campus‘
money is going and what exactly is being paid for.
The electricity bills from January 2006 to present for WPI‘s main campus were obtained
from records at the Facilities Department. The information on these electricity bills were put into
an excel spreadsheet to generate tables and graphs reflecting the patterns of electricity usage and
cost for the past three years at WPI as can been seen in Figure 1.3.
Figure 1.3 Average Kilowatt Hours Used Daily
1.5 Recommendations
With the information gathered from the energy audit of Higgins Laboratory, the case
studies, electricity bills, and the HVAC system, these are the key recommendations being made.
They are arranged in decreasing order of importance.
1). An ongoing relationship with National Grid (NG) needs to be developed and their
resources utilized.
2). A full scale professional energy audit should be purchased and performed.
3). Functioning meters should be placed on every building on campus in order to better
utilize the Energy Profiler Online program National Grid offers.
0
10000
20000
30000
40000
50000
60000
KW
H U
sed
Month
Ave Dail KW…
Average Kilowatt Hours Used Daily200820072006 2009

12
4). Replace ALL incandescent bulbs with preferably LED lights, if not, then fluorescent
bulbs.
5). Decrease light levels in most all rooms and halls by 20% and up to 70% or more in
some areas.
6). Occupancy sensors should be installed in all classrooms and auditoriums.
7). Outfit all CCU‘s on campus with an on/off outlet switch.
National Grid has many services available to their clients to aid in creating a more energy
efficient world. Mike Thompson, a NG employee who directly handles WPI‘s energy account,
explained that when East Hall was built, NG paid approximately $200,000 dollars for having
energy efficient lights, chillers, and ventilation motors installed. He pointed out that there are
also many programs that can help defray the costs in retrofitting current lighting and HVAC
systems in existing buildings. These programs are called incentive programs. The incentive
means that depending on how efficient the new upgraded system is, and as long as the minimum
requirements are met for energy savings, NG will pay WPI back a specific amount of money for
each change made. Developing a strong relationship with Mr. Thompson, and the NG company
will aid greatly in continuing to make positive changes to the campus at a greatly reduced cost.
Once the campus has a professional energy audit performed, NG will pay the campus back
a minimum of 45%, and up to 100% of the cost. A professional audit is essential in determining
what the best method is for beginning to reduce all around campus electrical waste. The
information gathered from the study of Higgins Laboratory‘s electrical consumption clearly
demonstrates that a high percentage of its electricity used is wasted energy.
NG has a program called the Energy Profiler Online (EPO). This program is an online
database that catalogs a variety of information regarding the campus‘ electricity use. Every
fifteen minutes this program takes a reading of WPI‘s instantaneous electrical demand. It has
built in tools that will plot consumption from multiple time periods together on one graph. This
makes comparing usage from different months and years more convenient. The program can do
many different things, and will be a key tool in monitoring electrical patterns. In order for this
program to be utilized at its full potential, functioning electrical meters first need to be installed
in every campus building.
Higgins Laboratory still contains incandescent bulbs in a number of its rooms. Each of
these bulbs consumes almost 6 times the energy of the fluorescent bulbs that would replace them,
and up to 75 times the energy a LED light would use. Just replacing the incandescent lights with

13
fluorescent bulbs would result in a conservative savings estimate at minimum of $3,800 a year.
With LED bulbs the minimum conservative savings estimate would be $4,500 a year. Installing
the latter device would have a payback period of 2 months.
The majority of rooms in Higgins Laboratory are over illuminated. According to the case
studies only one room is under illuminated. Every classroom, bathroom, hallway, stairwell, and
office is over illuminated. The data shows that these spaces can have their light levels reduced
anywhere from 20% to 70%. This reduction in lighting levels would more than qualify WPI for
National Grid‘s incentive programs. This means they would pay for some portion of these
renovations, offsetting the initial cost.
After speaking with Norman Hutchins from the Facilities Department, who is in charge
of the HVAC systems here at WPI, it can be concluded that there isn‘t much that can be done to
improve the current system without replacing it with a newer system. Certainly there is a more
efficient system out there on the market as technology continues to improve over the years,
especially since the current system was issued for construction in July of 1994. The payback
period and inconvenience to install a new system is costly and unreasonable with a budget of
only $30,000 to work with and furthermore there is no immediate reason to do so.
With that being said, your savings with the current system are going to come from the
installation of occupancy sensors and CO2 sensors. So far, there are about a half dozen installed
on campus. The success of the CO2 sensor, currently installed in Salisbury Labs 305, has been
monitored between the dates of 3/19/09 – 4/23/09 since its installation. The data shows fan run
time hours saved as a result of the installation of this device. Initially on 3/19 in this room alone,
the ventilation fans were running for 337.59 hours. Now as of 4/23, the fans were running for
152.02 hours. The fan hours saved were 185.57 hours which corresponds to a 54.9% decrease; a
substantial save in just one room alone. One can only imagine the amount of savings incurred if
these sensors were to be installed throughout the campus. It shows that efforts have been made
towards the efficiency matter, but still shy of the ultimate goal.
The research and work performed here will be valuable information for multiple groups
of WPI‘s community such as the Sustainability Task Force which is spearheading WPI‘s campus
wide efforts for energy and resource conservation. The campus savings may prove to help in
keeping more consistent tuition costs during these tough economical times. This would directly
affect students, and it is therefore important that everyone is made aware.
The information in this project will set the ground work for future IQP‘s on this subject
and will stimulate WPI‘s awareness on unnecessary energy usage and finally suggests simple

14
and cost effective solutions to major and obvious problem areas to get more ―bang for the buck.‖
This in turn will improve WPI‘s environmental impact on society, and possibly set an example
for other institutions by integrating technology with environmental responsibility.
WPI has 36 Computer Control Units (CCUs). These units are not capable of a true
shutdown, where the electricity being pulled is less than 1 watt. Equipping each of these systems
with an outlet switch that has an on/off button will take care of this issue (Figure 1.4). The
payback period is estimated for one CCU by purchasing one switch. If the switches were bought
in bulk the price would drop as well as the time for payback. In order to keep the estimate
conservative, it is assumed the CCU is in its lowest power state of 50 watts when not being used.
In actuality, the CCU‘s have a program that puts them into a sleep/standby mode after about
fifteen minutes. People utilizing the rooms have been advised by Network Operations not to shut
the computers down during the week, since they have this standby program. Due to this fact, the
computers are almost always found in their nominal 140 watt-drawing stage.
Figure 1.4 Outlet Switch
In a worst case scenario, the CCU will be in use from 7am
until 10pm. This would mean that it is not in use eleven hours a
day. This assumes that every professor and group using the room
will need the CCU for their entire hour, and that none are teaching
from the whiteboards. This was done to make sure the payback
calculation is conservative. Shutting the CCU off for eleven hours
a day, assuming it is pulling 50 watts and WPI is paying 14 cents a
kWh, equates to a payback period of just less than 5 months. The
warranty on the switch covers a full year, which is over double the
conservative payback period estimate.

15
Chapter 2 Background
2.1 Intro
The background contains historical and current information regarding energy related
research, laws, and technologies. United States Energy Act of 2005 and OSHA standards for
lighting are explored. Federal committees such as LEED, Leadership in Energy and
Environmental and Design, and FERC, the Federal Energy Regulatory Commission, are
explained. WPI Sustainability Task Force and demographics are discussed, along with campus
energy projects. A detailed method for performing a full scale energy audit is provided, and grant
and funding opportunities are covered.
2.2 United States Energy Use History
Since the 20th
century, there has been an increasing demand in the United States for
industrial and residential electricity. The earliest large scale energy production was performed in
thermal power plants which utilized conventional steam turbines powered by the burning of coal.
In more recent times coal has been replaced by new energy sources, but the steam turbines are
still typically used today. Advancements in science, technology, and with new discoveries,
natural gas and oil were utilized to produce the majority of the United States‘ electricity since the
1950s. Figure 2.1. United States Energy Consumption by Source in Quadrillion BTU‘s is a
representation of the exponential growth of energy used by the United States.
Figure 2.1. United States Energy Consumption by Source in Quadrillion BTU’s1
Since the oil embargo of 1973, energy auditing and improvements to the energy
efficiency of new buildings have become increasingly popular. Interest in energy audits in recent
1 http://www.eia.doe.gov/emeu/aer/eh/frame.html

16
times has increased as a result of a growing understanding of human impact upon global
warming and climate change. This is reflected Figure 2.1. United States Energy Consumption by
Source in Quadrillion BTU‘s where petroleum and natural gas consumption drop around 1975.
Simple steps have been made by the populous to reduce energy usage in daily life such as
turning off lights when not in use, replacing incandescent lights with fluorescent lighting,
shutting down computers when not in use, and replacing old technologies with new.
In the electrical industry, i.e. U.S. power plants, steps have been made to develop and
utilize technologies for ―cleaner‖ burning coal, renewable energy sources such as wind, solar,
geothermal, hydroelectric and tidal. This is illustrated in Table 2.1 which gives totals and a
breakdown for energy consumption from 2002 to 2006.
Table 2.1. Detailed analysis of US energy consumption in more recent years.2
U.S. Energy Consumption by Energy Source, 2002-2006
(Quadrillion Btu)
Energy Source 2002 2003 2004 2005 2006
Totala 97.684 97.971 100.051 100.161 99.398
Fossil Fuels 83.994 84.386 86.191 86.451 85.307
Coal 21.904 22.321 22.466 22.795 22.452
Coal Coke Net Imports 0.061 0.051 0.138 0.044 0.061
Natural Gasb 23.558 22.897 22.931 22.583 22.190
Petroleumc 38.227 38.809 40.294 40.393 39.958
Electricity Net Imports 0.072 0.022 0.039 0.084 0.063
Nuclear 8.143 7.959 8.222 8.160 8.214
Renewable 5.893 6.150 6.261 6.444 6.922
Biomassd 2.706 2.817 3.023 3.154 3.374
Biofuels 0.309 0.414 0.513 0.595 0.795
Waste 0.402 0.401 0.389 0.403 0.407
Wood Derived Fuels 1.995 2.002 2.121 2.156 2.172
Geothermal 0.328 0.331 0.341 0.343 0.343
Hydroelectric Conventional 2.689 2.825 2.690 2.703 2.869
Solar/PV 0.064 0.064 0.065 0.066 0.072
Wind 0.105 0.115 0.142 0.178 0.264
a Ethanol blended into motor gasoline is included in both "Petroleum" and "Biomass," but is counted only once in
total consumption. b Includes supplemental gaseous fuels. c Petroleum products supplied, including natural gas plant liquids and crude oil burned as fuel. d Biomass includes: bio fuels, waste (landfill gas, MSW biogenic, and other biomass), wood and wood derived
fuels. MSW=Municipal Solid Waste.
Note: Data revisions are discussed in Highlights section. Totals may not equal sum of components due to
independent rounding. Non-renewable energy: Energy Information Administration (EIA), Monthly Energy Review (MER) December 2007, DOE/EIA-0035 (2007/12) (Washington, DC, December 2007,) Tables 1.3, 1.4a and 1.4b.
Renewable Energy: Table 2 of this report.
2 http://www.eia.doe.gov/cneaf/solar.renewables/page/trends/table1.html

17
There is a 2.4% increase in use from 2002 to 2005, a large increase over a very short
period of time. Due to this increase, a large scale energy policy was formed and put into effect in
2005. A decrease of about 0.762% in usage can be seen in the numbers. This is a small victory,
but demonstrates that even with a growing population, it is feasible to continue reducing our
energy waste.
The United States Department of Energy was founded in 1942 during the development of
the atomic bomb. Until the 1970s energy crisis, their focus was nuclear power and proliferation.
At that time it was determined the U.S. needed unified energy organization and development. In
1977, the Department of Energy Organization Act was passed placing all U.S. government
energy agencies and programs under one unified department. This department has been
responsible for coordinating the U.S. energy efforts in high risk energy technology research and
development, energy conservation, nuclear energy and weapons programs, as well as national
energy data collection and analysis3.
2.3 Creating Sustainable, Energy Efficient, Green Buildings
United States companies and industries are under increasing pressure to address their
sustainability performance as bottom lines are being squeezed by energy prices and climate
change which threatens the viability of energy. Many companies recognize the importance of
energy efficiency as energy prices continue to rise. One could expect that profit-driven
companies would be the first to move towards higher efficiency, but that is still not the case. It is
surprising that very few companies have taken advantage of opportunities to incorporate energy
efficiency into their building stock even though a general agreement exists that widespread
savings are clearly available4. With the Energy Policy Act of 2005, companies are automatically
eligible for tax deductions of as much as $1.80 per square foot if improvements to their energy
systems were to be made. Those savings alone can help offset initial investment costs.
There are many barriers that slow or even prevent the incorporation of energy efficiency
measures which include tenant and/or occupants, financial, building design, etc. According to
studies, the primary obstacles institutions, industries, businesses, etc. face in increasing energy
efficiency are listed below.
3 http://www.energy.gov/about/origins.htm
4 Info gathered through conversations with National Grid Employees

18
Obstacles Face in Increasing Energy Efficiency5
Investment Allocation
o Companies may prefer to allocate their funds towards the core of their business
rather than reducing utility expenditure
Initial Investment Cost
o Many companies believe that applying energy efficient measures to new buildings
require higher initial expenses, higher than conventional methods.
Life Cycle Analysis
o Many companies only analyze initial costs when considering implementing
energy efficiency measures and forget to calculate the reduction in costs possible
for the life of the building. A life cycle analysis is required to look at expenditure
of energy for the life of the building.
Misaligned Incentives
o During the development of a building, the allocation of funds my skew the
construction to one area or another. For example, am efficient design budget can
lead to larger mechanical systems in a building than what is required which leads
to higher operational costs.
Risk Factors
o Benefactors and/or lenders may not incorporate value with the use of new
technologies and may find it too risky. Any uncertainty with new technologies
may result in a higher interest rate with loans or mortgages which may result in
diminished returns for the company.
Today when a structure is being built it can achieve a ranking based on how green and
sustainable it is. The United States Green Building Counsel has created LEED, the Leader in
Energy and Environmental Design green building ranking system. These buildings receive a
LEED certification of either Basic, Silver, Gold, or Platinum. Platinum is the highest rating and
requires extensive planning in the design of a structure from beginning to end. The Oregon
Center for Health and Healing located on the Oregon Health and Science University campus
received this top ranking in 2007.
5 http://dukespace.lib.duke.edu:8080/dspace/bitstream/10161/417/1/MP_elm17_a_200712.pdf

19
Figure 2.2 Oregon Health Center6
2.4 WPI History and Background
WPI is taking steps towards a ―greener‖ campus, as evidenced in the construction of new
buildings. One of its newest buildings, The Bartlett Center, is registered with the U. S. Green
Building Council, and uses innovative architectural methods to reduce the load on its lighting
and air-conditioning systems. Also, the newest residence hall that was recently constructed, East
Hall, was aimed to achieve LEED silver certification, a step above basic LEED certification
which certifies a certain level of environmental sustainability. There is, however, much more
room to improve the environmental impact of the already present buildings. WPI is a leading
technical institution, and as such, should serve as an example for integrating technology with
environmental responsibility by tracking its electricity use.
6 http://www.ohsu.edu/xd/research/centers-institutes/neurology/neuromuscular-disease-center/new-clinic.cfm 4/1/09
Figure 2.2 is a photo of the
Oregon Health Center. It is
currently the largest United
States health center to achieve
such a high level of efficiency.
The solar panels acting as
shades can be seen above
windows similar to awnings.
These also collect electricity
for the building. Other
buildings have also achieved
the Platinum ranking, around
30 or so in the whole country.
The basic ranking is much
more common.

20
Sustainability Taskforce
WPI is a significant consumer of energy in Worcester County. Recently, the president of
WPI had established a Sustainability Task Force whose purpose is ―to provide leadership and
coordination for WPI‘s campus-wide efforts in energy and resource conservation and reduction
in the harmful environmental impacts of our operations, all directed toward enhancing the long-
term sustainability of WPI‘s activities and the environment of which we are a part.‖ Most
recently, this taskforce implemented the use of solar powered lighting at WPI‘s Alumni Field.
The taskforce also launched the availability of Zipcars for faculty, staff, and students, and
continue their efforts to monitor and reduce energy usage and costs at WPI. Many of the
buildings on campus do not have working energy meters. Currently there is no plan to install up
to date energy monitoring systems in all of WPI‘s main facilities in order to track WPI‘s
electricity consumption and identify unnecessary expenditure. Figure 2.3 shows campus yearly
electricity use for a ten year period.
Figure 2.3 WPI’s yearly electricity consumption over 10 years7
The Alumni Field has been equipped with three large solar powered LED path lights (
7 http://www.wpi.edu/About/Sustainability/climateprotection.html 4/1/09

21
Figure 2.4. Solar powered path lights Figure 2.5. Closer look at solar light.
They were installed on September 19th
2008, and were cheaper than installing an electrical
system for conventional lighting. According to Fred Dimauro, these lights have increases safety
on the field and on the walk to Harrington Auditorium.
Figure 2.4. Solar powered path lights8 Figure 2.5. Closer look at solar light9
On March 5th
2009, WPI‘s East Hall was nominated and won the Green Building‘s of
America Award. Over 2,500 projects other extensive projects were considered. Teams
developing these projects worked hard to attain a high level of sustainability. East Hall has
become a well known successful green building.
8 http://www.wpi.edu/About/Sustainability/76786.htm 9 http://www.wpi.edu/About/Sustainability/76787.htm 4/1/09

22
East Hall10
East Hall Sustainable Features
East Hall contains the city of Worcester's first "living green roof" (Figure 2.6) with
12,985 square feet of white, EnergyStar roofing. The green roof's size is approximately
5,000 square feet of sedum.
Features such as occupant sensor lighting and low-flush toilets.
Large number of windows maximizing the amount of natural light that enters the building,
thereby reducing the need for artificial light and electricity use during the daylight hours.
Dedicates interior storage for bikes to encourage students to consider forms of
transportation other than automobiles. The new parking lot also has 12 parking spaces for
Hybrid or alternative fuel vehicles.
WPI's second "green" building; the first being the Bartlett Center. East Hall has been
registered with the United States Green Building Council and is awaiting final LEED
certification, which is anticipated to be at the gold level. (In February 2007, WPI's Board
of Trustees voted to adopt a policy calling for all future buildings on campus to be
environmentally friendly and LEED-certified structures.)
Figure 2.6. The “green” roof on top of East Hall11
10 http://www.wpi.edu/About/Sustainability/eastha764.html 4/1/09 11 http://www.wpi.edu/About/Sustainability/eastha764.html

23
2.5 Demographics
WPI consists of many kinds of buildings. There are academic buildings that each focus
on different areas of study available to students. There are also administrative buildings and
dormitories. Sports facilities also make up a small portion of campus structures. All together
there are 23 different buildings not counting the car garages. Each building uses a different
amount of energy.
A previous study showed that many of the meters are not functioning properly, and until
they are repaired, a breakdown of percent usage by each building is not possible. A more
generalized usage is shown in Figure 2.7, showing Higgins Labs to be a main consumer of
electricity.
Figure 2.7 Average Usage/Day of WPI's Main campus (Mwh/day)12
It is important to understand how WPI‘s energy use varies over the years, and see how
campus energy demands change with class scheduling. During Christmas vacation the power
used is very low because both graduate and undergraduate students have no classes. Between A
and B term, and C and D term only the undergraduates have break, and only for one week. In the
summer most people go home, but a good portion of WPI faculty and students stay to work and
take classes in the summer E term.
12
Monitoring Electricity Consumption on the WPI Campus Christopher O‘Hara, Maximillian Hobson-Dupont, Max Hurgin, Valerie Thierry

24
The campus has 10 undergraduate academic buildings. The names and seating capacities
for each is listed below, along with the number of Computer Control Units (CCU‘s) they contain.
Table 2.2. Building Capacities
Building
Seat Capacity
# of CCU's
Atwater Kent
392
4
Fuller Labs
516
3
Gateway Park
90
1
Goddard Hall
80
1
Higgins Lab
325
6
Kaven Hall
176
3
Olin Hall
314
2
Stratton Hall
292
4
Salisbury Labs 617
9
Washburn Shops 159
3
2.6 Higgins Demographics and Background
Until the 1940s the Mechanical Engineering Department was located in Stratton Hall. In
1942 it was decided that a new mechanical engineering building would be erected. New
laboratories in the building were made for heat transfer, lubricants, fuels, structure of metals,
refrigeration, internal combustion, and others. Named for Milton P. Higgins, Higgins
Laboratories was built in 1942.
Mechanical Engineering is one of the oldest departments at WPI. Keeping it updated with
new facilities and equipment is important to WPI; renovations and a rededication of the labs
occurred in 1996, including the construction of an addition with a dramatic glassed-in entrance
facing the Quad. The labs contain laser systems, wind tunnels in the basement, and a large
student project lab. It is also home to one of the nation‘s few fire protection engineering
departments13
.
Part of the renovation consisted of replacing old constant drive motors in the HVAC
system that ran any pumps or fans with Variable Frequency Drive (VFD) motors14
. These VFD
motors are naturally more efficient than the other motors in a sense that they adjust their running
speeds with respect to their loads. This allows for precise electrical use. Since the case usually is
that the system is not constantly operating under full loads, there is no need to be running those
motors at their full potential. With a building the size of Higgins, you need a number of motors
to power the fans to circulate the air throughout the building. You can see that the summation of
13
Tech Bible 14
Norman F. Hutchins-Head of HVAC Systems at WPI

25
their individual contributions to the unnecessary power draw crisis can be quite substantial. The
excess electricity used can intuitively be noted and the advantages of Variable Frequency Drive
motors are evident.
The renovation also included retrofitting the whole campus with better, more energy efficient
lighting. This retrofit required replacing all of the old ballasts in every building up on the hill
with new ones to fit the new slimmer fluorescent tubes. The job was done by a company out in
Longmeadow and took about 6 months to complete15
.
2.7 Previous Energy Project
In 2007, there was a group who carried out a project titled ―Monitoring Electricity
Consumption on WPI Campus.‖ The report, which was prepared for the Plant Services
Department at WPI, evaluated the present status of WPI‘s electricity monitoring system on a
building-by-building basis. It included a comprehensive report of the electricity meter
functionality for several dormitories and academic buildings and also presented a short and long-
term plan to improve the school‘s ability to monitor its electricity consumption. Unfortunately
for them (and us), there was no single point-source for information on WPI‘s present electricity
metering system and there was ambiguity among the administration about which meters were
working, what they were recording, and for what buildings they provided data for. On top of that,
no analysis of electricity usage data to observe any emerging trends has been done so they had to
start from scratch.
2.8 Energy Audit
Performing a detailed energy audit for a building as large as Higgins Laboratory is a time
consuming and complex process. Given the short 6 week time span for this audit, it is very
important to figure out early on what are the important elements that need to be studied and
documented. A typical energy audit consists of several steps.
Step One
The first step in an energy audit is to do a building and utility data analysis. Typically 3
years of information is gathered. The bills show the standard charges, as well as higher charges
for peak demand times. A previous IQP group gathered and compiled information about the
15
Lawrence B. Riley-WPI‘s Facilities Custodial Staff

26
overall campus usage for several past years. This information will be useful in developing and
understanding an energy profile for the campus over the years.
Once enough data is obtained, it can be analyzed to develop patterns of usage. It is
important to also classify the building. CAD drawings should be acquired and will help to
calculate overall dimensions and number of rooms. Weather effects should also be looked into
thoroughly. A list of heating and cooling devices, along with the amount of square footage of
window spaces will be necessary in this portion of the audit. The environment in which the
building is located should be studied as well. Does the building require heat all year? Is it located
in an area where it has high sun or wind exposure? Developing the overall general characteristics
of the building will aid in understanding how it reacts to and effects the environment.
Step Two
The second step of the audit requires a detailed walkthrough of the building, in this case
Higgins Laboratory, where general usage of rooms, equipment type, lighting, and controls are
observed and recorded. In this phase it is necessary to decide what in the building is wasting the
most power and what items are using a negligible amount. The main goal of the audit should be
determined, and address the concerns of any customer‘s requesting the audit. Operating and
maintenance procedures should be obtained from janitorial or on site personnel that can give
primary first hand information. The various kinds of spaces in the building need to be classified,
along with the major pieces of electrical equipment located in these zones. A determination
should be made as to which electrical devices can be considered negligible based upon the scale
of the specific energy audit, and its goals. An energy use density map will show where the heavy
areas of energy drain are from a building, but are not always readily available. If this tool is not
available it will suffice to estimate the general occupancy and equipment use of the areas studied.
The amount and classification of lighting is also developed in this phase.
Step Three
The third step of the audit process is to develop a baseline of the building‘s energy use.
This is where the architectural, mechanical, and electrical drawings that were found can be
analyzed. By now there should be a basic understanding of the spaces consuming the most
power, and what kinds of equipment are present. These items should be inspected and tested to
see how much energy they are truly using. Information regarding the efficiency of these
machines as well as their reliability should be found and documented. Once all the data has been
collected a baseline of building energy usage should be created. This will allow comparison of
A-typical energy demands, and allow predictions of future energy use.
27
Step Four
Step 4 involves the total evaluation of energy saving methods and solutions. The first
thing to do is make a list of all methods that could be implemented. Each method should be
researched and the amount of energy savings offered should be evaluated. The amount of money
required for initial investment and upkeep should also be calculated. This will help in figuring
out payback periods. Once each method has been looked at they can be put into an order based
on cost effectiveness, which will make selecting the best option easier.
2.9 Heating, Ventilation, Air Conditioning
Heating Ventilation and Air Conditioning systems, more formerly known as HVAC,
maintain and control temperature and humidity levels to provide an adequate indoor environment
for human activity, experimental labs, and/or for processing goods. In the U.S. it is estimated that
the energy used to operate the HVAC systems account for about 50% of the total electrical
energy use in a typical commercial building. It is therefore important to understand some of the
characteristics of HVAC systems and determine if any retrofits can be recommended to improve
the overall energy efficiency of the building.
A typical HVAC system consists of dampers (Outside Air, Return Air, Exhaust Air and
Supply Air) to control the amount of air to be distributed, preheat coils, cooling coils, filters,
humidifiers, and a distribution system where the air is channeled to various locations and spaces.
These components come in all sorts of configurations and the integration of these components
constitutes a system for the sole purpose of conditioned air distribution. These Air Distribution
systems fall into two main categories: Constant Air Volume and Variable Air Volume Systems.
Constant Air Volume systems provide a constant amount of supply air conditioned at
proper temperature to meet the thermal loads in each space based on a thermostat setting.
Typically, the supply air temperature is controlled by either mixing cooled air with heated or
bypassed air or by directly reheating cooled air. As a result, these systems waste energy because
of the mixing and/or reheating especially under partial thermal load conditions. Fortunately, WPI
produces its own steam for heating, so there is no electrical loss in that area.
Variable Air Volume systems provide a variable amount of supply air conditioned at a
constant temperature to meet thermal loads in all spaces based on thermostat settings. The supply
air volume can be controlled and modulated using various techniques such as outlet dampers,
inlet vanes, and variable speed drives. Typically, only cooled air is supplied at the central air
handling unit. In each space, reheat is provided depending on the space thermal load. Variable
Air Volume systems are more efficient since they minimize reheat energy waste.

28
In most cases, conversion of constant volume systems to variable air volume systems is
cost effective and should be considered for existing commercial and institutional buildings.
There are still energy savings opportunities in the design of the systems, the method of operation,
and the maintenance of the systems. Some steps include the aforementioned reduction in reheat
since it wastes energy, eliminating overcooling and overheating of the conditioned spaces to
improve comfort levels and avoid energy waste, operating the systems only when needed not in
unoccupied rooms, and even reducing the amount of air delivered by minimizing the supply air,
make up, and exhaust air.
INDOOR TEMPERATURE CONTROLS
During both heating and cooling seasons, indoor temperature settings have a significant
impact on the energy use of the HVAC systems as well as the thermal comfort within occupied
spaces. Consumers usually address this area first along with lighting control for immediate
savings without out any substantial initial investment. There are four options for adjustments that
can save heating and cooling energy, as long as set points are adjusted correctly.
Overcooling can be eliminated by raising the cooling set-point during the summer.
Overheating can be eliminated by lowering the heating set-point during the winter.
Separating heating and cooling set-points can prevent simultaneous heating and cooling
operations by the HVAC system.
Heating and/or cooling requirements can be reduced during unoccupied hours by setting
back the set-point temperature (or letting the indoor temperature float) during heating
and setting up the set-point temperature during cooling.
UPGRADE OF FAN SYSTEMS
Fans are used to distribute conditioned air from central air handling units to heat or cool
various zones within a building. Fans represent about 25% of the total electrical energy use of a
building, thus significant energy savings can be seen through improvements in these systems.
The electrical energy input required can be significantly reduced by reducing the amount of air to
be moved by the fan. For example, a 50% reduction in the volume of air results in 87.5%
reduction in fan energy use16
. This is another reason why Variable Air Volume systems are more
efficient compared to Constant Air Volume systems. Some other measures that can be taken are
selecting energy-efficient motors, energy-efficient belts, variable speed drives, and sizing. A note
16
Energy Audit of Building Systems-An Engineering Approach by Moncef Krarti

29
on sizing: It was found through a recent EPA study that 60% of building fan systems were
oversized by at least 10%. Average savings of 50% can be achieved in energy use of fan systems
just by simply reducing the size to the required capacity. The benefits of using the proper fan size
not only save you money, but also extend to better comfort and longer equipment life.
CENTRAL HEATING SYSTEMS
Four types of heating systems are used extensively in commercial buildings. They are
boilers, furnaces, individual space heaters, and packaged heating units. Boiler systems use a
combustion process of hydrocarbons to provide the heat. A typical boiler is compromised of an
insulated jacket, a burner, a mechanical draft system, tubes and chambers for combustion gas,
tubes and chambers for water or steam circulation, and controls.
The main area which can be improved upon is the overall thermal efficiency. This can be
improved by tuning-up the existing boiler, replacing the existing boiler with a high efficiency
boiler, or use modular boilers. One can also install turbulators in the fire-tubes to increase the
heat transfer between the hot combustion gas and water, insulate the jacket of the boiler to
reduce heat losses, install soot-blowers to remove boiler tube deposits that reduce heat transfer,
or use economizers to transfer energy from a stack flue gases to incoming feed water. Of course
with a good budget one can always just replace the existing boiler with a higher efficiency one as
manufacturers continue to improve both the combustion and the overall efficiency of boilers.
Modular boilers can increase the overall seasonal efficiency of the heating system by 15-
30%.The principle behind modular boilers is that almost all heating systems are most efficient
when they operate at full capacity. Instead of operating the boiler in an on/off mode when the
load is lower than its capacity, controls use step-firing rates or modulating firing rates ranging
from 100-15%.17
COOLING SYSTEMS
There are several types of cooling systems that are used in commercial buildings
including: packaged air conditioner units, central chillers, heat pumps, residential-type central air
conditioners, district chilled water, individual air conditioners, and evaporative coolers. In
general, the packaged air conditioner units are the main equipment used to condition buildings in
the U.S. The average cooling system consists of a compressor, a condenser, an expansion device,
an evaporator, and other auxiliary equipment where both the evaporator and condenser are heat
17
Energy Audit of Building Systems-An Engineering Approach by Moncef Krarti

30
exchangers. The energy efficiency of a cooling system is characterized by its Coefficient of
Performance (COP), which is defined as the ratio of the heat extracted divided by the energy
input required. Currently, the most energy efficient centrifugal water chiller has a COP of about
70% of the ideal Carnot cycle. The capacity of cooling systems is expressed in kW and is defined
in terms of the maximum amount of heat that can be extracted. In large buildings, central chillers
are used to cool water for space air conditioning. Some of these chillers are powered by electric
motors which have their own inefficiencies associated with them. Some chillers use hot water to
steam to generate chilled water, which is what is currently being used at WPI.
The energy use of cooling systems can be reduced by improving the efficiency of the
equipment under both full and partial load conditions. Like the heating systems, this can be
achieved by either improving the existing operating controls of the cooling systems, using
alternative cooling systems, or simply by replacing the existing cooling systems. Indeed it can be
cost-effective to replace an existing chiller with a new and more energy efficient chiller. Some
strategies that can be used to improve the efficiency of existing chillers are as follows: Increase
the evaporator and the condenser surface area for more effective heat transfer, improve the
compressor efficiency and control, enlarge internal refrigerant pipes for lower friction, and
ozonate the condenser water to avoid scaling and biological contamination. Before replacing an
existing chiller though, it is recommended to consider alternative cooling systems or simple
operating and control strategies to improve its energy performance. Evaporative cooling and
water-side economizers are some of the common and proven alternative cooling systems. Two
basic control strategies that can be implemented are supplying chilled water at the highest
temperature that meets the cooling load and decreasing the condenser water supply temperature
when the outside air wet bulb temperature is reduced. In the future, it is expected that higher
efficiency cooling equipment will be available as well as other innovative air conditioning
alternatives such as desiccant cooling systems. 18
2.10 Lighting
There are many lights in each building on the WPI campus. Higgins is certainly no
exception. Lighting is a very important factor of campus life. How much lighting is necessary in
a classroom that has no windows so that students will remain awake, take notes, and be able to
see the front of the room? Is full lighting needed in a hallway that has many windows? How
about a machine shop where being able to see very clearly is a primary factor for safety? There
are many elements that tie directly into how much lighting is needed in the various environments
that each building contains.
18
Energy Audit of Building Systems-An Enginnering Approach by Moncef Krarti

31
There are several precautions that can be taken in order to reduce the amount of
electricity that is used by the lighting system of a building. Incandescence is when a hot body
gives off light because of its high temperature. In these kinds of bulbs an electron flow is present
and is resisted by the filament. This causes it to heat up enough that it gives off some light
radiation that is within our visible spectrum. However, the majority of the light given off is
infrared and therefore invisible. This is the reason that these bulbs are very inefficient and can
result in a lot of undesirable heat radiation.
Florescence is very different in the way it produces light. In these tube-like bulbs a small
current is passed through mercury atoms and causes them to give off light. This light is actually
in the ultraviolet range and can be very harmful to people and animals. A fluorescent material,
called phosphor, is coated along the inside of the tube, which absorbs the harmful light and in
turn radiates safe visible light. These bulbs tend to give off up to quarter of the heat the
incandescent bulbs do. This clearly makes florescent bulbs the more efficient choice, unless the
heat radiation is desired.
Light Emitting Diodes (LEDs) work on electroluminescence, which is an optical and
electrical phenomenon where light is emitted when electricity passes through a material. LEDs
use up to 90% less electricity than fluorescent bulbs, don‘t contain hazardous gasses, and last up
to 3 times longer. However, LEDs are still rather expensive, but with the increase in demand for
low energy light bulbs, and increase in LED production, the cost should drop.
From advancements in lighting technology and with various sources of lighting, comes a
variety of control systems. Most traditional are simple switches, where the light is either on or
off. Dimmer switches were also developed in order to increase or decrease light intensity while
on. To facilitate energy conservation, lighting timers and motion sensors were also developed in
order to shut off lights when they are not needed. Most recently, Panasonic has developed a
lighting system that automatically dims based upon ambient light intensity whereas a room
would not be lit above the required lumen standard.
2.11 Federal and State Laws
The United States Department of Labor, Occupational Safety and Health Administration
(OSHA) have standards for the illumination of all public areas and buildings. With the
implementation of new lighting sources, many old buildings can be over illuminated which can
lead to increased electrical usage. OSHA states that, for any corridors or hallways the minimum
illumination required is 5 foot-candles. Ten foot candles of illumination are necessary for mess

32
halls, equipment rooms, store rooms, workrooms, and bathrooms. Thirty foot-candles are
mandatory for infirmaries and offices19
.
U.S. Congress passed the bill, Energy Policy act of 2005, and it was put into law by
George W. Bush. This energy act is rather extensive and covers most all possibilities for energy
conservation and the future of a greener U.S. This bill looked to authorize loans towards new
technologies that produce less greenhouse gasses such as renewable energy sources, nuclear
power, and cleaner coal. The energy act also authorized subsidies, grants, and up to $14.5 billion
in tax incentives for the application of alternative energy sources towards corporations and
industries20
.
2.12 Computers
WPI has hundreds of computers on campus, with over 50 in some of the labs. Though the
machine has come a long ways, the computer continues to draw a lot of power. They are also
very expensive and contain a lot of heavy metal waste. Keeping a computer running well
requires minimal but consistent effort on the user‘s end. It is very important to allow the
computer time to cool down. They have a very long shelf life when not being used, but when
continuously running the life of the system is greatly reduced. One of the most common things
missed is cleaning out the ventilation and fan areas. Fans do commonly fail in computers. It is
much more likely that it will break when no one is around if the device is left constantly running,
pulling in harmful dust when not in use. With the newer technologies available, cyclic fatigue is
not as much of a worry with computers anymore. There is a greater need to shut them down in
extended periods of non use usually, over an hour. This is beneficial in extending the machines
life and greatly reduces energy waste.
19Regulations (Standards - 29 CFR) Illumination. - 1926.56. http://www.osha.gov/pls/oshaweb/
owadisp.show_document?p_table=STANDARDS&p_id=10630 04/01/2009
20 http://www.epa.gov/oust/fedlaws/publ_109-058.pdf 4/1/09

33
2.13 Understanding the National Grid and Direct Energy Bills and Charges
WPI currently purchases electricity from National Grid (NG), who sends an employee to
take a meter reading from 183 West Street once a month. The bills are comprised of a variety of
different charges that fluctuate throughout the year. Understanding the individual charges that
WPI incurs from NG will help in evaluating where the campus‘ money is going and what exactly
is being paid for (Figure 2.1).
Figure 2.8 National Grid Bill Image
WPI is rated by NG as a G-3 category client. This means that the campus uses more than
10,000 kWh per month and has a demand higher than 200 kW. Residential homes will typically
fall under a G-1 category, while small businesses tend to be in the G-2 group. As shown in Table
2.3, it is much more costly to use electricity during the peak hours rather than off peak. The cost
is roughly 27 times more expensive per kWh during peak times (Table 2.3). The generation
charge is separate from the distribution charge and is not typically reflected in the NG bill, but is
a separate bill all together (See Appendix C and Appendix D).

34
Table 2.3 National Grid Charging System21
Time-of-Use (G-3) This service is primarily available for large commercial and
industrial customers with demand greater than 200 kW.
Rates for Delivery Service
Peak Hours: January 1—March 7: 8:00 a.m. to 9:00 p.m.
March 8—April 4: 9:00 a.m. to 10:00 p.m.*
April 5—October 24: 8:00 a.m. to 9:00 p.m.
October 25—October 31: 7:00 a.m. to 8:00 p.m.*
November 1—December 31: 8:00 a.m. to 9:00 p.m.
*These Peak Hours are applicable during 2009 and reflect
the difference between when the customer's meter records
on-peak kWh consistent with the pre-2007 Daylight
Saving Time schedule and the revised Daylight Savings
Time schedule mandated by the Federal Energy Policy
Act of 2005.
Off-Peak Hours: All hours not specified as peak hours.
Billing Terms
Off-Peak: This is when the National Grid Company has an overall low demand for electricity
from its cumulative clientele. This is typically holidays, weekends and evenings.
Peak: This is when the National Grid Company has an overall high demand for electricity from
its cumulative clientele. These periods are usually during the days of Monday through
Friday.
Demand Charge: This is the cost of providing electrical transmission and distribution
equipment to accommodate the largest electrical load WPI uses.
Explanation of Charges
Customer Charge: This is the cost of providing customer related services. These include
metering, meter reading, and billing. This cost is fixed and does not change with
increased or decreased electricity usage.
Distribution Charge On-Peak: This is the cost of delivering electricity from the beginning of
the National Grid distribution center to WPI during the peak hours as defined above.
Distribution Charge Off -Peak: This is the cost of delivering electricity from the beginning of
the National Grid distribution center to WPI during the off-peak hours as defined above.
Transition Charge: These charges are actually part of a debt owed to certain energy companies
from National Grid due to early termination of a National Grid contract with the power
generation company. Due to deregulation of certain policies in 1998, National Grid is
now strictly a distribution center and is not allowed to generate electricity. They used to
21
https://www.nationalgridus.com/masselectric/business/rates/4_tou.asp 4/13/09
Customer Charge $73.16/month
Distribution Demand Charge $3.92/kW
Distribution Energy Charge
Peak Hours 1.229¢/kWh
Off-Peak Hours (0.045)¢/kWh
Transmission Charge 1.192¢/kWh
Transition Demand Charge $0.19/kW
Transition Energy Charge 0.061¢/kWh
Demand Side Management Charge
0.250¢/kWh
Renewables Charge 0.050¢/kWh

35
make some of their own electricity, but there was a higher demand for power than the
company had capacity for. It outsourced to small power generation companies to cover
the remaining demand. Once National Grid stopped making energy, they had to outsource
for their total electricity demand. The small companies they were using did not have the
capacity to provide all of this power, so N.G. had to cancel all the contracts they had with
the smaller companies and create new ones with much larger generation companies. This
debt that N.G. owes is spread among all of its clients, and should be paid off in roughly
10-15 years22
.. After that, this charge will no longer appear on the monthly bills
Transmission Charge: This is the cost of delivering electricity from the electrical generation
company to the beginning of National Grid‘s distribution center. This is a fixed rate, and
is not a function of the distance between N.G. and its power generation source.
Distribution Demand Charge: This is the cost of delivering the largest instantaneous electricity
demand throughout the month from the beginning of the National Grid distribution center
to WPI.
High Voltage Discount: This is a discount offered to WPI because the electricity that we get
from National Grid comes to the campus at 13,800 volts, where as a normal residential
home or small business usually receives it at 120, 240 or 480 volts.
Demand Side Management Charge: This is the cost of demand side management programs
offered by National Grid. Residential homes and small businesses can ask for a free
energy audit from N.G., and can also be reimbursed for implementing energy saving
methods such as more efficient lights and motion sensors.
Transition Demand Charge: This charge is essentially the same as the Transition Charge,
except that it is a function of the largest instantaneous electrical demand throughout the
month rather than the total month‘s usage.
Renewable Energy Charge: This is a charge to fund initiatives for communicating the benefits
of renewable energy and fostering formation, growth, expansion, and retention of
renewable energy and related enterprises. There is no way to track where this money
goes, or to see what programs donations are being made to.
High Voltage Metering: This is a discount given to WPI because we use our own transformers
to reduce the 13,800 volt electricity delivered by National Grid down to a more
manageable voltage.
22
A Conversation with a National Grid Representative

36
2.14 Summary
The background explains reasons as to why businesses have a difficult time operating
with a high level of electrical efficiency and sustainability, and WPI is no exception. Although
several steps towards a greener, more efficient campus have been taken, more needs to be done.
The right motivated people, equipped with the proper tools and information could make a
permanent positive change to the campus electrical waste. An energy audit is an extensive
process when applied to a campus the size of WPI, but would provide much of this foundational
information.

37
Chapter 3 Methodology
3.1 Introduction
This section details the process and procedures performed for an energy audit of Higgins
Labs and sets up a general procedure for an energy audit of all other buildings on the WPI
campus. It was chosen to perform an energy audit in order to create a baseline of data regarding
excess electricity use. Organizing a set of data containing information on what electrical
components in various spaces are wasting electricity will help in coming up with fixes to save
money. Saving money and reducing electrical wasted are the main audit goals. The primary tools
utilized to complete the audit, were a LUX light meter and a Kill-A-Watt meter.
3.2 Step One: Utility and Building Data Analysis
CAD drawings of Higgins Labs were obtained. These CAD drawings detail floor plans
for each room and numbered section of the building, room size, location, etc.
The electricity bills from January 2006 to present for WPI‘s main campus were obtained.
The information from the bills was put into an excel spreadsheet to develop patterns of electricity
usage and cost at WPI for the past three years. Bills from National Grid, Hess Energy
Corporation, and Direct Energy were all integrated to create an accurate energy profile.
A schematic of the HVAC system of Higgins Labs was obtained (Refer to Appendix H).
This schematic shows all of the HVAC equipment specifications currently in use in the building.
The schematic aided in the determination of a rough estimate of the electrical power draw of the
HVAC system compromised of over 80 individual motors.
A schedule of the typical weekly classroom and office usage of Higgins Labs was
obtained. This schedule allowed for the development of a pattern of use chart to further hone in
on and identify key areas of inefficiency..
3.3 The Walkthrough
Utilizing the CAD drawings of Higgins Labs, each room number was classified as an
auditorium, standard classroom, office, computer lab, laboratory, machine shop, conference
room, bathroom, hallway, stairway or closet. For each room, all switches, lights, and any
electronics or pieces of equipment were catalogued by number and by electricity consumption.
The intensity of lighting was determined for each room using a Lux Meter. The intensity of light
was measured with all lights on and all shades closed then open, and if possible, lights dimmed

38
or at different levels, depending on the capability of the controls in the room, with shades open
then closed. Lighting levels were measured at various times of the day and during cloudy and
sunny days in this manor in order to show lighting intensity with varying ambient light.
3.4 Higgins Baseline Energy Use
For a period of 9 days, the electricity use for Higgins Labs was monitored through the use
of Higgins Labs‘ main electricity meter in order to develop a baseline for Higgins Labs‘
electrical use. For one day, the electricity meter was monitored every hour on the hour to develop
a ―Day in the Life of Higgins Labs.‖ For any building, an electricity metering system can be used
by a licensed electrician to develop a more detailed, zone by zone or room by room, electricity
profile. For this study of Higgins Labs, the budget did not allow for this detailed profile.
Case studies of a typical office, classroom, lecture hall, and computer lab were performed
in order to develop profiles of energy uses in each of these types of rooms. A Kill-A-Watt meter
was used in order to determine the electrical consumption, in kilowatts, by each and every device
plugged into a 120 volt outlet. Each piece of equipment was classified based upon its electrical
consumption.
3.5 Determining Results and Conclusions
The data collected in each step of the energy audit was utilized to develop energy saving
methods for Higgins Labs, as well as develop potential energy saving methods for all WPI
buildings.

39
Chapter 4 Results
4.1 Results Introduction
This chapter includes all raw data collected for the energy audit of Higgins Labs at WPI.
This includes building schematics and room classifications, case studies of electrical components
with electric consumption found in specific rooms, campus wide electric consumption data from
National Grid, Direct Energy, and Hess Energy, and the HVAC system currently utilized.
4.2 Layout of Higgins Labs
Higgins Labs consists of 205 rooms from the basement level to the third floor. Each room
is classified as follows:
Table 4.1 Room Classifications
Room Classification Room Numbers
Auditorium 116, 218
Classroom 114, 154, 202
Laboratory 004, 005, 006, 008, 016, 025, 026, 031, 042, 045, 124, 127, 129, 216, 230, 232, 235, 248, 311, 312, 313
Office
003, 008A, 009, 010, 011, 012, 027, 028, 032, 033, 034, 037, 038, 039, 041, 044, 103, 104-112, 125, 126, 128,
131, 133, 134, 135-140, 143-145, 148, 150-153, 203, 204, 206-214, 231, 234A, 236, 239, 240, 242-247, 249,
250, 301, 306, 307
Hallway 036, 048-051, 103, 156-159, 203A, 251, 253-255, 315, 316, 318
Bathroom 019, 020, 117, 118, 223, 224, 303, 304
Closet or Storage Room 006, 015, 017, 018, 021-024B, 038A, 103A, 103B, 119-122, 146, 217, 218A, 222, 225-228, 231, 241, 305, 322,
323
Conference Room 102, 123, 115, 201, 229
Stairwell 001, 002, 007, 035, 101, 113, 130, 142, 215, 238, 302, 319, 321
Note: The highest electrical consuming devices were documented for rooms in BOLD. Rooms in RED had limited or restricted access and the
equipment in those rooms was not documented.
The CAD drawings of each of the floors in Higgins Labs with room numbers can be found in
APPENDIX I.
4.3 Case Study Introduction
The following studies were performed in order to develop a detailed electricity profile for
a typical office, auditorium, computer lab, and machine shop in Higgins Labs. Every piece of
equipment in each room was documented with the equipments electricity usage in watts and run
time in a typical day. Light intensity readings of each room were taken with a Digital LUX
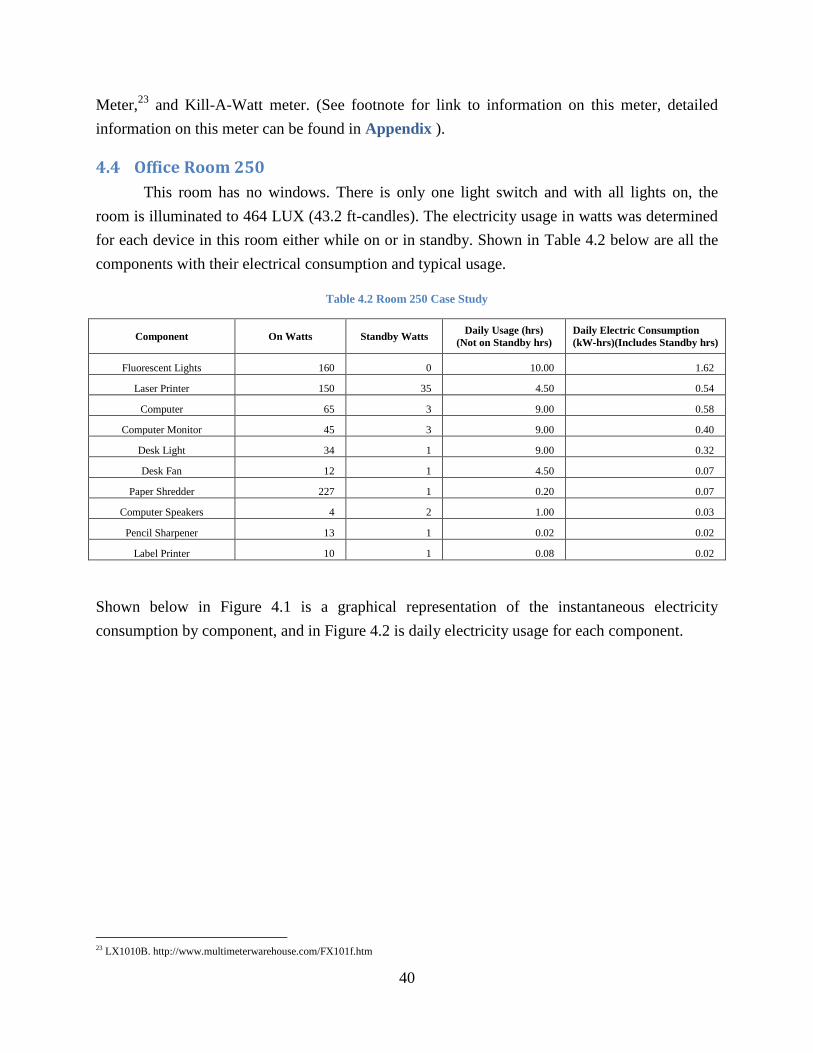
40
Meter,23
and Kill-A-Watt meter. (See footnote for link to information on this meter, detailed
information on this meter can be found in Appendix ).
4.4 Office Room 250
This room has no windows. There is only one light switch and with all lights on, the
room is illuminated to 464 LUX (43.2 ft-candles). The electricity usage in watts was determined
for each device in this room either while on or in standby. Shown in Table 4.2 below are all the
components with their electrical consumption and typical usage.
Table 4.2 Room 250 Case Study
Component On Watts Standby Watts Daily Usage (hrs)
(Not on Standby hrs)
Daily Electric Consumption
(kW-hrs)(Includes Standby hrs)
Fluorescent Lights 160 0 10.00 1.62
Laser Printer 150 35 4.50 0.54
Computer 65 3 9.00 0.58
Computer Monitor 45 3 9.00 0.40
Desk Light 34 1 9.00 0.32
Desk Fan 12 1 4.50 0.07
Paper Shredder 227 1 0.20 0.07
Computer Speakers 4 2 1.00 0.03
Pencil Sharpener 13 1 0.02 0.02
Label Printer 10 1 0.08 0.02
Shown below in Figure 4.1 is a graphical representation of the instantaneous electricity
consumption by component, and in Figure 4.2 is daily electricity usage for each component.
23 LX1010B. http://www.multimeterwarehouse.com/FX101f.htm

41
Figure 4.1
Figure 4.2
0
50
100
150
200
250
Wa
tts
Component
Instantaneous Electricity Usage by Component
On Watts
Standby Watts
0.00
0.20
0.40
0.60
0.80
1.00
1.20
1.40
1.60
1.80
Flourescent
Lights
Laser
Printer
Computer Comuter
Monitor
Desk Light Desk Fan Paper
Shredder
Computer
Speakers
Pencil
Sharpener
Label
Printer
kW
-hrs
Component
Daily Electricity Usage by Component in kW-hrs (inc. standby hrs)

42
Offices in Higgins Labs vary slightly with components and size. Some offices contain
windows and allow for ambient lighting. Even with additional components, such as personal
laptops, office room 250 sets a typical standard for office rooms 104-112, 203, 204, 206-214, and
239-249.
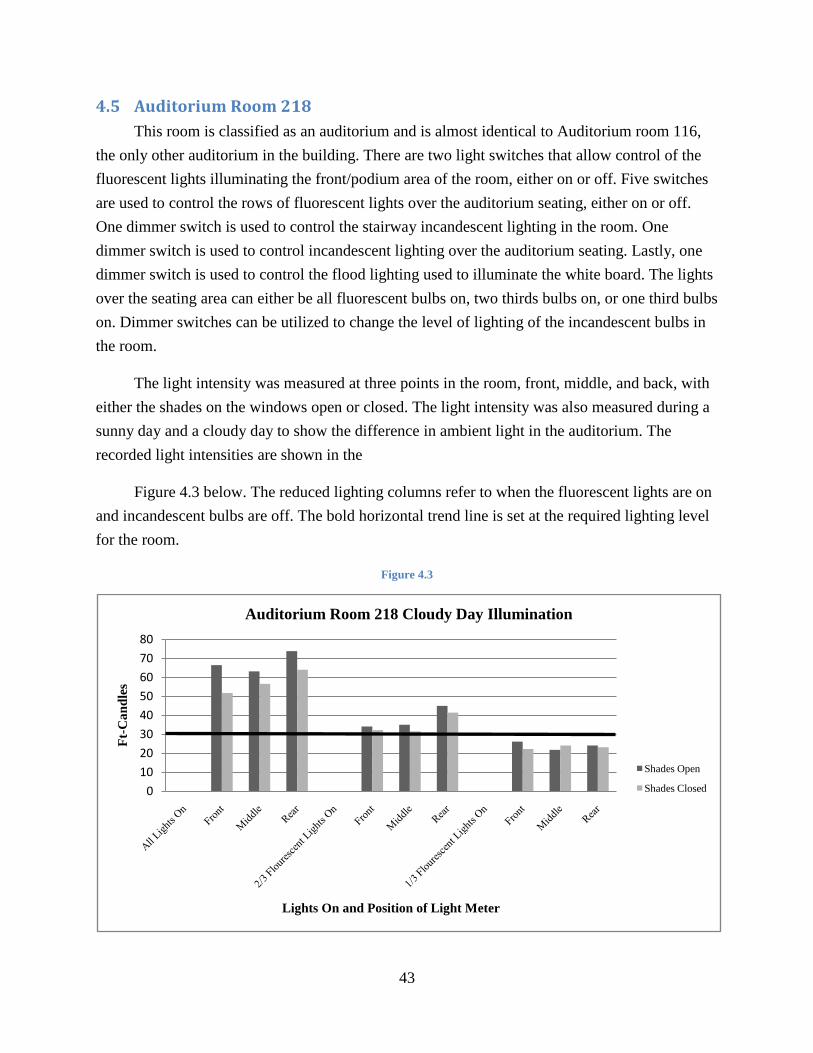
43
4.5 Auditorium Room 218
This room is classified as an auditorium and is almost identical to Auditorium room 116,
the only other auditorium in the building. There are two light switches that allow control of the
fluorescent lights illuminating the front/podium area of the room, either on or off. Five switches
are used to control the rows of fluorescent lights over the auditorium seating, either on or off.
One dimmer switch is used to control the stairway incandescent lighting in the room. One
dimmer switch is used to control incandescent lighting over the auditorium seating. Lastly, one
dimmer switch is used to control the flood lighting used to illuminate the white board. The lights
over the seating area can either be all fluorescent bulbs on, two thirds bulbs on, or one third bulbs
on. Dimmer switches can be utilized to change the level of lighting of the incandescent bulbs in
the room.
The light intensity was measured at three points in the room, front, middle, and back, with
either the shades on the windows open or closed. The light intensity was also measured during a
sunny day and a cloudy day to show the difference in ambient light in the auditorium. The
recorded light intensities are shown in the
Figure 4.3 below. The reduced lighting columns refer to when the fluorescent lights are on
and incandescent bulbs are off. The bold horizontal trend line is set at the required lighting level
for the room.
Figure 4.3
0
10
20
30
40
50
60
70
80
Ft-
Ca
nd
les
Lights On and Position of Light Meter
Auditorium Room 218 Cloudy Day Illumination
Shades Open
Shades Closed

44
Each piece of equipment and all light bulbs were catalogued with their instantaneous
electrical consumption in watts. (Table 4.3)
Table 4.3 Room 218 Case Study
Component Number of
Components
On Watts
per
Component
Standby
Watts per
Component
Total On Watts
per Component
Typical Weekly
Usage (hrs) (Not
Standby)
Weekly Electric
Consumption
(kW-hrs) (inc. Standby
hrs)
Florescent
Light 90 32 0 2880 90 259.37
Incandescent
Bulb 21 75 0 1575 90 141.92
Projector 2 367 367 734 168 61.82
Marker Board
Lights 3 75 0 225 90 20.42
Exit Sign 3 40 0 120 168 20.33
CCU 1 150 60 150 90 8.27
Clock 1 0.4 0 0.4 168 0.24
Air
conditioners 3 N/A
Security
Camera 1 N/A
Projector
Screen 1 N/A
Heater 0 N/A
Light Switch 10 N/A
Windows 3 N/A
Figure 4.4 is a graphical representation of the total instantaneous electricity usage by component
and Figure 4.5 is a graphical representation of the weekly electricity usage by component for
Auditorium Room 218.
Figure 4.4
0
500
1000
1500
2000
2500
3000
3500
Florescent Light Incandescent
Bulb
Projector Marker Board
Lights
Exit Sign CCU Clock
Wa
tts
Components
Total Instantaneous Electricity Used by Component

45
Figure 4.5
0.00
50.00
100.00
150.00
200.00
250.00
300.00
Florescent Light Incandescent
Bulb
Projector Marker Board
Lights
Exit Sign CCU Clock
kW
-hrs
Components
Weekly Electricity Use by Component in kW-hrs (inc. standby hrs)

46
4.6 Classroom Room 114
Room 114 is classified as a classroom. feet. In room 114 there are three is one light switch
to control the lighting over the podium/front area and two switches to control the rest of the
lighting in the room, half or full lighting. The light intensity was also measured during a cloudy
day to show low ambient lighting with the shades open in the room. The recorded light
intensities are shown in the Figure 4.6 below. The bold horizontal trend line is set at the required
lighting level for the room.
Figure 4.6
Each piece of equipment along with each light bulb was catalogued with its instantaneous
power consumption in watts. In the Table 4.4 Room 114 Case Study below, utilizing scheduling
data for the room, the electricity profile is shown.
0
20
40
60
80
100
120
Ft-
Ca
nd
les
Lights On and Position of Meter
Conference Room 114 Cloudy Day Light Illumination
Shades Open Ft-Candles
Shades Closed Ft-Candles

47
Table 4.4 Room 114 Case Study
Component Number of
Components
On Watts
per
Component
Standby
Watts per
Component
Total Watts
per
Component
Typical Weekly
Usage (hrs) (Not
Standby)
Weekly Electricity
Consumption
(kW-hrs) (inc. Standby hrs)
Florescent Light 36 32 0 1152 65 74.88
Projector 1 367 367 367 65 61.66
CCU 1 150 60 150 65 15.93
Marker Board
Lights 4 32 0 128 65 8.32
Clock 1 0.4 0 0.4 168 0.07
Incandescent Bulb 0 N/A
Projector Screen 1 N/A
Heater 3 N/A
Light Switch 3 N/A
Windows 5 N/A
Air conditioners 1 N/A
Figure 4.7 is a graphical representation of the instantaneous electricity usage by component in
watts and Figure 4.8 is a graphical representation of the yearly electricity usage by component in
kW-hrs for room 114.
Figure 4.7
0
200
400
600
800
1000
1200
1400
Florescent Light Projector CCU Marker Board Lights Clock
Wa
tts
Component
Instantaneous Electricity Usage by Component

48
Figure 4.8
0.00
10.00
20.00
30.00
40.00
50.00
60.00
70.00
80.00
Florescent Light Projector CCU Marker Board Lights Clock
kW
-hrs
Component
Weekly Electricity Use by Component in kW-hrs (inc standby hrs)

49
4.7 Conference Room 201
This conference room 201 has two dimmer switches to control the lighting. There are no
fluorescent bulbs, only incandescent. The light intensity was measured with all lights on and off,
with shades open and closed, as well as on both a cloudy and sunny day. The light intensity data
is shown in Figure 4.9 and Figure 4.10 below. The bold horizontal trend line is set at the required
lighting level for the room.
Figure 4.9 Figure 4.10
All equipment and each light bulb in room 201 were catalogued, shown in Table 4.5. The
only non-HVAC components of the room that required electricity were the lights and the clock.
Table 4.5 Room 201 Case Study
Component Number of
Components
Watts per
Component
Total Watts
per Component
Typical Weekly
Usage (hrs)
Weekly Electric Consumption
(kW-hrs)
Incandescent Bulb 6 75 450.0 14 6.30
Clock 1 0.4 0.4 168 0.07
Florescent Light 0 0 0
Air conditioners 0 0 0
Heater 0 0 0
Windows 1 N/A
Light Dimmer 2 N/A
0
2
4
6
8
10
All lights
On
Board
Lights
Only
Ft-
Ca
nd
les
Middle of Room Reading
Light Intensity Conference Room
201
Shades Closed Ft-
Candles
0
10
20
30
40
50
60
All
Lights
On
Board
Lights
Only
Ft-
Ca
nd
les
Middle of Room Reading
Sunny Day Light Intensity
Conference Room 201
Shades Open Ft-
Candles

50
4.8 Conference Room 102
Room 102 is classified as a conference room. There are two on/off switches to control the
overhead lighting and two on/off light switches to control board lighting in the front and rear of
room 102. The light intensity was measured with all lights on and off, with shades open, as well
as on both a cloudy and sunny day. The light intensity data is shown in Error! Reference source
not found. and Error! Reference source not found. below. The bold horizontal trend line is set
at the required lighting level for the room.
Figure 4.11 Figure 4.12
As can be seen in Figure 4.11 and Figure 4.12, room 102 is actually never illuminated to 30 ft-
candles.
All equipment and each light bulb in room 103 were catalogued, shown in Figure 4.6.
The only non-HVAC components of the room that required electricity were the lights. Figure 4.6
below shows the instantaneous electricity consumption by the lighting as well as the yearly
electricity usage.
0
5
10
15
20
All
Lights
On
Only
Board
Lights On
Ft-
Ca
nd
les
Lights On and Position of Meter
Cloudy Day Light Intensity
Conference Room 102
Shades Open Ft-
Candles
0
5
10
15
20
25
30
35
All
Lights
On
Only
Board
Lights
Ft-
Ca
nd
les
Lights On and Position of Meter
Sunny Day Light Intensity
Conference Room 102
Shades Open Ft-
Candles

51
Table 4.6 Room 102 Case Study
Component Number of
Components
Watts per
Component
Total Watts
per Component
Typical Weekly
Usage (hrs)
Weekly Electric Consumption
(kW-hrs)
3 Prong Florescent 18 40 720 24 17.28
Ls212k1 Bulb 4 75 300 24 7.20
Air conditioners 2 N/A
Heater 0 N/A
Projector Screen 1 N/A
Windows 3 N/A
Light Switch 4 N/A

52
4.9 Computer Lab Room 230
Room 230 is classified s a Computer Lab. There are four on/off light switches in this
computer lab. These are redundant switches whereas two switches control on bank of lights, and
two control another. The lighting in the room can either be all on, half on, or all off. There is no
board lighting, only lighting over the seating. Figure 4.13 shows the light intensity in room 230
measured with all lights on and half lighting with no ambient light. The bold horizontal trend line
is set at the required lighting level for the room.
Figure 4.13
Each piece of equipment and every light bulb were catalogued with its instantaneous
electrical consumption. Utilizing the schedules found in Appendix and the fact that this lab is
open 24 hours a day, yearly usage was determined for each component. This data is shown in
Table 4.7 below.
0
5
10
15
20
25
30
35
40
45
50
Front Middle Rear
Ft-
Ca
nd
les
Position of Meter
Light Intensity Computer Lab Room 230
Full Lighting Shades Closed
Half Lighting Shades Closed

53
Table 4.7 Computer Lab Case Study
Component Number of
Components
On Watts per
Component
Standby Watts per
Component
Total Watts
per Component
Typical Weekly
Usage (hrs) (Not Standby)
Weekly Electricity Consumption
(kW-hrs)(inc. Standby hrs)
Computers 41 70 2 2870.0 168 482.16
Monitors 41 45 1 1845.0 168 309.96
Florescent Light 51 32 0 1632.0 168 274.18
Projector 1 367 367 367.0 30 61.66
CCU 1 150 60 150.0 30 12.78
Exit Sign 2 40 0 80.0 168 13.44
Printer 1 21 21 21.0 72 3.53
Clock 1 0.4 0 0.4 168 0.07
Projector Screen 1 N/A N/A
Handicap Switch 1 N/A N/A
Heater 0 N/A N/A
Light Switch 4 N/A N/A
Windows 2 N/A N/A
Air conditioners 1 N/A N/A
The computers electrical usage was determined in stand-by mode. When the computers in lab
230 were on, they used negligible more electricity. These computers are never shut off unless
maintenance is being performed on them.
Figure 4.14 is a graphical representation of the instantaneous electricity usage by
component in watts and Figure 4.15 is a graphical representation of the yearly electricity usage
by component in kW-hrs for room lab 230.
Figure 4.14
0
500
1000
1500
2000
2500
3000
3500
Computers Monitors Florescent
Light
Projector CCU Exit Sign Printer Clock
Wa
tts
Components
Total Instantaneous Watts per Component Lab 230

54
Figure 4.15
As shown in both Figure 4.14 and Figure 4.15the computers and monitors use about 67% of the
total electricity, and the lighting system uses about 23%.
0.00
100.00
200.00
300.00
400.00
500.00
600.00
Computers Monitors Florescent
Light
Projector CCU Exit Sign Printer Clock
kW
-hrs
Components
Weekly Electricity Use by Component in kW-hrs (inc standby hrs)

55
4.10 Controls Lab Room 248
Controls lab room 248 has two on/off light switches to control all illumination in the
room either fully on, half on or off. Figure 4.16 shows the light intensity in room 248 measured
with all lights on and half lighting with the shades open or closed. The bold horizontal trend line
is set at the required lighting level for the room.
Figure 4.16
Each piece of equipment and every light bulb were catalogued with its instantaneous
electrical consumption. This lab is used sparingly for projects. The usage data is shown in Table
4.8 Controls Lab Case Study, which is a conservative estimate.
Table 4.8 Controls Lab Case Study
Component Number of
Components
Watts per
Component
Total Watts
per Component
Typical Weekly
Usage (hrs)
Weekly Electric Consumption
(kW-hrs)
Florescent Light 64 32 2048 63 129.02
Work Station W/Comp 5 180 900 28 25.20
Air conditioners 1 N/A
Heater 2 N/A
Light Switch 2 N/A
Windows 4 N/A
0
20
40
60
80
100
120
140
All Lights On Half Lighting
Ft-
Ca
nd
les
Center of Room Reading
Controls Lab 248 Light Intensity Sunny Day
Shades Closed Ft-Candles
Shades Open Ft-Candles
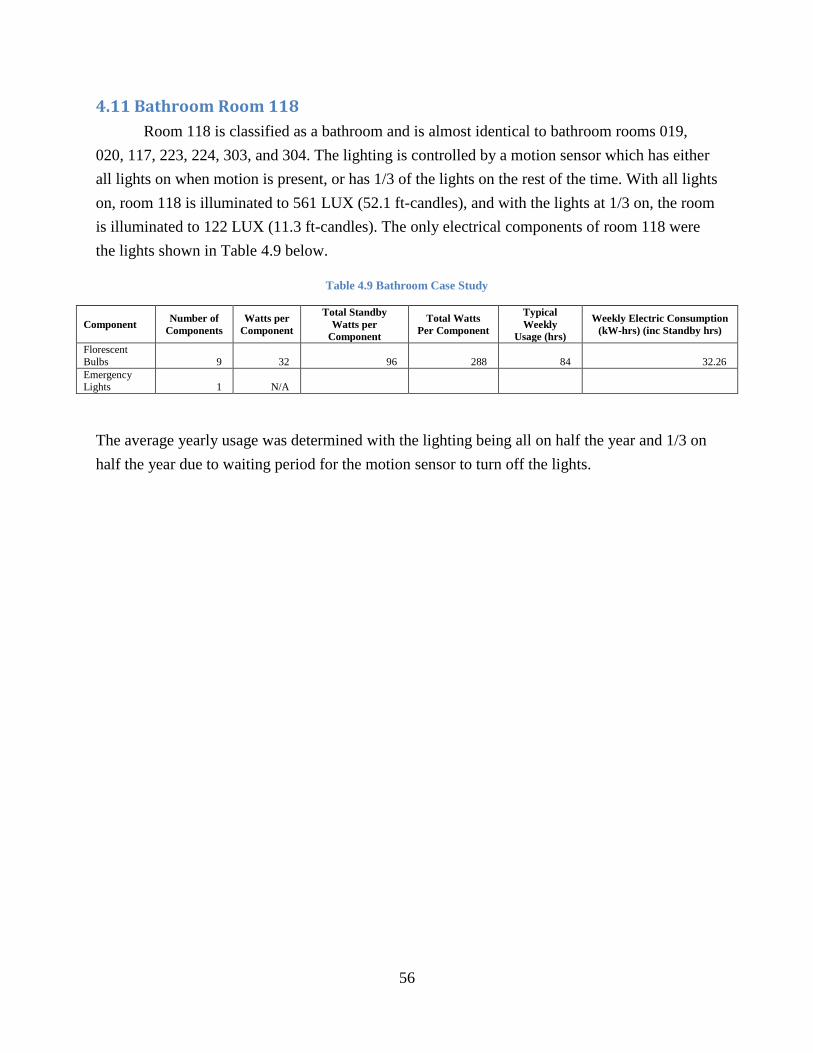
56
4.11 Bathroom Room 118
Room 118 is classified as a bathroom and is almost identical to bathroom rooms 019,
020, 117, 223, 224, 303, and 304. The lighting is controlled by a motion sensor which has either
all lights on when motion is present, or has 1/3 of the lights on the rest of the time. With all lights
on, room 118 is illuminated to 561 LUX (52.1 ft-candles), and with the lights at 1/3 on, the room
is illuminated to 122 LUX (11.3 ft-candles). The only electrical components of room 118 were
the lights shown in Table 4.9 below.
Table 4.9 Bathroom Case Study
Component Number of
Components
Watts per
Component
Total Standby
Watts per
Component
Total Watts
Per Component
Typical
Weekly
Usage (hrs)
Weekly Electric Consumption
(kW-hrs) (inc Standby hrs)
Florescent
Bulbs 9 32 96 288 84 32.26
Emergency Lights 1 N/A
The average yearly usage was determined with the lighting being all on half the year and 1/3 on
half the year due to waiting period for the motion sensor to turn off the lights.

57
4.12 Hallways Rooms 156-158
Rooms 158, 157, and 156 are classified as hallways. These hallways are identical to the
basement hallways rooms 048-050, and the second floor hallways 253-255. There are four lights
on/off light switches to have either all lights on or half lights on. These lights are never reduced
to half and are left on all year. The lighting intensity varies slightly in the halls and stay typically
at about 380 LUX (35 ft-candles). The component data for hallway rooms 156-158 is shown in
Table 4.10 below.
Table 4.10 Hallway Case Study
Component Number of
Components
Watts per
Component
Total Watts
per Component
Typical Weekly
Usage (hrs)
Weekly Electric Consumption
(kW-hrs)
Florescent Bulbs 106 32 3392 168 569.86
Exit Signs 7 40 280 168 47.04
Emergency Lights 0 N/A
Light Switches 4 N/A

58
4.13 Meter Readings
The main electrical meter in the sub-basement of Higgins Lab was accessed in order to
develop a day by day electricity usage profile. This meter can read current, amperage, voltage,
wattage, watt hours, and demand power in watts and volts. The instantaneous wattage and the
watt hours were measured every day at 1:30pm for 9 days. This is shown in Table 4.11 below.
Table 4.11 Higgin's Electrical Meter Readings
Date Instantaneous
Watts
Watt Hour Meter
Mega-Watts
Watt Hour Meter
Mega-Watts per Day
4/21/2009 316 3771.64
4/22/2009 352 3778.18 6.54
4/23/2009 329 3784.42 6.24
4/24/2009 288 3790.44 6.02
4/25/2009 314 3796.56 6.12
4/26/2009 323 3802.34 5.78
4/27/2009 360 3808.48 6.14
4/28/2009 382 3816.08 7.60
4/29/2009 294 3822.36 6.28
Average 6.34
4.14 WPI Electricity Use/Cost Profile
Figure 4.17 and Figure 4.18 give a full compilation of WPI‘s electric bills and charges
for the last 3 years. In 2006 the campus energy supplier was Select Energy, who was being
bought out by Hess Energy Corporation at the time. Hess bought Select on June 1st 2006. The
energy supplier is the company actually making the electricity, not distributing it. Hess was still
using Select‘s information management system up through around January 1st 2007. At the same
time in January WPI switched their energy supplier to National Grid‘s basic energy provider,
and began paying for electricity supply through their NG bill, Only one or two people in the
current Hess Corporation were familiar with the old information system, and were able to email
copies of the bills. The campus switched suppliers again in August of 2008 to Direct Energy
and has been with them ever since. National Grid has been WPI‘s electricity distributor for the
entire 3 years.
Figure 4.17 gives a breakdown of average kilowatt hours used daily. The meter reading
periods often vary as can be referenced in the table in Appendix A. This graph was obtained by
dividing the kWh billed for each month by the number of days the corresponding meter reading
covered. This information was acquired through the National Grid Bills. Figure 4.17 shows a

59
rise in energy consumption in the later summer months. This makes sense because the campus
provides its own heating during the winter, but uses a lot of electricity to power its water coolers
and air conditioners. There is also a drop in January which is when all students are on a month
break. The usage pattern is steady, with a slight decrease overall in 2008 and 2009.
Figure 4.17 Average Kilowatt Hours Used Daily
Figure 4.18 is a compendium of data acquired from National Grid Bills, Hess Energy
Bills, and Direct Energy bills that can be referenced in Appendices B, C, and D respectively.
This figure reflects cost fluctuations and trends in electrical spending through the last three years.
Figure 4.18 Average Daily Electricity Cost
0
10000
20000
30000
40000
50000
60000
20
06
jan
uar
y
Feb
ruar
y
Mar
ch
Ap
ril
May
Jun
e
July
Au
gust
Sep
tem
ber
Oct
ob
er
No
vem
ber
Dec
emb
er
20
07
Jan
uar
y
Feb
ruar
y
Mar
ch
Ap
ril
May
Jun
e
July
Au
gust
Sep
tem
ber
Oct
ob
er
No
vem
ber
Dec
emb
er
20
08
Jan
uar
y
Feb
ruar
y
Mar
ch
Ap
ril
May
Jun
e
July
Au
gust
Sep
tem
ber
Oct
ob
er
No
vem
ber
Dec
emb
er
20
09
Jan
uar
y
Feb
ruar
y
Mar
ch
KW
H U
sed
Month
Ave Dail KWH Use
Average Kilowatt Hours Used Daily200820072006 2009
0
1000
2000
3000
4000
5000
6000
7000
8000
9000
Mar
ch
Ap
ril
May
Jun
e
July
Au
gust
Sep
tem
ber
Oct
ob
er
No
vem
ber
Dec
emb
er
20
07
Jan
uar
y
Feb
ruar
y
Mar
ch
Ap
ril
May
Jun
e
July
Au
gust
Sep
tem
ber
Oct
ob
er
No
vem
ber
Dec
emb
er
20
08
Jan
uar
y
Feb
ruar
y
Mar
ch
Ap
ril
May
Jun
e
July
Au
gust
Sep
tem
ber
Oct
ob
er
No
vem
ber
Dec
emb
er
20
09
Jan
uar
y
Feb
ruar
y
Mar
ch
Co
st $
$
Month
Ave Daily Electricity Cost
Average Daily Electricity Cost2006 2007 2008 2009

60
4.15 Higgins Laboratory HVAC
The entire HVAC system is turned on at 6 a.m. and is shut off at 9 p.m. during weekdays,
turned on at 7 a.m. and shut off at 3:30 p.m. during weekends, and completely shut off during
vacations and holidays. For the majority of the time, only one chiller is operating with two
pumps on the rooftop. The other chiller is left on standby for extreme cases that would occur
only in the summer. The system continuously runs throughout the day and is controlled by a
program on a computer in the office of Norman Hutchins. The system is basically set at a certain
value during heating season and cooling season and is left to run on its own. The system is fairly
efficient as is, with the installed VFD motors and the use of Variable Air Volume distribution
systems.24
Since WPI provides its own heating through steam, that further adds to the efficiency of
the Higgins HVAC system leaving only the cooling and ventilation systems in charge of the
electrical consumption. Higgins Labs is kept cool by two Air-Cooled Series R Rotary Liquid
Chillers manufactured by Trane located on the rooftop. The cooled water is moved down into the
building by 3 pumps (two of which are on VFD motors) each operating at 1/3 HP at 120 Volts
corresponding to a power draw of 11.7 kWh per pump motor daily. While running, these systems
alone consume roughly 23.4 kWh per day which corresponds to 8424 kWh/yr and a total of
$1,179 per year. In Higgins Labs, there are a total of 85 electric motors which run the fans and
pumps on the circulation systems. The different types of motors and their power draws are listed
in Error! Reference source not found..
Table 12-HVAC System Motors & Their Associated Power Draws.
Quantity HP
Voltage
Req. Instantaneous Weekday Run Weekend Run Weekday Daily Weekend Daily
(V) Power Draw (kW) Time (hr) Time (hr) Power Draw (kWh) Power Draw (kWh)
8 1/3 120 1.99 15 8.5 29.83 16.90
13 3/4 120 7.27 15 8.5 109.06 61.80
6 1 120 4.47 15 8.5 67.11 38.03 6 1 1/2 120 6.71 15 8.5 100.67 57.05
20 1/4 120 3.73 15 8.5 55.93 31.69
4 2 120 5.97 15 8.5 89.48 50.71 1 2 1/2 120 1.86 15 8.5 27.96 15.85
2 3 120 4.47 15 8.5 67.11 38.03
1 20 120 14.91 15 8.5 223.71 126.77 1 5 120 3.73 15 8.5 55.93 31.69
9 1/6 120 1.12 15 8.5 16.78 9.51
6 1 208 4.47 15 8.5 67.11 38.03 3 7 1/2 208 16.78 15 8.5 251.67 142.62
2 5 208 7.46 15 8.5 111.85 63.38
3 20 208 44.74 15 8.5 671.13 380.31
Total Power
Draw: 129.69 kW 1945.34 kWh 1102.36 kWh
24
Interview with Norman F. Hutchins-Head of HVAC Systems here at WPI

61
Motion Occupancy Sensors
Motion sensors coupled with replacing standard light bulbs with energy-efficient ones is
way to add a bit of more on energy-savings in Higgins Labs. Alone they won‘t save as much
money or energy as replacing standard light bulbs with energy-efficient ones but together can
boost up efficiency. Currently in Salisbury 305 the sensor illustrated below is in use.
Figure 4.19 Occupancy Sensor currently in use in Salisbury Labs 305
PRODUCT DESCRIPTION Price: $264.
67 The CI-24 is a ceiling-mount passive
infrared occupancy sensor specifically designed to
interface with Building Automation Systems through an
internal isolated relay. A user-adjustable time delay (30
seconds to 30 minutes) on deactivation may be
programmed through DIP switches to prevent
unnecessary cycling. The CI-24 includes a built-in
override switch. Two levels of sensitivity are also
selectable through DIP switches. The four-level
patented Fresnel lens allows the CI-24 to cover up to 1200 ft2 (111.48 m2).
Table 4.13 Sensor Information
Power supply 24 VAC/DC
Power consumption 37 mA
Time-delay adjust Digital (DIP switch setting) for 30 sec, 10 min., 20 min.
or 30 min.
Coverage 360° up to 1200 ft2 (111.48m2)
Color White
Isolated contact
rating 1A 24 VAC/VDC, 1/2A 120VAC
Agency approvals UL and ULC listed
Operating temp 32° to 98°F (0°to 36°C)

62
CO2 Occupancy Sensors
When a building is designed, the maximum expected occupancy is determined to develop
settings for outdoor fresh air ventilation required for the building. The use of outside air, needed
for fresh air ventilation, can be expensive due to the heating or cooling requirements of the fresh
air on particularly warm or cool days.
When occupancy is at only a fraction of the possible maximum occupancy or the room is
just vacant, the amount of outside air, which is typically at a fixed level, may be 10 times what is
needed for the actual occupancy of the building at any given time. The cost of heating or cooling
this excessive amount can be significant. CO2 sensors lower the demand on the chillers, the
supply fan loads, and heaters.
Figure 4.20 Example of a typical CO2 Sensor.
Price: $264.67
Vendor: HONEYWELL
COMMERCIAL
A CO2 (carbon dioxide) sensing system uses real
time CO2 measurements throughout the building to
determine actual occupancy continuously during the day. The CO2 system adjusts outside air
delivery to provide only the amount of ventilation needed for actual real-time occupancy in the
space, thus virtually eliminating 100% of the excessive amount of outside air used in a building.
The result is the elimination of the cost of excessive outside air ventilation.
4.16 Higgins Laboratories
The major electric components such as incandescent and fluorescent light bulbs, computers,
projectors, and the CCUs of the rooms in bold in Figure 4.1 were documented. Table 4.14
Building Electric Consumption by Component contains the data collected.

63
Table 4.14 Building Electric Consumption by Component
Component Quantity Average Watts per Component Total kWatts
HVAC 85 1526 129.69
Number of Fluorescent Light Bulbs 1933 32 61.86
Number of Computers 120 115 13.80
Number of Incandescent Bulbs 67 75 5.03
Projectors 6 367 2.20
CCUs 6 150 0.90
TOTAL
213.47
4.17 A day in the Life of Higgins Laboratories
The electricity consumption of Higgins Labs was monitored every hour for a period of 24
hours in order to develop a baseline daily electric consumption. A walkthrough was performed
periodically in order to see what computers, lights and equipment were in use. The monitoring
started at 11:00 PM and went to 11:00 PM the following day. It was found that all classroom
lights were on when not in use, and all hall lighting was set to its highest setting. The only rooms
with equipment and lighting turn to its lowest level were all laboratories that were not occupied
and the offices. Therefore, at 3:00 AM, all lighting in the entire building was turned to its lowest
level. The data collected from the electric meter is shown in Table 4.15.
Table 4.15 A day in the Life of HL Meter Readings
Instantaneous Demand Watt Hour Meter Watt Hour Meter
Time kWatts kWatts MWatt Hours MWatt Hours per Hour
11:00 PM 219 236 3819.06
12:00 AM 241 210 3819.28 0.22
1:00 AM 168 177 3819.47 0.19
2:00 AM 178 198 3819.67 0.20
3:00 AM 211 201 3819.85 0.18
4:00 AM 146 142 3820.01 0.16
5:00 AM 162 153 3820.18 0.17
6:00 AM 201 200 3820.36 0.18
7:00 AM 227 222 3820.58 0.22
8:00 AM 240 246 3820.80 0.22
9:00 AM 275 265 3821.06 0.26
10:00 AM 278 289 3821.34 0.28
11:00 AM 315 292 3821.62 0.28
12:00 PM 315 281 3821.91 0.29
1:00 PM 304 295 3822.21 0.30
2:00 PM 289 297 3822.50 0.29
3:00 PM 329 308 3822.81 0.31
4:00 PM 327 308 3823.12 0.31
5:00 PM 287 287 3823.41 0.29
6:00 PM 286 280 3823.69 0.28
7:00 PM 230 246 3823.95 0.26
8:00 PM 248 267 3824.21 0.26
9:00 PM 194 226 3824.45 0.24
10:00 PM 212 240 3824.67 0.22
11:00 PM 235 239 3824.87 0.20

64
Chapter 5 Analysis
5.1 Introduction
This chapter contains analysis of the data collected in Chapter 4 Results. This includes
Higgins Labs illumination, projections of yearly electrical consumption and costs for case
studies, electric use in ‗A Day in the Life of Higgins Labs‘, overall building electric consumption
and projected costs by core systems, National Grid incentives, and campus wide electricity costs.
5.2 Office Room 250
In this office, take note that the paper shredder takes the most electricity to run, however, it
is not used frequently, as can be seen in the comparison between Figure 4.1and Figure 4.2. The
laser printer is never shut off and the printer remains in standby until something is being printed.
For this office, the OSHA standards require illumination of 30 ft-candles. From the results in
Office Room 2504.4, this office is over-illuminated by 44%. The yearly electric usage, Figure
5.1, was extrapolated using Table 4.1 and determined on a five day work week whereas all
equipment is typically shut off for the weekend. As can be seen in Figure 5.1, the fluorescent
lights in this room use the most electricity on a year by year basis, about 35%. The second most
consumer of electricity is the laser printer which expends about 30% of the yearly electric
consumption.
Figure 5.1
0
50
100
150
200
250
300
350
400
450
Flourescent
Lights
Laser
Printer
Computer Comuter
Monitor
Desk Light Desk Fan Paper
Shredder
Computer
Speakers
Pencil
Sharpener
Label
Printer
kW
-hrs
Component
Yearly Electric Usage by Component

65
5.3 Auditorium room 218
OSHA standards state for this room to be illuminated a minimum 30 ft-candles. Figure
4.3 shows that the room is over-illuminated by about 190% with all lights on. Room 218 can be
properly illuminated at night or on a cloudy day by just the fluorescent bulbs in the room two
thirds on. On a sunny day, with no direct sunlight, the room can be illuminated with just one
third of only the fluorescent lights. Figure 5.2 shows the yearly electric consumption of
Auditorium Room 218, extrapolated from Table 4.3, where it can be seen that the fluorescent
lighting of the room uses about 45% of the electricity, and the incandescent lighting uses about
24% of the electricity.
Figure 5.2
0
2000
4000
6000
8000
10000
12000
14000
16000
Florescent
Light
Incandescent
Bulb
Projector Marker Board
Lights
Exit Sign CCU Clock
kW
-hrs
Components
Auditorium Room 218 Yearly Electricity Usage per Component

66
5.4 Classroom 114
OSHA standards state for this room to be illuminated a minimum 30 ft-candles.
Therefore, this room is always over-illuminated. Figure 4.6 shows that room 114 is over-
illuminated by about 190% with all lights on. Room 114 can be properly illuminated on a cloudy
day with the shades open and only the board lights on, as well for a sunny day. As can be seen in
Figure 4.7, the lighting in room 114 utilizes about 71% of the instantaneous electricity but, from
Figure 5.3, extrapolated from Table 4.4, only uses about 54% of the yearly electricity
consumption. The projector uses about 38% of the yearly electric consumption.
Figure 5.3
0
500
1000
1500
2000
2500
3000
3500
4000
4500
Florescent Light Projector CCU Marker Board Lights Clock
kW
-hrs
Component
Classroom Room 114 Yearly Electric Usage per Component

67
5.5 Conference Room 201
OSHA standards state for this room to be illuminated a minimum 10 ft-candles. Room 201
is actually under-illuminated (Figure 4.9) if the shades are closed, but is over-illuminated by as
much as 470% (Figure 4.10) with the shades open. Table 4.5 shows the instantaneous electricity
consumption by the lighting is 99% of the total, and, from Figure 5.4, extrapolated from Table
4.5, 99% of the yearly electricity consumption for room 201.
Figure 5.4
0.00
50.00
100.00
150.00
200.00
250.00
300.00
350.00
Incandescent Bulbs Clock
kW
-hrs
Component
Conference Room 201 Yearly Electric Usage

68
5.6 Conference Room 102
OSHA standards state for this room to be illuminated a minimum 10 ft-candles. From
Error! Reference source not found. and Error! Reference source not found., conference
room 102 is always over-illuminated with all lights on as long as the shades are open. Figure 5.5,
extrapolated from Table 4.6, shows the fluorescent lighting consumes about 71% of the room
electricity, and the incandescent lighting, Ls212k1 bulbs, use the remaining 29%.
Figure 5.5
0
100
200
300
400
500
600
700
800
900
1000
3 Prong Florescent Ls212k1 Bulb
kW
-hrs
Component
Conference Room 102 Yearly Electric Usage
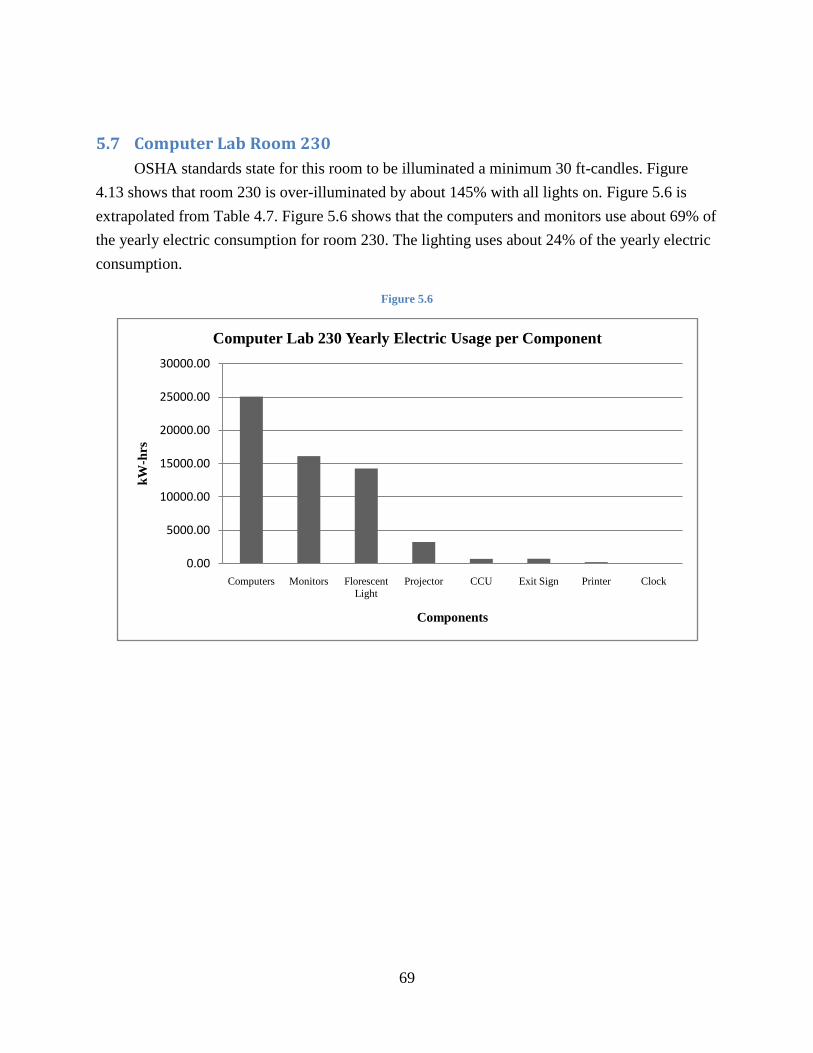
69
5.7 Computer Lab Room 230
OSHA standards state for this room to be illuminated a minimum 30 ft-candles. Figure
4.13 shows that room 230 is over-illuminated by about 145% with all lights on. Figure 5.6 is
extrapolated from Table 4.7. Figure 5.6 shows that the computers and monitors use about 69% of
the yearly electric consumption for room 230. The lighting uses about 24% of the yearly electric
consumption.
Figure 5.6
0.00
5000.00
10000.00
15000.00
20000.00
25000.00
30000.00
Computers Monitors Florescent
Light
Projector CCU Exit Sign Printer Clock
kW
-hrs
Components
Computer Lab 230 Yearly Electric Usage per Component

70
5.8 Controls Lab Room 248
OSHA standards state for this room to be illuminated a minimum 30 ft-candles. From
Figure 4.16, at half lighting and the shades closed, room 248 is over-illuminated by 210%. With
the shades closed and at full illumination, room 248 is over-illuminated by 300%. Therefore, this
room is always over-illuminated. Figure 5.7, extrapolated from Table 4.8, shows the yearly
electric consumption of the lighting is about 84% of the total and the remainder by the work
stations.
Figure 5.7
0
1000
2000
3000
4000
5000
6000
7000
8000
Florescent Light Work Station W/Comp
kW
-hrs
Component
Controls Lab 248 Yearly Electric Consumption by Component

71
5.9 Bathroom Room 118
OSHA standards state for this room to be illuminated a minimum 10 ft-candles. From the
light intensity readings in section 4.11 Bathroom Room 118, this room is always over-
illuminated by 13% with 1/3 lighting, and by 421% when fully illuminated. The yearly electrical
consumption of Bathroom 118 was extrapolated from Table 4.9 whereas all the electrical
consumption is due to lighting. This is about 1600 kW-hrs.

72
5.10 Hallways Rooms 156-158
According to OSHA, as stated earlier, the minimum illumination requirement is 5 ft-
candles. Therefore, from the illumination readings in section 4.12 Hallways Rooms 156-158, this
hallway is over-illuminated by about 600%. Figure 5.8 shows the yearly electric consumption of
hallways 156-158 by component which was extrapolated from Table 4.9, for which the
fluorescent illumination was determined to use about 92% of the yearly consumption and the exit
signs used the remainder.
Figure 5.8
0
5000
10000
15000
20000
25000
30000
35000
Florescent Bulbs Exit Signs
kW
-hrs
Component
Hallways Room 156-158 Yearly Electric Consumption by Component

73
5.11 Higgins Labs Meter Readings
Extrapolated from Table 4.11, for the week of April 21 to April 28, 2009, Higgins Labs
used an average of 329kW instantaneous electricity and 6.34 MW-hrs of electricity per day.
From the documented electrical consuming equipment in Table 4.14, the calculated
instantaneous electric consumption only accounts for about 65% of the metered reading. This
was to be expected due to the varying factors of the building. Components of the building such
as mills and lathes in the machine shop laboratory room 004 draw large amounts of electricity
however are not used on a scheduled basis. These mills and lathes are not incorporated in Table
4.14. Other equipment such as personal laptop computers, refrigerators and microwaves were not
accounted for either. The electric consumption of the computer servers located in Higgins Labs
could not be determined.
During a day in the Life of Higgins Laboratories, the average instantaneous electric
consumption, from Table 4.15, was 244kW, the average peak demand was 244.2kW, and the
average watt hours used was 242.2kWh per hour. This is lower than the average taken from
Table 4.11 by about 24%. This is due to the time the meter readings from Table 4.11 were taken.
From Table 4.14, the documented equipment accounts for 87% of the electric consumption.
5.12 CCU and Computer Analysis
There are several small scale, low cost changes that can be made to existing systems in
order to reduce campus wide electricity consumption. There is a computer control unit inside
every classroom and auditorium. This is typically a podium that locks so that none of the interior
equipment can be removed with a monitor on top. Inside there is a video cassette player, a digital
video disc player and the computer for the monitor. There is also a set of controls that power on
the ceiling mounted projector as well as lower the projector screen above the whiteboards. These
podiums can be found inside of every academic building. Some classrooms have the equipment
inside a cabinet with a counter on top for the monitor. The ceiling projectors and CCU are two
components that draw a large amount of electricity, even when in their lowest standby phase.
The CCU draws 50-60 watts in its lowest power stages, and as much as 160 watts when in full
use. The nominal use is considered to be when the VCR and DVD player are off, but the
computer and monitor are on and in standby mode, and uses about 140 watts. This is the most
common situation to encounter when entering a classroom and inspecting the CCU. The
projectors use 360-370 watts when in standby mode. Almost every area with a CCU also has a
projection unit, and between the main academic buildings alone there are about 36 CCUs.
The main dilemma here is that the computer control units are not capable of a true
shutdown. This can be easily overcome by installing small outlet switches between the
component‘s plug and the wall outlet, containing a switch on the side that allows for true shutoff

74
of anything plugged into it. This would allow the CCU to be truly shutdown. The projector on
the ceiling is always in a standby mode, and the controls on the podium simply turn the bulb in
the projector on. This is a little trickier to handle because it is out of reach so a simple fix like an
outlet switch is not feasible. If the projector was rewired so that all power to it came directly
from the CCU, then it could also be truly shutdown with the switch.
5.13 National Grid Incentive Programs
National Grid has many services available to their clients to aid in creating a more energy
efficient world. Mike Thompson is a National Grid employee who directly handles WPI‘s energy
account. He explained that when East Hall was built NG paid approximately $200,000 dollars for
having energy efficient lights, chillers, and ventilation motors installed. He pointed out that there
are also many programs that can help in renovating current lighting and HVAC systems in
existing buildings. These programs are called incentive programs. The incentive means that
depending on how efficient the new upgraded system is, as long as the minimum requirements
are met for energy savings, NG will pay WPI back a specific amount of money for each change
made. The eligibility requirements are outlined below.
II. Incentive Program Selection25
: Energy Initiative vs Design 2000plus
The Energy Initiative incentive program is applicable to projects where there are existing
lighting systems that are being upgraded to improve efficiency.
Exceptions: The Design 2000plus incentive program would apply if there is an existing lighting
system under any of the following conditions:
• The space is undergoing a major renovation
• The use of the space is changing so that the required lighting levels are dropping by 20% or
more
• Whenever the proposed lighting project reduces light levels by 20% or more
Based on the studies done during this project with LUX meter, reducing light levels in the
majority of rooms by 20% is realistic and will still keep the levels within OSHA standards. This
makes WPI eligible to receive incentive payments or upgrading the lighting system.
Figure 5.9 shows an example of a lighting incentive. Each one has an associated code
number. The incentive explains what criteria must be met, and what situations need to be
avoided to remain eligible for payback. The Incentive box gives the dollar amount per fixture
25
https://www.nationalgridus.com/non_html/shared_energyeff_lighting_existing.pdf 4/19/09

75
that the campus could receive from NG if this specific fixture is installed. Many other examples
are shown in the National Grid Incentive Document in Appendix D. Some of the incentives
require that a minimum number of watts must be saved with the new installation.
Figure 5.9 National Grid Incentive Example
5.14 Actual Cost of Electricity
Computing how much WPI actually pays for each kilowatt-hour they use required
compiling a lot of information from many sources.
Figure 5.10 Cost in USD Per kWh

76
As Figure 5.10 shows, WPI has paid almost as much as $0.168/kWh and as little as
$0.105/kWh. The lower cost actually occurs most recently in March of this year. Some of the
peak charges are due to a month where there was a large instantaneous demand. When all the
students return from breaks, they tend to turn everything on, and plug in many thing in a short
amount of time. This can result in an abnormally high instant demand for electricity, which
National Grid applies to the entire monthly billing period.
5.15 HVAC Analysis
After speaking with Norman Hutchins from the Facilities Department, who is in charge
of the HVAC systems here at WPI, it can be concluded that there isn‘t much that can be done to
improve the current system without replacing it with a newer system. Certainly there is a more
efficient system out there on the market as technology continues to improve over the years,
especially since the current system was issued for construction in July of 1994. The payback
period and inconvenience to install a new system is costly and unreasonable and there really is
no reason to do so.
Norman has been monitoring the success of this device. He developed an Excel spreadsheet
showing fan run time hours saved as a result of the installation of this device. The data obtained
spans from 3/19/09 – 4/23/09. It shows that initially on 3/19 in this room alone, the ventilation
fans were running for 337.59 hours. Now as of 4/23, the fans were running for 152.02 hours. The
fan hours saved were 185.57 which correspond to a 54.9% decrease (see Table 18 below). One
can only imagine the amount of savings incurred if these sensors were to be installed throughout
the campus.
0
0.02
0.04
0.06
0.08
0.1
0.12
0.14
0.16
0.18
Mar
ch
Ap
ril
May
Jun
e
July
Au
gust
Sep
tem
ber
Oct
ob
er
No
vem
ber
Dec
emb
er
20
07
Jan
uar
y
Feb
ruar
y
Mar
ch
Ap
ril
May
Jun
e
July
Au
gust
Sep
tem
ber
Oct
ob
er
No
vem
ber
Dec
emb
er
20
08
Jan
uar
y
Feb
ruar
y
Mar
ch
Ap
ril
May
Jun
e
July
Au
gust
Sep
tem
ber
Oct
ob
er
No
vem
ber
Dec
emb
er
20
09
Jan
uar
y
Feb
ruar
y
Mar
ch
Do
llar
Month
Cost $/kWh

77
Table 16-Fan Run time hours Saved in Salisbury Labs 305
The system works well with constant or variable airflow systems and installation is quite
simple, with the availability of wireless systems that work equally well with pneumatic or digital
building control systems. A typical installation would involve installing CO2 sensors in each
major distinct occupied zone (i.e. a suite, meeting room, or lecture hall). Generally one sensor
should serve about 5000 square feet of floor area. Based on the CO2 reading in the space,
ventilation can be regulated in the zone, for the floor or entire building. If a number of areas are
served by one ventilation control device, ventilation levels are usually based on the highest level
measured in all served zones. Return air sensing is not advised as it may not represent ventilation
levels in a particular space. The combined use of economizers and CO2 control are the one-two
punch for getting control of ventilation related energy costs. When outside conditions are right,
the outside air will be used for free cooling. During the bulk of time when outside air is too
warm, too humid or too cold, CO2 control will regulate outside air to minimize energy cost and
optimize indoor air quality. Unusual levels of CO2 can also give an indication of a malfunction
somewhere in the air delivery system. In selecting a CO2 sensor, it is important to consider how
the sensor deals with calibration. While first cost may in some cases be lower, the maintenance
requirements for a poorly performing sensor can far exceed any energy savings generated

78
Chapter 6 Conclusions and Suggestions
6.1 Introduction
There are several actions that can be taken to address issues discovered throughout the
course of the energy audit. This chapter includes suggestions based on the results and analysis
chapters in order to develop higher energy awareness for Higgins Labs and WPI such as energy
monitoring and potential electric saving measures.
6.2 Lighting Suggestions
Many of Higgins Labs classrooms, auditoriums, offices, hallways, bathrooms, and
laboratories are over-illuminated at all times. Lights are left on when room are not in use.
Incandescent lighting can still be found throughout Higgins Labs. This excess lighting leads to
excess wasted electricity.
The first suggestion is to replace any incandescent lighting with alternative electricity
saving bulbs. Compact fluorescent bulbs can produce as much light as incandescent bulbs while
using a fraction of the electricity. The standard 75watt incandescent bulb can be replaced with a
dimmable 15watt compact fluorescent bulb26
. Documented in Higgins Labs, this would reduce
electric consumption by about 4kW minimum. Based on an average electric cost of $0.14 per
kW-hr, the retail payback period for one bulb would be about one month. Projected savings
would be about $3800 per year (appendix). Even more efficient lighting, LED bulbs, can be
implemented to replace any incandescent bulbs. Replacing the incandescent bulbs in Higgins
Labs, a 1W LED bulb can be utilized27
. Even though the LED bulbs are at a higher cost, the
payback period would only be about two months. The projected annual savings would be about
$4500. These projections do not include life expectancy of the bulbs. However, the life
expectancy of the compact fluorescent bulbs is greater than the incandescent bulbs, and the life
expectancy of the LED bulbs is even greater.
The most utilized form of lighting in Higgins Labs consists of the 32W fluorescent bulbs.
These bulbs can be replaced by 15W LED T8 bulbs28
. The LED T8 bulbs come at a high retail
cost of about $65 per bulb, however they are dimmable using from 0-15W. The payback period
for these bulbs would be about three years. The annual savings thereafter would be about
$40,000.
26
SDS15-2P (Dimmable). Bulbs.com. http://www.bulbs.com/eSpec.aspx?ID=15427&Ref=Category&RefId=13&
Ref2=Light+Bulbs 27
LED/G16W (LED, White). Bulbs.com. http://www.bulbs.com/eSpec.aspx?ID=13973&Ref=Category&RefId=13 28
LED T8. Creativelightings.com. http://www.creativelightings.com/ProductDetails.asp?ProductCode=200007

79
In order to eliminate human error of forgetting to turn off lights, motion sensors can be
installed in hallways, storage rooms, classrooms, and laboratories. Motions sensors29
, akin to the
one in Figure 6.1, can already be found in all the bathrooms in Higgins Labs. This will ensure
lights are not on when not in use.
Figure 6.1 Motion Sensor Light Switch
A more sophisticated lighting system was developed by Panasonic called the ―Auto-eco
Light-control Twin Pa30
.‖ This lighting system measures the light intensity in the room the
system is in and automatically dims the lighting to required levels. This allows for rooms to not
be over-illuminated and decreases the lighting electrical consumption. This is a new product that
hasn‘t hit the market yet. However, this eco lamp shows a potential to be utilized at WPI in order
to help decrease the lighting issues.
6.3 Computer Suggestions
The majority of computers in Higgins Labs are on 24 hours a day. Most of these computers
are manually programmed to go into a sleep or hibernation mode after some period of non use.
Unfortunately, many computers go into a standby mode after a period of non use. This standby
mode puts the monitor at a lower level of electric consumption, but the computer itself still
draws about 60W. All computers in Higgins Labs have the ability of completely shutting off
after a period of non use. This feature should be implemented in order to decrease this excess
electric consumption.
In addition to programming computers to shut off after non-use, the implementation of
smart power strips31
can decrease electrical consumption of the computers in Higgins Labs. Even
when the computer is set to automatically shut off, the computer and monitor still draws about
6W. A smart power strip can detect when a device is in the lowest power setting and cut the
29
White Motion Switch. DoItBest.com. http://doitbest.com/Main.aspx?PageID=64&SKU=512273&utm_source=
Froogle&utm_medium=FREECSE&utm_term=512273&utm_content=6790&utm_campaign=DATAFEED 30
Panasonic Launches Eco Lamp. http://gadgets.softpedia.com/news/Panasonic-Launches-Eco-Lamp-1003-01.html 31
Smart Surge Strip. http://www.topmic.com/112-0189.html

80
power completely therefore eliminating electric leakage. If one of these smart power strips were
attached to each computer, the payoff period would be about 5 years. The annual savings would
be about $440. This is a conservative estimate since more than just the computer and monitor can
be attached to this strip, eliminating even more electric leakage. This payback period is based on
leakage alone. If the true shutoff is implemented instead of standby, the payback period for these
strips would be about nine months and the annual savings would be about $4400.
6.4 CCU and Projector Suggestion
Below is information taken offline about the switch that is being proposed as a solution.
The payback period is estimated for one CCU by purchasing one switch. If the switches were
bought in bulk the price would drop as well as the time for payback. In order to keep the estimate
conservative, it is assumed the CCU is in its lowest power state of 50 watts when not being used.
In actuality, the CCU‘s have a program that puts them into a sleep/standby mode after about
fifteen minutes. People utilizing the rooms have been advised by Network Operations not to shut
the computers down during the week, since they have this standby program. Due to this fact, the
computers are almost always found in their nominal 140 watt-drawing stage.
The ―BH9936 Remote Controlled Switch Socket‖32
is
ideal for the remote operation of many electrical devices,
including lamps, appliances, tools and more. It offers a
working range of up to 100-feet, and even works outside! The
remote control and power socket are fashioned in a sleek pearl
design. With one 9-volt (not included) battery for the remote
you are ready to go! Get your BH9936 Remote Controlled
Switch Socket today!
32
http://closeoutcomputerwarehouse.com/index.php?main_page=product_info&products_id=7799 4/20/09
Figure 6.2 Outlet Switch

81
6.5 National Grid Relationship
Mike Thompson has a daughter that goes to WPI, and is familiar with the campus. He
said he would be very happy to help, and that he hopes to hear from WPI on a more regular
basis, in order to start an ongoing evolution of developing a more energy efficient campus.
National Grid offers to pay a minimum of 45%, and up to 100% of an energy audit if WPI has
one performed. If the campus puts into place any of the suggestions that the audit company has,
NG will cover even more of the cost of electrical renovations. This brings to light the importance
of having an extensive campus wide energy audit done. This will benefit the campus when
upgrading existing systems as well as when installing new ones.
This is one kind of outlet switch (Figure 6.2
that would address the computer control unit issue. The
first option explored was very similar but did not have
a ground. A second option was very similar, but did not
come with a remote and was a little more expensive.
The switch shown above is available at low cost,
comes with a one year warranty, and has the added
convenience of being remote controlled. This means
that a professor leaving the room does not have to bend
down to flip the outlet switch. The remote functions off
of a nine-volt battery. The wall unit itself also has an
on-off button in case the remote is lost or dies.
Payback
In a worst case scenario, the CCU will be in
use from 7am until 10pm. This would mean that it is
not in use eleven hours a day. This assumes that every
professor and group using the room will need the
CCU for their entire hour, and that none are teaching
from the whiteboards. This was done to make sure the
payback calculation is conservative. Shutting the CCU
off for eleven hours a day, assuming it is pulling 50
watts and WPI is paying 14 cents a kWh, equates to a
payback period of just less than 5 months. This
warranty covers a full year, which is almost triple the
conservative payback period estimate.
Features/Specifications:
General Features:
Remote controlled outlet
Turn lights on from anywhere (even outside)
433.92 MHz frequency
100-foot range
Works through walls, floors and doors
Great for use anywhere in your home
Single 3-prong outlets
120 v 60 Hz voltage
10 A current
Operates on a 9-volt battery (not included)
Socket Dimensions:
2.75 x 5 x 1.75-inches (W x L x D,
approximate)
Regulatory Approvals:
cULus
FCC
Remote controlled switch socket included
Remote control included
Notes:
Model: BH9936
No.: 1408
9-volt battery not included
Product Requirements:
Available power outlets
9-volt battery (for remote)
The Warranty Period Is: 1 Year
Product Number: CON-BH9936

82
There is also an Energy Profiler Online program that WPI pays for. It was signed up for
by John Miller and hasn‘t been utilized since he left the campus. This system will allow the
campus to track its energy use and peak demand times. This makes it possible to identify what
times extra precautions towards electrical consumption should be taken. The profiler takes an
instantaneous reading from the campus core meter every fifteen minutes. In order to utilize this
tool to its full potential, fully working electrical meters should be replace any broken ones on
campus.
6.6 HVAC Conclusions
Savings with the current HVAC system are going to come from the installation of
occupancy sensors and CO2 sensors. So far, there are about a half dozen installed on campus. It
shows that efforts have been made towards the efficiency matter, but still shy of the ultimate
goal. The current HVAC system is as efficient as it is going to get without replacing it with
newer technology. Yes, there are over 82 motors that operate on constant drives but because the
majority of these motors are a fraction of a Horsepower there is nothing valuable gained if you
were to put these all on Variable Frequency Drives. ―You actually get more savings by just
shutting them off,‖ said Norman. With all of the funding for these energy savings projects
coming from the Building Management Systems (BMS) budget of only $30,000 it can be seen
why a significant effort hasn‘t been made to implement these sensors all over campus. The first
step to making efficiency possible would be to increase the available budget allocated for these
matters.

83
Works Cited
―Climate Protection‖. Sustainability. Worcester Polytechnic Institute. 01 April 2009. <http://
www.wpi.edu/About/Sustainability/climateprotection.html>
―East Hall‖. Sustainability. Worcester Polytechnic Institute. 01 April 2009. <http://www.wpi.
edu/About/Sustainability/eastha764.html>
―Energy Policy Act of 2005.‖ August 2008. U.S. Environmental Protection Agency. 01 April
2009. <http://www.epa.gov/oust/fedlaws/publ_109-058.pdf >.
―History of Energy in the United States: 1635-2000.‖ 01 April 2009. <http://www.eia.doe.gov/
emeu/aer/eh/frame.html>.
Krarti, Moncef. Energy Audit of Building Systems An Engineering Approach. Boca Raton
Florida: CRC Press, 2000.
―LED/G16W (LED, White).‖ Bulbs.com. 20 April 2009. <http://www.bulbs.com/eSpec.aspx?
ID=13973&Ref=Category&RefId=13>.
―LED T8 Flourescent Light Tube.‖ Creativelightings.com. 20 April 2009. <http://www.
creativelightings.com/ProductDetails.asp?ProductCode=200007>.
―LX1010B.‖ 2007. Professional Test Equipment. Multimeter Warehouse. 01 April 2009.
<http://www.multimeterwarehouse.com/FX101f.htm>.
Mauer, Eric. ―The Energy Challenge: A New Agenda for Corporate Real Estate.‖ 2007. 02 April
2009. <http://dukespace.lib.duke.edu:8080/dspace/bitstream/10161/417/1/MP_elm17_a_
200712.pdf>
National Grid. Phone Interviews.
―National Grid‘s Lighting Incentive and Eligibility Requirements Manual.‖ 2009. National Grid.
<https://www.nationalgridus.com/non_html/shared_energyeff_lighting_existing.pdf>.
―New Neuromuscular Clinic Home‖. Oregon Heath and Science University. 01 April 2009.
<http://www.ohsu.edu/xd/research/centers-institutes/neurology/neuromuscular-disease-

84
center/new-clinic.cfm>.
―Origins & Evolution of the Department of Energy.‖ U.S. Department of Energy. 01 April 2009.
<http://www.energy.gov/about/origins.htm>.
―Panasonic Launches Eco Lamp.‖ January 2009. Softpedia. 20 April 2009. <http://gadgets.
softpedia.com/news/Panasonic-Launches-Eco-Lamp-1003-01.html>.
―Regulations (Standards - 29 CFR) Illumination. - 1926.56.‖ United States Department of Labor.
Occupational Safety & Health Administration. 01 April 2009. <http://www.osha.gov/pls/
oshaweb/owadisp.show_document?p_table=STANDARDS&p_id=10630>.
―SDS15-2P (Dimmable).‖ Bulbs.com. 20 April 2009. <http://www.bulbs.com/eSpec.aspx?ID=
15427&Ref=Category&RefId=13& Ref2=Light+Bulbs>.
―Smart Surge Strip.‖ Topmic.com 20 April 2009. <http://www.topmic.com/112-0189.html>
―Tech Bible.‖ Worcester Polytechnic Institute. < http://www.wpi.edu/Academics/Library/
Archives/TechBible/>.
―Time of Use (G-3).‖ 2009. National Grid. 01 April 2009. <https://www.nationalgridus.com/
masselectric/business/rates/4_tou.asp 4/13/09>.
―U. S. Energy Consumption by Energy Source.‖ April 2009. Energy Information Administration.
01 April 2009. <http://www.eia.doe.gov/cneaf/solar.renewables/page/trends/table1.html>
―White Motion Switch.‖ DoItBest.com. 20 April 2009. <http://doitbest.com/Main.aspx?PageID=
64&SKU= 512273&utm_source=Froogle&utm_medium=FREECSE&utm_term=512273
&utm_content=6790&utm_campaign=DATAFEED>.
http://closeoutcomputerwarehouse.com/index.php?main_page=product_info&products_id=7799
4/20/09 No longer Exists
Monitoring Electricity Consumption on the WPI Campus Christopher O‘Hara, Maximillian
Hobson-Dupont, Max Hurgin, Valerie Thierry
Norman F. Hutchins-Head of HVAC Systems at WPI
Lawrence B. Riley-WPI‘s Facilities Custodial Staff

85
Appendices
Appendix A
Read Date & Days
Read Type
Total kWh
Utility Charges
Supplier Charges
Late Payment Charges
Total Charges
TOU On-
Peak kWh
TOU Off-Peak kWh
12/15/2006 Actual 1,557,600 $49,854.20 $151,538.90 $0.00 $201,393.10 741,600 816,000 31 days
11/14/2006 Actual 1,000,800 $31,677.47 $97,367.83 $0.00 $129,045.30 463,200 537,600 19 days
10/26/2006 Actual 2,124,000 $68,853.74 $206,643.96 $0.00 $275,497.70 984,000 1,140,000 41 days
9/15/2006 Actual 1,648,800 $48,522.00 $160,411.75 $516.40 $208,933.75 780,000 868,800 30 days
8/16/2006 Actual 1,646,400 $47,376.19 $160,178.26 $0.00 $207,554.45 813,600 832,800 29 days
7/18/2006 Actual 1,694,400 $47,140.87 $164,848.18 $0.00 $211,989.05 777,600 916,800 32 days
6/16/2006 Actual 1,324,800 $38,902.96 $113,270.40 $0.00 $152,173.36 621,600 703,200 29 days
5/18/2006 Actual 1,420,800 $40,301.93 $121,478.40 $447.89 $162,228.22 691,200 729,600 30 days
4/18/2006 Actual 1,476,000 $41,090.46 $203,289.48 $0.00 $244,379.94 710,400 765,600 29 days
3/20/2006 Actual 1,593,600 $42,398.85 $219,486.53 $0.01 $261,885.39 698,400 895,200 33 days
2/15/2006 Actual 1,428,000 $40,075.34 $0.00 $0.76 $40,076.10 667,200 760,800 28 days
This chart is a full compilation of WPI‘s electric bills and charges for the last 3 years.
The information in light red reflects billing periods where the campus energy supplier was Select
Energy, who was being bought out by Hess Energy Corporation at the time. The energy supplier
is the company actually making the electricity, not distributing it. The information in blue
reflects the more recent time where Direct Energy has been the electrical supplier. National Grid
has been the electricity distributor for the whole 3 years.

86
Read Date & Days
Read Type Total kWh
Utility Charges
Metered Peak kW
Metered On-Peak
kW TOU On-Peak
kWh TOU Off-
Peak kWh
7/16/2008 Actual 1,483,200 $226,697.24 3,528.00 3,528.00 722,400 760,800
30 days
6/16/2008 Actual 1,430,400 $204,274.10 3,576.00 3,576.00 636,000 794,400
32 days
5/15/2008 Estimated 1,276,800 $165,554.72 2,952.00 2,952.00 612,000 664,800
28 days
4/17/2008 Actual 1,459,200 $174,324.98 2,952.00 2,952.00 705,600 753,600
30 days
3/18/2008 Actual 1,279,200 $161,038.17 2,664.00 2,664.00 597,600 681,600
28 days
2/19/2008 Actual 1,348,800 $181,479.53 2,472.00 2,472.00 583,200 765,600
34 days
1/16/2008 Estimated 1,377,600 $179,983.01 2,928.00 2,928.00 607,200 770,400
30 days
12/17/2007 Actual 1,514,400 $177,225.19 0 0 667,200 847,200
33 days
11/14/2007 Actual 1,504,800 $183,732.11 0 0 696,000 808,800
30 days
10/15/2007 Actual 1,648,800 $210,728.74 0 0 734,400 914,400
31 days
9/14/2007 Actual 1,684,800 $221,914.22 0 0 796,800 888,000
30 days
8/15/2007 Actual 1,567,200 $211,305.18 0 0 772,800 794,400
29 days
7/17/2007 Actual 1,576,800 $200,750.75 0 0 715,200 861,600
32 days
6/15/2007 Actual 1,372,800 $166,372.70 0 0 638,400 734,400
30 days
5/16/2007 Actual 1,322,400 $163,631.15 0 0 633,600 688,800
29 days
4/17/2007 Actual 1,391,712 $186,307.60 0 0 634,398 757,314
29 days
3/19/2007 Actual 1,575,932 $212,769.21 0 0 718,373 857,559
32 days
2/15/2007 Actual 1,431,288 $218,505.92 0 0 652,438 778,850
30 days

87
Read Date & Days
Read Type
Total kWh
Utility Charges
Supplier Charges
Total Charges
Metered Peak kW
TOU On-Peak kWh
TOU Off-Peak kWh
3/19/2009 Actual 1,320,000 $38,621.80 $104,451.00 $143,072.80 2,640.00 616,800 703,200
29 days
2/18/2009 Actual 1,358,400 $41,961.09 $142,455.40 $184,416.49 2,616.00 612,000 746,400
29 days
1/20/2009 Actual 1,310,400 $41,667.31 $137,421.00 $179,088.31 2,736.00 612,000 698,400
36 days
12/15/2008 Estimated 1,372,800 $43,070.89 $143,965.50 $187,036.39 3,000.00 559,200 813,600
28 days
11/17/2008 Actual 1,533,600 $47,565.05 $180,382.00 $227,947.05 3,048.00 664,800 868,800
32 days
10/16/2008 Actual 1,483,200 $43,849.04 $174,453.00 $218,302.04 3,048.00 681,600 801,600
29 days
9/17/2008 Actual 1,663,200 $46,429.98 $195,625.00 $242,054.98 3,720.00 789,600 873,600
30 days
8/18/2008 Actual 470,400 $13,530.60 $55,328.00 $68,858.60 3,720.00 194,400 276,000
10 days
The table on the following page was put together using the information from the charts above.
The graphs in the paper were created from this table.
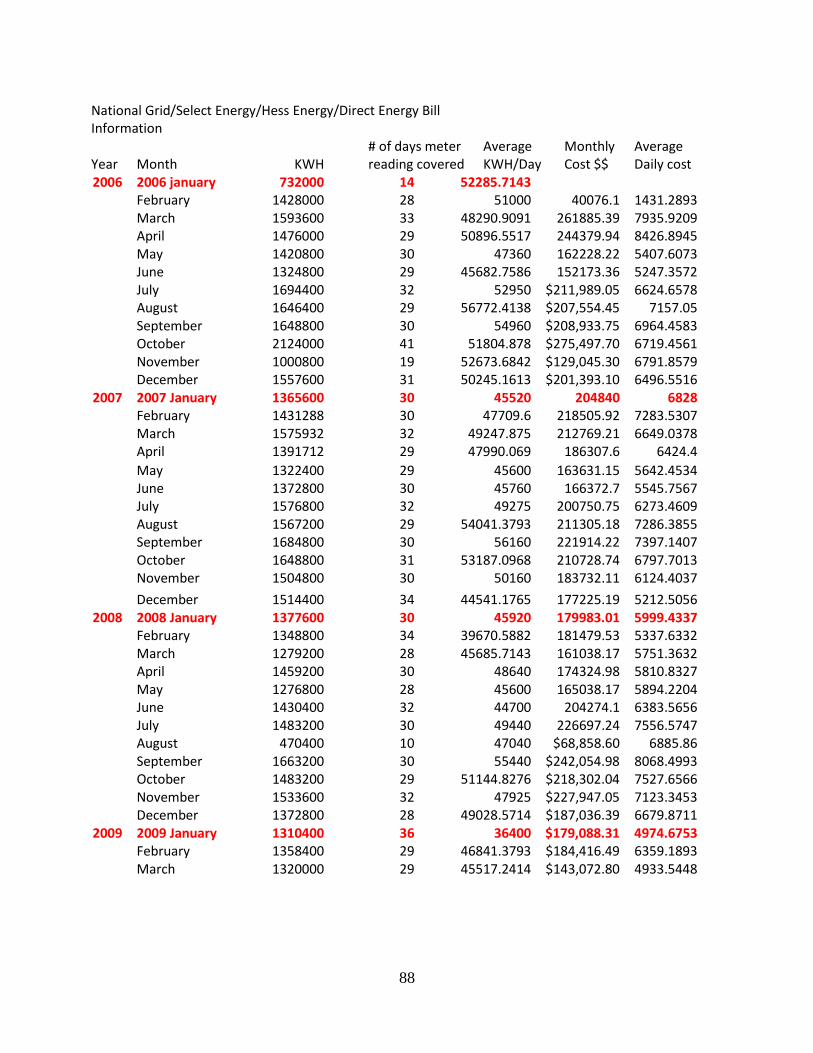
88
National Grid/Select Energy/Hess Energy/Direct Energy Bill Information
# of days meter Average Monthly Average Year Month KWH
reading covered KWH/Day Cost $$ Daily cost
2006 2006 january 732000
14 52285.7143
February 1428000
28 51000 40076.1 1431.2893
March 1593600
33 48290.9091 261885.39 7935.9209
April 1476000
29 50896.5517 244379.94 8426.8945
May 1420800
30 47360 162228.22 5407.6073
June 1324800
29 45682.7586 152173.36 5247.3572
July 1694400
32 52950 $211,989.05 6624.6578
August 1646400
29 56772.4138 $207,554.45 7157.05
September 1648800
30 54960 $208,933.75 6964.4583
October 2124000
41 51804.878 $275,497.70 6719.4561
November 1000800
19 52673.6842 $129,045.30 6791.8579
December 1557600
31 50245.1613 $201,393.10 6496.5516
2007 2007 January 1365600
30 45520 204840 6828
February 1431288
30 47709.6 218505.92 7283.5307
March 1575932
32 49247.875 212769.21 6649.0378
April 1391712
29 47990.069 186307.6 6424.4
May 1322400
29 45600 163631.15 5642.4534
June 1372800
30 45760 166372.7 5545.7567
July 1576800
32 49275 200750.75 6273.4609
August 1567200
29 54041.3793 211305.18 7286.3855
September 1684800
30 56160 221914.22 7397.1407
October 1648800
31 53187.0968 210728.74 6797.7013
November 1504800
30 50160 183732.11 6124.4037
December 1514400
34 44541.1765 177225.19 5212.5056
2008 2008 January 1377600
30 45920 179983.01 5999.4337
February 1348800
34 39670.5882 181479.53 5337.6332
March 1279200
28 45685.7143 161038.17 5751.3632
April 1459200
30 48640 174324.98 5810.8327
May 1276800
28 45600 165038.17 5894.2204
June 1430400
32 44700 204274.1 6383.5656
July 1483200
30 49440 226697.24 7556.5747
August 470400
10 47040 $68,858.60 6885.86
September 1663200
30 55440 $242,054.98 8068.4993
October 1483200
29 51144.8276 $218,302.04 7527.6566
November 1533600
32 47925 $227,947.05 7123.3453
December 1372800
28 49028.5714 $187,036.39 6679.8711
2009 2009 January 1310400
36 36400 $179,088.31 4974.6753
February 1358400
29 46841.3793 $184,416.49 6359.1893
March 1320000
29 45517.2414 $143,072.80 4933.5448

89
Appendix B National Grid Bills
News and Information
February 22, 2007 Contact: Harry Lenhart
503-494-8231
Email Harry Lenhart
Index of current releases | News Release Archive | News & Pubs Home
OHSU Center First Medical Facility in Nation to Win LEED
Platinum Award
The Center for Health & Healing blazes a trail with coveted green
building certification
PORTLAND, Ore. - The U.S. Green Building Council has awarded Oregon Health & Science University's Center for Health & Healing LEED platinum certification for energy efficiency and environmental
sustainability, the first medical and research facility anywhere to have achieved this distinction.
The Center, located in the South Waterfront district, is one of only 30 buildings of all kinds in the country to have been awarded platinum
certification and the largest and most complex medical building in the country to have achieved it. The building garnered 55 points out of a possible 69 on the USBGC's Leadership in Energy and Environmental
Design (LEED) scorecard, three more points than required for platinum.
"We set out to meet the highest standards of sustainability and energy efficiency when this project was started. This award recognizes the melding of the OHSU Medical Group's vision and the innovative team
that designed and built this remarkable building," said Joseph Robertson, M.D., MBA, president of OHSU. "The Center for Health & Healing is the first step in our development of the South Waterfront and
demonstrates in bricks and mortar OHSUÍs belief that a healthy built environment is integral to healthy living."
"The OHSU Center for Health & Healing is a real testament to how we can advance green building practices," said Dennis Wilde, principal and
senior project manager at Gerding Edlen Development. "It's one of the largest buildings in the country to augment forced air-conditioning with a vastly more efficient chilled beam and displacement ventilation
system. All told, the energy that will be saved as a result of the buildingÍs many innovations will be nearly 5.1 million pounds of carbon dioxide a year, the equivalent of removing 443 cars from our

90

91

92

93

94

95

96

97
Appendix C Hess Energy Corporation Bills33
33
These Document were emailed
Sold To
Utility Account
No.
Invoice
Date Invoice No. Amount Due Date From To Volume
479301 5191111525006 8/7/06 SE0022564 $164,848.18 9/6/06 6/16/06 7/18/06 1,694,400 KWH
479301 5191111525006 8/22/06 SE0032514 $160,178.26 9/21/06 7/18/06 8/16/06 1,646,400 KWH
479301 5191111525006 9/20/06 SE0046506 $160,411.75 10/20/06 8/16/06 9/15/06 1,648,800 KWH
479301 5191111525006 11/1/06 SE0066838 $206,643.96 12/1/06 9/15/06 10/26/06 2,124,000 KWH
479301 5191111525006 11/21/06 SE0076758 $97,367.83 12/21/06 10/26/06 11/14/06 1,000,800 KWH
479301 5191111525006 12/21/06 SE0087966 $151,538.90 1/20/07 11/14/06 12/15/06 1,557,600 KWH

98
Appendix D Direct Energy Bills

99

100

101

102

103

104

105
Appendix E
OSHA Standards Illumination Chart
____________________________________________________________________
|
Foot-Candles | Area of Operation
______________|____________________________________________________
|
5.............| General construction area lighting.
3.............| General construction areas, concrete placement,
| excavation and waste areas, access ways, active
| storage areas, loading platforms, refueling, and
| field maintenance areas.
5.............| Indoors: warehouses, corridors, hallways, and
| exitways.
5.............| Tunnels, shafts, and general underground work areas:
| (Exception: minimum of 10 foot-candles is required
| at tunnel and shaft heading during drilling,
| mucking, and scaling. Bureau of Mines approved cap
| lights shall be acceptable for use in the tunnel
| heading)
10............| General construction plant and shops (e.g., batch
| plants, screening plants, mechanical and
| electrical equipment rooms, carpenter shops,
| rigging lofts and active store rooms, mess halls,
| and indoor toilets and workrooms.)
30............| First aid stations, infirmaries, and offices.
______________|____________________________________________________

106
Appendix F
LUX Meter Information

107
Appendix G
Scheduling Documents
News and Information
February 22, 2007 Contact: Harry Lenhart
503-494-8231
Email Harry Lenhart
Index of current releases | News Release Archive | News & Pubs
Home
OHSU Center First Medical Facility in Nation to Win LEED Platinum
Award
The Center for Health & Healing blazes a trail with coveted green building certification
PORTLAND, Ore. - The U.S. Green Building Council has awarded Oregon Health & Science University's Center for Health & Healing LEED platinum certification for energy
efficiency and environmental sustainability, the first medical and research facility anywhere to have achieved this distinction.
The Center, located in the South Waterfront district, is one of only 30 buildings of all kinds in the country to have been awarded platinum certification and the largest and
most complex medical building in the country to have achieved it. The building

108
garnered 55 points out of a possible 69 on the USBGC's Leadership in Energy and Environmental Design (LEED) scorecard, three more points than required for platinum.
"We set out to meet the highest standards of sustainability and energy efficiency when
this project was started. This award recognizes the melding of the OHSU Medical Group's vision and the innovative team that designed and built this remarkable building," said Joseph Robertson, M.D., MBA, president of OHSU. "The Center for Health
& Healing is the first step in our development of the South Waterfront and demonstrates in bricks and mortar OHSUÍs belief that a healthy built environment is integral to healthy living."
"The OHSU Center for Health & Healing is a real testament to how we can advance
green building practices," said Dennis Wilde, principal and senior project manager at Gerding Edlen Development. "It's one of the largest buildings in the country to augment forced air-conditioning with a vastly more efficient chilled beam and displacement
ventilation system. All told, the energy that will be saved as a result of the buildingÍs many innovations will be nearly 5.1 million pounds of carbon dioxide a year, the equivalent of removing 443 cars from our highways."
"This is a remarkable achievement given the complex array of uses and systems that
were needed in the building," added David Crawford, chief financial officer of the OHSU Medical Group, who oversaw construction. "We had to capture every opportunity to integrate together function, architecture and engineering. This is really the result of a
great collaborative team effort. We have set a new standard for OHSU and for other projects in Portland."
The 16-story, 400,000 square foot building - the first OHSU building to be completed in
the South Waterfront and now OHSUÍs gateway to health care - houses clinical offices, ambulatory surgery suites, a rehabilitation center, research laboratories, educational facilities, a conference center, and the march wellness and fitness center with its saline-
treated swimming and therapy pools, basketball court and locker rooms. A Casey Eye Optical Shop, an OHSU retail pharmacy and the Daily Café restaurant occupy space on the ground floor near the three-story atrium.
The building is 61 percent more energy-efficient than required by Oregon code. It uses
nearly 60 percent less potable water than a similar conventional building does. One-hundred percent of the sewage generated in the building is treated in a membrane bioreactor on site. Building systems also included an integrated day-lighting system,
naturally ventilated stair towers, radiant heating and cooling, and eco-roofs. Rainwater and wastewater are harvested for landscaping, keeping 15,000 gallons a day from reaching the cityÍs overburdened sewer system. No potable water is used for waste
conveyance or irrigation in the building, and the swimming pools are integrated with the heating and cooling system as a thermal storage unit.
The south-side façade of the building on the 15th and 16th floors was transformed into a giant solar air heater by creating a 6,000 square foot trombe wall consisting of two
glass skins. The warm air produced inside the trombe wall by the greenhouse effect is recirculated through the building in winter reducing the buildingÍs energy use.
The building also features:

109
Sunshades on the south side that double as solar electricity generators; Lighting in stairwells and offices controlled by occupancy sensors as well as
reduced lighting in lobbies and other pass-through areas; A gas-fueled cogeneration system powered by five 60-kilowatt microturbines, the
first of its scale in Oregon;
Chilled beams that combine convective cooling systems with displacement ventilation, which cut energy use by 20 percent to 30 percent under conventional air conditioning systems and reduce the need for ductwork and other mechanical
systems; Use of sustainable and lower toxicity materials in interior finishes and
furnishings, including low volatile organic compound paints and sealants,
sustainably manufactured carpeting systems, and the used of Forest Stewardship Council (FSC) certified wood products.
More than 950 OHSU employees work in the building either full time or part
time. It is the centerpiece of a nearly $2.3 billion array of new investment in the South Waterfront and is ringed by public transportation links. The lower terminal of the Portland Aerial Tram is located next door and the Portland Streetcar stops
across the street.
The LEED green building rating system is a voluntary, consensus-based national standard for developing high-performance sustainable buildings. It targets areas such as sustainable site development, water efficiency, energy and atmosphere, materials
and resources, and indoor environmental quality. The U.S. Green Building Council, which administers the rating system, is a coalition of leaders from every sector of the
building industry working to promote environmentally responsible, profitable and healthy places to live and work.
The building represents the state-of-the-art in integrative design, a process in which all project team members provided an exceptional level of collaboration. Key team
members, in addition to OHSU and the OHSU Medical Group included Gerding Edlen Development, the development managers; GBD Architects and Interface Engineering, Inc., who were responsible for the design of the building and its mechanical, electrical
and plumbing systems; Walker Macy, the landscape designers; Hoffman Construction Co., who built it; and Brightworks, the sustainability advisors who coordinated the green building strategies. Also involved in the project were KPFF Consulting Engineers
and Peterson Kohlberg Associates.
For more information about the Center for Health & Healing, go to http://www.ohsu.edu/ohsuedu/about/transformation/commons/index.cfm

110
Appendix H

111

112

113

114

115
Appendix I CAD Drawings
*not to scale
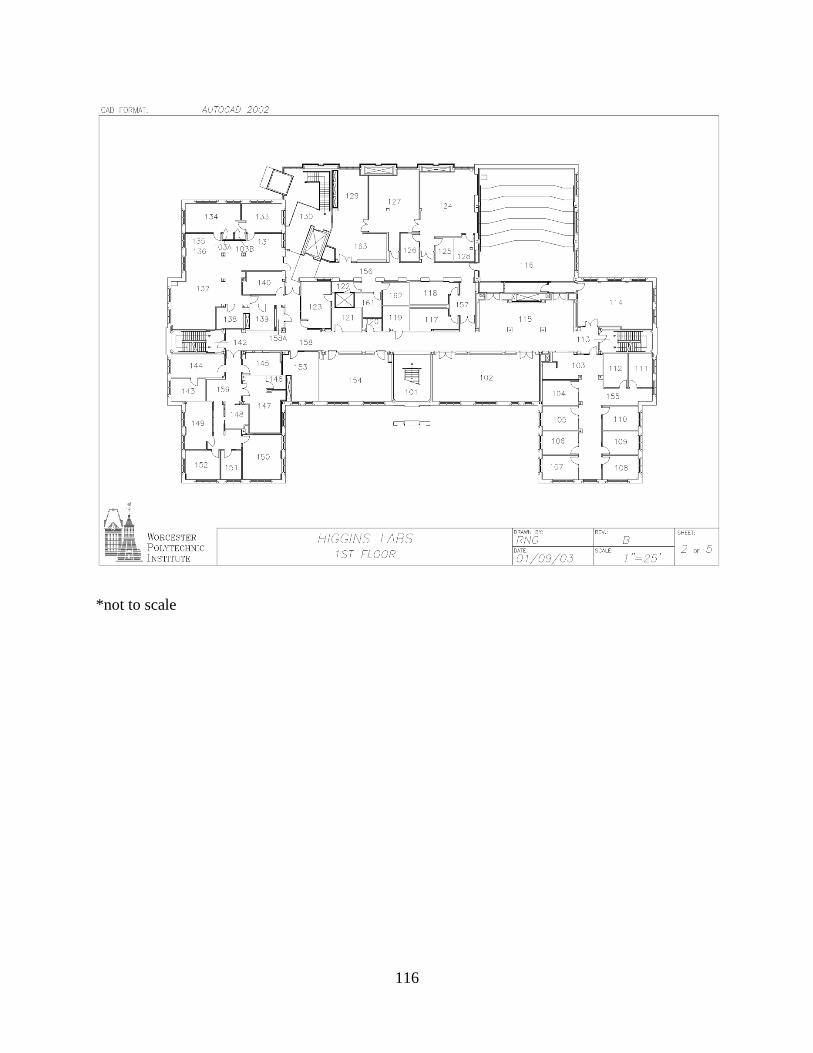
116
*not to scale

117
*not to scale

118
*not to scale

119
Appendix J Schedules

120

121

122

123

124

125

126

127

128

129

130

131

132

133

134

135

136

137
Appendix K
Room 250 spreadsheets
Room 250 Case
Study On
Watts
Standby
Watts
Daily Usage
(hrs)
(Not on
Standby hrs)
Daily Electricity
Consumption
(kW-hrs)(Includes
Standby hrs)
Yearly Usage
(kW-hrs)
(Combined
Usage)
Average Yearly Cost ($)
(Based on an average of $0.14
per kW-hr) Component
Fluorescent
Lights 160 0 10.00 1.62 416
$
58.24
Laser Printer 150 35 4.50 0.54 353 $
49.41
Computer 65 3 9.00 0.58 164
$
22.93
Computer Monitor 45 3 9.00 0.40 117
$ 16.38
Desk Light 34 1 9.00 0.32 83
$
11.68
Desk Fan 12 1 4.50 0.07 19
$
2.68
Paper Shredder 227 1 0.20 0.07 18
$
2.52
Computer Speakers 4 2 1.00 0.03 13
$ 1.82
Pencil
Sharpener 13 1 0.02 0.02 6
$
0.88
Label Printer 10 1 0.08 0.02 6 $
0.90
Room 218
Room 218
Case
Study
Numb
er of
Comp
onents
On
Watts
per
Compo
nent
Standby
Watts per
Compone
nt
Total
On
Watts
per
Compo
nent
Typical
Weekly
Usage (hrs)
(Not on
Standby)
Weekly
Electricity
Consumption
(kW-
hrs)(Includes
Standby hrs)
Yearly
Usage (kW-
hrs)
Average Yearly Cost
(based on an average
cost of $0.14 per kW-
hr) Componen
t
Florescent
Light 90 32 0 2880 90 259.20 13478
$
1,886.98
Incandescent Bulb 21 75 0 1575 90 141.75 7371
$ 1,031.94
Projector 2 367 367 734 168 123.31 6412
$
897.71
Marker Board
Lights 3 75 0 225 90 20.25 1053
$
147.42
Exit Sign 3 40 0 120 168 20.16 1048 $
146.76
CCU 1 150 60 150 90 18.18 945
$
132.35
Clock 1 0.4 0 0.4 168 0.07 3 $
0.49
Air
conditioners 3 N/A
Security
Camera 1 N/A
Projector Screen 1 N/A
Heater 0 N/A
Light
Switch 10 N/A
Windows 3 N/A

138
Cloudy Day Shades Open Shades Open Shades Closed Shades Closed
Room 218 Case Study LUX Ft-Candles LUX Ft-Candles
All Lights On
Front 715 66 558 52
Middle 680 63 609 57
Rear 795 74 689 64
2/3 Fluorescent Lights On
Front 368 34 347 32
Middle 378 35 340 32
Rear 484 45 446 41
1/3 Fluorescent Lights On
Front 290 26 240 22
Middle 241 22 260 24
Rear 267 24 250 23
Room 114
Classroo
m 114 Numb
er of
Comp
onents
On
Watts
per
Compo
nent
Standby
Watts per
Compone
nt
Total
Watts
per
Compon
ent
Typical Weekly
Usage (hrs)
(Not On
Standby)
Weekly
Electricity
Consumption
(kW-
hrs)(Includes
Standby hrs)
Yearly
Usage
(kW-
hrs)
Average Yearly Cost
(based on an average
cost of $0.14 per kW-hr) Compone
nt
Florescent
Light 36 32 0 1152 65 74.88 3894
$
545.13
Projector 1 367 367 367 65 61.66 3206
$
448.86
CCU 1 150 60 150 65 15.93 828
$
115.97
Marker
Board
Lights 4 32 0 128 65 8.32 433
$
60.57
Clock 1 0.4 0 0.4 168 0.07 3 $
0.49
Incandesce
nt Bulb 0 N/A
Projector
Screen 1 N/A
Heater 3 N/A
Light
Switch 3 N/A
Windows 5 N/A
Air conditione
rs 1 N/A

139
Cloudy Day Shades Open Shades Open Shades Closed Shades Closed
Room 114 Case Study LUX Ft-Candles LUX Ft-Candles
All Lights On
Rear 1220 113 557 52
Middle 1145 106 693 64
Front 930 86 605 56
1/2 Fluorescent Lights On
Rear 1028 96 339 31
Middle 657 61 361 34
Front 610 57 350 33
Only Board Lights On
Rear 977 91
0
Middle 585 54
0
Front 422 39
0
Room 201
Room 201 Number
of
Watts
per
Total
Watts
Typical
Weekly
Weekly Electricity
Consumption
Yearly
Usage Average Yearly Cost
Component Compon
ents
Compo
nent
per
Componen
t
Usage
(hrs) (kW-hrs) (kW-hrs)
(based on an average cost of
$0.14 per kW-hr)
Incandescent Bulbs 6 75 450 14 6.30 327.60
$ 45.86
Clock 1 0.4 0.4 168 0.07 3.49
$
0.49
Florescent
Light 0 0 0
Air
conditioners 0 0 0
Heater 0 0 0
Windows 1 N/A
Light
Dimmer 2 N/A

140
Sunny Day Shades Open Shades Open
Room 201 Case Study LUX Ft-Candles
All Lights On 547 51
Board Lights Only 481 45
Shades Closed Shades Closed
LUX Ft-Candles
All lights On 78 7.2462
Board Lights Only 27 2.5083
Room 102
Room 102 Number
of
Watts
per
Total
Watts
Typical
Weekly
Weekly Electricity
Consumption
Yearly
Usage Average Yearly Cost
Component Compon
ents
Compo
nent
per
Componen
t
Usage
(hrs) (kW-hrs) (kW-hrs)
(based on an average cost of
$0.14 per kW-hr)
3 Prong
Florescent 18 40 720 24 17.28 899
$
125.80
Ls212k1
Bulb 4 75 300 24 7.20 374
$
52.42
Air
conditioners 2 N/A
Heater 0 N/A
Projector
Screen 1 N/A
Windows 3 N/A
Light Switch 4 N/A
Cloudy Day Shades Open Shades Open
Room 102 Case Study LUX Ft-Candles
All Lights On 200 19
Only Board Lights 87 8
Sunny Day Shades Open Shades Open
Room 102 Case Study LUX Ft-Candles
All Lights On 312 29
Only Board Lights On 227 21

141
Room 230
Lab
Room
230
Numbe
r of
On
Watts
per
Standby
Watts per
Total
Watts Typical Weekly
Weekly
Electricity
Consumption
Yearly
Usage Average Yearly Cost
Compon
ent
Compo
nents
Compo
nent
Compone
nt
per
Compon
ent
Usage (hrs) (Not
On Standby)
(kW-
hrs)(Includes
Standby hrs)
(kW-
hrs)
(based on an average cot
of $0.14 per kW-hr)
Compute
rs 41 70 2 2870.0 168 482.16
25072.
32
$
3,510.12
Monitors 41 45 1 1845.0 168 309.96 16117.
92 $
2,256.51
Floresce
nt Light 51 32 0 1632.0 168 274.18
14257.
15
$
1,996.00
Projector 1 367 367 367.0 30 61.66 3206.1
1 $
448.86
CCU 1 150 60 150.0 30 12.78 664.56
$
93.04
Exit
Sign 2 40 0 80.0 168 13.44 698.88
$
97.84
Printer 1 21 21 21.0 72 3.53 183.46
$
25.68
Clock 1 0.4 0 0.4 168 0.07 3.49 $
0.49
Projector
Screen 1 N/A N/A
Handicap Switch 1 N/A N/A
Heater 0 N/A N/A
Light
Switch 4 N/A N/A
Windows 2 N/A N/A
Room 230 Full Lighting Shades
Closed LUX Ft-Candles
Half Lighting
Shades Closed LUX Ft-Candles
Front 488 45
262 24
Middle 462 43
223 21
Rear 453 42
254 24
Room 248
Room 248 Number
of
Watts
per
Total
Watts
Typical
Weekly
Weekly Electricity
Consumption
Yearly
Usage Average Yearly Cost
Component Compon
ents
Compo
nent
per
Compone
nt
Usage
(hrs) (kW-hrs)
(kW-
hrs)
(based on an average cost of
$0.14 per kW-hr)
Florescent Light 64 32 2048 63 129.02 6709
$ 939.29
Work Station
W/Comp 5 180 900 28 25.20 1310
$
183.46
Air conditioners 1 N/A N/A
Heater 2 N/A N/A
Light Switch 2 N/A N/A
Windows 4 N/A N/A

142
Shades Closed Shades Closed Shades Open Shades Open
Controls Lab 248
Illumination LUX Ft-Candles LUX Ft-Candles
Sunny Day
All Lights On 965 90 1332 124
Half Lighting 674 63 1008 94
Bathroom
Bathroom Numbe
r of
Watts
per
Total Standby
Watts per
Total
Watts
Typical
Weekly
Weekly Electricity
Consumption
Yearly
Usage Average Yearly Cost
Compone
nt
Compo
nents
Comp
onent Component
per
Compon
ent
Usage
(hrs)
(kW-hrs)(Includes
Standby hrs)
(kW-
hrs)
(based on an average cost
of $0.14 per kW-hr)
Florescent Bulbs 9 32 96 288 84 32.26 1677
$ 234.82
Emergenc
y Lights 1 N/A
Hallways
Hallway
s Numbe
r of
Watts
per
Total
Watts
Typical
Weekly
Weekly Electricity
Consumption
Yearly
Usage Average Yearly Cost
Rooms
156-158
Compone
nt
Compo
nents
Compo
nent
per
Compone
nt
Usage
(hrs) (kW-hrs)
(kW-
hrs)
(based on an average cost of
$0.14 per kW-hr)
Florescent Bulbs 106 32 3392 168 569.86 29633
$ 4,148.55
Exit Signs 7 40 280 168 47.04 2446
$
342.45
Emergency Lights 0 N/A
Light
Switches 4 N/A
143
Appendix L
National Grid Incentive Documents

144
Appendix M
National Grid Incentive Application Form