energy and exergy analysis of the kiln system in the ... 4.pdf · energy and exergy analysis of the...
TRANSCRIPT
Energy and Exergy Analysis of the Kiln system in the Cement Plant
103
4
EENNEERRGGYY AANNDD EEXXEERRGGYY AANNAALLYYSSIISS OOFF TTHHEE KKIILLNN SSYYSSTTEEMM IINN TTHHEE CCEEMMEENNTT PPLLAANNTT
4.1 Introduction
4.2 Kiln System.
4.3 Kiln System Analysis
4.4 Results and Discussion
4.5 Conclusion
4.1 Introduction
The conservation, balance and management of energy are hot and
emerging topic of today’s discussion. In this regard, the attempts for
energy balance in the industries of developing countries like India are
having extreme significance. Cement industry is an energy intensive
industry. Theoretically, producing one tonne of clinker requires a
minimum on 1.6 GJ heat (Liu et al., 1999). The specific thermal energy
consumption in cement industries in India varies from 2.95 GJ to 4
GJ/tonne of clinker. The higher specific energy consumption is due to
the harder raw material and poor quality of fuel. In this study, the energy
utilization efficiency for kiln system with different operating conditions
was determined. Mass balance, energy and exergy utilization efficiency
of the kiln system were analyzed using the actual operational data.
Con
tent
s
Chapter-4
104
4.2 Kiln System
The plant uses the dry process with four stage cyclone pre-heaters
and an inclined Kiln. The specification of kiln is given as follows
Length 65 m
Diameter 4.4 m
Designed capacity 1213 tonnes per day
Kiln slope 3%
Kiln speed 0.3 -2.2 RPM
Normal speed 1.2 RPM
The rotary cement kiln is a long cylindrical steel shell lined on the
interior with refractory bricks. The shell slopes slightly (3%) and slowly
rotates on its axis at between 0.3 - 2.2 revolutions per minute. Coal ground to
fine power in the coal mill, is weighed in an electronic weight feeder and fired
to the kiln through a burner pipe positioned almost concentric to the kiln at the
outlet. This forms intense heat at the outlet end of kiln, imparting thermal
energy for clinkerisation. The pulverised coal is injected into the kiln with the
help of primary air. Secondary air is drawn first through the cooler and then
through the kiln for combustion of the coal. In the cooler the air is heated by
the cooling clinker, so that it may be 800-950°C before it enters the kiln, thus
causing intense and rapid combustion of the coal.
Required raw meal is extracted from the storage silos, weighed in an
electronic feeder and lifted to top of the preheater unit. The raw meal travels
down the preheater countering the exit hot gas from kiln. In the drying zone
the moisture content of material escape as water vapour. Above 600°C,
calcium carbonate and magnesium carbonate in the feed starts decomposing to
Energy and Exergy Analysis of the Kiln system in the Cement Plant
105
form calcium oxide, magnesium oxide and carbon dioxide. The partly calcined
material enters the kiln where temperature is maintained at 850°C. The feed
that enters the kiln inlet gradually travel towers the outlet end due to rotation
and slope of kiln. Hot gas from the kiln moves upwards, as a result the raw
materials are exposed to hot gases and in its course, it gets fully calcined. The
calcined material then enters to the burning zone (1450oC) of the kiln and the
entire chemical reactions takes place there and clinker is formed. Fig.4.1
shows details of the kiln system.
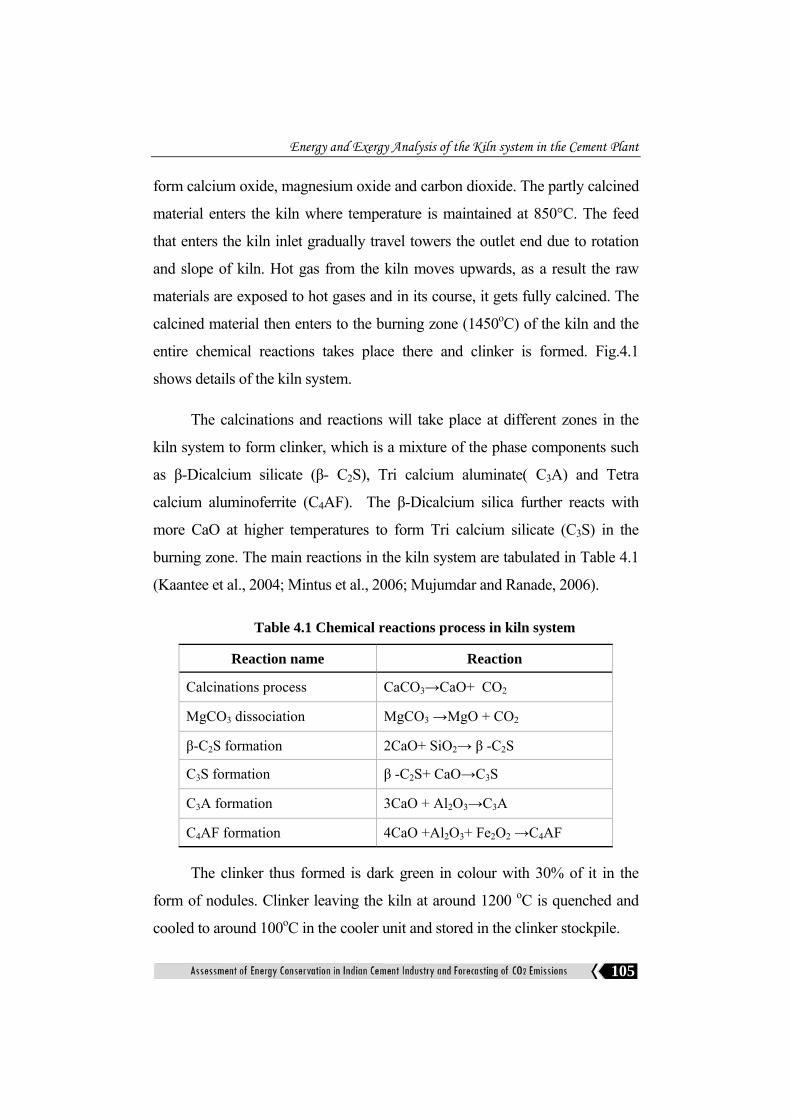
The calcinations and reactions will take place at different zones in the
kiln system to form clinker, which is a mixture of the phase components such
as β-Dicalcium silicate (β- C2S), Tri calcium aluminate( C3A) and Tetra
calcium aluminoferrite (C4AF). The β-Dicalcium silica further reacts with
more CaO at higher temperatures to form Tri calcium silicate (C3S) in the
burning zone. The main reactions in the kiln system are tabulated in Table 4.1
(Kaantee et al., 2004; Mintus et al., 2006; Mujumdar and Ranade, 2006).
Table 4.1 Chemical reactions process in kiln system
Reaction name Reaction
Calcinations process CaCO3→CaO+ CO2
MgCO3 dissociation MgCO3 →MgO + CO2
β-C2S formation 2CaO+ SiO2→ β -C2S
C3S formation β -C2S+ CaO→C3S
C3A formation 3CaO + Al2O3→C3A
C4AF formation 4CaO +Al2O3+ Fe2O2 →C4AF
The clinker thus formed is dark green in colour with 30% of it in the
form of nodules. Clinker leaving the kiln at around 1200 oC is quenched and
cooled to around 100oC in the cooler unit and stored in the clinker stockpile.

Chapter-4
106
Fig.
4.1
Kiln
syst
em

Energy and Exergy Analysis of the Kiln system in the Cement Plant
107
4.3 Kiln System Analysis
The energy and exergy analysis of the kiln system were conducted for
two operating conditions given as follows.
I. Clinker production rate of 1400 tpd
The operation data of the kiln system for the production rate of 1400
tonnes per day is given in the Table 4.2
Table 4.2 Operation data of kiln system for the production rate of 1400 tonnes per day
Ambient temperature 35 0C Present kiln capacity 1400 TPD Required kiln feed 87 TPH Temperature of feed 55 0C Raw meal /clinker factor 1.49 Coal consumption 11.08 TPH Flow rate of preheater Exhaust gas 120666Nm3/hr Preheater exhaust gas temperature 384 0C O2 % Preheater exit gas 4.2% O2 % Kiln inlet (junction between preheater and kiln) 1.8% Flow rate of primary air 21508 Nm3/hr Temperature of Primary air 71 0C Flow rate of cooler inlet air 185423Nm3/hr Excess air 10% Clinker discharge temperature from cooler 95 0C Flow rate of gas to coal mill 6157 Nm3/hr Temperature of coal mill gas 330 0C Flow rate of cooler hot air 138542Nm3/hr Temperature of hot air from cooler 2000C Temperature of secondary air 850 0C Dust concentration in Preheater exhaust gas 36.06 g/ Nm3 Surface temperature of kiln 300 0C Surface temperature of preheater 80 0C Surface temperature of cooler 82 0C
Chapter-4
108
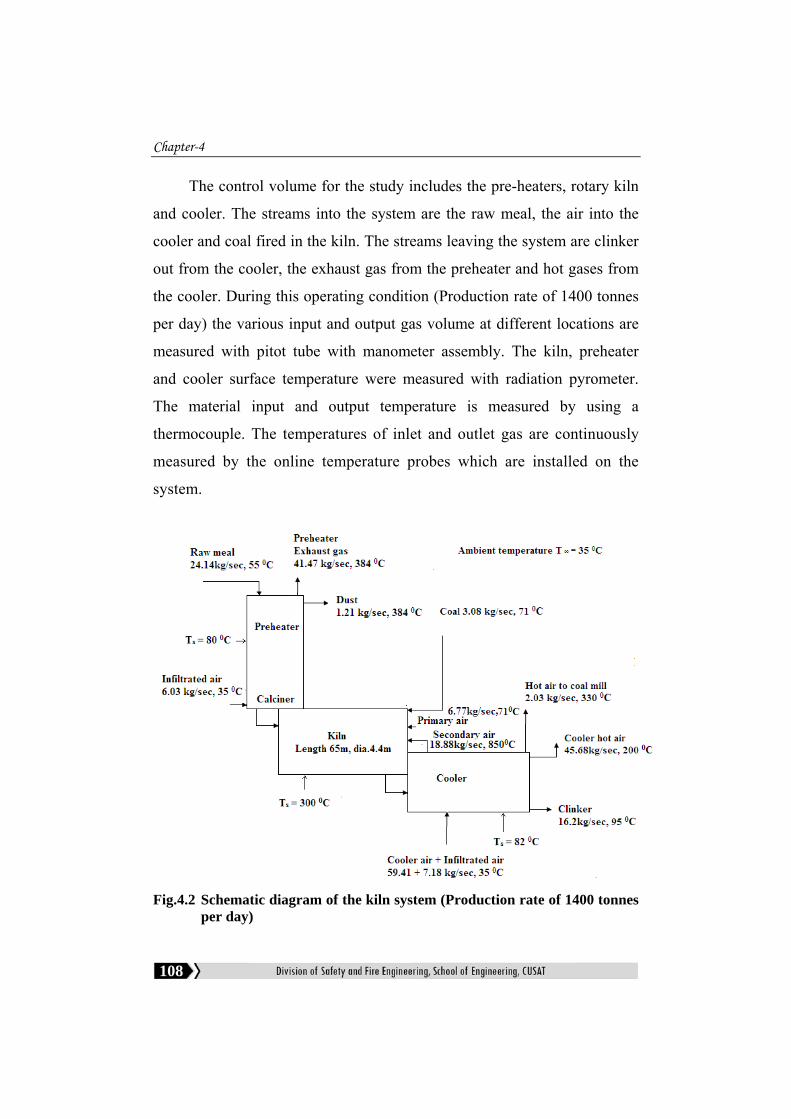
The control volume for the study includes the pre-heaters, rotary kiln
and cooler. The streams into the system are the raw meal, the air into the
cooler and coal fired in the kiln. The streams leaving the system are clinker
out from the cooler, the exhaust gas from the preheater and hot gases from
the cooler. During this operating condition (Production rate of 1400 tonnes
per day) the various input and output gas volume at different locations are
measured with pitot tube with manometer assembly. The kiln, preheater
and cooler surface temperature were measured with radiation pyrometer.
The material input and output temperature is measured by using a
thermocouple. The temperatures of inlet and outlet gas are continuously
measured by the online temperature probes which are installed on the
system.
Fig.4.2 Schematic diagram of the kiln system (Production rate of 1400 tonnes
per day)

Energy and Exergy Analysis of the Kiln system in the Cement Plant
109
The Fig. 4.2 shows the various input and output streams based on mass
flow rate of the kiln system. The raw meal at the rate 24.14 kg/sec (55 0C)
from the raw mill supplied to the top of the preheater and it moves down to the
rotary kiln. The hot gas from kiln moves upwards as a result of which heat
transfer take place between raw meal and hot gas and the gas then discharged
to the surrounding (384 0C). In the kiln, raw meal subject to chemical reaction
and burning, the clinker is formed and it is cooled in the clinker cooler. The
clinker discharge rate from the cooler is 16.2 kg/sec at 95 0C. The pulverised
coal is supplied to the kiln at the outer end with the primary air (71 0C). The
secondary air (850 0C) drawn from the clinker cooler moves through the kiln
and preheter. The suction is created by the preheater fan.
It was observed that, kiln inlet (junction between preheater and kiln)
O2 level was 1.8% which indicates that the kiln is operating with 10%
excess air. The secondary air required for complete combustion of coal in
the kiln was calculated as 18.87 kg/sec. The coal mill fan drawn air from
the clinker cooler with temperature of 3300C. The temperature of cooler
hot air discharged to the surrounding is about 200 0C. It was observed that
the O2 level at preheater exit is indicated to be 4.2%. Normally for
optimum energy consumption, the percentage of oxygen to be maintained
at preheater exit and kiln inlet are 3.5% and 1.5 % respectively. It was
observed that air leakage in to the kiln is negligible. The air leakage mainly
occurs across the preheater and clinker cooler. In this case the total infiltration
air to the whole system was found to be 12.4%.
II Clinker production rate of 1369 tonnes per day The operation data of the kiln system for the production rate of 1369
tonnes per day is shown in Table 4.3

Chapter-4
110
Table 4.3 Operation data of kiln system for the production rate of 1369 tonnes per day
Ambient temperature 30 0C Present kiln capacity 1369 TPD Required kiln feed 85 TPH Temperature of feed 55 0C Raw meal /clinker factor 1.49 Coal consumption 10.83 TPH Flow rate of preheater Exhaust gas 117113 Nm3/hr Preheater exhaust gas temperature 395 0C O2 % Preheater exhaust gas 4% O2 % Kiln inlet (junction between preheater and kiln) 1.8% Flow rate of primary air 21658 Nm3/hr Temperature of Primary air 53 0C Flow rate of cooler inlet air 137756 Nm3/hr Excess air 10% Clinker discharge temperature 150 0C Flow rate of gas to coal mill 6405 Nm3/hr Temperature of coal mill gas 340 0C Flow rate of cooler hot air 98919 Nm3/hr Temperature of hot air from cooler 2200C Temperature of secondary air 860 0C Dust concentration in Preheater exhaust gas 36.28 g/ Nm3 Surface temperature of kiln 305 0C
Surface temperature of preheater 82 0C
Surface temperature of cooler 85 0C
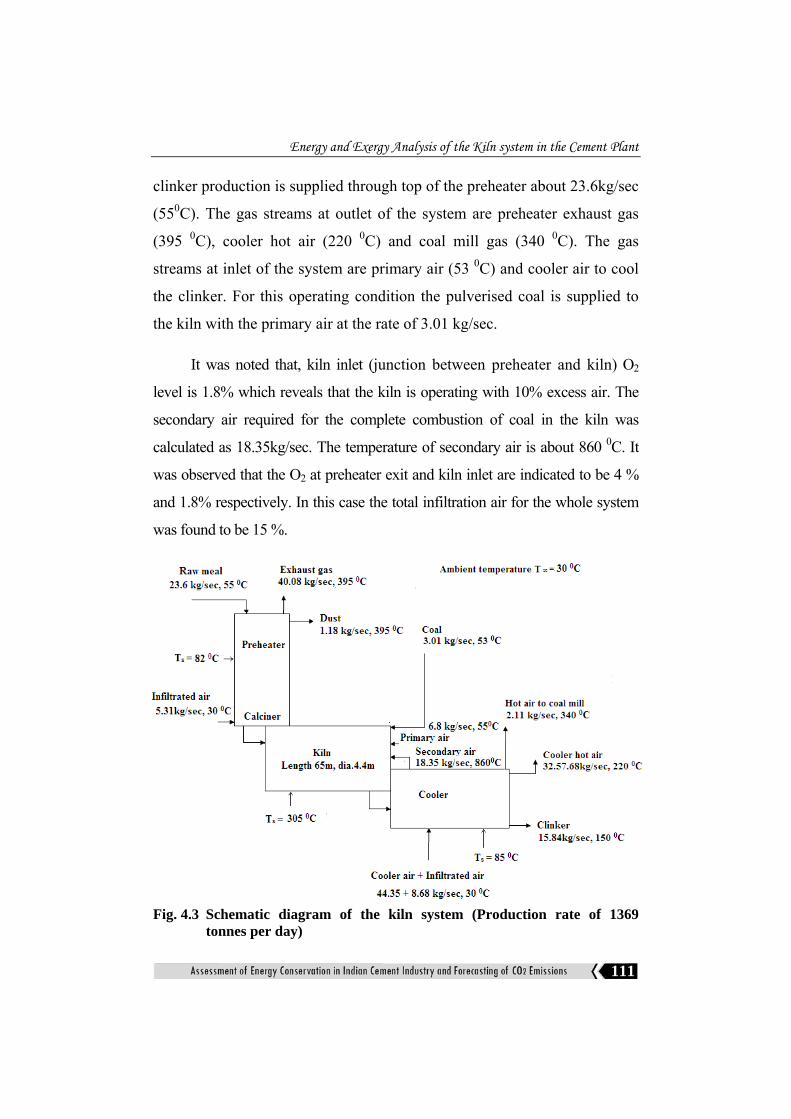
Fig.4.3 shows the various streams based on mass flow rate in the kiln
system. The clinker discharge rate from the cooler in this operating
condition is about 15.84 kg/sec at 150 0C. The required kiln feed for the
Energy and Exergy Analysis of the Kiln system in the Cement Plant
111
clinker production is supplied through top of the preheater about 23.6kg/sec
(550C). The gas streams at outlet of the system are preheater exhaust gas
(395 0C), cooler hot air (220 0C) and coal mill gas (340 0C). The gas
streams at inlet of the system are primary air (53 0C) and cooler air to cool
the clinker. For this operating condition the pulverised coal is supplied to
the kiln with the primary air at the rate of 3.01 kg/sec.
It was noted that, kiln inlet (junction between preheater and kiln) O2
level is 1.8% which reveals that the kiln is operating with 10% excess air. The
secondary air required for the complete combustion of coal in the kiln was
calculated as 18.35kg/sec. The temperature of secondary air is about 860 0C. It
was observed that the O2 at preheater exit and kiln inlet are indicated to be 4 %
and 1.8% respectively. In this case the total infiltration air for the whole system
was found to be 15 %.
Fig. 4.3 Schematic diagram of the kiln system (Production rate of 1369
tonnes per day)

Chapter-4
112
4.4 Results and Discussion
4.4.1 Mass balance of the Kiln System (Production rate of 1400 tonnes per day) The stream data obtained from the plant is used to perform a mass
balance over the system. It is usually more convenient to define mass or
energy data per kg of clinker produced per unit time. The clinker
production rate of in the kiln is estimated to be 16.2 kg of clinker/sec. For
this production rate of various input and output components of the kiln
system are estimated as follows.
Inputs
(i) Raw meal feed = 24.14 kg/sec
Raw meal per kg of clinker production, 2.1614.24)( =rmkm
= 1.49 kg/kg-clinker
(ii) Rate of coal consumption = 3.078 kg/sec
Coal per kg of clinker production, 2.16
078.3)( =ckm
= 0.19 kg/kg-clinker
(iii) Primary air mass flow rate = 6.77 kg/sec
Primary air per kg of clinker production, 2.16
77.6)( =pakm
=0.418 kg/kg-clinker
(iv) Mass flow rate of air into the cooler = 59.41 kg/sec
Cooler air per kg of clinker production, 2.1641.59)( =cakm
= 3.667 kg/kg-clinker
Energy and Exergy Analysis of the Kiln system in the Cement Plant
113
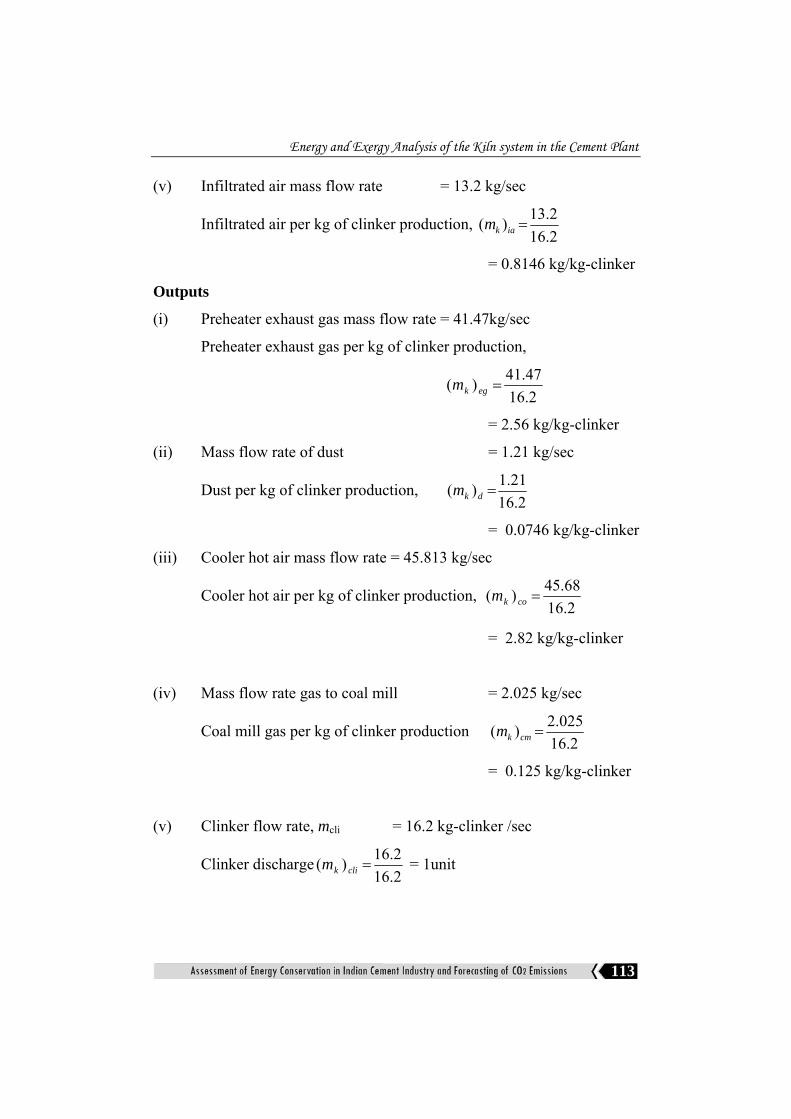
(v) Infiltrated air mass flow rate = 13.2 kg/sec
Infiltrated air per kg of clinker production, 2.162.13)( =iakm
= 0.8146 kg/kg-clinker
Outputs
(i) Preheater exhaust gas mass flow rate = 41.47kg/sec
Preheater exhaust gas per kg of clinker production,
2.1647.41)( =egkm
= 2.56 kg/kg-clinker
(ii) Mass flow rate of dust = 1.21 kg/sec
Dust per kg of clinker production, 2.16
21.1)( =dkm
= 0.0746 kg/kg-clinker
(iii) Cooler hot air mass flow rate = 45.813 kg/sec
Cooler hot air per kg of clinker production, 2.1668.45)( =cokm
= 2.82 kg/kg-clinker
(iv) Mass flow rate gas to coal mill = 2.025 kg/sec
Coal mill gas per kg of clinker production 2.16
025.2)( =cmkm
= 0.125 kg/kg-clinker
(v) Clinker flow rate, mcli = 16.2 kg-clinker /sec
Clinker discharge2.162.16)( =clikm = 1unit
Chapter-4
114
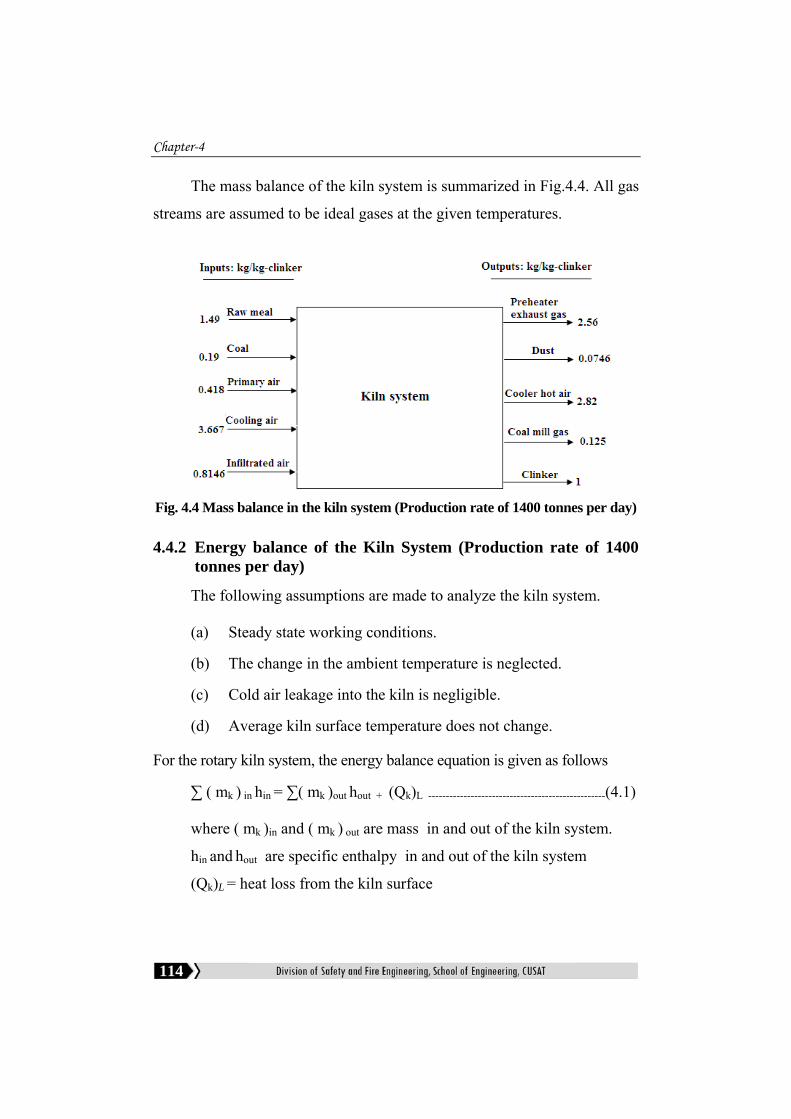
The mass balance of the kiln system is summarized in Fig.4.4. All gas
streams are assumed to be ideal gases at the given temperatures.
Fig. 4.4 Mass balance in the kiln system (Production rate of 1400 tonnes per day)
4.4.2 Energy balance of the Kiln System (Production rate of 1400 tonnes per day)
The following assumptions are made to analyze the kiln system.
(a) Steady state working conditions.
(b) The change in the ambient temperature is neglected.
(c) Cold air leakage into the kiln is negligible.
(d) Average kiln surface temperature does not change.
For the rotary kiln system, the energy balance equation is given as follows
∑ ( mk ) in hin = ∑( mk )out hout + (Qk)L --------------------------------------------------(4.1)
where ( mk )in and ( mk ) out are mass in and out of the kiln system.
hin and hout are specific enthalpy in and out of the kiln system
(Qk)L = heat loss from the kiln surface

Energy and Exergy Analysis of the Kiln system in the Cement Plant
115
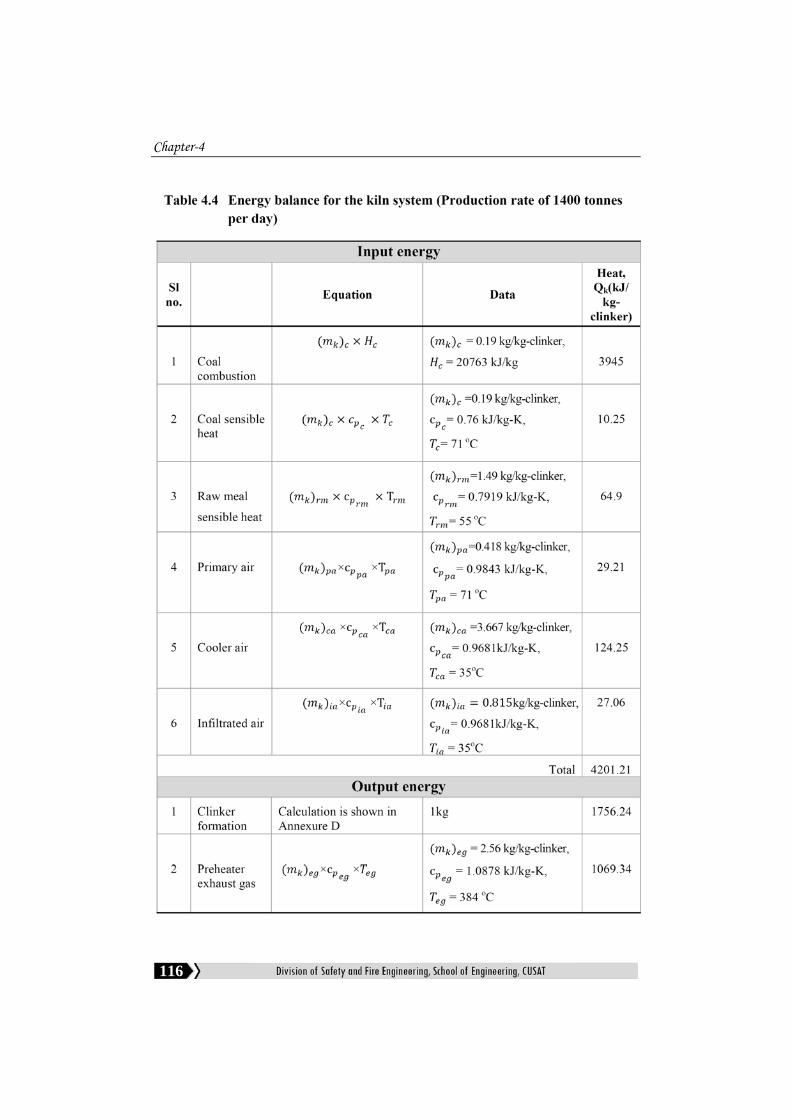
Based on the collected data, an energy balance is applied to the kiln
system. The equations can be found in hand book (Peray, 1979). The
reference enthalpy is considered to be zero at 0 0C for the calculation. The
specific heat capacity ( pc ) of the each input and output material for
analysis has been calculated by using relation 2TcTbacp +×+= where a,
b and c are the constants for the components of material and T
represents temperature in Kelvin (Perry and Green, 1984). The
compositions of input and output materials are shown in Annexure A.
The constants of each component of the input and output materials are
taken from standard hand book (Perry and Green, 1984). The complete
energy balance for the system is shown in Table 4.4
Chapter-4
116
Energy and Exergy Analysis of the Kiln system in the Cement Plant
117

Chapter-4
118
Energy and Exergy Analysis of the Kiln system in the Cement Plant
119
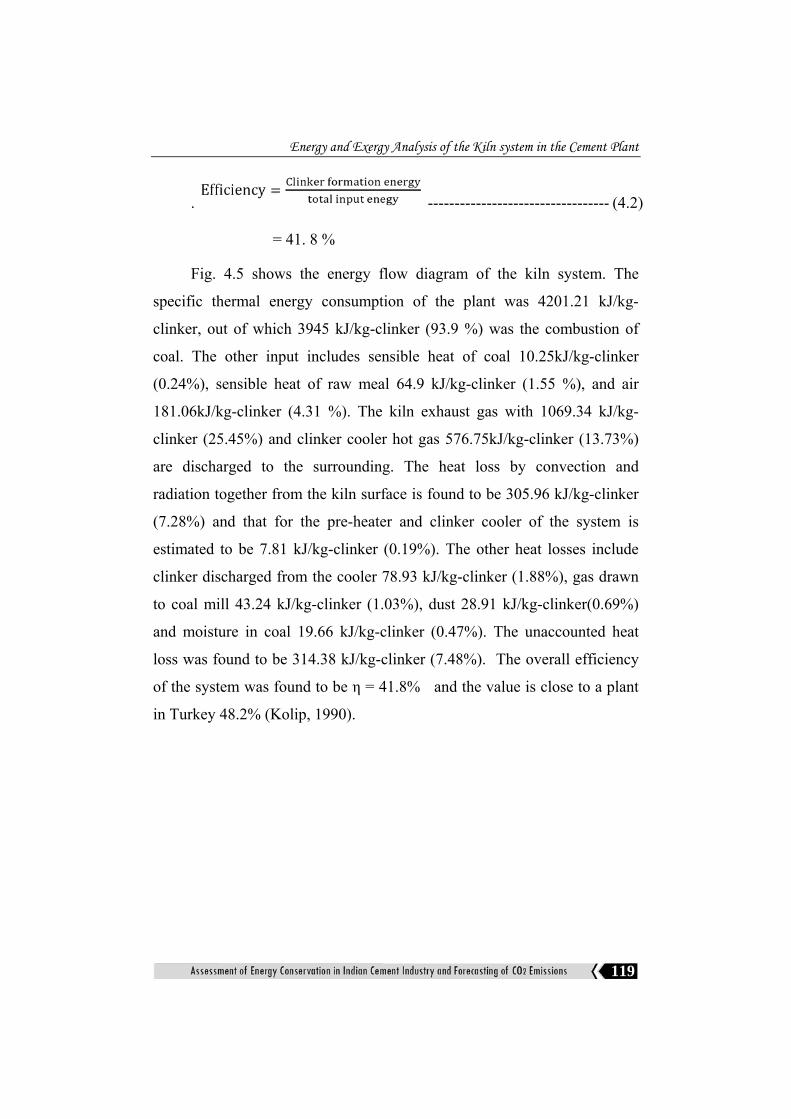
. ---------------------------------- (4.2)
= 41. 8 %
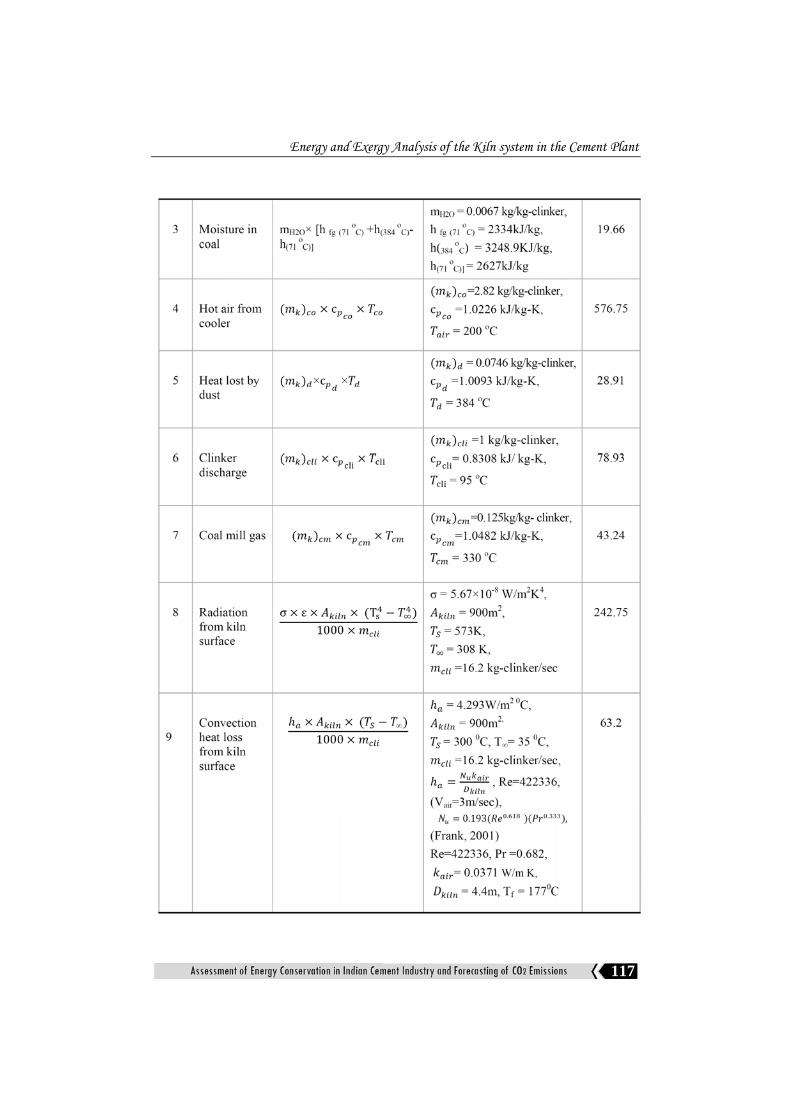
Fig. 4.5 shows the energy flow diagram of the kiln system. The
specific thermal energy consumption of the plant was 4201.21 kJ/kg-
clinker, out of which 3945 kJ/kg-clinker (93.9 %) was the combustion of
coal. The other input includes sensible heat of coal 10.25kJ/kg-clinker
(0.24%), sensible heat of raw meal 64.9 kJ/kg-clinker (1.55 %), and air
181.06kJ/kg-clinker (4.31 %). The kiln exhaust gas with 1069.34 kJ/kg-
clinker (25.45%) and clinker cooler hot gas 576.75kJ/kg-clinker (13.73%)
are discharged to the surrounding. The heat loss by convection and
radiation together from the kiln surface is found to be 305.96 kJ/kg-clinker
(7.28%) and that for the pre-heater and clinker cooler of the system is
estimated to be 7.81 kJ/kg-clinker (0.19%). The other heat losses include
clinker discharged from the cooler 78.93 kJ/kg-clinker (1.88%), gas drawn
to coal mill 43.24 kJ/kg-clinker (1.03%), dust 28.91 kJ/kg-clinker(0.69%)
and moisture in coal 19.66 kJ/kg-clinker (0.47%). The unaccounted heat
loss was found to be 314.38 kJ/kg-clinker (7.48%). The overall efficiency
of the system was found to be η = 41.8% and the value is close to a plant
in Turkey 48.2% (Kolip, 1990).

Chapter-4
120
Fig.
4.5
Ene
rgy
flow
dia
gram
(San
key
diag
ram
) of k
iln sy
stem
(Pro
duct
ion
rate
of 1
400
tonn
es p
er d
ay)

Energy and Exergy Analysis of the Kiln system in the Cement Plant
121
4.4.3 CO2 emissions
For the present operating conditions the kiln was fired with coal at the
rate of 11081 kg/hr. CO2 emissions from the kiln system are mainly due to
the combustion of coal and decarbonation reactions. Complete combustion
of coal and decarbonation reaction is assumed. The corresponding,
stoichiometric of the reactions are written as follows.
C+ O2→CO2
CaCO3→CaO+ CO2
Total yield of CO2 is determined considering 1 kg-clinker, 0.19 kg of
coal/kg of clinker and stoichiometric mass ratio. It is found that 0.37 kg CO2
per kg of clinker is generated from the complete combustion of coal. The raw
meal to clinker ratio at the present operating condition is 1.49 and it contains
1.176 kg of CaCO3. Therefore it was determined that 0.52 kg of CO2 per kg of
clinker is generated during the decarbonation reaction. Hence the total
emissions of CO2 due to combustion of coal and decarbonation reaction for a
clinker production rate of 1400 tonnes per day is estimated to be 1246 tonnes
per day.
4.4.4 Energy conservation opportunities
One of the objectives of the energy conservation measures is to
expand the use of the secondary energy as much as possible and thereby
reduce the requirement for primary purchased energy. In this study, only
thermal energy conservation measures are presented. Basically all output
flow from the kiln system could have potential for waste heat recovery. The
main sources energy conservation can be kiln and cooler exhaust gases and
radiation heat from kiln. The recovered waste heat can be used for power
generation, drying raw material and coal and preheating the secondary air
for kiln.

Chapter-4
122
4.4.5 Waste heat recovery steam generation (WHRSG) –Production rate of 1400 tonnes per day
The overall efficiency of the system can be improved by recovering
some of the heat losses and the recovered heat can be used for several
purposes, such as electricity generation, hot water generation etc. The waste
heat recovery system can also be considered as an environment friendly
system since it utilizes available wasted energy and reduces the resulting
CO2 emissions of cement production processes. It is possible to recover the
major heat losses such as like kiln exhaust gas and hot air from cooler
stack by using waste heat recovery steam generation (WHRSG) unit.
Fig. 4.6 Waste heat recovery steam generation application
The four stage pre-heaters have exhaust gases leaving at temperature
384°C. The clinker is discharged red-hot from the kiln and transferred to
clinker coolers, which performs the function of cooling the clinker for
downstream transport and processing and the temperature of air discharge
from the cooler is 200oC. Both streams would be directed through a waste

Energy and Exergy Analysis of the Kiln system in the Cement Plant
123
heat recovery steam generator and available energy is transferred to water
via the WHRSG. The schematic diagram of WHRSG unit is shown in
Fig.4.6. The available waste energy is such that the steam would be
generated. The steam would then be used to power the steam turbine driven
electrical generator. The electricity generated would offset a portion of the
purchased electricity, thereby reducing electrical demand.
In order to determine the size of the generator, the available energy from
the gas stream must be found. Once this is determined, an approximation of
the steaming rate for a specified pressure can be estimated. The steam rate and
pressure will determine the size of the generator.
As the gas passes through the WHRSG, energy will be transferred
and gas temperature will drop. Targeting a pressure of 8 bar at the turbine
inlet, the minimum steam temperature at the WHRSG exit would be higher
than corresponding saturation temperature which is roughly 170oC. After
exiting the WHRSG, the energy of these streams can be recovered by using
a compact heat exchanger. Hence the final temperature can be reduced as
low as possible, which might be limited by the acid dew point temperature
of stream. According to the final temperature of both the streams, the final
enthalpies have been calculated to be hco=173.84 kJ/kg, heg =184.93 kJ/kg.
So the available heat energy would be
Qavailable = [( mk )eg(heg1-heg2)+ ( mk )co(hco1-hco2)] × mcli ----- (4.2)
where (mk)eg is the mass of exhaust gases from the pre-heater (kg/kg-
clinker), (mk)co is the mass of air from the cooler (kg/kg-clinker) and mcli is
the mass flow rate of clinker(kg/sec)
Qavailable = [2.56(417.72-184.93) + 2.82(204.52-173.84)] ×16.2 =8253 kW

Chapter-4
124
It is assuming a reasonable efficiency of 85% for the steam generator.
Then the energy that would be transferred through
WHRSG = 0.85 × 8253= 7015 kW
For utilizing this available recovered heat energy, a steam turbine unit
is considered with a turbine pressure of 8 bar and a condenser pressure of
10 kPa. It can be shown that the net power, which would be obtained from
this turbine, is almost 1000 kW.
Then the author assumed that the useful power generated is 1000 kW,
then the energy saving will be based on the 1000 kW. Assuming 8000
hours of usage per year,
Energy saved = power generated × hours of usage (4.3)
= 1000kW × 8000hr/yr= 8×10⁶ kWh/yr
The average unit price of electricity can be taken as INR 5/kWh,
therefore, the cost saving would be = 5× 8× 106= INR 4 Crores/year.
The first cost estimate for the system is about INR 6 Crores and
taking into account the operating cost, the payback period for the system is
estimated as follows.
Payback period = implementation cost/ annual cost of saving
= 64 /
INR CroresINR Crores yr
= 1.5 yr = 18 months
For improving the performance of the waste heat recovery steam
generation unit, modifying the existing cycle with flash steam system is an

Energy and Exergy Analysis of the Kiln system in the Cement Plant
125
excellent option. The flash steam power cycle is based on the property that a
certain mass of steam can be separated from water at saturated state if the
pressure is lowered. The amount of flashed steam depends on the pressure
before the flash tank and the final pressure in the tank. The lower the pressure
in the flashing tank the higher is the amount of steam, but on the other side,
low pressure steam generates a lesser amount of power. Fig. 4.7 shows the
configuration of flash steam cycle for the cement plant. In this case two heat
recovery steam generators are used to recover the two waste heat sources; one
for the preheater exhaust, called the suspension preheater boiler, and the other
for the clinker cooler exhaust called the air quenching cooler boiler. The
working fluid passed through feed pump is sent into air quenching cooler
boiler and preheated initially. One part of preheated working fluid is vaporized
and superheated in air quenching cooler boiler, and another part of preheated
working fluid is sent to suspension preheater boiler to be vaporized and
superheated. The two streams of superheated steam from air quenching cooler
boiler and suspension preheater boiler are mixed and expended through turbine
to generate power. The rest of preheated working fluid is expanded in the
flasher and is separated into saturated steam and saturated water. The saturated
steam is then sent into turbine to generate power. The turbine exhaust is
condensed in the condenser, and passes through condensing pump to be mixed
with saturated water from the flasher.

Chapter-4
126
Fig.4.7 Waste heat recovery steam generation unit with steam flash cycle
4.4.6 Heat recovery from the kiln surface (Production rate of 1400 tonnes per day). The convection and radiation heat loss from the kiln surface was
found to be around 7% of the input energy. Using a secondary stationary
shell on the kiln surface can significantly reduce this heat loss. For current
rotary kiln, the radius is 2.2m, and for secondary shell radius of 2.6m can
be considered. Since the distance between surfaces is relatively small
40cm, a realistic estimation for the temperature of secondary shell can be
made. Assume the temperature of the secondary shell as 280oC (T2).
Consider the secondary shell made of steel with relatively low surface
emission and thermal conductivity. The heat transfer by radiation
calculated by Eq. 4.4 (Frank, 2001).

Energy and Exergy Analysis of the Kiln system in the Cement Plant
127
------------------------------------- (4.4)
where Akiln is the surface area of the kiln = 2×Л×r×Lk
σ Stefan Boltzman constant =5.67×10 -8 W/m2K4
T1 is the Kiln surface temperature = 573 K
T2 is the Shell surface temperature = 553 K.
ε1= emissivity for oxidized kiln surface
ε2= emissivity for stainless steel shell.
Qra = 254.962 kW
This heat loss is to be transferred through the insulation of the
secondary shell. For glass wool insulation, the thermal conductivity is taken
as 0.05 W/mK. The thickness of the glass wool insulation can be
determined by using the expression for resistance of the insulation. The
thermal resistance of the insulation is
)2( insins
Shell
ins
ins LkrrIn
Rt×××
⎟⎟⎠
⎞⎜⎜⎝
⎛
=π
---------------------------------------- (4.5)
where k ins is the thermal conductivity of the insulation material.
rins is the outer radius of the insulated secondary shell,
rshell is the outer radius of the secondary shell
L ins is the length of the insulation shell
)6505.02( ×××
⎟⎟⎠
⎞⎜⎜⎝
⎛
=π
Shell
ins
insrrIn
Rt

Chapter-4
128
Assuming temperature difference of ∆T=250oC (which means outer
surface temperature of 50oC), So the radius of the insulation rins can be
determined from the following relation.
∆T ins = Qra (resistance of the insulation) -------------------------- (4.6)
)6505.02(6.2962.254250×××
⎟⎠⎞
⎜⎝⎛
×=π
insrIn
So the radius of the insulation found to be (rins) = 2.65m, and the
thickness would be, t = r ins– r shell = 2.65-2.4 = 0.05 m = 50 mm
When the secondary shell is added to the kiln surface the convection heat
loss become insignificant. Hence the total energy saving would be
= (242.75kJ/kg-clinker×16.2kg-clinker/sec)-254.962=3677.59kW
from the radiation and
= 63.2kJ/kg-clinker×16.2kg-clinker/sec=1023.84 kW from the
convection heat transfers.
Therefore the secondary shell would save the 4.7 MW, which is about
6.9 % of input energy. This energy saving would result the reduction in fuel
consumption of the kiln system, that would reduce CO2 emissions. The
overall efficiency would be increased by approximately 3 to 4%.
4.4.7 CO2 reduction methods in cement plants.
The following methods are also used to reduce CO2 emissions from
the cement plants:
(i) Use of Low carbon intensive fuels
(ii) Use of Waste fuels

Energy and Exergy Analysis of the Kiln system in the Cement Plant
129
(iii) Use of Renewable energy
(iv) Use of Lower clinker to cement ratio and
(v) Carbon capture and storage (CCS).
(i) Use of Low carbon intensive fuels
It is found that lower carbon content fuels reduce CO2 emissions
from the kiln system compared to higher carbon content fuels. CO2
emissions by fuel consumption are practically the same as the CO2
emissions from limestone calcination. In the cement plants saving of
1 kcal reduces CO2 emissions by about 0.325 gm (PCA, 2008).
(ii) Use of Waste fuels
Rotary kilns producing cement clinker can use waste materials as fuels.
Greco et al., (2004) has found that cement kilns by and large encompass
extremely elevated temperatures, high turbulence, continuously
oxidizing conditions and lengthy residence times. The use of a
flammable waste reduces the use of conventional fossil fuels and also
the generation of CO2 emissions. They also found that it is possible to
replace more than 50% of the fuel requirements of a cement kiln with
waste fuels. One of the significant sources of waste materials that can
be used as fuel for cement kilns is used tires. Cement kilns totally
consume used tires, with no residual waste produced.
(iii) Use of Renewable energy
In a thermal power plant using coal as fuel, power generation of one
kWh results in the production of about 0.83 gm CO2 (IPCC, 2007).
CO2 emissions due to electrical power consumption in a cement plant
are dependent on the electrical power generation source and hence if

Chapter-4
130
electrical power for the same is generated from other sources like
hydro, wind or nuclear power, a cement plant would be contributing
practically zero CO2 emissions.
(iv) Use of Lower clinker to cement ratio
The method of reducing CO2 emissions from the cement
manufacturing industry by reducing the amount of clinker used when
making finished cement is found to be better compared to the
previously mentioned techniques. Blending of cement with additives
to replace clinker have significant effects in the reduction of CO2
emissions.
(v) Carbon capture and storage (CCS)
CO2 capture and storage (CCS) is an emerging method for reducing
CO2 emissions in cement plants. There are a number of storage
destinations such as saline aquifers, porous geologic formation,
depleted oil and gas reservoirs and coal seams. In this method there are
basically three strategies for CO2 capture in cement plants. They are (i)
Pre-combustion, (ii) Post-combustion, and (iii) Oxy-combustion
a) Precombustion
For new cement plants integrated with gasification technologies, pre-
combustion CO2 capture will be more applicable to produce Syngas
(a mixture of H2, CO, H2O, and CO2) from the main plant fuel. H2
would be then fired in the cement kiln after capturing CO2 from this
Syngas. However CO2 released by calcination of limestone will not
be captured. In addition, a new generation of burner technology and
cement kiln lines will be required.
Energy and Exergy Analysis of the Kiln system in the Cement Plant
131
b) Post-combustion
A commercially mature technology used in chemical industry for
separation of CO2 is the post combustion capture by amine scrubbing
(e.g. using Monoethanolamine (MEA)). The CO2 is stripped from
ammine solution, dried, compressed and transported to storage site.
Alie et al. (2005) found out that the main challenge lies in the scale
up of this process and its implementation for scrubbing of CO2 from
flue gases that contain a number of contaminations potentially
harmful to the operation of the scrubber unit.
Post-combustion CO2 capture technologies exhibiting the following
characteristics are extremely useful in the present cement industry: 1)
technical compatibility with cement manufacturing operating
conditions, 2) non-toxic, non-hazardous materials, 3) minimal impact
on cement plant operations, and 4) affinity to operational experience
of cement plants.
c) Oxy - firing
In this method, the combustion air is totally replaced with pure
oxygen combined with recycled CO2 rich flue gas to moderate the
flame temperature. Due to high percentage of CO2 in flue gases
originating from the calcinations process, combustion in a CO2 / O2
atmosphere looks like one of the finest options for CO2 reduction in the
cement plant. If cement kiln could be successfully operated with a high
CO2 atmosphere and leakage could be greatly reduced, oxy-combustion
of the kiln could be a reasonable option (Adia et al., 2009).
Chapter-4
132
4.4.8 Exergy balance of the kiln system (Production rate of 1400 tonnes per day).
The process for which the exergy analysis performed is assumed to
be the kiln system as an open system under the steady state working
condition. The reference pressure and temperature for the dead state
conditions are assumed to be 101 kPa and 298 K respectively. There are
physical exergy in the process. The chemical reaction takes place in the
preheater and rotary kiln.
The following assumptions are considered for the exergy analysis.
a) The effect of the pressure on the input and output enthalpies are
neglected.
b) All gas steams are ideal gas mixtures.
c) The process is at the steady-state conditions, that is no
parameter changes with time.
Equations for the exergy analysis were given in the Annexure C.
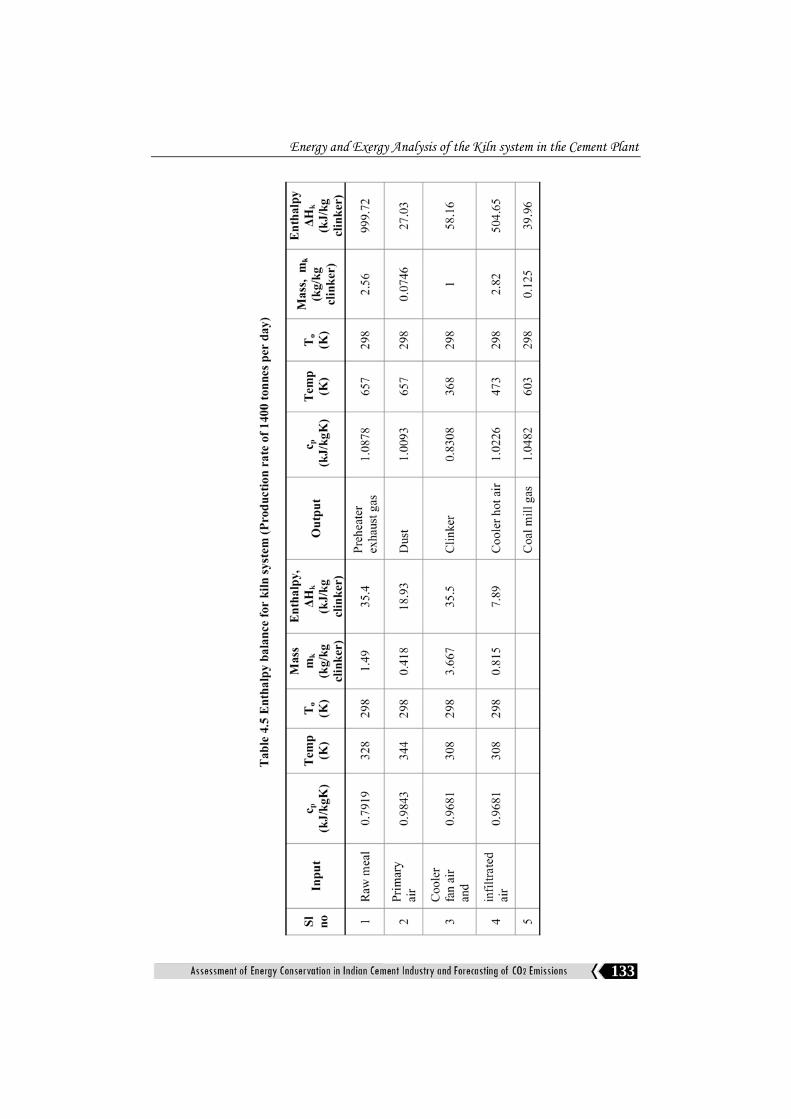
Table 4.5 and 4.6 shows the enthalpy and entropy balance in the kiln
system. The exergy balance is shown in Fig 4.7. The detailed calculation of
exergy of the input and output steams are shown in Annexure E. The
exergy calculation for the clinker formation is given in Annexure D.
Energy and Exergy Analysis of the Kiln system in the Cement Plant
133

Chapter-4
134

Energy and Exergy Analysis of the Kiln system in the Cement Plant
135
Chapter-4
136
Fig.
4.8
Exe
rgy
flow
dia
gram
(San
key
diag
ram
) of t
he k
iln sy
stem
(Pro
duct
ion
rate
of 1
400
tonn
es p
er d
ay)
Energy and Exergy Analysis of the Kiln system in the Cement Plant
137
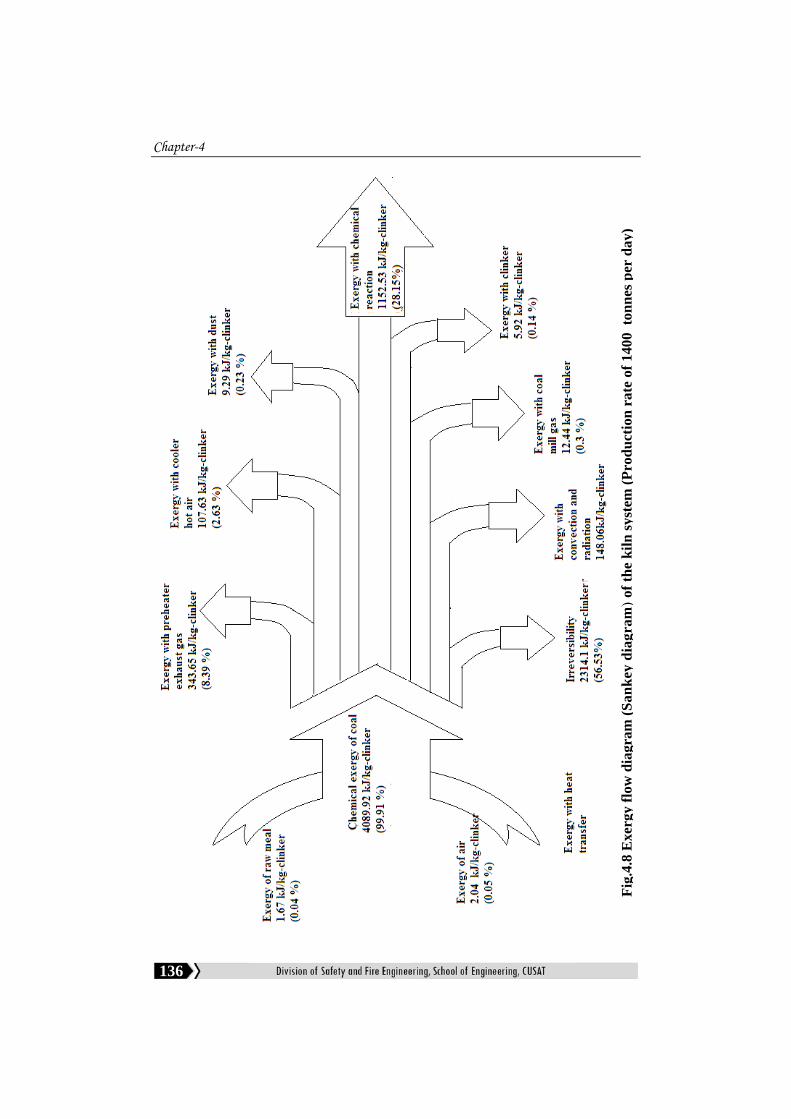
The exergy analysis results of the input and output components are
shown in Table 4.7. It is clear from that the results exhibit good consistency
between input and output exergy fluxes. The available exergy of the whole
system was found to be 4093.63 kJ/kg-clinker. It is also interesting to
observe from Table 4.7 that almost 99.91 % (4089.92 kJ/kg-clinker) of the
input exergy is the chemical exergy of coal.
---- (4.7)
= 28.3 %
The allocation of input and output exergies of various components
can be best represented by the Sankey diagram as shown in Fig. 4.8.
This value represents 28.3% of the useful exergy with the remaining
71.7 % being exergy losses at the various stages of the system. The
major loss is due to irreversibility in the system 56.53% (2314.1 kJ/kg-
clinker). The kiln exhaust gas 343.65 kJ/kg-clinker (8.39 %) and clinker
cooler hot gas 107.63 kJ/kg-clinker (2.63 %) are discharged to the
surrounding. The exergy with heat losses are found to be 148.06 kJ/kg-
clinker (3.62%). The coal mill gas and dust were found to be 12.44
kJ/kg-clinker (0.3%) and 9.29kJ/kg-clinker (0.23%) respectively.
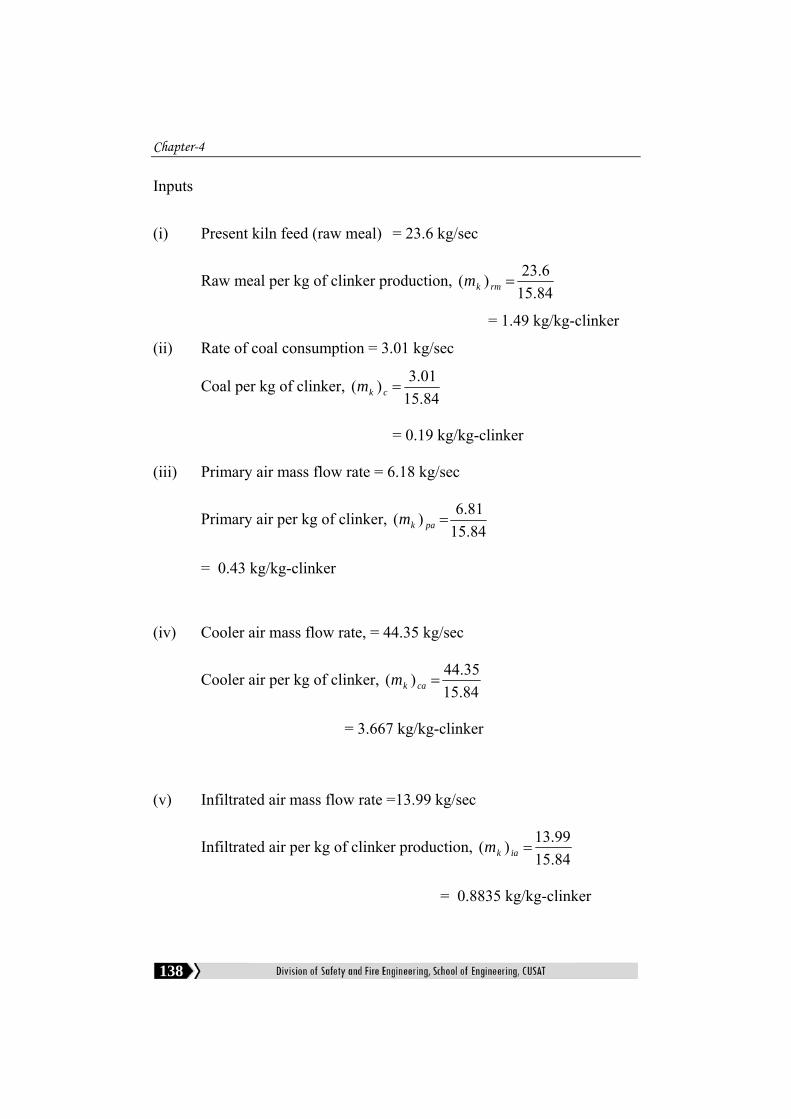
4.4.9 Mass balance of the Kiln System (Production rate of 1369 tonnes per day) In this case the clinker production rate in the kiln is estimated to be
15.84 kg of clinker/sec. For this operating condition the various input and
out put components of the kiln system are estimated as follows.
Chapter-4
138
Inputs
(i) Present kiln feed (raw meal) = 23.6 kg/sec
Raw meal per kg of clinker production, 84.156.23)( =rmkm
= 1.49 kg/kg-clinker
(ii) Rate of coal consumption = 3.01 kg/sec
Coal per kg of clinker, 84.1501.3)( =ckm
= 0.19 kg/kg-clinker
(iii) Primary air mass flow rate = 6.18 kg/sec
Primary air per kg of clinker, 84.1581.6)( =pakm
= 0.43 kg/kg-clinker
(iv) Cooler air mass flow rate, = 44.35 kg/sec
Cooler air per kg of clinker, 84.1535.44)( =cakm
= 3.667 kg/kg-clinker
(v) Infiltrated air mass flow rate =13.99 kg/sec
Infiltrated air per kg of clinker production, 84.1599.13)( =iakm
= 0.8835 kg/kg-clinker
Energy and Exergy Analysis of the Kiln system in the Cement Plant
139
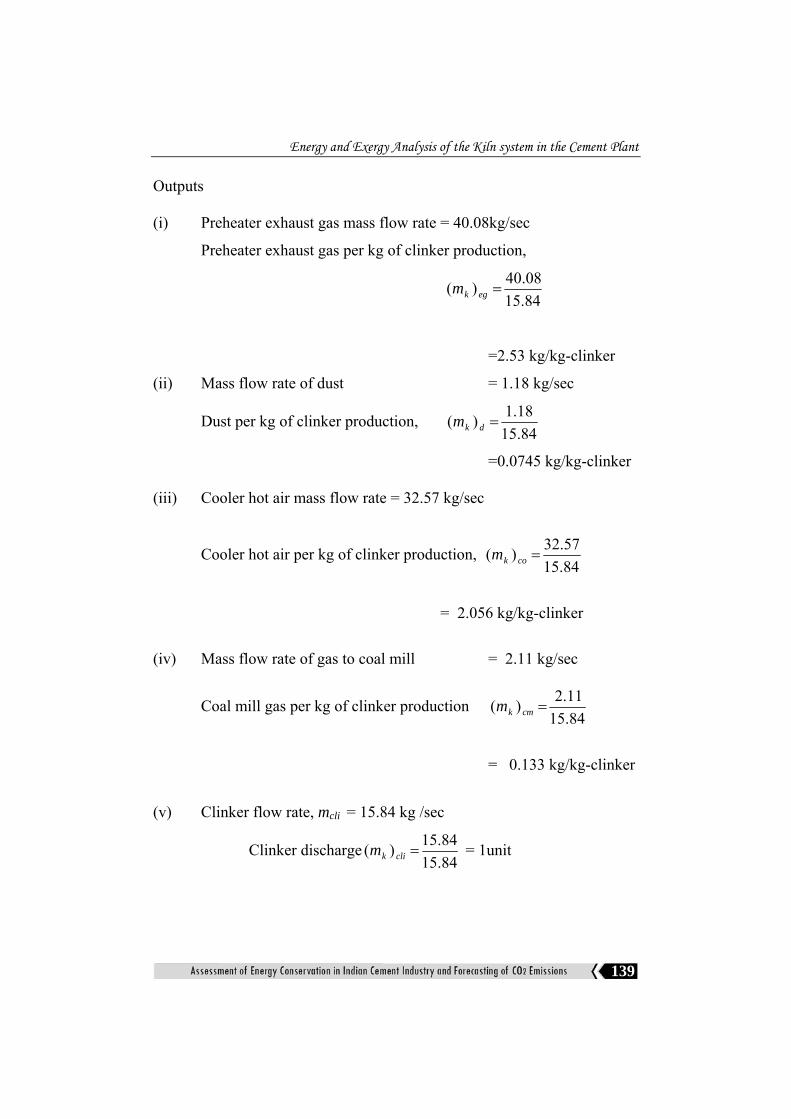
Outputs (i) Preheater exhaust gas mass flow rate = 40.08kg/sec
Preheater exhaust gas per kg of clinker production,
84.1508.40)( =egkm
=2.53 kg/kg-clinker
(ii) Mass flow rate of dust = 1.18 kg/sec
Dust per kg of clinker production, 84.1518.1)( =dkm
=0.0745 kg/kg-clinker (iii) Cooler hot air mass flow rate = 32.57 kg/sec
Cooler hot air per kg of clinker production, 84.1557.32)( =cokm
= 2.056 kg/kg-clinker
(iv) Mass flow rate of gas to coal mill = 2.11 kg/sec
Coal mill gas per kg of clinker production 84.1511.2)( =cmkm
= 0.133 kg/kg-clinker
(v) Clinker flow rate, mcli = 15.84 kg /sec
Clinker discharge84.1584.15)( =clikm = 1unit
Chapter-4
140
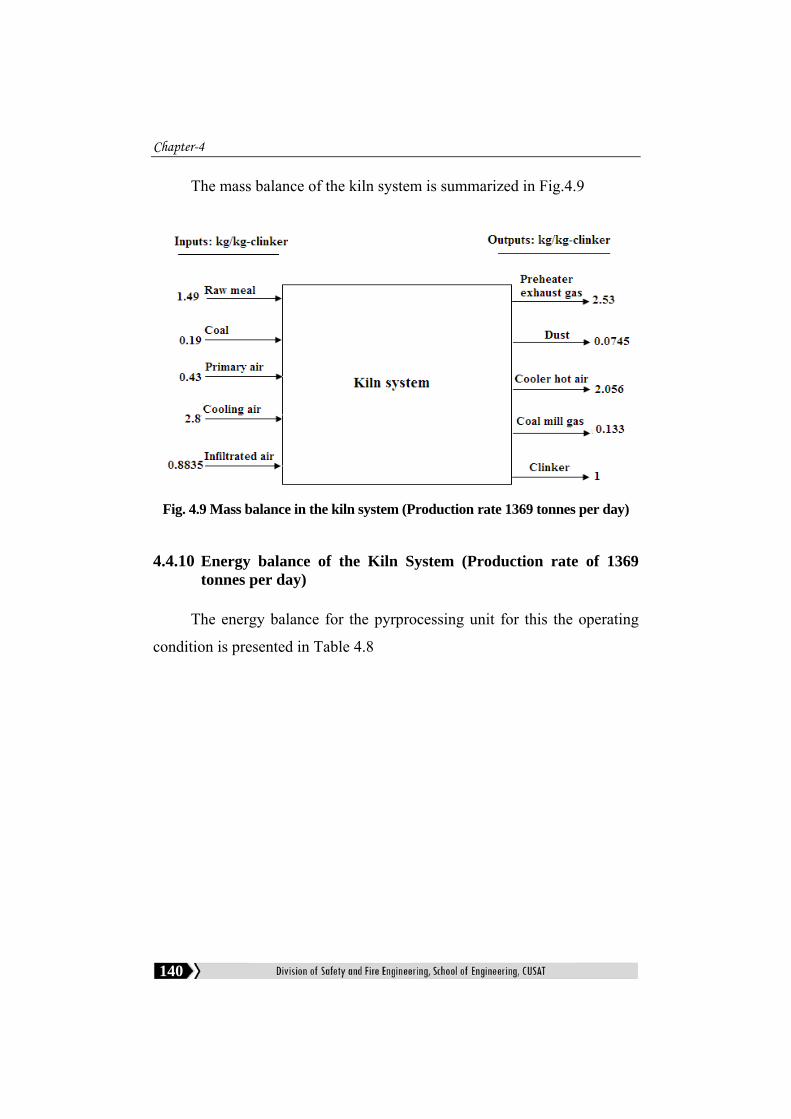
The mass balance of the kiln system is summarized in Fig.4.9
Fig. 4.9 Mass balance in the kiln system (Production rate 1369 tonnes per day)
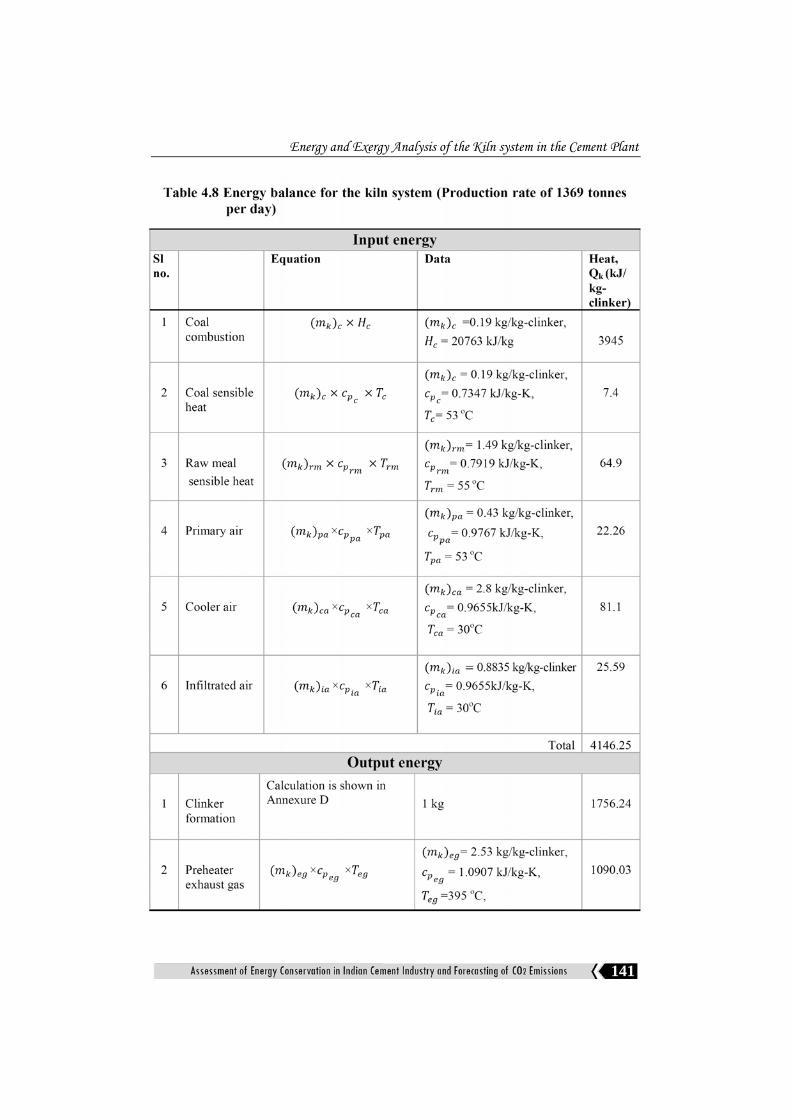
4.4.10 Energy balance of the Kiln System (Production rate of 1369 tonnes per day)
The energy balance for the pyrprocessing unit for this the operating
condition is presented in Table 4.8
Energy and Exergy Analysis of the Kiln system in the Cement Plant
141

Chapter-4
142
Energy and Exergy Analysis of the Kiln system in the Cement Plant
143

Chapter-4
144
Fig.
4.10
E
nerg
y flo
w d
iagr
am o
f the
kiln
syst
em (P
rodu
ctio
n ra
te o
f 136
9 to
nnes
per
day
)
Energy and Exergy Analysis of the Kiln system in the Cement Plant
145
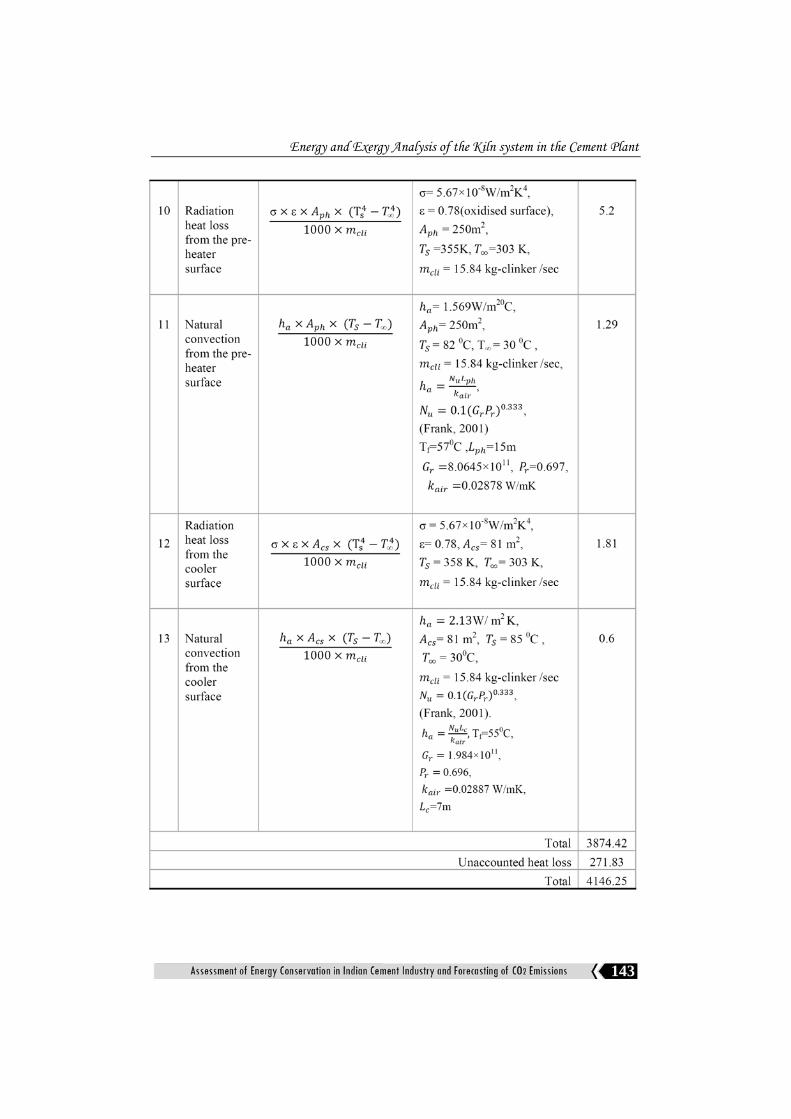
Fig.4.10 shows the Sankey diagram demonstrating magnitudes and
percentages of energy flows and losses. The results shows that fuel
combustion generate heat of 3945 kJ/kg-clinker (95.14%). The total
sensible heats of raw meal, coal and air at the input are found to be 137.85
kJ/kg-clinker (4.86%). The first law efficiency of the system is found to be
42.36%. The major energy losses such as kiln exhaust gas, clinker cooler
hot gas and radiation and convection of kin system were estimated to be
1090.03 kJ/kg-clinker (26.29%), 464.58 kJ/kg-clinker (11.2%) and 334.91
kJ/kg-clinker (8.1%) respectively. The heat energy carried by the coal mill
gas was found to be 47.48 kJ/kg-clinker (1.15%). The other heat losses are
clinker discharge 131.09 kJ/kg-clinker (3.16%), dust 29.89 kJ/kg-clinker
(0.72%) and moisture in coal 20.26 kJ/kg-clinker (0.49%). The
unaccounted heat loss was found to be 271.83 kJ/kg-clinker (6.56%). The
total emissions of CO2 due to combustion of coal and decarbonation reactions
for a clinker production rate of 1369 tonnes per day is estimated to be 1218
tonnes per day.
4.4.11 Exergy balance of the kiln system (Production rate of 1369 tonnes per day)
The input and output enthalpy and entropy for this operating
condition are shown in the Table 4.9 and Table 4.10 respectively. The
exergy of the various streams of the clinker production process are shown
in the Table 4.11.

Chapter-4
146

Energy and Exergy Analysis of the Kiln system in the Cement Plant
147

Chapter-4
148

Energy and Exergy Analysis of the Kiln system in the Cement Plant
149
Fig.
4.11
Exe
rgy
flow
dia
gram
of t
he k
iln sy
stem
(Pro
duct
ion
rate
of 1
369
tonn
es p
er d
ay)
Chapter-4
150
Fig. 4.11 shows the Sankey diagram of input and output exergy of
various components of the kiln system. The exergy efficiency for this
operating condition was found to be 28.6%. The contribution of the major
input exergy is coal and it is found to be 4089.92 (99.94%) and the
remaining contains exergy of raw meal 1.67 kJ/kg-clinker (0.04%) and air
0.67 kJ/kg-clinker (0.02%). The irreversibility in the system was found to be
2286.35 kJ/kg-clinker (55.88%). The kiln exhaust gas with 357.24kJ/kg
clinker (8.73%) and clinker cooler hot gas 94.99 kJ/kg-clinker (2.32%)
are released to the surrounding. The exergy associated to radiation and
convection heat losses are found to be 159.37 kJ/kg-clinker (3.89%). The
exergy of coal mill gas and dust are found to be 13.97kJ/kg-clinker
(0.35%) and 9.79 kJ/kg-clinker (0.24%) respectively.
4.5 Conclusion Energy analysis is a powerful tool, which has been effectively used in
the design and performance evaluation of energy related systems. The
energy efficiency value for the kiln system for first operating condition
(Production rate of 1400 tonnes per day) was found to be 41.8%. The major
heat losses for the system were identified as the preheater exhaust gas and
hot air discharged from the cooler. The preheater exhaust gas carries about
1069.34 kJ/kg-clinker and that of the cooler hot gas is 576.75 kJ/kg-clinker,
which indicate that the total energy recovery potential from these waste
gases is of the order of 39.18%. The selected retrofit steam cycle showed an
energy saving potential of 7 MW from the waste heat streams. The CO2
emission due to the combustion of coal and decarbonation reaction of raw
meal in the first operating condition was found to be 1246 tonnes per day.
Energy and Exergy Analysis of the Kiln system in the Cement Plant
151
The heat loss by convection and radiation together from the kiln
surface is about 305.96 kJ/kg-clinker (7.28%) and that for the pre-heater
and clinker cooler of the system is estimated to be 7.81 kJ/kg-clinker
(0.19%). For the kiln system, a secondary shell system has been proposed
and designed. This system would lead to saving 6.9% of the input energy;
hence the overall efficiency would be increased by approximately 3 to 4%.
As for the exergy, it was determined that the exergy efficiency of the
existing system is `28.3% and the irreversibility is 56.53%. Therefore it is
seen that exergy analysis accounts for the operation, indicating the
locations of energy degradation in the process. The main cause of
irreversibility in the process is due to conversion of chemical energy of the
fuel to thermal energy.
For the second operating condition (Production rate of 1369 tonnes
per day) first law and second law efficiencies of the kiln system were found
to be 42.36% and 28.6% respectively. The irreversibility of the system was
found to be 2286.35 kJ/kg-clinker (55.87%). The values are very close to
the previous operating condition. The energy loss by the preheater exhaust
gas and cooler exhaust were found to be 1090.03 kJ/kg-clinker (26.29%)
and 464.58kJ/kg-clinker (11.2%) respectively. As a result the total energy
recovery potential from these waste gases in this operating condition was
estimated to be 37.49%. Here results obtained for the energy and exergy
analyses of the kiln system were almost close to the first operating
condition (Production rate of 1400 tonnes per day). Therefore the average
values of the energy and exergy efficiencies of the kiln system were found
to be 42.08% and 28.45% respectively.
….. …..