energy 2030: financing a greener future 2030...energy 2030: financing a greener future financing...
TRANSCRIPT

Citi is one of the world’s largest financial institutions, operating in all major established and emerging markets. Across these world markets, our employees conduct an ongoing multi-disciplinary global conversation – accessing information, analyzing data, developing insights, and formulating advice for our clients. As our premier thought-leadership product, Citi GPS is designed to help our clients navigate the global economy’s most demanding challenges, identify future themes and trends, and help our clients profit in a fast-changing and interconnected world. Citi GPS accesses the best elements of our global conversation and harvests the thought leadership of a wide range of senior professionals across our firm. This is not a research report and does not constitute advice on investments or a solicitation to buy or sell any financial instrument. For more information on Citi GPS, please visit our website at www.citi.com/citigps.
Citi GPS: Global Perspectives & Solutions
December 2015
ENERGY 2030: FINANCING A GREENER FUTUREFinancing Green Energy in a Low Fossil Fuel Price World and Managing Stranded Asset Risk

Citi GPS: Global Perspectives & Solutions December 2015
Reconciling Cheap Fossil Fuels in a Low Carbon World De-risking Through Pubic Sector Involvement Stranded Assets in Practice
Anthony Yuen Global Commodities Strategist
+1-212-723-1477 | [email protected]
Edward L Morse Global Head of Commodities Research
+1-212-723-3871 | [email protected]
Seth M Kleinman Head of Energy Strategy
+44-20-7986-4556 | [email protected]
Adriana Knatchbull-Hugessen Commodities Strategy Team
+1-212-723-7193 | [email protected]
Renewable Energy Cost Trends & Drivers
Michael Taylor Senior Energy Analyst at IRENA
Innovations in Alternative Energy Finance
Marshal Salant Head of Alternative Energy Finance Group, Citi +1-212-723-6096 | [email protected]
Bruce Schlein Director, Alternative Energy Finance Group, Citi +1-212-723-1836 | [email protected]
Richard Morse Associate, Alternative Energy Finance Group, Citi +1-212-723-6667 | [email protected]
Securitization Solutions for a Greener Planet
Mary E Kane Head of Global Securitized Products
+1-212-816-8409 | [email protected]
Eugene Belostotsky US Consumer ABS Strategy
+1-212-816-8432 | [email protected]
Renewable Energy Project Structuring & Hedging
Roxana Popovici Director, Commodities Structured Products Group, Citi +1-713-752-5405 | [email protected]
Mike Curry Head of North American Commodities Structured Product Group, Citi
+1-713-693-6866 | [email protected]
Financing Global Renewable Energy with DFIs
Georges Romano Regional Head of Export and Agency Finance Latin America, Citi +1-212-816-6158 | [email protected]
Valentino Gallo Global Head of Export and Agency Finance, Citi
+1-212-816-1008 | [email protected] Innovation to Unlock Developing Economy Finance
Barbara Buchner Senior Director of Climate Policy Initiative
Will Fossil Fuels be Stranded?
Willem Buiter Global Chief Economist
+1-212-816-2363 | [email protected]
Ebrahim Rahbari Global Economist
+1-212-816-5081 | [email protected]
Contributors Chris Main – Citi Commodities Research Donavan Escalante – Climate Policy Initiative

December 2015 Citi GPS: Global Perspectives & Solutions
© 2015 Citigroup
3
ENERGY 2030: FINANCING A GREENER FUTURE Financing Green Energy in a Low Fossil Fuel Price World and Managing Stranded Asset Risk In our August 2015 Citi GPS report Energy Darwinism II, we took an objective look
at the economics of the global warming debate, to assess the incremental costs and
impacts of mitigating the effects of emissions, to see if there is a ‘solution’ that offers
global opportunities without penalizing global growth, whether we can afford to do it
(or indeed whether we can afford not to), and how we could make it happen.
After looking at the macroeconomic effect, we decided to switch gears and
investigate the microeconomics of a changing energy environment. In this new
report, we take a look at the competitive dynamics between fossil fuels and
renewables and question whether renewables will remain competitive in a lower-for-
longer fossil fuel environment, and subsequently, can renewables still be
competitive in a zero subsidy environment. Financial innovation will be key to
making this a reality.
Technological breakthroughs in oil and gas production (shale technology) as well as
renewable technology have led to precipitous cost declines in both energy
mediums. With incremental efficiency gains and cost declines tailing off as
renewables technologies mature and given financial costs are a large part of the
overall costs for renewable power plants, the authors believe financial innovation
could provide the next leg of cost declines for renewables to maintain their
competitive position with fossil fuels. Given that cost of capital differs greatly
between regions, financing costs of capital intensive renewables projects can
indeed constitute the close to half of overall costs.
To investigate how innovations in renewable energy finance and policy support for
green finance could alter competitive dynamics of renewables vs. fossil fuels, the
report considers total costs of new power plants forecasted to 2030 under a ‘high’
and ‘low’ financing scenario and finds that financing costs matter.
Equally important as renewables to global climate change mitigation are the
dynamics of inter-fuel competition and namely the battle between coal and gas.
While new plant economics seem to favor the rise of natural gas, regional variation
in costs and power demand growth could dampen its ascent, to the benefit of coal.
There is therefore a need for governments to assess appropriate policies to assure
not only support for renewables but also for natural gas. In a changing energy
environment, the issue of stranded assets is relevant as there is fear that policies
aimed at climate change could lead to large amounts of stranded assets and
potentially creating the inadvertent effect of companies holding back on needed
investments to fuel the planet.
Most importantly, the report investigates the future of new energy financing by
exploring the core alternative energy project finance strategies that are critically
important in many regions. It also drills down on the key components of broader
financing strategies that address the role of currency risk in emerging markets,
hedging strategies for project finance, public sector de-risking measure,
participation of development finance institutions and the securitization of distributed
energy production.
Kathleen Boyle
Managing Editor, Citi GPS

© 2015 Citigroup
Renewables vs. Fossil Fuels
Financing is a large percentage of overall costs for renewables making financial innovation important (2015, $/MWh)
Cost of a new power plant in 2014 and in a hypothetical “falling renewables financing cost” scenario out to 2030 ($/MWh)
Hypothetically, what happens to renewable energy competitiveness when financing costs are lowered?
Source: NREL, IRENA, IEA, EIA, Citi Research (A = Actual, H = Hypothetical)
Source: NREL, IRENA, IEA, EIA, Citi Research
$0
$50
$100
$150
$200
North America Latin America
Tax Costs
Financing Costs
Fuel and O&M Costs
Capital Costs
95
58
91
56
2030H2014A
66
105
47
46
2030H2014A
98 87
88
135
64
61
Wind
Wind
Solar
Solar
Coal
Coal
Gas
Gas

Europe Developing Asia OECD Asia
88
72
83
66
2030H2014A
99
180
70
79
92
85
87
78
2030H2014A
123
222
85
97
46
67
44
61
2014A
64
99
46
43
Wind
Wind
Wind
Solar
Solar
SolarCoal Coal
Coal
GasGas
Gas
2030H

Citi GPS: Global Perspectives & Solutions December 2015
© 2015 Citigroup
6
Contents
Introduction 7
Part A: Reconciling Cheap Fossil Fuels in a Low Carbon World 9 (1) The New Reality of Cheap Oil 9 (2) Gas: Shale Revolution Pressuring Global Prices 11 (3) Dirty but Cheap: Dethroning King Coal is Difficult without Policy Help in Many Regions 13 Energy 2030: Consultant Analysis 17 (4) IRENA: Renewable Energy Cost Trends and Drivers 17 Solar PV and Wind Power: The Rapidly Maturing Newcomers 19 Energy 2030; Commodities Analysis 24 (5) A Global Power Struggle: The Face-off between Renewables, Coal and Gas 24 Cheap Oil and the Rise of the Alternative Vehicle 36 (6) Policies: Crucial Roles but Unintended Consequences 38 Unintended Consequences of Policies – Stranded Assets of an Unexpected Kind 40 Externalities Increasingly Captured in “Shadow Carbon Prices” 43
Part A Conclusion 45
Part B: The Future of New Energy Financing 46
Innovations in Alternative Energy Finance 48 Citi Alternative Energy Finance 50
Securitization Solutions for a Greener Planet 56 Mother Earth = Mother Lode Energy Savings 56 Why WHEEL Represents the Future 57 Green Energy ABS Supply: Past and Future 58 How WHEEL Works: Kickoff ABS Deal 60 A Secondary Market for Energy Efficiency Lending 60 Renewable Funding (RF): Principal Parties 61 RF Structure and Credit Enhancement 62 Collateral Risks & Mitigants 62 Solar Lease & PACE Lien ABS Limitations 64 Summary: ABS Offers Green Pastures for Energy Financing 66
Renewable Energy Project Structuring and Hedging in the US 67
Financing Global Renewable Energy with Development Finance Institutions 71
Innovation to Unlock Developing Economy Finance: Currency Risk Reduction 75
De-risking Through Public Sector Involvement 79
Part B Conclusion 83
Part C: Will Fossil Fuels be Stranded? 84
Stranded Assets in Practice 92 Conventional Wisdom may be Wrong: Critical Role of Policies and Unintended Consequences 92
Appendix A 94 Pricing Carbon Under Uncertainty: A Practical Approach for Finance 94 Investing in Renewable Energy at the Project Level is Different in Three Key Ways: 95
Author Biographies 97
Energy 2030: Commodities Analysis
Energy 2030: Financing Analysis
Energy 2030: ABS Analysis
Energy 2030 Financing Analysis
Energy 2030: Consultant Analysis
Energy 2030: Commodities Analysis
Energy 2030: Macro Analysis
Energy 2030: Commodities Analysis

December 2015 Citi GPS: Global Perspectives & Solutions
© 2015 Citigroup
7
Energy 2030: Commodities Analysis
Introduction Innovative finance may soon become the critical lynchpin for mitigating climate
change. While the costs of renewables continue to fall, a new era of lower-cost
fossil fuels is upon us, sharpening the competitive landscape. The impact of
cheaper fossil fuels will ripple through the global energy system. But even as the
economics of competition are being altered, the position of renewable energy vs.
traditional fuels continues to be strengthened by rapid innovation in technology,
policy and finance.
The good news is that renewable energy costs have experienced precipitous
declines over the last several years as technologies have evolved and efficiencies
have improved. See Citi’s GPS report “Energy Darwinism II” for extensive analyses
on the subject. But the very maturation that has driven cost reductions in the past
may require new sources of innovation in the new competitive environment.
Solutions, in addition to technological innovation, are key to reducing the costs of
renewables at a pace that most climate scientists suggest is required. The
emergence of new energy technologies, from renewables and efficiency, to smart
grid and electrification of transportation, requires financing solutions.
Finance can be at the forefront of this effort by providing affordable ways to fund the
high upfront capital needs of large renewable energy projects, or finding ways to tap
the massive opportunity in distributed energy and energy efficiency. Indeed, in
addition to the economic and policy environment, our analyses of the competitive
dynamics in power markets reveals that financing costs should be a major
determinant in the economic viability of renewable energy in many regions.
Significant strides have already been made. Structures for securitizing renewable
energy, for more complex domestic and foreign project finance and for reducing
currency risk in foreign projects, are some of the innovations in this space that are
discussed in detail in this report. Some private sector financing also involves
construction financing, debt financing (bank term loans and bond market private
placements), mezzanine financing (mezzanine debt, leasing, tax equity), pool
financing (inverted leases, asset-backed securities (ABS), Real Estate Investment
Trusts (REIT), master limited partnership (MLP), YieldCo) and derivative hedging
(interest rate, FX, commodities, power). Government policies can also help to de-
risk projects and lower the cost of capital. In the end, the shape and pace of
government policies is potentially a major accelerant as support for clean energy
continues to grow globally.
But, for the broader picture of global emissions, the potential for cheaper natural
gas to displace coal globally could be critically important. This potential has already
been witnessed over the last five years in the US, which saw dramatic declines in
CO2. For nearly two decades, discoveries of cleaner-burning natural gas have
outpaced those of petroleum and it is now clear that global gas resources are
distributed in many more countries than petroleum and are also found offshore and
in deep waters around the world. The long heralded “Golden Age of Gas”,
promulgated a half decade ago by the International Energy Agency, was supposed
to catalyze this shift internationally and harken to a new era when gas would
supplant coal as the baseload for power generation.
Anthony Yuen
Ed Morse
Seth Kleinman
Adriana Knatchbull-Hugessen
Citi Commodities Research
Renewable energy costs have seen
precipitous declines as technologies have
evolved and efficiencies have improved
Financial innovation will be critical in the
next phase of renewables cost reduction
when currently as much as half of the total
cost of renewables could be financing costs
Innovative financing options are already
starting to be used effectively
Cleaner-burning natural gas has displaced
coal in the US
Citi GPS: Global Perspectives & Solutions December 2015
© 2015 Citigroup
8
Yet markets, left to their own devices, may not be as supportive of gas-fired
generation as commonly anticipated. Though Citi estimates that the cost of a new
natural gas plant is lower than that of a new coal plant in many parts of the world,
natural gas is still typically more expensive than coal on an operational cost basis.
In regions where power demand growth is flat or declining, these economics could
actually favor coal over gas, as seen in recent years in the European power market.
Without cleaner-burning gas to substitute for coal in power generation and for oil in
transportation, it will be difficult to reach an appropriate level of carbon reduction
around the world. There is thus a need for governments to assess appropriate
policies to assure not only support for renewables but also for lower carbon fuels,
including natural gas. Moving from a cost-based to more value-based energy
markets would involve pricing negative externalities generated from pollution and
climate change. An economically optimal way to achieve this goal would be to price
carbon.
But even targeted and appropriate policy support might have additional
consequences in the form of stranded assets. There has been an accelerating fear
that climate change policies could “strand” hundreds of billions of dollars of fossil
fuel assets globally. Such a large risk might prompt companies to hold back on the
portion of fossil investment still needed to fuel the economy. The stranded asset
fear, in short, could lead to inadequate investments to bridge the gap to a cleaner
future. We believe such fears are exaggerated yet the problem of stranded assets
looms large in current debates over “what to do” about climate change. The
underlying concern, fed by growing divestment by sovereign wealth funds,
university endowments and other fiduciaries of their coal and other “dirty fuel”
assets, is that coal and oil sands have become to some degree the new tobacco.
Perhaps the most dramatic statement of the stranded asset issue came in a speech
by Bank of England Governor Mark Carney at a Lloyd’s of London dinner on
September 28, 2015, in which he warned that between one-fifth and one-third of the
world’s proven reserves of oil, gas and coal were at risk if the world were to meet a
2 degree Celsius targeted limit on the average global change in temperature. Citi
Chief Economist Willem Buiter reviews the stranded asset issue in Part C of this
report. We find that there are several confusions at work here, including the natural
process of phasing out assets that are replaced by cheaper substitutes or new
technologies, summed up by the notion that the Stone Age didn’t end because of a
scarcity of stones.
The bulk of the report that follows focuses on the interaction of these issues,
starting with an overview of the current state of the fossil fuel and renewables
markets and their outlook for the future, including the competitive dynamics and
policies likely to drive future growth. The next section presents an overview of
financial innovations that are becoming increasingly important for the growth of
alternative energy. We find that the future for renewable energy is as bright as ever,
despite cheaper fossil fuels and ups-and-downs in equity prices of renewable
energy companies. The role of finance more broadly in enhancing the
competitiveness of renewable energy becomes critically important, by helping to
recycle capital and optimize the allocation of risk and funding of projects. We
conclude with a discussion of stranded assets.
Conventional wisdom generally believes
renewables and gas are winners while coal
is the biggest loser…but this might not be
the case globally
Climate change policies can help the move
away from coal but also increase the risk of
stranded assets leading to the possibility of
inadequate energy investments to bridge the
gap to a cleaner future
Stranded assets are another issue causing
confusion such as the natural process of
phasing out assets that are replaced by
cheaper substitutes or new technologies

December 2015 Citi GPS: Global Perspectives & Solutions
© 2015 Citigroup
9
Part A: Reconciling Cheap Fossil Fuels in a Low Carbon World The future of energy markets and climate are inseparable. Energy has always been
the leading source of global carbon emissions, contributing 69% of all greenhouse
gas (GHG) emissions.1 This basic math of climate change dictates that
understanding the trajectory of emissions requires understanding how the global
energy market will behave and evolve. Seemingly minor changes in major fossil fuel
markets – such as a switch from coal to gas – can have outsized impacts on
emissions. The major shifts now underway in global energy markets are therefore
critical for climate pathways as well as financial markets.
But now, the confluence of cheaper energy and greater climate and environmental
policy are poised to reshape energy markets by catalyzing large-scale shifts in fuel
use and investment. The momentum of climate and environmental policies that
might fundamentally alter energy use in the global economy is building, but that
momentum could be challenged by cheaper oil, coal and gas that are better
positioned to compete with cleaner alternatives.
At the intersection of these forces is potentially the largest beneficiary and one of
the most important tools for global emissions mitigation – renewable energy. But
climate policy does not imply the abdication of competitive economics – whether
and how renewable energy can compete will still matter immensely to its growth and
viability as a climate solution, particularly in a lower fossil fuel price regime.
(1) The New Reality of Cheap Oil
The unconventional oil revolution, a product of this century, has turned on its head
basic assumptions about oil prices, OPEC and long-term energy costs, making oil
prices lower than anyone would have dreamed in 2010 and posing a big challenge
to the economics of renewable fuels. Three new sources of oil were tapped into on
a large scale for the first time ever as a result of high prices in the first decade of the
21st century – oil produced from oil sands, deep water and shales. As a result, in the
first five years of this decade, Brazilian oil output grew by over 25%, Canadian
production surged by over 40% and US liquids output rose by close to 90%, and the
total liquids emanating from these sources, including natural gas liquids, climbed to
close to 20-mb/d of the world’s ~95 mb/d of liquids output.
Given the abundance of the resource base now available and the dramatic cost
deflation that is unfolding in unconventional plays, assumptions of peaking oil
supply at higher prices are being replaced with assumptions of long-term supply
abundance at lower prices. Surprising to many analysts, unconventional oil is
increasingly cost competitive with traditional lower cost supplies, including from the
Middle East. While the 30% or so cost deflation in shale oil (and gas) plays over the
past year is starting to tail off, cost deflation has a long way to go still not only in the
shales but also in both deep water and oil sands.
1 Source: IEA. Note that other gasses and variables in addition to CO2 are important in
climate modeling. See http://www.ipcc.ch/. CO2 however is one of the most important
gasses and factors determining the rates of climate warming.
Figure 1. Shares of Global GHG Emissions
by Sector
Source: IEA, Citi Research
Figure 2. Share of Global CO2 Emissions by
Fuel
Source: IEA, Citi Research
Assumptions on oil are now of long-term
supply abundance at lower prices vs.
peaking oil supply at higher prices
Energy, 69%Industry,
6%
Agriculture, 11%
Others, 14%
Oil, 35%
Coal, 44%
Gas, 20%
Other, 1%

Citi GPS: Global Perspectives & Solutions December 2015
© 2015 Citigroup
10
Cost deflation is pointing to global oil potentially stabilizing in a band between ~$55-
$75/bbl. What’s more, the new supply, especially from shales, appears to be
significantly elastic in its response to prices, yet another new condition, which is the
opposite of the traditional view that supply is inelastic to price changes in the short
term. As a result there is increased confidence that when oil prices recover, supply
from shales will recover rapidly as well and the US will remain capable of seeing
shale production grow by upwards of 1-m b/d annually for a while, just as it had in
the period 2010-2014 before prices collapsed. Further expansion of shale resource
development to other countries seems inevitable, including to Canada and Russia
where shale resources are abundant and fracking techniques are in their infancy of
use, as well as to China, Mexico, Australia, and North Africa among other places. As
these resources are developed and shale production rises as a share of global
output a bigger base of production should assure continued limitations on how high
prices could reach before being checked by new production.
Coupled to these new supply sources are changes on the demand side that are
resulting in an increase in energy efficiency in emerging markets and a stunning
reduction in the rate of growth of oil product demand in relation to GDP growth.
Global oil demand looks set to be capped at around the 1% per annum level or
lower, even if global GDP returns to 4%+ levels in the years ahead. The more
widespread adoption of climate change policies to limit the role of oil in the economy
and to substitute natural gas for oil in the transportation fuel mix should drive
demand growth even lower, probably to levels well under 1% per annum, making it
increasingly likely that additions to supply from increasingly competitive
unconventional fuels could be ample to meet rising world demand.
As a result of new supply pressures Saudi Arabia in late 2014 forced other OPEC
countries to change OPEC’s underlying policy, abandoning the role of global central
banker to oil markets (adding or reducing liquidity as needed to keep prices at
higher than market clearing levels would otherwise have been and instead to gain
and protect market share). This new policy looks to be fairly permanent, even if it
undergoes moderate change, designed to maximize revenue. It reflects a clear
understanding that if prices are too high, unconventional oil supplies, particularly
from shales, can come roaring back fairly quickly, and this too suggests that oil
prices will be capped going forward well under $90 a barrel and most probably
under $80.
In effect there has been a change in attitude toward the value of oil on a net present
value basis, pointing to a new view that oil in the ground is worth less than oil taken
out of the ground and produced, another profound change from the traditional way
of thinking about oil as an exhausting resource whose value would increase over
time.
The dynamics of politics within OPEC have also changed and point to lower prices
and more competitive markets. It used to be the case that more often than not
OPEC countries could set aside their competitive situation and join together in
common action to lift prices by reducing output. New market conditions make that
very difficult to accomplish without subsidizing new unconventional production.
Combine that with a less rapidly growing market and competition among the large
producers for limited market share has made producer interactions with one another
a zero-sum situation where any one party’s gain is a loss for someone else with the
fear of losing market share in the short run from any production cutback risking
losing that market share on a more permanent basis.
Cost deflation is pointing to stabilization of
the global oil price plus elasticity in shale
supply in response to prices
Demand is changing with increased energy
efficiency in emerging markets and slower
demand growth in oil product vs. growth in
GDP
There is effectively a change in attitude on
the value of oil
Politics within OPEC point to lower prices
and more competitive markets

December 2015 Citi GPS: Global Perspectives & Solutions
© 2015 Citigroup
11
Natural gas supplies as well are seeing similar forces at work. Not only have natural
gas discoveries outpaced those in oil, but increasingly cheaper supplies from
unconventional places, including shales and deep water, are driving international
prices down. The traditional linkage of internationally-traded natural gas to oil prices
might have made sense when invented by Japan’s government to induce gas
suppliers to produce liquefied natural gas. But in a world of abundant supplies with
more and more gas available on a spot basis, gas prices also need to come down.
(See section (2) below). As in oil, increasingly over time it appears that there will be
growing incentives for large international suppliers like Russia and Qatar to take the
lead given by Norway and to search for the best ways to maximize the volume of
exports to preserve and not relinquish market share.
So whether looking at petroleum, or natural gas, or incredibly abundant coal
resources, the future of primary fuels globally appears to be increasingly
challenging for renewable fuels – especially given their interruptible nature and the
lack of a breakthrough as of yet in battery storage technology.
(2) Gas: Shale Revolution Pressuring Global Prices
The explosive growth of cheap natural gas supply has led us to “the Golden Age of
Gas”.2 But rapid growth of shale gas production and major discoveries globally have
depressed prices (see LNG Landscape; Finding a Home for US LNG). Yet despite
the vast supply and falling prices, gas is fighting against coal and renewables for
market shares in the power sector globally. We examine developments in US gas
and global LNG in this section.
(2.1) US Natural Gas
The combination of a massive reserve base and relentless technological progress
promises to keep gas prices low. Although “fracking” began in natural gas,
enhanced techniques developed in recent years for oil production are now being
reapplied to natural gas production, boosting output. With a low cost base, North
America should be able to expand its gas exports, with export growth possible if and
when the global market demands it. More modest domestic consumption growth,
efficiency gains in gas production and low services costs are all keeping a lid on
prices not just now, but for a good half decade or longer ahead.
2 We refer to a well-known proclamation from the International Energy Agency.
Dynamics in natural gas are also changing
with cheaper supplies driving international
prices down
The future of primary fuels appears to be
increasingly challenging for renewable fuels
Despite vast supply and falling prices, gas is
fighting against coal and renewables for
market share in the global power sector
With massive reserves, North America
should be able to expand its gas exports

Citi GPS: Global Perspectives & Solutions December 2015
© 2015 Citigroup
12
Figure 3. Future US Gas Production Growth Driven by a few Key
Shale Plays…
Figure 4. Map of Future Global Gas Flow
Source: EIA, state data, Woodmac, Citi Research Source: EIA, IEA, Citi Research
(2.2) LNG: Global Supply on the Rise, Price Competition More Fierce
Australia and the US are ramping up exports in a world that is already oversupplied
with gas. Despite the global oversupply, firms and countries continue to discover
sizeable new fields and are developing existing ones. (See “Global Gas: Watch out
US shale, here come Iran and Egypt” (Sept 2015) and “Next Move in the US-Russia
Energy Duel” (Jun 2014) for details) Indeed, the world looks poised to remain
awash in gas for some time and for lower pricing to persist.
Figure 5. Global Gas and LNG Prices
Figure 6. US Gas Exports to Add to the Global LNG Oversupply to 2020
Source: Platts, Citi Research Source: Woodmac, company reports, Citi Research
The breakdown of traditional LNG pricing, linking natural gas prices to oil prices,
puts further downward pressure on global gas prices. US LNG as the marginal
supply globally looks increasingly likely to set gas prices in markets worldwide. This
is because US gas supplies are by law not restricted by destination and because
the initial lifters of US LNG are “mid-stream” agents likely to sell spot to the highest
bidder and highest priced market. The conventional way of pricing and
-
10.0
20.0
30.0
40.0
50.0
60.0
70.0
80.0
90.0
2011
2012
2013
2014
2015
2016
2017
2018
2019
2020
Bc
f/d
Bakken
Utica
Marcellus
Fayetteville
Woodford
Anadarko
Eagle Ford
Haynesville
Barnett
Production ex-key basins
Key pipelines routes
From US, Canada
To Asia
Yamal
Key existing LNG routes
Pipe to China
Possible new LNG routes
East Africa
-
2
4
6
8
10
12
14
16
18
20
Oct-
09
Jan-1
0
Apr-
10
Jul-10
Oct-
10
Jan-1
1
Apr-
11
Jul-11
Oct-
11
Jan-1
2
Apr-
12
Jul-12
Oct-
12
Jan-1
3
Apr-
13
Jul-13
Oct-
13
Jan-1
4
Apr-
14
Jul-14
Oct-
14
Jan-1
5
Apr-
15
Jul-15
Oct-
15
$/M
MB
tu
JKM (Spot LNG) NBP (UK Gas) HH (US Gas) Oil Indexed
0
10
20
30
40
50
60
2000
2002
2004
2006
2008
2010
2012
2014
2016
2018
2020
2022
2024
Bil
lio
n c
ub
ic f
eet/
day
West Africa
South America
South & EastAfrica
North America
North Africa
Middle East
Europe
Asia Pacific
Further downward pressure on global gas
prices comes from a breakdown of
traditional LNG pricing

December 2015 Citi GPS: Global Perspectives & Solutions
© 2015 Citigroup
13
understanding the market involving oil-indexed, destination- and volume-restricted
gas supplies is increasingly giving way to gas-indexed, flexible supplies. More
flexible contracts from the US allow for market-based pricing while greater
competition also helps to liberalize global LNG markets thereby driving down prices.
On the demand side, more modest growth in key regions, such as Japan, China
and Europe, should keep prices low amid oversupply, at least for a couple of years.
Japan could cut LNG demand by 1 to 2-Bcf/d as nuclear reactors resume
operation.3 China was supposed to be the growth engine for gas and LNG but
demand growth has slowed substantially on weak macro conditions and
unfavorable pricing inside the country. Perhaps by the end of this decade Chinese
policy changes could make a big difference on demand, but in the meantime the
demand outlook looks weak in China as well as in India. Reversing the long-term
decline in European gas demand looks challenging with sluggish macro growth and
improving energy efficiency. Although the Middle East, Southeast Asia and South
America should have strong growth rates, their markets are too small to be
comparable to Japan, China, India and Europe.
Nonetheless, outside of the shale bubble in North America and the LNG surge in
Australia, the pressure on gas prices may still not be enough to make gas
sufficiently competitive vs. coal. With rapidly falling costs of renewables, gas may
even become a loser within North America particularly if policy remains supportive
of renewables going forward.
Although gas demand growth for power generation, as a bridge from coal to
renewables, could be lower than many had expected, the supposed dominance of
renewables in the years to come, as capital costs have rapidly fallen, may have to
wait as gas and coal prices have also dropped. Renewables could regain their
recent competitive momentum with lower financing costs.
(3) Dirty but Cheap: Dethroning King Coal Is Difficult without Policy Help in Many Regions
Global coal markets are awash in excess capacity, reflected also in depressed
prices in a hangover from the heavy investment of the commodity super cycle years
in the first decade of this century. Nearly all major markets – the US, China and the
global seaborne market – are oversupplied. In a world were coal demand growth is
increasingly challenged by cheaper renewable energy and gas, the oversupply will
take longer than most people anticipate to work off.
3 Nuclear restarts, crucial to the government’s newly released long-term energy plan
post-Fukushima, is one of several seismic shifts underway with substantial long-term
impacts on global LNG. Other developments include: (1) phased liberalization of Japan’s
energy markets in 2016, 2017 and after; (2) joint procurement of LNG; and (3) expiration
of long-term LNG contracts in large volume.
Modest demand growth in key regions such
as Japan, China and Europe should keep
prices low amid oversupply
The pressure on gas prices may still not be
enough to make gas sufficiently competitive
vs. coal
Lower gas and coal prices can delay the
dominance of renewables in the years to
come
Nearly all major coal markets are
oversupplied

Citi GPS: Global Perspectives & Solutions December 2015
© 2015 Citigroup
14
Figure 7. A Dramatic Run-Up in Coal Prices in the Early 2000s Sparked
Huge Amounts of New Investment; the Market Remains in a “Hangover”
of Overcapacity
Figure 8. Futures Curves for International Coal Prices Suggest
Additional Downside and Little Optimism for Recovery
Source: Bloomberg, Citi Research Source: Bloomberg, Citi Research
In the US the war on coal has been won so far by cheap natural gas. Power
markets sourcing expensive coal from underground mining in the East are sitting on
top of two of the world’s lowest cost gas plays: the Marcellus and Utica shales.
Figure 9. Coal’s Once Dominant Share of US Electricity Is Being Challenged by Natural Gas, Which Has Recently Taken the Lead Position
Source: EIA, Citi Research
As gas prices have continued their march lower in the midst of staggering
productivity gains in hydraulic fracturing, gas’ inroads into coal’s once safe territory
have gone farther. Additionally, new environmental regulations, such as the Clean
Power Plan that more strictly regulates coal pollution, have added liability to building
new coal plants and forced more coal-fired power plants to retire.
0
50
100
150
200
Sep-0
7D
ec-0
7M
ar-
08
Jun-0
8S
ep-0
8D
ec-0
8M
ar-
09
Jun-0
9S
ep-0
9D
ec-0
9M
ar-
10
Jun-1
0S
ep-1
0D
ec-1
0M
ar-
11
Jun-1
1S
ep-1
1D
ec-1
1M
ar-
12
Jun-1
2S
ep-1
2D
ec-1
2M
ar-
13
Jun-1
3S
ep-1
3D
ec-1
3M
ar-
14
Jun-1
4S
ep-1
4D
ec-1
4M
ar-
15
Jun-1
5S
ep-1
5
$/t
on
Newcastle Coal (AU)
European Coal
Powder River Basin(W. US)
CSX (E. US)
42
44
46
48
50
52
54
Oct-
15
Jan-1
6
Apr-
16
Jul-16
Oct-
16
Jan-1
7
Apr-
17
Jul-17
Oct-
17
Jan-1
8
Apr-
18
Jul-18
Oct-
18
Jan-1
9
Apr-
19
Jul-19
Oct-
19
Jan-2
0
Apr-
20
Jul-20
Oct-
20
$/t
on
Newcastle (AU) API2 (Europe)
0%
10%
20%
30%
40%
50%
60%
Ja
n-0
0
Ju
n-0
0
Nov-0
0
Apr-
01
Sep
-01
Feb-0
2
Ju
l-0
2
Dec-0
2
Ma
y-0
3
Oct-
03
Ma
r-04
Aug
-04
Ja
n-0
5
Jun-0
5
Nov-0
5
Apr-
06
Sep
-06
Feb-0
7
Ju
l-0
7
Dec-0
7
Ma
y-0
8
Oct-
08
Ma
r-09
Aug
-09
Ja
n-1
0
Ju
n-1
0
Nov-1
0
Apr-
11
Sep
-11
Feb-1
2
Ju
l-1
2
Dec-1
2
Ma
y-1
3
Oct-
13
Mar-
14
Aug
-14
Ja
n-1
5
Ju
n-1
5
Coal Natural Gas
Nuclear Solar
Wind All Others
The war on coal has been won by cheap
natural gas in the US

December 2015 Citi GPS: Global Perspectives & Solutions
© 2015 Citigroup
15
In the rest of the world, however, the story is very different. In nearly every economy
except the US, coal remains a much cheaper source of power generation.4 Even in
Europe, with a €9/ton carbon burden, burning coal is still far more profitable than
burning gas, due in large part to the high costs of imported gas (see above chart). In
addition to oversupply, mining costs have compressed by 30% in the last three
years, even with lower prices, cushioning producers.
The prospects for significant increases in coal pricing that might hinder the
competitiveness of renewables or gas appear limited, and hinge crucially on India
and China. In the US, cheap natural gas should keep a tight lid on coal prices,
limiting prospects for significant uplift.
Growth of coal demand in emerging Asian economies may not be as robust as
many have predicted. Peak Chinese coal demand for power generation may
happen soon – and might have happened already. Citi first called for Chinese coal
demand to peak in the early 2020s in 2013 (see The Unimaginable: Peak Coal in
China). Since then, the trends driving this outcome have only become more
pronounced – renewable energy growth has been aggressive, energy efficiency
gains have accelerated and GDP has slowed faster than anticipated.
Figure 10 through Figure 12 below show potential pathways for Chinese coal
demand under Citi’s models.5 As coal demand slows and domestic mining capacity
remains healthy, reliance on imports should wane, reducing a key source of
demand in global markets (see Commodities Quarterly). Though India offers a
bright spot for coal demand, this may not necessarily be supportive of global
markets, as domestic coal supplies have finally surged (see Survival of the Fittest).
Figure 10. China Coal Use Could Peak Soon
Even Under a “Stable Econ Growth” Scenario
Figure 11. China Coal Use Looks Set to Decline
Under a “Transition” Economic Scenario
Figure 12. A Sharper Slowdown in China Could
Push Coal Use Down Quickly and for Good
Source: CEC, IEA, Citi Research Source: CEC, IEA, Citi Research Source: CEC, IEA, Citi Research
4 For a detailed discussion of coal markets, see Morse, Richard and Thurber, Mark. “The
Global Coal Market: Supplying the Major Fuel for Emerging Economies”. Cambridge.
2015. 5 These models capture coal use in the power sector and do not include industry and
residential use.
-
1,000
2,000
3,000
4,000
5,000
6,000
7,000
8,000
9,000
10,000
201
0
201
2
201
4
201
6
201
8
202
0
202
2
202
4
202
6
202
8
203
0
Ge
nera
tio
n (
TW
h)
Other
Solar
Wind
Hydro
Nuclear
Gas
Oil
Coal
TotalGeneration
-
1,000
2,000
3,000
4,000
5,000
6,000
7,000
8,000
9,000
2010
201
2
201
4
201
6
2018
202
0
202
2
202
4
2026
202
8
203
0
Ge
nera
tio
n (
TW
h)
Other
Solar
Wind
Hydro
Nuclear
Gas
Oil
Coal
TotalGeneration
-
1,000
2,000
3,000
4,000
5,000
6,000
7,000
8,000
201
0
201
2
201
4
201
6
201
8
202
0
202
2
202
4
202
6
202
8
203
0
Ge
ne
rati
on
(T
Wh
)
Other
Solar
Wind
Hydro
Nuclear
Gas
Oil
Coal
TotalGeneration
Outside the US, coal remains a much
cheaper source of power generation
Growth in coal demand in emerging Asia
may not be as robust as earlier predicted

Citi GPS: Global Perspectives & Solutions December 2015
© 2015 Citigroup
16
The recent announcement by the OECD on cutting public financing of coal power
plants6 would have some, but we believe limited, impact on coal demand growth.
The OECD agreement does not cover ultra-supercritical coal plants — the most
efficient kind of coal plants — or coal plants in very poor countries. In addition, the
World Bank, the US Export-Import Bank and the European Investment Bank had
already cut support prior to this announcement, so there has already been some
impact. Some coal plants may opt to finance from other banks. Interestingly, in
China, although more coal power plants are being built, coal demand might have
peaked in 2013 already. Thus, coal plant capacity growth does not necessarily
equal coal demand growth.
With low coal prices, renewables may not be dethroning king coal just yet. We
discuss later in the report why coal may be surprisingly resilient in a world with more
renewable energy. Lower financing costs could give renewables the boost needed.
6 http://www.oecd.org/newsroom/statment-from-participants-to-the-arrangement-on-
officially-supported-export-credits.htm
Recent OECD announcements likely to have
limited impact on coal demand growth
Renewables may not be dethroning coal just
yet

December 2015 Citi GPS: Global Perspectives & Solutions
© 2015 Citigroup
17
Energy 2030: Consultant Analysis
(4) IRENA: Renewable Energy Cost Trends and Drivers
The benefits of renewable energy are many and clear, but so in the past have been
the barriers to their uptake. Market structures that hindered or even prohibited
deployment, a lack of understanding of emerging renewable technologies, difficulty
in accessing finance, high financing costs, inadequate regulatory frameworks, lack
of remuneration for offsetting fossil fuel externalities (e.g. carbon and local air
pollutant emissions), small markets, policy uncertainty and high costs have all
played a role in hindering the deployment of renewables. Fortunately, with diligent
work by industry, governments, financing institutions and regulators, many of these
barriers are falling away.
One of the barriers to increased renewable power generation deployment was their
high costs. However, the past decade has seen a dramatic, and sustained,
improvement in the competitiveness of renewable power generation technologies.
Around the world, renewables – if not already more competitive than was widely
recognized – have benefited from a virtuous cycle of increased deployment leading
to technology improvements and falling costs. Renewable power generation
technologies have accounted for more than half of all new power generation
capacity additions in every year since 2011, with a record high of more than 130
gigawatts (GW) added in 2014. This year looks set to be another record, with
expectations of solar photovoltaic (PV) deployment of 55 GW and 56 to 58 GW for
wind power.
The Road to Competitiveness
Despite the fact that the economics of renewable power generation technologies
are critical to understanding their potential role in the energy sector and how quickly,
and what cost they can be deployed, most governments have not systematically
collected the necessary cost data. The result is that too often misconceptions about
costs or out-of-date data has undermined policy effectiveness. This has led, in
some cases, to inefficient policy settings as the very rapid cost declines for solar PV,
and to a lesser extent wind power, meant that decisions based on data even one or
two years old can significantly overestimated the costs of renewables. To fill this
gap, and ensure that robust policy can be made on accurate, timely data, IRENA
has developed a database of around 15,000 utility-scale renewable power
generation projects and close to three-quarters of a million small-scale solar PV
systems.7 The trends emerging from this data show not only the success of
deployment policies to drive down costs but that the cost-competitiveness of
renewable power generation has reached historic levels. Biomass for power,
hydropower, geothermal and onshore wind can all now provide electricity
competitively compared to fossil fuel-fired power generation where good resources
and cost structures exist (see figure below).
7 The majority of the utility-scale project data in the IRENA Renewable Costing Database
are in non-OECD countries. This is driven by the fact that many of these projects benefit
from development support or lending from development banks or multi-lateral lending
agencies and high level data is in the public domain. More commercial markets, such as
those predominate in the OECD, are characterized by much more stringent
confidentiality issues and data is therefore more difficult to obtain. In all cases, the
project-level data by country and technology is compared to or supplemented by
averages from trusted secondary sources.
Michael Taylor
Renewable Costing Analyst, International
Renewable Energy Agency (IRENA)
Historically, renewable power generation
deployment was hindered by high costs,
however competitiveness has improved
Better data has helped increase policy
effectiveness

Citi GPS: Global Perspectives & Solutions December 2015
© 2015 Citigroup
18
Figure 13. Levelized Cost of Electricity from Utility-Scale Renewable Power Generation Projects
Compared to Fossil-Fuel Fired Electricity, 2010 and 2014
Note: The size of the diameter of the circle represents the size of the project. The center of each circle is the value for the cost of each project on the Y axis. Real weighted average cost of capital is 7.5% in OECD countries and China; 10% in the rest of the world. Source: IRENA
Between 2010 and 2014 the global weighted average levelized cost of electricity
(LCOE) of utility-scale solar PV fell by half. The most competitive utility-scale solar
PV projects are now regularly delivering electricity for just $0.08 per kilowatt-hour
(kWh) without financial support, compared to a range of $0.045 to $0.14/kWh for
fossil fuel power. But even lower costs are being contracted for 2017 and beyond.
The recent tender in Dubai of $0.06/kWh ably demonstrates this shift, even in a
region with abundant fossil fuels. Other tenders in Jordan, Chile, Brazil and South
Africa have all highlighted that solar PV can be competitive.
Onshore wind is now one of the most competitive sources of electricity available.
Technology improvements, occurring at the same time as installed costs have
continued to decline, mean that the cost of onshore wind is now within the same
cost range, or even lower, than for fossil fuels. Wind projects around the world are
consistently delivering electricity for $0.05 to $0.09/kWh without financial support,
with the best projects costing $0.04/kWh.
The electricity from concentrating solar power (CSP) and offshore wind still typically
costs more than fossil fuel-fired power generation options today, with the exception
of offshore wind in tidal flats. But these technologies are in their infancy in terms of
deployment.8 Both represent important renewable power sources that will play an
increasing role in the future energy mix as their costs will continue to come down.
Costs for the more mature renewable power generation technologies – biomass for
power, geothermal and hydropower – have been broadly stable since 2010.
However, where untapped economic resources remain, these mature technologies
can provide some of the cheapest electricity of any source.
8 The cumulative deployment of CSP reached 4.3 GW at the end of 2014, while that of
offshore wind reach 8.8 GW (IRENA, 2015).
In the past 4 years, the global weighted
LCOE of utility-scale solar PV has been cut
in half
Onshore wind is now one of the most
competitive electricity sources
CSP and onshore wind still typically cost
more than fossil fuel generation, but are in
their infancy in terms of deployment
More mature renewable tech (biomass,
geothermal, hydropower) has been stable

December 2015 Citi GPS: Global Perspectives & Solutions
© 2015 Citigroup
19
Solar PV and Wind Power: The Rapidly Maturing Newcomers
It is remarkable to think that in the year 2000, just 800 MW of solar PV capacity was
installed worldwide and 17 GW of wind power. Both of these “new” renewable
power generation technologies are now mature, commercially proven technologies
which are increasingly competing directly with the alternatives on economic grounds
alone, without taking into account the value from their reducing local and global
pollutant emissions. In both cases, the technology improvements and cost
reductions have been significant.
Solar PV Costs
For solar PV, growing economies of scale, efficiency improvements and reductions
in material inputs and prices have driven down costs dramatically. Solar PV module
prices in October 2015 were 78% to 81% lower than their levels in October 2009
(See Figure 14), and the estimated learning rate for solar PV modules was between
18% and 22%. At the same time, the balance of system costs has also been driven
lower. The end result is that solar PV installed costs have also fallen rapidly.
Figure 14. Solar PV Module Prices in Europe, 2009 and 2015
Source: IRENA
Between 2011 and 2014, the most competitive utility-scale projects have
continuously reduced costs – from lows of around $3,200/kW for small-scale
projects and $2,200/kW for large-scale projects in 2011, to lows of around $1,300
for both size groups in 2014. This is a decline of 65% for smaller utility-scale
projects (1-5 MW) and 41% for larger (>5 MW) projects in just three years. Cost
reductions mean that the LCOEs of the latest utility-scale projects in 2014 are
increasingly competitive. Figure 15 below presents the LCOE ranges and capacity-
weighted averages for utility-scale PV projects between 2010 and 2014. The range
of the LCOE has declined from between $0.18 and $0.61/kWh in 2010 to between
0.00
0.50
1.00
1.50
2.00
2.50
3.00
3.50
4.00
May-0
9
Au
g-0
9
No
v-0
9
Feb
-10
May-1
0
Au
g-1
0
No
v-1
0
Feb
-11
May-1
1
Au
g-1
1
No
v-1
1
Feb
-12
May-1
2
Au
g-1
2
No
v-1
2
Feb
-13
May-1
3
Au
g-1
3
No
v-1
3
Feb
-14
May-1
4
Au
g-1
4
No
v-1
4
Feb
-15
May-1
5
Au
g-1
5
$/W
p [
2015 U
SD
]
Crystalline Europe(Germany)
Crystalline China
Crystalline Japan
Thin film CdS/CdTe
Thin film a-Si
Thin film a-Si/u-Si orGlobal Price Index(Q4 2013 onwards)
Technology improvements and cost
reductions in solar PV and wind have been
significant
Most competitive utility-scale solar PV
projects have continuously reduced costs

Citi GPS: Global Perspectives & Solutions December 2015
© 2015 Citigroup
20
$0.08 and $0.50/kWh in 2014.9 The ranges remain wide, but there has been a rapid
reduction in the global weighted average LCOE of utility-scale solar and projects
being contracted for today for delivery two years hence have LCOEs as low as
$0.058/kWh in the case of the Dubai Electricity and Water Authority’s recent
contract with ACWA Power. This may be today’s most competitive project, but by
2017 it will be the new norm for solar PV in sunny regions with access to low cost
finance.
Figure 15. The Levelized Cost of Electricity from Utility-Scale Solar PV Projects, 2010 and 2014
Source: IRENA
Rooftop solar PV costs have fallen rapidly in line with solar PV module price
reductions, but also as a result of reductions in balance of system costs (See Figure
16). Germany and China have, on average, the most competitive small-scale
residential rooftop systems in the world. Germany’s residential system costs have
fallen from just over $7,200/kW in the first quarter of 2008 to $2,200/kW in the first
quarter of 2014. They have continued to fall, albeit at a slower rate in 2015, and
have averaged just $1,550/kW in 2Q 2015 (EUPD data). Rooftop solar PV is
typically more expensive than a utility-scale project in a country, but this is not
necessarily true between countries, as there is a very wide cost variation between
countries. For instance, despite the gap narrowing residential-scale projects in
Germany were still estimated to have lower average installed costs than utility-scale
projects in the United States in 2014.
9 The upper end of this range represents utility-scale projects in remote locations that are
typically offsetting expensive diesel-fired generation.
Rooftop solar PV costs have fallen rapidly,
in line with solar PV module price reductions

December 2015 Citi GPS: Global Perspectives & Solutions
© 2015 Citigroup
21
Figure 16. The Levelized Cost of Electricity from Utility-Scale Solar PV Projects, 2010 and 2014
Note: Annual data for Australia, China and Italy; quarterly data for the remaining countries. Source: IRENA
Wind power costs
Wind power is a more mature than solar PV, with around 393 GW installed at the
end of June 201510
, yet wind turbine costs are continuing to edge lower at the same
time as technology improvements (e.g. taller turbines, with larger swept areas) are
increasing capacity factors for a given resource compared to older wind turbine
models. The combined result is that onshore wind in particular is now very
competitive where good cost structures and/or wind resources exist.
Figure 17. Wind Turbine Price Evolution by Market, 1997 to 2015
Source: IRENA
10
According to World Wind Energy Association (WWEA).
Technology improvements and increasing
capacity factors have increased the
competitiveness of onshore wind
Citi GPS: Global Perspectives & Solutions December 2015
© 2015 Citigroup
22
The wind turbine is the largest single cost item of the total installed cost of a wind
farm. Wind turbine prices have fluctuated with economic cycles and with the price of
commodities such as copper and steel, which can make up a sizeable part of the
final cost of a wind turbine. The average turbine price in the United States for
projects larger than 100 MW was $755/kW for projects delivered between 2000 and
2002 (Wiser and Bollinger, 2014). In 2009, the cost of wind turbines peaked in the
United States at $1,728/kW and in Europe at around $1,890/kW. Since the peak of
2009 wind turbine prices have fallen by around 30% (See Figure 17).
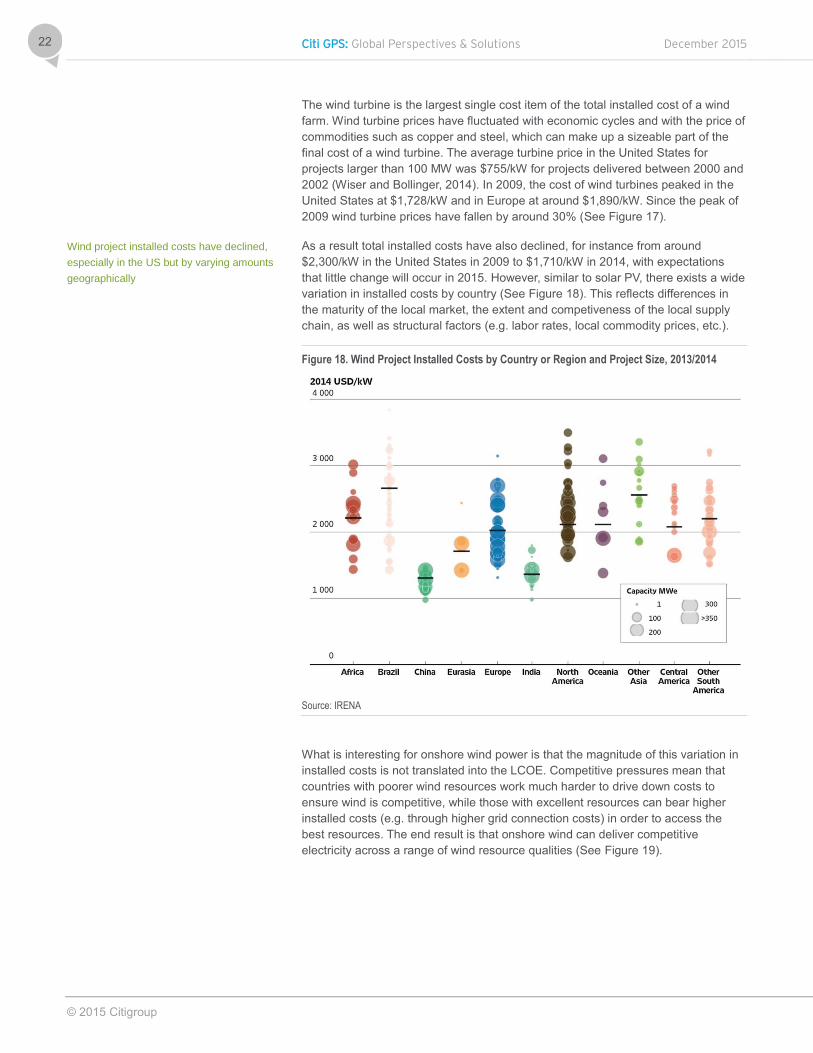
As a result total installed costs have also declined, for instance from around
$2,300/kW in the United States in 2009 to $1,710/kW in 2014, with expectations
that little change will occur in 2015. However, similar to solar PV, there exists a wide
variation in installed costs by country (See Figure 18). This reflects differences in
the maturity of the local market, the extent and competiveness of the local supply
chain, as well as structural factors (e.g. labor rates, local commodity prices, etc.).
Figure 18. Wind Project Installed Costs by Country or Region and Project Size, 2013/2014
Source: IRENA
What is interesting for onshore wind power is that the magnitude of this variation in
installed costs is not translated into the LCOE. Competitive pressures mean that
countries with poorer wind resources work much harder to drive down costs to
ensure wind is competitive, while those with excellent resources can bear higher
installed costs (e.g. through higher grid connection costs) in order to access the
best resources. The end result is that onshore wind can deliver competitive
electricity across a range of wind resource qualities (See Figure 19).
Wind project installed costs have declined,
especially in the US but by varying amounts
geographically

December 2015 Citi GPS: Global Perspectives & Solutions
© 2015 Citigroup
23
Figure 19. Wind Project LCOE Compared to Capacity Factor by Country/Region and Project
Size
Source: IRENA

Citi GPS: Global Perspectives & Solutions December 2015
© 2015 Citigroup
24
Energy 2030: Commodities Analysis
(5) A Global Power Struggle: The Face-off between Renewables, Coal and Gas
Fossil fuel prices could stay lower for longer, but renewable energy costs have also
gotten more competitive over time: which will win out? Understanding the true
competitiveness of fossil fuels vs. renewables is crucial to seeing where regional
and global energy balances could be heading. Though policy support will be
another key driver of renewable adoption, in a world where many governments have
limited fiscal capacity to subsidize costly renewable projects, competitive dynamics
will play an increasingly important role. Here, reducing financing costs may be the
next frontier.
Competitive dynamics among fossil fuel technologies will also be critical to reaching
emission targets. Conventional wisdom dictates that natural gas, a cleaner-burning
fossil fuel, could enter its golden age, and coal, the dirtier fuel, should lose market
share. However, conventional wisdom could be wrong: alternative outcomes could
see coal less of a loser and gas less of a winner, with dramatic impacts on carbon
emissions.
In the following section, we discuss the face-off between fossil fuels and renewables
and the role financing costs could play in shaping its outcome.
In a Low Fuel Price Environment, Financing Costs Could Be the
Differentiator between Fossil and Renewables
In the power sector, the momentum behind renewable energy is strong and building:
since 2011, renewable energy has accounted for more than half of all new capacity
additions globally. Citi expects that share to increase going forward. But the new
reality of cheaper fossil fuels alters competitive dynamics in important ways that can
shape investment in the coming decade. Financing costs need to play an
increasingly important role in determining how the battle between fossil fuels and
renewable alternatives plays out.
As the technological revolution in renewable energy has progressed capital costs
for renewables have seen dramatic declines while efficiencies have improved;
certain technologies such as onshore wind have become economic in some regions
even absent any policy support. But this very maturation of renewable technology
inevitably leads to a slower pace of capital cost reduction as efficiency gains and
cost declines approach technical asymptotes. As technologies mature, the cost
declines associated with additional capacity growth diminish, a phenomenon
typically captured in models by a logarithmic relationship between installed capacity
and costs. Wind and solar are increasingly becoming mature technologies with
many agencies expecting slower cost declines going forward.
Anthony Yuen
Ed Morse
Seth Kleinman
Adriana Knatchbull-Hugessen
Commodities Research Team
Competitive dynamics among fossil fuel will
be critical to reaching emission targets
Renewable energy has accounted for more
than 50% of all new power sector capacity
additions globally since 2011
Capital costs for renewables have seen
dramatic declines helped by the
technological revolution

December 2015 Citi GPS: Global Perspectives & Solutions
© 2015 Citigroup
25
Figure 20. IEA Historical and Forecasted Solar PV Investment Costs Show Diminishing Rates of Cost Reduction
Source: IEA Medium-Term Renewable Energy Outlook
But in a world awash in cheap fossil fuels, further cost declines in renewables will
be necessary to incentivize deployment, creating a need to pursue other avenues of
cost reduction to reach sustainable energy goals. Reducing financing costs is the
next phase in improving the competitiveness of renewable energy. For capital
intensive renewable projects, financing costs can make up nearly half of the total
cost of a project. This is particularly true in developing nations, where the cost of
capital can be much higher and access to capital markets much more restricted.
This is also where the majority of new generating capacity is being deployed,
making reducing financing costs for renewable energy projects pertinent in the
global effort to combat climate change.
In this report we analyze the economic competiveness of coal, gas, wind and solar
power generation to 2030 in key global markets, considering:
Detailed Citi forecasts for lower oil, gas and coal prices globally.
Comprehensive global data from IRENA on actual installed costs for renewable
energy in important regions of the world and the latest data on installed costs
from the IEA for coal and gas plants in various countries.11
The latest technological learning assumptions from the US National Renewable
Energy Laboratory based on the DOE’s Wind and Solar Vision reports for
renewables and the Annual Energy Outlook for coal and gas.12
11
Two general approaches to analyzing renewable energy costs are often used:
observed costs and modeled costs. Because regional differences in equipment costs,
labor, permitting and other local factors and be critically important, using actual,
observed comprehensive statistics for a large sample of global projects that have
actually been installed yields more relevant results than a modeled approach. Hence we
rely on an empirical rather than hypothetical cost approach. 12
Bolinger, Mark and Joachim Seel. “Utility-scale solar 2014: an empirical analysis of
project cost, performance and pricing trends in the United States” Lawrence Berkley
National Laboratory. 2015; and Wiser, Ryan and Mark Bolinger. “2014 Wind
Technologies Market Report” Lawrence Berkley National Laboratory. 2015.
Further cost declines in renewables will be
necessary for them to remain competitive
with cheap fossil fuels and incentivize
deployment
Analyzing fossil fuel and renewable
competitiveness out to 2030— laying out our
assumptions

Citi GPS: Global Perspectives & Solutions December 2015
© 2015 Citigroup
26
Financial modeling of power plant economics based on Citi’s adaptation and
enhancement of US Department of Energy’s power plant models.13
Citi’s analysis of global capital market conditions, renewable energy finance and
capital costs.
Our analysis assumes a 10% investment tax (ITC) credit for solar in the US, but
no other government subsidies or tax credits.
We assume the US long-term gas price to average $3.50/MMBtu in 2015 dollars,
with a soft ceiling in the low-$4 range and soft floor around $3. Production growth
continues even in places where prices have fallen to the $1/MMBtu range.14
See
“The New American (Gas) Century II: Disruptive and Durable” for further discussion
of long-term US natural gas pricing. We also assume the use of ultra-supercritical
technology for coal (in all locations except the US) in our competitive generation
economic analysis between coal, gas and renewables. Hence, cuts in public
financing, as announced by the OECD, have no impact on our analysis.
Over the next half-decade when new US LNG terminals come online, we assume
that the price of US natural gas delivered could fall to around $4.50 to $5.50 for
Europe and $6 to $7 for East Asia, compared with over $20/MMBtu in Asia just two
years ago.15
,16
Costs in the power sector can vary significantly across countries and even within
countries. We attempt to capture some of this variation by considering five
representative regions: the United States, OECD Asia, Developing Asia, Europe and
Latin America. Each region is differentiated by capital costs and technological
efficiency, based on data from IRENA, the International Energy Agency (IEA), and
the US Energy Information Administration (EIA). Financing costs are differentiated
by region according to three main categories: developed world, low-cost financing
developing world and high-cost financing developing world. In the developing world
(United States, OECD Asia, and Europe), we use a 9% nominal (7% real) weighted
average cost of capital (WACC), while in the high-cost financing developing world
(Latin America) we use a 17% nominal (10% real) WACC. In developing Asia, some
financial institutions are flushed with money thereby driving the cost of capital,
below even the prevailing rates in the developed world. In this region, we use a 7%
nominal (5% real) WACC. These assumptions were based on the average WACC of
equity indices in different countries, such as the US, China and Brazil, as well as
conversations with professionals in capital markets.
13
Adapted from the Annual Technology Baseline (ATB) model from the US National
Renewable Energy Laboratory, 2015. 14
Although this price level does not appear to be sustainable long term (as it may only
cover variable costs in some locations), considerably lower price ranges due to cost
reduction, productivity gains and exploitation of large gas fields seem likely, with far-
reaching consequences. 15
This assumes capacity charges, which covers the capital costs of US LNG terminals
as sunk, a $3.50/MMBtu Henry Hub gas long term, in addition to a transport cost of
~$0.9 from the US Gulf Coast (USGC) to Europe and ~$2.7 from USGC to Asia. 16
If certain costs are viewed as sunk, this could take delivered costs of US LNG down
further to ~$4 to $4.50 for Europe and ~$5 to $6 for Asia. Some offtakers of US LNG
may consider dayrates of an LNG vessel sunk if they own or have signed long term
contracts.

December 2015 Citi GPS: Global Perspectives & Solutions
© 2015 Citigroup
27
Though we attempt to make realistic cost estimates and projections by
differentiating by region and using current data on actual installed costs, there are
still many limitations to cost modelling that should be noted here. These include:
limited data on costs particularly outside the US, variability in resource efficiency
between locations, the high sensitivity of forecasts to assumptions on technological
innovation, grid integration costs and the feedback effect on power pricing from
renewables (discussed below). As such, we intend this analysis principally as a
comparison of the current state of and projected competitive dynamics and
particularly what factors could influence this evolution, rather than a forecast
of the likely future of the power market.
The Current State of Competitive Dynamics
As the capital costs of renewables have come down, these technologies have
increasingly been able to compete with fossil fuels on an economic basis. But
competitive dynamics vary significantly in different parts of the world, due to
regional differences in capital costs, fuel costs and access to cheap capital. Note
the year specified in our work is the year of investment, rather than the online year.
The cost of building and operating a power plant consists of several key factors.
First are the capital costs related to the sourcing and construction of a power plant,
operating and maintenance (O&M) costs involved in running the power plant, fuel
costs in the case of fossil generation and the financing costs associated with raising
debt and equity capital for the project. Then come other costs that relate to tax
structure and government incentives.
Figure 21. The Breakdown (Capital, O&M, Financing and Tax) in 2015 of Power Plant Costs (New) Across Regions and Technologies Shows that
Financing Costs Can Be a Significant Portion of Overall Costs for Renewables, Particularly in Developing Countries with High Cost of Capital
Source: NREL, IRENA, IEA, EIA, Citi Research
$0
$50
$100
$150
$200
$250
La
nd
-Ba
se
d W
ind
So
lar
- P
V
Co
nve
ntio
na
l -
Co
al
Co
nve
ntio
na
l -
Ga
s
La
nd
-Ba
se
d W
ind
So
lar
- P
V
Co
nve
ntio
na
l -
Co
al
Co
nve
ntio
na
l -
Ga
s
La
nd
-Ba
se
d W
ind
So
lar
- P
V
Co
nve
ntio
na
l -
Co
al
Co
nve
ntio
na
l -
Ga
s
La
nd
-Ba
se
d W
ind
So
lar
- P
V
Co
nve
ntio
na
l -
Co
al
Co
nve
ntio
na
l -
Ga
s
La
nd
-Ba
se
d W
ind
So
lar
- P
V
Co
nve
ntio
na
l -
Co
al
Co
nve
ntio
na
l -
Ga
s
United States OECD Asia Developing Asia Europe LatAm
$2013/MWhCapital Costs Fuel and O&M Costs Financing Costs Tax Costs
This analysis is a comparison of the current
state and projected competitive dynamics,
not a forecast of the likely future of power
markets
Falling capital costs have increased the
competitiveness of renewables vs. fossil
fuels on an economic basis

Citi GPS: Global Perspectives & Solutions December 2015
© 2015 Citigroup
28
The relative importance of these costs varies significantly amongst technologies.
Variable costs (including fuel and O&M) make up a larger portion of the overall cost
of fossil fuel generation than renewable generation, due to the absence of fuel costs
in the latter case – though this has become less of a differentiator with the
substantial decline in fossil fuel pricing over the last year. However, renewable
projects and particularly utility-scale solar PV, tend to be more capital-intensive than
fossil fuel generation because the upfront costs of building the plants tend to be
higher as compared to gas and coal. Renewables are also affected by low capacity
factors as compared to fossil fuels (the percentage of time a plant is actually able to
produce electricity) due to the variability in wind and solar resources throughout the
day and year. This raises not only the capital costs of renewable projects, but also
their financing costs.
The distribution across cost categories also varies regionally. In the developing
world with high-cost financing, such as Latin America, financing costs for capital
intensive renewables projects can indeed constitute the largest component of
overall costs. On the other hand, in developing Asia, with low-cost financing and low
labor and construction costs, both capital costs and the cost of financing are
diminished, making fuel costs a principal driver of overall economics.
Regionally, fuel costs can differ considerably. In the US where an abundance of
natural gas from shale production has brought on a new era of low-cost natural gas
pricing, variable costs for gas generation are nearly on par with coal on a country-
wide average basis and are lower than coal in certain regions. But in other parts of
the world, where higher-cost LNG dominates, coal remains the least cost alternative
on an operational cost basis, and in developing Asia, coal is the lowest total cost
technology due to the large impact of relatively high natural gas prices. Indeed
natural gas may be less of a winner than many market players have previously
anticipated as we discuss in detail below.
These regional and technological differences play important roles in current
competitive dynamics, differentiating the least-cost technologies across the world. In
the US, natural gas generation is the most economic technology on a total basis,
though onshore wind is nearly as cheap. Coal and solar-PV are relatively expensive
in the US. In OECD Asia, both onshore wind and solar PV remain relatively
expensive compared to fossil generation due to high capital costs. Gas is slightly
cheaper than coal in a total cost basis, though on a variable cost basis, coal is the
winner. In developing Asia, cheap coal and low capital costs continue to make coal
the lowest cost technology. Wind’s competitiveness is hampered by low capacity
factors; there is a huge opportunity for greater competitiveness if capacity factors
can be improved. While fossil generation remains the most competitive in Europe,
aggressive policies for renewable energy drive economics there. Hence investment
will be more tied to Feed-in-Tariff (FiT) policy than competitiveness. Finally, in Latin
America wind is already the lowest cost technology (we exclude coal due to
negligible generating capacity for coal-fired plants in Latin America) due to relatively
expensive fuel prices in this region.
One thing that is consistent across regions: financing costs are significant in overall
spend for a renewables projects. Indeed, it is clear that financing costs will be an
important driver of relative economics between renewables and fossil fuels going
forward, particularly if capital cost reductions slow. To what degree could financing
costs influence competitive dynamics?
The relative importance of power plant costs
varies amongst technologies…
...and across regions
Fuel costs also differ considerably across
regions
Current competitive dynamics are driven by
these regional and technological differences

December 2015 Citi GPS: Global Perspectives & Solutions
© 2015 Citigroup
29
Can Financing Costs become the Differentiator?
To investigate how innovations in renewable energy finance and policy support for
green finance could alter the competitive dynamics of renewables vs. fossil fuels,
we consider total costs of new power plants forecasted to 2030 under two financing
cost scenarios for renewables.
Figure 22. US: Results Show that Onshore Wind Is Already Nearly
Competitive with Natural Gas Generation (Country-wide Average, May
Vary Regionally). Solar Would Become Competitive with Gas in the Mid-
2020s Under the Cheaper Financing Scenario
Figure 23. OECD Asia: Although Coal and Gas Remain the Cheapest
Technologies (Total Cost) Throughout the Forecasting Period, Under
Cheaper Financing, Wind Would Become Competitive by 2020 and
Solar Would Be Nearly Competitive by 2030
Source: NREL, IRENA, IEA, EIA, Citi Research Source: NREL, IRENA, IEA, EIA, Citi Research
Figure 24. Developing Asia: Cheap Coal Is Hard to Dislodge in
Developing Asia, but Cheaper Financing Would Make Both Solar and
Wind Competitive by the End of the Forecasting Period
Figure 25. LatAm: Wind Is Already Nearly the Lowest Cost Technology.
Cheaper Financing Could Bring Down Solar Costs to Competitive
Levels by the Early 2020s
Source: NREL, IRENA, IEA, EIA, Citi Research Source: NREL, IRENA, IEA, EIA, Citi Research
The first scenario (“high”) uses the financing costs as indicated earlier constant over
the forecasting period, while the second scenario (“low”) considers a 250pbs
reduction by 2020 in real WACC, a hypothetical scenario of possible financing cost
reductions. We incorporate cost declines and efficiency improvements in our
projections based on the assumptions of the National Renewable Energy
Laboratory (NREL) as a base case for cost declines in various technologies.
-
20
40
60
80
100
120
2014 2019 2024 2029
$/MWh
Land-Based WindSolar-PVConventional - CoalConventional - Gas
Constant WACCDeclining WACC
-
50
100
150
200
250
2014 2019 2024 2029
$/MWh
Land-Based Wind Solar-PVConventional - Coal Conventional - Gas
Constant WACCDeclining WACC
-
20
40
60
80
100
120
2014 2019 2024 2029
$/MWh
Land-Based Wind Solar-PVConventional - Coal Conventional - Gas
Constant WACCDeclining WACC
-
20
40
60
80
100
120
140
160
2014 2019 2024 2029
$/MWh
Land-Based Wind Solar-PV
Conventional - Gas
Constant WACCDeclining WACC
Analyzing new power plant costs to 2030
under two financing scenarios
We look at both a “high” and a “low”
financing cost scenario

Citi GPS: Global Perspectives & Solutions December 2015
© 2015 Citigroup
30
Reduced financing costs for renewables can greatly accelerate the competitive
“threshold” of wind and solar vs. fossil. In some cases, cheaper financing is the
differentiator between a future in which renewable technologies eventual compete
with coal and gas and one where fossil fuels remain the cheapest alternative
throughout our forecasting period.
US: In the US, solar is nearly competitive with coal and should surpass coal
under both scenarios by the end of the decade. Wind is nearly on par with low
cost natural gas generation. To be sure, gas prices vary regionally in the US, as
do wind capacity factors, which could impact wind’s competitiveness in certain
regions. But under a cheaper financing scenario, both wind and solar become
clear winners over our forecasting period with wind surpassing gas within the
next few years and solar by the late-2020s.
OECD Asia: Coal and gas remain the most competitive throughout the
forecasting period in the baseline case. With cheaper cost of capital, wind
becomes competitive with fossil fuels in the early 2020s and solar in the late
2020s.
Developing Asia: Cheap coal will be difficult to dethrone in developing Asia, but
under a reduced cost of capital scenario, both wind and solar would be
competitive in the 2020s. Solar would become competitive with gas by the late
2020s in our base case and by the early 2020s under lower cost financing.
Europe (not shown): Power markets in Europe are driven more by policy than
competitive dynamics. Gas and coal are the cheapest technologies into the mid-
2020s under our base case, but heavy subsidization of renewables has
supported rapid penetration there.
Latin America: Wind is already competitive with gas. Solar would become
competitive with wind and gas in the early 2020s under cheaper financing versus
the late 2020s in our baseline scenario.
Such differentiated declines in the cost of capital for renewables vs. fossil fuels
would likely necessitate policy intervention or targeted financial products for
renewable technologies. Competitive dynamics could be altered even if the cost of
capital declines across all technologies. This may be particularly important in the
developing world, where there is significant space for reducing institutional risk.
Reduced financing costs for renewables can
accelerate the competitive “threshold” of
wind and solar vs. fossil
Competitive dynamics could be altered even
if cost of capital declines across all
technologies

December 2015 Citi GPS: Global Perspectives & Solutions
© 2015 Citigroup
31
Figure 26. 2020 LCOE of Various Technologies under High and Low Financing Cost Scenarios Show that Lower Cost Financing Significantly
Narrows the Gap between Renewable and Fossil Fuel Projects Costs
Source: NREL, IRENA, IEA, EIA, Citi Research
Indeed, projected costs in 2020 applying the “high” and “low” financing cost
scenarios to all technologies indicate that the competitive economics of renewables
improve significantly under a lower cost financing scenario. Because financing costs
disproportionately affect high capital cost renewable projects, reductions in
financing costs disproportionately benefit these projects. Innovation in financing
could thus reduce the “gap” that technological innovation must cover in order to
bring renewables into an era of cost competitiveness with fossil fuels. This could be
particularly important for solar projects, which largely remain above competitive cost
levels in our forecasts.
To be sure capital cost declines may progress faster or slower than our projections,
potentially changing ultimate competitive dynamics. Key variables could improve
renewable energy economics vs. these results: (1) faster technological innovation
could lead to both lower equipment costs and better capacity factors; (2) capacity
factor optimization from improved project siting or better grid connectivity (less
curtailment); and (3) lower costs of capital. On the other hand, coal and gas
technologies could likewise see more aggressive cost declines if fuel prices
continue to fall or technological innovation in this space exceeds expectations.
But regardless of how the actual progression of capital cost declines and efficiency
improvements across fossil and renewable technologies manifests, financing costs
will matter. Cheaper renewables financing can greatly accelerate the timeline for
renewables to become more competitive than fossil generation on a widespread
basis. Even cheaper financing across all technologies would improve the
competitive landscape for renewables, narrowing the gap between total costs of
fossil and renewables, bearing some of the burden for cost reduction.
0
20
40
60
80
100
120
140
160
180
200
Low High Low High Low High Low High Low High
United States OECD Asia Developing Asia Europe LatAm
$2013/MWh Land-Based Wind Solar - PV Conventional - Coal Conventional - Gas
In a lower financing cost scenario, all
technologies indicate that competitive
economics of renewables improve
significantly
Other factors affect capital costs and could
affect renewable energy economics…
...but financing costs still matter
Citi GPS: Global Perspectives & Solutions December 2015
© 2015 Citigroup
32
Even so, several concluding caveats need to be noted:
(a) In power markets, competitive dynamics don’t always drive
investment
Competition is not always straightforward in energy markets. Many of the power
markets in emerging Asian economies are not competitive; they are state-controlled
or in various states of gradual reform.17
India, China and much of Asia fall into this
category, although China is set to open up its power market to more competition. In
sum, economics still matter in developing economies, but are heavily distorted by
government and policy objectives.
(b) Impacts of intermittency and grid integration costs are
externalities of high renewable penetration that are not captured by
plant costs
Another important economic factor is the role of intermittency and grid integration
costs. Examining asset-level competitiveness does not fully capture the effect on
the entire electrical grid, which should also be taken into account.18
Some
renewables can be baseload, “dispatchable” power: hydro, biomass and
geothermal. Others, such as wind and solar, depend on weather conditions and are
interruptible by nature and therefore variable (henceforth VRE, or variable
renewable energy).
The integration of a substantial share of renewable energy into the power grid will
require large investments and changes in operation. They include: (1)
accommodating two-way power flows, blurring the generation-load divide, because
homes themselves could generate electricity through distributed generation
resources, such as solar; (2) improving ancillary services to balance the grid and
accommodate the intermittency of renewables, as electricity supply and demand
have to be balanced instantly; (3) wider adoption of demand-side management
measures that can change demand patterns throughout the day; (4) integrating
multiple distributed generation resources for greater balancing and resiliency; and
(5) incorporating energy storage to balance the electricity network.
17
For a detailed analysis of the political economy of developing country power sectors,
see Victor, David and Heller, Thomas. “The Political Economy of Power Sector Reform;
The Experiences of Five Major Developing Countries”. Cambridge University Press.
Cambridge. 2009. 18
For a more detailed assessment of this issue, see Renenewable Energy Integration in
Power Grids. IRENA. 2015.
Competition is not always straightforward in
energy markets
Intermittency and grid integration costs are
important economic factors for renewables

December 2015 Citi GPS: Global Perspectives & Solutions
© 2015 Citigroup
33
Figure 27. Global Energy Storage Capacity from Pumped Hydro, Large-scale Batteries and Other Sources
Source: IEA, Citi Research
Storage could be a key technology going forward, but for the moment, its scale is
unfortunately inadequate to back up intermittent power systems globally. The total
electricity generated globally in 2014 was 2,687GW in utilized capacity terms, of
which ~100-GW came from solar and wind. Although the latest IEA report put
storage capacity at just under 140-GW, seemingly sufficient to back up renewables,
nearly all of that capacity is pumped-storage (i.e. water on high ground or tanks).
These pumped-storage facilities are often not in the same area as where solar and
wind are expanding, while the non-pumped part of storage is still less than 5-GW, of
which battery is less than 1-GW. Even at rapid growth rates, it would take years for
batteries to be able to back up solar and wind. In addition, currently the growth of
solar and wind appears to be faster in absolute terms than non-pumped storage.
Finally, the cost of large-scale batteries is still very high making the full system cost
of renewables supported by battery storage much higher than if renewables were
standalone resources able to produce a smooth generation profile like fossil,
nuclear or hydro.
Figure 28. Penetration of Renewables (% Renewable Consumption to Total Electricity
Generation) in Major Regions
Source: BP, Citi Research
0
20
40
60
80
100
120
140
2000 2005 2010 2014
GW
Pumped Hydro storage Other
0
1
2
3
4
5
2010 2011 2012 2013 2014
GW
Thermal Storage Large-scalebatteries
Flywheel CAES Hydrogen
0%
2%
4%
6%
8%
10%
12%
1995 1997 1999 2001 2003 2005 2007 2009 2011 2013
N. America S. & Cent. AmericaEurope Middle EastAfrica Asia-Ex ChinaChina
Storage could be a key factor going forward
but is currently inadequate to back up
intermittent power systems globally

Citi GPS: Global Perspectives & Solutions December 2015
© 2015 Citigroup
34
The cost and level of investment required will be a function of renewable energy
penetration levels. Integration costs can be considered in two categories: grid
infrastructure and system operations costs. IRENA estimates that grid upgrading
costs for a power system with 20-30% variable renewable energy, subject to grid
and interconnection capabilities could be in the range of $0.5-3.5/MWh.19
These
costs can be phased in over time as renewable energy penetration increases. For
system operation costs, the single largest cost is anticipated to be reduced plant
utilization of baseload assets. At penetration rates of 30-40%, this would account for
half of system operations costs on the level of $16-28/MWh.
Figure 29. For Wind Generation, There Are Still Kinks that Require
Smoothing (ERCOT Hourly Wind Generation in March 2014)
Figure 30. “Duck” Curve Representing the Sharp Drop in Mid-day
Electricity Demand but the Sharp Ramp-up of Evening Demand (Net
Load Curve for California from 2012 to 2020)
Source: EIA, Citi Research Source: LBNL, Citi Research
(c) Greater renewable energy penetration will have feedback effects
on power prices and generation revenue
The revenue side of the economic calculation is equally as important as the cost
side, where much of the discussion so far has focused on the fuel, capital and
financing cost of power assets.
Greater penetration of renewables pushes down power prices and impacts the
value of all generation assets. Higher shares of renewables and more generation
from sources with near-zero marginal costs (e.g. nuclear) should keep off-peak
prices low. Regions with large shares of low-cost variable generation at times see
near zero or even negative electricity prices because generation from renewable
energy exceeds demand or transmission capacity. Developers are concerned about
these shrinking margins, which impedes the motivation to sponsor renewable
energy projects. Hence, as margin falls, the solar and wind install economics will
have to rely more on continued cost declines to stay economic.
Power prices could also be more volatile during certain times of the day. High
penetration rates of renewables also create another problem manifested in a so-
called “Duck” curve. The surge in solar generation mid-day sharply lowers mid-day
electricity demand and severely depresses prices. But the evening ramp-up in
electricity demand after sunset requires either more fossil generation or sufficient
energy release from storage facilities. Therefore, markets for ancillary services and
capacity become necessary to financially support electricity supply from fossil or
storage, as energy prices (i.e., electricity prices) are expected to keep falling.
19
Renewable Energy Integration in Power Grids. IRENA. 2015. See report for detailed
discussion.
Costs aren’t the only consideration for
renewables, the revenue side matters as
well
Renewables power prices could become
move volatile at certain times of the day due
to a surge in mid-day generation
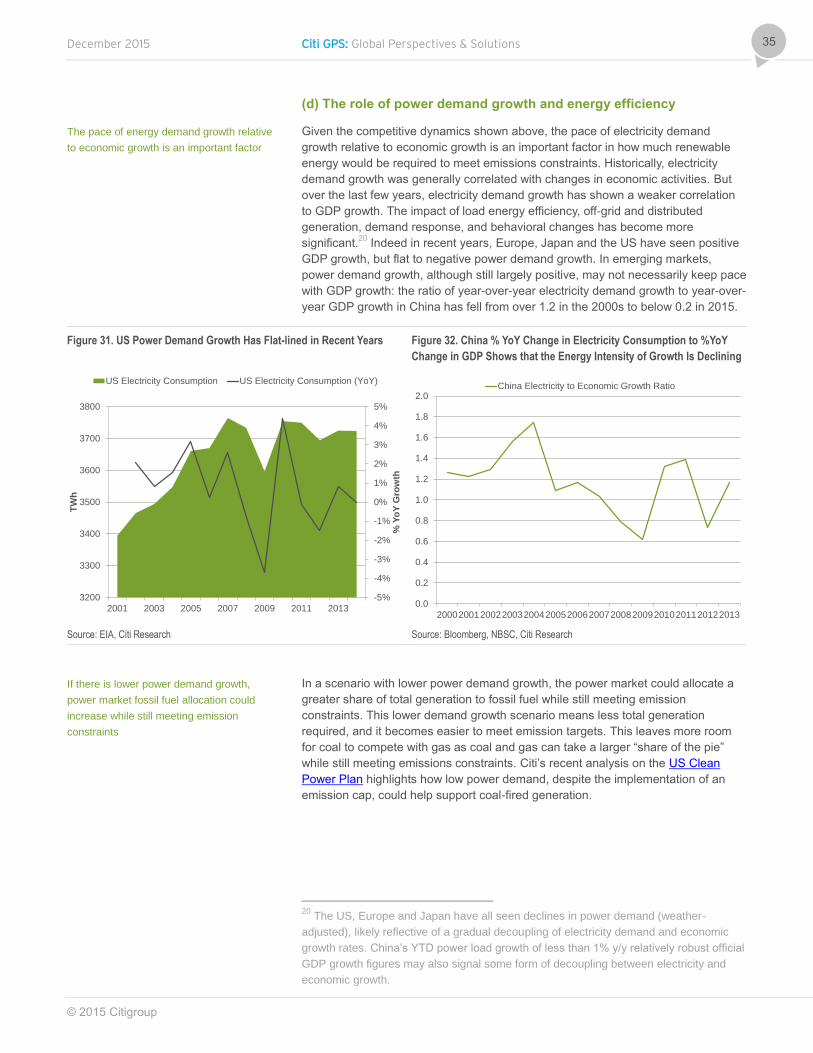
December 2015 Citi GPS: Global Perspectives & Solutions
© 2015 Citigroup
35
(d) The role of power demand growth and energy efficiency
Given the competitive dynamics shown above, the pace of electricity demand
growth relative to economic growth is an important factor in how much renewable
energy would be required to meet emissions constraints. Historically, electricity
demand growth was generally correlated with changes in economic activities. But
over the last few years, electricity demand growth has shown a weaker correlation
to GDP growth. The impact of load energy efficiency, off-grid and distributed
generation, demand response, and behavioral changes has become more
significant.20
Indeed in recent years, Europe, Japan and the US have seen positive
GDP growth, but flat to negative power demand growth. In emerging markets,
power demand growth, although still largely positive, may not necessarily keep pace
with GDP growth: the ratio of year-over-year electricity demand growth to year-over-
year GDP growth in China has fell from over 1.2 in the 2000s to below 0.2 in 2015.
Figure 31. US Power Demand Growth Has Flat-lined in Recent Years
Figure 32. China % YoY Change in Electricity Consumption to %YoY
Change in GDP Shows that the Energy Intensity of Growth Is Declining
Source: EIA, Citi Research Source: Bloomberg, NBSC, Citi Research
In a scenario with lower power demand growth, the power market could allocate a
greater share of total generation to fossil fuel while still meeting emission
constraints. This lower demand growth scenario means less total generation
required, and it becomes easier to meet emission targets. This leaves more room
for coal to compete with gas as coal and gas can take a larger “share of the pie”
while still meeting emissions constraints. Citi’s recent analysis on the US Clean
Power Plan highlights how low power demand, despite the implementation of an
emission cap, could help support coal-fired generation.
20
The US, Europe and Japan have all seen declines in power demand (weather-
adjusted), likely reflective of a gradual decoupling of electricity demand and economic
growth rates. China’s YTD power load growth of less than 1% y/y relatively robust official
GDP growth figures may also signal some form of decoupling between electricity and
economic growth.
-5%
-4%
-3%
-2%
-1%
0%
1%
2%
3%
4%
5%
3200
3300
3400
3500
3600
3700
3800
2001 2003 2005 2007 2009 2011 2013
% Y
oY
Gro
wth
TW
h
US Electricity Consumption US Electricity Consumption (YoY)
0.0
0.2
0.4
0.6
0.8
1.0
1.2
1.4
1.6
1.8
2.0
20002001200220032004200520062007200820092010201120122013
China Electricity to Economic Growth Ratio
The pace of energy demand growth relative
to economic growth is an important factor
If there is lower power demand growth,
power market fossil fuel allocation could
increase while still meeting emission
constraints
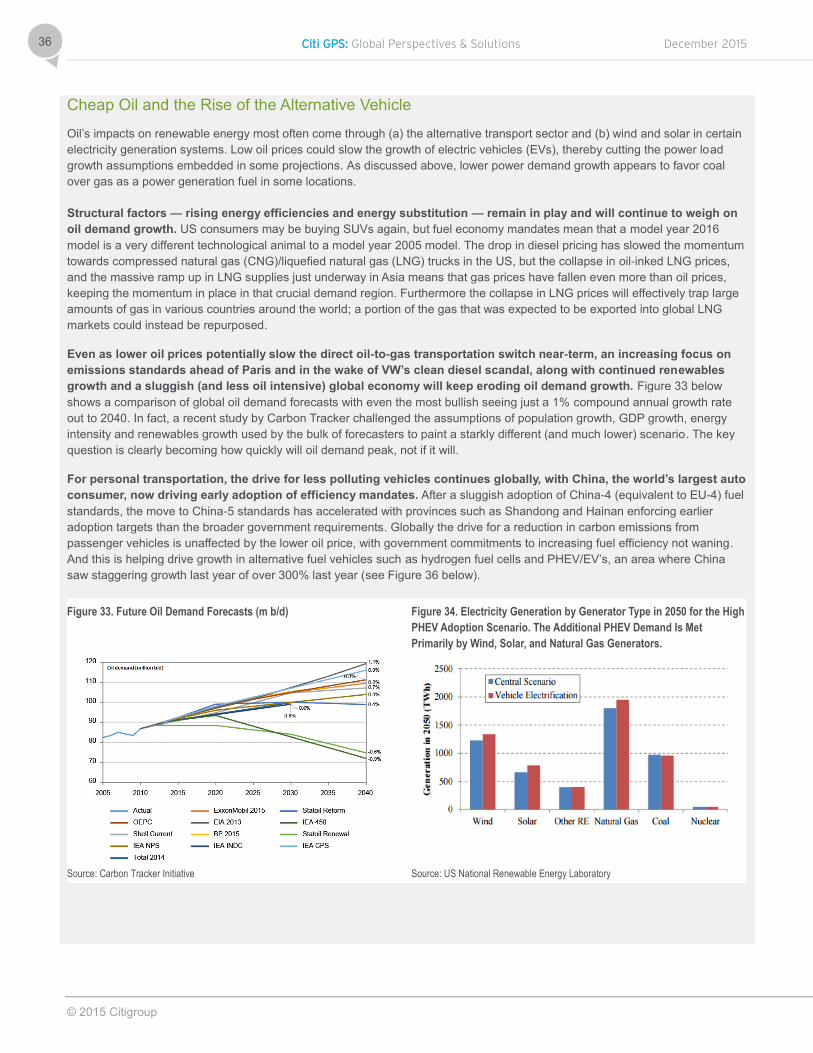
Citi GPS: Global Perspectives & Solutions December 2015
© 2015 Citigroup
36
Cheap Oil and the Rise of the Alternative Vehicle
Oil’s impacts on renewable energy most often come through (a) the alternative transport sector and (b) wind and solar in certain
electricity generation systems. Low oil prices could slow the growth of electric vehicles (EVs), thereby cutting the power load
growth assumptions embedded in some projections. As discussed above, lower power demand growth appears to favor coal
over gas as a power generation fuel in some locations.
Structural factors — rising energy efficiencies and energy substitution — remain in play and will continue to weigh on
oil demand growth. US consumers may be buying SUVs again, but fuel economy mandates mean that a model year 2016
model is a very different technological animal to a model year 2005 model. The drop in diesel pricing has slowed the momentum
towards compressed natural gas (CNG)/liquefied natural gas (LNG) trucks in the US, but the collapse in oil-inked LNG prices,
and the massive ramp up in LNG supplies just underway in Asia means that gas prices have fallen even more than oil prices,
keeping the momentum in place in that crucial demand region. Furthermore the collapse in LNG prices will effectively trap large
amounts of gas in various countries around the world; a portion of the gas that was expected to be exported into global LNG
markets could instead be repurposed.
Even as lower oil prices potentially slow the direct oil-to-gas transportation switch near-term, an increasing focus on
emissions standards ahead of Paris and in the wake of VW’s clean diesel scandal, along with continued renewables
growth and a sluggish (and less oil intensive) global economy will keep eroding oil demand growth. Figure 33 below
shows a comparison of global oil demand forecasts with even the most bullish seeing just a 1% compound annual growth rate
out to 2040. In fact, a recent study by Carbon Tracker challenged the assumptions of population growth, GDP growth, energy
intensity and renewables growth used by the bulk of forecasters to paint a starkly different (and much lower) scenario. The key
question is clearly becoming how quickly will oil demand peak, not if it will.
For personal transportation, the drive for less polluting vehicles continues globally, with China, the world’s largest auto
consumer, now driving early adoption of efficiency mandates. After a sluggish adoption of China-4 (equivalent to EU-4) fuel
standards, the move to China-5 standards has accelerated with provinces such as Shandong and Hainan enforcing earlier
adoption targets than the broader government requirements. Globally the drive for a reduction in carbon emissions from
passenger vehicles is unaffected by the lower oil price, with government commitments to increasing fuel efficiency not waning.
And this is helping drive growth in alternative fuel vehicles such as hydrogen fuel cells and PHEV/EV’s, an area where China
saw staggering growth last year of over 300% last year (see Figure 36 below).
Figure 33. Future Oil Demand Forecasts (m b/d)
Figure 34. Electricity Generation by Generator Type in 2050 for the High
PHEV Adoption Scenario. The Additional PHEV Demand Is Met
Primarily by Wind, Solar, and Natural Gas Generators.
Source: Carbon Tracker Initiative Source: US National Renewable Energy Laboratory
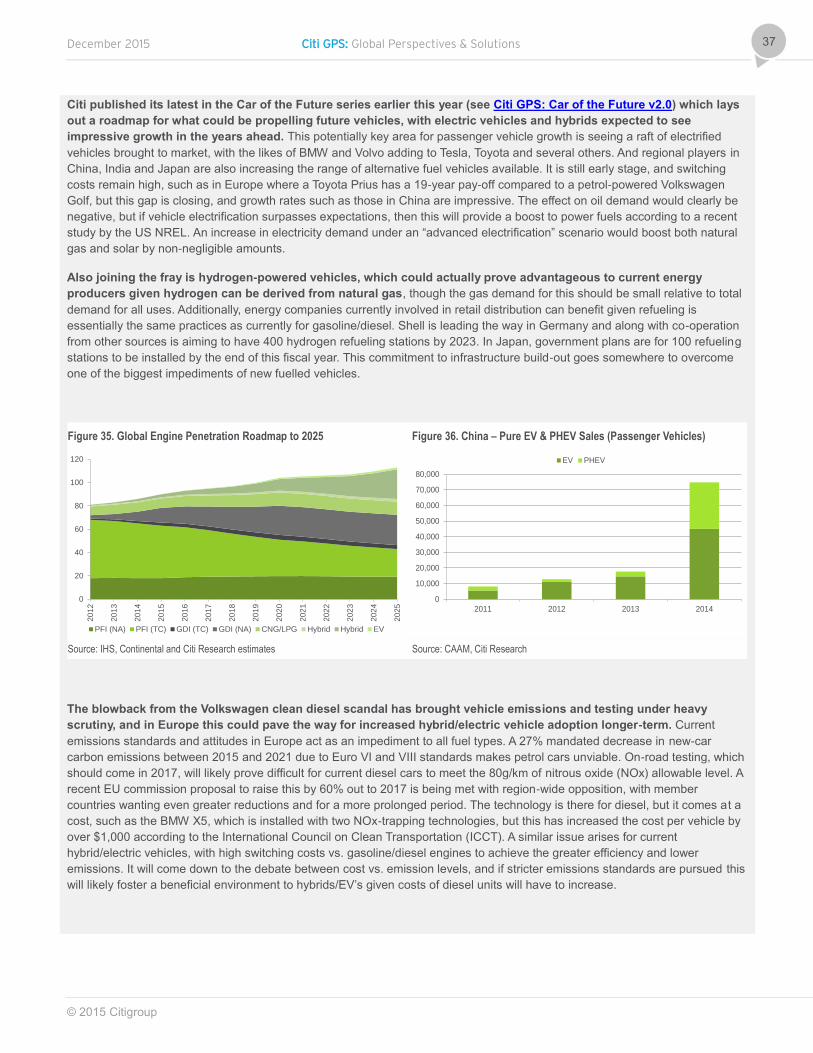
December 2015 Citi GPS: Global Perspectives & Solutions
© 2015 Citigroup
37
Citi published its latest in the Car of the Future series earlier this year (see Citi GPS: Car of the Future v2.0) which lays
out a roadmap for what could be propelling future vehicles, with electric vehicles and hybrids expected to see
impressive growth in the years ahead. This potentially key area for passenger vehicle growth is seeing a raft of electrified
vehicles brought to market, with the likes of BMW and Volvo adding to Tesla, Toyota and several others. And regional players in
China, India and Japan are also increasing the range of alternative fuel vehicles available. It is still early stage, and switching
costs remain high, such as in Europe where a Toyota Prius has a 19-year pay-off compared to a petrol-powered Volkswagen
Golf, but this gap is closing, and growth rates such as those in China are impressive. The effect on oil demand would clearly be
negative, but if vehicle electrification surpasses expectations, then this will provide a boost to power fuels according to a recent
study by the US NREL. An increase in electricity demand under an “advanced electrification” scenario would boost both natural
gas and solar by non-negligible amounts.
Also joining the fray is hydrogen-powered vehicles, which could actually prove advantageous to current energy
producers given hydrogen can be derived from natural gas, though the gas demand for this should be small relative to total
demand for all uses. Additionally, energy companies currently involved in retail distribution can benefit given refueling is
essentially the same practices as currently for gasoline/diesel. Shell is leading the way in Germany and along with co-operation
from other sources is aiming to have 400 hydrogen refueling stations by 2023. In Japan, government plans are for 100 refueling
stations to be installed by the end of this fiscal year. This commitment to infrastructure build-out goes somewhere to overcome
one of the biggest impediments of new fuelled vehicles.
The blowback from the Volkswagen clean diesel scandal has brought vehicle emissions and testing under heavy
scrutiny, and in Europe this could pave the way for increased hybrid/electric vehicle adoption longer-term. Current
emissions standards and attitudes in Europe act as an impediment to all fuel types. A 27% mandated decrease in new-car
carbon emissions between 2015 and 2021 due to Euro VI and VIII standards makes petrol cars unviable. On-road testing, which
should come in 2017, will likely prove difficult for current diesel cars to meet the 80g/km of nitrous oxide (NOx) allowable level. A
recent EU commission proposal to raise this by 60% out to 2017 is being met with region-wide opposition, with member
countries wanting even greater reductions and for a more prolonged period. The technology is there for diesel, but it comes at a
cost, such as the BMW X5, which is installed with two NOx-trapping technologies, but this has increased the cost per vehicle by
over $1,000 according to the International Council on Clean Transportation (ICCT). A similar issue arises for current
hybrid/electric vehicles, with high switching costs vs. gasoline/diesel engines to achieve the greater efficiency and lower
emissions. It will come down to the debate between cost vs. emission levels, and if stricter emissions standards are pursued this
will likely foster a beneficial environment to hybrids/EV’s given costs of diesel units will have to increase.
Figure 35. Global Engine Penetration Roadmap to 2025
Figure 36. China – Pure EV & PHEV Sales (Passenger Vehicles)
Source: IHS, Continental and Citi Research estimates Source: CAAM, Citi Research
0
20
40
60
80
100
120
2012
2013
2014
2015
2016
2017
2018
2019
2020
2021
2022
2023
2024
2025
PFI (NA) PFI (TC) GDI (TC) GDI (NA) CNG/LPG Hybrid Hybrid EV
0
10,000
20,000
30,000
40,000
50,000
60,000
70,000
80,000
2011 2012 2013 2014
EV PHEV
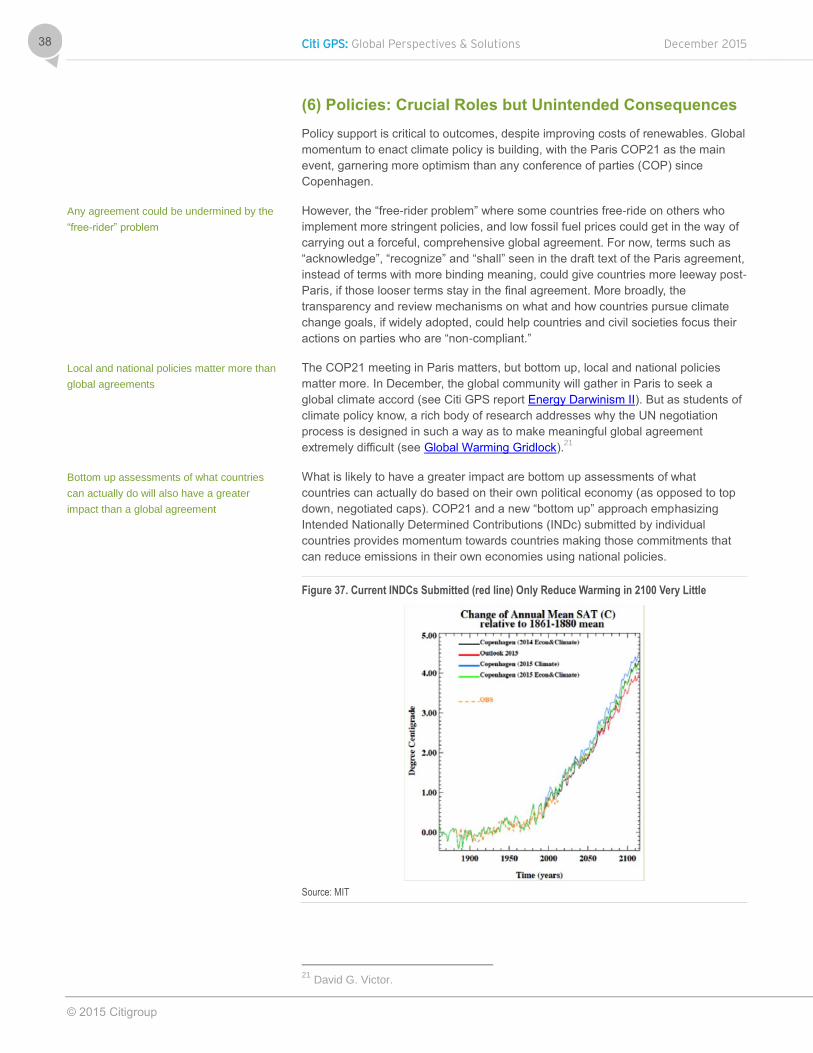
Citi GPS: Global Perspectives & Solutions December 2015
© 2015 Citigroup
38
(6) Policies: Crucial Roles but Unintended Consequences
Policy support is critical to outcomes, despite improving costs of renewables. Global
momentum to enact climate policy is building, with the Paris COP21 as the main
event, garnering more optimism than any conference of parties (COP) since
Copenhagen.
However, the “free-rider problem” where some countries free-ride on others who
implement more stringent policies, and low fossil fuel prices could get in the way of
carrying out a forceful, comprehensive global agreement. For now, terms such as
“acknowledge”, “recognize” and “shall” seen in the draft text of the Paris agreement,
instead of terms with more binding meaning, could give countries more leeway post-
Paris, if those looser terms stay in the final agreement. More broadly, the
transparency and review mechanisms on what and how countries pursue climate
change goals, if widely adopted, could help countries and civil societies focus their
actions on parties who are “non-compliant.”
The COP21 meeting in Paris matters, but bottom up, local and national policies
matter more. In December, the global community will gather in Paris to seek a
global climate accord (see Citi GPS report Energy Darwinism II). But as students of
climate policy know, a rich body of research addresses why the UN negotiation
process is designed in such a way as to make meaningful global agreement
extremely difficult (see Global Warming Gridlock).21
What is likely to have a greater impact are bottom up assessments of what
countries can actually do based on their own political economy (as opposed to top
down, negotiated caps). COP21 and a new “bottom up” approach emphasizing
Intended Nationally Determined Contributions (INDc) submitted by individual
countries provides momentum towards countries making those commitments that
can reduce emissions in their own economies using national policies.
Figure 37. Current INDCs Submitted (red line) Only Reduce Warming in 2100 Very Little
Source: MIT
21
David G. Victor.
Any agreement could be undermined by the
“free-rider” problem
Local and national policies matter more than
global agreements
Bottom up assessments of what countries
can actually do will also have a greater
impact than a global agreement
December 2015 Citi GPS: Global Perspectives & Solutions
© 2015 Citigroup
39
Although this bottom-up approach looks promising, it is unlikely that many nations
would self-impose high carbon prices. In the lead-up to COP21 in Paris, many
countries have put out their emission goals and these goals aggregate up to the
global level, which is different form the past when goals were more top-down and
countries were allocated to achieve certain emission levels. However, in using this
approach, countries may hesitate to voluntarily put in stringent policies on carbon. In
general, putting a high price on carbon incrementally reduces a country’s
competitive edge by raising production costs, unless most other countries impose
high carbon prices. This is despite in the long-run having a carbon price is good for
the world. This is the opposite case of competitive currency devaluation, for
example, where a quick devaluation may boost a country’s exports incrementally in
the short-run, even though in the long-run countries tend to suffer if everyone
devalues. Hence, countries may opt to pursue policies that increase welfare in the
short-run and avoid policies that reduce welfare in the immediate future. With a
looser cap on carbon, coal may have more breathing room.
In the US, President Obama’s Clean Power Plan that was announced in August
2015, has the potential to remake the power sector in a cleaner image. Yet the plan
faces a gauntlet of legal, political, and implementation risk between now and its
2022 start date that could impact its existence or eventual design, creating large
uncertainties. For full detail, see Citi’s report Clean Power Plan: Focus on the Big
Risks (Aug’15)
The “Mission Innovation” and “Breakthrough Energy Coalition” initiatives, as
announced at the start of COP21 in Paris, are much-needed steps to drive the next
wave of research, development and innovation in clean energy.22
Driving innovation
in clean energy may not see as immediate a return as software, as the speed of
replication and commercialization is much faster for the latter thereby attracting
substantial amounts of venture capital investments. In addition, investing in
traditional forms or energy is still appealing because, from some investors’ view
including Bill Gates, there could potentially be a higher degree of “uncertainty”
regarding clean energy. These initiatives aim to drive the focus back to clean
energy. Indeed, private sector involvement and public-private partnerships are
critical: the $100 billion per year of commitment in clean energy investment from
developed countries to developing countries, as committed to in Copenhagen in
2009, would only be achieved if funding comes not just from the public sector and
multi-lateral development banks (MBDs), but also from leveraging the private sector,
as previously analyzed by the World Resource Institute.23
In all, decarbonizing the
global economy in a low fossil fuel price environment requires a further reduction in
the costs of clean energy; R&D is key but reducing risk and financing costs are
crucial in compressing clean energy costs.
But policy isn’t all pointing in one direction: important tax incentives for wind and
solar are being phased out in the US by 2017 unless Congress renews them.
Whether Congress extends renewable energy support policies should have a large
impact on the pace of renewable energy expansion before 2022 in the US.
22
The “Mission Innovation” initiative, as announced at the start of the Paris conference,
is a key example of public sector involvement, as 20 countries have signed on pledging
to double their investments in clean energy R&D in the next five years. Meanwhile, Bill
Gates is leading a parallel initiative called “Breakthrough Energy Coalition” – a private-
sector push bringing early-stage energy programs into the marketplace. 23
http://.www.wri.org/publication/getting-100-billion-climate-finance-scenarios-and-
projrctions-2020
It is unlikely that many nations would self-
impose high carbon prices in their bottom-up
approaches
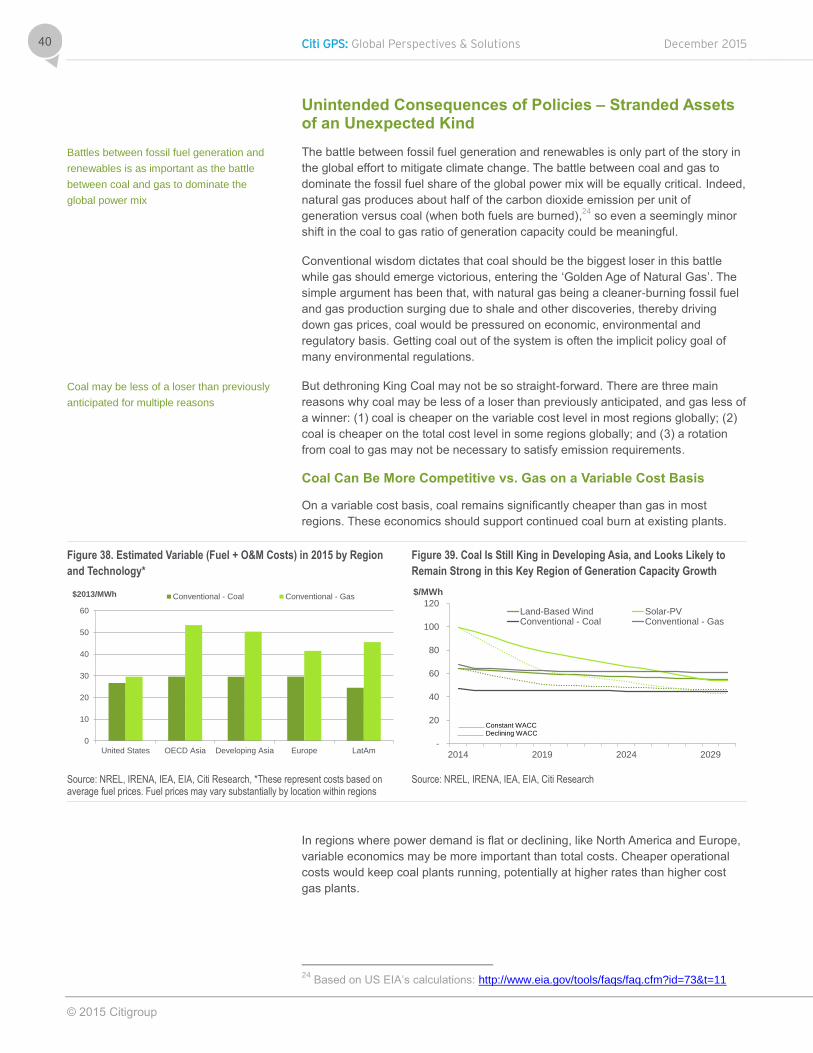
Citi GPS: Global Perspectives & Solutions December 2015
© 2015 Citigroup
40
Unintended Consequences of Policies – Stranded Assets of an Unexpected Kind
The battle between fossil fuel generation and renewables is only part of the story in
the global effort to mitigate climate change. The battle between coal and gas to
dominate the fossil fuel share of the global power mix will be equally critical. Indeed,
natural gas produces about half of the carbon dioxide emission per unit of
generation versus coal (when both fuels are burned),24
so even a seemingly minor
shift in the coal to gas ratio of generation capacity could be meaningful.
Conventional wisdom dictates that coal should be the biggest loser in this battle
while gas should emerge victorious, entering the ‘Golden Age of Natural Gas’. The
simple argument has been that, with natural gas being a cleaner-burning fossil fuel
and gas production surging due to shale and other discoveries, thereby driving
down gas prices, coal would be pressured on economic, environmental and
regulatory basis. Getting coal out of the system is often the implicit policy goal of
many environmental regulations.
But dethroning King Coal may not be so straight-forward. There are three main
reasons why coal may be less of a loser than previously anticipated, and gas less of
a winner: (1) coal is cheaper on the variable cost level in most regions globally; (2)
coal is cheaper on the total cost level in some regions globally; and (3) a rotation
from coal to gas may not be necessary to satisfy emission requirements.
Coal Can Be More Competitive vs. Gas on a Variable Cost Basis
On a variable cost basis, coal remains significantly cheaper than gas in most
regions. These economics should support continued coal burn at existing plants.
Figure 38. Estimated Variable (Fuel + O&M Costs) in 2015 by Region
and Technology*
Figure 39. Coal Is Still King in Developing Asia, and Looks Likely to
Remain Strong in this Key Region of Generation Capacity Growth
Source: NREL, IRENA, IEA, EIA, Citi Research, *These represent costs based on average fuel prices. Fuel prices may vary substantially by location within regions
Source: NREL, IRENA, IEA, EIA, Citi Research
In regions where power demand is flat or declining, like North America and Europe,
variable economics may be more important than total costs. Cheaper operational
costs would keep coal plants running, potentially at higher rates than higher cost
gas plants.
24
Based on US EIA’s calculations: http://www.eia.gov/tools/faqs/faq.cfm?id=73&t=11
0
10
20
30
40
50
60
United States OECD Asia Developing Asia Europe LatAm
$2013/MWh Conventional - Coal Conventional - Gas
-
20
40
60
80
100
120
2014 2019 2024 2029
$/MWh
Land-Based Wind Solar-PVConventional - Coal Conventional - Gas
Constant WACCDeclining WACC
Battles between fossil fuel generation and
renewables is as important as the battle
between coal and gas to dominate the
global power mix
Coal may be less of a loser than previously
anticipated for multiple reasons

December 2015 Citi GPS: Global Perspectives & Solutions
© 2015 Citigroup
41
Coal Is Still Competitive on a Total Cost Basis in Critical Growth Areas
In Developing Asia, coal looks likely to remain the cheapest alternative, although
coal looks slightly more expensive on a total cost basis in most regions, including
the US and OECD Asia (by a small margin). Indeed, in our base case financing
scenario, neither gas nor renewables reaches competitive levels with coal
throughout our forecasting period. Despite the possibility of coal demand peaking in
China in the near future, (see Citi’s report “The Unimaginable: Peak Coal in China”
(Sept ’13) for details) as air pollution concerns drive a shift towards cleaner
technologies and a macro economic slowdown reduces overall power demand,
other countries in the region including India and Indonesia, are poised to see
significant power demand growth. Much of this growth could be satisfied by coal
given its competitive advantage in this region.
Figure 40. In regions with falling coal demand, gas may not substitute coal 1-for-1; in regions with growing power demand coal often wins vs. gas
Source: BP, Citi Research
Looking at the top 10 regions of coal consumption reveals that there may be less
room for gas to take market share than many analysts expect. In regions where
power demand is growing, such as South Africa, Indonesia, India and Australia, coal
is generally cheaper than gas on a total cost basis, which should support new coal
plant builds over new gas plant builds absent strict emission caps. However, in
regions where growth is not expected, such as Europe, North America, Japan and
China, coal is being substituted more so by renewables and nuclear than by natural
gas while variable cost economics largely continue to favor coal.
Some think that low North American gas prices could help gas-fired generation gain
market share in power generation. But, similar to what’s happening in China with
coal, having more capacity does not necessarily mean higher consumption. In the
US, electricity demand growth is flat to negative, while generation from renewable
energy is rising and nuclear is relatively stable. This puts a squeeze on fossil fuel
power generation, particularly on coal at first glance. However, there are regions
where the variable generation costs of coal power plants are cheaper than gas
plants. In this case, then coal could stay resilient. Even if there is a carbon price,
which should disadvantage coal, if the carbon price is not high enough to lift the
variable generation cost of coal to equal that of gas, then coal power generation in
that location could stay favored. This is currently the case in Europe, where the
carbon price is too low to support gas-fired power generation.
Country/region 2014 demand
(mtoe)
Cumulative
demand (mtoe)
Share of total
world demand
Growth mode Comment
China 1.96 1.96 51% No Coal demand peaked, but gas use minimal and likely only partially
substituting coal-fired power generation
North America 0.49 2.45 63% No Coal demand peaked, but possible for coal's share in power generation to
stay above gas as renewables partially take shares
India 0.36 2.81 72% Yes Coal - a less expensive generation fuel for wide-spread electrification vs.
gas
EU 0.28 3.10 80% No Coal demand more resilient than gas due to pricing
Japan 0.13 3.22 83% No Nuclear restarts backing out oil, then gas, with government's plan looking
for both coal and gas to have similar generation shares
South Africa 0.09 3.31 85% Yes Major coal producing country
Russian Federation 0.09 3.40 88% Yes Major gas and coal producing country
South Korea 0.08 3.48 90% Yes Previous government plans (the 6th and 7th Basic Plans) looked to ramp up
coal-fired generation capacity (6th Basic Plan PDF)
Indonesia 0.06 3.54 91% Yes Major coal producing country building new coal power plants
Australia 0.04 3.59 92% Yes Major coal and gas producing country; the country's Bureau of Resources
and Energy Economics still expects coal demand to grow, particularly in
the power sector
Coal is likely to remain the cheapest
alternative in Developing Asia but looks
slightly more expensive in the US and
OECD Asia
In regions where power demand is growing,
coal is generally cheaper than gas on a total
cost basis
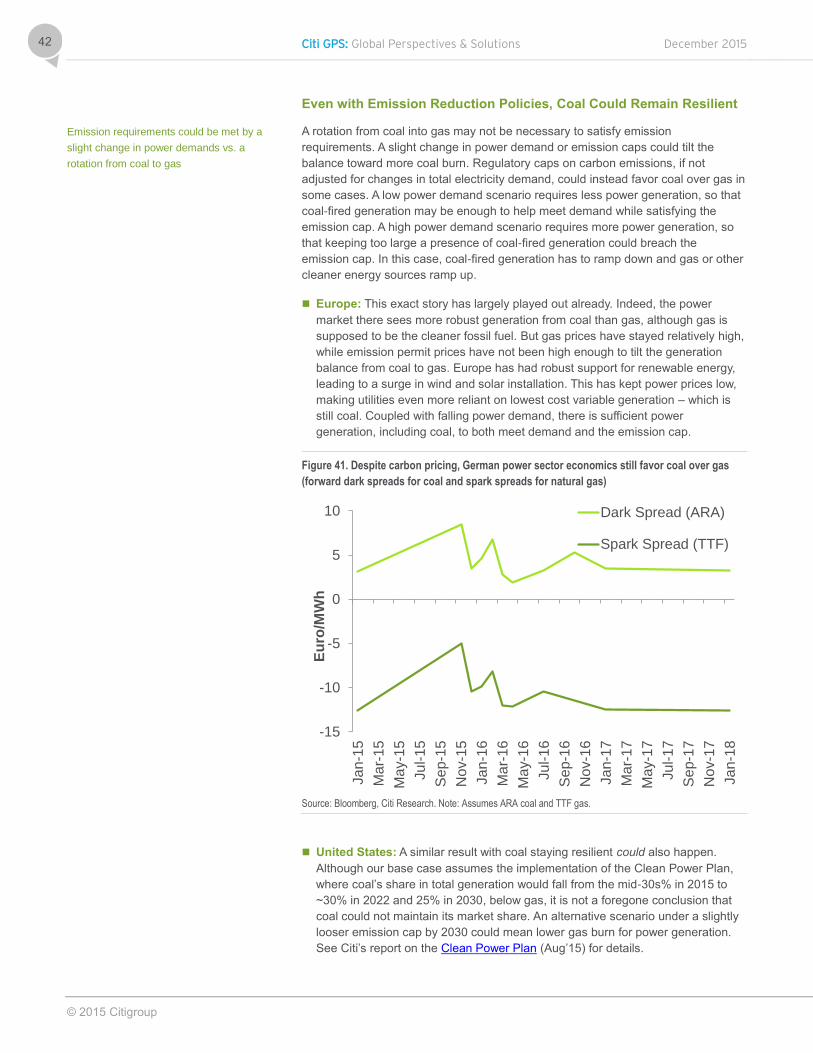
Citi GPS: Global Perspectives & Solutions December 2015
© 2015 Citigroup
42
Even with Emission Reduction Policies, Coal Could Remain Resilient
A rotation from coal into gas may not be necessary to satisfy emission
requirements. A slight change in power demand or emission caps could tilt the
balance toward more coal burn. Regulatory caps on carbon emissions, if not
adjusted for changes in total electricity demand, could instead favor coal over gas in
some cases. A low power demand scenario requires less power generation, so that
coal-fired generation may be enough to help meet demand while satisfying the
emission cap. A high power demand scenario requires more power generation, so
that keeping too large a presence of coal-fired generation could breach the
emission cap. In this case, coal-fired generation has to ramp down and gas or other
cleaner energy sources ramp up.
Europe: This exact story has largely played out already. Indeed, the power
market there sees more robust generation from coal than gas, although gas is
supposed to be the cleaner fossil fuel. But gas prices have stayed relatively high,
while emission permit prices have not been high enough to tilt the generation
balance from coal to gas. Europe has had robust support for renewable energy,
leading to a surge in wind and solar installation. This has kept power prices low,
making utilities even more reliant on lowest cost variable generation – which is
still coal. Coupled with falling power demand, there is sufficient power
generation, including coal, to both meet demand and the emission cap.
Figure 41. Despite carbon pricing, German power sector economics still favor coal over gas
(forward dark spreads for coal and spark spreads for natural gas)
Source: Bloomberg, Citi Research. Note: Assumes ARA coal and TTF gas.
United States: A similar result with coal staying resilient could also happen.
Although our base case assumes the implementation of the Clean Power Plan,
where coal’s share in total generation would fall from the mid-30s% in 2015 to
~30% in 2022 and 25% in 2030, below gas, it is not a foregone conclusion that
coal could not maintain its market share. An alternative scenario under a slightly
looser emission cap by 2030 could mean lower gas burn for power generation.
See Citi’s report on the Clean Power Plan (Aug’15) for details.
-15
-10
-5
0
5
10
Ja
n-1
5
Ma
r-15
Ma
y-1
5
Ju
l-1
5
Se
p-1
5
No
v-1
5
Ja
n-1
6
Ma
r-16
Ma
y-1
6
Ju
l-1
6
Se
p-1
6
No
v-1
6
Ja
n-1
7
Ma
r-17
Ma
y-1
7
Ju
l-1
7
Se
p-1
7
No
v-1
7
Ja
n-1
8
Eu
ro/M
Wh
Dark Spread (ARA)
Spark Spread (TTF)
Emission requirements could be met by a
slight change in power demands vs. a
rotation from coal to gas

December 2015 Citi GPS: Global Perspectives & Solutions
© 2015 Citigroup
43
Figure 42. Base case – coal’s share continues to fall while gas’ share
stays flat in the US due to President Obama’s Clean Power Plan
Figure 43. A slight loosening of the US emission cap in 2030 could
theoretically keep coal’s generation share above that of gas
Source: EIA, Citi Research Source: EIA, Citi Research
Rest of World: Elsewhere globally, without policies that target coal, the relative
generation economics generally still favor coal over gas. Hence, those areas that
could choose between coal and gas-fired generation may opt for more coal-fired
generation. It is at first glance a purely economic decision, but it is more of an
unintended consequence of policy choices and market design.
Externalities Increasingly Captured in “Shadow Carbon Prices”
Globally, the trend is towards stronger national policies to penalize GHG emissions
and promote clean energy, but the risk and uncertainties are still large. This trend is
creating a “shadow price” of carbon because national polities are increasingly
capturing the externalities – negative and positive – associated with fossil fuel and
renewable energy. These policies create tangible incentives and costs, which alter
the competitive landscape, even if they do not explicitly price CO2.
Some important externalities, increasingly captured in “shadow carbon prices” and
driving national policies, are:
Energy security: For many of the energy-short economies of Asia, renewable
energy provides an important hedging and diversification value. Economies like
China, Japan, Korea, and Taiwan are hugely exposed to global fossil fuel prices
and availability; greater use of renewable energy reduces this exposure. Policy
makers are acutely aware of this in many cases and may express that
awareness in the form of policy targets, FiTs, or other incentive programs for
renewable energy.
Local pollution: In China, aggressive regulation of coal plants has been
underway for years. But it wasn’t initially motivated by climate concerns; it was
motivated by local pollution, which has immediate health impacts. A typical coal
plant emits sulfur oxides, nitrogen oxides and particulate matters etc., which
cause acid rain, smog and other adverse environmental effects. These effects
have substantial negative impacts on the environment and public health, such as
shortening the lifespan of surrounding populations.
-
50
100
150
200
250
2001
2003
2005
2007
2009
2011
2013
2015
2017
2019
2021
2023
2025
2027
2029
Uti
lized
Cap
acit
y (
GW
)
Coal
PetroleumLiquids
Natural Gas
Nuclear
Renewables(Hydro, Wind,Solar etc)
-
50
100
150
200
250
20
01
20
03
20
05
20
07
20
09
20
11
20
13
20
15
20
17
20
19
20
21
20
23
20
25
20
27
20
29
Uti
lize
d C
ap
ac
ity (
GW
)
Coal
PetroleumLiquids
Natural Gas
Nuclear
Renewables(Hydro, Wind,Solar etc)
National policies to create clean energy still
contain risk and uncertainty

Citi GPS: Global Perspectives & Solutions December 2015
© 2015 Citigroup
44
Costs of Climate Adaptation: Governments are increasingly aware of the risks
to economies and agricultural systems, such as on rice, water etc. The prospect
of environmental stress in China could create public unrest – something that the
government monitors closely.

December 2015 Citi GPS: Global Perspectives & Solutions
© 2015 Citigroup
45
Part A Conclusion
Fossil fuel pricing, from oil to coal to natural gas, looks poised to stay lower for
longer as oversupply and slowing demand keep markets loose.
But fossil fuels aren’t the only thing getting cheaper. Solar and wind technologies
have undergone rapid technological advances in the last decade that have
brought costs down to increasingly competitive levels.
These two forces are leading to a global power struggle between renewable
energy and fossil fuels described in section 5.
In the interim, when the cost of renewable energy could still be higher than fossil
fuel technologies, even as renewable energy costs continue to fall, policy support
remains crucial to steer investments into renewables. But policy isn’t all pointing
one direction. In the US, for example, important tax incentives for wind and solar
are being phased out by 2017 unless Congress renews them. Whether Congress
extends renewable energy support policies should have a large impact on the
pace of renewable energy expansion before 2022 in the US.
While technology has thus far been the nexus of innovation in this area and will
continue to play a major role, finance looks poised to be at the frontier of cost
reduction going forward. Innovative financial products and technology cost
declines on the private side, combined with supportive policies on the public side
could bring about a new age of renewables growth.

Citi GPS: Global Perspectives & Solutions December 2015
© 2015 Citigroup
46
Part B: The Future of New Energy Financing With the high upfront capital costs of renewables, lowering financing costs is critical
and can potentially be achieved through financial innovations and public sector de-
risking measures. Financial innovations can help to lower the cost of capital, match
risk profiles in particular parts of a project to more appropriate sets of investors and
facilitate more effective recycling of capital. The public sector could also help de-risk
projects in ways that could sharply lower the cost of capital and expand the size of
private financing into renewable projects. In the US, policy support, tax credits, tax
equity treatment and subsidies have been instrumental. More broadly in the global
context, local power market design, policy orientation, public acceptance as well as
political, economic and financing conditions all imply different types of risks that
need to be priced in. Public sector measures could help mitigate these factors.
Figure 44. Financing Costs in 2015 by Region and Technology
Source: NREL, IRENA, IEA, EIA, Citi Research
Green finance includes a broad spectrum of financial instruments and institutions,
applicable globally in many cases. Sophisticated project finance could help steer
investments into green projects beyond traditional bank lending. The public equity
market through examples such as YieldCos, could provide an effective way for
project developers to recycle capital at the right valuation, although the sector has
suffered recently due to over-valuation and some companies having over-
expanded. Instead, private placement to private equity, large institutional investors
or strategic players, particularly in times of poor equity market performance, could
be another way of recycling capital for project developers to sell stakes or exit.
Strategic players, such as utilities or independent power producers (IPPs), have
been traditional buyers of projects. “Strategics” often have lower costs of capital
given the nature of their business, where regulated entities can rate-base their costs
to their consumers. Private equity is also active in the space. Many have raised
substantial amounts of funds to enter in the space, with leverage. Some large
institutional investors, who used to gain exposure via public equity and debt, are
buying at the asset level.
$0
$10
$20
$30
$40
$50
$60
$70
$80
$90
UnitedStates
OECD Asia DevelopingAsia
Europe LatAm
$2013/MWh Land-based Wind Solar - PV
Conventional - Coal Conventional - Gas
Green finance includes a broad spectrum of
financial instruments and institutions
globally; sophisticated project finance is
instrumental in pushing the field forward
December 2015 Citi GPS: Global Perspectives & Solutions
© 2015 Citigroup
47
Another development is green bonds. Green bonds are somewhat different from
other fixed income instruments, as they specify the use of proceeds to green
activities. By some measures, $36.6 billion of green bonds were issued in 2014,
driven by both new and refinancing activities. However, what defines ‘green’ and the
certification process can be rather involved causing some companies to shy away
from pursuing. The Green Bond Principles (GBP) are “voluntary process guidelines
that recommend transparency and disclosure and promote integrity in the
development of the Green Bond market by clarifying the approach for issuance of a
Green Bond. The GBPs are intended for broad use by the market as: (1) they
provide issuers guidance on the key components involved in launching a credible
Green Bond; (2) they aid investors by ensuring availability of information necessary
to evaluate the environmental impact of their Green Bond investments; and (3) they
assist underwriters by moving the market towards standard disclosures, which will
facilitate transactions.”25
Eighty-nine institutions, ranging from investors, issuers and
underwriters, have joined GBP as members and forty-five organizations have
observer status as of May 2015. Separately, the Climate Bonds Standard, which
grew out of the Climate Bonds Initiatives, is a “multi-sector standard that is certified
by a third party verifier…[and] consists of a certification process, pre-issuance
requirements, post-issuance requirements and a suite of sector-specific eligibility
and guidance documents.”
On the one hand, qualifying what is green would help establish the credibility of a
green bond and the green bond market as a whole. On the other hand,
requirements being too stringent at this nascent stage of green bond development
could discourage issuance. There is a natural tension between issuers, who may
like to have the green label to attract investors without undergoing a very stringent
set of qualifications, and investors, who may like to have a higher certainty that a
green bond indeed finances meaningful green activities. The green bond market is
still evolving.
Green banks, green funds and green loans are also public-sector sponsored entities
or initiatives that aim to provide financing, engage in public-private partnership,
transfer risk from the private sector to the public sector (e.g. through loan
guarantees) to attract private capital. The “Mission Innovation” initiative, as
announced at the start of the Paris conference, is a key example of public sector
involvement, as 20 countries have signed on pledging to double their investments in
clean energy R&D in the next five years. Meanwhile Bill Gates is leading a parallel
initiative called the “Breakthrough Energy Coalition” — a private-sector push
bringing early-stage energy programs into the marketplace. Together they could
form a potent public-private partnership in accelerating research and
commercialization.
Beyond these, we highlight in the report the following areas of development:
innovations in alternative energy finance, securitization, more complex hedging,
international project financing and the foreign exchange on financing projects
internationally.
25
http://www.icmagroup.org/Regulatory-Policy-and-Market-Practice/green-bonds/green-
bond-principles
Green bond issuance was $36.6 billion in
2014 and numbers are increasing in 2015
The stringency of the ‘green’ definition could
either help the credibility or discourage
issuance of green bonds

Citi GPS: Global Perspectives & Solutions December 2015
© 2015 Citigroup
48
Energy 2030: Financing Analysis Innovations in Alternative Energy Finance Financial innovation is now central to the growth and profitability of renewable
energy, as rapid market growth requires commensurate amounts of capital and
financing costs can contribute to as much as half the total cost of renewable energy.
Delivering growth in renewable energy therefore requires delivering the lowest cost
of capital with minimum amount of risk.
The competitiveness of renewable energy vs. fossil fuels depends on it. While
technologies like gas or coal-fired power can be cheaper in terms of upfront capital
invested, expensive and variable fuel procurement raises total costs.
Financing renewable energy growth requires meeting different challenges in
different regions. As we discuss below, in many parts of the world, project finance is
the leading method of developing renewable energy projects. Yet it is important to
note that alternative energy finance is not a “one size fits all” solution; the nature of
power markets, capital markets, and government incentives can vary significantly,
requiring adaptive approaches. For example, in Europe Feed-in-Tariffs were
extensively utilized to promote renewable energy, whereas in the USA, federal
government incentives relied heavily on tax credits to promote renewable energy.
The different government incentive programs lend themselves to different types of
financial solutions.
Many such issues are discussed in this section, including: the role of currency risk
in emerging markets, participation of Development Finance Institutions,
securitization of distributed energy production, hedging strategies for project
finance, and public sector de-risking measures. Additionally, new capital markets
instruments such as green bonds, green loans, and “green IPOs” might soon play a
larger role in both developed and developing economies. The solutions discussed
here are not exhaustive, but do offer insight into some of the most important and
promising strategies currently being used.
The section below explores the core alternative energy project finance strategies
which are critically important in many regions. In the sections that follow, the authors
drill down to present detailed analysis of key components of broader financing
strategies.
The Central Role of Project Finance
Non-recourse project finance is one of the most important strategies for sourcing
and delivering capital to clean energy projects. This area of finance focuses on
developing long-lived infrastructure through innovative structures that enable
funding of projects that might otherwise be too risky for single investors. As capital
intensive, long-lived infrastructure assets, most renewable energy falls into this
category. Citi has a long history in project finance – having famously financed the
Panama Canal – and is actively engaged in financing infrastructure of all types
around the globe.
The set of “renewable” technologies that that have benefited from project finance
strategies is broad and growing, having also benefitted from precipitous declines in
technology costs. Technology types that Citi and other financial institutions have
financed include (but are not limited to): 1) wind power; 2) utility scale solar; 3)
distributed and residential rooftop solar; 4) geothermal energy; 5) energy efficiency;
and, 6) renewable fuels and biofuels.
Marshal Salant
Head of Alternative Energy Finance Group,
Citi
Bruce Schlein
Director, Alternative Energy Finance Group,
Citi
Richard Morse
Associate, Alternative Energy Finance
Group, Citi
Non-recourse project finance is a strategy
for sourcing and delivery capital to clean
energy projects
The set of renewable technologies that have
benefited from project finance strategies is
broad and growing
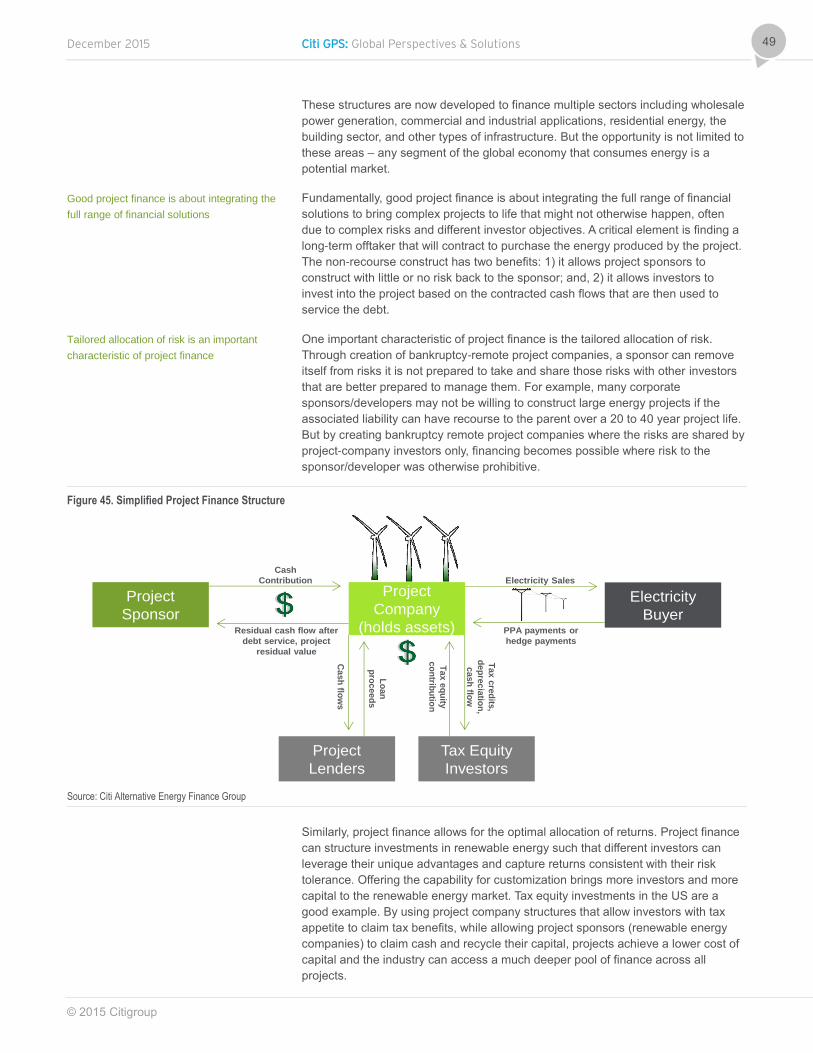
December 2015 Citi GPS: Global Perspectives & Solutions
© 2015 Citigroup
49
These structures are now developed to finance multiple sectors including wholesale
power generation, commercial and industrial applications, residential energy, the
building sector, and other types of infrastructure. But the opportunity is not limited to
these areas – any segment of the global economy that consumes energy is a
potential market.
Fundamentally, good project finance is about integrating the full range of financial
solutions to bring complex projects to life that might not otherwise happen, often
due to complex risks and different investor objectives. A critical element is finding a
long-term offtaker that will contract to purchase the energy produced by the project.
The non-recourse construct has two benefits: 1) it allows project sponsors to
construct with little or no risk back to the sponsor; and, 2) it allows investors to
invest into the project based on the contracted cash flows that are then used to
service the debt.
One important characteristic of project finance is the tailored allocation of risk.
Through creation of bankruptcy-remote project companies, a sponsor can remove
itself from risks it is not prepared to take and share those risks with other investors
that are better prepared to manage them. For example, many corporate
sponsors/developers may not be willing to construct large energy projects if the
associated liability can have recourse to the parent over a 20 to 40 year project life.
But by creating bankruptcy remote project companies where the risks are shared by
project-company investors only, financing becomes possible where risk to the
sponsor/developer was otherwise prohibitive.
Figure 45. Simplified Project Finance Structure
Source: Citi Alternative Energy Finance Group
Similarly, project finance allows for the optimal allocation of returns. Project finance
can structure investments in renewable energy such that different investors can
leverage their unique advantages and capture returns consistent with their risk
tolerance. Offering the capability for customization brings more investors and more
capital to the renewable energy market. Tax equity investments in the US are a
good example. By using project company structures that allow investors with tax
appetite to claim tax benefits, while allowing project sponsors (renewable energy
companies) to claim cash and recycle their capital, projects achieve a lower cost of
capital and the industry can access a much deeper pool of finance across all
projects.
Project
Sponsor
Electricity
Buyer
Project
Company
(holds assets)
Project
Lenders
Cash
Contribution
Tax c
red
its,
dep
recia
tion
,
cash
flow
PPA payments or
hedge payments
Electricity Sales
Residual cash flow after
debt service, project
residual value
Cash
flow
s
Tax Equity
Investors
Tax e
qu
ity
co
ntrib
utio
n
Lo
an
pro
ceed
s
Good project finance is about integrating the
full range of financial solutions
Tailored allocation of risk is an important
characteristic of project finance

Citi GPS: Global Perspectives & Solutions December 2015
© 2015 Citigroup
50
Delivering the optimal balance of risk and return through project finance means
lowering the cost of capital for renewable energy.
Citi Alternative Energy Finance
Financing renewable energy projects requires specialized skills in multiple areas of
finance – and the ability to successfully integrate them as a project requires.
Organized to find solutions for financing all types of alternative energy at the
cheapest cost of capital, Citi AEF has three principle roles in the market:
1. Integrating Citi’s wide array of existing financing solutions and tailoring them for
alternative energy.
2. Offering unique tax equity investment structures that enable the wind and solar
industries to tap cheaper capital and faster growth.
3. Developing new strategies and solutions for the rapidly evolving alternative
energy sector.
There are several fundamental components of Citi’s strategy for financing new and
growing markets in renewable energy and energy efficiency. A common thread
across all of these components is the ability to creatively adapt and combine
elements of traditional finance, and the notion of "stretching" across a number of
transaction attributes. “New” finance typically does not come out of the gate
optimally sized, from established market players, or with standardized executions.
Attaining these attributes is an important goal in developing a liquid and efficient
financing environment. Each key component is described below, along with an
illustrative example.
Application of Multiple Solutions
To help foster the development of the renewable energy and energy efficiency
markets, a host of financing, advisory and hedging strategies and services are
needed to manage risk and maximize return.
In some cases these will be existing strategies; in other cases the development of
new products is required. The ability to draw on a wide set of strategies and
approaches is critical for delivering efficient and cost effective financing solutions.
The following strategies and instruments can be utilized to finance large projects
and pools of small projects around the globe:
Construction Financing
Term Debt Financing (Bank Term Loans and Project Bonds (144A & 4(2) Private
Placements)
Mezzanine Financing (Mezzanine Debt, Leasing, Tax Equity)
Pool financing (Tax Equity: Inverted Leases, Debt: Asset-Backed Securities, and
Equity: REIT, MLP, YieldCo)
Derivatives Hedging (Interest Rate, FX, Commodities, Power)
Equity Financing (IPOs, follow-ons)
A host of financing, advisory and hedging
strategies and services are needed to
manage risk and maximize return
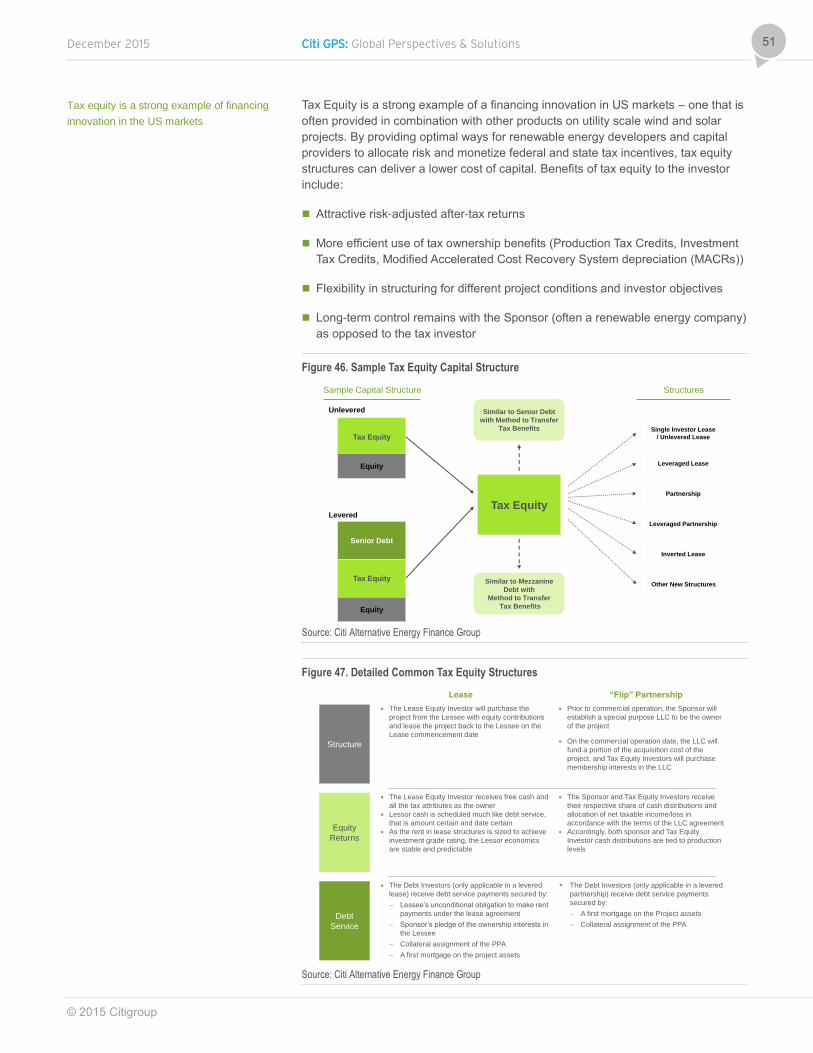
December 2015 Citi GPS: Global Perspectives & Solutions
© 2015 Citigroup
51
Tax Equity is a strong example of a financing innovation in US markets – one that is
often provided in combination with other products on utility scale wind and solar
projects. By providing optimal ways for renewable energy developers and capital
providers to allocate risk and monetize federal and state tax incentives, tax equity
structures can deliver a lower cost of capital. Benefits of tax equity to the investor
include:
Attractive risk-adjusted after-tax returns
More efficient use of tax ownership benefits (Production Tax Credits, Investment
Tax Credits, Modified Accelerated Cost Recovery System depreciation (MACRs))
Flexibility in structuring for different project conditions and investor objectives
Long-term control remains with the Sponsor (often a renewable energy company)
as opposed to the tax investor
Figure 46. Sample Tax Equity Capital Structure
Source: Citi Alternative Energy Finance Group
Figure 47. Detailed Common Tax Equity Structures
Source: Citi Alternative Energy Finance Group
Sample Capital Structure
Tax Equity
Unlevered
Single Investor Lease
/ Unlevered Lease
Equity
Senior Debt
Tax Equity
Equity
LeveredTax Equity
Leveraged Lease
Partnership
Leveraged Partnership
Inverted Lease
Structures
Similar to Senior Debt
with Method to Transfer
Tax Benefits
Similar to Mezzanine
Debt with
Method to Transfer
Tax Benefits
Other New Structures
Structure
Lease “Flip” Partnership
Equity
Returns
Debt
Service
The Lease Equity Investor will purchase the
project from the Lessee with equity contributions
and lease the project back to the Lessee on the
Lease commencement date
The Lease Equity Investor receives free cash and
all the tax attributes as the owner
Lessor cash is scheduled much like debt service,
that is amount certain and date certain
As the rent in lease structures is sized to achieve
investment grade rating, the Lessor economics
are stable and predictable
The Debt Investors (only applicable in a levered
lease) receive debt service payments secured by:
– Lessee’s unconditional obligation to make rent
payments under the lease agreement
– Sponsor’s pledge of the ownership interests in
the Lessee
– Collateral assignment of the PPA
– A first mortgage on the project assets
Prior to commercial operation, the Sponsor will
establish a special purpose LLC to be the owner
of the project
On the commercial operation date, the LLC will
fund a portion of the acquisition cost of the
project, and Tax Equity Investors will purchase
membership interests in the LLC
The Sponsor and Tax Equity Investors receive
their respective share of cash distributions and
allocation of net taxable income/loss in
accordance with the terms of the LLC agreement
Accordingly, both sponsor and Tax Equity
Investor cash distributions are tied to production
levels
The Debt Investors (only applicable in a levered
partnership) receive debt service payments
secured by:
– A first mortgage on the Project assets
– Collateral assignment of the PPA
Tax equity is a strong example of financing
innovation in the US markets

Citi GPS: Global Perspectives & Solutions December 2015
© 2015 Citigroup
52
The Shannon Wind Project, a 204 MW wind project in Texas sponsored by Alterra
Power Corporation and Starwood Energy Group illustrates the importance and
value of an integrated strategy that includes Tax Equity. In this case, Citi provided a
comprehensive solution for the Shannon Wind Project, combining a 13-year
physical power hedge (which provided revenue certainty to enable financing),
construction loan and letter of credit facilities (which provided cost effective
construction finance), and an unlevered tax equity partnership investment (which
structures an optimal risk/return profile for all parties involved).
Figure 48. Key Facts: Shannon Wind
Source: Citi Alternative Energy Finance Group
These structures can enable utility scale renewable energy development that might
not otherwise be possible. Several components of these kinds of transactions are
essential for delivering cheaper capital:
Optimal monetization of tax benefits: In the US market, two primary forms of
credits can be utilized by investors – Production Tax Credits (PTC) and
Investment Tax Credits (ITC), and Modified Accelerated Cost Recovery System
(MACRs) depreciation. Monetizing these benefits requires an investor with large
amounts of taxable income; many renewable energy developers are not able to
do this. Tax equity structures therefore are carefully crafted to allocate benefits to
each investor in a project such that the cost of capital is as low as possible. This
enables more projects to be financed at more competitive costs.
The Shannon Wind Project illustrates the
importance and value of an integrated
strategy that includes tax equity

December 2015 Citi GPS: Global Perspectives & Solutions
© 2015 Citigroup
53
Revenue certainty through hedging: Where more traditional power purchase
agreements (PPAs) are not available, hedges provide revenue certainty – and
therefore the ability to finance a project. Hedges can therefore greatly expand the
growth potential for key US wind and solar markets.
Addressing inter-creditor conflicts: Integrating construction loans, tax equity,
and hedging under one roof allows Citi to address potential inter-creditor conflicts
that might otherwise prevent a project from being financed. For instance, there is
often a conflict between the construction lender and hedge provider; both want
first liens on the assets. This can block financing where two parties cannot agree
on how to solve this issue. Citi has strategized to solve this problem in multiple
transactions by providing both construction finance and hedge, thereby
navigating through the conflict and allowing projects to be financed.
Connecting New Markets to Capital Markets: Market Segmentation
and Prioritization
New markets typically lack clear precedents for financing, and this can impede
access to capital markets even where there appear to be attractive opportunities
and returns. Energy efficiency is a prime example.
In the aggregate, and on many power point slides over the last decade, energy
efficiency is lauded a huge opportunity. McKinsey, in its 2009 report, “Unlocking
Energy Efficiency in the US Economy” indicates, “the potential to reduce annual
non-transportation energy consumption by roughly 23 percent by 2020, eliminating
more than $1.2 trillion in waste—well beyond the $520 billion upfront investment
(not including program costs) that would be required”.
However, tapping this opportunity has until recently proved challenging due to a
high degree of market fragmentation across a number of dimensions. Those
include: different possible property improvement measures and types and lack of
simple, easily available project implementation and financing tools for property
owners that can be standardized for investors. Potential measures to realize the
$1.2 trillion in energy savings include everything from insulation and more efficient
appliances in single family homes to new lighting technologies in school systems to
heating and ventilating systems for large commercial and industrial facilities.
Property types and their respective underlying ownership structures also vary
widely. Taken together, these characteristics do not lend themselves to
standardization and aggregation in ways required for scalable, capital markets
finance solutions; solutions that have been widely available in markets such as auto
loans or credit card receivables. Innovative finance is therefore critical to unlocking
the energy efficiency opportunity.
To address this issue and help the market to break down and access the
overarching energy efficiency opportunity, Citi developed an Energy Efficiency
Finance Framework. The Framework breaks the market down by finance
product/solution and property type (underlying owners and “credits”), the
intersections of which are color-coded and tagged by an estimation of “doability”.
Solutions include unsecured and a number of secured forms of lending, including
Property Assessed Clean Energy (PACE), where loans are repaid on the property
tax bill and secured by a lien on the property, and Utility On-Bill Repayment (OBR),
where loans are repaid on the utility bill and secured by remedies available to the
utility.
Lack of clear precedents for financing can
impede access to capital market even if
there are attractive opportunities and returns
Market fragmentation has made unlocking
energy efficiency challenging
The Energy Efficiency Finance Framework
helps to break down and access the
overarching energy efficiency opportunity

Citi GPS: Global Perspectives & Solutions December 2015
© 2015 Citigroup
54
Citi uses this tool to help develop and disseminate market knowledge among public,
non-profit and private sector market actors in a way that can help develop more
mature markets. Successive iterations of the framework have been presented over
the last four years at the annual Citi-Environmental Defense Fund (EDF) energy
efficiency finance conference; the last of which was held on October 22, 2015 in
New York.
This tool also helps segment the huge potential for energy efficiency investment into
a more accessible opportunity, and the makings of a new asset class that can be
more easily financed by a wide investor base. The warehouse for energy efficiency
loans (WHEEL), a Single Family, Pooled Asset Deal, was identified as a market-
making opportunity given the existence of a pipeline of efficiency activity, historical
performance data, and the availability of FICO scores to measure credit risk (unique
to this property type). Recent transactions demonstrate the potential.
Citi and Renew Financial, the WHEEL Administrator, completed the first
securitization from WHEEL on June 18, 2015; which represented a first-to-market
energy efficiency asset-backed security (ABS). With a now established and scalable
financing model, a much deeper pool of capital can be brought to bear on the
immense opportunity that is energy efficiency investment.
Figure 49. Energy Efficiency Financing Solutions
Product / Solution
MUSH Federal/DOD Single Family Multifamily Commercial Corporate
Large Single Project
Yes Yes N/A Yes Yes Yes
Pooled Asset Deal
Yes Yes Yes Difficult Difficult Yes
ESCO/ESA Two Factor
Yes Yes N/A Difficult Difficult Yes
PACE Yes N/A N/A Yes Yes Yes
On-Bill (OBR) Yes N/A Yes Yes Yes Yes
Stranded Cost Tariff
Yes N/A Yes Yes Yes Yes
Green Bond Yes N/A N/A N/A N/A Yes
Sustainable Energy Utility
Yes N/A N/A N/A N/A N/A
Microfinance N/A N/A Yes N/A Yes N/A
Source: Citi Alternative Energy Finance Group
Win-Win Finance: Public Private Partnerships
Public Private Partnerships (PPP) represent opportunities for public entities to
catalyze or complement private market actors where objectives are aligned. Public
entities can help fill critical gaps in transactions that otherwise would not get done
without their participation. In successful cases the PPP is structured in such a way
so that the public role can be supplanted by private.
PPP represent opportunities for public
entities to catalyze or complement private
market actors

December 2015 Citi GPS: Global Perspectives & Solutions
© 2015 Citigroup
55
For renewable energy and energy efficiency markets, public entities can play an
important role by promoting policies and standards, providing indirect or direct
financial support, and establishing programs. All of these activities help leverage
private capital for important public objectives.
WHEEL is an excellent example of a PPP that has performed in this way. Actually,
WHEEL is more than a PPP given the involvement of philanthropies and non-profits
that helped create and develop WHEEL in advance of the participation of both
public and private players. Philanthropies such as Rockefeller Foundation, non-
profits such as the Energy Programs Consortium, and governments such as the
State of Pennsylvania were instrumental in conceiving and developing WHEEL.
Public entities were engaged in WHEEL in the following roles:
State of Pennsylvania Treasury: Pennsylvania’s Keystone HELP program, a state
energy efficiency program, provides the essential pipeline of loans and historical
data that was used to “prime the pump” of WHEEL. Pennsylvania Treasury roles,
with respect to Keystone HELP, included provision of funds, program design and
implementation. State of Pennsylvania Treasury was also a co-investor with Citi
in the warehouse facility.
Kentucky Home Performance: provides pipeline of loans
Greater Cincinnati Energy Alliance HELP: provides pipeline of loans
U.S. Department of Energy (DOE): through the provision of funds from the
American Recovery and Reinvestment Act (ARRA), DOE has supported the
establishment of energy efficiency programs across the U.S., as well as approval
for states to use ARRA funds in support of their participation in WHEEL.
WHEEL is just one example of the importance of collaboration between public and
private entities for supporting new market development in renewable energy and
energy efficiency, through PPPs and other mechanisms, such as loan guarantees
and tax benefits as illustrated in the aforementioned example of tax equity.
Conclusion
Technology, economics, and policy are converging around a future that will demand
a greater deployment of alternative energy solutions. Innovative finance that
provides enhanced opportunities for alternative energy investments to deliver
attractive returns at lower risks is now a critical lynchpin for delivering that future.
But there is no “one size fits all” solution for the rapidly changing alternative energy
landscape in the US and internationally. Fully capturing the opportunity at hand will
require innovative finance to continually bring new tools and transactions to the
market in pursuit of the most efficient solutions.
Based on Citi’s experience across transaction types, results are clear and
meaningful: greater access to capital for clean energy, cheaper capital for clean
investments, optimal structuring of risk and returns, a deepening investor base, and
the delivery of cleaner energy at scale in markets comprised of projects from
household to utility scale. And while the contribution of innovative finance to clean
energy development has already been significant, we are likely seeing the
beginnings of new markets and the benefits that can be delivered. This section has
outlined key frameworks and elements of innovative renewable energy finance. In
the sections that follow, the authors dig deeper into important transaction types that
are fundamental parts of many renewable energy finance strategies.
WHEEL is an excellent example of a PPP
that has helped leverage private capital for
important public objectives
Innovative financing that provides enhanced
opportunities for alternative energy
investments to deliver attractive returns at
lower risks is a critical lynchpin

Citi GPS: Global Perspectives & Solutions December 2015
© 2015 Citigroup
56
Energy 2030: ABS Analysis Securitization Solutions for a Greener Planet Mother Earth = Mother Lode Energy Savings
Clean energy is not only good for Mother Earth but it is fostering significant
commercial opportunity and is expected to be a source of rapid economic growth in
the years ahead. Whole new industries have sprung up in the new Millennium, like
solar and wind, while biomass, clean water and geothermal have been around for
decades. Americans purchased more than 320 million ENERGY STAR-certified
products in 2014 across more than 70 product categories for a cumulative total
exceeding 5.2 billion products since 199226
. ENERGY STAR is a key Environmental
Protection Agency (EPA) initiative to develop national programs, policies, and
regulations for reducing US air pollution. In 2014, the EPA estimates that US
consumers and businesses reduced utility bills by $34 billion and reduced
greenhouse gas emissions by 300 million metric tons27
. Investments in energy-
efficient technologies and practices will continue to provide cost savings for years to
come. For details, please see the report “Securitization Solutions for a Greener
Planet” (Nov’15)
Figure 50. ENERGY STAR Program Benefits Have Doubled in the Last Five Years
Source: US Environmental Protection Agency. ENERGY STAR 2014 List of Achievements
The securitization market has played a small role in green energy capital formation
thus far, and could play an even more prominent role in the years ahead, given
appropriate structures and other terms and conditions. In order for this to happen,
however, we think the asset-backed security (ABS) market can best contribute to
the goal of reducing the cost of financing green energy for consumers and
businesses by adopting a simple and standardized structure. Of the “green”
securitizations done to date, we think structures based on the WHEEL program
have the most potential to conform to this standard and gain wide market
26
www.energystar.gov; “2014 Overview of Accomplishments”. 27
Ibid.
0
500
1,000
1,500
2,000
2,500
3,000
Energy Savings
Billions KWh
Mary Kane
Head of Global Securitized Products
Research, Citi
Eugene Belostotsky
US Consumer ABS Strategy, Citi
When the ITC expires at the end of 2016,
will probably position securitization as a
more attractive financing solution than lease
or other financing.

December 2015 Citi GPS: Global Perspectives & Solutions
© 2015 Citigroup
57
acceptance.2829
Expiration of the ITC in 2016 will also have a bearing on future
green ABS economics. We discuss the WHEEL program in more detail and the
structure of the inaugural 2015 securitization (RF 2015-1/ RenewFund Receivables
Trust) based on WHEEL and also comment on what we see as the limitations of
some alternative green energy securitization structures (such as solar lease and
PACE liens) in the report.
Why WHEEL Represents the Future
WHEEL is an effective structure for financing sustainable energy and represents the
future of the ABS market, in our view, for the following reasons:
Simple and transparent. WHEEL loans are simple fixed-rate closed-end
unsecured installment loans to high-credit-quality residential homeowners that
meet stringent income ratio and other conservative underwriting measures
established by the participating state.
No “security” delusion. Unsecured loans avoid the trap of over-relying on the
value that collateral adds to the loan.
– Solar lessors typically do not repossess the collateral as solar panels have
experienced quality, technological obsolescence and other problems
historically, and the collateral value is uncertain. There is also some evidence
that solar leases depreciate the property value and make it more difficult to sell
because buyers are reluctant to take on long-term leases. These long-term
leases are sometimes off-market because the equipment cost often drops
from the initial lease date.
– PACE liens are thorny: the Federal Housing Finance Agency (FHFA) opposes
super-priority liens in front of the first mortgage provider and stated in
December 2014 that it would aggressively initiate actions toward this end. The
FHFA has directed the government-sponsored enterprises (GSEs) not to buy
mortgages on properties with PACE liens and there is evidence that homes
with PACE liens are more difficult to sell30
. However:
• PACE more inclusive / California (CA) reserve fund. Contractors would
like to have multiple financing solutions for jobs they quote and PACE is a
possible solution for consumers who do not qualify for unsecured financing.
This makes the PACE program more inclusive for “green” consumers. The
State of California set up a reserve fund to defray lenders’ PACE lien risk on
foreclosed properties.
Standardization. The WHEEL underwriting standards are conservative and well-
documented on the lender’s website. The program guidelines and use of
proceeds are tightly supervised and the receivables are written using
standardized documentation.
28
Toyota has structured and priced several “green” securitizations which represent
securitizations for hybrid and other energy efficient vehicles. This asset class is already
an on-the-run ABS and benefits from document standardization, long collateral history
and extensive disclosure. These standard ABS programs dressed up as “green” have
been highly successful and are outside the scope of this report, which examines more
esoteric assets. 29
Securitizations of LEED-certified commercial buildings, commercial real estate retro-
fitting and other commercial “green” projects are also outside the scope of this report. 30
“Green Financing Has Hobbled Home Sales in California”, by Nichola Groom, Reuters,
October 19, 2015.
WHEEL is an effective structure for
financing sustainable energy and represents
the future of the ABS market.
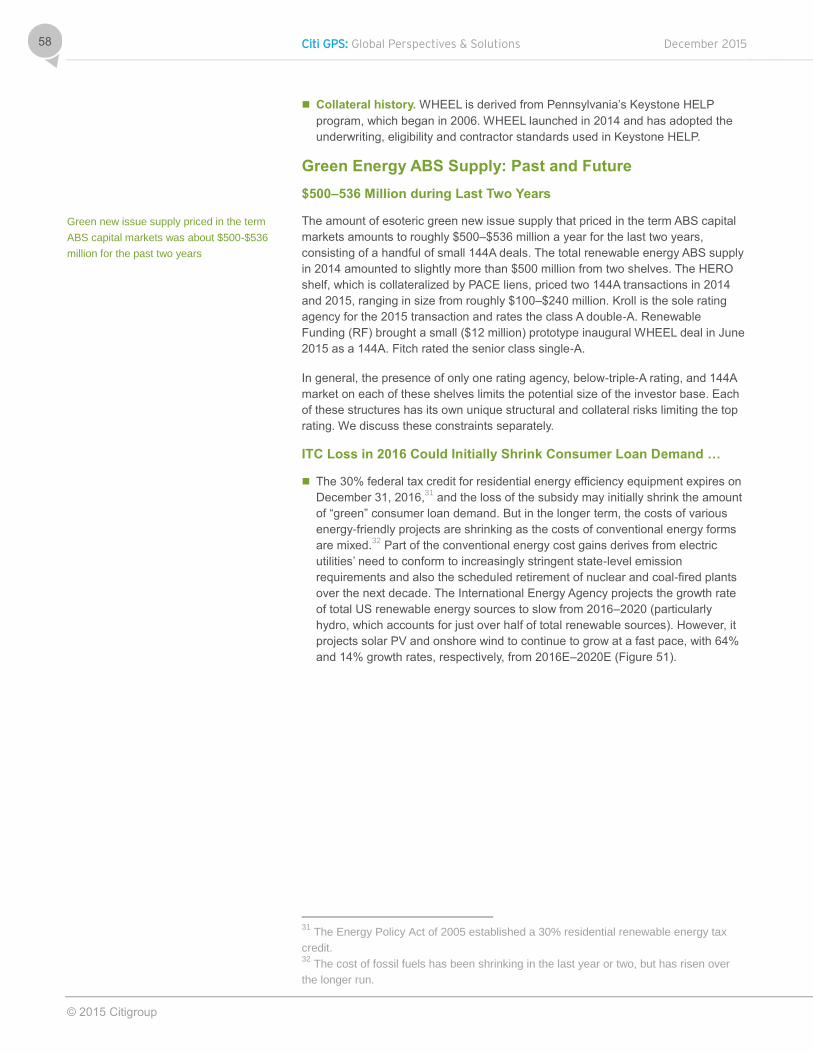
Citi GPS: Global Perspectives & Solutions December 2015
© 2015 Citigroup
58
Collateral history. WHEEL is derived from Pennsylvania’s Keystone HELP
program, which began in 2006. WHEEL launched in 2014 and has adopted the
underwriting, eligibility and contractor standards used in Keystone HELP.
Green Energy ABS Supply: Past and Future
$500–536 Million during Last Two Years
The amount of esoteric green new issue supply that priced in the term ABS capital
markets amounts to roughly $500–$536 million a year for the last two years,
consisting of a handful of small 144A deals. The total renewable energy ABS supply
in 2014 amounted to slightly more than $500 million from two shelves. The HERO
shelf, which is collateralized by PACE liens, priced two 144A transactions in 2014
and 2015, ranging in size from roughly $100–$240 million. Kroll is the sole rating
agency for the 2015 transaction and rates the class A double-A. Renewable
Funding (RF) brought a small ($12 million) prototype inaugural WHEEL deal in June
2015 as a 144A. Fitch rated the senior class single-A.
In general, the presence of only one rating agency, below-triple-A rating, and 144A
market on each of these shelves limits the potential size of the investor base. Each
of these structures has its own unique structural and collateral risks limiting the top
rating. We discuss these constraints separately.
ITC Loss in 2016 Could Initially Shrink Consumer Loan Demand …
The 30% federal tax credit for residential energy efficiency equipment expires on
December 31, 2016,31
and the loss of the subsidy may initially shrink the amount
of “green” consumer loan demand. But in the longer term, the costs of various
energy-friendly projects are shrinking as the costs of conventional energy forms
are mixed.32
Part of the conventional energy cost gains derives from electric
utilities’ need to conform to increasingly stringent state-level emission
requirements and also the scheduled retirement of nuclear and coal-fired plants
over the next decade. The International Energy Agency projects the growth rate
of total US renewable energy sources to slow from 2016–2020 (particularly
hydro, which accounts for just over half of total renewable sources). However, it
projects solar PV and onshore wind to continue to grow at a fast pace, with 64%
and 14% growth rates, respectively, from 2016E–2020E (Figure 51).
31
The Energy Policy Act of 2005 established a 30% residential renewable energy tax
credit. 32
The cost of fossil fuels has been shrinking in the last year or two, but has risen over
the longer run.
Green new issue supply priced in the term
ABS capital markets was about $500-$536
million for the past two years
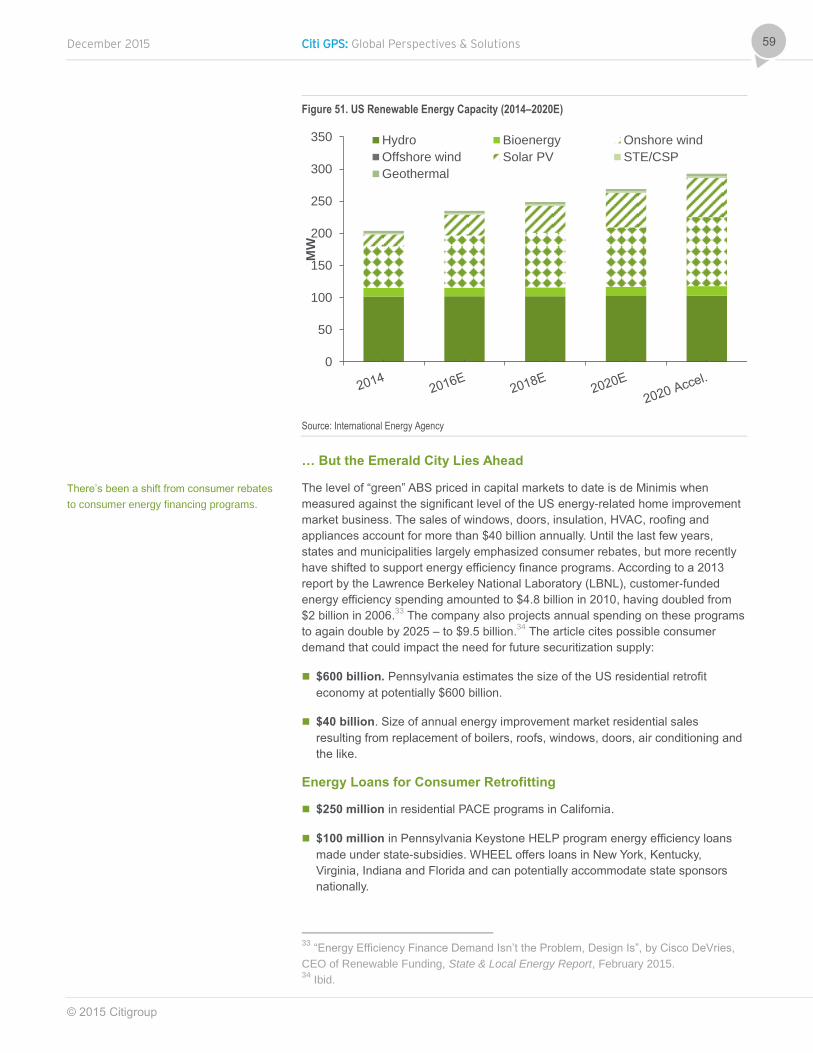
December 2015 Citi GPS: Global Perspectives & Solutions
© 2015 Citigroup
59
Figure 51. US Renewable Energy Capacity (2014–2020E)
Source: International Energy Agency
… But the Emerald City Lies Ahead
The level of “green” ABS priced in capital markets to date is de Minimis when
measured against the significant level of the US energy-related home improvement
market business. The sales of windows, doors, insulation, HVAC, roofing and
appliances account for more than $40 billion annually. Until the last few years,
states and municipalities largely emphasized consumer rebates, but more recently
have shifted to support energy efficiency finance programs. According to a 2013
report by the Lawrence Berkeley National Laboratory (LBNL), customer-funded
energy efficiency spending amounted to $4.8 billion in 2010, having doubled from
$2 billion in 2006.33
The company also projects annual spending on these programs
to again double by 2025 – to $9.5 billion.34
The article cites possible consumer
demand that could impact the need for future securitization supply:
$600 billion. Pennsylvania estimates the size of the US residential retrofit
economy at potentially $600 billion.
$40 billion. Size of annual energy improvement market residential sales
resulting from replacement of boilers, roofs, windows, doors, air conditioning and
the like.
Energy Loans for Consumer Retrofitting
$250 million in residential PACE programs in California.
$100 million in Pennsylvania Keystone HELP program energy efficiency loans
made under state-subsidies. WHEEL offers loans in New York, Kentucky,
Virginia, Indiana and Florida and can potentially accommodate state sponsors
nationally.
33
“Energy Efficiency Finance Demand Isn’t the Problem, Design Is”, by Cisco DeVries,
CEO of Renewable Funding, State & Local Energy Report, February 2015. 34
Ibid.
0
50
100
150
200
250
300
350
MW
Hydro Bioenergy Onshore wind
Offshore wind Solar PV STE/CSP
Geothermal
There’s been a shift from consumer rebates
to consumer energy financing programs.

Citi GPS: Global Perspectives & Solutions December 2015
© 2015 Citigroup
60
How WHEEL Works: Kickoff ABS Deal
After growing its energy efficiency loan portfolio to $45 billion from 2006–2010, the
state of Pennsylvania’s Keystone Home Energy Loan Program (HELP) realized it
would deplete its available public funds and sought private capital to form a
partnership funded by foundation, private and public funds:
– The Ford, Rockefeller, Surdna, and Energy Foundations, and the DOE
provided the initial WHEEL funding.
– Several banks provide warehouse financing for the energy efficiency
consumer loan originations.
– WHEEL launched in 2014 with Pennsylvania and Kentucky as the first state
sponsors providing capital to support the program. WHEEL bundles the loans
into diversified pools to collateralize rated term asset-backed securities.
A Secondary Market for Energy Efficiency Lending
The goal of the Warehouse for Energy Efficiency Lending (WHEEL) is to create a
secondary market for residential clean energy loans in order to source lower-cost
capital for state and local energy loan programs. WHEEL purchases unsecured
residential energy efficiency loans from participating programs such as Keystone
HELP and Kentucky’s Home Performance loan program and packages the loans
into diversified pools to collateralize ABS. A $100 million line of credit from a bank
and the Pennsylvania Treasury officially launched the program in April 2014.35
Kentucky joined in October 2014 with $20 million of loans. In addition to the State of
Pennsylvania (PA), the State of New York (NY), the Commonwealth of Kentucky
(KY), the State of Indiana (IN), the State of Florida (FL), the Commonwealth of
Virginia (VA) and the Greater Cincinnati Energy Alliance have all joined the WHEEL
program, and additional states are expected to join soon.
Benefits of the WHEEL Program
Access to national scale, low-cost financing. The purchase and aggregation
of personal installment loans for energy efficiency via bank conduit facilities
should provide access to funds at a low cost to consumers. Some of the program
guidelines are as follows:
– Fixed-rate (contemplated to be <10%)
– 5-, 7- and 10-year (10YR) terms
– 640+ FICO scores
35
Ibid.
PA, KY and FL joined in 2014. NY, IN, VA
and others are also members and several
more states are examining the program.

December 2015 Citi GPS: Global Perspectives & Solutions
© 2015 Citigroup
61
Renewable Funding (RF): Principal Parties
AFC First Financial Corp: RF Servicer / Wells Fargo Bank: Backup
Servicer
AFC is a non-bank Pennsylvania consumer energy lender, founded in 1947 and
was recently acquired by Renew Financial of Oakland, California (see below). AFC
has specialized exclusively in residential energy efficiency lending since 1999. It is a
leader in residential energy-efficiency and renewable lending and rebate programs.
It operates nationally in partnership with states, utilities, manufacturers and
municipalities. It offers programs through 4,000 approved contractors which sell,
install and service high efficiency heating, air conditioning, weatherization and other
renewable energy projects. Contractors have a tremendous influence on a
customer’s decision on how they will pay for an energy efficiency upgrade. The
lender trains contractors how to effectively make affordability of energy efficiency a
key part of every sales proposal and evaluation.
AFC originates loans in all 50 states and Washington D.C. AFC’s “EnergyLoan”
program is for homeowners who meet the program’s eligibility guidelines. These
customers can get a low cost, low payment loan for qualified improvements
including: high efficiency heating, air conditioning, air sealing, insulation, windows,
and “whole house” improvements. Special loan terms can help save significant
costs over the life of the loan, enhancing the positive financial impact of energy
savings and minimizing out of pocket costs. EnergyLoan’s interest rate is fixed and
the loan maturity terms are longer than what is typically available at a bank. AFC’s
website discloses some of the following attributes for these loans:
Figure 52. Selected Attributes of Renewable Energy Loans Made by AFC
Eligible Projects Some Origination Standards
Heating & Cooling Systems Loan amounts from $1,000 to $25,000
Water Heaters 100% financing
Windows & Doors Unsecured
Insulation - All Types Low fixed-rate, fixed monthly payments
Roofing & Siding No lien filing on the residence
Solar PV & Solar Thermal No home equity required: new homeowners OK
Geothermal Heat Pumps No points, fees or closing costs
Lighting & Controls Repayment up to 10 years — no prepay penalty
Electrical & Plumbing Work must be done by approved contractor
Heated Sunrooms Primary residence (1–2 unit) or vacation home on permanent foundation
Most other Energy-Related Improvements
Source: Company Reports
Renewable Funding Group, Inc., Oakland, CA
Renewable Funding Group, Inc. (RFG) was founded in 2009 to develop innovative
financing and technology solutions for the US transformation to clean energy. Its
affiliate, Renew Financial, acquired Pennsylvania-based AFC First Financial
Corporation, one of the nation’s premier lenders specializing in the energy efficiency
home improvement market in early October. It did not disclose the terms of the
transaction. RFG is the master servicer for the RF shelf.
Renew’s founder, Cisco DeVries, invented the PACE lien program for local and
state governments while serving as the chief of staff for the mayor of Berkeley, CA.
Scientific American magazine termed the PACE program solution as one of the top
20 “world changing” ideas in 2009. Several private equity funds rank among the
company’s principal investors, including Apollo Investment Corporation, Angeleno
Group, NGEN Partners and Claremont Creek Ventures. Renew Financial operates

Citi GPS: Global Perspectives & Solutions December 2015
© 2015 Citigroup
62
in 10 states and 150 communities. It also operates in Melbourne, Australia. The
states include: Maryland, California, Colorado, Washington DC, Oregon, Louisiana,
New Mexico, Florida and Illinois.
RF Structure and Credit Enhancement
We would expect future securitizations to closely mirror the inaugural RF deal and
as more states add assets to the program, the collateral mix will likely have greater
geographical diversity and transaction sizes would have more scale. The kickoff RF
deal structure consists of one senior class A rated single-A by Fitch. Credit
enhancement consists of overcollateralization, a yield supplement account (YSOC),
a reserve fund and excess spread. The senior class has an expected 2.3YR WAL
and is optionally callable when the receivables balance is equal to 20% of the cutoff
pool balance. Figure 53 shows the initial capitalization of the trust at the closing
date.
Figure 53. Renewable Funding Receivables Trust, Initial Capitalization at Closing
Amount WAL (YRS) % of Pool Credit Enh (%).
Class A 12,580,000.00 2.28 79.7 21.3
Overcollateralization 3,208,381.50 20.3
Pool balance 15,788,381.50 100.0
YSOC 2,411,369.72 15.3
Reserve fund 157,883.82 1.0
Source: Prospectus
Overcollateralization. The initial overcollateralization (OC) amounts to
approximately 20.3% of the cutoff pool balance. Going forward, any excess cash
flow will be available to build and maintain the target OC. The target OC will
equal the lesser of:
– (i) the sum of (a) 10.0% of the pool balance as of the last day of the related
collection period and (b) 13.0% of the cutoff date pool balance and
– (ii) the pool balance as of the last day of the related collection period.
Collateral Risks & Mitigants
4. Origination Network / Contractor Qualification Standards
The origination channel for any consumer loan is typically a point of potential
vulnerability — WHEEL uses a network of over 7,000 pre-approved and managed
contractors to deploy its financing. Contractors must be approved to access WHEEL
financing for their customers. Contractor approval requirements include:
Minimum time in business;
History of financial stability;
Minimum net worth criteria;
Satisfactory company and personal credit histories;
Satisfactory Better Business Bureau rating; and
Satisfactory customer and trade references.

December 2015 Citi GPS: Global Perspectives & Solutions
© 2015 Citigroup
63
WHEEL actively monitors its approved contractors and takes remedial action when
required, terminating contractors for poor performance or failure to maintain the
minimum WHEEL contractor requirements. These standards mirror the
Pennsylvania Keystone HELP program which has been in existence since 2006.
5. New Asset Class / Lack of Historical Data / Mirrors 2006 Program
The Pennsylvania State Treasury launched Keystone HELP in 2006, with AFC as
the loan originator and servicer and the WHEEL program adopted the identical
underwriting, eligibility and contractor standards as those used in Keystone HELP.
AFC continues as the originator and servicer for energy efficiency loans originated
under the WHEEL program.
6. Unsecured Lending but High-FICO Obligors with Motivation to Pay
While the energy efficiency loans are unsecured, the obligor credit characteristics
compare favorably to marketplace loans and credit card trusts in terms of average
FICO distribution, loan amount and loan purpose.
Motivated payers. We think consumers would be more motivated to pay energy
efficiency loans than general purpose installment loans because it saves them
money on their utility bills and the discount equips them with cash flow for debt
service. There is also an argument that environmentally conscious consumers
are better educated and motivated to do the right thing.
Strong credit quality. Two-thirds of the inaugural deal had a FICO score of 725
or better and the weighted average FICO was 749 (right-hand panel of Figure
54). These metrics compare very favorable to typical marketplace securitizations
that have come to the ABS market (middle panel) and to the credit card industry
(left-hand panel). The purpose of the vast majority of marketplace loans is to
consolidate credit card debt, which would not rank very highly as a debt priority
through a full credit cycle, in our view.
Figure 54. Comparative Credit Scores
Credit Card Industry Average
Marketplace ABS
Energy efficiency loans
Source: Prospectuses Source: Prospectuses Source: Prospectuses
Loan amount. The energy efficiency loan balances compare favorably to
average marketplace loan balances (Figure 55 ) and are more in line with
average credit card balances (Figure 56) for consumers which run a balance.
While the average borrower income for energy efficiency loan is not disclosed,
we would expect it to be comparable to marketplace loans, which ranks in the
60–89.9th
income percentiles. Lower balances and favorable interest rates imply
that energy efficiency borrowers are less leveraged than marketplace borrowers.
0%
10%
20%
30%
40%
50%
60%
70%
< = 600 601--660 661--720 > 720
Credit card trust avg. FICO 65% = > 720
0%7%
62%
31%
0%
20%
40%
60%
80%
< = 600 601--660 661--720 > 720
706 WA FICO
Marketplace FICO Distribution
31% = > 720
0%5%
30%
65%
0%
20%
40%
60%
80%
< = 600 601--660 661--724 > 725 +
749 WA FICO
Renew Fund FICO Distribution
65% = > 720
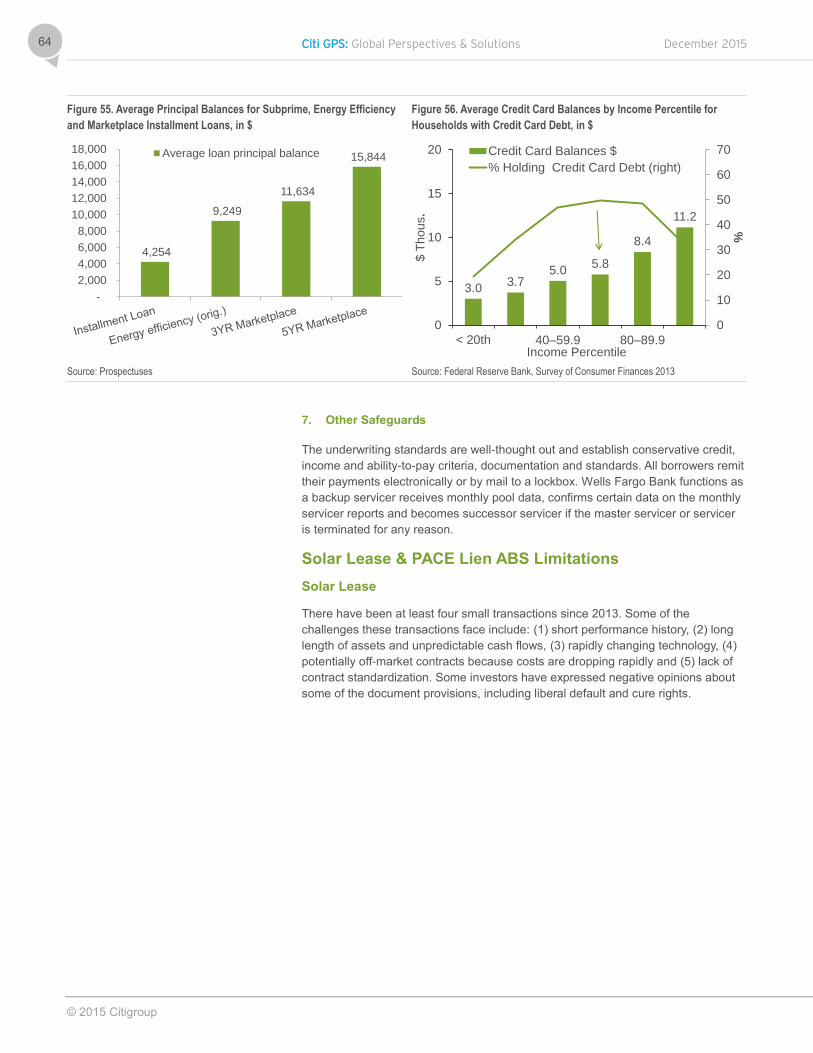
Citi GPS: Global Perspectives & Solutions December 2015
© 2015 Citigroup
64
Figure 55. Average Principal Balances for Subprime, Energy Efficiency
and Marketplace Installment Loans, in $
Figure 56. Average Credit Card Balances by Income Percentile for
Households with Credit Card Debt, in $
Source: Prospectuses Source: Federal Reserve Bank, Survey of Consumer Finances 2013
7. Other Safeguards
The underwriting standards are well-thought out and establish conservative credit,
income and ability-to-pay criteria, documentation and standards. All borrowers remit
their payments electronically or by mail to a lockbox. Wells Fargo Bank functions as
a backup servicer receives monthly pool data, confirms certain data on the monthly
servicer reports and becomes successor servicer if the master servicer or servicer
is terminated for any reason.
Solar Lease & PACE Lien ABS Limitations
Solar Lease
There have been at least four small transactions since 2013. Some of the
challenges these transactions face include: (1) short performance history, (2) long
length of assets and unpredictable cash flows, (3) rapidly changing technology, (4)
potentially off-market contracts because costs are dropping rapidly and (5) lack of
contract standardization. Some investors have expressed negative opinions about
some of the document provisions, including liberal default and cure rights.
4,254
9,249
11,634
15,844
-
2,000
4,000
6,000
8,000
10,000
12,000
14,000
16,000
18,000 Average loan principal balance
3.03.7
5.05.8
8.4
11.2
0
10
20
30
40
50
60
70
0
5
10
15
20
< 20th 40–59.9 80–89.9
%
$ T
hous.
Income Percentile
Credit Card Balances $
% Holding Credit Card Debt (right)

December 2015 Citi GPS: Global Perspectives & Solutions
© 2015 Citigroup
65
PACE Liens
In qualifying states or localities, residential or commercial property owners may take
out a loan to improve the energy efficiency of a dwelling on the property. A PACE
lien is similar to a tax lien, as it confers a super senior lien on the financed real
estate, which is also superior to the first mortgage loan. Prior to 2009, only
California and Colorado had enacted PACE loan legislation. Since that time, 32
states and the District of Columbia have authorized local governments to create
PACE financing programs. Most states confer a super-senior priority lien status on
PACE loans, similar to a tax lien. But in recognition of the FHFA’s opposition to the
super-senior lien, a few states have enacted legislation that grants PACE loans a
subordinate lien instead. Oklahoma, Maine and Vermont downgraded the lien status
to subordinate, for instance (Figure 57).
Figure 57. US States Offering PACE Loan Incentives for Renewable Energy and Energy
Efficiency as of Jan 2014
State Lien status State Lien status State Lien status
AR Super-senior MD Super-senior OH
CA Super-senior ME Subordinate OK Subordinate
CO Super-senior MI Super-senior OK Super-senior
CT Super-senior MN Super-senior OR Super-senior
DC Super-senior MO Super-senior RI
FL Super-senior NC Super-senior TX Super-senior
GA Super-senior NH Super-senior UT
HI Super-senior NJ Super-senior VA Super-senior
IL Super-senior NM Super-senior VT Subordinate
LA Super-senior NV Super-senior WI Super-senior
MA Super-senior NY Super-senior WY Super-senior
Source: US Department of Energy and PACE Now.
Typical PACE Program Underwriting Standards36
1. Homes must have 15% or more positive equity
2. Residential Projects limited to 10% of home value
3. Energy audit and work performed by accredited professionals
4. Projects must show cash flow savings (positive Savings/Investment Ratio)
The PACE program assessment ranks pari pasu with tax liens (in all jurisdictions
but Vermont), with a super-priority interest in the property that is senior to the first
mortgage holder. Theoretically, the sale of the property would not trigger a required
PACE loan prepayment, and the assessment is supposed to remain with the
property until paid as scheduled. In practice, Agency lenders will not make new
mortgage loans against PACE-lien properties and since the Agencies grant the vast
majority of new mortgages today, the PACE lien must be satisfied prior to voluntary
sale of the property. In foreclosure proceedings, the lien remains with the property,
and only the amount in arrears needs to be brought current.
36
Sonoma County Energy website.

Citi GPS: Global Perspectives & Solutions December 2015
© 2015 Citigroup
66
Summary: ABS Offers Green Pastures for Energy Financing
All forms of renewable energy are expanding, and we expect the ABS market to
play a part in its growth. The most likely source of significant deal flow is from the
WHEEL program. This takes the form of making a direct unsecured personal loan to
the consumer and is “cleaner” than other forms of financing for renewable energy
program financing. More delinquency and default data is needed in the public
domain, but we would expect the losses on these types of loans to be low, given the
cost savings involved in the projects. It is difficult to project a firm supply number,
but we would expect more term ABS financing to come to market in the year ahead.
We expect the ABS market to expand and
believe the most likely source of significant
deal flow is from the WHEEL program

December 2015 Citi GPS: Global Perspectives & Solutions
© 2015 Citigroup
67
Energy 2030: Financing Analysis Renewable Energy Project Structuring and Hedging in the US The presence of the production tax credit (PTC)
37 legislation and prevalence of
corporate sustainability plans have led to significant renewable growth in the United
States with a concentration of projects in regions such as Texas, the Mid Atlantic
and the Southwest (ERCOT, PJM and SPP energy regions) in the wind space and
in the West (WECC) in the solar space. While uncertainty around the expiration of
PTCs38
every two to three years has led to a boom-bust cycle in the development
pipeline, corporate sustainability plans have recently served as a mitigant in that
regard and have stimulated a baseline expansion of the pipeline.
The complexity associated with executing a renewable transaction has served as a
barrier to entry since each one encompasses three and in some cases four
components: (1) power purchase arrangement, (2) construction loan, (3) tax equity
investment, and in some instances, (4) back-leverage. While the construction loan,
tax equity investment and back-leverage are executed as club deals with a handful
of participants, the power purchase arrangement is put in place with a single entity
and is meant to support the other legs of the deal.
There are two types of power purchase arrangements that are pervasive in the
market as it stands today: 1) Traditional Power Purchase Agreements (“PPAs”) and
2) Physical or Financial Hedges, also known as virtual PPAs. Under both
arrangements, the project agrees to sell either all or a portion of the power and / or
renewable energy credits at a fixed price in order to support the associated
financing.
Although both types of power purchase arrangements are acceptable to the set of
investors coming into a deal either as lenders or tax equity investors or both, PPAs
are preferred due to the favorable transfer of risks from the project to the buyer.
Traditional Power Purchase Arrangement Overview
The traditional PPA market has been driven by utilities, corporates, municipalities
and cooperatives in various degrees of participation derived from each group
depending on the power market. In PJM for instance, wind project PPAs have
stemmed primarily from engagement by corporate entities foraying into the
renewable space. In ERCOT, the PPA market has emanated from a combination of
participation from municipalities, cooperative and corporates. The past two years
have seen a proliferation of corporate participants into the market feeding into the
triple bottom line corporate governance approach. Names making headlines have
included Amazon, IKEA, Hewlett-Packard, Google and many others.
37
The federal renewable electricity production tax credit (PTC) is an inflation-adjusted
per-kilowatt-hour (kWh) tax credit for electricity generated by qualified energy resources
and sold by the taxpayer to an unrelated person during the taxable year. 38
Originally enacted in 1992, the PTC has been renewed and expanded numerous
times, most recently by the American Recovery and Reinvestment Act of 2009 in
February 2009, the American Taxpayer Relief Act of 2012 in January 2013, and the Tax
Increase Prevention Act of 2014 in December 2014.
Roxana Popovici
Director, Commodity Structured Products
Group, Citi
Mike Curry
Head of North American Commodities
Structured Products Group, Citi
The complexity of executing a renewable
transaction has been a barrier to entry
There are two types of power purchase
arrangements — traditional and virtual
Traditional PPAs are driven by utilities,
corporates, municipalities and cooperatives
Citi GPS: Global Perspectives & Solutions December 2015
© 2015 Citigroup
68
Traditional PPAs are favored by investors since under the typical structure risk is
disproportionately allocated to the buyer. In its most basic form, a traditional PPA
will provide for the buyer to purchase at a fixed price the power output from the
project on an as produced basis at the node at which the project interconnects into
the relevant power market. Minimum availability guaranties are set over extended
time periods, typically in excess of one year, and capped liquidated damages (i.e.
$10/MWh) are imposed if the project fails to deliver such minimum quantities.
While the tenor (maturity) of traditional PPAs is generally longer than that of hedges
— some ranging from 15 to 25 years — credit requirements tend to be a fraction of
what is required under a hedge. Credit is usually addressed via a relatively small
letter of credit such that the asset is not encumbered, thus facilitating in some case
more favorable debt and tax equity terms than under a hedge transaction.
The disproportionate risk allocation mentioned earlier is advantageous to the
project, which receives a long-dated power purchase arrangement at a fixed price.
In return, the buyer must capture the production risk with respect to the intermittent
nature of the wind or solar resource, capped liquidated damages when the minimum
availability guaranty is not met, basis risk with respect to the unhedgeable price
delta between the node at which the power is purchased and the relevant, liquid
hub and credit risk with respect to a single, ring-fenced asset to which the buyer is
an unsecured creditor without recourse to the parent.
Virtual Power Purchase Arrangement Overview
The virtual PPA market has emerged from the participation of financial investors,
such as banks, and a handful of corporate or strategic players. Banks have
dominated the virtual PPA market over the course of the past three to five years,
bringing forth several advantages – speed of execution in a market grappling
periodically with the cliff expiration of PTCs, good understanding via lending
experience of the asset serving as collateral backstop and shared services through
partaking in some or all prongs of the transaction such as tax equity, construction
loan, and/or back-leverage.
In its simplest form, a virtual PPA entails a physical or financial sale from the project
to the buyer of a portion of the power, shaped by month and time of day, at a fixed
price for a tenor long enough to cover the term of the tax equity investment plus a
buffer of two to three years. The hedge is generally sized at the one-year 99th
percentile production level, which is determined through an assessment performed
by one of several consultants recognized by and acceptable to investors. In mature
markets, the virtual PPA may settle at the project node while in less established
markets, it will settle at the more liquid hub or zone in which the project is located or
even a hub or zone in an adjacent market to which a high degree of correlation
exists. A virtual PPA provides for liquidated damages, which are uncapped and
determined by market prices at the time the failure to deliver occurred.
In addition, a tracking account, in the parlance of a virtual PPA, is used to smooth
revenues by providing liquidity to the project in situations where its revenues are
insufficient to cover obligations owed under the hedge. The tracking account is
capped, but is customarily sized generously to give the project control over its
operations during periods of prolonged stress on revenues.
Unlike a PPA that requires de minimis collateral requirements, a hedge entails
significant but yet manageable collateral levels, which are bifurcated pre and post
the commercial operation date.
Risk in a traditional PPA is
disproportionately allocated to the buyer
The tenor of traditional PPAs is generally
longer than hedges, credit requirements are
less
Virtual PPAs emerged from the participation
of financial investors with banks dominating
the market
Revenues are smoothed as a tracking
account provides liquidity to the project

December 2015 Citi GPS: Global Perspectives & Solutions
© 2015 Citigroup
69
Prior to the commercial operation date, the virtual PPA will rely primarily on a letter
of credit provided by the lenders and a second lien on all project assets. After the
commercial operation date, exposure from the project to the buyer is addressed via
a first lien on the asset, thus eliminating the need for liquid collateral prevalent
under traditional PPAs.
Unlike traditional PPAs where risks are disproportionately allocated to the buyer, in
the case of virtual PPAs, inherent project risks, such as production shape risk and,
in some instances, basis risk, are retained by the project. The end result for
investors is more stringent due diligence around congestion, assessment, and
availability under the tracking account.
Two developments have, at times, commanded certain variations around the basic
structure of virtual PPAs, primarily through the use of options.
1. The decline in power prices and, more importantly, heat rates over the course
of the past three years has led to sponsors looking to retain upside when
possible.
2. Some buyers have become weary of concentration risk, especially with respect
to illiquid tenor buckets.
The most common virtual PPA/option combo structure is one that entails a fixed-
price power purchase for the first five to seven years and a put option establishing a
floor for the remaining tenor, with the premium for the option embedded in the fixed-
price transaction.
While this structure addresses the concerns of both equity investors and buyers, it
becomes more challenging to implement as prices decline further due to additional
reductions in the fixed price for the first five to seven years as a result of market
conditions but also through the use of an option that is now less out of the money
than previously and thus more expensive.
Outlook
Future development in the renewable space is expected to stagnate if PTCs are not
extended. The industry is counting on the sagacity of lawmakers to extend the
legislation and allow for further development, particularly in light of the recently
observed diversity of participants in the space.
Corporate sustainability goals may keep corporates from retreating, but they are not
enough to support to the growth of the renewable energy market. If the program
were to be abandoned entirely, corporate sustainability and compliance entities
alone will have the ability to breathe air into the market via purchases above market
levels. However, while corporates have displayed a proclivity to pay for meeting
additionality goals and utilities have been willing to pay up to meet compliance
targets, it’s unlikely for either of them to compensate a project entirely for the loss of
PTCs.
One potential outcome associated with the elimination of PTCs is that most
compliance Renewable Energy Certificate (REC) markets will see an uplift in prices,
but not enough. However, the uplift is insufficient to recompense projects for the
loss of PTCs. States will have to take a more aggressive stance with respect to
complying with Renewable Portfolio Standard (RPS) levels, leading to a significant
increase in the value of compliance RECs and thus keeping projects whole. Such
action at the state-level, at a time when states are already burdened by carbon
legislation, will take time and may dry up the development pipeline.
In virtual PPAs, inherent project risks are
retained by the project
If PTC’s are not expected, future
development in the renewable space is
expected to stagnate
It is unlikely that corporate sustainability
goals or compliance entities are enough to
compensate a project entirely for the loss of
PTCs
However, Renewable Energy Certificate
markets could see an uplift in prices,
although not enough to recompense projects
for the loss of PTCs

Citi GPS: Global Perspectives & Solutions December 2015
© 2015 Citigroup
70
One potential fix would be to put in place a short-term PTC extension while
mandating further federal guidelines for renewables and providing support to REC
prices. In the absence of a dramatic power price increase, regulatory action is
critical to the survival of the industry.
In the absence of a dramatic power price
increase, regulatory action is critical to the
survival of the industry

December 2015 Citi GPS: Global Perspectives & Solutions
© 2015 Citigroup
71
Financing Global Renewable Energy with Development Finance Institutions The popularity of capital expenditures in renewable energy continues to grow
unabated at a $200 billion39
clip annually as new projects are deployed in virtually
all corners of the world and across a vast array of green technologies. Accelerating
improvements in efficiency and declining capital costs have allowed many solar and
wind farms to become economically competitive vis-à-vis conventional power
plants, becoming an energy solution of choice for governments and energy
investors alike.
The imperatives posed by climate change, when combined with superior economic
rationale for green projects, have prompted policy makers to enact sweeping energy
reforms in almost all markets. Bold targets have been set for the deployment of
renewable energy projects in many markets, including the US, China, Japan, India,
Germany, Brazil, Chile, Mexico, South Africa, Morocco, Turkey, Egypt, and
Pakistan. Among the many policy instruments available to promote capital
investments in renewable energy, we would like to focus on financing programs
provided by Export Credit Agencies (ECAs), Multilaterals (MLAs), and Development
Finance Institutions (DFIs).
Export & Agency Finance for Renewable Projects
Export & Agency Finance is the general term for financing supported or provided by
government-sponsored agencies, whereby such agencies provide funding based on
their underlying purpose. Export Credit Agencies exist for the purpose of promoting
exports from their sponsoring countries. Historically, ECAs were exclusively the
tools of developed countries. However in recent years ECAs have also increasingly
been promoted by emerging countries such as China, South Africa and India.
Multilaterals and Development Finance Institutions, including well known institutions
like the World Bank and lesser known lenders such as the Overseas Private
Investment Corporation of the United States, exist for the purpose of promoting
development in and investment into the emerging markets.
These types of agencies are typically able to provide financing with longer tenors
and lower cost than within the private market. As a result, agencies often help to fill
market gaps by mobilizing investments that would not otherwise have adequate
financing solutions.
Even though improvements in technology in recent years have pushed the costs of
renewable energy development downwards, investments face numerous barriers
and potential risks. One of the primary barriers is capital availability and this gap is
frequently filled by official agencies. The challenges inherent in financing renewable
energy projects, including large upfront investments and drawn out repayment
periods, make agencies a crucial source of financing for these types of projects. In
this article, we attempt to identify the various agency programs that support
investment in renewable energy projects, which can be used as a starting point to
further engage with commercial banks and agencies for deal specific solutions.
39
According to Advanced Energy Now 2015 Market Report
Georges Romano
Regional Head of Export and Agency
Finance Latin America, Citi
Valentino Gallo
Global Head of Export and Agency Finance,
Citi
Export Credit Agencies (ECAs) exist for the
purpose of promoting exports from their
sponsoring countries
ECAs can provide financing with long tenors
and lower cost than the private market
Official agencies fill the gap of capital
availability

Citi GPS: Global Perspectives & Solutions December 2015
© 2015 Citigroup
72
Export Credit Agencies
ECAs have been a key source of debt funding for renewable energy investments,
particularly those covering exports by local industries. Many agencies express a
desire to support such investments in order to meet their Corporate Social
Responsibility objectives.
The OECD consensus, an agreement among the OECD countries that governs the
terms of ECA credits, contains a specific “sector understanding” outlining how ECAs
can provide support by the way of financing in the renewable energy sector. This
flexibility allows ECAs to offer loans or loan guarantees for tenors up to 18 years,
versus the standard term of 10 years for other types of exports, which enables the
financing to match the frequently longer investment horizons of renewable energy
projects. Also, whereas for ordinary exports ECAs require principal repayments to
be in equal installments, for renewable projects ECAs allow interest payments to be
combined with principal in calculating the equated installments, thus lessening the
upfront burden of repayments.
As mentioned above, many ECAs consider renewable energy as a focus area but
almost all support is only through credit lines tied to domestic exports or to
investments made by local companies in the foreign geography. Only the Japan
Bank for International Cooperation (JBIC) and to some extent Nippon Export and
Investment Insurance (NEXI) offer untied support to renewable energy projects by
way of untied “Green” lending programs. Figure 58 includes a list of the ECAs that
have been active in the renewable energy space. Some of the ECAs have special
focus or specific programs for renewable energy.
Figure 58. List of ECAs Active in the Renewable Energy Sector
Figure 59. Typical ECA Funding Structure
Country Agency Country Agency
Australia Export Finance and Insurance Co (EFIC)
Japan Japan Bank for International Cooperation (JBIC)
Austria Oesterreichische Kontrollbank (OeKB)
Japan Nippon Export and Investment Insurance (NEXI)
Belgium Office National du Decroire (ONDD)
Korea Korea Trade Insurance Corporation (K-SURE)
Brazil Brazilian Development Bank (BnDES)
Korea Export-Import Bank of Korea (KEXIM)
Canada Export Development Canada (EDC)
Norway Norwegian Guarantee Institute for Export Credits (GEIK)
Denmark Eksport Kreditfonden (EKF)
Spain Compañía Española de Seguros de Crédito a la Exportación (CESCE)
Germany Euler Hermes Kreditversicherungs-AG
(Hermes)
Sweden Exportkreditnämnden (EKN)
Italy Servizi Assicurativi del Commercio Estero (SACE)
US Export-Import Bank of the US (Ex-Im Bank)
Source: Citi TTS Source: Citi TTS
Exporter Importer
ECA
(1) Export Contract (Direct /
Indirect through the contractor
(4) Goods and Services
(3) Insurance policy /
Guarantee / Subsidies
(7) Repayment(5) Presentation of documents
(6) Payment for exports (2) Loan Agreement
ECAs are a key source of debt funding
The structure of ECAs for renewables
lessens the upfront burden of repayments
Almost all ECA support is through credit
lines tied to domestic exports or to
investment made by local companies in the
foreign geography
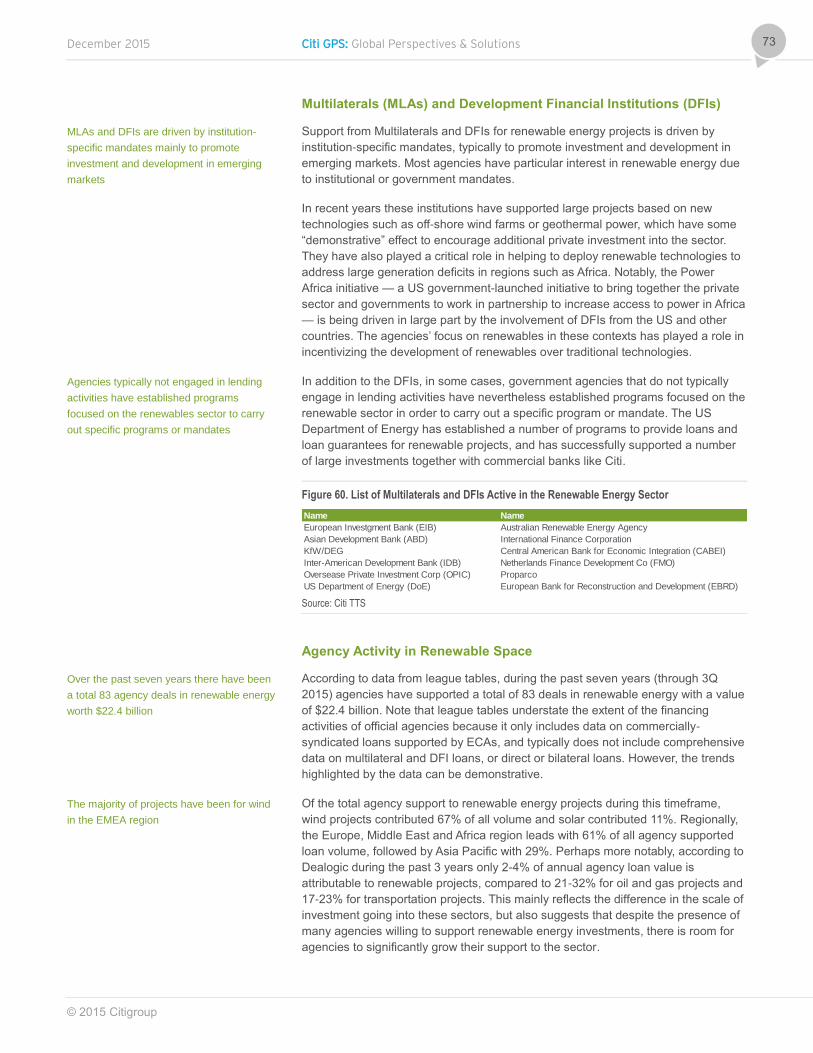
December 2015 Citi GPS: Global Perspectives & Solutions
© 2015 Citigroup
73
Multilaterals (MLAs) and Development Financial Institutions (DFIs)
Support from Multilaterals and DFIs for renewable energy projects is driven by
institution-specific mandates, typically to promote investment and development in
emerging markets. Most agencies have particular interest in renewable energy due
to institutional or government mandates.
In recent years these institutions have supported large projects based on new
technologies such as off-shore wind farms or geothermal power, which have some
“demonstrative” effect to encourage additional private investment into the sector.
They have also played a critical role in helping to deploy renewable technologies to
address large generation deficits in regions such as Africa. Notably, the Power
Africa initiative — a US government-launched initiative to bring together the private
sector and governments to work in partnership to increase access to power in Africa
— is being driven in large part by the involvement of DFIs from the US and other
countries. The agencies’ focus on renewables in these contexts has played a role in
incentivizing the development of renewables over traditional technologies.
In addition to the DFIs, in some cases, government agencies that do not typically
engage in lending activities have nevertheless established programs focused on the
renewable sector in order to carry out a specific program or mandate. The US
Department of Energy has established a number of programs to provide loans and
loan guarantees for renewable projects, and has successfully supported a number
of large investments together with commercial banks like Citi.
Figure 60. List of Multilaterals and DFIs Active in the Renewable Energy Sector
Source: Citi TTS
Agency Activity in Renewable Space
According to data from league tables, during the past seven years (through 3Q
2015) agencies have supported a total of 83 deals in renewable energy with a value
of $22.4 billion. Note that league tables understate the extent of the financing
activities of official agencies because it only includes data on commercially-
syndicated loans supported by ECAs, and typically does not include comprehensive
data on multilateral and DFI loans, or direct or bilateral loans. However, the trends
highlighted by the data can be demonstrative.
Of the total agency support to renewable energy projects during this timeframe,
wind projects contributed 67% of all volume and solar contributed 11%. Regionally,
the Europe, Middle East and Africa region leads with 61% of all agency supported
loan volume, followed by Asia Pacific with 29%. Perhaps more notably, according to
Dealogic during the past 3 years only 2-4% of annual agency loan value is
attributable to renewable projects, compared to 21-32% for oil and gas projects and
17-23% for transportation projects. This mainly reflects the difference in the scale of
investment going into these sectors, but also suggests that despite the presence of
many agencies willing to support renewable energy investments, there is room for
agencies to significantly grow their support to the sector.
Name Name
European Investgment Bank (EIB) Australian Renewable Energy Agency
Asian Development Bank (ABD) International Finance Corporation
KfW/DEG Central American Bank for Economic Integration (CABEI)
Inter-American Development Bank (IDB) Netherlands Finance Development Co (FMO)
Oversease Private Investment Corp (OPIC) Proparco
US Department of Energy (DoE) European Bank for Reconstruction and Development (EBRD)
MLAs and DFIs are driven by institution-
specific mandates mainly to promote
investment and development in emerging
markets
Agencies typically not engaged in lending
activities have established programs
focused on the renewables sector to carry
out specific programs or mandates
Over the past seven years there have been
a total 83 agency deals in renewable energy
worth $22.4 billion
The majority of projects have been for wind
in the EMEA region

Citi GPS: Global Perspectives & Solutions December 2015
© 2015 Citigroup
74
Key Takeaways
Many ECAs have programs that support investments in renewable energy but
almost all of these programs are linked to domestic exports or to investments by
local companies in a foreign geography.
The sector understanding under the OECD consensus provides flexibility to the
ECAs to extend loans with tenors up to 18 years for project in renewable energy
as against generally acceptable terms of 10 years. It also provides some
flexibility in the terms of repayment.
DFIs also have programs for renewable energy and have been actively seeking
projects to support in the sector. An analysis of the historical deals suggests an
inclination by these agencies to finance landmark projects in new technology
sectors as proof of concept.
December 2015 Citi GPS: Global Perspectives & Solutions
© 2015 Citigroup
75
Energy 2030: Consultant Analysis
Innovation to Unlock Developing Economy Finance: Currency Risk Reduction Tools to manage FX and interest rate risk are essential for increasing
climate investment in developing countries
Investing in renewable energy and other forms of clean infrastructure is capital-
intensive and requires long-term financing to match long operational lifetimes and
payback periods. In countries with underdeveloped capital markets, oftentimes the
only long-term financing available is in a hard currency – such as dollar or euro.
Sub-Saharan Africa is a prominent example where, except for South Africa, local
capital markets are not sufficiently deep to offer project finance in local currency or
offer suitable hedges for currency risk (Donnelly, 201540
).
This creates a mismatch between local currency revenues and repayment
obligations, creating the risk that foreign denominated debt cannot be paid back if
the local currency loses value. Project investors will seek a higher return to
compensate for the higher perceived risk and this can tip the balance of financial
feasibility with the result of good projects not being pursued. An interlinked barrier is
interest rate risk. Loans in developing countries are often only available with a
floating interesting rate – meaning that debt repayments increase if interest rates
rise. Inadequate currency and interest rate risk management can lead to greater
project failures, adverse impacts on consumers and systemic risk on financial
systems (Gray & Schuster, 199841
), (EU, 201142
).
An Innovative Instrument to Hedge FX and Interest Rate Risk
Over the past year, the Global Innovation Lab for Climate Finance43
worked with
The Currency Exchange Fund (TCX) and the International Finance Corporation
(IFC) to develop a public-private instrument that would provide long-term FX and
interest rate risk management to renewable energy and other climate-relevant
projects. This concept was one of four finalists selected from over one hundred
proposals based on their innovativeness, catalytic and transformative potential and
actionability. By providing the tools to lock-in long term finance in local currency, the
instrument will help make more projects viable and unlock new climate investment.
40
Donnelly, D (2015). Financing Renewables Projects on Africa. In Clean Energy Guide.
VB/Research Ltd. 41
Gray, R David, Schuster, John 1998. “The East Asian Financial Crisis: Fallout for
Private power Projects” World Bank, Washington, DC. 42
EU (2011). Recommendation of the European Systemic Risk Board of 21 September
2011 on Lending in Foreign Currencies (ESRB/2011/1). Official Journal of the European
Union (2011/C34). 43
For more information see http://climatefinancelab.org/
Barbara Buchner
Senior Director of Climate Policy Initiative
The TCX and the IFC have worked together
developing a public-private instrument that
would provide long-term foreign exchange
and interest rate risk management to
renewable energy projects

Citi GPS: Global Perspectives & Solutions December 2015
© 2015 Citigroup
76
About the Lab
The Global Innovation Lab for Climate Finance (The Lab) is a public-private initiative that identifies, develops, and supports
delivery of cutting edge climate finance instruments. It aims to drive billions of dollars of private investment into climate change
mitigation and adaptation in developing countries.
The Lab convenes a unique group of public and private actors, pooling political, technical, institutional, and financial resources to
accelerate the development of innovative ideas from concepts through to implementation-ready projects that address investor
and recipient country needs. It distinguishes itself from similar initiatives by quickly moving from talk to action, delivering effective
pilots of Lab-tested financial instruments, and encouraging the replication of successful pilots at greater scale within reasonable
timeframes. In addition to the Long-term Foreign Exchange Risk Management instrument, The Lab has delivered three other
instruments, which include:
Energy Savings Insurance, which insures the value of savings generated by energy efficiency investments. The instrument
has a pilot in Mexico and it has secured further funding to replicate across Latin America.
Climate Investor One, which will facilitate early-stage development, construction financing, and refinancing to fast-track
renewable energy projects in developing countries, mobilizing at least $2 billion in private finance out to 2020.
Agricultural Supply Chain and Adaptation Facility, which will partner with agribusiness corporations to provide farmers with
technical and financial support for climate-resilient investments through the corporations’ supply chains.
The Long-term Foreign Exchange Risk Management instrument provides a suite of
products that allow projects and entities to manage their foreign exchange (FX) and
interest rate exposure44
. The instrument would offer different types of cross-
currency and interest rate swaps in countries not previously served by commercial
markets including many countries in Sub-Saharan Africa. It would also offer a local
currency lending product that bundles swaps with a US-dollar loan provided by the
IFC to help clients who may not wish to enter into derivative contracts.
Figure 61. Long-Term FX Risk Management Facility Design
Source: Global Innovation Lab for Climate Finance
44
More information and analysis related to this instrument is available at
http://climatefinancelab.org/idea/long-term-currency-swap/
TCX & IFC will draw on
ADDITIONAL COUNTERPARTIES
to increase coverage, improve leverage &
contribute to long-term market development
BENEFICIARIES
NEW CLIENT-
RELEVANT
INVESTMNET
Foreign exchange and interest rate risk
increases the uncertainty of a project’s
financial outcomes which can lead to
promising projects not being pursued.
BARRIER:
By providing the tools to lock-in long term finance in
local currency, the Long-Term FX Risk Management
instrument helps to make more projects viable and
unlocks new climate investment.
SOLUTION:
TCXWill provide
long-term fixed and
inflation linked cross
currency swaps & interest
rate swaps
Long-term fixed
cross-currency swap
Inflation linked
cross-currency swap
Interest rate swaps
IFCWill provide
direct local currency
loans & cross currency
swaps in case of client
default
Cross-currency
swaps
Local currency loans
The instrument offers different types of
cross-currency and interest rates swaps

December 2015 Citi GPS: Global Perspectives & Solutions
© 2015 Citigroup
77
In a pilot of the instrument, TCX and IFC would collaborate to develop a pipeline of
projects and enter into joint transactions where appropriate. Their roles are
complementary and each would fill specific gaps in the market. TCX would focus on
market risk while IFC on counterparty risk.
TSC has been hedging frontier market currencies since 2008. As part of this
instrument, TCX will provide risk management instruments to firms, promoters and
financiers that are undertaking climate relevant investment:
Long-term fixed foreign exchange (FX) swaps offer clients fixed payments in a
currency pair at tenors up to ten years to better match the operational lifetimes of
renewable energy and clean infrastructure projects.
Inflation (CPI) linked FX swaps decrease swap costs by indexing payments to
inflation. This is ideal for a renewable energy project that can adjust revenues to
inflation.
Interest rate swaps will also be offered directly to clients as an additional benefit
of the instrument. This allows clean investment projects to lock long term
financing at a fixed rate.
IFC would solve another key barrier – credit risk. Swap providers, including TCX
cannot take credit risk which is present because a currency swap involves a stream
of payments over time. They might require high collateral — as much as 25% of the
value of the hedge up front. This is where IFC can come in. By accepting the credit
risk and using their own AAA credit rating to act as the counterparty, they can make
a transaction happen. IFC would be an intermediary offering currency swaps to
clients and also providing a local currency loan product that combines a USD loan
from IFC with a cross currency swap for clients who do not wish to enter into
derivatives transactions. They would offer the following:
Local currency loans which bundle a US-dollar-denominated loan with a cross-
currency swap to directly offer a local currency loan to clients.
Cross currency swaps directly to clients. The IFC would underwrite the swap
and re-hedge its FX exposure with TCX or with commercial counterparties.
The Role of Public Finance
To start a pilot of this instrument, both organizations are seeking to raise $250
million in risk capital from donor finance sources, which can leverage between three
and four times more in additional finance. The funds would be used for:
A proposed $200 million risk capital to back a portfolio of cross-currency swaps
through TCX. These amounts are expected to support $600 million – $800 million
worth of transactions.
A proposed $50 million first loss tranche to partially guarantee a portfolio of local
currency loans and cross currency swaps through IFC. IFC would also participate
in the first loss tranche to ensure alignment of interest. This is expected to
generate $300 million worth of financing extended by IFC to relevant projects
over time.
TCX and IFC will collaborate to develop a
pipeline of projects
Credit risk is lowered with IFC acting as an
intermediate offering currency swaps to
clients and also providing a local currency
loan product
To start a pilot of this instrument, both
organizations are seeking to raise risk
capital from donor finance sources

Citi GPS: Global Perspectives & Solutions December 2015
© 2015 Citigroup
78
There is a case for public support for the FX instrument based on the environmental
and economic benefits it provides. A simplified scenario was drawn that focused
only on wind and solar projects to provide an estimate of potential impacts of a pilot.
In this scenario, with $250 million in donor risk capital, the pilot could provide a total
hedging capacity of $915 million. This could support $1.45 billion in total project
value with potential GHG reductions of 1.7 MtCO2 per year and a cumulative total of
39 MtCO2 over the operational lifetime of the assets.
Ideas for Further Development
The Long Term Foreign Exchange Risk Management instrument is highly versatile
and can also support clean energy, energy efficiency, public transport, water
infrastructure, and other types of mitigation and adaptation projects. Post-pilot, the
instrument is highly scalable and flexible in terms of geographic and sectoral reach
and will also contribute to financial market development and transformational
impacts, unlocking additional investment.
There is public support for the FX instrument
based on the environmental and economic
benefits it provides
The instrument is versatile and can support
multiple mitigation and adaptation projects

December 2015 Citi GPS: Global Perspectives & Solutions
© 2015 Citigroup
79
Energy 2030: Commodities Analysis De-risking Through Public Sector Involvement The public sector could help de-risk projects in ways that could sharply lower the
cost of capital and expand the size of private financing into renewable projects.
Unlike some developed markets that have strong renewable energy policies,
institutional capacity, resource assessment, local expertise and grid connection,
developing countries and even some developed markets are still forming their
policies. Europe and California are deemed to be at the forefront of renewable
energy integration but other markets are catching up. The United Nations
Development Programme (UNDP) laid out a framework for de-risking that involves
the following policy instruments:
Policy de-risking instruments aim to remove underlying barriers that generate
additional risks, such as grid access, permitting process, policies on the use of
renewable energy, information, resource assessment, as well as institutional and
individual capacity building.
Financial de-risking instruments aim to transfer risk from the private to public
sectors. They include loan guarantees and public equity co-investments.
Direct financial incentives aim to reduce residual risks not eliminated by policy
and financial de-risking. These incentives include subsidies, tax credits or explicit
price premiums
Most emerging market countries need to address their policy gaps, which hinder the
adoption of more renewable energy supply, through the use of policy de-risking
instruments. However, some countries may need more direct financial incentives to
lower the cost of renewable energy because other electricity generation sources are
much more economically competitive: for example, coal-fired generation is often
cheap in a coal producing country, so that support for renewable energy could help
make renewables competitive vs. coal. Some countries may need financial de-
risking instruments to lower the cost of capital, because sovereign and foreign
exchange risks are high, or because of tight local financing markets: an example is
Brazil with its high cost of capital. However, some local markets are so flush with
money that their costs of capital tend to be low.
Policy de-risking could take years, however, as successful policy changes and
capacity building efforts usually take time. Opening up and encouraging renewable
energy penetration often goes against the entrenched interests of incumbents, firms
along the existing value-chain or others that resist change. Developing local
manufacturing and installation capability should also lower the cost of installing
renewables and create green jobs. The investment and expertise brought in should
raise foreign direct investments and improve local capacity building.
Reducing subsidies on fossil fuels should help reduce the amount of direct financial
incentives spent on renewable energy projects. While subsidies do distort the
normal functioning of markets, if the objective is to promote renewables over fossil
fuels, then why keep on subsidizing energy sources (i.e. fossil fuels) whose share in
energy supply the government wants to reduce? Low-income consumers may need
help to pay for their energy costs if subsidies for fossil fuels are taken away.
Therefore, some other policy support should be in place to deal with the regressive
nature of higher energy costs.
Anthony Yuen
Ed Morse
Seth Kleinman
Adriana Knatchbull-Hugessen
Citi Commodities Research
Policy de-risking instruments help emerging
markets address their policy gaps
Reducing subsidies on fossil fuels should
reduce the amount of direct financial
incentives spent on renewable energy
projects

Citi GPS: Global Perspectives & Solutions December 2015
© 2015 Citigroup
80
Designing and Applying Appropriate Instruments to De-Risk Projects
Designing and applying appropriate instruments to de-risk projects involves:
Identifying and quantifying risks that contribute to entry barriers and higher
costs of capital vs. similar projects in markets with best practices;
Formulating effective policy instruments to break down key barriers and
reduce risks, so that renewable energy projects become economically
competitive enough vs. conventional energy projects;
Evaluating the effectiveness of these policy instruments in lowering the cost
of capital, boosting private investments, reducing consumer expenditure, and
cutting emissions.
Risks identification
The types of risks that are typically identified include:
Political risks include the direction of renewable energy policy, market access,
permitting process and general uncertainty (e.g. stability of a government and its
policies).
Social risks include whether the public wants to have renewable energy. Even if
people do support renewables, they may have a NIMBY (Not-In-My-Backyard)
problem about the siting of renewables.
Technical risks include the experience, expertise and adequacy of infrastructure
in accommodating renewable energy, as well as data availability and resource
assessment in helping project developers and financial partners evaluate
projects.
Financial risks include counterparty risk in making sure off-takers of the energy
generated can pay, local funding conditions, macroeconomic risks including
inflation and interest rates, as well as foreign exchange risks in relation to
bringing in foreign capital or importing equipment and fuels.
Industry comparables (e.g. sovereign ratings, local corporate or utility-specific
WACC), existing deals, case studies in international and cross-sector experiences,
as well as structured interviews should help quantify some of these risks. However
some risks are qualitative in nature and hard to value. As the risk-return profiles of
equity and debt are different, separate evaluations should be performed or these
asset classes. The graphs below show illustrative cases of how the cost of capital
could rise for a renewable energy project and how public policy measures could
help de-risk projects.
Project risks can include political, social,
technical or financial risk
Separate evaluations should be performed
for equity and debt as their risk-return
profiles are different

December 2015 Citi GPS: Global Perspectives & Solutions
© 2015 Citigroup
81
Figure 62. Quantifying the Size of Risks Embedded in Higher Financing
costs (equity)…
Figure 63. …And how Public Policy Measures Could De-Risk Project
Source: UNDP, Citi Research Source: UNDP, Citi Research
Figure 64. Quantifying the Size of Risks Embedded in Higher Financing
Costs (debt)…
Figure 65. …And How Public Policy Measures Could De-Risk Project
Source: UNDP, Citi Research Source: UNDP, Citi Research
Costs and Implementation of Public Sector De-Risking Measures:
For policy de-risking instruments, the core costs include the design,
implementation, impact evaluations of instruments and the duration of these cost
items. There are costs associated with funding permanent regulatory bodies and
monitoring functions, but the streamlining of existing process and enhancing the
new process could save money.
For financial de-risking instruments, costs include the capital deployed or held in
reserve for loan guarantees plus public equity co-investment etc. Sometimes
there is no cost to the public because green banks or development banks make
the loan but expect only a small profit. However, these policy banks could incur
capital losses due to defaults on occasion. This is where risk evaluation is critical
0%
2%
4%
6%
8%
10%
12%
14%
16%
18%
20%
Cost of E
quity
Best-
In C
lass
Countr
y
Pow
er
Mark
et
Ris
k
Perm
its
Ris
k
Socia
lA
cce
pta
nceR
isk
Grid inte
gra
tion
Ris
k
Counte
rpart
yR
isk
Fin
ancia
lS
ecto
r R
isk
Polit
ical
Ris
k
Curr
ency/
Macro
econ. R
isk
Cost of E
quity
BA
U
0%
2%
4%
6%
8%
10%
12%
14%
16%
18%
20%
Co
st o
f D
eb
tB
AU
Pow
er
Mark
et
Ris
k
Perm
its
Ris
k
Socia
lA
ccep
tan
ce
Ris
k
Grid I
nte
gra
tion
Ris
k
Co
un
terp
art
yR
isk
Fin
ancia
lS
ecto
r R
isk
Co
st o
f E
qu
ity
Post-
Deri
skin
g
0%
1%
2%
3%
4%
5%
6%
7%
8%
9%
10%
Co
st o
f E
qu
ity
Be
st-
In C
lass
Co
un
try
Po
we
r M
ark
et
Ris
k
So
cia
lA
ccep
tance
Ris
k
Grid in
teg
ratio
nR
isk
Co
un
terp
art
yR
isk
Po
litic
al
Ris
k
Cu
rre
ncy/
Ma
cro
eco
n. R
isk
Co
st o
f E
qu
ity
BA
U
0%
1%
2%
3%
4%
5%
6%
7%
8%
9%
10%
Co
st o
f D
eb
tB
AU
Po
we
r M
ark
et
Ris
k
Socia
lA
ccepta
nce
Ris
k
Grid In
teg
ratio
nR
isk
Co
un
terp
art
yR
isk
Cost of E
quity
Post-
Deriskin
g
The costs for policy and financial de-risking
must be evaluated

Citi GPS: Global Perspectives & Solutions December 2015
© 2015 Citigroup
82
to avoiding defaults as much as possible. Policy banks may leverage their paid-in
capital and high credit ratings to raise private capital in order to lend to project
developers. Some estimates suggest that institutions like the World Bank could
leverage 3.5-times their paid-in capital. New development banks, most
prominently the Asian Infrastructure Investment Bank (AIIB), are also looking to
drive more public-private investments; the AIIB looks to target power, water and
transport infrastructure investment in its initial phase of operation.
Next is the evaluation of the various costs of renewable energy vs. traditional
energy sources. It is not just a simple total cost comparison that includes financing,
capital and variable costs.
For new renewable energy supply competing with existing fossil fuel power
plants, the capital, financing and variable costs of the new renewable energy
project should be compared with the fuel and variable (fuel + operating costs)
costs of the fossil fuel plant, because no new fossil fuel plant is needed in this
case.
For building new power plants, the capital, fuel, variable and financing costs of
both the renewable energy and fossil fuel project should be considered. A better
baseline for comparison assumes no government support, such as subsidies for
renewables or fossil fuels, then adds back the impacts of policies which aren’t
likely to be eliminated.
Evaluation of Policy Effectiveness
Evaluations of policy effectiveness involve (1) assessing how much more private
capital has been raised vs. the amount of public capital put in; (2) how much
consumers have saved and the affordability for consumers; and (3) how much
emissions can be cut, which can be associated with lowering the health and
environmental costs.
A cost comparison includes looking at
financing, capital and variable costs

December 2015 Citi GPS: Global Perspectives & Solutions
© 2015 Citigroup
83
Part B Conclusion
Technology, finance and policy are converging in the global effort to promote a
greener future. Financial innovation is increasingly critical in this space as
diverse solutions expand and evolve to facilitate the recycling of capital and to
optimize the allocation of risk and funding of renewable energy projects globally.
We highlight several influential financial solutions being developed and deployed
today.
Innovative financial solutions for “new” markets like renewable energy and
energy efficiency are supported by several fundamental components: (1) tailoring
adaptive solutions to specific projects by combining multiple financing strategies;
(2) helping to connect new markets with capital markets by providing
transparency and standardization in diverse and fragmented markets; and (3)
leveraging public-private partnerships to fill critical gaps and mobilize projects
that might otherwise not get done.
Securitization solutions for residential green energy loans could help support
greater and more diverse growth in residential purchases of green energy
technologies. By pooling loans and slicing risk into different levels, securitization
thereby expands access to capital by appealing to a broader range of investors
with varying risk appetites. This has the potential to increase consumer access to
low cost capital for funding household green energy purchases, thereby
supporting the proliferation of these technologies. The WHEEL program in
particular looks poised to be at the forefront of this effort.
Different structures in power hedging, including PPAs and virtual PPAs could
provide incentives for development in the US by allowing varying risk allocation
between the buyer and seller.
Development finance institutions and government-sponsored agencies provide a
bridge between public and private solutions to promoting green energy,
particularly in emerging markets. These institutions are able to provide lower cost
and longer tenor financing to renewable projects than the private markets,
helping to mobilize investments in the sector.
In developing countries, where access to local capital markets is limited, foreign
investment is often necessary to provide capital for renewable energy projects.
However, foreign funding exposes investors to currency risk due to the mismatch
between repayment obligations and local currency revenues. Mitigating this risk
through innovative currency swap solutions could help lower the cost of capital
for renewable energy in otherwise inaccessible markets, like Sub-Saharan Africa.
The public sector could be a critical player in the effort to de-risk renewable
investments and lower capital costs for projects. In this space, several solutions
are available beside direct financial support, ranging from policy instruments that
remove underlying barriers that generate risks, to financial instruments that
transfer risks from the private to the public sector, such as loan guarantees for
renewable energy projects.

Citi GPS: Global Perspectives & Solutions December 2015
© 2015 Citigroup
84
Energy 2030: Macro Analysis Part C: Will Fossil Fuels Be Stranded? “The Stone Age did not end for lack of stone, and the Oil Age will end long before
the world runs out of oil” 45
“Stranded assets” is a dramatic name for familiar concept: real (that is, physical)
assets that have lost much or all of their value, or may even have become liabilities,
as a result of unanticipated and sometimes discontinuous technological, social,
political, economic and market developments which are perceived to be permanent.
One can potentially think of stranded assets as assets that lose their value as a
result of political and regulatory actions, and which absent those political and
regulatory changes would still have material value. But in this report we stress that
the issue is usually much more nuanced: technological, social, political, economic
and market developments interact in determining the relative competitiveness of
assets, technologies or resources and the relevant scenarios are not limited to the
status quo and the world where an asset that has value today becomes stranded
due to some political or regulatory action tomorrow.
It is hardly news that assets — both real and financial — are risky, that they may
become worthless or turn into a net drain on financial resources. New
environmental standards adopted in the US and a number of other countries hurt
the financial performance of the mining sector by restricting the pollution of land,
water or air and often prohibiting the release of toxic materials, notably the dumping
of mine tailings in rivers, lakes and oceans. Mining companies are increasingly likely
to be required to make full financial provision, in advance, to cover the cost of
closing the mines and restoring the environment to an acceptable standard. The
political momentum behind legislation like the Clean Water Act could prevent mining
activities in protected areas or in areas with great non-economic (environmental,
cultural or historical) value. An example is the decision by the EPA to invoke its
powers under the Clean Water Act by reviewing the environmental impact of the
proposed Pebble Mine in Bristol Bay, Alaska. This large open-pit gold, copper and
molybdenum mining project has been shelved since 2013, but there is a legal
challenge to the EPA’s ruling.46
If the legal challenge fails and the EPA’s decision to
impose restrictions based on Section 404 (C) of the Clean Water Act stands, this
would effectively kill the project.47
Asbestos is another classic example of a stranded
45
Quote attributed by the Economist to Sheikh Ahmed Zaki Yamani, Saudi Arabia’s
Minister of Oil and Mineral Resources from 1962 to 1986. “The Future of Energy; The
End of The Oil Age”, The Economist, 23 October 2003,
http://www.economist.com/node/2155717. A rival, but later attribution is to William
McDonough: “The Stone Age did not end because humans ran out of stones. It ended
because it was time for a re-think about how we live.” As quoted in "Eco-designs on
future cities" by BBC News (14 June 2005). 46
See Michael J. Kowalski, “When Gold Isn’t Worth the Price”, New York Times, 7
November 2015, p. A23. 47
“Section 404(c) authorizes EPA to prohibit, restrict, or deny the discharge of dredged
or fill material at defined sites in waters of the United States (including wetlands)
whenever it determines, after notice and opportunity for public hearing, that use of such
sites for disposal would have an unacceptable adverse impact on one or more of various
resources, including fisheries, wildlife, municipal water supplies, or recreational areas.”
EPA, Clean Water Act Section 404(c): Restriction of Disposal Sites,
http://water.epa.gov/lawsregs/guidance/cwa/dredgdis/404c_index.cfm
Willem Buiter
Global Chief Economist, Citi
Ebrahim Rahbari
Director, Global Economics Team, Citi
Assets are risky and may become either
worthless or a net drain on financial
resources

December 2015 Citi GPS: Global Perspectives & Solutions
© 2015 Citigroup
85
asset killed by new knowledge about its health impact and by the laws, regulations
and lawsuits triggered by this new knowledge.
Price bubbles in real reproducible assets can motivate capital investment that
makes sense at the inflated bubble prices but not once the bubble has burst. During
the Irish financial and construction boom preceding the Great Financial Crisis, a
large amount of new residential construction took place in locations that were quite
far off the beaten track. When the house price bubble burst, much of these
speculative constructions became stranded assets. Unlikely ever to find buyers
such properties stand empty and sometimes unfinished. In 2013 the Irish
government demolished 40 unfinished ‘ghost’ housing estates. The costs were born
by the site owners.48
The term ‘stranded assets’ is generally reserved for natural resources, though the
logic can be applied to any real asset whose value can be drastically reduced or
even wiped out by technological, social, political, economic, or market
developments. The Irish ghost town example makes this clear.
For any natural resource, the amount that can be profitably recovered, in a given
time period or cumulatively between now and kingdom come, is an increasing
function of its future price path: the marginal cost curve and, after a while, the
average cost curve are upward-sloping with the volume of extraction in any given
period and, unless technological progress comes to the rescue, with the cumulative
extraction volume also. For most natural resources, the bulk of the existing stock ‘in
the ground’ has never been a candidate for profitable extraction and likely will
always remain unprofitable at any reasonably conceivable future path of prices and
costs. Such resources are not stranded assets as we use the term, because they
never had a positive economic value – they never were assets. Stranded assets are
assets that once had positive economic value but no longer do, as it would not be
profitable to extract them, now or in the future.
In the Figure 66, ‘total resources’ refers to the cumulative amount of the resource
that has been extracted (profitably, presumably) plus an estimate of the amount that
could be profitably recovered and produced (extracted, henceforth), using current
technology and assumptions about future technology and geology plus an estimate
of the amount that once could have been recovered profitably, but that because of
unexpected developments is profitable no longer. The ultimately recoverable
resources (URR) are an estimate of the cumulative total amount of the resource that
will ever be profitably extracted. It is determined by geology, the laws of physics,
technology, the prices of the inputs used in the extraction process, the price of the
resource and the price of the other outputs of the extraction process. With the
exception of the laws of physics, all these drivers of the URR will change over time.
Technological change in the extractive industry itself will tend to raise the URR over
time. New knowledge in general, however, need not have this effect, as the fate of
asbestos illustrates.
48
BBC News, “Ghost estates: 40 unfinished developments to be demolished”, 28
November 2013, http://www.bbc.com/news/world-europe-25137410
Capital investment that makes sense during
a price bubble might not make sense once
the bubble is burst
The amount of any natural resource that can
be profitably recovered is a function of its
future price path
For most natural resources, the bulk of
existing stock in the ground has never been
a candidate for profitable extraction — these
are not stranded assets as they never had a
positive economic value
Total resources are the total amount of the
resource that has been extracted plus an
estimate of the amount that could be
profitably recovered and produced

Citi GPS: Global Perspectives & Solutions December 2015
© 2015 Citigroup
86
A Classification of Recoverable Resources
As shown in the figure below, the ultimately recoverable resource is the sum of
cumulative production, discovered reserves and undiscovered resources.
Figure 66. Decomposing the stock of available resources
Source: Citi Research
Cumulative production is the total amount extracted up to a given date. Discovered
reserves are an estimate of the future cumulative profitable production from
currently known reserves. Discovered reserves are the sum of proven, probable and
possible reserves. Proven reserves are future cumulative profitable production that
is recoverable with reasonable certainty (say at 90% probability or higher) from
known reserves with current technology and current operating and market
conditions. Probable reserves are reserves that are estimated to have a less than
90% but more than even (50% or higher) probability of being profitably extracted in
the future, from known reserves with current technology and current operating and
market conditions. Possible reserves are reserves that have a significant but less
than 50% chance of being profitably extracted in the future, from known reserves
with current technology and current operating and market conditions.
Undiscovered resources are the unknown unknowns in the world of natural
resources. These are resources yet-to-be discovered. A probabilistic assessment is
made based on assumptions about future geological, technological, political, social
and economic factors. This requires assumptions about the future price of the
resource, about future technology, the future regulatory, legal and tax environment
and other drivers of future costs of production and of the operational environment.
The probability of being discovered may be low, but it is positive for undiscovered
reserves.
To this standard decomposition of ultimately (profitably) recoverable resources, we
add the category of resources that are (or are likely to be) technologically
recoverable in the future, and once were expected to be profitably recoverable, but
no longer are, given new assumptions about future prices, other market conditions
and other drivers of the operational environment such as current and future taxes,
regulations and technology. These Non-Recoverable Resources are the stranded
assets that are making such a splash in the world of fossil fuels – principally coal, oil
and natural gas. Total resources are the sum of ultimately recoverable resources
and stranded assets.
Ultimately Recoverable ResourcesStranded Assets/
Non-Recoverable Resources
Cumulative
Production
Discovered
Resources
Undiscovered
Resources
Total Resources
Possible
Reserves
Provable
Reserves
Proven
Reserves
Cumulative production is the total amount
extracted up to a given date
Undiscovered resources are resources yet-
to-be discovered
December 2015 Citi GPS: Global Perspectives & Solutions
© 2015 Citigroup
87
The owners of the right to extract a resource in a given location value this asset in
terms of the present discounted value of profits from exploiting the discovered
reserves and the undiscovered resources; cumulative past production is a bygone.
So are stranded assets, unless they turn into actual liabilities. The discount rate
applied to the streams of future profits will rise as we move vertically in Figure 66.
The value of the stranded assets is, by definition, zero.
Why the Interest in Stranded Assets Now?
Why is the stranded asset question mostly raised in the context of natural resource
extraction? Resource extraction processes typically produce multiple outputs. The
conversion of fossil fuels into energy likewise produces other outputs, such as
greenhouse gas emissions. When one or more of these joint products are ‘bads’,
like soil and water contamination or emissions of greenhouse gases, their price
should be interpreted as the cost associated with handling these negative
externalities. Historically, free disposal of the joint products created by the extraction
process of fossil fuels and by their conversion into energy, has often been the rule.
When knowledge accumulated about these negative externalities and was
disseminated among those affected by them, the government would often respond
with measures to force or incentivize the producers to limit these negative
externalities. Taxes, quotas, tradable pollution permits, regulations that imposed
costly restrictions on the extraction process and similar interventions often resulted.
The debate about ‘stranded assets’ is therefore invariably related to the political and
social debate about the ‘bad’ or the negative externality that is associated with their
extraction and conversion into energy or other desirable products.
Sometimes the costs imposed by these externalities, to the extent that they are not
internalized/borne by the mining companies, the electric power generators or the
users of goods and services that have fossil fuels somewhere in their supply chain,
are referred to as energy subsidies (see e.g. Coady, Parry, Sears and Shang
(2015), Ebeke and Ngouana (2015) and Gaspar (2015)). These publications call
‘cash’ subsidies pre-tax subsidies and the negative externalities created by the
extraction and use of energy post-tax subsidies. We don’t think this rather strained
and stretched redefinition is useful, as it smacks of the use of semantic weapons
(and the emotions they evoke) rather than relentless logic and hard facts to promote
a cause. The economics profession and the world at large know what negative
externalities are and have a standard usage for the word ‘subsidy’. The numbers
are big enough not to get distracted by semantic warfare.
According to recent IMF studies the sum of pre-tax subsidies, fiscal revenues
foregone (which is close to a traditional cash subsidy the way taxes and tax
expenditures can be viewed as closely related concepts) and the cost of negative
externalities for 2015 is estimated to be $5.3 trillion. Pre-tax subsidies and fiscal
revenues foregone are 12% of this or $636 billion (Gaspar (2015) and Ebeke and
Ngouana (2015)). The rest, the cost of the energy-related negative externalities, is
just under $4.7 trillion. If these numbers are anywhere near correct, it is not
surprising that there has been a policy response to force the energy producers
and/or users to internalize at least part of these costs – a political response that is
about to turn a significant amount of fossil fuel reserves into stranded assets.
The stranded asset debate is related to
political and social debates about the
negative externalities associated with their
extraction and conversion into energy
The costs imposed by negative externalities
are referred to as energy subsidies
In 2015, the cost of negative externalities is
forecast to be $5.3 trillion

Citi GPS: Global Perspectives & Solutions December 2015
© 2015 Citigroup
88
The headlines about the carbon budget — the cap on future carbon emissions
implied by a global commitment to keep the rise in average global temperature over
its pre-industrial level to no more than 2 degrees Celsius — refer to a potentially
large shift in the figure above, for fossil fuels generally (but most immediately for
coal, followed by oil and then by natural gas) out of the URR box into the stranded
assets box. Through new taxes, quotas (including tradable permits for extraction or
for the right to emit carbon dioxide and other greenhouse gases by burning fossil
fuels) and regulations, either extraction costs are raised and/or the prices buyers
are willing to pay are reduced to the point that future extraction of previously
profitable resources is no longer profitable.
There are three reasons why ‘stranded assets’ have relatively suddenly become a
subject of considerable interest, debate and controversy. The first is that the
amounts involved are likely to be big. The numbers that could be involved were
large enough for the Governor of the Bank of England, Mark Carney — speaking as
the head of the UK’s Prudential Regulation Authority (and indeed head of every
aspect of financial regulation and supervision except for ‘conduct’) — to warn
investors in the fossil fuel industry about possibly huge losses from climate change
action. Tougher rules on climate change could leave between 66% and 80% of the
world’s proven fossil fuel reserves stranded.” 49
That would be a fair amount of
asset impairment.
The second reason stranded assets are in the news is that only a few years ago,
the prevailing concerns about ‘peak oil’ were concerns about peak oil supply. In the
‘stock’ version this referred to the belief that the total amount of oil that was
recoverable, given current technology and reasonably foreseeable future
technological developments, at non-prohibitive costs of exploration and extraction
had peaked. In the ‘flow’ version of the peak oil hypothesis, the maximum amount
that could be extracted at non-prohibitive costs in a period of, say, a year, was about
to peak. Stranded assets change the peak oil hypothesis in two ways. First, it
generalizes it from oil to all fossil fuel assets. Second, the hypothesis refers to peak
demand.
The third reason ‘stranded assets’ are a hot topic is that it refers to the outcome of
the collision of two important human desiderata. It is the clash between
environmental concerns, especially the desire to limit global warming, and the
desire to have cheap and reliable sources of energy.
The risk of much of the world’s fossil fuel reserves becoming stranded assets as a
result of a political response to global warming is of course not the only risk
associated with climate change. Carney lists physical risks (natural disasters etc.),
liability risks and transition risks (the risks associated with a transition to a low-
carbon intensity world, which includes the risk of fossil fuel assets becoming
stranded).
Note also that global warming is not the only environmental externality created by
fossil fuel extraction. Coal mining (especially open pit mining) can destroy areas of
outstanding natural beauty. Mine tailings pollute water and the soil, as does the
extraction of shale gas and tight oil.
49
Mark Carney (2015), “Breaking the tragedy of the horizon - climate change and
financial stability” - speech given at Lloyd’s of London, 29 September,
http://www.bankofengland.co.uk/publications/Documents/speeches/2015/speech844.pdf
Stranded assets have recently become a
subject of interest due to their potential
size….
…and have changed the peak oil
hypothesis…
…and demonstrate a clash between
environmental concerns and the desire to
have cheap and reliable sources of energy

December 2015 Citi GPS: Global Perspectives & Solutions
© 2015 Citigroup
89
What Drives the Likelihood, Magnitude and Timing of Fossil Fuel
Reserves Becoming Stranded Assets?
A lot of attention is being paid on the political and regulatory decisions that could
potentially strand a significant share of the currently recognized natural resource
(coal, oil and gas) assets. However, the actual decisions that would lead these
assets to be stranded will depend on the costs of such action and the perceived
costs of inaction.
The Scientific and Political Case for Human-made Climate Change and
Its Consequences
As Governor Carney noted in his recent speech, the scientific case that there are
some human-made contributions to the increase in global temperatures is by now
nearly equivocal.50
The scientific case for human-made climate change essentially
rests on four factors: (1) we have recently observed extreme events that are without
precedent over perhaps millennia; (2) many of these events can be related to a
warmer atmosphere; (3) the increase in global warming since the mid-20th century
is highly likely to have been caused by anthropogenic greenhouse gas emissions
and other anthropogenic drivers; and (4) the increase in the greenhouse gas
emissions and other anthropogenic drivers is a direct consequence of human
activity.
As for the politics, we have been surprised over the past 5 years or so by the
degree to which the educated public – and especially the business community in the
US and Europe – has accepted (1) that global warming is happening; (2) that there
is a significant man-made contribution to the rising concentration of greenhouse
gases; and (3) that policy measures (carbon emissions or carbon content taxes;
tradable greenhouse gas emission quotas/permits etc.) will have to be taken to
prevent a planet-wide disaster from occurring during our children’s lifetime.
Politicians from Obama to Xi are making serious efforts to get global agreements
limiting greenhouse gas emissions. Except in Tea Party Land, this is now part of the
‘acquis intellectuel’.
That China now has joined the camp that wants to limit CO2 emissions – especially
those generated by burning coal – is a very important development. It is largely born
out of local/national environmental concerns and is therefore not subject to the free
rider problem. Much of urban China has become an environmental disaster area,
with coal-fired power plants making a significant contribution to the health-impairing
and expected life-span reducing air pollution that plagues cities from Beijing to
Chongqing. Reducing the emission of these pollutants is now a policy priority in
China – and that is only because of the local effects of mainly particulate pollution
rather than the global effect of greenhouse gas emissions. The impetus for tackling
environmental issues (even though not necessarily climate change) has risen
dramatically on politicians’ agenda.
50
See IPCC - Climate Change 2014: Synthesis Report. Contribution of Working Groups
I, II and III to the Fifth Assessment Report of the Intergovernmental Panel on Climate
Change (2014)
The decision leading an asset to be
stranded will depend on the cost of such
action and the perceived costs of inaction
Political leaders are noting that the scientific
case that there are some human-made
contributions to the rise in global
temperatures is nearly equivocal
Politicians are making serious efforts to get
global agreements limit greenhouse gas
emissions
China joining the camp that wants to limit
CO2 emissions is an important development

Citi GPS: Global Perspectives & Solutions December 2015
© 2015 Citigroup
90
Why 2°C?
The 2 degrees Celsius limit on the increase in average global temperature from pre-
industrial average levels originated in an academic paper by William Nordhaus in
1977 and was formally recognized in the Cancun Agreement in 2010. The
hypothesis is that, should the increase in global temperatures be limited to 2
degrees Celsius, then some of the worst implications of human-made climate
change could be avoided. However, there is no exact science behind the 2°C cut-
off. Geology on a global scale is not an experimental science — we only have
history for empirical support. The degree to which we face non-linearity in the
damage done by higher temperatures at the 2 degrees benchmark is highly
uncertain, which would — other things equal — suggest to us that we should expect
some slippage relative to this goal. But in our view the 2 degree Celsius goal is best
understood as a useful focal point for communication and for negotiations – and in a
public debate that is likely to be very fraught and in negotiations between more than
a hundred countries, such focal points can be both important and powerful.
The Carbon Budget
The IPCC suggests that to have an even greater than 50% chance of limiting
temperature increases to 2°C, global cumulative CO2 emissions would need to be
limited to approximately 3,010GT, which is the so-called ‘carbon budget.’ Recent
estimates suggest that emissions to date have accounted for around 60% or more
of this budget, with a roughly 500 GT increase in the last ten years alone. This
implies that the ‘no change in trend’ trajectory for emissions would bring us to
exhaust the carbon budget in less than twenty years. Of course, the mapping from
carbon emissions to the exact effect on the global temperature is also subject to
significant estimation uncertainty, but if there is a risk of a serious non-linearity at
temperature increases of more than 2 degrees Celsius, the precautionary principle
would suggest error on the size of lowering the size of the carbon budget.
The Cost of Action
The political and regulatory decisions that end up stranding assets that were
previously of material value do not take place in a technological and market
vacuum. Clearly, the conclusions about the risk of a significant share of fossil fuel
reserves ending up as stranded assets as a result of the political response to
climate change depends on a host of assumptions about future political and
technological developments that we can hardly be confident about.
These include assumptions about:
Future developments in carbon capture and storage technologies that may
make it commercially viable to extract a larger share of the proven reserves of
coal, oil and gas resources than would otherwise be compatible with the carbon
budget constraint
Developments in the technical efficiency and cost of alternative, and
especially renewable sources of energy
Development in the technology to store power and to deal with
interruptions in power production, which have been a major obstacle to the
wider adoption of wind, wave, tidal (and sometimes even solar) energy. Until
recently, there appears to have been little progress in battery technology since
the late nineteenth century, but innovations like MIT’s ‘yolk and shell’ batteries
(with a titanium dioxide shell and an aluminum yolk) may imply larger storage
capacities, a much extended life and faster charging
Limiting global temperature to just a rise of
2oC from the pre-industrial average is
suggested would avoid some of the worst
implications of human-made climate change
No change in the trend trajectory for
emissions would bring us to exhaust the
carbon budge in less than twenty years

December 2015 Citi GPS: Global Perspectives & Solutions
© 2015 Citigroup
91
Conversely, should these technological developments turn out to disappoint – and
the resulting costs of restricting carbon emissions correspondingly increase – the
likelihood rises that politicians and regulators will shy away from taking drastic
measures to limit carbon emissions.
The Free-Rider Problem
Even if technological developments work towards reducing the cost of a fossil fuel-
free diet, the enforcement of the carbon budget constraint will still be at risk of falling
victim to the free rider problem. Global warming’s negative externalities are global.
The benefits from burning fossil fuel are local. Every nation would prefer all other
nations each to cut back CO2 emissions a bit more to allow it to emit a lot more. The
“free rider/after you” problem is serious and it has clearly been important in
preventing earlier agreements to limit carbon emissions.
But it is probably not unsurmountable. For all practical purposes, it will be sufficient
to have the US, China and the EU on board. Most other countries are likely to
follow. And as noted above, the impetus to take action is currently often local (as in
China) which increases the likelihood of action.
References
Caspar, Vitor (2015), “How Large Are Global Energy Subsidies”, Presentation at
The Brookings Institution, 18 May.
http://www.imf.org/external/np/fad/subsidies/pdf/presentation.pdf
Coady, David, Ian Parry, Louis Sears and Baoping Shang (2015) “How Large Are
Global Energy Subsidies?” International Monetary Fund IMF Working Paper,
WP/15/105, Fiscal Affairs Department 1 May 2015
The enforcement of the carbon budget
constraint is still at risk of falling victim to the
free rider problem

Citi GPS: Global Perspectives & Solutions December 2015
© 2015 Citigroup
92
Energy 2030: Commodities Analysis Stranded Assets in Practice Conventional Wisdom May Be Wrong: Critical Role of Policies and Unintended Consequences
Two examples highlight the nuances of the “stranded asset” concept, as well as the
critical role of policies and their unintended consequences in determining what
could be stranded: (1) oil sands producers' surprising apparent embrace of the
recent proposal by the Alberta government to impose an emission cap on Alberta oil
sands production which indicates carbon intensive industries may be more resilient
to regulation than previously anticipated; and (2) the continued reliance on coal,
despite the supposed arrival of the Golden Age of Natural Gas.
Canadian Oil Sands
The just announced move by the Canadian province of Alberta to adopt a strict
emission reduction program provides an illustrative example of the nuances of the
stranded asset issue and its interplay with public policy. The province of Alberta,
where ~70% of Canada’s crude production is sourced and home to the carbon-
intensive oil sands industry, recently unveiled an aggressive climate change and
emission mitigation project, imposing a suite of strict regulations on carbon
emissions, including a per unit emissions tax, an explicit cap of 100 megatonnes of
greenhouse gas emissions per year on the oil sands industry and a plan to phase
out all coal-fired generation by 2030, to be replaced with renewables and natural
gas. The 100 megatonne cap gives the oil sands industry — already producing ~70
megatonnes annually — little room to grow in coming years absent technological
innovations to reduce the carbon intensity of bitumen extraction or the adoption of
expensive carbon capture technologies. At the same time, the higher tax on carbon
will raise breakeven prices for oil sands producers, which are already near the top
of the global cost curve.
Conventional wisdom would suggest that these new policies present a serious
threat to Canadian oil sands, an industry already challenged by the lower-for-longer
oil price environment and takeaway infrastructure hurdles, most recently highlighted
by President Obama’s rejection of the Keystone XL pipeline proposal. With these
new emission targets in place, the Canadian oil sands look like a prime example of
assets that could become “stranded” over the coming years. Yet, the reaction from
the oil sands industry to the new rules has been surprisingly positive as oil sands
producers have apparently embraced the stringent environmental regulations. The
plan has been endorsed by the Canadian Association of Petroleum Producers
(CAPP) as well as major oil sands producers, including Canadian Natural
Resources, Suncor, Cenovus and Shell, indicating that leaders of the industry are
optimistic that with the help of technology they can meet the new standards at an
acceptable cost.
This unconventional reaction may show that producers are determined to turn
supposed “stranded” assets into profitable assets by finding strategies to adapt to
new environmental regulations. Over the last year, industries like shale in the US
have proven to be surprisingly resilient in the face of collapsing oil prices,
experiencing 20-30% cost deflation and rapid efficiency gains. Carbon intensive
industries, like the Canadian oil sands, may likewise prove to be more adaptive to
increasingly strict environmental regulations than has been previously expected.
Technological innovation could help to bring down the cost of reducing carbon
emissions for these producers. Experiments are ongoing to see if radio waves, for
example, could replace steam, which uses a lot of water and natural gas as a fuel
Anthony Yuen
Ed Morse
Seth Kleinman
Adriana Knatchbull-Hugessen
Citi Commodities Research
Emission reductions program will leave little
room for growth in the oil sands industry in
the coming years
Surprisingly, major oil sands producers and
the industry have embraced the stringent
environmental regulations
The reaction could show that producers are
determined to keep their supposed
“stranded’ assets as profitable assets
through adaption to new regulations

December 2015 Citi GPS: Global Perspectives & Solutions
© 2015 Citigroup
93
source, to get oil out of oil sands. Certainly, the positive reception of the regulations
suggests that producers are relatively optimistic that reasonable margins can be
attained.
In fact, for an industry that has become the poster child in recent years for bad
practices and environmental and social negligence, the environmental rules may
actually turn beneficial for oil sands producers. The industry faces two principal
problems: (1) a perception problem from bad publicity and (2) opposition to
infrastructure builds – both of which are largely due to environmental issues. But by
embracing and adapting to new environmental rules, producers make strides
towards solving their perception problem, which may in turn help solve the
infrastructure problem as environmental opposition to the industry could ease. For
example, if lower emissions standards were met, it could either raise the possibility
that the US would allow some future version of the Keystone XL pipeline to go
ahead, or make other oil sands-related infrastructure projects more acceptable to
the public, governments and other civil society groups. The new rules also reduce
uncertainty and the potential for liability with regards to future environmental policy.
It remains to be seen, however, how resilient the Canadian oil sands industry will be
in this new regulatory environment. Nevertheless, this case highlights the highly
complex and potentially surprising nature of the stranded asset issue. Even in cases
where government policy is targeted at specific assets like the oil sands,
unexpected results can manifest.
Gas May Not Dethrone King Coal in Many Markets
Less targeted policies can have even greater unanticipated and certainly
unintended consequences, as can be seen in the nuances of the battle between
coal and gas amidst increasing environmental scrutiny of coal. Conventional
wisdom dictates that emission reduction targets should favor natural gas burn over
coal burn, yet in many cases emission reduction policies could fail to limit coal-fired
generation. Coal-fired generation remains highly competitive on a total cost basis in
many parts of the world, and particularly in important growth areas including
developing Asia. By the same token, even where the cost of a new gas plant is
cheaper than a new coal plant, on an operational cost basis, coal is still the
cheapest cost alternative globally ex-US. These dynamics mean that even small
adjustments to carbon emission policies can have outsized impacts on the
generation mix. Indeed, without targeted policies limiting coal generation, too lenient
emission targets could leave coal dominant over gas despite a carbon program.
In Europe, this exact story has largely played out already. The power market there
sees more robust generation from coal than gas despite the cost of emissions,
although gas is supposed to be the cleaner fossil fuel. Emission permit prices have
not been high enough to tilt the generation balance from coal to gas as gas prices
have remained relatively high in Europe while coal prices have stayed low.
Meanwhile, Europe has seen robust support for renewable energy, leading to a
surge in wind and solar installation. This additional zero marginal cost production
has driven down the price of electricity, only further encouraging the use of coal as
the cheapest cost generation fuel.
Coal consumption is still expected to rise in 6 of the 10 largest coal consuming
countries or regions because of policy-design or comparative generation economics
that may still favor coal. These surprising dynamics of coal versus gas under
regulatory constraints on carbon emissions are another illustrative example of the
complexity of the stranded asset issue. In practice, a nuanced approach to this
issue must be taken to fully assess potential risk and reward going forward.
By embracing the change, producers may
change the public’s bad perception of oil
sands
Policies that aren’t targeted enough can also
hurt as they don’t drive the anticipated result

Citi GPS: Global Perspectives & Solutions December 2015
© 2015 Citigroup
94
Appendix A Pricing Carbon Under Uncertainty: A Practical Approach for Finance
In the face of many uncertainties, the most straightforward way to price the risk in
investment decisions will be to assume a carbon price. However, what that price
should be at any given moment is anything but straightforward. Other carbon
markets offer some signposts, priced anywhere between $0 and $50/ton. In the EU
ETS, the world’s largest carbon market to date, emissions pricing has ranged
between zero and almost €30/ton. California has seen allowances price between
$11/ton and $23/ton. Prices in the US Northeast RGGI have been below $5/ton. The
US government has calculated its “social cost of carbon” around $40, but depending
on assumptions could actually be higher.51
For those regions with some form of power markets, the price of CO2 regionally
should be set by the marginal cost of abatement there. The marginal abatement
cost curve could make up of both the actual carbon reduction cost and coal-to-gas
switching in the power sector, as switching away from coal to gas is also a carbon
reduction strategy. There are many moving pieces that affect the marginal cost of
abatement, including local politics and macro conditions. (Note, this applies more to
power plants that operate in competitive markets or markets with multiple players,
rather than one that has an effective monopoly over all aspects of power
generation.)
Figure 67. Carbon prices vary widely
Source: Bloomberg, Citi Research
In the US, for example, the theoretical carbon price could be ~$14/ton if coal-to-gas
switching is the marginal abatement strategy. Here’s how it works: At $35/ton for
Illinois Basin coal and $10/ton for transport so that the delivered cost of coal is
~$45/ton, 23.6-MMBtu/ton in head content and 10 MMBtu/MWh in heat rate for
operating a generic coal plant, the marginal generation cost could be ~$19/MWh. At
51
http://www.epa.gov/climatechange/EPAactivities/economics/scc.html
0
5
10
15
20
25
30
35
0
5
10
15
20
25
Apr-2005 Apr-2008 Apr-2011 Apr-2014
Eu
ro/t
on
$/t
on
RGG California EUA (rhs)

December 2015 Citi GPS: Global Perspectives & Solutions
© 2015 Citigroup
95
$3.5/MMBtu Henry Hub gas, the marginal generation cost of a combined cycle gas
power plant should be around ~$26/MWh, assuming that a gas plant emits ~50%
less carbon than a coal plant. The carbon price that makes generation costs of both
sources equal would be ~$14/ton (because the generation costs become $33/MWh
for both the coal and gas power plants). Note that there are other commodity price
dynamics involved, but this could be the first step of a broader analysis. The more
predictable and stable the price signal is, the better incentive it will be.
Crucially, in an environment of uncertainty around whether and how carbon might
be priced, environmental policy risk shapes market outcomes. Climate52
policies
and potential future policies may create more of a liability for fossil fuel asset than
an incentive to build renewable energy assets. Numerous development and
financial institutions have already backed away from financing coal for exactly this
reason – there are clearly large future liabilities around climate change and climate
policy that are extremely hard to price. The World Bank has already cut back its
financing of coal projects globally53
, while other financial institutions have also
reduced financing of coal development54
. And if you can’t quantify the risk, it’s much
harder to be comfortable taking it. For this reason, the rise of climate policy creates
large liability which will disincentivize investment in the most emissions intensive
assets (coal power), even if the liability is hard to quantify.
Although the prospect of pricing in the negative externalities of carbon may have
positive incentive for renewable energy investment, markets still cannot yet easily
price environmental incentives or lend against them in many cases. A renewable
energy developer might have a hard time borrowing against the unknown future
value of credits; hence lenders may not allow renewable energy developers to price
the benefit of such credits in their return models. That said, a portfolio investor like a
utility may seek to increase the share of renewables in its generation mix as a way
to avoid total future carbon liabilities on its portfolio. That could create a greater bid
from utilities on the margin for renewable assets. In order to create an incentive for
renewable energy investment, policy makers would need to create clear, stable
incentives such as carbon pricing or consistent tax or incentive policies.
Investing in Renewable Energy at the Project Level Is Different in Three Key Ways:
The generation profile of renewable energy (mainly solar, wind, storage etc.) is
different from fossil fuel, nuclear or even hydroelectric generation. Investors have to
appreciate, to various levels of sophistication depending on how involved they are
at the project level, multiple components for renewable energy investment that are
different from fossil or nuclear power assets. These components are risk items that
need to be incorporated into the return calculation of projects. Hence, different
generation profiles of wind and solar, particularly the implied costs of intermittency,
compared with the smoother generation profile of fossil fuel, nuclear or even hydro
power plants, may require an augmented risk-adjusted return on capital (RAROC)
measure.
52
This refers to instances of potential future CO2 pricing, such as the clean power plant. 53
Except in “rare circumstances,” the World Bank has ceased funding new coal power
plants. 54
Citi announced its intentions to cut back on financing for coal mining projects, citing
climate change as the principal motivation. The bank has also noted that its credit
exposure to coal has significantly reduced since 2011, and will continue to decline.

Citi GPS: Global Perspectives & Solutions December 2015
© 2015 Citigroup
96
Renewable energy projects face additional risks that fossil fuel power plants don’t,
such as shaping and variable generation risk, the cost of ancillary services, and
data integrity.
Even if there is no intermittency, shaping risks relate to the mismatches
between electricity demand and generation during the day and seasonally. Often
renewable energy generation is strongest overnight for wind and strongest in the
middle of the day for solar. But the morning ramp-up in electricity demand after
wind has died down but before the sun rises, and, more importantly, the heavy
demand during the evening when usually both wind and solar generation is low,
present demand gaps that require generation to fill. The strength of wind and
solar generation also varies seasonally. Hence, pricing in the non-renewable
energy generation or storage needed to fill the demand gaps add to the overall
cost.
Variable generation risks relate to the intermittency of renewable energy
generation, which require fast-ramp backup generation facilities, storage assets
or demand-side management that could ramp up or down when there is a drop or
surge in generation. Calculating the probability of these happening, at what
magnitude and having backup electricity supply (or demand response) ready are
additional risk items that go into the overall risk-adjusted return.
Ancillary services provide the voltage support, balancing and other services
that maintain the integrity of the power grid. These have to be priced-in.
Data integrity is another issue for both historical calculations and forecasts. It
would be difficult to price in the above risks and costs without an accurate picture
of what the generation profile and intermittency look like in the past. Without
good data, it would also be difficult to forecast how much generation one should
expect from wind and solar assets, even down to the minutes – one might
generally schedule too much or at times too little backup if the forecasting of
renewable energy generation is not accurate.
The small-scale nature of some green energy projects often preludes larger
investors from investing at the project level, unless the projects are pooled together
(e.g. many rooftop solar units from multiple homes as one single generation
resource). Unlike traditional energy projects that involve large power plants and
major capital allocation, the value of small-scale renewable energy or distributed
energy resource, despite the growth trajectory expected, is necessarily smaller.
Attracting more capital to develop this space requires intermediaries that pool
assets together or that distributed generation resources are part of a larger
“microgrid” or something to that effect. Even if pooled, some of the contracts signed
between solar provider and homeowners, for instance, have terms that make
pooling together assets through traditional securitization procedures difficult. Is the
solar panel part of the house or not part of the house? What is the default risk? Is it
even senior to debt?
Large upfront capital cost, perhaps even around 80% of the total cost, makes
financing consideration dominate the overall investment on renewable energy.
Financing cost could be nearly 50% of the total project cost in some cases.
Therefore, for renewable energy to take off, aside from falling technology and
installation cost, it is critical that financing cost has to fall.

December 2015 Citi GPS: Global Perspectives & Solutions
© 2015 Citigroup
97
Author Biographies Reconciling Cheap Fossil Fuels in a Low Carbon World
De-Risking Through Public Sector Involvement
Stranded Assets in Practice
Anthony Yuen is responsible for global macro and quantitative strategy within Commodities Research at Citi.
He also conducts research on gas, power, coal, renewables, oil and emissions, and has published on climate
change, the shale revolution, energy exports, peak coal demand in China, competitive dynamics of fossil fuels
vs. renewables, nuclear in Japan and Russia-China gas, among others. Widely cited in the media, he also was
a reviewer of IEA’s World Energy Outlook and has advised the US EIA. Before Citi, he worked at McKinsey &
Company and Constellation Commodities Group – one of the largest physical/financial commodities trading
operations in North America then. He previously held research and teaching positions at the University of
Pennsylvania and was a faculty member of Columbia University. He received his undergraduate and graduate
engineering degrees (electrical/computer/photonics) from the University of Toronto and his Ph.D. degree in
Economics from the University of Pennsylvania. He is a member and Ambassador Lecturer of the Society of
Petroleum Engineers.
+1-212-723-1477 | [email protected]
Edward L Morse is Managing Director and Global Head-Commodities, Citi Research in New York. He
previously held similar positions at Lehman Brothers, Louis Capital Markets and Credit Suisse. Widely cited in
the media, he is a contributor to journals such as Foreign Affairs, the Financial Times, the New York Times,
The Wall Street Journal and the Washington Post. He was most recently ranked one of “The 36 Best Analysts
On Wall Street by Business Insider (one of two commodity analysts) and #23 among the “Top 100 Global
Thinkers of 2012” by Foreign Policy. He worked in the US government at the State Department, and later was
an advisor to the United Nations Compensation Commission on Iraq as well as to the US Departments of
State, Energy and Defense and to the International Energy Agency on issues related to oil, natural gas and the
impact of financial flows on energy prices. A former Princeton professor and author of numerous books and
articles on energy, economics and international affairs, Ed was the publisher of Petroleum Intelligence Weekly
and other trade periodicals and also worked at Hess Energy Trading Co. (HETCO).
+1-212-723-3871 | [email protected]
Seth M Kleinman joined Citi as Head of Energy Strategy on the commodities side. He covers all aspects of
global oil and gas markets. Seth has spent the last 15 years in the energy markets as an analyst, trader and
researcher. He started in market analysis at PFC Energy in Washington DC, moved into physical and prop
trading at Hess Energy Trading Company in New York. He moved to Morgan Stanley to write oil research,
before moving to London with Glencore to head up its global oil analysis team there.
+44-20-7986-4556 | [email protected]
Adriana Knatchbull-Hugessen is an analyst on the Citi Commodities Research team in New York where
she focuses on macro strategy, investor flows, agriculture and energy markets. She received her
undergraduate degree with highest honors in operations research from Princeton University.
+1-212-723-7193 | [email protected]

Citi GPS: Global Perspectives & Solutions December 2015
© 2015 Citigroup
98
Renewable Energy Cost Trends and Drivers
Michael Taylor is a senior energy analyst at IRENA with 20 years’ experience in energy modeling, the
economic analysis of energy sector issues and energy policy development. Michael is responsible for IRENA’s
analysis of renewable technologies cost and performance, which started with power generation and transport,
and will soon cover stationary applications. Prior to working with IRENA Michael worked at the IEA in the
Economic Analysis Division on the World Energy Outlook (WEO) and in the Energy Technology Policy Division
where he was responsible for leading the divisions’ modeling and analysis of the buildings sector, including the
development of IEA roadmaps for the buildings sector. He was one of the lead authors of the IEAs
groundbreaking Energy Technology Perspectives: Scenarios and Strategies to 2050 series of publications.
Michael is the author of IRENA’s Renewable Power Generation Costs in 2014 released in January 2015, which
draws on IRENA’s world-class database of over 15 000 utility-scale projects and 750 000+ small-scale solar
PV systems. Michael has contributed to numerous other publications that focus on the energy sector and the
economic and environmental challenges it faces.
Innovations in Alternative Energy Finance
Marshal Salant is the Global Head of Citi’s Alternative Energy Finance (AEF) Group in the Capital Markets
Origination Division. AEF focuses on providing full service financing solutions to Citi’s Alternative Energy
clients for alternative energy projects and pools of projects. Solutions include Construction Financing, Project
Debt Financing in the Bank and Bond Markets (144A and 4(2) Private Placements), Tax Equity, Leasing,
Project Equity, Warehouse/Accumulation Facilities, ABS Securitizations, and YieldCos, as well as
commodities, interest rate, and FX hedging. AEF also provides advisory services, and helps clients access
various Loan Guarantee Programs and other forms of government support. AEF is active in Wind, Solar, and
Geothermal Power projects, as well as Fuel Cells, Biomass, Synfuels, Waste-to-energy, and other new
renewable energy technologies, and Energy Efficiency.
Marshal joined Citi from Morgan Stanley, where he was a member of the Capital Markets Management
Committee and Head of the Global Structured Products Group. Mr. Salant has broad experience as a financial
engineer in Structured Finance and New Product Development of innovative and complex financial
instruments. During his years at Morgan Stanley, Mr. Salant led the development of the Structured Notes
business, the Collateralized Bond Obligations business, the Structured Credit business, the Structured Tax
business, the Structured Insurance Products business and the FIG Client Solutions business. While at Morgan
Stanley, Marshal had significant experience in Synfuel and Alternative Energy Tax Equity financings in the
Wind, Solar, and Geothermal sectors. Mr. Salant oversaw the investment of more than $2 billion in Tax Equity
and developed new financing structures, as agent and as principal, for numerous clients in the Alternative
Energy industry.
Mr. Salant is a Trustee of The Johns Hopkins University. He received his MBA, with Distinction, from The
Harvard Business School and holds BA and BES Degrees, with Honors, in Mathematical Sciences, from The
Johns Hopkins University.
+1-212-723-6096 | [email protected]
Bruce Schlein is a Director in Citi’s Alternative Energy Finance (AEF) Group in Capital Markets Origination; a
dedicated team providing full service financing solutions for all types of renewable energy and energy
efficiency. Prior to AEF Bruce worked as Director of Corporate Sustainability with Citi business and operations
units to identify and develop solutions for emerging environmental and social issues and opportunities.
Previously he worked as a sustainability specialist for Bechtel on petrochemical and civil projects in China and
Romania, and for international development agencies including Save the Children, Catholic Relief Services in
Bosnia Herzegovina and the U.S. Peace Corps in Papua New Guinea. Bruce is a graduate of Cornell
University and holds a Masters in International Affairs from Johns Hopkins Nitze School of Advanced
International Studies (SAIS).
+1-212-723-1836 | [email protected]

December 2015 Citi GPS: Global Perspectives & Solutions
© 2015 Citigroup
99
Richard Morse is an associate in Citi Alternative Energy Finance. Previously, he was part of Citi
Commodities Strategy in New York, where he focused on energy markets. Prior to Citi, he directed research on
global coal markets at Stanford University’s Program on Energy and Sustainable Development, where his work
focused on international coal, power, and natural gas markets and was frequently cited in international media.
He is also co-editor and contributing author of the book The Global Coal Market on Cambridge University
Press. Prior to Stanford Richard worked in energy trading at BP, with a focus on oil, gas, and renewable
energy. He also co-founded SuperCritical Capital, an energy advisory firm. He received his MBA from the
University of Chicago, concentrated in finance and econometrics, and his undergraduate degree from Rice
University.
+1-212-723-6667 | [email protected]
Securitization Solutions for a Greener Planet
Mary E Kane is Head of Global Securitized Products Research. She is a member of the Citi fixed income
research team and manages a group of research professionals covering US Consumer ABS, European
ABS/RMBS, and US CMBS. The groups publish frequent strategy commentary and ad hoc research reports.
For the past 10 years, Mary has ranked as a Top 3 analyst in Institutional Investor magazine's All-America
Fixed Income Research Poll for the US Consumer Asset-Backed Securities sector. She has worked in banking
for over 25 years, and she has held previous positions as a portfolio manager at Creditanstalt Bank, as well as
banking and treasury positions at Swiss Bank Corp. in New York and Basel, Switzerland. Mary received her
BA degree from Boston College and an MBA degree from the University of Massachusetts.
+1-212-816-8409 | [email protected]
Eugene Belostotsky is a member of Citi’s US Consumer ABS Strategy team. Prior to joining the firm in
2010, he was with Fidelity Management and Research, having begun his career at JP Morgan. Eugene holds a
Bachelor of Science degree from MIT and a Master of Science degree from the London School of Economics.
+1-212-816-8432 | [email protected]
Renewable Energy Project Structuring and Hedging in the US
Roxana Popovici is a Director at Citi in the Commodity Structured Products group. Roxana spearheads the
renewable business within the structured products group and has over 15 years of experience in commodity
markets. Prior to joining Citi, Roxana worked for UBS, El Paso Energy and Sempra Energy Solutions. Roxana
has a vast array of experience with the cycle of a transaction from deal origination, structuring, optimization of
credit & market risk terms within a broader context of lenders and tax equity investors to documentation and
effective deal execution. Roxana’s recent commodity transactions include several long-dated purchases of
power and renewable energy credits from a number of wind projects as well as successful syndications.
+1-212-816-5081 | [email protected]
Michael Curry is the head of Citi’s Commodities North American Structured Products business. His teams
focus on customized solutions for clients with features that include risk management solutions, advantageous
credit and collateral structures, and the provision of capital. His teams have been recognized by EnergyRisk
Magazine winning multiple Electricity, Derivative and Deal of the Year awards during 2014 and 2015. Previous
to Citi, Mr. Curry was a Managing Director at UBS where he was the Americas Head of Sales for Commodities.
Prior to joining UBS, he was a Director for Enron Capital & Trade where he led various power and gas groups
throughout the US and traded natural gas for NESI Energy Marketing, Inc. an affiliate of NiSource where he
started his career as an engineer. Mr. Curry is a graduate of Northwestern’s Kellogg Graduate School of
Business and has a Bachelor of Science degree in Mechanical Engineering from the University of Notre Dame.
+1-713-693-6866 | [email protected]

Citi GPS: Global Perspectives & Solutions December 2015
© 2015 Citigroup
100
Financing Global Renewable Energy with Development Finance Institutions
Georges Romano is a Managing Director and Regional Head for Export and Agency Finance group for Latin
America where his responsibilities encompass all business development activities of Citi in Latin America and
the Caribbean region. Georges leads a team of 10+ professionals across offices in New York, Sao Paulo,
Mexico City, and Panama, spanning a wide range of sectors such as aviation, shipping, power, telecom,
industrials, transportation, and financial institutions. Georges joined Citi from Credit Agricole Corporate and
Investment Bank where he was Head of Project Finance for Latin America. In his role, Georges established
and grew a highly successful global project finance organization, providing a diverse product offering including
project finance, reserve based lending, structured commodity finance, and multilateral/ECA financing. Georges
directed all origination and execution efforts for projects covering infrastructure, natural resources, and power
sectors, delivering arranging, financial advisory services, and debt capital markets solutions to both strategic
and financial sponsors. Georges was recognized with numerous awards from Project Finance Magazine and
Project Finance International for notable business success for transactions in Mexico, Chile, Peru, Colombia,
and Brazil. Georges holds an MBA-equivalent degree from HEC School of Management of Paris, France and a
Master’s degree in management from Erasmus University of Rotterdam, Netherlands.
+1-212-816-6158 | [email protected]
Valentino Gallo is the Global Head for Citi’s Export and Agency Finance group based in New York. In this
role, Valentino is responsible for driving Citi’s market-leading export and agency finance solutions globally.
These solutions include agency-supported working capital financing, longer-term structured trade models and
project financing. Valentino has over 20 years’ experience in cross-border finance and has led the
arrangement of many ground-breaking export credit and multi-source financings. Valentino joined Citibank in
Italy, in the predecessor business of Export and Agency Finance, where he was Region Head for Southern
Europe, Germany, Austria and Switzerland. He moved to New York in 1999 as Head of Emerging Markets
Origination and then Global Manager of Structured Trade Finance. Prior to joining Citi, Valentino worked with
Fiat in Italy and Venezuela in the international treasury department. Valentino is a speaker at many industry
events. He has been a member of the Advisory Board of the US Ex-Im Bank. He is a senior credit officer of Citi
and a member of Citi’s Environmental and Social Risk Advisory Committee. He holds a degree in business
administration from the University of Venice.
+1-212-816-1008 | [email protected]
Innovation to Unlock Developing Economy Finance: Currency Risk Reduction
Barbara Buchner is Senior Director of Climate Policy Initiative. She leads CPI’s global climate finance
program and directs the European office’s research and operations. In 2014, Barbara was named one of the
20 most influential women in climate change. She directs CPI’s work as Secretariat of the Global Innovation
Lab for Climate Finance, a new public-private initiative that identifies cutting edge climate finance instruments
with the potential to drive investment at scale. She is the lead author on CPI’s Global Landscape of Climate
Finance analyses, the most comprehensive overview of global climate finance flows available, which have
been cited widely and served as the basis for the 2014 Intergovernmental Panel on Climate Change Working
Group 3 report chapter on climate finance.
Barbara supports various high level leaders in finance, energy policy, and climate change in an advisory role.
Over the past several years, she has built and directed the San Giorgio Group, which brings together key
financial institutions actively engaged in green, low-emissions finance in collaboration with the World Bank
Group, CLP (China Light & Power), and the OECD (Organisation for Economic Co-operation and
Development). Buchner regularly speaks at high-profile events as an expert in climate policy and climate
finance, and has presented at Climate Week, at the Climate Finance Ministerial, as part of the GCF Private
Sector Facility, at COP side-events, and at the BNEF Summit among many others. Barbara was promoted
from Director to Senior Director in 2013. Previously she served as a Senior Energy and Environment Analyst at
the International Energy Agency (IEA) and as a Senior Researcher at the Fondazione Eni Enrico Mattei
(FEEM) where she was involved in a number of activities related to FEEM’s Climate Change Policy and
Modelling Unit in the field of environmental economics. She holds a PhD in Economics from the University of
Graz and was a Visiting Scholar at the Massachusetts Institute of Technology (MIT).

December 2015 Citi GPS: Global Perspectives & Solutions
© 2015 Citigroup
101
Will Fossil Fuels be Stranded?
Willem Buiter joined Citi in January 2010 as Chief Economist. One of the world’s most distinguished
macroeconomists, Willem previously was Professor of Political Economy at the London School of Economics
and is a widely published author on economic affairs in books, professional journals and the press. Between
2005 and 2010, he was an advisor to Goldman Sachs advising clients on a global basis. Prior to this, Willem
was Chief Economist for the European Bank for Reconstruction & Development between 2000 and 2005, and
from 1997 and 2000 a founder external member of the Monetary Policy Committee of the Bank of England. He
has been a consultant to the IMF, the World Bank, the Inter-American Development Bank and the Asian
Development Bank, the European Commission and an advisor to many central banks and finance ministries.
Willem has held a number of other leading academic positions, including Cassel Professor of Money &
Banking at the LSE between 1982 and 1984, Professorships in Economics at Yale University in the US
between 1985 and 1994, and Professor of International Macroeconomics at Cambridge University in the UK
between 1994 and 2000. Willem has a BA degree in Economics from Cambridge University and a PhD degree
in Economics from Yale University. He has been a member of the British Academy since 1998 and was
awarded the CBE in 2000 for services to economics.
+1-212-816-2363 | [email protected]
Ebrahim Rahbari is a Director in the Global Economics Team of Citi Research in New York. Ebrahim works
closely with Citi global Chief Economist Willem Buiter and focuses on economic events, developments and
trends of global significance, including trends in monetary policy, global investment, debt and deleveraging and
longer-term growth in output and trade. Ebrahim joined Citi in 2010 and prior to his current role, Ebrahim was a
Director of European and Global Economics in London, where he focused on economic developments in the
Eurozone, including the ECB and the European sovereign debt and banking crisis, and was Citi's lead
economist for Germany (2012-15) and for Spain (in 2012). Ebrahim holds a Master's degree and PhD in
Economics from London Business School and a BA (Hons) in Economics and Management from Oxford
University (Balliol College).
Citi Global Perspectives & Solutions (Citi GPS) is designed to help our clients navigate the global economy’s most demanding challenges, identify future themes and trends, and help our clients profit in a fast-changing and interconnected world. Citi GPS accesses the best elements of our global conversation and harvests the thought leadership of a wide range of senior professionals across the firm. All Citi GPS reports are available on our website www.citi.com/citigps
The Global Art Market Perspectives on Current Drivers & Future trends November 2015
The Curtain Falls How Silicon Valley is Challenging Hollywood October 2015
Energy Darwinism II Why a Low Carbon Future Doesn’t Have to Cost the Earth August 2015
Disruptive Innovations III Ten More Things to Stop and Think About July 2015
Public Wealth of Nations Unlocking the Value of Global Public Assets June 2015
Women in the Economy Global Growth Generators May 2015
Car of the Future v2.0 Mobility Transformation: Full Steam Ahead May 2015
Beyond China The Future of the Global Natural Resources Economy March 2015
Technology at Work The Future of Innovation and Employment February 2015
Investment Highlights in 2015 Dealing with Divergence January 2015
Corporate Finance Priorities 2015 Driving Corporate Growth in Divergent Markets January 2015
The Re-Birth of Telecom Monopoly Is the Industry Broken & Heading Back to its Monopolistic Roots November 2014
Energy 2020: Out of America The Rapid Rise of the US as a Global Energy Superpower November 2014
Asset Allocation for a New Era Diversification, Not Rotation, is the New Watchword October 2014
Future Opportunities, Future Shocks Key Trends Shaping the Global Economy and Society October 2014
Taking It To The Streets The New Vox Populi Risk May 2014
The Car of the Future Transforming Mobility As We Know It May 2014
Disruptive Innovations II Ten More Things to Stop and Think About May 2014

Upwardly Mobile III Mobility Unchained: From Mobile Commerce to IoT January 2014
2014 Year Ahead Investment Themes January 2014
Abenomics Four Arrows to Target Four Challenges October 2013
Energy Darwinism The Evolution of the Energy Industry October 2013
Call of the Frontier II On the Right Track to be Tomorrow’s EMs September 2013
Energy 2020 Trucks Trains & Automobiles: Start your Natural Gas Engines June 2013
The Global Search for Yield How Today’s Markets Shape Tomorrow’s Companies May 2013
Disruptive Innovation Ten Things to Stop and Think About April 2013
Energy 2020 Independence Day: Global Ripple Effects of the N. American Energy Revolution February 2013
2013 Year Ahead Investment Themes January 2013
2013 Year Ahead Corporate Finance Priorities January 2013
Upwardly Mobile II A Long and Winding Road for Mobile Payments November 2012
China in Transition What We Know, What We Don’t Know November 2012
Global Debt Mr. Macawber’s Vindication November 2012
Sub-Saharan Africa The Route to Transformative Growth September 2012
China & Emerging Markets China is About to Rebalance. How Will EM be Affected? July 2012
Energy 2020 North America, the New Middle East? March 2012
Upwardly Mobile An Analysis of the Global Mobile Payments Opportunity March 2012
2012 Year Ahead Corporate Finance Priorities January 2012
2012 Year Ahead Investment Themes January 2012
Call of the Frontier The Search for a New Generation of Emerging Markets November 2011
Trade Transformed The Emerging New Corridors of Trade Power October 2011

Citi GPS: Global Perspectives & Solutions December 2015
© 2015 Citigroup
104
Notes

December 2015 Citi GPS: Global Perspectives & Solutions
© 2015 Citigroup
105
Notes

Citi GPS: Global Perspectives & Solutions December 2015
© 2015 Citigroup
106
IMPORTANT DISCLOSURES
This communication has been prepared by Citigroup Global Markets Inc. and is distributed by or through its locally authorised affiliates (collectively, the "Firm") [E6GYB6412478]. This communication is not intended to constitute "research" as that term is defined by applicable regulations. Unless otherwise indicated, any reference to a research report or research recommendation is not intended to represent the whole report and is not in itself considered a recommendation or research report. The views expressed by each author herein are his/ her personal views and do not necessarily reflect the views of his/ her employer or any affiliated entity or the other authors, may differ from the views of other personnel at such entities, and may change without notice. You should assume the following: The Firm may be the issuer of, or may trade as principal in, the financial instruments referred to in this communication or other related financial instruments. The author of this communication may have discussed the information contained herein with others within the Firm and the author and such other Firm personnel may have already acted on the basis of this information (including by trading for the Firm's proprietary accounts or communicating the information contained herein to other customers of the Firm). The Firm performs or seeks to perform investment banking and other services for the issuer of any such financial instruments. The Firm, the Firm's personnel (including those with whom the author may have consulted in the preparation of this communication), and other customers of the Firm may be long or short the financial instruments referred to herein, may have acquired such positions at prices and market conditions that are no longer available, and may have interests different or adverse to your interests. This communication is provided for information and discussion purposes only. It does not constitute an offer or solicitation to purchase or sell any financial instruments. The information contained in this communication is based on generally available information and, although obtained from sources believed by the Firm to be reliable, its accuracy and completeness is not guaranteed. Certain personnel or business areas of the Firm may have access to or have acquired material non-public information that may have an impact (positive or negative) on the information contained herein, but that is not available to or known by the author of this communication. The Firm shall have no liability to the user or to third parties, for the quality, accuracy, timeliness, continued availability or completeness of the data nor for any special, direct, indirect, incidental or consequential loss or damage which may be sustained because of the use of the information in this communication or otherwise arising in connection with this communication, provided that this exclusion of liability shall not exclude or limit any liability under any law or regulation applicable to the Firm that may not be excluded or restricted. The provision of information is not based on your individual circumstances and should not be relied upon as an assessment of suitability for you of a particular product or transaction. Even if we possess information as to your objectives in relation to any transaction, series of transactions or trading strategy, this will not be deemed sufficient for any assessment of suitability for you of any transaction, series of transactions or trading strategy. The Firm is not acting as your advisor, fiduciary or agent and is not managing your account. The information herein does not constitute investment advice and the Firm makes no recommendation as to the suitability of any of the products or transactions mentioned. Any trading or investment decisions you take are in reliance on your own analysis and judgment and/or that of your advisors and not in reliance on us. Therefore, prior to entering into any transaction, you should determine, without reliance on the Firm, the economic risks or merits, as well as the legal, tax and accounting characteristics and consequences of the transaction and that you are able to assume these risks. Financial instruments denominated in a foreign currency are subject to exchange rate fluctuations, which may have an adverse effect on the price or value of an investment in such products. Investments in financial instruments carry significant risk, including the possible loss of the principal amount invested. Investors should obtain advice from their own tax, financial, legal and other advisors, and only make investment decisions on the basis of the investor's own objectives, experience and resources. This communication is not intended to forecast or predict future events. Past performance is not a guarantee or indication of future results. Any prices provided herein (other than those that are identified as being historical) are indicative only and do not represent firm quotes as to either price or size. You should contact your local representative directly if you are interested in buying or selling any financial instrument, or pursuing any trading strategy, mentioned herein. No liability is accepted by the Firm for any loss (whether direct, indirect or consequential) that may arise from any use of the information contained herein or derived herefrom. Although the Firm is affiliated with Citibank, N.A. (together with its subsidiaries and branches worldwide, "Citibank"), you should be aware that none of the other financial instruments mentioned in this communication (unless expressly stated otherwise) are (i) insured by the Federal Deposit Insurance Corporation or any other governmental authority, or (ii) deposits or other obligations of, or guaranteed by, Citibank or any other insured depository institution. This communication contains data compilations, writings and information that are proprietary to the Firm and protected under copyright and other intellectual property laws, and may not be redistributed or otherwise transmitted by you to any other person for any purpose. IRS Circular 230 Disclosure: Citi and its employees are not in the business of providing, and do not provide, tax or legal advice to any taxpayer outside of Citi. Any statements in this Communication to tax matters were not intended or written to be used, and cannot be used or relied upon, by any taxpayer for the purpose of avoiding tax penalties. Any such taxpayer should seek advice based on the taxpayer’s particular circumstances from an independent tax advisor. © 2015 Citigroup Global Markets Inc. Member SIPC. All rights reserved. Citi and Citi and Arc Design are trademarks and service marks of Citigroup Inc. or its affiliates and are used and registered throughout the world.

December 2015 Citi GPS: Global Perspectives & Solutions
© 2015 Citigroup
107
NOW / NEXT Key Insights Regarding the Future of Green Energy
INNOVATION Costs in the power sector can vary significantly across countries. However, one thing
that is consistent across regions is that financing costs are significant in the overall
spend for renewables projects. / Innovative financing that decreases the cost of
financing for renewables is an important driver of relative economics between
renewables and fossil fuels going forward.
COMMODITIES Conventional wisdom believes renewables could be a major winner with gas
entering its golden age (perhaps as a bridge fuel to even more renewables) and coal
the biggest loser. / Coal could be much more resilient than forecast as prospects for
a significant increase in coal pricing that might hinder competitiveness of
renewables or gas appear limited and hinge crucially on India and China.
POLICY New environmental standards globally have increased the cost of fossil fuel
extraction while the prices buyers are willing to pay for fossil fuels have reduced to
the point that future extraction of previously profitable resources is no longer
profitable, making them ‘stranded assets’. / Despite policy, the enforcement of
carbon budget constraints will still be at risk of falling victim to the free rider
problem.

Citi GPS: Global Perspectives & Solutions © 2015 Citigroup
www.citi.com/citigps