energy 2020 documentation volume 3
TRANSCRIPT

ENERGY 2020 Documentation
Volume 3 Demand Sector
Code Description
Systematic Solutions, Inc. Policy Assessment Corp. 534 E. Dayton-Yellow Springs Rd. 14604 West 62nd Place Fairborn, Ohio 45324 Arvada, Colorado 80004 (513) 878-8603 (303) 467-3566
ENERGY 2020 Demand Sector
Table of Contents
Demand Sector Code Description
INTRODUCTION ...............................................................................................................1 DEMAND: RESIDENTIAL, COMMERCIAL, INDUSTRIAL, TRANSPORTATION ...4 PROCEDURE TPRICE: FUEL PRICES AND TECHNOLOGY MAPPING ............................................................................4
Energy Constraint Multiplier....................................................................................................................................4 End-use Prices ..........................................................................................................................................................4
PROCEDURE DMARGINAL: DEVICE EFFICIENCY AND CAPITAL COSTS ...................................................................5 Device Capital Charge Rate .....................................................................................................................................5 Device Efficiencies & Capital Costs.........................................................................................................................6 Marginal Fuel Costs .................................................................................................................................................8
PROCEDURE DDSM: DEVICE DEMAND SIDE MANAGEMENT PROGRAMS ..................................................................8 Calculating the Device Capital Charge Rate with an Incentive ...............................................................................9 Device Efficiencies and Capital Costs with Incentives .............................................................................................9 Capitalized Conservation Expense from Low Interest Loans.................................................................................12
PROCEDURE CMARGINAL: PROCESS EFFICIENCY AND CAPITAL COSTS ...............................................................13 Process Capital Charge Rate .................................................................................................................................13 Process Efficiency & Capital Cost .........................................................................................................................14
PROCEDURE CDSM: PROCESS DEMAND SIDE MANAGEMENT PROGRAMS...............................................................15 Endogenous Process DSM......................................................................................................................................15 Capitalized Conservation Expense from Low Interest Loans.................................................................................18
PROCEDURE CIMPACT: CROSS-IMPACTS OF ONE END-USE ON ANOTHER ...............................................................19 Loss Intensity ..........................................................................................................................................................19
PROCEDURE MSHARE: MARGINAL MARKET SHARES ...........................................................................................20 Market Share Determination ..................................................................................................................................20
PROCEDURE FUELSYSTEM: SYSTEM-BASED FUEL CHOICE..................................................................................21 Fuel System Selection .............................................................................................................................................21 Market Share ..........................................................................................................................................................21
PROCEDURE MSTOCK: MARGINAL STOCK CHANGES ............................................................................................22 End-Use Saturations...............................................................................................................................................22 Stock Life-Cycle Dynamics .....................................................................................................................................23
PROCEDURE CONVERSION: DEVICE RETIREMENTS AND FUEL CONVERSIONS .....................................................25 Device Fuel Conversions ........................................................................................................................................26 Devices from Conversions ......................................................................................................................................28 Device and Retirement Accounting.........................................................................................................................29
PROCEDURE PRETROFIT: PROCESS RETROFITS .....................................................................................................30 Process Capital Charge Rate for a Retrofit............................................................................................................30 Resource Curves for Retrofits.................................................................................................................................31 Process Investment Decision - Endogenous ...........................................................................................................34 Capitalized Conservation Expense from Low Interest Loans.................................................................................35
PROCEDURE DRETROFIT: DEVICE RETROFITS ......................................................................................................36 Marginal Value of Device Retrofits ........................................................................................................................36 Device Retrofit Market Shares................................................................................................................................37 Capitalized Conservation Expense from Low Interest Loans.................................................................................39
PROCEDURE TSTOCK: TOTAL STOCK UPDATE.......................................................................................................40 PROCEDURE UTILIZE: SHORT-TERM "UTILIZATION" DSM.....................................................................................40
Average Process Cost .............................................................................................................................................40 Budget Capital Charge Rate...................................................................................................................................41 Marginal value of device usage ..............................................................................................................................41 Market Shares.........................................................................................................................................................42
Systematic Solutions, Inc. ii Policy Assessment Corp.

ENERGY 2020 Demand Sector
Modifying Device Replacement, New Capital Additions, and New Process Replacement to Account for the Budget Constraint...................................................................................................................................................43 Conservation Expenses ...........................................................................................................................................44
PROCEDURE EUDEMAND: END-USE DEMAND DYNAMICS ...................................................................................44 Budget Response.....................................................................................................................................................44 Average Process And Device Efficiency .................................................................................................................45 Endogenous End-use Demand................................................................................................................................46 Exogenous Demands...............................................................................................................................................47
PROCEDURE FUNGIBLE: FUNGIBLE DEMANDS......................................................................................................47 Exogenous Fungible Demands: ..............................................................................................................................47
PROCEDURE COGENERATION .............................................................................................................................48 Renewable Resource Curves...................................................................................................................................48 Cogeneration Capital Charge Rate ........................................................................................................................48 Marginal Cost of Cogeneration..............................................................................................................................49 Allocation Weight and Market Share......................................................................................................................50 Exogenous Market Shares ......................................................................................................................................50 Cogeneration Capacity ...........................................................................................................................................50 Cogeneration Load and Energy..............................................................................................................................51 Cogeneration Demands ..........................................................................................................................................52
PROCEDURE TOTDEMAND: TOTAL DEMAND.......................................................................................................53 Total Demand .........................................................................................................................................................53 Energy Demands by Energy Sector ........................................................................................................................54 Energy Cost per Dollar of Output ..........................................................................................................................54 Energy Costs (M$/YR) ............................................................................................................................................54 Society Service Energy Bill ($/YR) .........................................................................................................................54
PROCEDURE POLLUTION: END-USE POLLUTION ...................................................................................................54 Average Pollution ...................................................................................................................................................55 Cogeneration Pollution ..........................................................................................................................................56 Total Pollution ........................................................................................................................................................57
PROCEDURE DSMPOST: POST PROCESS CALCULATIONS FOR DSM EVALUATION .................................................58 Incentives ................................................................................................................................................................58 Participant Level ....................................................................................................................................................60
PROCEDURE LOADMGMT: LOAD MANAGEMENT..................................................................................................63 Load Management Device Capital Charge Rate:...................................................................................................63 Load Management Fuel Price ................................................................................................................................63 Load Management Indicated Market Share ...........................................................................................................63 Load Management Capitalized...............................................................................................................................64 Load Management Expensed:.................................................................................................................................64 Load Management can also be specified exogenously:..........................................................................................64
PROCEDURE LOADCURVE....................................................................................................................................64 Device Load Curves................................................................................................................................................64
PROCEDURE NOLOADCURVE: ELECTRIC SALES WHEN LOAD SHAPES ARE NOT AVAILABLE ................................66 PROCEDURE DAILYUSE: GAS UTILITY DAILY USE CURVE .....................................................................................67 PROCEDURE NODAILYUSE: GAS SALES WHEN LOAD SHAPES ARE NOT AVAILABLE .............................................68
Gas Sales by end-use and Economic Category. .....................................................................................................68 Exogenous Transportation Sales ............................................................................................................................69
INITIAL: RESIDENTIAL, COMMERCIAL, INDUSTRIAL, TRANSPORTATION ....69 PROCEDURE IPRICE................................................................................................................................................69
Device Table Index from Fuel Prices .....................................................................................................................69 Investment Levelization Rate - the Capital Charge Rate........................................................................................70 Cost of Using a Device ...........................................................................................................................................71 Calculate Trade-Off Table Indices from Capital Costs ..........................................................................................71
PROCEDURE INITIAL..............................................................................................................................................72 Weighting the Capacity Utilization Factor by Output ............................................................................................72 Energy Requirements by End-use ...........................................................................................................................73
Systematic Solutions, Inc. iii Policy Assessment Corp.

ENERGY 2020 Demand Sector
Process Energy Requirements of Capital Stock......................................................................................................73 Saturation ...............................................................................................................................................................73 Calculate indicated EUPC as FPC ........................................................................................................................73 Calculate Process Efficiency ..................................................................................................................................74 Split Capital Stock by Age ......................................................................................................................................75 Cooling to Heating Efficiency Ratio .......................................................................................................................76 Initialize Average Budget........................................................................................................................................76 Initialize Cogeneration ...........................................................................................................................................76
PROCEDURE CONSTANT .......................................................................................................................................76 Device Efficiency Trade-off Curve Coefficients......................................................................................................77 Process Efficiency Trade-off Curve Coefficients ....................................................................................................78
PROCEDURE POLLUTION ......................................................................................................................................81 Embodied Pollution from Cogeneration.................................................................................................................81 Embodied Pollution ................................................................................................................................................82
INDEX ...............................................................................................................................83
Systematic Solutions, Inc. iv Policy Assessment Corp.

ENERGY 2020 Demand Sector
Volume III
DEMAND SECTOR CODE DESCRIPTION
INTRODUCTION In the previous chapter, a general overview and flowcharts of the demand sector were presented. This chapter contains a more detailed analysis of the demand modeling mechanics. Each line of descriptive code contained in the twenty-six procedures that comprise the basic demand sector is explained, along with the procedures in the supporting initial and calibration files, variable by variable. Justification for particular constructions and functional forms can be found in the following chapter containing the theoretical documentation.
The primary function of the demand sector is to simulate total demand (including feedstocks and cogeneration) by fuel, economic class and end-use. Any policies designed to affect demand such as mandates, tax changes, rebates, time-of-use or interruptible rates, or subsidized loans are modeled in this sector. In addition, electric and natural gas load curves are estimated, and energy-related pollution is tracked.
In the demand sector, investments in capital stocks result in embodied process energy requirements (PER) such as the heat from a furnace required for production. These process requirements last the 45 to 60 years of the capital stock life. As capital stock investments are made, choices of fuel type and level of energy efficiency are made. Given fuel prices, marginal energy efficiencies and capital costs for equipment are determined using efficiency/cost trade-off curves based on consumer preferences. Capital, operating and fuel costs, combined and discounted, provide a marginal cost of using energy (MCFU). The MCFU is then used to determine process efficiencies (PEE) and the marginal market share of each fuel with regard to new capital additions.
Equipment (devices) used in a factory or building are replaced every 10 to 20 years. These devices have a thermal efficiency and are used to satisfy the process needs. Investments in equipment represent embodied energy device requirements (DER). These devices are utilized (and require energy) as the factory is utilized. Engineering corrections are made for temperature dependent use and environmental constraints. Other corrections captures short-term budget constraint responses and long-term socio-economic effects on energy use. The former represents temporary consumer cutbacks made when energy prices rise and the latter represents changes that are caused, for example, by the female-labor participation rate and reduced family size.
Chapter Three is divided into three Sections. Section Two describes the “initial” source codes: RINITIAL.SRC, IINITIAL.SRC, CINITIAL.SRC, and TINITIAL.SRC. These source codes contain procedures that initialize certain variables used in the demand sector procedures. Section Three describes the calibration files: CCALIB.SRC and ICALIB.SRC. These files produce the calibrated variables used in the demand sector. Section One describes demand sectors (RDEMAND.SRC, CDEMAND.SRC, IDEMAND.SRC and TDEMAND.SRC) and defines and explains the following procedures:
Systematic Solutions, Inc. 1 Policy Assessment Corp.
ENERGY 2020 Demand Sector
1. PROCEDURE TPRICE: Fuel Prices and Technology Mapping Procedure one calculates the total energy constraint multiplier and maps global fuel prices into local prices.
2. PROCEDURE DMARGINAL: Device Efficiency and Capital Costs In this procedure, the device efficiencies (DEE), device capital costs (DCC), the marginal cost of fuel use (MCFU) and the device capital charge rate (DCCR) are computed.
3. PROCEDURE DDSM: Device Demand Side Management Programs This procedure simulates the consumer response (DEER) to a demand side management program (rebate, standard or interest reduction) and its effects on device efficiency (DEE) and capital costs (DCC).
4. PROCEDURE CMARGINAL: Process Efficiency and Capital Costs In this procedure, the marginal process efficiencies (PEE) and capital costs (PCC), cost of fuel use (MCFU) and the process capital charge rate (PCCR) are computed.
5. PROCEDURE CDSM: Process Demand Side Management Programs This procedure simulates the consumer response (PEER) to a demand side management program (rebate, standard or interest reduction) and its effects on process efficiency (PEE) and capital costs (PCC).
6. PROCEDURE CIMPACT: Cross-Impacts of one end-use on another Some efficiency changes have cross impacts. For example, more efficient lighting gives off less heat, saving energy when air conditioning is needed but increasing energy needs in the winter. This procedure calculates those impacts by assuming the MCFU decision is primary and determines building characteristics. Cross-impacts then affect only size (volume) needs.
7. PROCEDURE MSHARE: Marginal Fuel Market Shares A market allocation weight (MAW) is computed for each fuel (TE) in each end-use (EU) in each economic class (EC). Summing over the fuels, a total allocation weight by (EC) and (EU) is calculated. The ratio of the MAW/TAW yields the fuel market share fraction by device for each economic class (MMSF).
8. PROCEDURE FUELSYSTEM: System-Based Fuel Choice System based fuel choices are calculated using market shares.
9. PROCEDURE MSTOCK: Marginal Stock Changes This procedure calculates End-use Saturations (Using Electric or Weighted-Average as the Reference Fuel), and process and device energy additions.
10. PROCEDURE CONVERSION: Device Retirements and Fuel Conversions The short term utilization multiplier (BM) is calculated in this procedure. This multiplier captures income-motivated short term energy behavior changes (such as biking to work). These adjustments tend to be short-lived as the consumer’s budget returns to normal.
11. PROCEDURE PRETROFIT: Process Retrofits The effects on energy demand of process capital retrofits are calculated in this procedure.
12. PROCEDURE DRETROFIT: Device Retrofits The effects on energy demand of device retrofits are calculated in this procedure.
Systematic Solutions, Inc. 2 Policy Assessment Corp.

ENERGY 2020 Demand Sector
13. PROCEDURE TSTOCK: Total Stock Update The procedure updates the total productive capacity (EUPC), the process energy requirements (PER) and the device energy requirements (DER) with additions and retirements.
14. PROCEDURE UTILIZE: Short-term "utilization" DSM The short term utilization multiplier (BM) is calculated in this procedure. This multiplier captures income-motivated short term energy behavior changes (such as biking to work). These adjustments tend to be short-lived as the consumer’s budget returns to normal.
15. PROCEDURE EUDEMAND: End-Use Demand Dynamics This procedure calculates the new and average consumer energy budgets, average and marginal process efficiencies and end use demand.
16. PROCEDURE FUNGIBLE: Fungible Demands This procedure calculates the energy demand that can be served by at least two fuels (FSDMD).
17. PROCEDURE COGENERATION ENERGY 2020 considers cogeneration to be self-generation - generation for own use only. Customers who sell power are considered small power producers and are simulated in the supply sector. This procedure calculates the cogeneration potential (CGPOT) in the service area in question, the cogeneration capacity (CGCR) and cogeneration demand (CGDMD).
18. PROCEDURE TOTDEMAND In this procedure total demand by class (ECD) and sector (DMDES) are calculated as well as total energy costs (ECOSTS) and energy costs per dollar of output (ECOST). A dollar value of energy service (SEB - including capital) is also calculated.
19. PROCEDURE POLLUTION: End-use Pollution In this accounting procedure, the emissions of CO2, CO, volatile organics, NOX, SOX, and particulates from the burning of fuels at the consumer end-use and energy-supply technology level are calculated.
20. PROCEDURE DSMPOST: Post Process Calculations for DSM Evaluation The post- processing routine for DSM simulation helps the user analyze the effects of the DSM program simulated. In this procedure, customer costs and energy intensity ratios are calculated.
21. PROCEDURE ETOU: Electric Time-Of-Use Impacts This procedure calculates the impacts of different time of use pricing on peak, average and minimum loads.
22. PROCEDURE LOADMGMT: Impacts from Load Management Programs. Procedure 22 calculates the effects on sales and peak demand from load management programs.
23. PROCEDURE LOADCURVE: Generating Electric Loadcurve. Procedure 23 derives economic class (ECLDC) and revenue class (CLDC) load shapes from demand (DMD). Electric sales (ESALES, ECSALES, and SALES) are calculated from the load shapes. Cogeneration is accounted for and netted out of sales.
Systematic Solutions, Inc. 3 Policy Assessment Corp.

ENERGY 2020 Demand Sector
24. PROCEDURE NOLOADCURVE: Electric Sales when load shapes are not available Procedure derives electric sales (ESALES, ECSALES, and SALES) from demand (DMD). Accounts for cogeneration demand.
25. PROCEDURE DAILYUSE: Gas Utility Daily Use Curve. Procedure 25 calculates EUDUC, CDUC, (daily use curves by end-use and class, respectively), GSALES and SALES (sales by end-use and total sales) for the natural gas utility .
26. PROCEDURE NODAILYUSE: Gas Sales when load shapes are not available. Procedure 26 calculates GSALES (gas sales by end-use and class) and SALES (total sales) when no load shapes are available and CCSALES (transportation gas)
DEMAND: RESIDENTIAL, COMMERCIAL, INDUSTRIAL, TRANSPORTATION
PROCEDURE TPRICE: Fuel Prices and Technology Mapping Procedure one calculates the total energy constraint multiplier and maps global fuel prices into local prices.
Energy Constraint Multiplier
The energy supply constraint multiplier, (TENMSM), can be used to represent any existing or predicted fuel supply constraints that would prevent all demand for a particular fuel from being met. It is used when calculating market allocation weights (MAW).
TENMSM(T)=SUM(F)(ENMSM(F)FTMAP(F,T))
where: TENMSM(TECH): Energy Supply Constraint Multiplier (BTU/BTU or J/J) ENMSM(FUEL,YEAR): Energy Supply Constraint Multiplier (BTU/BTU OR GJ/GJ)
End-use Prices
The end-use fuel price is the average annual fuel price with two exceptions. Space heating uses winter fuel prices and air conditioning uses the summer prices.
The following equations map global fuel prices (FP) into local fuels prices (ECFP) and adds all applicable sales taxes. Cogeneration fuel prices (CGFP) are calculated in the same manner. Fuel prices are used to calculate the marginal cost of fuel use (MCFU) in Procedure 2.
ECFP(T,EC)=FP(FPMAP(T,EC))*(1+ECFPSM(T,EC)) ECFP0(T,EC)=FP0(FPMAP(T,EC))*(1+ECFP0SM(T,EC)) CGFP(EC)=FP(FPMAP(ELECTRIC,EC))*(1+ECFPSM(ELECTRIC,EC)) CGFP0(EC)=FP0(FPMAP(ELECTRIC,EC))*(1+ECFP0SM(ELECTRIC,EC))
where: ECFP(TECH,EC,YEAR): Fuel Price ($/MBTU or $/GJ) ECFP0(TECH,EC,FIRST): Fuel Price ($/MBTU or $/GJ)
Systematic Solutions, Inc. 4 Policy Assessment Corp.

ENERGY 2020 Demand Sector
ECFPSM(TECH,EC,YEAR): Sales Tax ($/$) ECFP0SM(TECH,EC,FIRST): Sales Tax ($/$) CGFP(TECH,EC,YEAR): Electric Price ($/MBTU OR $/GJ) CGFP0(TECH,EC,YEAR): Electric Price ($/MBTU OR $/GJ)
In the following equations, population, total capital output and a capacity utilization factor are mapped from ECC to EC. The capacity utilization factor (WCUF) is weighted by economic output (PC) to represent changes in economic conditions affecting capacity utilization in the determination of final demand (DMD).
STCO(EC)=SUM(ECC)(PC(ECC)*ECCMAP(EC,ECC)) STCO0(EC)=SUM(ECC)(PC0(ECC)*ECCMAP(EC,ECC)) SPOP(EC)=SUM(ECC)(POP(ECC)*ECCMAP(EC,ECC)) SPOP0(EC)=SUM(ECC)(POP0(ECC)*ECCMAP(EC,ECC)) WCUF(EC)=SUM(ECC)(PC(ECC)*ECUF(ECC)*ECCMAP(EC,ECC))/ SUM(ECC)(PC(ECC)*ECCMAP(EC,ECC))
where: SPOP(EC,YEAR): Population (MILLIONS) SPOP0(EC,FIRST): Population (MILLIONS) STCO(EC): Total Capital Output Capacity (M$/YR) STCO0(EC): Total Capital Output Capacity (M$/YR) WCUF(EC) Capacity Utilization Factor Weighted by Output
PROCEDURE DMARGINAL: Device Efficiency and Capital Costs In this procedure, the device efficiencies (DEE), device capital costs (DCC), the marginal cost of fuel use (MCFU) and the device capital charge rate (DCCR) are computed.
Device Capital Charge Rate
The device capital charge rate is the annualization of device capital expenses (over the life of the device - DTL), accounting for taxes (TXRT), tax credits (DIVTC), and return of principal and on investment (including risk premiums and inflation: 1+ROIN+DRISK+INSM). (1-(1/(1+ROIN+DRISK))**DPLN)/(1-TXRT) is the classical capital recovery term. The (1-TXRT) term at the end converts the after tax calculation into before tax dollars. Investment tax credits reduce the cost of the facility by the tax credit after the first year of operation using nominal dollars. Therefore the value of the tax credit is (DIVTC/(1+ROIN+DRISK+INSM). Depreciation is modeled as a current dollar phenomena which does not account for inflation. Therefore the net present value of the energy is calculated with the nominal rate of return: (2/DTL)/(ROIN+DRISK+INSM+2/DTL)). It shows up as an additional negative term in the capital cost modifiers of DCCR because depreciation is a benefit (negative cost).
Device capital costs (DCC) are multiplied by the DCCR to get the annualized cost of the device used in computing market share calculations.
The formula for calculating the device capital charge rate:
Systematic Solutions, Inc. 5 Policy Assessment Corp.

ENERGY 2020 Demand Sector
DCCR=(1-DIVTC/(1+ROIN+DRISK+INSM)-TXRT*(2/DTL)/(ROIN+DRISK+INSM+2/DTL))*(ROIN+DRISK)/(1-(1/(1+ROIN+DRISK))**DPLN)/(1-TXRT)
Where: DIVTC(TECH,YEAR): Device Investment Tax Credit ($/$) DPLN(ENDUSE,TECH,EC,ZERO): Physical Life of Equipment (YRS) DRISK(ENDUSE,TECH): Device Excess Risk Premium ($/$) DTL(ENDUSE,TECH,EC): Device Tax Life (YRS) INSM(YEAR): Smoothed Inflation Rate (($/YR)/$) ROIN(EC): Return on Investment (($/YR)/$) TXRT(EC,YEAR): Tax Rate on Energy Consumer ($/$)
Device Efficiencies & Capital Costs
The device efficiencies selected in the model are based on local fuel prices. As fuel prices rise, consumers will select higher efficiency devices, although not at the optimum level. The level of device efficiency selected, and other factors, has an associated capital cost that becomes the device capital cost.
ENERGY 2020 uses tables to determine device efficiencies selected at different price levels. Given fuel prices, marginal energy efficiencies and capital costs for devices are determined using efficiency/cost trade-off curves based on consumer preferences. When energy prices increase, energy consumers could reduce their energy bills by purchasing more efficient devices or homes which use less energy (e.g. a more efficient furnace or more wall insulation) . The increase in efficiency requires added equipment, design quality, or materials unless the response is to lose energy service (e.g. turn back the thermostat). Procedure 2 deals only with the increased efficiency of devices. Procedure 4 (CMARGINAL) determines process efficiency in a similar manner. The consumer response of “cutting back” is addressed in Procedure 14 (UTILIZE).
Developing a trade-off curve between efficiency and capital costs begins with the identification of the upper bound on efficiency set by current technology. The technology upper bound can be raised through research and development until theoretical thermal efficiencies are reached. The rest of the curve represents the minimum cost of using energy for each efficiency level, done balancing the capital and operating costs of each device against its efficiency level and fuel costs. The values for the efficiency (DEET) and capital cost (DCCT) curves are interpolated based on input values.
As fuel costs increase, total energy use costs can be minimized by increasing the energy efficiency even though higher efficiency requires equipment with a higher capital cost. The trade-off can be as a market share calculation where the “share” is the fraction of the maximum efficiency. The perceived costs of higher efficiency both by the manufacturer and the consumer determine the shape of the efficiency curve.
As shown below the marginal device efficiency (DEE) is determined by the energy price efficiency curve and the device efficiency multiplier (DEMM). The device efficiency multiplier can be used to raise the level of efficiency (DEE) for a given set of prices due to technological improvements (more energy efficiency for the same dollars spent.)
Systematic Solutions, Inc. 6 Policy Assessment Corp.

ENERGY 2020 Demand Sector
DEE=DEMM*DTABPE(ECFP/INFLA) where:
DEMM(ENDUSE,TECH,EC,YEAR) Maximum Device Efficiency. Multiplier. (BTU/BTU) ECFP(TECH,EC,YEAR) Fuel Price ($/MBTU) INFLA(YEAR): Inflation Index ($/$)
A further constraint on device efficiency (DEE) may be encountered. The equation below indicates that the final device efficiency (DEE) is the maximum (XMAX) of the computed efficiency and any the device efficiency standard (DESTD) in place. If the standard is effective, DEE will increase (i.e. the standard forces customers to choose higher levels of device efficiency than they would have given the current set of prices and capital costs.) DESTD is the variable the model uses to incorporate existing standards. DESTDP is for testing policies that include new standards.
DEE=XMAX(DEE,DESTD,DESTDP) where:
DEE(ENDUSE,TECH,EC,YEAR): Device Efficiency (BTU/BTU OR J/J) DESTD(ENDUSE,TECH,EC,YEAR): Device Efficiency Standards (BTU/BTU OR J/J) DESTDP(ENDUSE,TECH,EC,YEAR): Device Efficiency Standards Policy (BTU/BTU OR J/J)
While fuel prices are the principal determinant of DEE, because of existing efficiency standards, the DEE that is selected may not be the one that corresponds to ECFP in the efficiency table. Therefore, working “backwards” the efficiency decision price (MECFP) is calculated for use in Procedure 3 (DDSM) in the calculation of efficiency.
MECFP=DTABEP(DEE/DEMM)/DEPM*INFLA where:
MECFP(ENDUSE,TECH,EC):Efficiency Decision Fuel Price ($/MBTU) DEMM(ENDUSE,TECH,EC,YEAR) Maximum Device Efficiency Multiplier (BTU/BTU) DEE(ENDUSE,TECH,EC,YEAR) Device Efficiency (BTU/BTU) DEPM(ENDUSE,TECH,EC,YEAR) Device Energy Price Multiplier ($/$) INFLA(YEAR): Inflation Index ($/$)
Device Capital Cost
The device capital cost (DCC) is computed based on the level of efficiency selected. The technology multiplier effect is removed from DEE (DEE/DEMM) before the table is used. A multiplier on capital costs that calculates non-efficiency related price changes is included (such as ice makers in refrigerators -DCMM) and sales tax is also accounted for (1+STX).
DCC=DTABEC(DEE/DEMM)*INFLA*DCMM*(1+STX)
where: DCC(ENDUSE,TECH,EC,YEAR): Device Capital Cost ($/(MBTU/YR) or $/(GJ/YR)) DEMM(ENDUSE,TECH,EC,YEAR) Maximum Device Efficiency Multiplier (BTU/BTU) DCCM(TECH): Device Capital Charge Rate Multiplier (($/YR)/$) DEE(ENDUSE,TECH,EC,YEAR) Device Efficiency (BTU/BTU) INFLA(YEAR): Inflation Index ($/$) STX (YEAR): Sales Tax Rate on Energy Consumer ($/$)
Systematic Solutions, Inc. 7 Policy Assessment Corp.

ENERGY 2020 Demand Sector
Marginal Fuel Costs
Device Operation and Maintenance Costs
Each device has a cost to operate and maintain it over its lifetime. This is computed on an annual basis as some fraction (DOCF) of the total cost of the device (DCC). More expensive devices are assumed to have more expensive operation and maintenance costs associated with them.
The calculation for Device Operation and Maintenance Costs (DOMC) is: DOMC=DOCF*DCC
where: DOMC(TECH,EC): Device Operating Cost ($/MBTU) DCC(ENDUSE,TECH,EC,YEAR): Device Capital Cost ($/(MBTU/YR) or $/(GJ/YR)) DOCF(ENDUSE,TECH,EC): Device Operating Cost Fraction (($/YR)/$)
Marginal Fuel Cost
Each specific demand for energy is associated with a stock of capital. Investment in each type of capital stock by fuel type is allocated according to the cost of using each type of fuel. This cost is the perceived cost to the user and includes a risk factor (incorporated in the calculation of DCCR), annualized capital costs (DCCR*DCC), operating and maintenance costs (DOMC), and delivered marginal fuel costs (ECFP/DEE).
The marginal cost of using energy (MCFU) includes the cost of using energy for all end-uses. As such, a house that has a gas furnace but an electric water heater would be represented partially in the model’s gas capital stock and partially in the electric capital stock. The investment includes capital using energy in addition to the energy source equipment.
MCFU is then used to determine process efficiencies (PEE) and the marginal market share (MMSF) of each fuel with regard to new capital additions.
MCFU=DCCR*DCC+DOMC+ECFP/DEE
where: MCFU(ENDUSE,TECH,EC,YEAR): Marginal Cost of Fuel Use ($/MBTU or $/GJ) DCC(ENDUSE,TECH,EC,YEAR): Device Capital Cost ($/(MBTU/YR) or $/(GJ/YR)) DCCR(ENDUSE,TECH,EC,YEAR): Device Capital Charge Rate (($/YR)/$) DOMC(TECH,EC): Device Operating Cost ($/MBTU) ECFP(TECH,EC,YEAR): Fuel Price ($/MBTU or $/GJ) DEE(ENDUSE,TECH,EC,YEAR): Device Efficiency (BTU/BTU or J/J)
PROCEDURE DDSM: Device Demand Side Management Programs This procedure simulates the consumer response to a demand side management program and its effects on device efficiency and capital costs.
Systematic Solutions, Inc. 8 Policy Assessment Corp.

ENERGY 2020 Demand Sector
Calculating the Device Capital Charge Rate with an Incentive
The device efficiency, device capital cost and device capital charge rate before the incentive programs (DEE,DCC,DCCR) are saved (and renamed to DEEB, DCCB, DCCRB, respectively) to use for before and after comparisons.
DEEB=DEE DCCB=DCC DCCRB=DCCR
The device capital charge rate with incentives (DCCRU) is very similar to the device capital charge rate without incentives (DCCR). It is the annualization of device capital expenses (over the life of the device - DTL), accounting for taxes (TXRT), investment tax credits plus any policy investment tax credits (DIVTC+DPIVTC), and return of principal and on investment (including interest on loans minus any subsidy (ROIN-CROIN), risk premiums and inflation: 1+(ROIN-CROIN)+DRISK+INSM). (1-1/(1+(ROIN-CROIN)+DRISK))**DPLN)/(1-TXRT) is the classical capital recovery term, with the additional term (CROIN) accounting for any interest subsidy. The (1-TXRT) term at the end converts the after tax calculation into before tax dollars. Investment tax credits (including policy tax credits -DIVTC+DPIVTC) reduce the cost of the facility by the tax credit after the first year of operation using nominal dollars. Therefore the value of the tax credit is ((DIVTC+DPIVTC)/(1+(ROIN-CROIN)+DRISK+INSM). Depreciation is modeled as a current dollar phenomena which does not account for inflation. Therefore the net present value of the energy is calculated with the nominal rate of return: (2/DTL)/((ROIN-CROIN)+DRISK+INSM+2/DTL)). It shows up as an additional negative term in the capital cost modifiers of DCCR because depreciation is a benefit (negative cost).
Device capital costs (DCC) are multiplied by the DCCRU to get the annualized cost of the device when incentives are present used in computing market share calculations.
The formula for calculating the device capital charge rate when subsidies are present is: DCCRU=(1-(DIVTC+DPIVTC)/(1+ROIN-CROIN+DRISK+INSM)-TXRT*(2/DTL)/(ROIN-
CROIN+DRISK+INSM+2/DTL))*(ROIN-CROIN+DRISK)/(1-(1/(1+ROIN-CROIN+DRISK))**DPLN)/(1-TXRT)
where: DIVTC(TECH,YEAR): Device Investment Tax Credit ($/$) DPIVTC(TECH,YEAR): Device Policy Investment Tax Credit ($/$) DPLN(ENDUSE,TECH,EC,ZERO): Physical Life of Equipment (YRS) DRISK(ENDUSE,TECH): Device Excess Risk Premium ($/$) DTL(ENDUSE,TECH,EC): Device Tax Life (YRS) INSM(YEAR): Smoothed Inflation Rate (($/YR)/$) ROIN(EC): Return on Investment (($/YR)/$) CROIN(EC): Subsidized Return on Investment (($/YR/$) TXRT(EC,YEAR): Tax Rate on Energy Consumer ($/$)
Device Efficiencies and Capital Costs with Incentives
The device capital cost (DCC) must be increased because the consumer is paying less interest so he can purchase a more expensive device for the same money. The Device Capital Cost multiplier (DCCM) captures the income effect of the difference between the capital charge rate before (DCCRB) and after (DCCRU) the incentive programs.
Systematic Solutions, Inc. 9 Policy Assessment Corp.

ENERGY 2020 Demand Sector
DCCM=DCCRU/DCCRB where:
DCCM(TECH): Device Capital Charge Rate Multiplier (($/YR)/$) DCCRU(TECH,EC): Device Capital Charge Rate with Subsidy (($/YR)/$) DCCRB(TECH,EC): Device Capital Charge Rate Before Subsidy (($/YR)/$)
The device efficiency (DEE) is determined by the efficiency curves and the capital cost (DCC) including rebate (DCCU). A capital cost incentive increase the actual capital related expenses in that the utility picks up the ADDED cost while the customer spends the same amount of money to get a better device. For each dollar level, more efficiency can be purchased.
Device Energy Price Multiplier
To correctly calculate the level of efficiency that will be selected in the presence of an incentive, the impact of "other" policy-induced economic factors on choice (such as a rebate [DCCB vs. DCCU], or tax abatement [done through the capital charge rate - DCCRB vs. DCCRU] or discounted loan rate [again, through DCCRB vs. DCCRU]) must be considered. These other factors are converted into an impact on price through the device energy price multiplier.
DEPM=1+(DCC0*(DOCF+DCCR0)/(ECFP0/DEE0)*(DCCB* (DOCF+DCCRB)* (1+STX)-(DCCB-DCCU)*(DOCF+DCCRU)*(1+STX))/(DCCB* (DOCF+DCCRB)*(1+STX)))
where: DCC0(CENDUSE,TECH,EC,YEAR): Device Capital Cost ($/(MBTU/YR) or $/(GJ/YR)) DCCU(ENDUSE,TECH,EC,YEAR): Device Capital Cost Subsidy($/(MBTU/YR) or $/(GJ/YR))
As shown below the marginal device efficiency (DEE) is determined by the energy price efficiency curve using the recalculated fuel price (MECFP) modified by the Device Energy Price Multiplier (DEPM) and the device efficiency multiplier (DEMM). The Device Energy Price Multiplier (DEPM) is applied to energy prices before the table function is used. Again this represents economic factors that affect the consumer’s perception of price of energy. The device efficiency multiplier (DEMM) can be used to raise the level of efficiency (DEE) for a given set of prices due to technological improvements (more energy efficiency for the same dollars spent.)
DEE=DEMM*DTABPE(MECFP/INFLA*DEPM) where:
DEE(ENDUSE,TECH,EC,YEAR): Device Efficiency (BTU/BTU OR J/J) DEMM(ENDUSE,TECH,EC,YEAR): Technological Improvements in Devices(BTU/BTU OR J/J) INFLA(YEAR): Inflation Index ($/$)
Consumer Response to Incentive Programs
The consumer response (DEER) to incentive programs is a fraction based on the required marginal efficiency (DEEP), the marginal efficiency before the programs (DEEB) and the marginal efficiency after the programs (DEE). The XMAX functions are required since it is possible, if energy prices are falling, that DEE could be less than DEEB, even with an incentive.
DEER=XMAX(0,(DEE-DEEB))/(XMAX(DEEP,DEE)-DEEB)
where: DEER(ENDUSE,TECH,EC,YEAR): Policy Participation Response (BTU/BTU OR J/J) DEE(ENDUSE,TECH,EC,YEAR): Device Efficiency (BTU/BTU OR J/J) DEEP(ENDUSE,TECH,EC,YEAR): Policy Device Efficiency (BTU/BTU OR J/J)
Systematic Solutions, Inc. 10 Policy Assessment Corp.

ENERGY 2020 Demand Sector
The device capital cost (DCC) is computed to include the impact of the device efficiency programs on the level of efficiency selected (the new DEE based on the MECFP). The technology multiplier effect is removed from DEE (DEE/DEMM) before the table is used. A multiplier on capital costs that captures non-efficiency related price changes is included (such as ice makers in refrigerators -DCMM) and sales tax is also accounted for (1+STX).
DCC=(DTABEC(DEE/DEMM)*INFLA*DCMM)*(1+STX) where:
DCC(ENDUSE,TECH,EC,YEAR): Device Capital Cost ($/(MBTU/YR) or $/(GJ/YR)) DCMM(ENDUSE,EC,YEAR): Capital Cost Maximum Multiplier ($/$) DEE(ENDUSE,TECH,EC,YEAR): Device Efficiency (BTU/BTU OR J/J) DEMM(ENDUSE,TECH,EC,YEAR): Technological Improvements in Devices (BTU/BTU OR J/J) INFLA(YEAR): Inflation Index ($/$)
DCCR=(DCCRB*(1-DEER))+(DCCRU*DEER) where:
DEER(ENDUSE,TECH,EC,YEAR): Policy Participation Response (BTU/BTU or J/J) DCCRB(ENDUSE,TECH,EC,YEAR): Device Capital Charge Rate before Policy, (($/YR)/$) DCCR(ENDUSE,TECH,EC,YEAR): Device Capital Charge Rate (($/YR)/$) DCCRN(ENDUSE,TECH,EC,ZERO): Device Capital Charge Rate (($/YR)/$)
Device Operation and Maintenance Costs
Each device has a cost to operate and maintain it over its lifetime. This is computed on an annual basis as some fraction (DOCF) of the total cost of the device (DCC). More expensive devices are assumed to have more expensive operation and maintenance costs associated with them.
The calculation for Device Operation and Maintenance Costs (DOMC) is: DOMC=DOCF*DCC
where: DOMC(ENDUSE,TECH EC,YEAR): Device Operation and Maintenance Costs ($/(MBTU/YR)) DCC(ENDUSE,TECH,EC,YEAR): Device Capital Cost ($/(MBTU/YR) or $/(GJ/YR)) DOCF(ENDUSE,TECH,EC): Device Operating Cost Fraction (($/YR)/$)
Marginal Fuel Cost
Each specific demand for energy is associated with a stock of capital. Investment in each type of capital stock by fuel type is allocated according to the cost of using each type of fuel. This cost is the perceived cost to the user and includes a risk factor (incorporated in the calculation of DCCR), annualized capital costs (DCCR*DCC), operating and maintenance costs (DOMC), and delivered marginal fuel costs (ECFP/DEE).
With the addition of an incentive, two other terms are needed. DCCU is the amount of rebate being offered. It is subtracted from the capital cost (DCC) after it is modified by the DEER - the policy participation response rate that indicates what fraction of those purchasing a device will select the rebated device and participate in the rebate program.
Systematic Solutions, Inc. 11 Policy Assessment Corp.

ENERGY 2020 Demand Sector
For example, a 100% participation rate (DEER=1) would reduce the term in the brackets to (DCC-DCCU).
The marginal cost of using energy (MCFU) includes the cost of using energy for all end-uses. As such, a house that has a gas furnace but an electric water heater would be represented partially in the model’s gas capital stock and partially in the electric capital stock. The investment includes capital using energy in addition to the energy source equipment.
MCFU is then used to determine process efficiencies (PEE) and the marginal market share (MMSF) of each fuel with regard to new capital additions.
MCFU=DCCR*(DCC-DCCU*DEER)+DOMC+ECFP/DEE where:
MCFU(ENDUSE,TECH,EC,YEAR): Marginal Cost of Fuel Use ($/MBTU or $/GJ) DCC(ENDUSE,TECH,EC,YEAR): Device Capital Cost ($/(MBTU/YR) or $/(GJ/YR)) DCCU(ENDUSE,TECH,EC,YEAR): Device Capital Cost Subsidy ($/(MBTU/YR) or $/(GJ/YR)) DCCR(ENDUSE,TECH,EC,YEAR): Device Capital Charge Rate (($/YR)/$) DEE(ENDUSE,TECH,EC,YEAR): Device Efficiency (BTU/BTU OR J/J) DEER(ENDUSE,TECH,EC,YEAR): Policy Participation Response (BTU/BTU OR J/J) DOMC(ENDUSE,TECH EC,YEAR): Device Operation and Maintenance Costs ($/(MBTU/YR)) ECFP(TECH,EC,YEAR): Fuel Price ($/MBTU or $/GJ)
Capitalized Conservation Expense from Low Interest Loans
Capitalized conservation is calculated as the cost of the device minus the rebate multiplied by the number of devices subject to the loan, the additional device energy requirements and the capital charge rate. It is the annualize cost of the DSM program.
TCONCAP=(XMAX(DCCP*INFLA,DCCB)-DCCU)*(1-DCCM)*DEER*DERA* DEE/1E6 CONCAP(F)=CONCAP(F)+SUM(TE,EC)(TCONCAP(EU,TE,EC)*FTMAP(F,TE))
where: CONCAP(SECTOR,FUEL,YEAR): Capitalized Conservation Expenses (M$/YR) TCONCAP(ENDUSE,TECH,EC): Capitalized Conservation Expenses (M$/YR) DCCP(ENDUSE,TECH,EC,YEAR): Capital Cost of "Rebated" Device($/(MBTU/YR) or $/(GJ/YR)) DCCM(TECH): Device Capital Charge Rate Multiplier (($/YR)/$) DCCU(ENDUSE,TECH,EC,YEAR): Device Capital Cost Subsidy($/(MBTU/YR) or $/(GJ/YR)) DEE(ENDUSE,TECH,EC,YEAR): Device Efficiency (BTU/BTU OR J/J) DEER(ENDUSE,TECH,EC,YEAR): Policy Participation Response (BTU/BTU OR J/J) DERA(ENDUSE,TECH,EC,YEAR): Device Energy Requirement Addition(MBTU/YR OR GJ/YR) INFLA(YEAR): Inflation Index ($/$)
Conservation Administration Costs
Conservation administration costs are equal to the cost per MBTU times the participation rate, the device additions and device efficiency.
TCONADM=ADDCST*DEER*DERA*DEE/1E6 CONADM(F)=CONADM(F)+SUM(TE,EC)(TCONADM(EU,TE,EC)*FTMAP(F,TE))
where: CONADM(SECTOR,FUEL,YEAR): Conservation Administration Costs (M$/YR) TCONADM(ENDUSE,TECH,EC): Conservation Administration Costs (M$/YR) ADDCST(ENDUSE,YEAR): Administrative Costs of Device Efficiency Programs ($/GJ) or ($/MBTU)
Systematic Solutions, Inc. 12 Policy Assessment Corp.

ENERGY 2020 Demand Sector
DEE(ENDUSE,TECH,EC,YEAR): Device Efficiency (BTU/BTU OR J/J) DEER(ENDUSE,TECH,EC,YEAR): Policy Participation Response (BTU/BTU OR J/J) DERA(ENDUSE,TECH,EC,YEAR): Device Energy Requirement Addition (MBTU/YR OR GJ/YR)
Conservation Expensed
The cost of rebates are expensed. The capital cost subsidy (MBTU/YR) is multiplied by the participation rate, the device energy requirement additions and the device efficiency to arrive at the total yearly cost of device rebates.
TCONEXP=DCCU*DEER*DERA*DEE/1E6 CONEXP(F)=CONEXP(F)+SUM(TE,EC)(TCONEXP(EU,TE,EC)*FTMAP(F,TE))
where: CONEXP(SECTOR,FUEL,YEAR): Conservation Expense (M$/YR) TCONEXP(ENDUSE,TECH,EC): Conservation Expense (M$/YR) DCCU(ENDUSE,TECH,EC,YEAR): Device Capital Cost Subsidy($/(MBTU/YR) or $/(GJ/YR)) DEE(ENDUSE,TECH,EC,YEAR): Device Efficiency (BTU/BTU OR J/J) DEER(ENDUSE,TECH,EC,YEAR): Policy Participation Response (BTU/BTU OR J/J) DERA(ENDUSE,TECH,EC,YEAR): Device Energy Requirement Addition (MBTU/YR OR GJ/YR)
PROCEDURE CMARGINAL: Process Efficiency and Capital Costs In this procedure, the marginal process efficiencies (PEE) and capital costs (PCC), cost of fuel use (MCFU) and the device capital charge rate (DCCR) are computed.
Process Capital Charge Rate
The process capital charge rate is the annualization of process capital expenses (over the life of the process capital - PETL), accounting for taxes (TXRT), tax credits (PIVTC), and return of principal and on investment (including and inflation: 1+ROIN+INSM). (1-(1/(1+ROIN))**PEPLN)/(1-TXRT) is the classical capital recovery term. The (1-TXRT) term at the end converts the after tax calculation into before tax dollars. Investment tax credits reduce the cost of the facility by the tax credit after the first year of operation using nominal dollars. Therefore the value of the tax credit is (PIVTC/(1+ROIN+INSM). Depreciation is modeled as a current dollar phenomena which does not account for inflation. Therefore the net present value of the energy is calculated with the nominal rate of return: (2/PETL)/(ROIN+INSM+2/PETL)). It shows up as an additional negative term in the capital cost modifiers of PCCR because depreciation is a benefit (negative cost).
Process capital costs (PCC) are multiplied by the PCCR to get the annualized cost of the process capital used in computing market share calculations.
PCCR=(1-PIVTC/(1+ROIN+INSM)-TXRT*(2/PETL)/(ROIN+INSM+2/PETL))*ROIN/(1-(1/(1+ROIN))**PEPLN)/(1-TXRT)
Where: PIVTC(TECH,YEAR): Process Capital Investment Tax Credit ($/$) PEPLN(ENDUSE,TECH,EC,ZERO): Physical Life of Process Capital (YRS) PETL(ENDUSE,TECH,EC): Process Capital Tax Life (YRS) INSM(YEAR): Smoothed Inflation Rate (($/YR)/$)
Systematic Solutions, Inc. 13 Policy Assessment Corp.

ENERGY 2020 Demand Sector
ROIN(EC): Return on Investment (($/YR)/$) TXRT(EC,YEAR): Tax Rate on Energy Consumer ($/$)
Process Efficiency & Capital Cost
Process Efficiency
As shown below the marginal process efficiency (DEE) is determined by the energy price efficiency curve and the process efficiency multiplier (PEPM). The values for the efficiency (PEET) and capital cost (PCCT) curves are interpolated based on input values.
The process efficiency multiplier can be used to raise the level of efficiency (PEE) for a given set of prices due to technological improvements (more energy efficiency for the same dollars spent.)
PEE=PEMM*CTABPE(MCFU/INFLA*PEPM) where:
MCFU(ENDUSE,TECH,EC,YEAR): Marginal Cost of Fuel Use ($/MBTU or $/GJ) PEMM(ENDUSE,TECH,EC,YEAR): Process Technological Improvements(($/BTU/$BTU) or ($/J/$/J)) PEE(ENDUSE,TECH,EC,YEAR): Marginal Process Efficiency ($/BTU or $/J) INFLA(YEAR): Inflation Index ($/$)
Process Efficiency Standard
A further constraint on process efficiency (PEE ) may be encountered. The equation below indicates that the final process efficiency (PEE) is the maximum (XMAX) of the computed efficiency and any process efficiency standard (PESTD) in place. If the standard is effective, PEE will increase (i.e. the standard forces customers to choose higher levels of process efficiency than they would have given the current set of prices and capital costs.) PESTD is the variable the model uses to incorporate existing standards. PESTDP is for testing policies that include new standards.
PEE=XMAX(PEE,PESTD,PESTDP) where:
PEE(ENDUSE,TECH,EC,YEAR): Marginal Process Efficiency ($/BTU or $/J) PESTD(ENDUSE,TECH,EC,YEAR): Process Efficiency Standard ($/BTU or $/J) PESTDP(ENDUSE,TECH,EC,YEAR): Process Efficiency Standard Policy ($/BTU or $/J)
Compute the Efficiency Decision Price
While fuel prices are the principal determinant of PEE, because of existing efficiency standards, the PEE that is selected may not be the one that corresponds to ECFP in the efficiency table. Therefore, working “backwards” the efficiency decision price (MMCFU) is calculated for use in Procedure 5 (PDSM) in the calculation of efficiency.
MMCFU=CTABEP(PEE/PEMM)/PEPM*INFLA
where: MMCFU(ENDUSE,TECH,EC,YEAR): Efficiency Decision Fuel Price ($/MBTU) PEE(ENDUSE,TECH,EC,YEAR): Marginal Process Efficiency ($/BTU or $/J) INFLA(YEAR): Inflation Index ($/$) PEMM(ENDUSE,TECH,EC,YEAR) Maximum Process Efficiency Multiplier (BTU/BTU)
Systematic Solutions, Inc. 14 Policy Assessment Corp.

ENERGY 2020 Demand Sector
PEPM(ENDUSE,TECH,EC,YEAR) Process Energy Price Multiplier ($/$)
The air conditioning process efficiency (PEE(AC)) is based on the space heating process efficiency (PEE(HEAT)), the heating-to-cooling ratio (CHR), the heating-to-cooling ratio multiplier (CHRM), and the process efficiency multiplier (PEMM).
For residential and commercial heating: HPEE=PEE HPER=PER PEE(TECH,S)=SUM(F)(HPEE(F,S)*HPER(F,S))/SUM(F)(HPER(F,S))/(CHR(S)*CHRM(S))*PEMM(EL
ECTRIC,S) where:
PEE(ENDUSE,TECH,EC,YEAR): Marginal Process Efficiency ($/BTU or $/J) PEMM(ENDUSE,TECH,EC,YEAR) Maximum Process Efficiency Multiplier(BTU/BTU) HPEE(ENDUSE,TECH,EC,YEAR): Marginal Process Efficiency ($/BTU or $/J) HPER(ENDUSE,TECH,EC,YEAR): Process Energy Requirement (MBTU/YR)
Process Capital Cost
The PROCESS capital cost (PCC) is computed based on the level of efficiency selected using the efficiency/capital cost curve procedure (CTABEC). The technology multiplier effect is removed from PEE (PEE/PEMM) before the table is used. A multiplier on capital costs that calculates non-efficiency related price changes is included (such as ice makers in refrigerators -PCCMM) and sales tax is also accounted for (1+STX).
PCC=CTABEC(PEE/PEMM)*INFLA*PCCMM*(1+STX) where:
PEE(ENDUSE,TECH,EC,YEAR): Marginal Process Efficiency ($/BTU or $/J) PEMM(ENDUSE,TECH,EC,YEAR) Maximum Process Efficiency Multiplier(BTU/BTU) PCCMM(ENDUSE,TECH,EC,YEAR): Process Cost Maximum Multiplier ($/$) STX (YEAR): Sales Tax Rate on Energy Consumer ($/$) INFLA(YEAR): Inflation Index ($/$)
PROCEDURE CDSM: Process Demand Side Management Programs This procedure simulates the consumer response to a process demand side management program and its effects on process efficiency and capital costs.
Endogenous Process DSM
The process efficiency (PEE) is renamed (PEEB) to track process efficiency before the incentive programs are saved. Process capital costs (PCC) are tracked in the same manner (PCCB)
PEEB=PEE PCCB=PCC
The process capital charge rate with incentives (PCCRU) is very similar to the process capital charge rate without incentives (PCCR). It is the annualization of process capital expenses (over the life of the process - PETL), accounting for taxes (TXRT), investment tax credits plus any policy investment tax credits (PIVTC+PPIVTC), and return of principal and on investment
Systematic Solutions, Inc. 15 Policy Assessment Corp.

ENERGY 2020 Demand Sector
(including interest on loans minus any subsidy (ROIN-CROIN), and inflation: 1+(ROIN-CROIN)+INSM). (1-1/(1+(ROIN-CROIN))) **PEPLN)/(1-TXRT) is the classical capital recovery term, with the additional term (CROIN) accounting for any interest subsidy. The (1-TXRT) term at the end converts the after tax calculation into before tax dollars. Investment tax credits (including policy tax credits -PIVTC+PPIVTC) reduce the cost of the facility by the tax credit after the first year of operation using nominal dollars. Therefore the value of the tax credit is ((PIVTC+PPIVTC)/(1+(ROIN-CROIN)+INSM). Depreciation is modeled as a current dollar phenomena which does not account for inflation. Therefore the net present value of the energy is calculated with the nominal rate of return: (2/PETL)/((ROIN-CROIN)+INSM+2/PETL)). It shows up as an additional negative term in the capital cost modifiers of PCCR because depreciation is a benefit (negative cost).
Process capital costs (PECC) are multiplied by the PCCRU to get the annualized cost of the process when incentives are present used in computing market share calculations.
The formula for calculating the process capital charge rate when subsidies are present is: PCCRU=(1-(PIVTC+PPIVTC)/(1+ROIN-CROIN+INSM)-TXRT*(2/PETL)/(ROIN-
CROIN+INSM+2/PETL))*(ROIN-CROIN)/(1-(1/(1+ROIN-CROIN))**PEPLN)/(1-TXRT) Where:
PIVTC(TECH,YEAR): Process Capital Investment Tax Credit ($/$) PPIVTC(TECH,YEAR): Process Capital Policy Investment Tax Credit ($/$) PEPLN(ENDUSE,TECH,EC,ZERO): Physical Life of Process Capital (YRS) PETL(ENDUSE,TECH,EC): Process Capital Tax Life (YRS) INSM(YEAR): Smoothed Inflation Rate (($/YR)/$) ROIN(EC): Return on Investment (($/YR)/$) CROIN(EC): Subsidized Return on Investment (($/YR/$) TXRT(EC,YEAR): Tax Rate on Energy Consumer ($/$)
Process Capital Charge Rate Multiplier
The Process capital charge rate multiplier captures the difference between the capital charge rate with a subsidy on interest rates and the baseline PCCR. It is used in the calculation for total capitalized costs of conservation.
PCCM=PCCRU/PCCR where:
PCCM(EC): Process Capital Charge Rate Multiplier (($/YR)/$) PCCR(EC,ENDUSE,YEAR): Process Capital Charge Rate (($/YR)/$) PCCRU(EC,ENDUSE,YEAR): Process Capital Charge Rate After Policies (($/YR)/$)
The process efficiency (PEE) is determined by the efficiency curves and the capital cost (PCC) including rebate (PCCU - all captured in the MMCFU). A capital cost incentive increases the actual capital related expenses in that the utility picks up the added cost while the customer spends the same amount of money to get a better device.
The process efficiency multiplier (PEMM) can be used to raise the level of efficiency (PEE) for a given set of prices due to technological improvements (more energy efficiency for the same dollars spent.)
PEE=PEMM*CTABPE(MMCFU/INFLA) where:
Systematic Solutions, Inc. 16 Policy Assessment Corp.

ENERGY 2020 Demand Sector
PEE(ENDUSE,TECH,EC,YEAR): Marginal Process Efficiency ($/BTU or $/J) PEMM(ENDUSE,TECH,EC,YEAR): Process Technological Improvements(($/BTU/$BTU) or ($/J/$/J)) MMCFU(ENDUSE,TECH,EC,YEAR): Efficiency Decision Fuel Price ($/MBTU) INFLA(YEAR): Inflation Index ($/$)
Process Efficiency Standard
A further constraint on process efficiency (PEE) may be encountered. The equation below indicates that the final process efficiency (PEE) is the maximum (XMAX) of the computed efficiency and any the process efficiency standard (PESTP) in place. If the standard is effective, PEE will increase (i.e. the standard forces customers to choose higher levels of process efficiency than they would have given the current set of prices and capital costs.) PESTP is the variable the model uses to incorporate existing standards. PESTPP is for testing policies that include new standards.
PEE=XMAX(PEE,PESTD,PESTDP) where:
PEE(ENDUSE,TECH,EC,YEAR): Marginal Process Efficiency ($/BTU or $/J) PESTD(ENDUSE,TECH,EC,YEAR): Process Efficiency Standard ($/BTU or $/J) PESTDP(ENDUSE,TECH,EC,YEAR): Process Efficiency Standard Policy ($/BTU or $/J)
The process capital cost (PCC) is computed to include the impact of the process efficiency programs on the level of efficiency selected (the new PEE based on the MMCFU). The technology multiplier effect is removed from PEE (PEE/PEMM) before the table is used. A multiplier on capital costs that captures non-efficiency related price changes is included (such as ice makers in refrigerators -PCCMM) and sales tax is also accounted for (1+STX).
PCC=CTABEC(PEE/PEMM)*INFLA*PCCMM*(1+STX) where:
PEE(ENDUSE,TECH,EC,YEAR): Marginal Process Efficiency ($/BTU or $/J) PEMM(ENDUSE,TECH,EC,YEAR) Maximum Process Efficiency Multiplier(BTU/BTU) PCCMM(ENDUSE,TECH,EC,YEAR): Process Cost Maximum Multiplier ($/$) STX (YEAR): Sales Tax Rate on Energy Consumer ($/$) INFLA(YEAR): Inflation Index ($/$)
Participation Fraction
The consumer response (PEER) to incentive programs is a fraction based on the required marginal efficiency (PEEP), the marginal efficiency before the programs (PEEB) and the marginal efficiency after the programs (PEE). The XMAX functions are required since it is possible, if energy prices are falling, for PEE to be less than PEEB, even with an incentive.
PEER=XMAX(0,(PEE-PEEB*1.0001))/(XMAX(PEEP,PEE)-PEEB)
The participation rate is used to recalculate process capital cost (PCC) by apportioning it into two segments PCC with incentive programs and PCC without (PCC*(1-PEER)).
PCC=PCC*(1-PEER)+XMAX(PCC,PCCP*INFLA)*(1+STX)*PEER where:
PEE(ENDUSE,TECH,EC,YEAR): Marginal Process Efficiency ($/BTU or $/J) PEEB(ENDUSE,TECH,EC,YEAR): Marginal Process Efficiency Before Policy ($/BTU or $/J) PEEP(ENDUSE,TECH,EC,YEAR): Policy Process Efficiency ($/BTU or $/J): PEER(ENDUSE,TECH,EC,YEAR): Process Policy Participation Response (BTU/BTU OR J/J) PCC(ENDUSE,TECH,EC,YEAR): Process Capital Cost ($/($/YR))
Systematic Solutions, Inc. 17 Policy Assessment Corp.

ENERGY 2020 Demand Sector
INFLA(YEAR): Inflation Index ($/$)
The process efficiency (PEE) is calculated with the process capital cost rebate (PCCU) and the capital charge rate which includes the impact of investment tax credits and low interest loans (PCCR).
The air conditioning process efficiency (PEE(AC)) is based on the space heating process efficiency (PEE(HEAT)), the heating-to-cooling ratio (CHR), the heating-to-cooling ratio multiplier (CHRM), and the process efficiency multiplier (PEMM).
HPEE=PEE HPER=PER PEE(TECH,S)=SUM(F)(HPEE(F,S) * HPER(F,S))/SUM(F)(HPER(F,S))/(CHR(S) * CHRM(S)) *
PEMM(ELECTRIC,S)
Capitalized Conservation Expense from Low Interest Loans
Capitalized conservation is calculated as the cost of the device minus the rebate multiplied by the number of devices subject to the loan, the additional device energy requirements and the capital charge rate. It is the annualize cost of the DSM program.
Load is for difference in costs less rebate TCONCAP=(XMAX(PCCP*INFLA,PCC)-PCCB-PCCU)*(1- PCCM)*PEER*PERA*PEE CONCAP(F)=CONCAP(F)+SUM(TE,EC)(TCONCAP(EU,TE,EC)*FTMAP(F,TE))
where: CONCAP(SECTOR,FUEL,YEAR): Capitalized Conservation Expenses (M$/YR) TCONCAP(ENDUSE,TECH,EC): Capitalized Conservation Expenses (M$/YR) PCCM(EC): Process Capital Charge Rate Multiplier (($/YR)/$) INFLA(YEAR): Inflation Index ($/$) PEE(ENDUSE,TECH,EC,YEAR): Marginal Process Efficiency ($/BTU or $/J) PERA(ENDUSE,TECH,EC,YEAR): Process Energy Requirements Additions((MBTU/YR)/YR) PEER(ENDUSE,TECH,EC,YEAR): Process Policy Participation Response (BTU/BTU OR J/J) PCC(ENDUSE,TECH,EC,YEAR): Process Capital Cost ($/($/YR)) PCCB(ENDUSE,TECH,EC,YEAR): Process Capital Cost before Rebate ($/($/YR)) PCCP(ENDUSE,TECH,EC,YEAR): Capital Cost of "Rebated" Process ($/($/YR)) PCCU(ENDUSE,TECH,EC,YEAR): Policy Capital Cost Increment ($/($/YR))
Conservation Administration Costs
Conservation administration costs are equal to the administration cost per MBTU times the participation rate, the process capital additions and the marginal process efficiency (which, when multiplied, yield the number of MBTUs).
TCONADM=ADCCST*PEER*PERA*PEE CONADM(F)=CONADM(F)+SUM(TE,EC)(TCONADM(EU,TE,EC)*FTMAP(F,TE))
where: CONADM(SECTOR,FUEL,YEAR): Conservation Administration Costs (M$/YR) TCONADM(ENDUSE,TECH,EC): Conservation Administration Costs (M$/YR) ADCCST(ENDUSE,YEAR): Administrative Costs of Process Efficiency Programs ($/GJ) or ($/MBTU) PEE(ENDUSE,TECH,EC,YEAR): PROCESS CAPITAL Efficiency (BTU/BTU OR J/J) PEER(ENDUSE,TECH,EC,YEAR): Policy Participation Response (BTU/BTU OR J/J) PERA(ENDUSE,TECH,EC,YEAR): PROCESS CAPITAL Energy Requirement Addition (MBTU/YR OR
GJ/YR)
Systematic Solutions, Inc. 18 Policy Assessment Corp.

ENERGY 2020 Demand Sector
Conservation Expenses
The cost of rebates are expensed. The capital cost subsidy (MBTU/YR) is multiplied by the participation rate, the process energy requirement additions and the process efficiency to arrive at the total yearly cost of process capital rebates.
TCONEXP=PCCU*PEER*PERA*PEE CONEXP(F)=CONEXP(F)+SUM(TE,EC)(TCONEXP(EU,TE,EC)*FTMAP(F,TE))
where: CONEXP(SECTOR,FUEL,YEAR): Conservation Expense (M$/YR) TCONEXP(ENDUSE,TECH,EC): Conservation Expense (M$/YR) PCCU(ENDUSE,TECH,EC,YEAR): Process Capital Cost Subsidy($/(MBTU/YR) or $/(GJ/YR)) PEE(ENDUSE,TECH,EC,YEAR): Process Capital Efficiency (BTU/BTU OR J/J) PEER(ENDUSE,TECH,EC,YEAR): Policy Participation Response (BTU/BTU OR J/J) PERA(ENDUSE,TECH,EC,YEAR): PROCESS CAPITAL Energy Requirement Addition (MBTU/YR OR
GJ/YR)
PROCEDURE CIMPACT: Cross-Impacts of one end-use on another Some efficiency changes have cross impacts. For example, more efficient lighting gives off less heat, saving energy when air conditioning is needed but increasing energy needs in the winter. This procedure calculates those impacts by assuming the MCFU decision is the primary decision and determines building characteristics. Cross-impacts then affect only size (volume) energy needs.
Loss Intensity
The loss intensity measures the waste heat from inefficiencies: LI=((1/DEE-1/(DEM*DEMM))/PEE)/LIN
where: LI(ENDUSE,TECH,EC): Loss Intensity Index (BTU/BTU) LIN(TECH,EC): Loss Intensity - Normal (BTU/BTU) DEE(ENDUSE,TECH,EC,YEAR): Device Efficiency (BTU/BTU OR J/J) DEM(ENDUSE,TECH,EC): Maximum Device Efficiency (BTU/BTU OR J/J) DEMM(ENDUSE,TECH,EC,YEAR): Technological Improvements in Devices(BTU/BTU OR J/J) PEE(ENDUSE,TECH,EC,YEAR): Marginal Process Efficiency ($/BTU or $/J)
Cross Energy-Use Impacts
EIM measures the cross end-use energy impacts. The cross impact factor captures the concept that the more dominant the end-use, the less other end-uses affect it.
EIM(TE,EC)=PEE(TE,EC)/PEE0(TE,EC)*PRODUCT(CEU)(LI(CEU,TE,EC)**CIF(CEU,TE,EC)) PEE=PEE*EIM
where: EIM(TECH,EC,YEAR): Energy Intensity Multiplier (BTU/BTU OR GJ/GJ) CIF(ENDUSE,CENDUSE,TECH,EC): Cross-Impact Factor (BTU/BTU or J/J) LI(ENDUSE,TECH,EC) 'Loss Intensity Index (BTU/BTU) PEE(ENDUSE,TECH,EC,YEAR): Marginal Process Efficiency ($/BTU or $/J) PEE0(ENDUSE,TECH,EC,FIRST): Marginal Process Efficiency ($/BTU or $/J)
Systematic Solutions, Inc. 19 Policy Assessment Corp.

ENERGY 2020 Demand Sector
PROCEDURE MSHARE: Marginal Market Shares
Market Share Determination
ENERGY 2020 uses standard market share concepts to allocate fuels to specific end uses. Not all investment funds are allocated to the least expensive energy form. Uncertainty, regional variations and limited knowledge make the perceived price on which choices are based, a distribution. The investments allocated to any fuel type are then proportional to the fraction of times one fuel is perceived as less expensive than all others.
A market allocation weight (MAW) is computed for each fuel (TE) in each end-use (EU) in each economic class (EC). Summing over the fuels, a total allocation weight by (EC) and (EU) is calculated. The ratio of the MAW/TAW yields the market share fraction by device for each economic class (MMSF).
In the most basic terms, market share (MMSF) is determined by price [more specifically, the increase in the efficiency-adjusted real prices: (MCFU/INFLA/PEE)/ (MCFU0/INFLA0/PEE0)] and a variance factor on perceived prices (MVF). Other adjustments to market share come from non-price factors (MMSM0), income induced buying pattern changes (MMSM1, modified by population and capital output variables), and a market potential multiplier (MSMM) that captures non-price determinants such as color or style. The natural log form of MSMM implies that it is a direct multiplier on MAW (for example, if MSMM=0.5, then the value of MAW is MAW*0.5). A final variable, the energy supply constraint multiplier, (TENMSM), can be used to represent any existing or predicted fuel supply constraints that would prevent all demand for a particular fuel from being met.
Market Share Determination
First determine each fuel market allocation weight (MAW) for each EC: MAW=EXP(MMSM0+LN(MSMM)+MMSMI*(STCO/SPOP)/(STCO0/SPOP0)+MVF*LN((MCFU/INF
LA/PEE)/(MCFU0/INFLA0/PEE0)))*TENMSM where:
INFLA(YEAR): Inflation Index ($/$)
The total market allocation weight for each EC is the individual MAWs summed over fuel: TMAW(EC)=SUM(TE)(MAW(TE,EC))
The marginal market share fraction for each fuel for each EC is the ratio of the MAW of the particular fuel to the total (TMAW):
MMSF=MAW/TMAW where:
MAW(TECH,EC,YEAR): Marginal Allocation Weight ($/$) TMAW(EC,YEAR): Total Allocation. Weight ($/$) MMSF(ENDUSE,TECH,EC,YEAR): Market Share Fraction by Device ($/$) MMSM0(ENDUSE,TECH,EC,YEAR): Non-price Factors ($/$) MMSMI(ENDUSE,TECH,EC): Market Share Multiplier from Income ($/$) MSMM(ENDUSE,TECH,YEAR): Market Potential Multiplier MCFU(ENDUSE,TECH,EC,YEAR): Marginal Cost of Fuel Use ($/MBTU or $/GJ)
Systematic Solutions, Inc. 20 Policy Assessment Corp.

ENERGY 2020 Demand Sector
MCFU0(ENDUSE,TECH,EC,FIRST): Marginal Cost of Fuel Use ($/MBTU or $/GJ) MVF(ENDUSE,TECH,EC): Market Share Variance Factor ($/$) INFLA(YEAR): Inflation Index ($/$) INFLA0(FIRST): Inflation Index ($/$) PEE(ENDUSE,TECH,EC,YEAR): Marginal Process Efficiency ($/BTU or $/J) PEE0(ENDUSE,TECH,EC,FIRST): Marginal Process Efficiency ($/BTU or $/J) TENMSM(TECH): Energy Supply Constraint Multiplier (BTU/BTU or J/J) SPOP(EC,YEAR): Population (Millions) SPOP0(EC,FIRST): Population (Millions) SPC(EC,YEAR): Total Production Capacity (M$/YR) SPC0(EC,FIRST): Total Production Capacity (M$/YR)
PROCEDURE FUELSYSTEM: System-Based Fuel Choice
Fuel System Selection
The weighted system marginal cost of fuel use (MCFU) is the sum of the marginal cost of fuel uses less a joint device adjustment (DCC*DCCR*JDA) multiplied by the device energy contribution (DEC/SUM(DEC)). Heat and air conditioning are weighted together.
SMCFU(TE,EC)=SUM(CEU,XTE)((MCFU1(CEU,XTE,EC)-DCCR1(CEU,TE,EC)*DCC1(CEU,TE,EC)*JDA(CEU,TE))*DEC(CEU,XTE,EC))/SUM(CEU,X TE)(DEC(CEU,XTE,EC))/INFLA
where: INFLA(YEAR): Inflation Index ($/$) JDA(CENDUSE,TECH): Joint Device Adjustment DEC(CENDUSE,TECH,EC): Device Energy Contribution (BTU/BTU)
Market Share
The market shares are determined in the same fashion as the market shares in Procedure 7. First determine each fuel system market allocation weight (SMAW) for each EC:
SMAW(TE,EC)=EXP(SMSM0(TE,EC)+SVF(TE,EC)*LN((SMCFU(TE,EC)/SUM(CEU)(PEE1(CEU,TE, EC)))/(SMCFU0(TE,EC)/SUM(CEU)(PEE01(CEU,TE,EC))))+SMSMI(TE,EC)*(STCO(EC)/SP OP(EC))/(STCO0(EC)/SPOP0(EC)))
The total market allocation weight for each EC is the individual MAWs summed over fuel: STMAW(EC)=SUM(TE)(SMAW(TE,EC))
The marginal market share fraction for each fuel for each EC is the ratio of the MAW of the particular fuel to the total (TMAW):
SMSF=SMAW/STMAW
where: SMSF(TECH,EC,YEAR): Market Share Fraction by Device ($/$) SMAW(TECH,EC,YEAR): Marginal Allocation Weight ($/$) STMAW(EC,YEAR): Total Allocation. Weight ($/$) SMMSF(ENDUSE,TECH,EC,YEAR): Market Share Fraction by Device ($/$) SMMSM0(ENDUSE,TECH,EC,YEAR): Non-price Factors ($/$) SMMSMI(ENDUSE,TECH,EC): Market Share Multiplier from Income ($/$) SMSMM(ENDUSE,TECH,YEAR): Market Potential Multiplier SMCFU(ENDUSE,TECH,EC,YEAR): Marginal Cost of Fuel Use ($/MBTU or $/GJ)
Systematic Solutions, Inc. 21 Policy Assessment Corp.

ENERGY 2020 Demand Sector
SMCFU0(ENDUSE,TECH,EC,FIRST): Marginal Cost of Fuel Use ($/MBTU or $/GJ) SMVF(ENDUSE,TECH,EC): Market Share Variance Factor ($/$) INFLA(YEAR): Inflation Index ($/$) SINFLA0(FIRST): Inflation Index ($/$) SPEE(ENDUSE,TECH,EC,YEAR): Marginal Process Efficiency ($/BTU or $/J) SPEE0(ENDUSE,TECH,EC,FIRST): Marginal Process Efficiency ($/BTU or $/J) TENMSM(TECH): Energy Supply Constraint Multiplier (BTU/BTU or J/J) SPOP(EC,YEAR): Population (Millions) SPOP0(EC,FIRST): Population (Millions) SPC(EC,YEAR): Total Production Capacity (M$/YR) SPC0(EC,FIRST): Total Production Capacity (M$/YR)
SMSF is mapped into MMSF MMSF1(EU,TE,EC)=SUM(CEU,XTE)(SMSF(XTE,EC)*DEC(CEU,XTE,EC))/DEC(EU,TE,EC)
where: MMSF1(ENDUSE,TECH,EC,YEAR): Market Share Fraction by Device ($/$) SMSF(TECH,EC,YEAR): Market Share Fraction by Device ($/$)
PROCEDURE MSTOCK: Marginal Stock Changes This procedure calculates End-use Saturations (Using Electric or Weighted-Average as the Reference Fuel), and process and device energy additions.
End-Use Saturations
This formula captures the non-price induced asymptotic saturation of devices. The Device Saturation (DST) is some fraction of the maximum device saturation (DSTM). This fraction is determined by the existing level of device saturation modified by changes in the marginal costs of using each fuel ((MCFU/INFLA/PEE)/(MCFU0/INFLA/PEE0) - both changes in device efficiency and fuel price changes are captured here) and income effects (DSTI*(STCO/SPOP)/(STCO0/SPOP0)) The income effects on the device saturation depend on the ratio of current and last period total output capacity per person.
DST=DSTM/(1+EXP(DST0+DSTP*LN((MCFU/INFLA/PEE)/(MCFU0/INFLA/PEE0))+ DSTI*(STCO/SPOP)/(STCO0/SPOP0)))
where: DST(ENDUSE,EC,YEAR): Device Saturation (BTU/BTU or J/J) DST0(ENDUSE,EC,YEAR): Device Saturation (BTU/BTU or J/J) DSTI(ENDUSE,EC): Device Saturation Income Utility ($/$) DSTM(ENDUSE,EC): Maximum Device Saturation (BTU/BTU or J/J) DSTP(ENDUSE,EC): Device Saturation Price Utility ($/$) INFLA(YEAR): Inflation Index ($/$) MCFU(ENDUSE,TECH,EC,YEAR): Marginal Cost of Fuel Use ($/MBTU or $/GJ) MCFU0(ENDUSE,TECH,EC,FIRST): Marginal Cost of Fuel Use ($/MBTU or $/GJ) PEE(ENDUSE,TECH,EC,YEAR): Marginal Process Efficiency ($/BTU or $/J) PEE0(ENDUSE,TECH,EC,FIRST): Marginal Process Efficiency ($/BTU or $/J) SPOP(EC,YEAR): Population (MILLIONS) SPOP0(EC,FIRST): Population (MILLIONS) STCO(EC): Total Capital Output Capacity (M$/YR) STCO0(EC): Total Capital Output Capacity (M$/YR)
Systematic Solutions, Inc. 22 Policy Assessment Corp.

ENERGY 2020 Demand Sector
Capital output is associated with a service or process energy requirement. The process energy requirement (PER) is the delivered process energy needed to produce the output implied by the capital output. The device energy requirement (DER) represent the energy needed by furnaces, for example to provide a process energy requirement. The capital stock (CO) last from 45 to 60 years. The devices which serve those stocks only last 15 to 20 years. Therefore the model separates the capital stock and their process requirements (CO, PER) into three age classes or vintages: new, middle, and old. As the stock passes from one age class to another, the devices which serve it are replaced. Therefore the device efficiency can change more often than the process efficiency.
Stock Life-Cycle Dynamics
Capital Stock Failure/Wear-out
Capital stock is retired (EUPCR) depending on the lifetime (PCPL) specified. If the lifetime is 30 years, then 1/30 of the capital stock (EUPC) is retired each year.
EUPCR(TE,A,EC)=EUPC(TE,A,EC)/(SUM(ECC)(PCPL(ECC)*ECCMAP(EC,ECC))/3) where:
EUPCR(ENDUSE,TECH,AGE,EC): Production Capacity Retirement ((M$/YR)/YR) EUPC(ENDUSE,TECH,AGE,EC,YEAR): Production Capacity by End-use (M$/YR) PCPL(ECC,YEAR): Physical Life of Production Capacity (YRS)
Changes in Stock Due to New Stock Growth
Capital Additions (EUPCA) by technology and economic class are calculated by dividing the production capacity additions (PCA) by the market share fractions for each economic class and fuel.
EUPCA(TE,NEW,EC)=SUM(ECC)(PCA(NEW,ECC)*ECCMAP(EC,ECC))*MMSF(TE,EC)
Capital is “aged” by moving it into different vintages. The “retired” capital from one age category becomes the “new” capital in the next vintage:
SELECT AGE(MID,OLD) EUPCA(TE,A,EC)=EUPCR(TE,A-1,EC)
where: EUPCA(ENDUSE,TECH,AGE,EC,YEAR): Production Capacity Additions ((M$/YR)/YR) EUPCR(ENDUSE,TECH,AGE,EC): Production Capacity Retirement ((M$/YR)/YR) MMSF(ENDUSE,TECH,EC,YEAR): Market Share Fraction by Device ($/$) PCA(AGE,ECC,YEAR): Production Capacity Additions ((M$/YR)/YR)
Stock Growth Dynamics
The total amount of stock is affected by changing saturation (retirements from the “old” vintage):
FXPC(TE,EC)=SUM(A)(EUPC(TE,A,EC))-EUPCR(TE,OLD,EC) where:
FXPC(TECH,EC): Fixed Production Capacity (M$/YR) EUPCR(ENDUSE,TECH,AGE,EC): Production Capacity Retirement ((M$/YR)/YR) EUPC(ENDUSE,TECH,AGE,EC,YEAR): Production Capacity by End-use (M$/YR)
Systematic Solutions, Inc. 23 Policy Assessment Corp.

ENERGY 2020 Demand Sector
New Process Additions From Capital Additions and Saturation Change
Every new capital addition (EUPCA) causes a fuel-specific service energy requirement (PERA). This requirement is modified by the device saturation and divided by the marginal process energy efficiency (dollars of output per service energy input). In addition to new process capital above the current stock, some old stock is replaced. This replacement stock (FXPC) may have a new device saturation (DST-DSTL) and is further modified by the average process efficiency.
PERA(TE,EC)=DST(EC)*EUPCA(TE,NEW,EC)/PEE(TE,EC)+(DST(EC)-DSTL(EC))*FXPC(TE,EC)/PEEA(TE,EC)
where: PERA(TECH,EC,YEAR): Process Energy Requirement Additions ((MBTU/YR)/YR) DST(ENDUSE,EC,YEAR): Device Saturation (BTU/BTU or J/J) DSTL(ENDUSE,EC,YEAR): Device Saturation (BTU/BTU or J/J) EUPCA(ENDUSE,TECH,AGE,EC,YEAR): Production Capacity Additions ((M$/YR)/YR) PEE(ENDUSE,TECH,EC,YEAR): Marginal Process Efficiency ($/BTU or $/J) PEEA(ENDUSE,TECH,EC,YEAR): Average Process Efficiency ($/BTU or $/J) FXPC(TECH,EC): Fixed Production Capacity (M$/YR)
Process Energy Retirements Due to Capital Retirements
Process retirements due to capital retirements are accounted the process energy removed due to the retired capital (EUPCR/PEEA - note the use of average efficiency and not marginal) modified by the device saturation as of the last period (DSTL).
PERRP(TE,EC)=DSTL(EC)*EUPCR(TE,OLD,EC)/PEEA(TE,EC) where:
PERRP(TECH,EC): Process Energy Requirement. Process Retirements ((MBTU/YR)/YR) DSTL(ENDUSE,EC,YEAR): Device Saturation (BTU/BTU or J/J) EUPCR(ENDUSE,TECH,AGE,EC,YEAR): Production Capacity Retirements ((M$/YR)/YR) PEEA(ENDUSE,TECH,EC,YEAR): Average Process Efficiency ($/BTU or $/J)
Device Retirements Due to Capital Retirements
When capital stock is retired, the devices are retired as well. The process energy requirements (PERRP) eliminated due to capital stock retirements divided by the average device efficiency (DEEA) yields the device energy requirement (DERRP) than is eliminated as well.
DERRP=PERRP/DEEA where:
DEEA(ENDUSE,TECH,EC,YEAR): Average Device Efficiency ($/BTU or $/J) PERRP(TECH,EC): Process Energy Requirement. Process Retirements ((MBTU/YR)/YR) DERRP(TECH,EC) 'Device Energy Requirement. Process Retire. ((MBTU/YR)/YR)
Changes in Stock Due to Normal Failures and Replacement
In addition to process retirements, some stock is replaced due to process failure. Process failure or wear-out (PERR) is calculated as the process energy requirement (PER) less retirements (PERRP) divided by the process capital lifetime (PEPL).
PERR=(PER-PERRP)/PEPL where:
Systematic Solutions, Inc. 24 Policy Assessment Corp.

ENERGY 2020 Demand Sector
PERR(ENDUSE,TECH,EC,YEAR): Process Energy Failure or Wearout (MBTU/YR) PER(ENDUSE,TECH,EC,YEAR): Process Energy Requirement (MBTU/YR) PEPL(ENDUSE,TECH,EC,YEAR): Physical Life of Process Requirements (YRS) PERRP(TECH,EC): Process Energy Requirement. Process Retirements ((MBTU/YR)/YR)
Device Failure/Wear-out
Device failure is calculated in exactly the same manner: device energy retirements (DERRP) are subtracted from the total device energy requirement (DER) and the result is divided by the device lifetime (DPL).
DERR=(DER-DERRP)/DPL where:
DER(ENDUSE,TECH,EC,YEAR): Device Energy Requirement (MBTU/YR OR GJ/YR) DPL(ENDUSE,TECH,EC,YEAR): Physical Life of Equipment (YRS) DERR(ENDUSE,TECH,EC,YEAR): Device Failure or Wearout (MBTU/YR) DERRP(TECH,EC): Device Energy Requirement. Process Retirements ((MBTU/YR)/YR)
Device Replacement, New Capital Additions, and New Process Replacement
The new, fuel-specific device energy requirement additions (DERA) represent the need for new devices (both from new capital additions (PERA) and from process wearout (PERR*(PEEA/PEE-1)) divided by the new (marginal) device efficiency.
DERA=(PERA+PERR*XMAX(0,(PEEA/PEE-1)))/DEE where:
DERA(ENDUSE,TECH,EC,YEAR): Device Energy Requirement Addition (MBTU/YR OR GJ/YR) PEE(ENDUSE,TECH,EC,YEAR): Marginal Process Efficiency ($/BTU or $/J) PEEA(ENDUSE,TECH,EC,YEAR): Average Process Efficiency ($/BTU or $/J) PERA(TECH,EC,YEAR): Process Energy Requirement Additions ((MBTU/YR)/YR) PERR(ENDUSE,TECH,EC,YEAR): Process Energy Failure or Wearout (MBTU/YR)
Process Replacement with New Efficiency
Process energy requirements receive an added term (PERR*PEEA/PEE) to capture the changing efficiencies of replacement capital. If the marginal efficiency (PEE) is greater than the average (PEEA) then PERR will fall (the replacement stock will be more efficient than the existing stock)..
PERA=PERA+PERR*PEEA/PEE
where: PERA(TECH,EC,YEAR): Process Energy Requirement Additions ((MBTU/YR)/YR) PEE(ENDUSE,TECH,EC,YEAR): Marginal Process Efficiency ($/BTU or $/J) PEEA(ENDUSE,TECH,EC,YEAR): Average Process Efficiency ($/BTU or $/J) PERR(ENDUSE,TECH,EC,YEAR): Process Energy Failure or Wearout (MBTU/YR)
PROCEDURE CONVERSION: Device Retirements and Fuel Conversions A Device conversion (for example changing from an electric to a natural gas water heater) is a fuel choice decision. The decision to replace with a device using a different fuel is based on the
Systematic Solutions, Inc. 25 Policy Assessment Corp.

ENERGY 2020 Demand Sector
relative total cost of energy service (MCFU). Policies used in this routine are rebates. Low interest loans would require additional calculations (a CMCFU based a FDCCRU).
Device Fuel Conversions
Market Share
In the most basic terms, conversion market share (CMSF) is determined by price [more specifically, the increase in the efficiency-adjusted real prices: (MCFU/INFLA/ (MCFU0/INFLA0] and a variance factor on perceived prices (CVF). Other adjustments to market share come from non-price factors (CMSM0) and income induced buying pattern changes (CMSM1, modified by population and capital output variables).
First determine each fuel market allocation weight (CMAW) for each EC: CMAW=EXP(CMSM0+CVF*LN(((MCFU-DCCR*(FDCC+FDCCU))/INFLA)/
(MCFU0/INFLA0))+CMSMI*(STCO/SPOP)/(STCO0/SPOP0))
The total market allocation weight for each EC is the individual CTMAWs summed over fuel: CTMAW(XTE,EC)=SUM(TE)(CMAW(TE,XTE,EC))
The marginal market share fraction for each fuel for each EC is the ratio of the CMAW of the particular fuel to the total (CTMAW):
CMSF=CMAW/CTMAW where:
CMAW(TECH,EC,YEAR): Marginal Allocation Weight ($/$) CTMAW(EC,YEAR): Total Allocation. Weight ($/$) CMSF(ENDUSE,TECH,EC,YEAR): Market Share Fraction by Device ($/$) CMSM0(ENDUSE,TECH,EC,YEAR): Non-price Factors ($/$) CMSMI(ENDUSE,TECH,EC): Market Share Multiplier from Income ($/$) MCFU(ENDUSE,TECH,EC,YEAR): Marginal Cost of Fuel Use ($/MBTU or $/GJ) MCFU0(ENDUSE,TECH,EC,FIRST): Marginal Cost of Fuel Use ($/MBTU or $/GJ) CVF(ENDUSE,TECH,EC): Market Share Variance Factor ($/$) INFLA(YEAR): Inflation Index ($/$) INFLA0(FIRST): Inflation Index ($/$) SPOP(EC,YEAR): Population (Millions) SPOP0(EC,FIRST): Population (Millions) SPC(EC,YEAR): Total Production Capacity (M$/YR) SPC0(EC,FIRST): Total Production Capacity (M$/YR) FDCC(ENDUSE,TECH,CTECH): Fixed Device Capital Cost ($/(MBTU/YR) or $/(GJ/YR)) FDCCU(ENDUSE,TECH,CTECH,YEAR): Conversion Rebate DCCR(ENDUSE,TECH,EC,YEAR): Device Capital Charge Rate (($/YR)/$)
Device Replacement with New Efficiency
The reduction in MBTU due to higher efficiency replacements is captured in this equation. Total energy conversion additions (DERC) are equal to the replacements (DERR) by fuel (CMSF) modified by the ratio of the average efficiency to the new, marginal efficiency.
DERC(TE,EC)=SUM(XTE)(DERR(EU,XTE,EC)*DEEA(XTE,EC)* CMSF(TE,XTE,EC))/DEE(TE,EC)
Systematic Solutions, Inc. 26 Policy Assessment Corp.

ENERGY 2020 Demand Sector
where: DERC(ENDUSE,TECH,EC): Energy Conversion Addition (MBTU/YR OR GJ/YR) DEE(ENDUSE,TECH,EC,YEAR): Device Efficiency (BTU/BTU OR J/J) DERR(ENDUSE,TECH,EC,YEAR): Device Failure or Wearout (MBTU/YR) DEEA(ENDUSE,TECH,EC,YEAR): Average Device Efficiency (BTU/BTU OR J/J) CMSF(ENDUSE,TECH,EC,YEAR): Market Share Fraction by Device ($/$)
Process Replacement with New Efficiency and Conversions (Fuel Switch)
Process replacements (PERA) are modified to include conversions at the higher efficiency level (DERC*DEE):
PERA=PERA+DERC*DEE where:
PERA(TECH,EC,YEAR): Process Energy Requirement Additions ((MBTU/YR)/YR) DERC(ENDUSE,TECH,EC): Energy Conversion Addition (MBTU/YR OR GJ/YR) DEE(ENDUSE,TECH,EC,YEAR): Device Efficiency (BTU/BTU OR J/J)
Capital Stock Fuel Loss (Switch) from Conversion
To capture the fuel loss from conversion, the "aged" (MID,OLD) capital stocks are moved across fuels using stock-age weight (EUPC/SUM(V)(EUPC))
EUPCR(TE,A,EC)=DERR(EU,TE,EC)*(DEEA(TE,EC)*PEEA(TE,EC))*EUPC(TE,A,EC)/SUM(V)(EUP C(TE,V,EC))
where: EUPCR(ENDUSE,TECH,AGE,EC): Production Capacity Retirement ((M$/YR)/YR) DEEA(ENDUSE,TECH,EC,YEAR): Average Device Efficiency (BTU/BTU OR J/J) PEEA(ENDUSE,TECH,EC,YEAR): Average Process Efficiency ($/BTU or $/J) EUPC(ENDUSE,TECH,AGE,EC,YEAR): Production Capacity by End-use (M$/YR) DERR(ENDUSE,TECH,EC,YEAR): Device Failure or Wearout (MBTU/YR)
Capital Stock Fuel Addition (Switch) from Conversion
Capital Stock fuel additions are also stock-age weighted and are calculated as the product of the energy conversion additions, the marginal device efficiency (DEE) and the average process efficiency (PEEA).
EUPCA(TE,A,EC)=DERC(TE,EC) * (DEE(TE,EC) * PEEA(TE,EC)) * EUPC(TE,A,EC)/SUM(V)(EUPC(TE,V,EC))
where: EUPCA(ENDUSE,TECH,AGE,EC,YEAR): Production Capacity Additions ((M$/YR)/YR) EUPC(ENDUSE,TECH,AGE,EC,YEAR): Production Capacity by End-use (M$/YR) DEE(ENDUSE,TECH,EC,YEAR): Device Efficiency (BTU/BTU OR J/J) PEEA(ENDUSE,TECH,EC,YEAR): Average Process Efficiency ($/BTU or $/J) DERC(ENDUSE,TECH,EC): Energy Conversion Addition (MBTU/YR OR GJ/YR)
Systematic Solutions, Inc. 27 Policy Assessment Corp.

ENERGY 2020 Demand Sector
Process Fuel (Switch) Loss from Conversion and Process Retirement
Process energy loss (PERR) is modified to include the energy requirements from device failure (DERR*DEEA).
PERR=PERR+DERR*DEEA where:
PERR(ENDUSE,TECH,EC,YEAR): Process Energy Failure or Wearout (MBTU/YR) DERR(ENDUSE,TECH,EC,YEAR): Device Failure or Wearout (MBTU/YR) DEEA(ENDUSE,TECH,EC,YEAR): Average Device Efficiency (BTU/BTU or J/J)
Devices from Conversions
Device energy requirements already calculated is modified to include devices from conversions (DERC).
DERA=DERA+DERC where:
DERA(ENDUSE,TECH,EC,YEAR): Device Energy Requirement Addition (MBTU/YR OR GJ/YR) DERC(ENDUSE,TECH,EC): Energy Conversion Addition (MBTU/YR OR GJ/YR)
Capitalized Conservation Expense from Low Interest Loans
Capitalized conservation is calculated as the cost of the device minus the rebate multiplied by the number of devices subject to the loan, the additional device energy requirements and the capital charge rate. It is the annualize cost of the DSM program. Loan is for entire system less the rebate.
TCONCAP(EU,TE,EC)=SUM(XTE)(FDCCU(TE,XTE) * (1-DCCM(XTE)) * DERR(EU,XTE,EC) * DEEA(XTE,EC) * CMSF(TE,XTE,EC)/DEE(XTE,EC))/1E6
CONCAP(F)=CONCAP(F)+SUM(TE,EC)(TCONCAP(EU,TE,EC)*FTMAP(F,TE)) where:
CONCAP(SECTOR,FUEL,YEAR): Capitalized Conservation Expenses (M$/YR) TCONCAP(ENDUSE,TECH,EC): Capitalized Conservation Expenses (M$/YR) DCCM(TECH): Device Capital Charge Rate Multiplier (($/YR)/$) FDCCU(ENDUSE,TECH,EC,YEAR): Device Capital Cost Subsidy($/(MBTU/YR) or $/(GJ/YR)) DEE(ENDUSE,TECH,EC,YEAR): Device Efficiency (BTU/BTU OR J/J) DEER(ENDUSE,TECH,EC,YEAR): Policy Participation Response (BTU/BTU OR J/J) DERA(ENDUSE,TECH,EC,YEAR): Device Energy Requirement Addition (MBTU/YR OR GJ/YR) INFLA(YEAR): Inflation Index ($/$) CMSF(ENDUSE,TECH,EC,YEAR): Market Share Fraction by Device ($/$)
Conversion Expenses
The cost of rebates are expensed. The capital cost subsidy (MBTU/YR) is multiplied by the participation rate, the device energy requirement additions and the device efficiency to arrive at the total yearly cost of device rebates.
TCONEXP(EU,TE,EC)=SUM(XTE)(DERR(EU,XTE,EC)*DEEA(XTE,EC) * CMSF(TE,XTE,EC) * FDCCU(TE,XTE))
CONEXP(F)=CONEXP(F)+SUM(TE,EC)(TCONEXP(EU,TE,EC)*FTMAP(F,TE))
Systematic Solutions, Inc. 28 Policy Assessment Corp.

ENERGY 2020 Demand Sector
where: CONEXP(SECTOR,FUEL,YEAR): Conservation Expense (M$/YR) TCONEXP(ENDUSE,TECH,EC): Conservation Expense (M$/YR) FDCCU(ENDUSE,TECH,EC,YEAR): Device Capital Cost Subsidy($/(MBTU/YR) or $/(GJ/YR)) DEER(ENDUSE,TECH,EC,YEAR): Policy Participation Response (BTU/BTU OR J/J) DERA(ENDUSE,TECH,EC,YEAR): Device Energy Requirement Addition (MBTU/YR OR GJ/YR) CMSF(ENDUSE,TECH,EC,YEAR): Market Share Fraction by Device ($/$)
Conservation Administration Costs
Conservation administration costs are equal to the cost per MBTU times the participation rate, the device additions and device efficiency.
TCONADM(EU,TE,EC)=SUM(XTE)(DERR(EU,XTE,EC) * DEEA(XTE,EC) * CMSF(TE,XTE,EC) * ADDCST * FDCCU(TE,XTE)/FDCCU(TE,XTE))
CONADM(F)=CONADM(F)+SUM(TE,EC)(TCONADM(EU,TE,EC)*FTMAP(F,TE))
where: CONADM(SECTOR,FUEL,YEAR): Conservation Administration Costs (M$/YR) TCONADM(ENDUSE,TECH,EC): Conservation Administration Costs (M$/YR) ADDCST(ENDUSE,YEAR): Administrative Costs of Device Efficiency Programs ($/GJ) or ($/MBTU) DEER(ENDUSE,TECH,EC,YEAR): Policy Participation Response (BTU/BTU OR J/J) DERA(ENDUSE,TECH,EC,YEAR): Device Energy Requirement Addition (MBTU/YR OR GJ/YR) CMSF(ENDUSE,TECH,EC,YEAR): Market Share Fraction by Device ($/$) FDCCU(ENDUSE,TECH,EC,YEAR): Device Capital Cost Subsidy ($/(MBTU/YR) or $/(GJ/YR))
Device and Retirement Accounting
Device energy additions is modified once again to include the effects of new efficiency levels ((DERR*DEEA)/DEE)) on replacements.
DERA=DERA+DERR*DEEA/DEE
where: DERA(ENDUSE,TECH,EC,YEAR): Device Energy Requirement Addition (MBTU/YR OR GJ/YR) DERR(ENDUSE,TECH,EC,YEAR): Device Failure or Wearout (MBTU/YR) DEEA(ENDUSE,TECH,EC,YEAR): Average Device Efficiency (BTU/BTU or J/J) DEE(ENDUSE,TECH,EC,YEAR): Device Efficiency (BTU/BTU OR J/J)
Device Loss Due to Process Wear Out
Device failure is modified to include loss due to process wear out. DERR=DERR+DERRP+PERR*XMAX(0,(1-PEEA/PEE))/DEEA
where: PERR(ENDUSE,TECH,EC,YEAR): Process Energy Failure or Wearout (MBTU/YR) DERR(ENDUSE,TECH,EC,YEAR): Device Failure or Wearout (MBTU/YR) DEEA(ENDUSE,TECH,EC,YEAR): Average Device Efficiency (BTU/BTU or J/J) PEE(ENDUSE,TECH,EC,YEAR): Marginal Process Efficiency ($/BTU or $/J)
Systematic Solutions, Inc. 29 Policy Assessment Corp.

ENERGY 2020 Demand Sector
PEEA(ENDUSE,TECH,EC,YEAR): Average Process Efficiency ($/BTU or $/J) DERR(ENDUSE,TECH,EC,YEAR): Device Failure or Wearout (MBTU/YR) DERRP(TECH,EC): Device Energy Requirement. Process Retirements ((MBTU/YR)/YR)
Process Loss from Capital Retirement PERR=PERR+PERRP
where: PERR(ENDUSE,TECH,EC,YEAR): Process Energy Failure or Wearout (MBTU/YR) PERRP(TECH,EC): Process Energy Requirement. Retirements ((MBTU/YR)/YR)
PROCEDURE PRETROFIT: Process Retrofits A retrofit decision is a decision about efficiency, not fuel choice. In the retrofit procedure, existing process capital is replaced with higher efficiency but same fuel type capital before it wears out because the customer finds it economic to do so. While some retrofits take place in the market (i.e. without intervention), most retrofits are the result of incentive programs.
Process Capital Charge Rate for a Retrofit
The process capital charge rate is the annualization of process capital expenses (over the life of the process capital - PETL), accounting for taxes (TXRT), tax credits (PIVTC), and return of principal and on investment (including and inflation: 1+ROIN+INSM). (1-(1/(1+ROIN))**PEPLN2)/(1-TXRT) is the classical capital recovery term. However, the process investment will only last PETL/2 years. Process retrofits cause reduction in device energy requirement for stock. The (1-TXRT) term at the end converts the after tax calculation into before tax dollars. Investment tax credits reduce the cost of the facility by the tax credit after the first year of operation using nominal dollars. Therefore the value of the tax credit is (PIVTC/(1+ROIN+INSM)). Depreciation is modeled as a current dollar phenomena which does not account for inflation. Therefore the net present value of the energy is calculated with the nominal rate of return: (4/PETL)/(ROIN+INSM+4/PETL)). It shows up as an additional negative term in the capital cost modifiers of PCCR because depreciation is a benefit (negative cost).
Process capital costs (PCC) are multiplied by the PCCR to get the annualized cost of the process capital used in computing market share calculations.
RPCCR=(1-PIVTC/(1+ROIN+INSM)-TXRT*(4/PETL)/(ROIN+0+INSM+4/PETL))*ROIN/(1-(1/(1+ROIN))**(PEPLN/2))/(1-TXRT)
Where: PIVTC(TECH,YEAR): Process Capital Investment Tax Credit ($/$) PEPLN(ENDUSE,TECH,EC,ZERO): Physical Life of Process Capital (YRS) PETL(ENDUSE,TECH,EC): Process Capital Tax Life (YRS) INSM(YEAR): Smoothed Inflation Rate (($/YR)/$) ROIN(EC): Return on Investment (($/YR)/$) TXRT(EC,YEAR): Tax Rate on Energy Consumer ($/$)
The incentive program capital charge rate (RPCRU) is computed based on the policy investment tax credits (PPIVTC) and the interest rate on subsidized loans (CROIN). The capital charge rate
Systematic Solutions, Inc. 30 Policy Assessment Corp.

ENERGY 2020 Demand Sector
with an incentive (RPCRU) will equal the retrofit capital charge rate (RPCCR) if there is no interest subsidy (CROIN=0.0) or investment tax credits (PPIVTC=0.0).
RPCRU=(1-(PIVTC+PPIVTC)/(1+ROIN-CROIN+INSM)-TXRT*(4/PETL)/(ROIN-CROIN+INSM+4/PETL))*(ROIN-CROIN)/(1-(1/(1+ROIN-CROIN))**PEPLN)/(1-TXRT)
where: PIVTC(TECH,YEAR): Process Capital Investment Tax Credit ($/$) PEPLN(ENDUSE,TECH,EC,ZERO): Physical Life of Process Capital (YRS) PETL(ENDUSE,TECH,EC): Process Capital Tax Life (YRS) INSM(YEAR): Smoothed Inflation Rate (($/YR)/$) ROIN(EC): Return on Investment (($/YR)/$) TXRT(EC,YEAR): Tax Rate on Energy Consumer ($/$) CROIN(ENDUSE): Conservation Return on Investment (($/YR)/$) PPIVTC(YEAR): Process Policy Investment Tax Credit ($/$)
The process capital cost multiplier (RPCM) is the increase in capital costs due to the difference between the capital charge rate before (RPCCR) and after (RPCRU) the incentive programs.
RPCM=RPCRU/RPCCR
where: RPCM(EC): Retrofit Process Capital Charge Rate Multiplier (($/YR)/$) RPCCR(EC): Retrofit Process Capital Charge Rate (($/YR)/$) RPCRU(EC): Retrofit Process Capital Charge Rate before Policies (($/YR)/$)
Resource Curves for Retrofits
Resource curves for retrofits can be either endogenously or exogenously specified. User specified retrofit "resource curves" use cost and efficiency decision criteria specified by the user (RTABPE, RTABEC). The secondary efficiency impacts of rebates and loans are assumed to be small and are ignored.
RPEE=RTABPE(MCFU/INFLA) RPCC=RTABEC(RPEE)
where: RPEE(ENDUSE,TECH,EC,YEAR): Retrofit Process Efficiency ($/BTU or $/J) INFLA(YEAR): Inflation Index ($/$) MCFU(ENDUSE,TECH,EC,YEAR): Marginal Cost of Fuel Use ($/MBTU or $/GJ)
Endogenously determined retrofit "resource curves."
Average Unit Cost of Stock
An average unit cost of stock is determined by a model resource curve relating average process efficiency to an average capital stock price.
APCC=CTABCE(PEEA)
where: APCC(TECH,EC): Average Process Capital Cost ($/($/YR))
Systematic Solutions, Inc. 31 Policy Assessment Corp.

ENERGY 2020 Demand Sector
PEEA(ENDUSE,TECH,EC,YEAR): Average Process Efficiency ($/BTU or $/J)
Implied Average MCFU of Historical Stock Choice
An average marginal cost of fuel use is calculated from a resource curve relating average process efficiency to the average marginal cost of fuel use.
AMCFU=CTABEP(PEEA)
where: AMCFU(TECH,EC): Average Implied Cost of Fuel Use ($/MBTU) PEEA(ENDUSE,TECH,EC,YEAR): Average Process Efficiency ($/BTU or $/J)
The following coefficients capture the implied trade-off of current conditions.
Process Capital Cost Coefficients RPCTC=(PEMX-1)/((AMCFU/1000000/PEEA)/((RPCCR+POCF)*APCC)*(1-PEEA/PEM))
where: RPCTC(TECH,EC): Process Capital Cap. Trade Off Coefficient. AMCFU(TECH,EC): Average Implied Cost of Fuel Use ($/MBTU) APCC(TECH,EC): Average Process Capital Cost ($/($/YR)) POCF(ENDUSE,TECH,EC): Process Operating Cost Fraction (($/YR)/$) PEEA(ENDUSE,TECH,EC,YEAR): Average Process Efficiency ($/BTU or $/J) PEM(ENDUSE,EC): Maximum Process Efficiency ($/MBTU or $/GJ) RPCCR(EC,ENDUSE,YEAR): Process Capital Charge Rate (($/YR/$))
Process Fuel Cost Coefficients RPFTC=RPCTC/(1-RPCTC)
where: RPFTC(TECH,EC): Process Fuel Trade Off Coefficient RPCTC(TECH,EC): Process Capital Cap. Trade Off Coefficient.
Normal Process Capital Cost RPCCN=(APCC*PCCR)/(PEM/PEEA-1)**(1/RPCTC)
where: APCC(TECH,EC): Average Process Capital Cost ($/($/YR)) RPCCN(TECH,EC): Normalized Process Capital Cost ($/MBTU) RPFPN(TECH,EC): Process Normalized Fuel Price ($/MBTU) PEM(ENDUSE,EC): Maximum Process Efficiency ($/MBTU or $/GJ) PEEA(ENDUSE,TECH,EC,YEAR): Average Process Efficiency ($/BTU or $/J) PCCR(EC,ENDUSE,YEAR): Process Capital Charge Rate (($/YR/$))
Process Normal Fuel Cost RPFPN=-(PCCR+POCF)*APCC*PEM*1000000/(RPCTC*(PEM/PEEA-1)**(1/RPCTC))
where: RPFPN(TECH,EC): Process Normalized Fuel Price ($/MBTU)
Systematic Solutions, Inc. 32 Policy Assessment Corp.

ENERGY 2020 Demand Sector
APCC(TECH,EC): Average Process Capital Cost ($/($/YR)) PEM(ENDUSE,EC): Maximum Process Efficiency ($/MBTU or $/GJ) RPCTC(TECH,EC): Process Capital Cap. Trade Off Coefficient. POCF(ENDUSE,TECH,EC): Process Operating Cost Fraction (($/YR)/$) RPCCR(EC,ENDUSE,YEAR): Process Capital Charge Rate (($/YR/$))
Efficiency Curve RPEET=PEM/(1+(CPRICE/RPFPN)**RPFTC)
where: RPEET(EFFI,TECH,EC): Price Vs Efficiency Process Retrofit Table (BTU/BTU) RPFTC(TECH,EC): Process Fuel Trade Off Coefficient RPFPN(TECH,EC): Process Normalized Fuel Price ($/MBTU) PEM(ENDUSE,EC): Maximum Process Efficiency ($/MBTU or $/GJ) CPRICE(EFFI,TECH): Energy Price Dimension for Efficiency and Capital Cost Curves ($/MBTU)
Capital Cost Curve RPCCT=RPCCN*(CPRICE/RPFPN)**(RPFTC/RPCTC)
where: RPCCT(EFFI,TECH,EC): Price Vs Capital Cost Process Retrofit Table ($/MBTU) RPFTC(TECH,EC): Process Fuel Trade Off Coefficient RPFPN(TECH,EC): Process Normalized Fuel Price ($/MBTU) RPCTC(TECH,EC): Process Capital Cap. Trade Off Coefficient.
Retrofit Process Efficiency
The secondary efficiency impacts of rebates and loans are assumed to be small and are neglected. Retrofit Process Efficiency is a function of fuel prices, the marginal cost of fuel use and process trade-off coefficient calculated above.
RPEE=PEM/(1+((MCFU/INFLA)/RPFPN)**RPFTC)
where: RPEE(ENDUSE,TECH,EC,YEAR): Retrofit Process Efficiency ($/BTU or $/J) RPFTC(TECH,EC): Process Fuel Trade Off Coefficient RPFPN(TECH,EC): Process Normalized Fuel Price ($/MBTU) INFLA(YEAR): Inflation Index ($/$) PEM(ENDUSE,EC): Maximum Process Efficiency ($/MBTU or $/GJ) MCFU(ENDUSE,TECH,EC,YEAR): Marginal Cost of Fuel Use ($/MBTU or $/GJ)
RPCC=RTABEC(RPEE/PEMM)-APCC RPCC=(RPCCN*((MCFU/INFLA)/RPFPN)**(RPFTC/RPCTC)-APCC)*INFLA
where: RPFPN(TECH,EC): Process Normalized Fuel Price ($/MBTU) RPCC(ENDUSE,TECH,EC): Retrofit Process Capital Cost ($/($/YR)) RPCCT(ENDUSE,EFFI,TECH,EC): Price Vs Capital Cost Process Retrofit Table($/MBTU or $/GJ) RPCCU(ENDUSE,TECH,EC,YEAR): Process Retrofit Rebate RPEE(ENDUSE,TECH,EC,YEAR): Retrofit Process Efficiency ($/BTU or $/J) RPEET(ENDUSE,EFFI,TECH,EC): Price Vs Efficiency Process Retrofit Table (BTU/BTU or J/J) RPMSM0(ENDUSE,TECH,EC,YEAR): Process Retrofit Market Share Multiplier (1/YR) RPMSMI(ENDUSE,TECH,EC): Process Retrofit Multiplier From Income (1/YR)
Systematic Solutions, Inc. 33 Policy Assessment Corp.

ENERGY 2020 Demand Sector
RPMSF(ENDUSE,TECH,EC,YEAR): Process Retrofit Market Share Fraction by Device (1/YR) RPVF(ENDUSE,TECH,EC): Process Retrofit Market Share Variance Factor (DLESS) RVF(ENDUSE,TECH,EC): Process Retrofit Market Share Variance Factor (DLESS)
Process Investment Decision - Endogenous
Marginal Value of Process Retrofits
The following equation yields the dollar return for a dollar invested in process retrofits. The marginal cost of fuel use, average and marginal device efficiencies, process capital costs are used to derive a value for retrofitting process capital.
MVPR=MCFU*(1/PEEA-1/RPEE)/(RPCRU*(RPCC-RPCCU))/INFLA
where: MCFU(ENDUSE,TECH,EC,YEAR): Marginal Cost of Fuel Use ($/MBTU or $/GJ) INFLA(YEAR): Inflation Index ($/$) RPEE(ENDUSE,TECH,EC,YEAR): Retrofit Process Efficiency ($/BTU or $/J) PEEA(ENDUSE,TECH,EC,YEAR): Average Process Efficiency ($/BTU or $/J) RPCC(ENDUSE,TECH,EC): Retrofit Process Capital Cost ($/($/YR)) PCCU(ENDUSE,TECH,EC,YEAR): Process Retrofit Rebate
Retrofit Market Shares
In basic terms, market share (RFMSF) is determined by price [more specifically, the increase in the marginal value of process retrofits: (MVPR/MVPR0)] and a variance factor on perceived prices (RPVF). Other adjustments to market share come from non-price factors (RPMSM0) and income induced buying pattern changes (RPMSM1, modified by population and capital output variables).
Market Share Determination
The first step is to determine each fuel market allocation weight (MAW) for each EC:
MAW=EXP(RPMSM0+RPVF*LN(MVPR/MVPR0)+RPMSMI*(STCO/SPOP)/(STCO0/SP OP0))
The marginal process retrofit market share fraction for each fuel for each EC is the ratio of the MAW of the particular fuel to the sum of the marginal allocation weight and the marginal value of alternate utility.
RPMSF=MAW/(MAW+MVAU)
where: RPMSF(ENDUSE,TECH,EC,YEAR): Process Retrofit Market Share Fraction by Device MAW(TECH,EC,YEAR): Marginal Allocation Weight ($/$) MVAU: Marginal Value of Alternate Utility ($/$) RPMSF(ENDUSE,TECH,EC,YEAR): Retrofit Process Market Share Fraction by Device($/$) RPMSM0(ENDUSE,TECH,EC,YEAR): Retrofit Process Non-price Factors ($/$) RPMSMI(ENDUSE,TECH,EC): Retrofit Process Market Share Multiplier from Income ($/$) MVPR(ENDUSE,TECH,EC,YEAR): Marginal Value of Process Retrofit ($/MBTU or $/GJ) MVPR0(ENDUSE,TECH,EC,FIRST): Marginal Value of Process Retrofit ($/MBTU or $/GJ)
Systematic Solutions, Inc. 34 Policy Assessment Corp.

ENERGY 2020 Demand Sector
RPVF(ENDUSE,TECH,EC): Retrofit Process Market Share Variance Factor ($/$) SPOP(EC,YEAR): Population (Millions) SPOP0(EC,FIRST): Population (Millions) SPC(EC,YEAR): Total Production Capacity (M$/YR) SPC0(EC,FIRST): Total Production Capacity (M$/YR)
The Process Retrofit Market Share Investment Decision can also be exogenously determined: RPMSF=XRPMSF
Reduction in Process Energy Requirements
The reduction in process energy requirements due to retrofits is calculated as the change in efficiencies (1/PEEA-1/RPEE) multiplied by the production capacity retrofitted (RPMSF*FXPC):
PERRR=RPMSF*FXPC*(1/PEEA-1/RPEE)
where: PERRR(TECH,EC): Process Energy Retire. Process Retrofit((MBTU/YR)/YR) RPMSF(ENDUSE,TECH,EC,YEAR): Process Retrofit Market Share Fraction by Device PEEA(ENDUSE,TECH,EC,YEAR): Average Process Efficiency ($/BTU or $/J) RPEE(ENDUSE,TECH,EC,YEAR): Retrofit Process Efficiency ($/BTU or $/J) FXPC(TECH,EC): Fixed Production Capacity (M$/YR)
Process Requirement Reduction Due to Process Reduction
The additional energy savings (PERRR) is added to the process energy retirements (PERR): PERR=PERR+PERRR
The device energy retirements are increased as well by the process energy savings divided by the average device efficiency (PERRR/DEEA):
DERR=DERR+PERRR/DEEA
where: DERR(TECH,EC): Device Energy Retire. Retrofit ((MBTU/YR)/YR)' PERR(TECH,EC): Process Energy Requirement. Retire. ((MBTU/YR)/YR) PERRR(TECH,EC): Process Energy Retire. Process Retrofit((MBTU/YR)/YR) DEEA(ENDUSE,TECH,EC,YEAR): Average Device Efficiency (BTU/BTU OR J/J)
Capitalized Conservation Expense from Low Interest Loans
Capitalized conservation is calculated as the cost of the process capital minus the rebate multiplied by the fraction of the market that elected to retrofit, modified by the effect of the subsidized loans. It is the annualized cost of the DSM program.
TCONCAP=RPMSF*FXPC*(RPCC-RPCCU)*(1-RPCM) CONCAP(F)=CONCAP(F)+SUM(TE,EC)(TCONCAP(EU,TE,EC)*FTMAP(F,TE))
where: RPCM(EC): Retrofit Process Capital Charge Rate Multiplier (($/YR)/$)
Systematic Solutions, Inc. 35 Policy Assessment Corp.
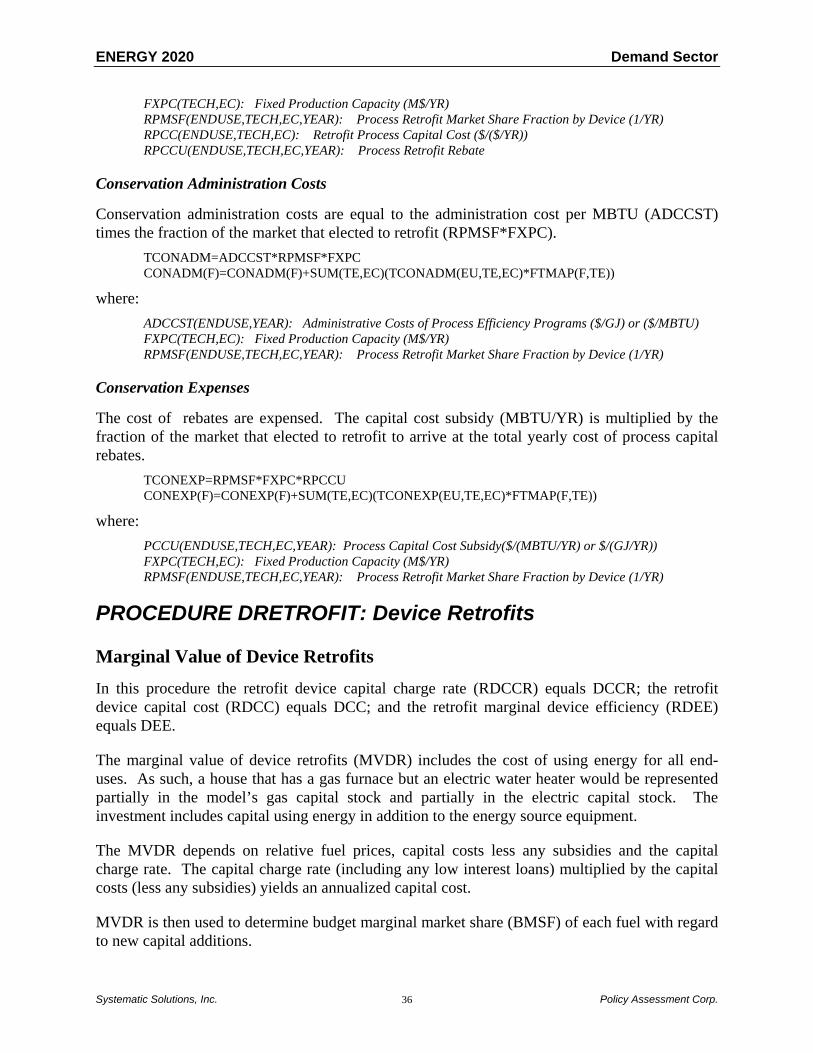
ENERGY 2020 Demand Sector
FXPC(TECH,EC): Fixed Production Capacity (M$/YR) RPMSF(ENDUSE,TECH,EC,YEAR): Process Retrofit Market Share Fraction by Device (1/YR) RPCC(ENDUSE,TECH,EC): Retrofit Process Capital Cost ($/($/YR)) RPCCU(ENDUSE,TECH,EC,YEAR): Process Retrofit Rebate
Conservation Administration Costs
Conservation administration costs are equal to the administration cost per MBTU (ADCCST) times the fraction of the market that elected to retrofit (RPMSF*FXPC).
TCONADM=ADCCST*RPMSF*FXPC CONADM(F)=CONADM(F)+SUM(TE,EC)(TCONADM(EU,TE,EC)*FTMAP(F,TE))
where: ADCCST(ENDUSE,YEAR): Administrative Costs of Process Efficiency Programs ($/GJ) or ($/MBTU) FXPC(TECH,EC): Fixed Production Capacity (M$/YR) RPMSF(ENDUSE,TECH,EC,YEAR): Process Retrofit Market Share Fraction by Device (1/YR)
Conservation Expenses
The cost of rebates are expensed. The capital cost subsidy (MBTU/YR) is multiplied by the fraction of the market that elected to retrofit to arrive at the total yearly cost of process capital rebates.
TCONEXP=RPMSF*FXPC*RPCCU CONEXP(F)=CONEXP(F)+SUM(TE,EC)(TCONEXP(EU,TE,EC)*FTMAP(F,TE))
where: PCCU(ENDUSE,TECH,EC,YEAR): Process Capital Cost Subsidy($/(MBTU/YR) or $/(GJ/YR)) FXPC(TECH,EC): Fixed Production Capacity (M$/YR) RPMSF(ENDUSE,TECH,EC,YEAR): Process Retrofit Market Share Fraction by Device (1/YR)
PROCEDURE DRETROFIT: Device Retrofits
Marginal Value of Device Retrofits
In this procedure the retrofit device capital charge rate (RDCCR) equals DCCR; the retrofit device capital cost (RDCC) equals DCC; and the retrofit marginal device efficiency (RDEE) equals DEE.
The marginal value of device retrofits (MVDR) includes the cost of using energy for all end-uses. As such, a house that has a gas furnace but an electric water heater would be represented partially in the model’s gas capital stock and partially in the electric capital stock. The investment includes capital using energy in addition to the energy source equipment.
The MVDR depends on relative fuel prices, capital costs less any subsidies and the capital charge rate. The capital charge rate (including any low interest loans) multiplied by the capital costs (less any subsidies) yields an annualized capital cost.
MVDR is then used to determine budget marginal market share (BMSF) of each fuel with regard to new capital additions.
Systematic Solutions, Inc. 36 Policy Assessment Corp.

ENERGY 2020 Demand Sector
MVDR(TE,XTE,EC)=(ECFP(TE,EC)/DEEA(TE,EC)-ECFP(XTE,EC)/DEE(XTE,EC))/ INFLA/(DCCRU(TE,EC)*(DCCB(TE,EC)-DCCU(TE)-RDCCU(TE)))
where: MVDR(ENDUSE,TECH,EC,YEAR): Marginal Value of Device Retrofits ($/MBTU or $/GJ) RDCCU(ENDUSE,TECH,EC,YEAR): Retrofit Device Capital Cost Subsidy ($/(MBTU/YR) or $/(GJ/YR)) DCCB(ENDUSE,TECH,EC,YEAR): Device Capital Cost before Rebate ($/(MBTU/YR) or $/(GJ/YR)) DCCU(ENDUSE,TECH,EC,YEAR): Device Capital Cost Subsidy ($/(MBTU/YR) or $/(GJ/YR)) DCCRU(ENDUSE,TECH,EC,YEAR): Subsidized Device Capital Charge Rate (($/YR)/$) DEEA(ENDUSE,TECH,EC,YEAR): Average Device Efficiency (BTU/BTU or J/J) DEE(ENDUSE,TECH,EC,YEAR): Marginal Device Efficiency (BTU/BTU OR J/J) ECFP(TECH,EC,YEAR): Fuel Price ($/MBTU or $/GJ) INFLA(YEAR): Inflation Index ($/$)
Device Retrofit Market Shares
Retrofit Market Shares
In basic terms, market share (RDMSF) is determined by price [more specifically, the increase in the marginal value of device retrofits: (MVDR/MVDR0)] and a variance factor on perceived prices (RDVF). Other adjustments to market share come from non-price factors (RDMSM0) and income induced buying pattern changes (RDMSM1, modified by population and capital output variables).
Market Share Determination
The first step is to determine each fuel market allocation weight (CMAW) for each EC: CMAW=EXP(RDMSM0+RDVF*LN(MVDR/MVDR0)+RDMSMI*(STCO/SPOP)/(STCO0/SPOP0))
The total market allocation weight is the sum of the individual fuel market allocation weights: CTMAW(XTE,EC)=SUM(TE)(CMAW(TE,XTE,EC))
The marginal device retrofit market share fraction for each fuel for each EC is the ratio of the MAW of the particular fuel to the total:
RDMSF=CMAW/CTMAW
where: RDMSF(ENDUSE,TECH,CTECH,EC,YEAR): Device Retrofit Market Share Fraction by Device (1/YR) CMAW(TECH,CTECH,EC): Conversion Allocation. Weight ($/$) CTMAW(CTECH,EC): Conversion Allocation. Weight ($/$) RDMSM0(ENDUSE,TECH,EC,YEAR): Retrofit Device Non-price Factors ($/$) RDMSMI(ENDUSE,TECH,EC): Retrofit Device Market Share Multiplier from Income ($/$) MVDR(ENDUSE,TECH,EC,YEAR): Marginal Value of Device Retrofit ($/MBTU or $/GJ) MVDR0(ENDUSE,TECH,EC,FIRST): Marginal Value of Device Retrofit ($/MBTU or $/GJ) RDVF(ENDUSE,TECH,EC): Retrofit Device Market Share Variance Factor ($/$) SPOP(EC,YEAR): Population (Millions) SPOP0(EC,FIRST): Population (Millions)
Systematic Solutions, Inc. 37 Policy Assessment Corp.

ENERGY 2020 Demand Sector
SPC(EC,YEAR): Total Production Capacity (M$/YR) SPC0(EC,FIRST): Total Production Capacity (M$/YR)
The marginal value of retrofits is the sum over technologies of the marginal value of device retrofits times the retrofit device market share:
MVR(TE,EC)=SUM(XTE)(MVDR(TE,XTE,EC)*RDMSF(TE,XTE,EC))
where: MVR(ENDUSE,TECH,CTECH,EC,YEAR): Marginal Value Retrofits ($/$) RDMSF(ENDUSE,TECH,CTECH,EC,YEAR): Device Retrofit Market share Fraction by Device (1/YR) MVDR(ENDUSE,TECH,EC,YEAR): Marginal Value of Device Retrofit ($/MBTU or $/GJ)
Retrofit Market Share
The first step is to determine each fuel market allocation weight (MAW) for each EC:
MAW=EXP(RMSM0+RVF*LN(MVR/MVR0)+RMSMI*(STCO/SPOP)/(STCO0/SPOP0))
The marginal retrofit market share fraction for each fuel for each EC is the ratio of the MAW of the particular fuel to sum of the MAW and the marginal value of alternative utility:
RMSF=MAW/(MAW+MVAU)
where: RMSF(ENDUSE,TECH,CTECH,EC,YEAR): Retrofit Market Share Fraction by Device (1/YR) MAW(TECH,CTECH,EC): Conversion Allocation. Weight ($/$) MVAU: Marginal Value of Alternative Utility ($/$) RMSM0(ENDUSE,TECH,EC,YEAR): Retrofit Non-price Factors ($/$) RMSMI(ENDUSE,TECH,EC): Retrofit Market Share Multiplier from Income ($/$) MVR(ENDUSE,TECH,EC,YEAR): Marginal Value of Retrofit ($/MBTU or $/GJ) MVR0(ENDUSE,TECH,EC,FIRST): Marginal Value of Retrofit ($/MBTU or $/GJ) RVF(ENDUSE,TECH,EC): Retrofit Market Share Variance Factor ($/$) SPOP(EC,YEAR): Population (Millions) SPOP0(EC,FIRST): Population (Millions) SPC(EC,YEAR): Total Production Capacity (M$/YR) SPC0(EC,FIRST): Total Production Capacity (M$/YR)
The Retrofit Market Share Investment Decision can also be exogenously determined: RMSF=XRMSF
Reduction in Device Energy Requirements DERRR(XTE,EC)=RMSF(XTE,EC)*SUM(TE)(RDMSF(TE,XTE,EC)*(PER(XTE,EC)-
PERRP(XTE,EC))/DEEA(XTE,EC)) DERRA(TE,EC)=SUM(XTE)(RMSF(XTE,EC)*RDMSF(TE,XTE,EC)*(PER(XTE,EC)-
PERRP(XTE,EC))/DEE(TE,EC))
where: DERRA(TECH,EC): Device Energy Retire. Retrofit ((MBTU/YR)/YR) DERRR(TECH,EC): Device Energy Retire. Retrofit ((MBTU/YR)/YR) PERRP(TECH,EC): Process Energy Requirement. Process Retire. ((MBTU/YR)/YR) PER(ENDUSE,TECH,EC,YEAR): Process Energy Requirement (MBTU/YR) DEE(ENDUSE,TECH,EC,YEAR): Device Efficiency (BTU/BTU OR J/J) RMSF(ENDUSE,TECH,EC,YEAR): Retrofit Market Share Fraction by Device (1/YR)
Systematic Solutions, Inc. 38 Policy Assessment Corp.

ENERGY 2020 Demand Sector
RDMSF(ENDUSE,TECH,CTECH,EC,YEAR): Device Retrofit Market Share Fraction by Device (1/YR) DEEA(ENDUSE,TECH,EC,YEAR): Average Device Efficiency (BTU/BTU OR J/J)
Device Requirement Reduction Due to Process Reduction DERR=DERR+DERRR PERR=PERR+DERRR*DEEA
where: DERR(TECH,EC): Device Energy Retire. Retrofit ((MBTU/YR)/YR)' PERR(TECH,EC): Process Energy Requirement. Retire. ((MBTU/YR)/YR) DERRR(TECH,EC): Device Energy Retire. Process Retrofit((MBTU/YR)/YR) DEEA(ENDUSE,TECH,EC,YEAR): Average Device Efficiency (BTU/BTU OR J/J)
Device Requirement Additions Due to Retrofit DERA=DERA+DERRA PERA=PERA+DERRA*DEE
where: DEE(ENDUSE,TECH,EC,YEAR): Device Efficiency (BTU/BTU OR J/J) DERA(ENDUSE,TECH,EC,YEAR): Device Energy Requirement Addition (MBTU/YR OR GJ/YR) PERA(ENDUSE,TECH,EC,YEAR): Process Energy Requirements Additions ((MBTU/YR)/YR) DERRA(TECH,EC): Device Energy Retire. Retrofit ((MBTU/YR)/YR)
Capitalized Conservation Expense from Low Interest Loans TCONCAP(EU,TE,EC)=RMSF(TE,EC)*SUM(XTE,EC)(RDMSF(TE,XTE,EC)* PER(XTE,EC)-
PERRP(XTE,EC)))*(DCC(TE,EC)-RDCCU(TE))*(1-DCCM(TE))/1E6 CONCAP(F)=CONCAP(F)+SUM(TE,EC)(TCONCAP(EU,TE,EC)*FTMAP(F,TE))
where: CONCAP(SECTOR,FUEL,YEAR): Capitalized Conservation Expenses (M$/YR) TCONCAP(ENDUSE,TECH,EC): Capitalized Conservation Expenses (M$/YR) DCCP(ENDUSE,TECH,EC,YEAR): Capital Cost of "Rebated" Device($/(MBTU/YR) or $/(GJ/YR)) DCCM(TECH): Device Capital Charge Rate Multiplier (($/YR)/$) DCCU(ENDUSE,TECH,EC,YEAR): Device Capital Cost Subsidy($/(MBTU/YR) or $/(GJ/YR)) DEE(ENDUSE,TECH,EC,YEAR): Device Efficiency (BTU/BTU OR J/J) DEER(ENDUSE,TECH,EC,YEAR): Policy Participation Response (BTU/BTU OR J/J) DERA(ENDUSE,TECH,EC,YEAR): Device Energy Requirement Addition (MBTU/YR OR GJ/YR) INFLA(YEAR): Inflation Index ($/$)
Conservation Administration Costs
Conservation administration costs are equal to the cost per MBTU times the participation rate, the device additions and device efficiency.
TCONADM=ADDCST*RDMSF*(PER-PERRP)/1E6 CONADM(F)=CONADM(F)+SUM(TE,EC)(TCONADM(EU,TE,EC)*FTMAP(F,TE))
where CONADM(SECTOR,FUEL,YEAR): Conservation Administration Costs (M$/YR) TCONADM(ENDUSE,TECH,EC): Conservation Administration Costs (M$/YR)
Systematic Solutions, Inc. 39 Policy Assessment Corp.

ENERGY 2020 Demand Sector
ADDCST(ENDUSE,YEAR): Administrative Costs of Device Efficiency Programs ($/GJ) or ($/MBTU) PER(ENDUSE,TECH,EC,YEAR): Process Energy Requirements (MBTU/YR)
Conservation Expenses
The cost of rebates are expensed. The capital cost subsidy (MBTU/YR) is multiplied by the fraction of the market that elected to retrofit to arrive at the total yearly cost of process capital rebates.
TCONEXP(EU,TE,EC)=SUM(XTE)(RDMSF(TE,XTE,EC)*(PER(XTE,EC)-PERRP(XTE,EC))*RDCCU(TE))/1E6
CONEXP(F)=CONEXP(F)+SUM(TE,EC)(TCONEXP(EU,TE,EC)*FTMAP(F,TE))
where: CONEXP(SECTOR,FUEL,YEAR): Conservation Expense (M$/YR) TCONEXP(ENDUSE,TECH,EC): Conservation Expense (M$/YR) RDCCU(ENDUSE,TECH,EC,YEAR): Device Capital Cost Subsidy ($/(MBTU/YR) or $/(GJ/YR)) PER(ENDUSE,TECH,EC,YEAR): Process Energy Requirements (MBTU/YR OR GJ/YR)
PROCEDURE TSTOCK: Total Stock Update The procedure updates the total productive capacity (EUPC), the process energy requirements (PER) and the device energy requirements (DER). All three variables are calculated in the same fashion - the difference between additions to and subtractions from existing capacity and energy requirements are added to the current respective levels.
EUPC=EUPC+DT*(EUPCA-EUPCR) PER=PER+DT*(PERA-PERR) DER=DER+DT*(DERA-DERR)
where: EUPC(ENDUSE,TECH,AGE,EC,YEAR): Production Capacity by End-use (M$/YR) EUPCA(ENDUSE,TECH,AGE,EC,YEAR): Production Capacity Additions ((M$/YR)/YR) EUPCR(ENDUSE,TECH,AGE,EC): Production Capacity Retirement ((M$/YR)/YR) DER(ENDUSE,TECH,EC,YEAR): Device Energy Requirement (MBTU/YR or GJ/YR) DERR(ENDUSE,TECH,EC,YEAR): Device Energy Requirement Retirements (MBTU/YR or GJ/YR) DERA(ENDUSE,TECH,EC,YEAR): Device Energy Requirement Addition (MBTU/YR or GJ/YR)
PROCEDURE UTILIZE: Short-term "utilization" DSM The short term utilization multiplier (BM) is calculated in this procedure. This multiplier captures income-motivated short term energy behavior changes (such as biking to work). These adjustments tend to be short-lived as the consumer’s budget returns to normal.
Average Process Cost
The first step is to calculate an average process cost (APCC) using the average process efficiency (PEEA) in the look-up table.
APCC=CTABCE(PEEA)*INFLA
Systematic Solutions, Inc. 40 Policy Assessment Corp.

ENERGY 2020 Demand Sector
where: APCC(TECH,EC): Average Process Capital Cost ($/($/YR)) PEEA(ENDUSE,TECH,EC,YEAR): Average Process Efficiency ($/BTU or $/J) INFLA(YEAR): Inflation Index ($/$)
Budget Capital Charge Rate
The budget capital charge rate is the annualization of device capital expenses (over the housekeeping life of the device - DTL), accounting for taxes (TXRT), tax credits (DIVTC), and return of principal and on investment (including risk premiums and inflation: 1+ROIN+DRISK+INSM). (1-(1/(1+ROIN+DRISK))**BPL)/(1-TXRT) is the classical capital recovery term. The (1-TXRT) term at the end converts the after tax calculation into before tax dollars. Investment tax credits reduce the cost of the facility by the tax credit after the first year of operation using nominal dollars. Therefore the value of the tax credit is (DIVTC/(1+ROIN+DRISK+INSM). Depreciation is modeled as a current dollar phenomena which does not account for inflation. Therefore the net present value of the energy is calculated with the nominal rate of return: (2/BTL)/(ROIN+DRISK+INSM+2/BTL)). It shows up as an additional negative term in the capital cost modifiers of DCCR because depreciation is a benefit (negative cost).
Device capital costs (DCC) are multiplied by the BCCR to get the annualized cost of the device used in computing market share calculations.
The formula for calculating the budget capital charge rate: BCCR=(1-DIVTC/(1+ROIN+DRISK+INSM)-
TXRT*(2/BTL)/(ROIN+DRISK+INSM+2/BTL))*(ROIN+DRISK)/(1-(1/(1+ROIN+DRISK))**BPL)/(1-TXRT)
Where: BCCR(TECH): Budget Capital Charge Rate (($/YR)/$) DIVTC(TECH,YEAR): Device Investment Tax Credit ($/$) DRISK(ENDUSE,TECH): Device Excess Risk Premium ($/$) INSM(YEAR): Smoothed Inflation Rate (($/YR)/$) ROIN(EC): Return on Investment (($/YR)/$) TXRT(EC,YEAR): Tax Rate on Energy Consumer ($/$) BPL(ENDUSE,TECH): Housekeeping DSM Physical-Life (Years) BTL(ENDUSE,TECH): Housekeeping DSM Tax-Life (Years)
Marginal value of device usage
Each specific demand for energy is associated with a stock of capital. Investment in each type of capital stock by fuel type is allocated according to the cost of using each type of fuel. This cost is the perceived cost to the user and includes a risk factor (incorporated in the calculation of BCCR), annualized capital costs (BCCR*BDCCU)/(APCC*PEEA)), and delivered marginal fuel costs (ECFP/DEEA).
The marginal value of device usage (MVDU) includes the cost of using energy for all end-uses. As such, a house that has a gas furnace but an electric water heater would be represented
Systematic Solutions, Inc. 41 Policy Assessment Corp.
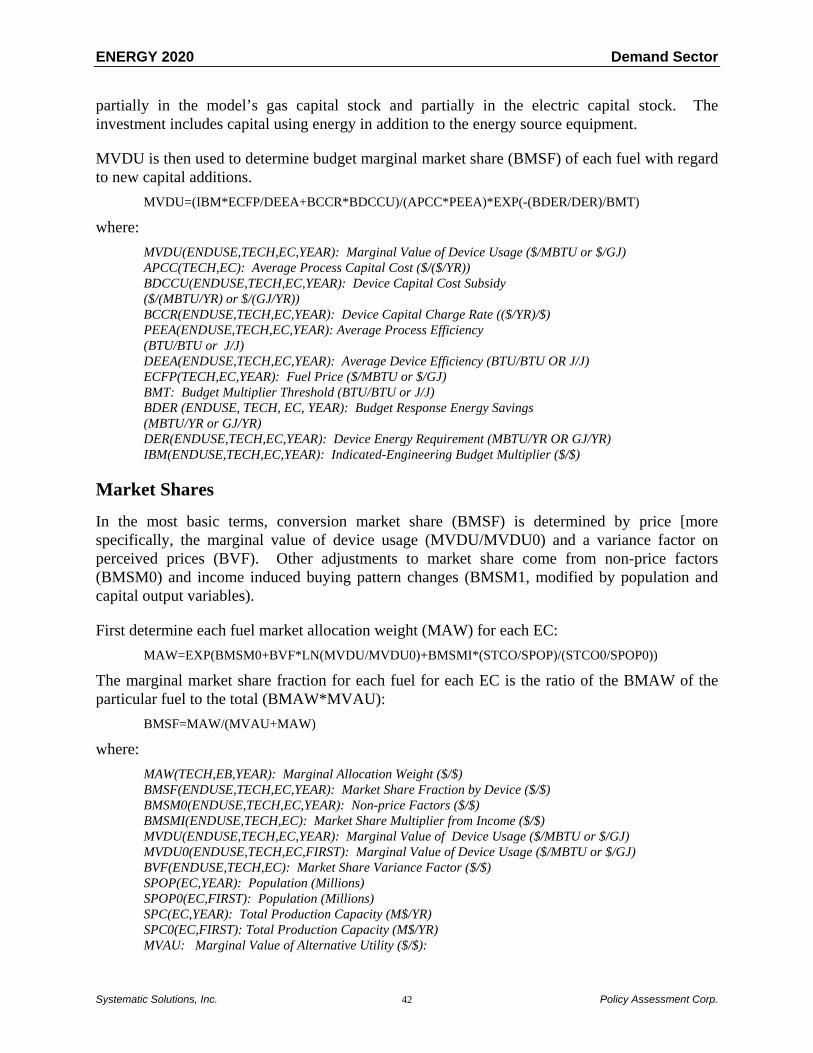
ENERGY 2020 Demand Sector
partially in the model’s gas capital stock and partially in the electric capital stock. The investment includes capital using energy in addition to the energy source equipment.
MVDU is then used to determine budget marginal market share (BMSF) of each fuel with regard to new capital additions.
MVDU=(IBM*ECFP/DEEA+BCCR*BDCCU)/(APCC*PEEA)*EXP(-(BDER/DER)/BMT)
where: MVDU(ENDUSE,TECH,EC,YEAR): Marginal Value of Device Usage ($/MBTU or $/GJ) APCC(TECH,EC): Average Process Capital Cost ($/($/YR)) BDCCU(ENDUSE,TECH,EC,YEAR): Device Capital Cost Subsidy ($/(MBTU/YR) or $/(GJ/YR)) BCCR(ENDUSE,TECH,EC,YEAR): Device Capital Charge Rate (($/YR)/$) PEEA(ENDUSE,TECH,EC,YEAR): Average Process Efficiency (BTU/BTU or J/J) DEEA(ENDUSE,TECH,EC,YEAR): Average Device Efficiency (BTU/BTU OR J/J) ECFP(TECH,EC,YEAR): Fuel Price ($/MBTU or $/GJ) BMT: Budget Multiplier Threshold (BTU/BTU or J/J) BDER (ENDUSE, TECH, EC, YEAR): Budget Response Energy Savings (MBTU/YR or GJ/YR) DER(ENDUSE,TECH,EC,YEAR): Device Energy Requirement (MBTU/YR OR GJ/YR) IBM(ENDUSE,TECH,EC,YEAR): Indicated-Engineering Budget Multiplier ($/$)
Market Shares
In the most basic terms, conversion market share (BMSF) is determined by price [more specifically, the marginal value of device usage (MVDU/MVDU0) and a variance factor on perceived prices (BVF). Other adjustments to market share come from non-price factors (BMSM0) and income induced buying pattern changes (BMSM1, modified by population and capital output variables).
First determine each fuel market allocation weight (MAW) for each EC: MAW=EXP(BMSM0+BVF*LN(MVDU/MVDU0)+BMSMI*(STCO/SPOP)/(STCO0/SPOP0))
The marginal market share fraction for each fuel for each EC is the ratio of the BMAW of the particular fuel to the total (BMAW*MVAU):
BMSF=MAW/(MVAU+MAW)
where: MAW(TECH,EB,YEAR): Marginal Allocation Weight ($/$) BMSF(ENDUSE,TECH,EC,YEAR): Market Share Fraction by Device ($/$) BMSM0(ENDUSE,TECH,EC,YEAR): Non-price Factors ($/$) BMSMI(ENDUSE,TECH,EC): Market Share Multiplier from Income ($/$) MVDU(ENDUSE,TECH,EC,YEAR): Marginal Value of Device Usage ($/MBTU or $/GJ) MVDU0(ENDUSE,TECH,EC,FIRST): Marginal Value of Device Usage ($/MBTU or $/GJ) BVF(ENDUSE,TECH,EC): Market Share Variance Factor ($/$) SPOP(EC,YEAR): Population (Millions) SPOP0(EC,FIRST): Population (Millions) SPC(EC,YEAR): Total Production Capacity (M$/YR) SPC0(EC,FIRST): Total Production Capacity (M$/YR) MVAU: Marginal Value of Alternative Utility ($/$):
Systematic Solutions, Inc. 42 Policy Assessment Corp.

ENERGY 2020 Demand Sector
Modifying Device Replacement, New Capital Additions, and New Process Replacement to Account for the Budget Constraint
The new, fuel-specific budget device energy requirement additions (BDERA) represent the need for new devices adjusted for the short term constraint on purchases because of a limited budget (BDER) allocated by fuel through the budget market share fraction.
Budget energy savings additions BDERA=(DER-BDER)*BMSF
where: BDERA(ENDUSE,TECH,EC,YEAR): Budget Response Additions (MBTU/YR OR GJ/YR) BDER (ENDUSE, TECH, EC, YEAR): Budget Response Energy Savings(MBTU/YR or GJ/YR) BMSF (ENDUSE, TECH, EC,YEAR): Budget Market Share Fraction by Device ($/$) DER(ENDUSE,TECH,EC,YEAR): Device Energy Requirement (MBTU/YR OR GJ/YR)
Budget Response Retirements
Budget Response Retirements are calculated by dividing the energy savings by the housekeeping DSM physical life.
BDERR=BDER/BPL
where: BDERR(TECH,EC): Budget Response Retire. ((MBTU/YR)/YR) BDER (ENDUSE, TECH, EC, YEAR): Budget Response Energy Savings (MBTU/YR or GJ/YR) BPL (ENDUSE, TECH): Housekeeping DSM Physical-Life (Years)
Budget Energy Savings
The total amount of energy savings as a result of consumer response to a budget constraint is equal to any existing level plus the net of additions to and subtractions from the savings.
BDER=BDER+DT*(BDERA-BDERR)
where: BDER (ENDUSE, TECH, EC, YEAR): Budget Response Energy Savings (MBTU/YR or GJ/YR) BDERA(TECH,EC): Budget Response Addition (MBTU/YR) BDERR(TECH,EC): Budget Response Retire. ((MBTU/YR)/YR)
Budget Multiplier
The budget multiplier, then, can be calculated endogenously as one minus the ratio of energy savings to total device requirements modified by an exogenous multiplier (BMM) to capture any non-price effects.
BM=(1-BDER/DER)*BMM
where: BM (ENDUSE, TECH, EC,YEAR): Budget Multiplier ($/$)
Systematic Solutions, Inc. 43 Policy Assessment Corp.

ENERGY 2020 Demand Sector
BDER (ENDUSE, TECH, EC, YEAR): Budget Response Energy Savings(MBTU/YR or GJ/YR) DER(ENDUSE,TECH,EC,YEAR): Device Energy Requirement (MBTU/YR OR GJ/YR) BMM(ENDUSE,TECH,EC): Budget Exogenous Multiplier Adjustment (BTU/BTU, or J/J)
The budget multiplier can also be input exogenously: BM=BMM
Conservation Expenses
The cost of rebates are expensed. The capital cost subsidy (MBTU/YR) is multiplied by the device additions to arrive at the total yearly cost of process capital rebates.
CONEXP=CONEXP+BDERA*BDCCU/1E6
where: CONEXP(SECTOR,FUEL,YEAR): Conservation Costs Expensed (M$/YR) ADDCST(ENDUSE,YEAR): Administrative Costs of Device Efficiency Programs ($/GJ) or ($/MBTU) BDERA(ENDUSE,TECH,EC,YEAR): Device Energy Requirement Addition (MBTU/YR OR GJ/YR) BDCCU(ENDUSE,TECH,EC,YEAR): Device Capital Cost Subsidy($/(MBTU/YR) or $/(GJ/YR))
Conservation Administration Costs
Conservation administration costs are equal to the administrative cost per MBTU times the device additions.
CONADM=CONADM+ADDCST*BDERA/1E6
where: CONADM(SECTOR,FUEL,YEAR): Conservation Administration Costs (M$/YR) ADDCST(ENDUSE,YEAR): Administrative Costs of Device Efficiency Programs ($/GJ) or ($/MBTU) BDERA(ENDUSE,TECH,EC,YEAR): Device Energy Requirement Addition (MBTU/YR OR GJ/YR)
PROCEDURE EUDEMAND: End-Use Demand Dynamics This procedure calculates the new and average consumer energy budgets, average and marginal process efficiencies and end use demand. The new and average consumer budgets are used to formulate a budget induced usage multiplier for the end-use demand equation. The average and marginal process efficiencies are calculated for use in the new budget equation as well as for many other equations in the model. End use demand is used in the total demand procedure.
Budget Response
The budget constraint or response is the fuel-specific capacity utilization representing the short-term response of an energy user to rising energy prices. This response takes the form of a budget constraint which limits how much a user can afford to pay for energy in the short-term and what temporary energy saving actions the user can take (for example, turning down the thermostat, closing off rooms, biking to work).
At any point in time a change in the cost of using energy must at first be kept within the budget. Thus, if energy costs rise 10%, the first consumer response is to cut back 10%. Efficiency
Systematic Solutions, Inc. 44 Policy Assessment Corp.

ENERGY 2020 Demand Sector
changes, however, alter the amount of energy required and thus reduce the energy bill. Therefore the budget response is always less than the indicated response. After the economy and the household adjusts to the new prices, or at least the perception of them, energy use increases until the current budget matches the remembered history of the budget (called the average budget (AB)).
The current energy bill (NB - new budget) is a function of energy prices and average efficiencies. In the short run, efficiencies are constant, so a rise in energy prices causes an increase in the current energy bill, given no behavioral or capital changes.
NB=ECFP/INFLA*DST/(PEEA*DEEA)
where: INFLA(YEAR): Inflation Index ($/$)
The “average budget” is the remembered energy bill, or in system dynamics terms, the “smoothed” energy bill. It changes from year by an increment determined by the difference between the new budget, the old average budget divided by the budget averaging time, that incrementally moves the average budget toward the new budget. For example, if the new budget is $100 more than the average budget, and the budget averaging time is equal to five years, then the average budget will increase by twenty dollars.
AB=AB+DT*(NB-AB)/BAT
where: AB(ENDUSE,TECH,EC,YEAR): Average Budget ($spent on energy/$total dollars), BAT: Short Term Utilization Adjustment Time (YR) NB(TECH,EC): New Budget ($/$)
The ratio of the current budget to the average budget, modified by a budget elasticity term (BE) creates a usage multiplier (UMS) which represents the budget response on normal demand. It also is modified by the budget multiplier derived in Procedure 14. UMS appears in the demand equation (DMD), below, representing a short term response to conservation of changing prices which exaggerates the long term response. It also causes a later recovery to “normal” conditions - the “take-back” effect where the customer returns to a more energy intensive operating style. . An example of this would be an air conditioning retrofit that does not provide the amount of expected energy savings because the consumer has turned down the thermostat to enjoy cooler rooms. ENERGY 2020 formulation captures both the up and downside dynamics.
UMS=(NB/AB)**BE*BM
where: UMS(ENDUSE,TECH,EC,YEAR): Utility Multiplier for Short Term Price Response (BTU/BTU or J/J) AB(ENDUSE,TECH,EC,YEAR): Average Budget ($spent on energy/$total dollars), NB(TECH,EC): New Budget ($/$) BE: Budget Elasticity Factor ($/$) BM (ENDUSE, TECH, EC,YEAR): Budget Multiplier ($/$)
Average Process And Device Efficiency
Average process efficiency is calculated by multiplying the end-use production capacity for each economic class by the class device saturation divided by the process energy requirement.
Systematic Solutions, Inc. 45 Policy Assessment Corp.

ENERGY 2020 Demand Sector
PEEA(TE,EC)=SUM(A)(EUPC(TE,A,EC))*DST(EC)/PER(TE,EC)
where: PEEA(ENDUSE,TECH,EC,YEAR): Average Process Efficiency ($/BTU or $/J) EUPC(ENDUSE,TECH,AGE,EC,YEAR): Production Capacity by End-use (M$/YR) DST(ENDUSE,EC,YEAR): Device Saturation (BTU/BTU or J/J) PER(ENDUSE,TECH,EC,YEAR): Process Energy Requirement (MBTU/YR)
The average device efficiency (DEEA) is simply the process energy requirements (PER) divided by the device energy requirements (DER):
DEEA=PER/DER
where: PER(ENDUSE,TECH,EC,YEAR): Process Energy Requirement (MBTU/YR) DER(ENDUSE,TECH,EC,YEAR): Device Energy Requirement (MBTU/YR or GJ/YR) DEEA(ENDUSE,TECH,EC,YEAR): Average Device Efficiency (BTU/BTU or J/J)
Endogenous End-use Demand
The final demand for energy can now be calculated. The device energy requirements (DER) are first multiplied by a short term budget constraint and by the utilization of capital stock (UMS and CUF). The budget constraint reflects the assumption that the short-term response to price fluctuations is primarily a cutback on consumption. The capital utilization considers that a factory may be equipped and ready but unless there is a demand for the product made in that factory, no energy will be needed. Another utilization factor (WCUF) represents utilization changes resulting from general economic disturbances.
Non-price impacts (CERSM) are included and capture such socioeconomic effects as reduced housing sizes, an increase in multifamily dwellings, and all-parent labor participation (leaving an empty house during the day).
Temperature sensitive load considerations are also included (DDM*TSLOAD). DMD=DER*UMS*CERSM*CUF*WCUF*(DDM*TSLOAD+(1-TSLOAD))/1E6
where: WCUF(EC) Capacity Utilization Factor Weighted by Output TSLOAD(ENDUSE,EC): Temperature Sensitive Fraction of Load (BTU/BTU or J/J) UMS(ENDUSE,TECH,EC,YEAR): Utility Multiplier for Short Term Price Response (BTU/BTU or J/J) DER(ENDUSE,TECH,EC,YEAR): Device Energy Requirement (MBTU/YR OR GJ/YR) DDM(ENDUSE,YEAR): Degree Day Multiplier (DD/DD Normal) CUF(ENDUSE,TECH,EC,YEAR): Capacity Utilization Factor (($/YR)/($/YR)) CERSM(ENDUSE,EC,YEAR): Life Style Multiplier (BTU/BTU or J/J)
Feedstock Demands
Feedstock demands are calculated as a function of total capacity output, divided by the feedstock process efficiency (FSPEE) and modified by a utilization factor.
FSDMD=STCO/FSPEE*WCUF
Systematic Solutions, Inc. 46 Policy Assessment Corp.

ENERGY 2020 Demand Sector
where: WCUF(EC): Capacity Utilization Factor Weighted by Output FSDMD(TECH,EC,YEAR): Feedstock Energy Demand (TBTU/YR OR GJ/YR) FSPEE(TECH,EC,YEAR): Feedstock Process Efficiency ($/MBTU or $/GJ) STCO(EC): Total Capital Output Capacity (M$/YR)
Exogenous Demands
Some demand for certain technologies or economic categories may be exogenously determined in a primarily endogenous routine. For selected technologies and/or EC’s:
DMD=XDMD FSDMD=XFSDMD
Exogenous End-use Demand
All demands may be exogenously specified: DMD=XDMD FSDMD=XFSDMD
PROCEDURE FUNGIBLE: Fungible Demands This procedure calculates the energy demand that can be served by at least two fuels (FSDMD).
Many industrial boilers can burn multiple fuels. Some oil boilers can burn gas or coal; some gas boilers can burn oil or coal. Usually there is some relatively small cost associated with converting to a new fuel - for example a new nozzle installation. The differences in operations and maintenance costs among fuels and conversion costs are assumed to be negligible in the market share calculation. The implementation of the market share by fuel does not occur immediately with fuel price changes because of perception delays and contractual requirements (FVF). Non-price (institutional and engineering) constraints (FMSM0) are estimated and included as are economic constraints as well (FMSMI*(STCO/SPOP/STCO0/POP0).
CMAW(TE,CF,EC)=EXP(FMSM0(TE,CF,EC)+FVF(TE,CF,EC) * LN((ECFP(CF,EC)/INFLA)/(ECFP0(CF,EC)/INFLA0)) + FMSMI(TE,CF,EC)*(STCO(EC)/SPOP(EC))/(STCO0(EC)/SPOP0(EC)))CTMAW2(TE,EC)=SU M(CF)(CMAW(TE,CF,EC))
FMSF=CMAW/CTMAW2
where: INFLA(YEAR): Inflation Index ($/$)
Exogenous Fungible Demands:
If known, the model accepts exogenous fungible market shares: FMSF=XFMSF
All demands are placed in FDMD. The non-fungible portion (FDMD(TE,TE,EC) is equal to the base demand (DMD) times one minus the maximum fungible (FMAX).
FDMD(TE,TE,EC)=DMD(EU,TE,EC)*(1-FMAX(TE,EC))
Systematic Solutions, Inc. 47 Policy Assessment Corp.

ENERGY 2020 Demand Sector
Fungible demand (FDMD (TE,CF,EC) equals the base demand (DMD) times the fraction of the fungible demand captured by each fuel (FMSF) constrained by the maximum fungible demand between any two fuels (FMAX). There are two types of fungible demands - fungible demands that switch between fuels and fungible demands that, for the moment, are satisfied by their own fuel. XFMSF captures those fungible demands that are satisfied with a different fuel; FMAX is the total fungible demand. The fraction of fungible demand that does not fuel switch is FMAX(1-FMSF).
FDMD(TE,CF,EC)=FDMD(TE,CF,EC) + FMSF(TE,CF,EC) * FMAX(TE,EC) * DMD(EU,TE,EC)
Final demand (DMD) equals the fungible demands for each fuel summed over all the "From" fuels.
DMD(EU,CF,EC)=SUM(TE)(FDMD(TE,CF,EC))
Fungible demands by sector (FDMDES) equals fungible demands (FDMD) summed over all fuels for fuels which are not the same and summed over all end-uses.
FDMDES(F)=FDMDES(F) + SUM(EC,CF,TE)(FDMD(TE,CF,EC) * FTMAP(F,TE) * (TE NE CF))
PROCEDURE COGENERATION Traditionally, the industrial sector met its electricity requirements entirely with purchases from a utility. Now the industrial sector, as well as other sectors, can meet some or all of their electricity needs by converting some of its waste heat into usable electric energy when economics warrant such an action. ENERGY 2020 considers cogeneration to be self-generation - generation for own use only. Customers who sell power are considered small power producers and are simulated in the supply sector. This procedure calculates the cogeneration potential (CGPOT) in the service area in question, the cogeneration capacity (CGCR) and cogeneration demand (CGDMD).
Renewable Resource Curves
Renewable Resources and Cost Curves CGDM=1+CGDMSW * ((CGRESI-CGGC)/CGRESI) CGDM=XMAX(CGDM,EPSILON) CGCC=CGCC*CGDM
where: CGDM(TECH,YEAR): Cogeneration Depletion Multiplier (DLESS) CGDMSW(TECH): Depletion Multiplier Switch for Selecting Technology CGCC(TECH,EC): Cogeneration Capital Cost ($/MBTU/YR or $/GJ/YR) CGRESI(TECH): Resource Base (MBTU or GJ)
Cogeneration Capital Charge Rate
The cogeneration capital charge rate is the annualization of cogeneration capital expenses (over the life of the cogeneration facility - CGTL), accounting for taxes (TXRT), tax credits (CGIVTC), and return of principal and on investment (including a cogeneration risk premium and inflation: 1+ROIN+CGRISK+INSM). (1-(1/(1+ROIN+CGRISK))**CGBL)/(1-TXRT) is
Systematic Solutions, Inc. 48 Policy Assessment Corp.

ENERGY 2020 Demand Sector
the classical capital recovery term. The (1-TXRT) term at the end converts the after tax calculation into before tax dollars. Investment tax credits reduce the cost of the facility by the tax credit after the first year of operation using nominal dollars. Therefore the value of the tax credit is (CGIVTC/(1+ROIN+CGRISK+INSM). Depreciation is modeled as a current dollar phenomena which does not account for inflation. Therefore the net present value of the energy is calculated with the nominal rate of return: (2/CGTL)/(ROIN+CGRISK+INSM+2/CGTL)). It shows up as an additional negative term in the capital cost modifiers of CGCCR because depreciation is a benefit (negative cost).
Cogeneration capital costs (CGCC) are multiplied by the CGCCR to get the annualized cost of the cogeneration used in computing market share calculations.
The formula for calculating the cogeneration capital charge rate: CGCCR=(1-CGIVTC/(1+ROIN+CGRISK+INSM)-TXRT *
(2/CGTL)/(ROIN+CGRISK+INSM+2/CGTL)) * (ROIN+CGRISK)/(1-(1/(1+ROIN+CGRISK))**CGBL)/(1-TXRT)
where: CGBL: Cogeneration Equipment Book Value Lifetime (YRS) CGIVTC(YEAR): Cogeneration Investment Tax Credit ($/$) CGRISK(TECH): Cogeneration Excess Risk (DLESS) CGTL: Cogeneration Tax Life (YR)
Marginal Cost of Cogeneration
The amount of investment in cogeneration and the amount of cogeneration produced depend on the competitiveness of cogenerated electricity with utility supplied electricity. Questions of competitiveness are resolved by the calculation of market shares.
The marginal cost of cogeneration is the fixed cost (CGCCR*CGCC/CGCUFP) plus the variable costs (CGVC). The fixed cost is the capital cost of cogeneration equipment (CGCC), multiplied by the cogeneration capital charge rate (CGCCR) to get the annualized capital cost. Variable costs (CGVC) are composed of cogeneration operating costs (CGOMC - calculated as a fraction (CGOCF) of capital costs (CGCC)) plus the cost of additional fuel, if any (CGVCSW - if this switch is on then an additional fuel cost is calculated), for the cogeneration equipment (fuel cost (ECFP) multiplied by the cogeneration heat rate (CGHRT)) and a delivery charge (CGDC) which electric utilities may still require because they must have the capacity to supply all industrial electricity needs even when no cogeneration occurs. A normal capacity utilization term (CGCUFP) is incorporated to reflect the wide variety in cogeneration capacity utilization across economic sectors.
CGVC=(CGCC*CGOF+CGDC)*INFLA+CGVCSW*(ECFP*CGHRT/EECONV) CGMCE=CGCCR*CGCC/CGCUFP*INFLA+CGVC
where: CGVC(TECH,EC,YEAR): Cogeneration Variable Costs ($/MBTU or $/GJ) CGVCSW(TECH): Cogeneration Variable Costs Switch for Selecting TECH CGCC(TECH,EC): Cogeneration Capital Cost ($/MBTU/YR or $/GJ/YR) CGDC(TECH): Cogeneration Delivery Charge ($/MBTU or $/GJ)
Systematic Solutions, Inc. 49 Policy Assessment Corp.

ENERGY 2020 Demand Sector
CGCUFP(TECH,EC,YEAR): Normal Cogeneration Capacity Utilization Factor BTU/BTU or J/J) CGHRT(TECH): Cogeneration Heat Rate (BTU/KWH or J/KWH) CGMCE(TECH,EC,YEAR): Cogeneration Marginal Cost of Energy ($/MBTU or $/GJ) INFLA(YEAR): Inflation Index ($/$)
Allocation Weight and Market Share
The marginal cost of cogeneration is then compared with the cost of purchased electricity (ECFP- electric) to produce the cogeneration market share. A marginal allocation weight (CGMAW) is calculated for all the cogeneration fuel possibilities. Non-price influences (CGMSM0) such as the additional work involved by the cogenerator, an economic factor (CGMSMI), and possible energy shortages (TENMSM) affect the allocation decision. The CGMAW is compared to the allocation weight associated with purchased electricity (CGEAW -CGVF is the variance factor for energy decisions) to obtain the market share (CGMSF).
CGMAW=EXP(CGMSM0-LN(CGMSMM)+CGMSMI*(STCO/STCO0) + CGVF * LN(CGMCE/CGMCE0)) * TENMSM
CGEAW(T,EC)=EXP(CGVF(T,EC)*LN(CGFP(EC)/CGFP0(EC))) CGMSF=CGMAW/(CGMAW+CGEAW)
where: CGMCE(TECH,EC,YEAR): Cogeneration Marginal Cost of Energy ($/MBTU or $/GJ) CGMCE0(TECH,EC,FIRST): Cogeneration Marginal Cost of Energy ($/MBTU or $/GJ) CGMSM0(TECH,EC,YEAR): Cogeneration Non-Price Factors ($/$) CGMSMI(TECH,EC): Cogeneration Market Share Multiplier ($/$) CGMSMM(TECH,EC,YEAR): Cogeneration Market Share Multiplier Policy ($/$) CGMSF(TECH,EC,YEAR): Fraction of PotentialCogeneration Development ($/$) CGFP(TECH,EC,YEAR): Electric Price ($/MBTU or $/GJ) CGFP0(TECH,EC,YEAR): Electric Price ($/MBTU or $/GJ) CGVF(TECH,EC): Cogeneration Variance Factor ($/$)
Exogenous Market Shares
Exogenous cogeneration market share fractions can also be used: CGMSF=XCGMSF
Cogeneration Capacity
Cogeneration Capacity Retirements
The cogeneration retiring each year is determined by the total cogeneration capacity (CGGC) divided by the lifetime of a cogeneration plant (CGPL)
CGR=CGGC/CGPL
where: CGGC(TECH,EC,YEAR): Cogeneration Generation Capacity (MW) CGPL(TECH,EC): Cogeneration Physical Lifetime (YRS) CGR(TECH,EC,YEAR): Cogeneration Capacity Retirements (MW/YR)
Cogeneration Capacity Additions
Systematic Solutions, Inc. 50 Policy Assessment Corp.

ENERGY 2020 Demand Sector
All energy used for heating is a candidate for cogeneration. This Cogeneration Potential (CGPOT) is the maximum cogeneration power that could be used given maximum market share conditions. To estimate the cogeneration potential, the sum the available heat (DER) must first be modified to reflect the fraction of energy which is of the quality or type for electricity production (CGMSF)
For simplicity, cogeneration additions (CGCR) are captured as a delayed response of consumers’ perceptions of cogeneration’s competitive advantages; actual investments are not calculated. The delay (CGAT) represents the time to approve and build a cogeneration facility. The market share declines with retirements (CGR) of cogeneration facilities (using a 20 year lifetime - CGPL) if the indicated market share is less than the actual share. Since it is not possible to have a negative construction rate, a XMAX function is added to keep CGCR zero or positive. The equations for cogeneration capacity construction (CGCR) are:
CGPOT(TE,EC)=SUM(EU)(DER1(EU,TE,EC))/CGHRT(TE)/8760*1000 CGIGC=CGPOT*CGMSF CGCR=(CGIGC-CGGC)/CGAT+CGR CGCR=XMAX(CGCR,0)
where: CGPOT(TECH,EC,YEAR): Cogeneration Potential (MW) CGMSF(TECH,EC,YEAR): Fraction of Potential Cogeneration Development ($/$) CGAT: Cogeneration Implementation Time (YRS) CGCR(TECH,EC,YEAR): Cogeneration Capacity Construction Rate (MW/YR) CGHRT(TECH): Cogeneration Heat Rate (BTU/KWH or J/KWH) CGIGC(TECH,EC): Cogeneration Indicated Generation Capacity (MW)
Cogeneration Capacity
Cogeneration Capacity each year is simply the current level of cogeneration capacity (CGGC) plus any additions (CGCR) and less any retirements (CGR).
CGGC=CGGC+DT*(CGCR-CGR)
where: CGGC(TECH,EC,YEAR): Cogeneration Generation Capacity (MW) CGR(TECH,EC,YEAR): Cogeneration Capacity Retirements (MW/YR) CGCR(TECH,EC,YEAR): Cogeneration Capacity Construction Rate (MW/YR)
Cogeneration Load and Energy
Cogeneration Utilization Factor
The utilization of cogeneration depends on the variable cost (CGVC) of operating the cogenerator versus the cost of electricity. Only the decision to build includes all the costs of cogeneration; once these costs are incurred they are “sunk” and do not figure in the decision to run the cogeneration unit. The variable cost of cogeneration can be considered to be less than the fuel costs because the cogeneration in integrally tied to the primary heat process. Shutting down the cogenerator may increase costs for the rest of the processes. Therefore, only a portion (CGSCM) of the variable cost (CGVC) is used for the shutdown decision. That portion of the
Systematic Solutions, Inc. 51 Policy Assessment Corp.

ENERGY 2020 Demand Sector
cogeneration variable cost must be less than electric price or the cogeneration facility will shut down.
CGRATIO=CGFP/(CGVC*CGSCM) CGRATIO=XMIN(1.0,CGRATIO) CGRATIO=FLOOR(CGRATIO)
The utilization multiplier also includes a delay (CGAT) reflecting the time an owner waits to determine whether a change in economic conditions is temporary or semi-permanent. The delay also captures the distribution of many cogenerators whose costs vary from the mean. Therefore, if the current utilization factor is 60% but the ratio of electric to cogenerator energy prices (CGRATIO) indicates the price differential makes it economic to cogenerate (e.g. equals 1.0), the utilization multiplier will increase not by 40% but by some fraction of that determined by the CGAT.
CGUMS=CGUMS+DT*(CGRATIO-CGUMS)/CGAT
where: CGSCM(TECH): Cogeneration Shared Cost Multiplier ($/$) CGUMS(TECH,EC,YEAR): Cogeneration Utilization Multiplier (BTU/BTU or J/J)
Cogeneration Demands
Electric Generation from Cogeneration
The actual cogeneration demand for energy (CGEG) is determined by the cogeneration capacity (CGGC) multiplied by the cogeneration utilization factor (CGUMS) and further weighted by three other utilization multipliers - CGCUFP, a normal capacity utilization term reflecting the wide variety in cogeneration capacity utilization across economic sectors; WCUF, a utilization factor reflecting the variability in cogeneration caused by changes in economic output; and CGCUF, representing other customer-specific economic variables that weigh in the decision making process.
CGEG=CGGC*CGUMS*CGCUFP*CGCUF*WCUF*8760/1E3
where: CGEG(EC,YEAR): Cogeneration Electricity Generated (GHW/YR) CGEC(EC,YEAR): Cogeneration by Economic Category (GWH/YR) CGCUF(TECH,EC,YEAR): Cogeneration Capacity Utilization Factor (($/YR)/($/YR)) CGCUFP(TECH,EC,YEAR): Normal Cogeneration Capacity Utilization Factor (BTU/BTU or J/J) CGUMS(TECH,EC,YEAR): Cogeneration Utilization Multiplier (BTU/BTU or J/J)
Fuel Demands from Cogeneration
Fuel demands are converted from cogeneration electricity generated (CGEG) by multiplying by the heat rate (CGHRT):
CGDMD=CGEG*CGHRT/1E6
where: CGDMD(TECH,EC,YEAR): Cogeneration Energy Demand (TBTU/YR or GJ/YR) CGHRT(TECH): Cogeneration Heat Rate (BTU/KWH or J/KWH)
Systematic Solutions, Inc. 52 Policy Assessment Corp.

ENERGY 2020 Demand Sector
Hydro Cogeneration
Low-head industrial hydropower is exogenously specified as “electric” cogeneration. Technically, this amount of generation is not cogeneration (not related to primary heat) but self-generation. Other self-generators or small power producers are modeled separately.
CGDMD=XCGDMD CGEG=CGDMD/CGHRT*1E6
where: CGHRT(TECH): Cogeneration Heat Rate (BTU/KWH or J/KWH)
Exogenous Cogeneration
If the numbers are known, cogeneration can also be exogenously determined: CGDMD=XCGDMD CGEG=CGDMD/CGHRT/8760*1000*1E6
Cogeneration Totals
Summing over technology yields cogeneration (GWH) by economic class: CGEC(EC)=SUM(TE)(CGEG(TE,EC))
Cogeneration Demands
Summing over technology and economic class yields total cogeneration demand (TBTU) by fuel:
CGDES(F)=SUM(TE,EC)(CGDMD(TE,EC)*FTMAP(F,TE))
PROCEDURE TOTDEMAND: Total Demand In this procedure total demand by class (ECD) and sector (DMDES) are calculated as well as total energy costs (ECOSTS) and energy costs per dollar of output (ECOST). A dollar value of energy service (SEB - including capital) is also calculated.
Total Demand
Total demand by fuel and economic class is the sum over end-uses of all demand - including cogeneration and feedstock. An adjustment is made to cogeneration demand to avoid double counting.
ECD(TE,EC)=SUM(EU)(DMD(EU,TE,EC)) + (CGDMD(TE,EC) * CGLOAD(TE) + (1-CGLOAD(TE)) * (-SUM(TECH)(CGDMD(TECH,EC)/CGHRT(TECH)) * EECONV)) +FSDMD(TE,EC)
where: CGLOAD(TECH): Cogeneration Demand Load to ECD
Systematic Solutions, Inc. 53 Policy Assessment Corp.

ENERGY 2020 Demand Sector
Energy Demands by Energy Sector
Summing ECD over economic class and technologies yields demand by Energy Sector (DMDES) - Coal, Oil, Natural Gas, Electricity, etc.
DMDES(F)=SUM(TE,EC)(ECD(TE,EC)*FTMAP(F,TE))
Solar technology needs an adjustment: DMDES(SOLAR)=DMDES(SOLAR) + SUM(EU,EC)(DMD(EU,SOLAR,EC) * (DEEA(SOLAR,EC)-
1.0))
Energy Cost per Dollar of Output
The energy cost per dollar of output is the local fuel price (ECFP) multiplied by the total level of energy demand (ECD) divided by total output (as measured in dollars - STCO). It can be used as a measure of efficiency.
ECOST=SUM(TE,EC)(ECFP(TE,EC)*ECD(TE,EC))/SUM(ECC)(STCO(ECC))
Energy Costs (M$/YR)
Total energy costs by sector is determined by summing the product of local fuel prices (ECFP) and energy demand (ECD) over technologies and economic categories. The FTMAP maps technologies into the energy sectors.
ECOSTS(F)=SUM(TE,EC)(ECFP(TE,EC)*ECD(TE,EC)*FTMAP(F,TE))
Society Service Energy Bill ($/YR)
The energy bill is calculated as the process energy requirements multiplied by the marginal cost of using fuel (which contains both a capital component and operating costs - see Procedure 2)
SEB=SUM(CEU,TE,EC)(PER1(CEU,TE,EC)*MCFU1(CEU,TE))
PROCEDURE POLLUTION: End-use Pollution In this accounting procedure, the emissions of CO2, CO, volatile organics, NOX, SOX, and particulates from the burning of fuels at the consumer end-use and energy-supply technology level are calculated. A constant emission coefficient for each end-use and technology for each economic sector and fuel is used. These coefficients vary with pollution control programs by do not capture emission changes caused by operating condition changes, such as highway speed variations or the partial loading of power plants. The coefficients are based on a “typical-use” specification. The emission calculations are most useful for comparing the relative change in emissions between alternate scenarios.
Systematic Solutions, Inc. 54 Policy Assessment Corp.
ENERGY 2020 Demand Sector
Average Pollution
Pollution from New Devices
Pollution from new devices (POEMA) is simply the sum across end-uses of the product of the device energy requirement (DER in MBTUs) and either the pollution standard for that device (POCS) if one is operating, or the usual level of pollution associated with operating each device (POCX).
POEMA(TE,EC,POLL)=SUM(EU)(XMIN(POCX(TE,EC,POLL),POCS(TE,EC,POLL))*DERA1(EU,TE, EC))/1E6
where: POEMA(TE,EC,POL,YEAR): Pollution from New Devices(TONS/TBTU or TONNES/PJ) POCS(TECH,EC, POLL,YEAR): Pollution Standards(TONS/TBTU or TONNES/PJ) POCX(TECH,EC, POLL,YEAR): Marginal Pollution Coefficients (TONS/TBTU or TONNES/PJ) DERA1(ENDUSE,TECH,EC,YEAR): Device Energy Requirement Addition(MBTU/YR or GJ/YR)
Pollution from Retired Devices
Pollution from retired devices (POEMR) is calculated in a similar fashion - as the sum across end-uses of the product of the energy associated with retired devices (DERR) and the average pollution level (POCA).
POEMR(TE,EC,POLL)=SUM(EU)(DERR(EU,TE,EC))*POCA(TE,EC,POLL)/1E6
where: POEMR(TE,EC,POLL): Pollution from Retired Devices(TONS/TBTU or TONNES/PJ) POCA(TE,EC,POLL): Average Pollution(TONS/TBTU or TONNES/PJ) DERR(ENDUSE,TECH,EC,YEAR): Device Energy Requirement Retirements (MBTU/YR or GJ/YR)
Embedded Pollution
Embedded pollution is calculated as the existing pollution level plus any addition from new devices and reduced by pollution eliminated by retired devices.
POEM=POEM+DT*(POEMA-POEMR)
where: POEM(TECH,EC POLL,YEAR): Embodied Pollution(TONS/TBTU or TONNES/PJ) POEMR(TE,EC,POLL): Pollution from Retired Devices(TONS/TBTU or TONNES/PJ) POEMA(TE,EC,POL,YEAR): Pollution from New Devices(TONS/TBTU or TONNES/PJ)
Average Pollution
Average pollution is calculated as the embodied pollution divided by the device energy requirement.
POCA(TE,EC,POLL)=POEM(TE,EC,POLL)/SUM(EU)(DER1(EU,TE,EC))*1E6
where:
Systematic Solutions, Inc. 55 Policy Assessment Corp.

ENERGY 2020 Demand Sector
POCA(TE,EC,POLL): Average Pollution(TONS/TBTU or TONNES/PJ) POEM(TECH,EC POLL,YEAR): Embodied Pollution(TONS/TBTU or TONNES/PJ) DER1(ENDUSE,TECH,EC,YEAR): Device Energy Requirement (MBTU/YR or GJ/YR)
Cogeneration Pollution
Pollution from New Cogeneration
Pollution from new cogeneration (CGPOEA) is the product of new cogeneration capacity (in MW, multiplied by the heat rate and modified by a utilization factor) and either the pollution standard for that device (CGPOCS) if one is operating, or the usual level of pollution associated with operating each device (CGPOCX).
CGPOEA=XMIN(CGPOCX,CGPOCS)*CGCR*CGHRT*CGCUFP*8760/1E9
where: CGPOEA(TECH,EC,POLL,YEAR): Pollution from New Cogeneration (TONS/TBTU or TONS/PJ) CGPOCS(TECH,EC,POLL,YEAR): Cogeneration Pollution Standards (TONS/TBTU or TONS/PJ) CGPOCX(TECH,EC,POLL,YEAR): Cogeneration Pollution Coefficient (TONS/TBTU or TONS/PJ) CGCR(TECH,EC,YEAR): Cogeneration Capacity Construction Rate (MW/YR) CGCUFP(TECH,EC,YEAR): Normal Cogeneration Capacity Utilization Factor (BTU/BTU or J/J) CGHRT(TECH): Cogeneration Heat Rate (BTU/KWH or J/KWH)
Pollution from Retired Cogeneration
Pollution from retired cogeneration (CGPOEA) is the product of the amount of retired cogeneration capacity (in MW, multiplied by the heat rate and modified by a utilization factor) and the average cogeneration pollution rate (CGPOCA).
CGPOER=CGR*CGHRT*CGCUFP*8760/1E9*CGPOCA
where: CGPOER(TECH,EC,POLL): Pollution from Retired Cogeneration (TONS/TBTU or TONNES/PJ) CGCR(TECH,EC,YEAR): Cogeneration Capacity Construction Rate (MW/YR) CGCUFP(TECH,EC,YEAR): Normal Cogeneration Capacity Utilization Factor (BTU/BTU or J/J) CGHRT(TECH): Cogeneration Heat Rate (BTU/KWH or J/KWH) CGPOCA(TE,EC,POLL): Cogeneration Average Pollution(TONS/TBTU or TONNES/PJ)
Embodied Cogeneration Pollution
Embodied cogeneration pollution is calculated as the existing cogeneration pollution plus any additions from new cogeneration and minus any reductions by pollution eliminated by retired cogeneration.
CGPOE=CGPOE+DT*(CGPOEA-CGPOER)
where: CGPOE(TECH,EC,POLL,YEAR): Cogeneration Embodied Pollution CGPOER(TECH,EC,POLL): Pollution from Retired Cogeneration (TONS/TBTU or TONNES/PJ) CGPOEA(TECH,EC,POLL,YEAR): Pollution from New Cogeneration (TONS/TBTU or TONS/PJ)
Systematic Solutions, Inc. 56 Policy Assessment Corp.

ENERGY 2020 Demand Sector
Average Cogeneration Pollution
Average cogeneration pollution is calculated as the embodied pollution divided by the cogeneration capacity (modified by the heat rate to convert to BTUs and a utilization factor).
CGPOCA=CGPOE/(CGGC*CGHRT*CGCUFP*8760/1E9)
where: CGPOCA(TECH,EC,POLL,YEAR): Cogeneration Average Pollution Coefficient (TONS/TBTU or TONS/PJ) CGPOE(TECH,EC,POLL,YEAR): Cogeneration Embodied Pollution CGGC(TECH,EC,YEAR): Cogeneration Generating Capacity (MW) CGCUFP(TECH,EC,YEAR): Normal Cogeneration Capacity Utilization Factor (BTU/BTU or J/J) CGHRT(TECH): Cogeneration Heat Rate (BTU/KWH or J/KWH)
Total Cogeneration Pollution by Technology and Pollutant CGPOL(TE,P)=SUM(EC)(CGDMD(TE,EC)*CGPOCA(TE,EC,P))
where: CGPOL(TECH,POLL,YEAR): Cogeneration Pollution (TONS/YR) CGDMD(TECH,EC,YEAR): Cogeneration Energy Demand (TBTU/YR or GJ/YR) CGPOCA(TECH,EC,POLL,YEAR): Cogeneration Average Pollution Coefficient (TONS/TBTU or TONS/PJ)
Total Pollution
Total pollution by fuel and pollutant (TFPOL) is derived by multiplying demand (DMD in MBTUs) by the average pollution (POCA in TONS/MBTU), then adding to this figure the total cogeneration pollution already calculated (CGPOL) and summing across end-uses, technologies and economic classes. The FTMAP maps technologies into sectors.
TFPOL(F,P)=SUM(EU,TE,EC)((DMD(EU,TE,EC) * POCA(TE,EC,P) + CGPOL(TE,P)) * FTMAP(F,TE))
where: TFPOL(ES,FUEL,POLL,YEAR): Energy Sector Pollution (TONS/YR or TONNES/YR) CGPOL(TECH,POLL,YEAR): Cogeneration Pollution (TONS/YR) POCA(TE,EC,POLL): Average Pollution(TONS/TBTU or TONNES/PJ) DMD(ENDUSE,TECH,EC,YEAR): Total Energy Demand (TBTU/YR or PJ/YEAR)
Summing over sectors yields total pollution energy sector and pollutant: TSPOL(POLL)=SUM(F)(TFPOL(F,POLL))
where: TSPOL(ES,POLL,YEAR): Energy Sector Pollution (TONS/YR or TONNES/YR) TFPOL(ES,FUEL,POLL,YEAR): Energy Sector Pollution (TONS/YR or TONNES/YR)
Systematic Solutions, Inc. 57 Policy Assessment Corp.

ENERGY 2020 Demand Sector
Societal Cost of Pollution
The social cost of pollution is the sum over all pollutants of the product of the total of each type of pollution (in tons) and the cost of each type of pollution (in dollars per ton) to arrive at a total dollar figure for the cost of pollution to society.
TRPC(S,F)=SUM(P)(TFPOL(F,P)*POCSTR(P))*INFLA/1E6
where: TFPOL(ES,FUEL,POLL,YEAR): Energy Sector Pollution (TONS/YR or TONNES/YR) TRPC(SECTOR,FUEL,YEAR): Societal Cost of Pollution (M$/YR) POCSTR(POLL,YEAR): Societal Cost of Pollution ($/TON or $/TONNE) INFLA(YEAR): Inflation Index ($/$)
Viewing costs by fuel type yields pollution control/damage costs by fuel: POCST(F)=SUM(P)(TFPOL(F,P)*POCSTR(P))*INFLA/1E6
where: POCSTR(POLL,YEAR): Societal Cost of Pollution ($/TON or $/TONNE) TFPOL(ES,FUEL,POLL,YEAR): Energy Sector Pollution (TONS/YR or TONNES/YR) TRPC(SECTOR,FUEL,YEAR): Societal Cost of Pollution (M$/YR) INFLA(YEAR): Inflation Index ($/$)
PROCEDURE DSMPOST: Post Process Calculations for DSM Evaluation The post- processing routine for DSM simulation, helps the user analyze the effects of the DSM program simulated. In this procedure, customer costs and energy intensity ratios are calculated.
In order for the cost and benefit equations to work with and without conservation programs, the cost of the "rebated" equipment (DCCP,PCCP) is set to at least the cost of the equipment (DCC,PCC).
Incentives
The incentives (INC) at the program level to the participant are from rebates (CONEXP) and low-interest loans (CONCAP). The definition of CONCAP in ENERGY 2020 makes it the NPV of capitalized conservation.
INC=INC+CONEXP+CONCAP
where: CONCAP(SECTOR,FUEL,YEAR): Capitalized Conservation Expenses (M$/YR) CONEXP(SECTOR,FUEL,YEAR): Conservation Expense (M$/YR) INC(SECTOR,FUEL,YEAR): Incentives (M$/YR)
The new device (DA) and process (PA) energy additions are: DA=DERA*DEE/1E6 PA=PERA*PEE
where:
Systematic Solutions, Inc. 58 Policy Assessment Corp.

ENERGY 2020 Demand Sector
DA(TECH,EC) 'Device Additions (TBTU/YR)' PA(TECH,EC) 'Process additions (M$/YR/YR)' DERA(ENDUSE,TECH,EC,YEAR): Device Energy Requirement Addition (MBTU/YR OR GJ/YR) DEE(ENDUSE,TECH,EC,YEAR): Device Efficiency (BTU/BTU OR J/J) PERA(ENDUSE,TECH,EC,YEAR): Process Energy Requirements Additions ((MBTU/YR)/YR) PEE(ENDUSE,TECH,EC,YEAR): Marginal Process Efficiency ($/BTU or $/J)
The present value of O&M costs (OM) are: TOM=(XMAX(DCCP*INFLA,DCCB) * DEER + DCCB * (1-DEER)) * DOCF * DA +
(XMAX(PCCP*INFLA,PCC) * PEER + PCC * (1-PEER)) * POCF * PA + RPMSF * FXPC * RPCC * POCF + RDMSF * (PER-PERRP)*DCC*DOCF/1E6
OM(F)=OM(F)+SUM(TE,EC)(TOM(EU,TE,EC)*FTMAP(F,TE))
where: TOM(ENDUSE,TECH,EC): Operation/Maintenance Costs (M$/YR) OM(FUEL,YEAR): Operation/Maintenance Costs (M$/YR) DCC(ENDUSE,TECH,EC,YEAR): Device Capital Cost ($/(MBTU/YR) or $/(GJ/YR)) DEER(ENDUSE,TECH,EC,YEAR): Policy Participation Response (BTU/BTU OR J/J) DOCF(ENDUSE,TECH,EC): Device Operating Cost Fraction (($/YR)/$) DCCP(ENDUSE,TECH,EC,YEAR): Capital Cost of "Rebated" Device ($/(MBTU/YR) or $/(GJ/YR)) DCCB(TECH,EC): Device Capital Cost ($/(MBTU/YR)) PCC(ENDUSE,TECH,EC,YEAR): Process Capital Cost ($/($/YR)) PCCP(ENDUSE,TECH,EC,YEAR): Capital Cost of "Rebated" Process ($/($/YR)) RPMSF(ENDUSE,TECH,EC,YEAR): Process Retrofit Market Share Fraction by Device(1/YR) RDMSF(ENDUSE,TECH,CTECH,EC,YEAR): Device Retrofit Market Share Fraction by Device (1/YR) DA(TECH,EC): Device Additions (TBTU/YR) PA(TECH,EC): Process additions (M$/YR/YR) INFLA(YEAR): Inflation Index ($/$) PER(ENDUSE,TECH,EC,YEAR): Process Energy Requirement (MBTU/YR) PERRP(TECH,EC): Process Energy Requirement. Process Retire. ((MBTU/YR)/YR) PEER(ENDUSE,TECH,EC,YEAR): Process Policy Participation Response (BTU/BTU OR J/J) POCF(ENDUSE,TECH,EC): Process Operating Cost Fraction (($/YR)/$) FXPC(TECH,EC): Fixed Production Capacity (M$/YR) RPCC(ENDUSE,TECH,EC): Retrofit Process Capital Cost ($/($/YR))
Capital expenditures (EX) are: TEX=((XMAX(DCCP*INFLA,DCCB)-DCCU) * DEER + DCCB * (1-DEER)) * DA +
((XMAX(PCCP*INFLA,PCC)-PCCU) * PEER + PCC * (1-PEER))*PA + RPMSF*FXPC*RPCC + RDMSF*(PER-PERRP)*DCC/1E6
EX(F)=EX(F)+SUM(TE,EC)(TEX(EU,TE,EC)*FTMAP(F,TE))
where: EX(SECTOR,FUEL,YEAR): Expenditures (M$/YR) TEX(ENDUSE,TECH,EC): Expenditures (M$/YR) DCCU(ENDUSE,TECH,EC,YEAR): Device Capital Cost Subsidy ($/(MBTU/YR) or $/(GJ/YR)) DEER(ENDUSE,TECH,EC,YEAR): Policy Participation Response (BTU/BTU OR J/J) DCCP(ENDUSE,TECH,EC,YEAR): Capital Cost of "Rebated" Device ($/(MBTU/YR) or $/(GJ/YR)) DCCB(TECH,EC): Device Capital Cost ($/(MBTU/YR)) PCC(ENDUSE,TECH,EC,YEAR): Process Capital Cost ($/($/YR)) PCCP(ENDUSE,TECH,EC,YEAR): Capital Cost of "Rebated" Process ($/($/YR))
Systematic Solutions, Inc. 59 Policy Assessment Corp.

ENERGY 2020 Demand Sector
RPMSF(ENDUSE,TECH,EC,YEAR): Process Retrofit Market Share Fraction by Device(1/YR) RDMSF(ENDUSE,TECH,CTECH,EC,YEAR): Device Retrofit Market Share Fraction by Device (1/YR) DA(TECH,EC): Device Additions (TBTU/YR) PA(TECH,EC): Process additions (M$/YR/YR) INFLA(YEAR): Inflation Index ($/$) PER(ENDUSE,TECH,EC,YEAR): Process Energy Requirement (MBTU/YR) PERRP(TECH,EC): Process Energy Requirement. Process Retire. ((MBTU/YR)/YR) PEER(ENDUSE,TECH,EC,YEAR): Process Policy Participation Response (BTU/BTU OR J/J) POCF(ENDUSE,TECH,EC): Process Operating Cost Fraction (($/YR)/$) FXPC(TECH,EC): Fixed Production Capacity (M$/YR) RPCC(ENDUSE,TECH,EC): Retrofit Process Capital Cost ($/($/YR)) INFLA(YEAR): Inflation Index ($/$)
Participant Level
The level of demand for a participant in the program is determined by the capacity utilization factor, socioeconomic factors, saturation and the marginal device and process efficiencies (for the policy to be effective, the policy proscribed efficiencies must be higher than the average device efficiencies):
EUVAR=CUF*CERSM/(XMAX(PEEA,PEEP)*XMAX(DEEA,DEEP))*DST/1E6
where: EUVAR(TECH,EC): End-use Summation Variable DST(ENDUSE,EC,YEAR): Device Saturation (BTU/BTU OR J/J) CERSM(ENDUSE,EC,YEAR): Life Style Multiplier (BTU/BTU or J/J) DEEA(ENDUSE,TECH,EC,YEAR): Average Device Efficiency (BTU/BTU OR J/J) DEEP(ENDUSE,TECH,EC,YEAR): Policy Device Efficiency (BTU/BTU OR J/J) PEEA(ENDUSE,TECH,EC,YEAR): Average Process Efficiency ($/BTU or $/J) PEEP(ENDUSE,TECH,EC,YEAR): Policy Process Efficiency ($/BTU or $/J):
The fuel cost to a participant the program (URV) depends upon the amount of energy needed (EUVAR) and the price of fuel (ECFP):
TURV=EUVAR*ECFP*UMEA URV(F)=URV(F)+SUM(TE,EC)(TURV(EU,TE,EC)*FTMAP(F,TE))
where: URV(SECTOR,FUEL,YEAR): Fuel Costs for Participant UMEA(SECTOR): Unit of Measure for Participant EUVAR(TECH,EC): End-use Summation Variable TURV(ENDUSE,TECH,EC): Fuel Costs for Participant ECFP(TECH,EC,YEAR): Fuel Price ($/MBTU or $/GJ)
At the participant level, unit energy additions are obtained by multiplying energy additions per unit (DERA/EUPC or PERA/EUPC) times the efficiency of the participants (DEEP or PEEP) times a conversion factor (UMEA) to get to the proper units.
UDA(TE,EC)=DERA(TE,EC)/SUM(A)(EUPC(TE,A,EC)) * XMAX(DEEP(TE,EC),DEE(TE,EC))/1E6*UMEA
UPA(TE,EC)=PERA(TE,EC)/SUM(A)(EUPC(TE,A,EC)) * XMAX(PEEP(TE,EC),PEE(TE,EC))*UMEA RDA(TE,EC)=RDMSF(TE,EC)*(PER(TE,EC)-PERRP(TE,EC))/
SUM(A)(EUPC(TE,A,EC))/1E6*UMEA RPA(TE,EC)=RPMSF(TE,EC)*FXPC(TE,EC)/SUM(A)(EUPC(TE,A,EC))*UMEA
Systematic Solutions, Inc. 60 Policy Assessment Corp.
ENERGY 2020 Demand Sector
where: UMEA(SECTOR): Unit of Measure for Participant RDA(TECH,EC) 'Device Retrofit. Additions for Participant' RPA(TECH,EC) 'Process Retrofit. Additions for Participant' RPMSF(ENDUSE,TECH,EC,YEAR): Process Retrofit Market Share Fraction by Device(1/YR) RDMSF(ENDUSE,TECH,CTECH,EC,YEAR): Device Retrofit Market Share Fraction by Device (1/YR) INFLA(YEAR): Inflation Index ($/$) PER(ENDUSE,TECH,EC,YEAR): Process Energy Requirement (MBTU/YR) PERRP(TECH,EC): Process Energy Requirement. Process Retire. ((MBTU/YR)/YR) PEER(ENDUSE,TECH,EC,YEAR): Process Policy Participation Response (BTU/BTU OR J/J) FXPC(TECH,EC): Fixed Production Capacity (M$/YR)
The value of incentives to a participant in a program (TUINC) is the value of a rebate (DCCU or PCCU) plus the value of a low interest loan [(DCCP*(1-DCCRU/DCCR) or PCCP*(1-PCCRU/PCCR)] times the level of energy additions (UDA or UPA).
TUINC=(DCCU+XMAX(DCCP*INFLA,DCCB)*(1-DCCM)) * UDA + (PCCU+XMAX(PCCP*INFLA,PCC) * (1-PCCM)) * UPA+ RPCCU*RPA+ RDCCU*RDA
UINC(F)=UINC(F)+SUM(TE,EC)(TUINC(EU,TE,EC)*FTMAP(F,TE))
where: DCCU(ENDUSE,TECH,EC,YEAR): Device Capital Cost Subsidy ($/(MBTU/YR) or $/(GJ/YR)) DEER(ENDUSE,TECH,EC,YEAR): Policy Participation Response (BTU/BTU OR J/J) DCCP(ENDUSE,TECH,EC,YEAR): Capital Cost of "Rebated" Device($/(MBTU/YR) or $/(GJ/YR)) DCCB(TECH,EC): Device Capital Cost ($/(MBTU/YR)) PCC(ENDUSE,TECH,EC,YEAR): Process Capital Cost ($/($/YR)) PCCM(EC): Process Capital Charge Rate Multiplier (($/YR)/$) PCCP(ENDUSE,TECH,EC,YEAR): Capital Cost of "Rebated" Process ($/($/YR)) RPMSF(ENDUSE,TECH,EC,YEAR): Process Retrofit Market Share Fraction by Device(1/YR) RDMSF(ENDUSE,TECH,CTECH,EC,YEAR): Device Retrofit Market Share Fraction by Device (1/YR) UDA(TECH,EC): Device Additions (TBTU/YR) UPA(TECH,EC): Process additions (M$/YR/YR) RDA(TECH,EC): Device Additions (TBTU/YR) RPA(TECH,EC): Process additions (M$/YR/YR) INFLA(YEAR): Inflation Index ($/$) PER(ENDUSE,TECH,EC,YEAR): Process Energy Requirement (MBTU/YR) PERRP(TECH,EC): Process Energy Requirement. Process Retire. ((MBTU/YR)/YR) PEER(ENDUSE,TECH,EC,YEAR): Process Policy Participation Response (BTU/BTU OR J/J) INFLA(YEAR): Inflation Index ($/$)
The present value of O&M costs for program participants (UOM) are: TUOM=XMAX(DCCP*INFLA,DCCB)*DOCF*UDA + XMAX(PCCP*INFLA,PCC)*POCF*UPA +
RPCC*POCF*RPA + DCC*DOCF*RDA UOM(F)=UOM(F)+SUM(TE,EC)(TUOM(EU,TE,EC)*FTMAP(F,TE))
where: UOM TOM DCCP(ENDUSE,TECH,EC,YEAR): Capital Cost of "Rebated" Device ($/(MBTU/YR) or $/(GJ/YR)) DCCB(TECH,EC): Device Capital Cost ($/(MBTU/YR)) PCC(ENDUSE,TECH,EC,YEAR): Process Capital Cost ($/($/YR)) PCCP(ENDUSE,TECH,EC,YEAR): Capital Cost of "Rebated" Process ($/($/YR)) UDA(TECH,EC): Device Additions (TBTU/YR)
Systematic Solutions, Inc. 61 Policy Assessment Corp.

ENERGY 2020 Demand Sector
UPA(TECH,EC): Process additions (M$/YR/YR) RDA(TECH,EC): Device Additions (TBTU/YR) RPA(TECH,EC): Process additions (M$/YR/YR) INFLA(YEAR): Inflation Index ($/$) PER(ENDUSE,TECH,EC,YEAR): Process Energy Requirement (MBTU/YR) PERRP(TECH,EC): Process Energy Requirement. Process Retire. ((MBTU/YR)/YR) PEER(ENDUSE,TECH,EC,YEAR): Process Policy Participation Response (BTU/BTU OR J/J) POCF(ENDUSE,TECH,EC): Process Operating Cost Fraction (($/YR)/$) FXPC(TECH,EC): Fixed Production Capacity (M$/YR) RPCC(ENDUSE,TECH,EC): Retrofit Process Capital Cost ($/($/YR)) INFLA(YEAR): Inflation Index ($/$)
Capital expenditures for program participants (EX) are: TUEX=(XMAX(DCCP*INFLA,DCCB)-DCCU)*UDA + (XMAX(PCCP*INFLA,PCC)-PCCU)*UPA +
(RPCC-RPCCU)*RPA + (DCC-RDCCU)*RDA UEX(F)=UEX(F)+SUM(TE,EC)(TUEX(EU,TE,EC)*FTMAP(F,TE))
where: UEX(SECTOR,FUEL,YEAR): Expenditures for Participant TEX(ENDUSE,TECH,EC): Expenditures (M$/YR) RPCC(ENDUSE,TECH,EC): Retrofit Process Capital Cost ($/($/YR)) RPCCU(ENDUSE,TECH,EC,YEAR): Process Retrofit Rebate DCCP(ENDUSE,TECH,EC,YEAR): Capital Cost of "Rebated" Device ($/(MBTU/YR) or $/(GJ/YR)) DCCB(TECH,EC): Device Capital Cost ($/(MBTU/YR)) DCCU(ENDUSE,TECH,EC,YEAR): Device Capital Cost Subsidy ($/(MBTU/YR) or $/(GJ/YR)) UDA(TECH,EC): Device Additions (TBTU/YR) UPA(TECH,EC): Process additions (M$/YR/YR) RDA(TECH,EC): Device Additions (TBTU/YR) RPA(TECH,EC): Process additions (M$/YR/YR) INFLA(YEAR): Inflation Index ($/$) PROCEDURE ETOU: Electric Time-Of-Use Impacts
Time of use rates affect peak demand and sales in different ways. The higher rate will cause less usage on peak, depending on the elasticity of demand (ELAS). The lower rates can cause increased usage. Although peak energy use should decline, the final impact on sales depends on the elasticity of demand and the difference in prices. This procedure calculates the impacts of different time of use pricing on peak, average and minimum loads.
Endogenous T-O-U Rate Impacts TOU(EU,LOAD,SS) = (1-TOUFR) + TOUFR * TOURATIO(PEAK,SS)**ELAS(EU,LOAD,PEAK) *
TOURATIO(AVERAGE,SS)**ELAS(EU,LOAD,AVERAGE) * TOURATIO(MINIMUM,SS)**ELAS(EU,LOAD,MINIMUM)
where: TOURATIO(LOAD,SEASON): Ratio of TOU Rate to Average Price (fraction) TOUFR(YEAR): TOU Acceptance Fraction (fraction) TOU(ENDUSE,LOAD,SEASON): TOU Rate Multiplier (fraction) ELAS(ENDUSE,LOAD,XLOAD): TOU Rate Elasticity (Dless)
Systematic Solutions, Inc. 62 Policy Assessment Corp.

ENERGY 2020 Demand Sector
PROCEDURE LOADMGMT: Load Management This procedure calculates endogenous Load Management.
Load Management Device Capital Charge Rate: LMDCCR = (1-LMDIVTC/(1+ROIN+LMDRISK+INSM)-TXRT *
(2/DTL)/(ROIN+LMDRISK+INSM+2/DTL)) * (ROIN+LMDRISK)/(1-(1/(1+ROIN+LMDRISK))**DPLN)/(1-TXRT)
where: LMDCCR: LMDCCR Load Management Capital Charge Rate LMDIVTC: Device Investment Tax Credit (DLESS) LMDRISK: Device Excess Risk (DLESS):
Load Management Fuel Price
The load management “fuel price” contains both a fuel and a capital cost component. The load management capital charge rate is used to annualize the capital cost of the load management project. This cost is added to the cogeneration fuel price to arrive at the load management fuel price.
LMFP(U) = ((LMDCC(U)-LMDCCP(U))*LMDCCR/(8760*1000) + LMIC(U))*INFLA-LMEVF(U)*CGFP(EC)/3.412
where: LMFP(ENDUSE): Load Management Fuel Price INFLA(YEAR): Inflation Index ($/$) LMDCCR: LMDCCR Load Management Capital Charge Rate LMDCC(ENDUSE): LMDCC Load Management Capital Cost LMDCCP(ENDUSE): LMDCCP Load Management Policy Capital Cost LMIC(ENDUSE): Load Management Indirect Cost (DLESS): LMEVF(ENDUSE): Load Management Energy Value Fraction CGFP(TECH,EC,YEAR): Electric Price ($/MBTU OR $/GJ)
Load Management Indicated Market Share
The load management indicated market share is function of the load management fuel price (relative to the cogeneration fuel price) modified by the load management multiplier and variance factor.
LMIMS(U)=LMMSM(U)/(LMMSM(U)+(CGFP(EC)/3.412/LMFP(U))**LMVF)
where: LMFP(ENDUSE): Load Management Fuel Price CGFP(TECH,EC,YEAR): Electric Price ($/MBTU OR $/GJ) LMVF: Load Management Market Share Variance Factor (DLESS) LMMSM(ENDUSE,YEAR): Load Management Market Share Multiplier LMIMS(ENDUSE): Load Management Indicated Market Share
Systematic Solutions, Inc. 63 Policy Assessment Corp.

ENERGY 2020 Demand Sector
Train Transportation Only: LMMS(U) = LMMS(U)+DT*((XMAX(LMMS(U),LMIMS(U))-LMMS(U))/LMRT-
LMMS(U)/DPLN(TE,EC))
where: LMMS(ENDUSE,YEAR): Load Management Market Share LMIMS(ENDUSE): Load Management Indicated Market Share LMRT: Load Management Response Time
Load Management Capitalized LMCAP = SUM(U,EC)((XMAX(LMMS(U),LMIMS(U,EC))-LMMS(U))/LMRT(EC) * LMDCCP(EC) *
LMLSFR(U,PEAK) * DMD(U,TE,EC) * MAX(SS)(LSF(U,EC,PEAK,SS)))/(8760*MJKWH)*1000+XLMCAP
where: LMMS(ENDUSE,YEAR): Load Management Market Share LMDCCP(ENDUSE): LMDCCP Load Management Policy Capital Cost LMIMS(ENDUSE): Load Management Indicated Market Share
Load Management Expensed: LMEXP=LMCAP*LMOCF+XLMCAP
where: LMEXP(ENDUSE,YEAR): Load Management Expensed (M$) LMCAP(ENDUSE,YEAR): Load Management Capitalized (M$) XLMCAP(ENDUSE,YEAR): Load Management Capitalized (M$) LMOCF: LMOCF Load Management Operating Cost Factor
Load Management can also be specified exogenously: LMMS=XLMMS LMCAP=XLMCAP LMEXP=XLMEXP
PROCEDURE LOADCURVE Each electric end-use has a set of load shape factors (LSF) attributed to it. The LSF are estimated, end-use specific ratios that compare the kW contribution to the system seasonal peak and minimum load to the average load. (The load shape classifications are Peak, Average, Minimum load for each season - Winter, Spring, Summer, Fall, Late Fall). For example, the LSF (Winter Peak) for residential air conditioning is 0.0 while the LSF (Summer Peak) may be 6.0. The LSF (Average) over the year is always 1.0 unless a load management policy is specified. The seasonal LSF (Average) may, however, be much different than one.
Device Load Curves
The economic category and end-use load duration curve (ECLDC) by class, season, and loadshape classification is demand (DMD) multiplied by the respective LSF (DMD*LSF).
Systematic Solutions, Inc. 64 Policy Assessment Corp.

ENERGY 2020 Demand Sector
If time of use rates are being simulated, the time of use fraction (TOU) will further modify the ECLDC. Similarly, load management policies will activate LMMS (share of demand) and LMLSFR (load shape reduction fraction) and further modify the economic category load shapes
ECLDC=ECLDC+DMD*LSF*TOU*(1-LMMS*LMLSFR)/(8760*EECONV)*1E9
where: ECLDC(ENDUSE,EC,LOAD,SEASON): Load Curve by Economic Category (MW) EECONV: Electric Energy Conversion (BTU/KWH OR GJ/KWH) CLDC(CLASS,LOAD,SEASON,YEAR): Load Curve by Revenue Class (MW) LMLSFR(ENDUSE,LOAD): Load Management Load Shape Reduction LMMS(ENDUSE,YEAR): Load Management Market Share
The ECLDC (Peak) is corrected by an exogenous hourly multiplier (HPKM) to account for weather effects on temperature sensitive loads (such as air conditioning (TSLOAD)).
ECLDC=ECLDC*(HPKM*TSLOAD+(1-TSLOAD))
where: ECLDC(ENDUSE,EC,LOAD,SEASON): Load Curve by Economic Category (MW) HPKM(SEASON,YEAR): Hourly Peak Day Multiplier TSLOAD(ENDUSE,EC): Temperature Sensitive Fraction of Load (BTU/BTU or J/J)
Netting Out Cogeneration
Cogeneration can be though of as a negative demand (DMD) converted from input BTUs to output kWh. DMD is the customer’s need for electricity while CLDC is the demand the utility experiences. Therefore cogeneration demand must be subtracted from the electric loadcurves.
To begin, a cogeneration fraction (CGFR) is developed to isolate the contribution to load made by cogeneration. This fraction is determined by multiplying the cogeneration demand (CGDMD) times its load shape factor (by economic category) in a manner analogous to the calculation of ECLDC above. This load shape is then divided by the appropriate class ECLDC to derive the fraction of each ECLDC that is served by cogeneration.
CGFR(EC,L,SS) = (SUM(T)(CGDMD(T,EC)/CGHRT(T)) * LSF(CGMAP(EC),L,SS)/8760 * 1E9)/ SUM(EU)(ECLDC(EU,EC,L,SS))
If cogeneration present (if CGFR is not zero), The amount of cogeneration’s contribution to the class load curve (ECLDC*CGFR) is then subtracted from the appropriate class load duration curve (ECLDC) under the assumption that all end-uses are reduced by the same amount of cogeneration.
ECLDC=ECLDC-(ECLDC*CGFR)
where: ECLDC(ENDUSE,EC,LOAD,SEASON): Load Curve by Economic Category (MW) CGFR(EC,LOAD,SEASON): Cogeneration Fraction (Dless)
Systematic Solutions, Inc. 65 Policy Assessment Corp.

ENERGY 2020 Demand Sector
Deriving the Temperature Sensitive Portion of Load
The temperature sensitive portion of electric load is also calculated by multiplying the economic category load duration curve (ECLDC) by the fraction of temperature sensitive load in each end use for each economic class (TSLOAD)
TSLDC(L,SS)=SUM(EU,EC)(ECLDC(EU,EC,L,SS)*TSLOAD(EU,EC))
where: TSLDC(CLASS,LOAD,SEASON,YEAR): Temperature Sensitive Load Curve ECLDC(ENDUSE,EC,LOAD,SEASON): Load Curve by Economic Category (MW) TSLOAD(ENDUSE,EC): Temperature Sensitive Fraction of Load (BTU/BTU or J/J)
Computing the Class Load Curve
The revenue class load duration curve (CLDC) is the ECLDCs summed over end-uses and economic categories.
CLDC(L,S)=SUM(EU,EC)(ECLDC(EU,EC,L,S))
End-use sales
Sales by end-use and class (ESALES) are the average ECLDCs summed over hours (hours per season summed over all seasons). Sales by class ECSALES are ESALES summed over end-uses. Total sales (SALES) are sales by class (ECSALES) summed over class.
ESALES(EU,EC)=SUM(SS)(ECLDC(EU,EC,AVERAGE,SS)*HOURS(SS))/1000 ECSALES(EC)=SUM(EU)(ESALES(EU,EC)) SALES(ELECTRIC)=SUM(EC)(ECSALES(EC))
where: SALES(CLASS,FUEL,YEAR): Sales (Natural Units/YR) ECSALES(EC,YEAR): Electricity Sales by Economic Category (GWH/YR) ESALES(ENDUSE,EC,YEAR): Electricity Sales (GWH/YR) ECLDC(ENDUSE,EC,LOAD,SEASON): Load Curve by Economic Category (MW)
PROCEDURE NOLOADCURVE: Electric Sales when load shapes are not available If no load shapes are available, then electric demand is converted by TBTU to KWH ESALES by end-use and economic category. In the same fashion as above, ESALES is summed over all end-uses to arrive at sales by economic class (ECSALES)
ESALES(EU,EC)=SUM(TE)(DMD(EU,TE,EC)*FTMAP(F,TE))/EECONV*1E6 ECSALES(EC)=SUM(EU)(ESALES(EU,EC))
where: ECSALES(EC,YEAR): Electricity Sales by Economic Category (GWH/YR) ESALES(ENDUSE,EC,YEAR): Electricity Sales (GWH/YR) DMD(ENDUSE,TECH,EC,YEAR): Total Energy Demand (TBTU/YR OR PJ/YEAR) EECONV: Electric Energy Conversion (BTU/KWH OR GJ/KWH)
Systematic Solutions, Inc. 66 Policy Assessment Corp.

ENERGY 2020 Demand Sector
Netting Out Cogeneration
The cogeneration fraction is determined by cogeneration sales divided by the total sales in each economic category.
CGFR=CGEC/ECSALES
where: CGFR(EC,LOAD,SEASON): Cogeneration Fraction (Dless) CGEC(EC,YEAR): Cogeneration by Economic Category (GWH/YR) ECSALES(EC)=SUM(EU)(ESALES(EU,EC))
The cogeneration fraction for each economic category is used to reduce end-use sales in that economic category. All end-uses within the economic category are reduced by the same amount. Then ESALES is summed across end-uses to derive ECSALES which is then summed across economic category to arrive at total sales (SALES).
ESALES=ESALES-(ESALES*CGFR) ECSALES(EC)=SUM(EU)(ESALES(EU,EC)) SALES(ELECTRIC)=SUM(EC)(ECSALES(EC))
where: SALES(CLASS,FUEL,YEAR): Sales (Natural Units/YR) ECSALES(EC,YEAR): Electricity Sales by Economic Category (GWH/YR) ESALES(ENDUSE,EC,YEAR): Electricity Sales (GWH/YR) CGFR(EC,LOAD,SEASON): Cogeneration Fraction (Dless)
PROCEDURE DAILYUSE: Gas utility Daily use curve Each end-use has a set of load shape factors (DUF) associated with it. The DUFs are estimated end-use specific ratios that compare the MTherm/Day contribution to the system seasonal peak and minimum load to the average load. (The load shape classifications are Peak, Average, and Minimum Load for each season). As an example, the DUF(winter peak) for residential space heat may be 3.0 whereas the DUF(summer peak) is 0.0. The DUF(average) over the year is always 1.0 unless a load management policy is specified. The seasonal DUF average may, however, be much different than 1.0.
The end-use daily use curve (EUDUC) by class, season, and loadshape classification is the demand (DMD with or without (DUCFSW) cogeneration and feedstock demands (CGDMD+FSDMD) ) multiplied by the respective DUF (DMD*DUF)..
ECDUC=ECDUC+(DMD+(CGDMD+FSDMD)*DUCFSW)*DUF/365*GECONV
where: ECDUC(ENDUSE,EC,LOAD,SEASON): Gas End-use Load Curve (MTHERM/DAY) DMD(ENDUSE,TECH,EC,YEAR): Total Energy Demand (TBTU/YR OR PJ/YEAR) CGDMD(TECH,EC,YEAR): Cogeneration Energy Demand (TBTU/YR OR GJ/YR) GECONV: Gas Energy Conversion (THERM/MBTU or THERM/GJ) FSDMD(TECH,EC,YEAR): Feedstock Energy Demand (TBTU/YR OR GJ/YR) DUF(SHAPE,LOAD,SEASON) 'Daily Use Factor (THERM/THERM)
The winter daily use curves (EUDUC for PEAK) are comprised largely of temperature sensitive primary heating load (TSLOAD). This load is corrected for daily peak weather effects (DPKM).
Systematic Solutions, Inc. 67 Policy Assessment Corp.

ENERGY 2020 Demand Sector
ECDUC=ECDUC*(DPKM*TSLOAD+(1-TSLOAD))
where: ECDUC(ENDUSE,EC,LOAD,SEASON): Gas End-use Load Curve (MTHERM/DAY) DPKM(SEASON) 'DAILY Peak Day Multiplier', TYPE=REAL(8,3) TSLOAD(ENDUSE,EC): Temperature Sensitive Fraction of Load (BTU/BTU or J/J)
Gross Class Load Curve
The class load duration curve (CDUC) is the EUDUCs summed over end-uses: CDUC(L,SS)=SUM(EU,EC)(ECDUC(EU,EC,L,SS))
where: ECDUC(ENDUSE,EC,LOAD,SEASON): Gas End-use Load Curve (MTHERM/DAY) CDUC(LOAD,SEASON): Gas Gross Load Curve (MTHERM/DAY)
Temperature Sensitive Portion of Load
The temperature sensitive portion of load (TSDUC) is the daily use curve multiplied by the fraction of load that is temperature sensitive (TSLOAD)
TSDUC(L,SS)=SUM(EU,EC)(ECDUC(EU,EC,L,SS)*TSLOAD(EU,EC))
where: ECDUC(ENDUSE,EC,LOAD,SEASON): Gas End-use Load Curve (MTHERM/DAY) TSLOAD(ENDUSE,EC): Temperature Sensitive Fraction of Load (BTU/BTU or J/J) TSDUC(LOAD,SEASON): Temperature Sensitive Load Curve
End-use sales
Sales by class are the average daily load curves (ECDUC) summed over days. Total sales are the sales summed over all classes.
GSALES(EU,EC)=SUM(SS)(ECDUC(EU,EC,AVERAGE,SS)*DAYS(SS)) SALES(GAS)=SUM(EU,EC)(GSALES(EU,EC))
where: SALES(CLASS,FUEL,YEAR): Sales (Natural Units/YR) GSALES(ENDUSE,EC,YEAR): Gas Sales (MTHERM/YR) ECDUC(ENDUSE,EC,LOAD,SEASON): Gas End-use Load Curve (MTHERM/DAY)
PROCEDURE NODAILYUSE: Gas Sales when load shapes are not available
Gas Sales by end-use and Economic Category.
Gas sales are the calculated as the share of demand, including cogeneration and feedstock, that is belongs to natural gas, converted from TBTUs to MTHERMS.
GSALES(EU,EC)=SUM(TE)((DMD(EU,TE,EC)+CGDMD(TE,EC)+FSDMD(TE,EC))*FTMAP(GAS,TE ))*GECONV
Systematic Solutions, Inc. 68 Policy Assessment Corp.

ENERGY 2020 Demand Sector
where: GSALES(ENDUSE,EC,YEAR): Gas Sales (MTHERM/YR) FSDMD(TECH,EC,YEAR): Feedstock Energy Demand (TBTU/YR OR GJ/YR) CGDMD(TECH,EC,YEAR): Cogeneration Energy Demand (TBTU/YR OR GJ/YR) DMD(ENDUSE,TECH,EC,YEAR): Total Energy Demand (TBTU/YR OR PJ/YEAR) GECONV: Gas Energy Conversion (THERM/MBTU or THERM/GJ)
Total sales are the sales summed over all classes. SALES(GAS)=SUM(EU,EC)(GSALES(EU,EC))
where: SALES(CLASS,FUEL,YEAR): Sales (Natural Units/YR) GSALES(ENDUSE,EC,YEAR): Gas Sales (MTHERM/YR)
Exogenous Transportation Sales
Transportation sales are calculated as a proportion (XCCMS) of natural gas sales. This proportion is exogenously specified by year and can change over time.
CCSALES=SALES(GAS)*XCCMS
where: CCSALES (CLASS,YEAR): Transportation Sales of Gas (MTHERM/YR) SALES(CLASS,FUEL,YEAR): Sales (Natural Units/YR) XCCMS(YEAR): Transportation Market Share (Frac)
INITIAL: RESIDENTIAL, COMMERCIAL, INDUSTRIAL, TRANSPORTATION
PROCEDURE IPRICE This procedure calculates the Trade-Off Table Indices
The variables DCCRN(Device Capital Charge Rate),CPRICE, DPRICE (Energy Price Dimensions for Efficiency and Capital Cost Curves) are calculated to be used in the trade-off tables.
Sales taxes are added to fuel prices to get local fuel prices by economic category: ECFP(T,EC)=FP(FPMAP(T,EC))*(1+ECFPSM(T,EC))
where: ECFP(TECH,EC,YEAR): Fuel Price ($/MBTU or $/GJ) FP(PRICES) Fuel Prices ($/MBTU) ECFPSM(TECH,EC,YEAR): Sales Tax ($/$)
Device Table Index from Fuel Prices
This procedure creates the price X-axis for the efficiency curves. Twenty points are identified on the X-axis.
Systematic Solutions, Inc. 69 Policy Assessment Corp.

ENERGY 2020 Demand Sector
To begin, two local variables are created, the first, LOC1, is equal to the maximum number of points (20) divided by two; the second, LOC2, the maximum points divided by four. Therefore LOC1 is the tenth point and LOC2 is the fifth point.
LOC1=IFIX(EFFI:M/2) LOC2=IFIX(EFFI:M/4)
Fuel prices are then associated with these points. The tenth point, (LOC1), is assigned a price four times higher than the current maximum fuel price for any economic category. For the fifth point a price half that of LOC1’s price is assigned. If that price is lower than the minimum economic category price, then the latter is used instead.
DPRICE(LOC1,T)=MAX(EC)(ECFP(T,EC))*4.0 DPRICE(LOC2,T)=DPRICE(LOC1,T)/2 DPRICE(LOC2,T)=XMIN(DPRICE(LOC2,T),MIN(EC)(ECFP(T,EC)))
For the first point identified on the X-axis, DPRICE is equal to the price associated with fifth point (LOC2) divided by 10:
DPRICE(1,T)=DPRICE(LOC2,T)/10
For the points between five (LOC2) and twenty, DPRICE is equal to the LOC2 price (LOC2,T) plus the difference between the LOC1 and LOC2 prices (DPRICE(LOC1,T)-DPRICE(LOC2,T)) divided by the ratio of the change from the point in question to five (LOC2) and the change from LOC1 (10) to LOC2 (5), ((EFFI:S-LOC2)/(LOC1-LOC2)):
DPRICE(EF,T) = DPRICE(LOC2,T) + (DPRICE(LOC1,T) - DPRICE(LOC2,T))/(LOC1-LOC2) * (EFFI:S-LOC2)
For the points between the first point and the fifth point (LOC2), the same procedure is used, with DPRICE for the first point used as the starting point.
DPRICE(EF,T) = DPRICE(1,T) + (DPRICE(LOC2,T) - DPRICE(1,T))/ (LOC2-1)*(EFFI:S-1)
where: DPRICE(EFFI,TECH): Energy Price Dimension for Efficiency and Capital Cost Curves ($/MBTU) ECFP(TECH,EC): Fuel Price ($/MBTU)
Investment Levelization Rate - the Capital Charge Rate
The device capital charge rate is the annualization of device capital expenses (over the life of the device - DTL), accounting for taxes (TXRT), tax credits (DIVTC), and return of principal and on investment (including risk premiums and inflation: 1+ROIN+DRISK+INSM). (1-(1/(1+ROIN+DRISK))**DPL)/(1-TXRT) is the classical capital recovery term. The (1-TXRT) term at the end converts the after tax calculation into before tax dollars. Investment tax credits reduce the cost of the facility by the tax credit after the first year of operation using nominal dollars. Therefore the value of the tax credit is (DIVTC/(1+ROIN+DRISK+INSM). Depreciation is modeled as a current dollar phenomena which does not account for inflation. Therefore the net present value of the energy is calculated with the nominal rate of return: (2/DTL)/(ROIN+DRISK+INSM+2/DTL)). It shows up as an additional negative term in the capital cost modifiers of DCCR because depreciation is a benefit (negative cost).
Systematic Solutions, Inc. 70 Policy Assessment Corp.

ENERGY 2020 Demand Sector
Device capital costs (DCC) are multiplied by the DCCRN to get the annualized cost of the device used in computing market share calculations.
The formula for calculating the device capital charge rate: DCCRN = (1-DIVTC/(1+ROIN+DRISK+INSM)-TXRT * (2/DTL)/(ROIN+DRISK+INSM+2/DTL)) *
(ROIN+DRISK)/(1-(1/(1+ROIN+DRISK))**DPL)/(1-TXRT)
where: DCCRN(ENDUSE,TECH,EC): Device Capital Charge Rate (($/YR)/$) DIVTC(TECH,YEAR): Device Investment Tax Credit ($/$) DPL(ENDUSE,TECH,EC,ZERO): Physical Life of Equipment (YRS) DRISK(ENDUSE,TECH): Device Excess Risk Premium ($/$) DTL(ENDUSE,TECH,EC): Device Tax Life (YRS) INSM(YEAR): Smoothed Inflation Rate (($/YR)/$) ROIN(EC): Return on Investment (($/YR)/$) TXRT(EC,YEAR): Tax Rate on Energy Consumer ($/$)
Cost of Using a Device
Marginal device efficiencies are first set equal to their historical values: DEE=XDEE
Each specific demand for energy is associated with a stock of capital. Investment in each type of capital stock by fuel type is allocated according to the cost of using each type of fuel. This cost is the perceived cost to the user and includes a risk factor (incorporated in the calculation of DCCRN), annualized capital costs (DCCRN*XDCC), and delivered marginal fuel costs (ECFP/DEE).
The marginal cost of using energy (MCFU) includes the cost of using energy for all end-uses. As such, a house that has a gas furnace but an electric water heater would be represented partially in the model’s gas capital stock and partially in the electric capital stock. The investment includes capital using energy in addition to the energy source equipment.
MCFU=(DCCRN+DOCF)*XDCC+ECFP/DEE
where: MCFU(ENDUSE,TECH,EC,YEAR): Marginal Cost of Fuel Use ($/MBTU or $/GJ) XDCC(ENDUSE,TECH,EC,YEAR): Device Capital Cost ($/(MBTU/YR) or $/(GJ/YR)) DCCRN(ENDUSE,TECH,EC,YEAR): Device Capital Charge Rate (($/YR)/$) ECFP(TECH,EC,YEAR): Fuel Price ($/MBTU or $/GJ) DEE(ENDUSE,TECH,EC,YEAR): Device Efficiency (BTU/BTU or J/J)
Calculate Trade-Off Table Indices from Capital Costs
The two local variables are used again, the first, LOC1, is equal to the maximum number of points (20) divided by two; the second, LOC2, the maximum points divided by four. Therefore LOC1 is the tenth point and LOC2 is the fifth point.
Different marginal costs of fuel use are then associated with these points. The tenth point, (LOC1), is assigned a cost equal to the maximum marginal cost in any economic class end-use.
Systematic Solutions, Inc. 71 Policy Assessment Corp.

ENERGY 2020 Demand Sector
For the fifth point (LOC2), a price half that of LOC1’s price is assigned. If that price is lower than the minimum end-use cost, then the latter is used instead.
CPRICE(LOC1,T)=MAX(EC,EU)(MCFU(EU,T,EC)) CPRICE(LOC2,T)=CPRICE(LOC1,T)/2 CPRICE(LOC2,T)=XMIN(CPRICE(LOC2,T),MIN(EU,EC)(MCFU(EU,T,EC)))
For the first point identified on the X-axis, CPRICE is equal to the price associated with fifth point (LOC2) divided by 10:
CPRICE(1,T)=CPRICE(LOC2,T)/10
For the points between five (LOC2) and twenty, CPRICE is equal to the LOC2 price (LOC2,T) plus the difference between the LOC1 and LOC2 prices (CPRICE(LOC1,T)-CPRICE(LOC2,T)) divided by the ratio of the change from the point in question to five (LOC2) and the change from LOC1 (10) to LOC2 (5), ((EFFI:S-LOC2)/(LOC1-LOC2)):
CPRICE(EF,T) = CPRICE(LOC2,T) + (CPRICE(LOC1,T) - CPRICE(LOC2,T))/(LOC1-LOC2) * (EFFI:S-LOC2)
For the points between the first point and the fifth point (LOC2), the same procedure is used, with CPRICE for the first point used as the starting point.
CPRICE(EF,T)=CPRICE(1,T) + (CPRICE(LOC2,T) - CPRICE(1,T))/(LOC2-1) * (EFFI:S-1)
where: CPRICE(EFFI,TECH): Energy Price Dimension for Efficiency and Capital Cost Curves ($/MBTU) MCFU(ENDUSE,TECH,EC,YEAR): Marginal Cost of Fuel Use ($/MBTU or $/GJ)
PROCEDURE INITIAL This procedure performs variable initializations. AB (average budget), PEE(marginal process efficiency), PEEA(average process efficiency), PER(process energy requirements), CGGC(cogeneration generation capacity), CGUMS(cogeneration utilization factor), CHR (cooling to heating ratio), DEE(marginal device efficiency), DEEA(average device efficiency), DER(device energy requirements), DST(device saturation), EUPC(fuel prices), CGVF(cogeneration variance factor), DMD(demand), and CGDMD (cogeneration demand) are initialized in this process.
Weighting the Capacity Utilization Factor by Output
The calibrated capacity utilization factor (by ECC) is weighted by its share of total output (GO(ECC)/SUM(ECC)(GO(ECC)) and summed over ECC to yield a weighted capacity utilization factor by EC. The ECCMAP maps the ECCs (subclasses such as offices or food processing) into the correct EC (economic class such as commercial or industrial)
WCUF(EC) = SUM(ECC)(GO(ECC) * ECUF(ECC) * ECCMAP(EC,ECC))/SUM(ECC)(GO(ECC) * ECCMAP(EC,ECC))
where: WCUF(EC) Capacity Utilization Factor Weighted by Output ECUF(ECC,YEAR): Capital Utilization Fraction (BTU/BTU OR GJ/GJ)
Systematic Solutions, Inc. 72 Policy Assessment Corp.

ENERGY 2020 Demand Sector
GO(ECC): Gross Output ($M/YR)
Energy Requirements by End-use
Demand is set equal to exogenous historical demands: DMD=XDMD
Device Energy Requirements by End-use are calculated as from the exogenous demands by dividing by the weighted capacity utilization factor and normalizing for weather effects:
DER(EU,TE,EC)=DMD(EU,TE,EC)/WCUF(EC)/(DDM(U)*TSLOAD(EU,EC) + (1-TSLOAD(EU,EC)))*1E6
where: DER(ENDUSE,TECH,EC,YEAR): Device Energy Requirement (MBTU/YR OR GJ/YR) DMD(ENDUSE,TECH,EC,YEAR): Total Energy Demand (TBTU/YR OR PJ/YEAR) DDM(ENDUSE,YEAR): Degree Day Multiplier (DD/DD Normal) TSLOAD(ENDUSE,EC): Temperature Sensitive Fraction of Load (BTU/BTU or J/J)
If there is no initial demand, set to the last XDMD value that exists (XXDMD). DER=XMAX(XXDMD/1E12,DER)
where: DER(ENDUSE,TECH,EC,YEAR): Device Energy Requirement (MBTU/YR OR GJ/YR) XXDMD(ENDUSE,TECH,EC): Energy Demand (TBTU/YR)
Set the initial average efficiency (DEEA) equal to the initial marginal efficiency (DEE): DEEA=DEE
Process Energy Requirements of Capital Stock
The process energy requirements of capital stock are equal to the device requirements times the average device efficiency:
PER=DER*DEEA
where: PER(ENDUSE,TECH,EC,YEAR): Process Energy Requirement (MBTU/YR) DER(ENDUSE,TECH,EC,YEAR): Device Energy Requirement (MBTU/YR OR GJ/YR) DEEA(ENDUSE,TECH,EC,YEAR): Average Device Efficiency (BTU/BTU OR J/J)
Saturation
The initial device saturation is set equal to its exogenous value: DST=XDST
Calculate indicated EUPC as FPC
Actual Production Capacity by Technology ($) is equal to the process energy requirements by technology (MBTU) divided by the device saturation (BTU/BTU).
FPC=PER/DST
Systematic Solutions, Inc. 73 Policy Assessment Corp.
ENERGY 2020 Demand Sector
where: FPC(ENDUSE,TECH,EC): Actual Production Capacity by TECH ($/YR)' PER(ENDUSE,TECH,EC,YEAR): Process Energy Requirement (MBTU/YR) DST(ENDUSE,EC,YEAR): Device Saturation (BTU/BTU OR J/J)
The process efficiency for space heat is the same across all ages but varies (by a factor of PDIF) across fuels. If there is no HEAT and/or Air Conditioning, skip the following equation for FPC
FPC=PER/DST/PDIF
where: FPC(ENDUSE,TECH,EC): Actual Production Capacity by TECH ($/YR) PER(ENDUSE,TECH,EC,YEAR): Process Energy Requirement (MBTU/YR) DST(ENDUSE,EC,YEAR): Device Saturation (BTU/BTU OR J/J) PDIF(TECH,EC): Difference Between the Initial Process Efficiency for Each Fuel
FPC is allocated fractionally to sum to the initial production capacity (PCLVI (EUPC)):
First total actual production capacity is calculated by summing the actual production capacity across technologies:
TFPC(EU,EC)=SUM(TE)(FPC(EU,TE,EC))
The desired production capacity (FPCI) is derived from the initial production capacity (PCLVI) by splitting PCLVI by the ratio of a given technology’s production capacity to the total capacity (FPC/TFPC).
FPCI(EU,TE,EC)=SUM(A,ECC)(PCLVI(A,ECC)*ECCMAP(EC,ECC)) * FPC(EU,TE,EC)/TFPC(EU,EC)
where: FPCI(ENDUSE,TECH,EC): Desired Production Capacity by TECH ($/YR) PCLVI(AGE,ECC): Initial. Production Capacity ($/YR) FPC(ENDUSE,TECH,EC): Actual Production Capacity by TECH ($/YR) TFPC(ENDUSE,EC): Total Production Capacity by TECH ($/YR)
Calculate Process Efficiency
Average process efficiency is calculated by multiplying the production capacity by the device saturation and dividing by the energy requirements:
PEEA=FPCI*DST/PER
where: FPCI(ENDUSE,TECH,EC): Desired Production Capacity by TECH ($/YR) PER(ENDUSE,TECH,EC,YEAR): Process Energy Requirement (MBTU/YR) DST(ENDUSE,EC,YEAR): Device Saturation (BTU/BTU OR J/J) PEEA(ENDUSE,TECH,EC,YEAR): Average Process Efficiency ($/BTU or $/J)
The following insures an non-zero value of PEEA for non-use modes:
For each TECH where PEEA is greater than zero, calculate a new PEEA (DLOC2): DLOC2(EU)=MIN(TE)(PEEA(EU,TE,EC))
PEEA now has a “floor” of at least DLOC2:
Systematic Solutions, Inc. 74 Policy Assessment Corp.

ENERGY 2020 Demand Sector
PEEA=XMAX(DLOC2,PEEA)
For the initial year the average efficiency is also the marginal efficiency: PEE=PEEA
Split Capital Stock by Age
This routine uses the market share for each age category (PCERF) to split the capital stock (FPCI) into capital stock by age and fuel (EUPCI) for each end-use
The first step is to renormalize PCERF to be consistent with PCGRF.
Rename the fraction of energy requirement by fuel to be before modification: PCERFI=PCERF
Develop a weighted sum of PCERF (LOC3): LOC3(A,EC) = SUM(TE)(SUM(F,ECC)(PCERF(F,A,ECC) * ECCMAP(EC,ECC) * FTMAP(F,TE)) *
FPCI(EU,TE,EC))/SUM(TE)(FPCI(EU,TE,EC))
Scale to match PCERG (growth rate): PCERF(F,A,ECC)=PCERF(F,A,ECC)*PCGRF(A,ECC)/LOC3(A,EC)
Move residual to next AGE group (AGENEXT). Since AGENEXT is defined as AGE:S-1, this moves the residual into the MID category from the OLD category so that it works with large negative growth:
PCERF(F,AGENEXT,ECC)=PCERF(F,AGENEXT,ECC)+PCERFI(F,A,ECC)-PCERF(F,A,ECC) PCERF(F,AGENEXT,ECC)=XMAX(PCERF(F,AGENEXT,ECC),0.001)
Normalize PCERF to sum to 1.0: LOC4(F,ECC)=SUM(A)(PCERF(F,A,ECC)) PCERF=PCERF/LOC4
where: PCGRF(AGE,ECC): 'Fraction of Energy Requirement by AGE PCERF(FUEL,AGE,ECC): Fraction of Energy Requirement by AGE and Fuel PCERFI(FUEL,AGE,ECC): PCERF before modification FPCI(ENDUSE,TECH,EC): Desired Production Capacity by TECH ($/YR) PCERG(FUEL,ECC): Energy Requirement Growth Rate (1/YR)
Production capacity by end-use (EUPC) is then the sum over fuel and economic subclass of the product of the fraction of energy requirement by AGE and FUEL and the desired production capacity. PCERF is by ECC which is mapped into EC by the ECCMAP. PERCF is also by FUEL which is mapped into TECH with the FTMAP. The desired production capacity is allocated by technology, age and economic class in EUPC.
EUPC(EU,TE,A,EC)=SUM(F,ECC)(PCERF(F,A,ECC)*ECCMAP(EC,ECC)* FTMAP(F,TE))/SUM(ECC)(ECCMAP(EC,ECC))*FPCI(EU,TE,EC)
where: EUPC(ENDUSE,TECH,AGE,EC,YEAR): Production Capacity by End-use (M$/YR) PCERF(FUEL,AGE,ECC): Fraction of Energy Requirement by AGE and Fuel
Systematic Solutions, Inc. 75 Policy Assessment Corp.

ENERGY 2020 Demand Sector
PCERFI(FUEL,AGE,ECC): PCERF before modification FPCI(ENDUSE,TECH,EC): Desired Production Capacity by TECH ($/YR)
Cooling to Heating Efficiency Ratio
If there is no HEAT, skip the following equation for CHR. The cooling to heating efficiency ratio is the ratio of the heating
CHR(EC) = (SUM(TE)(PEE(HEAT,TE,EC) * PER(HEAT,TE,EC))/SUM(TE)(PER(HEAT,TE,EC))) / (SUM(TE)(PEE(AC,TE,EC) * PER(AC,TE,EC))/SUM(TE)(PER(AC,TE,EC)))
where: CHR(TECH,EC,YEAR): Cooling to Heating Ratio (BTU/BTU or J/J) PEE(ENDUSE,TECH,EC,YEAR): Marginal Process Efficiency ($/BTU or $/J) PER(ENDUSE,TECH,EC,YEAR): Process Energy Requirement (MBTU/YR)
Initialize Average Budget AB=ECFP/INFLA*DST/(PEEA*DEEA)
where: AB(ENDUSE,TECH,EC,YEAR): Average Budget ($spent on energy/$total dollars), DEEA(ENDUSE,TECH,EC,YEAR): Average Device Efficiency (BTU/BTU OR J/J) DST(ENDUSE,EC,YEAR): Device Saturation (BTU/BTU OR J/J) ECFP(TECH,EC,YEAR): Fuel Price ($/MBTU or $/GJ) INFLA(YEAR): Inflation Index ($/$) PEEA(ENDUSE,TECH,EC,YEAR): Average Process Efficiency ($/BTU or $/J)
Initialize Cogeneration CGDMD=XCGDMD CGUMS(TE,EC)=1.0 CGGC(TE,EC) = CGDMD(TE,EC)/SUM(ECC)(ECUF(ECC) *
ECCMAP(EC,ECC))/CGCUFP(EC)/CGHRT(TE)/8760*1E9 CGVF=XCGVF
where: CGDMD(TECH,EC,YEAR): Cogeneration Energy Demand (TBTU/YR OR GJ/YR) CGUMS(TECH,EC,YEAR): Cogeneration Utilization Multiplier (BTU/BTU or J/J) CGGC(TECH,EC,YEAR): Cogeneration Generation Capacity (MW) CGVF(TECH,EC): Cogeneration Variance Factor ($/$) CGCUFP(TECH,EC,YEAR): Normal Cogeneration Capacity Utilization Factor (BTU/BTU or J/J) CGHRT(TECH): Cogeneration Heat Rate (BTU/KWH or J/KWH) XCGDMD(TECH,EC,YEAR): Exogenous Cogeneration (TBTU/YR or PJ/YR) XCGVF(TECH,EC): Cogeneration. Variance Factor ($/$)
PROCEDURE CONSTANT This procedure derives the Consumer Preference Efficiency and Capital Cost Curves
The capital cost and fuel cost coefficients (DCTC,DFTC) are computed as well as DEET, DEE, PEM, PCCRN, DCCN, DFPN, MCFU, POCF, PEET, PCCT, CIF, LIN, PCCN, PCTC, PFPN, PFTC, DCC, and DCCT
Systematic Solutions, Inc. 76 Policy Assessment Corp.

ENERGY 2020 Demand Sector
Device Efficiency Trade-off Curve Coefficients
Capital Cost Coefficient DCTC=-1/((ECFP/INFLA/DEE)/((DCCRN+DOCF)*XDCC)*(1-DEE/DEM))
where: DCTC(ENDUSE,TECH,EC): Device Cap. Trade Off Coefficient (DLESS) DEE(ENDUSE,TECH,EC,YEAR): Device Efficiency (BTU/BTU OR J/J) DEM(ENDUSE,TECH,EC): Maximum Device Efficiency (BTU/BTU OR J/J) DCCRN(ENDUSE,TECH,EC,ZERO): Device Capital Charge Rate (($/YR)/$) DOCF(ENDUSE,TECH,EC): Device Operating Cost Fraction (($/YR)/$) ECFP(TECH,EC,YEAR): Fuel Price ($/MBTU or $/GJ) INFLA(YEAR): Inflation Index ($/$) XDCC(ENDUSE,TECH,EC,YEAR): Device Capital Cost ($/(MBTU/YR): or $/(GJ/YR))
Fuel Cost Coefficient DFTC=DCTC/(1-DCTC)
where: DFTC(ENDUSE,TECH,EC): Device Fuel Trade Off Coefficient (DLESS) DCTC(ENDUSE,TECH,EC): Device Cap. Trade Off Coefficient (DLESS)
Normal Capital Cost DCCN=XDCC/(DEM/DEE-1)**(1/DCTC)
where: DCCN(ENDUSE,TECH,EC): Normalized Device Capital Cost ($/MBTU) DCTC(ENDUSE,TECH,EC): Device Cap. Trade Off Coefficient (DLESS) DEE(ENDUSE,TECH,EC,YEAR): Device Efficiency (BTU/BTU OR J/J) DEM(ENDUSE,TECH,EC): Maximum Device Efficiency (BTU/BTU OR J/J) XDCC(ENDUSE,TECH,EC,YEAR): Device Capital Cost ($/(MBTU/YR): or $/(GJ/YR))
Normal Fuel Cost DFPN=-(DOCF+DCCRN)*DCCN*DEM/DCTC
where: DFPN(ENDUSE,TECH,EC): Normalized Fuel Price ($/MBTU) DCCN(ENDUSE,TECH,EC): Normalized Device Capital Cost ($/MBTU) DCTC(ENDUSE,TECH,EC): Device Cap. Trade Off Coefficient (DLESS) DEM(ENDUSE,TECH,EC): Maximum Device Efficiency (BTU/BTU OR J/J) DCCRN(ENDUSE,TECH,EC,ZERO): Device Capital Charge Rate (($/YR)/$) DOCF(ENDUSE,TECH,EC): Device Operating Cost Fraction (($/YR)/$)
Efficiency Curve DEET=DEM/(1+(DPRICE/DFPN)**DFTC) DEET(EFFI:M,EU,TE)=DEM(EU,TE,EC)
where: DEET(ENDUSE,EFFI,TECH,EC): Price Vs Efficiency Table (BTU/BTU OR J/J) DFPN(ENDUSE,TECH,EC): Normalized Fuel Price ($/MBTU) DEM(ENDUSE,TECH,EC): Maximum Device Efficiency (BTU/BTU OR J/J)
Systematic Solutions, Inc. 77 Policy Assessment Corp.
ENERGY 2020 Demand Sector
DFTC(ENDUSE,TECH,EC): Device Fuel Trade Off Coefficient (DLESS) DPRICE(EFFI,TECH): Energy Price Dimension for Efficiency and Capital Cost Curves ($/MBTU)
Capital Cost Curve DCCT=DCCN*(DPRICE/DFPN)**(DFTC/DCTC)
where: DCCT(ENDUSE,EFFI,TECH,EC): Price Vs Capital Cost Table ($/MBTU or $/GJ ) DCCN(ENDUSE,TECH,EC): Normalized Device Capital Cost ($/MBTU) DCTC(ENDUSE,TECH,EC): Device Cap. Trade Off Coefficient (DLESS) DFPN(ENDUSE,TECH,EC): Normalized Fuel Price ($/MBTU) DFTC(ENDUSE,TECH,EC): Device Fuel Trade Off Coefficient (DLESS) DPRICE(EFFI,TECH): Energy Price Dimension for Efficiency and Capital Cost Curves ($/MBTU)
Device Efficiency
Using the price vs. efficiency table (DEET) DEE=DTABPE(ECFP/INFLA)
where: DEE(ENDUSE,TECH,EC,YEAR): Device Efficiency (BTU/BTU OR J/J) ECFP(TECH,EC,YEAR): Fuel Price ($/MBTU or $/GJ) INFLA(YEAR): Inflation Index ($/$) DEET(ENDUSE,EFFI,TECH,EC): Price Vs Efficiency Table (BTU/BTU OR J/J)
Capital Cost
Using the price vs. capital cost table (DCCT): DCC=DTABEC(DEE)*INFLA
where: DCC(ENDUSE,TECH,EC,YEAR): Device Capital Cost ($/(MBTU/YR) or $/(GJ/YR)) DEE(ENDUSE,TECH,EC,YEAR): Device Efficiency (BTU/BTU OR J/J) DCCT(ENDUSE,EFFI,TECH,EC): Price Vs Capital Cost Table ($/MBTU or $/GJ )
Process Efficiency Trade-off Curve Coefficients
Cost of Using a Device MCFU=(DCCRN+DOCF)*DCC+ECFP/DEE
where: MCFU(ENDUSE,TECH,EC,YEAR): Marginal Cost of Fuel Use ($/MBTU or $/GJ) DCC(ENDUSE,TECH,EC,YEAR): Device Capital Cost ($/(MBTU/YR) or $/(GJ/YR)) DEE(ENDUSE,TECH,EC,YEAR): Device Efficiency (BTU/BTU OR J/J) DCCRN(ENDUSE,TECH,EC,ZERO): Device Capital Charge Rate (($/YR)/$) DOCF(ENDUSE,TECH,EC): Device Operating Cost Fraction (($/YR)/$) ECFP(TECH,EC,YEAR): Fuel Price ($/MBTU or $/GJ)
Systematic Solutions, Inc. 78 Policy Assessment Corp.

ENERGY 2020 Demand Sector
Capital Charge Rate PCCRN = (1-PIVTC/(1+ROIN+0+INSM)-TXRT * (2/PETL)/(ROIN+0+INSM+2/PETL)) * (ROIN+0)/(1-
(1/(1+ROIN+0))**PEPL)/(1-TXRT)
where: PCCRN(ENDUSE): Process Capital Charge Rate PIVTC(TECH,YEAR): Process Capital Investment Tax Credit ($/$) PEPL(ENDUSE,TECH,EC): Physical Life of Process Capital (YRS) PETL(ENDUSE,TECH,EC): Process Capital Tax Life (YRS) INSM(YEAR): Smoothed Inflation Rate (($/YR)/$) ROIN(EC): Return on Investment (($/YR)/$) TXRT(EC,YEAR): Tax Rate on Energy Consumer ($/$)
Operating Cost Factor POCF=(INFLA-MCFU/1000000/PEEA)/XPCC-PCCRN
where: POCF(ENDUSE,TECH,EC): Process Operating Cost Fraction (($/YR)/$) PCCRN(ENDUSE): Process Capital Charge Rate MCFU(ENDUSE,TECH,EC,YEAR): Marginal Cost of Fuel Use ($/MBTU or $/GJ) INFLA(YEAR): Inflation Index ($/$) PEEA(ENDUSE,TECH,EC,YEAR): Average Process Efficiency ($/BTU or $/J) XPCC(ENDUSE,TECH,EC,YEAR): Process Capital Cost ($/($/YR))
Maximum Process Efficiency
Maximum Process Efficiency is based on the highest fuel. PEM(EU,EC)=MAX(TECH)(PEEA(EU,TECH,EC)*PEMX(EU,TECH,EC))
where: PEM(ENDUSE,EC): Maximum Process Efficiency ($/MBTU or $/GJ) PEMX(ENDUSE,TECH,EC): Initial Capital Output Energy Efficiency Maximum Multiplier (DLESS) PEEA(ENDUSE,TECH,EC,YEAR): Average Process Efficiency ($/BTU or $/J)
Process Fuel and Capital Cost Coefficients PCTC = -1/((MCFU/1000000/PEEA)/((PCCRN+POCF)*XPCC) * (1-PEEA/PEM)) PFTC = PCTC/(1-PCTC)
where: PCTC(ENDUSE,TECH,EC): Process Capital Capacity Trade Off Coefficient (DLESS) PFTC(ENDUSE,TECH,EC): Process Fuel Trade Off Coefficient POCF(ENDUSE,TECH,EC): Process Operating Cost Fraction (($/YR)/$) PCCRN(ENDUSE): Process Capital Charge Rate MCFU(ENDUSE,TECH,EC,YEAR): Marginal Cost of Fuel Use ($/MBTU or $/GJ) PEEA(ENDUSE,TECH,EC,YEAR): Average Process Efficiency ($/BTU or $/J) XPCC(ENDUSE,TECH,EC,YEAR): Process Capital Cost ($/($/YR)) PEM(ENDUSE,EC): Maximum Process Efficiency ($/MBTU or $/GJ) PEMX(ENDUSE,TECH,EC): Initial Capital Output Energy Efficiency Maximum Multiplier (DLESS)
Systematic Solutions, Inc. 79 Policy Assessment Corp.
ENERGY 2020 Demand Sector
Process Normal Fuel Cost PFPN=-(PCCRN+POCF)*XPCC*PEM*1000000/(PCTC*(PEM/PEE-1)**(1/PCTC))
where: PFPN(ENDUSE,TECH,EC): Process Normalized Fuel Price ($/MBTU) PCTC(ENDUSE,TECH,EC): Process Capital Capacity Trade Off Coefficient (DLESS) POCF(ENDUSE,TECH,EC): Process Operating Cost Fraction (($/YR)/$) PCCRN(ENDUSE): Process Capital Charge Rate XPCC(ENDUSE,TECH,EC,YEAR): Process Capital Cost ($/($/YR)) PEM(ENDUSE,EC): Maximum Process Efficiency ($/MBTU or $/GJ) PEE(ENDUSE,TECH,EC,YEAR): Marginal Process Efficiency ($/BTU or $/J)
Normal Process Capital Cost
For Process Heat Only: PCCN=0
otherwise: PCCN=XPCC/(PEM/PEE-1)**(1/PCTC)
where: PCCN(ENDUSE,TECH,EC): Normalized Process Capital Cost ($/MBTU or $/GJ) PCTC(ENDUSE,TECH,EC): Process Capital Capacity Trade Off Coefficient (DLESS) PCCRN(ENDUSE): Process Capital Charge Rate XPCC(ENDUSE,TECH,EC,YEAR): Process Capital Cost ($/($/YR)) PEM(ENDUSE,EC): Maximum Process Efficiency ($/MBTU or $/GJ) PEE(ENDUSE,TECH,EC,YEAR): Marginal Process Efficiency ($/BTU or $/J)
Efficiency Curve (Only if Device Exists - XDCC) PEET=PEM/(1+(CPRICE/PFPN)**PFTC)*XDCC/XDCC
where: PEET(EFFI,ENDUSE,TECH,EC): Process Efficiency Table (BTU/BTU OR J/J) PFPN(ENDUSE,TECH,EC): Process Normalized Fuel Price ($/MBTU) PFTC(ENDUSE,TECH,EC): Process Fuel Trade Off Coefficient CPRICE(EFFI,TECH): Energy Price Dimension for Efficiency and Capital Cost Curves ($/MBTU) XDCC(ENDUSE,TECH,EC,YEAR): Device Capital Cost ($/(MBTU/YR) or $/(GJ/YR)) PEM(ENDUSE,EC): Maximum Process Efficiency ($/MBTU or $/GJ)
Capital Cost Curve DO EC PCCT=XPCC
where: PCCT(EFFI,ENDUSE,TECH,EC): Process Capital Cost Table ($/MBTU or $/GJ) XPCC(ENDUSE,TECH,EC,YEAR): Process Capital Cost ($/($/YR))
If there is no HEAT, skip the following equation for PCCT PCCT=PCCN*(CPRICE/PFPN)**(PFTC/PCTC)
where:
Systematic Solutions, Inc. 80 Policy Assessment Corp.

ENERGY 2020 Demand Sector
PCCT(EFFI,ENDUSE,TECH,EC): Process Capital Cost Table ($/MBTU or $/GJ) PCCN(ENDUSE,TECH,EC): Normalized Process Capital Cost ($/MBTU or $/GJ) PFPN(ENDUSE,TECH,EC): Process Normalized Fuel Price ($/MBTU) PCTC(ENDUSE,TECH,EC): Process Capital Capacity Trade Off Coefficient (DLESS) PFTC(ENDUSE,TECH,EC): Process Fuel Trade Off Coefficient CPRICE(EFFI,TECH): Energy Price Dimension for Efficiency and Capital Cost Curves ($/MBTU)
Cross Impact Factor LIN=(1/DEE-1/DEM)/PEE CIF(EU,CEU,TE)=LIN(CEU,TE,EC)*CIM(EU,CEU,TE)/LIN(EU,TE,EC)
where: CIF(ENDUSE,CENDUSE,TECH,EC): Cross-Impact Factor (BTU/BTU or J/J) PEE(ENDUSE,TECH,EC,YEAR): Marginal Process Efficiency ($/BTU or $/J) DEE(ENDUSE,TECH,EC,YEAR): Device Efficiency (BTU/BTU OR J/J) DEM(ENDUSE,TECH,EC): Maximum Device Efficiency (BTU/BTU OR J/J) CIM(ENDUSE,CENDUSE,TECH): Cross-Impact Multiplier (BTU/BTU)
PROCEDURE POLLUTION This procedure initializes the pollution variables ACPOL (accumulated energy sector pollution), CGPOCA and CGPOE (cogeneration embodied and average pollution), and POCA and POEM (embodied and average pollution).
Embodied Pollution from Cogeneration
The average pollution coefficient is set equal to the exogenous value: CGPOCA=CGPOCX
The average coefficient is used to determine the initial level of embodied pollution. Cogeneration pollution levels are a function of the amount of cogeneration capacity (CGGC) multiplied by the heat rate (CGHRT) and further modified by a utilization factor (CGCUFP) yielding energy production (in TBTU) that is then multiplied by the average pollution coefficient (TONS?TBTU). The embodied pollution (CGPOE) is in TONS:
CGPOE(F,EC,P) = CGGC(TE,EC) * CGHRT(TE) * CGCUFP(EC) * 8760/1E9 * CGPOCA(F,EC,P)
where: CGPOCA(TECH,EC,POLL,YEAR): Cogeneration Average Pollution Coefficient (TONS/TBTU or
TONS/PJ) CGPOCX(TECH,EC,POLL,YEAR): Cogeneration Pollution Coefficient (TONS/TBTU or TONS/PJ) CGPOE(TECH,EC,POLL,YEAR): Cogeneration Embodied Pollution (TONS) CGCUFP(TECH,EC,YEAR): Normal Cogeneration Capacity Utilization Factor (BTU/BTU or J/J) CGGC(TECH,EC,YEAR): Cogeneration Generation Capacity (MW) CGHRT(TECH): Cogeneration Heat Rate (BTU/KWH or J/KWH)
Systematic Solutions, Inc. 81 Policy Assessment Corp.

ENERGY 2020 Demand Sector
Embodied Pollution
The average pollution coefficient is set equal to the exogenous marginal value: POCA=POCX
The average coefficient is used to determine the initial level of embodied pollution. Pollution levels are a function of the amount of the device energy requirements multiplied by the average pollution coefficient (TONS/TBTU). The embodied pollution (POEM) is in TONS:
POEM(TE,EC,P)=SUM(EU)(DER(EU,TE,EC))*POCA(TE,EC,P)/1E6
An exogenous energy growth rate is mapped to the correct ECs: PCERG1(TE,EC)=SUM(F,EC)(PCERG(F,ECC)*ECCMAP(EC,ECC)*FTMAP(F,TE))
Accumulated Energy Sector Pollution is the sum of the total sector pollutants (POCA*DMD) modified by an energy growth rate and pollution lifetimes.
ACPOL(P) = SUM(EC,EU,TE)(POCA(TE,EC,P) * DMD(EU,TE,EC)/(XMAX(0,PCERG1(TE,EC)) + 1/GHGCL(P)))
where: ACPOL(POLL): Accumulated Energy Sector Pollution (TONS/YR), DER(ENDUSE,TECH,EC,YEAR): Device Energy Requirement (MBTU/YR OR GJ/YR) DMD(ENDUSE,TECH,EC,YEAR): Total Energy Demand (TBTU/YR OR PJ/YEAR) GHGCL(POLL): 'Green House Gas Emissions Chemical Lifetime (YR), PCERG(FUEL,ECC): Energy Requirement Growth Rate (1/YR) PCERG1(TECH,EC): 'Energy Requirement Growth Rate (1/YR) POCA(TECH,EC POLL,YEAR): Average Pollution Coefficients (TONS/TBTU or TONNES/PJ) POCX(TECH,EC POLL,YEAR): Marginal Pollution Coefficients (TONS/TBTU or TONNES/PJ)
POEM(TECH,EC POLL,YEAR): Embodied Pollution
Systematic Solutions, Inc. 82 Policy Assessment Corp.

ENERGY 2020 Demand Sector
—A— AB, 45, 46, 73, 77 ADCCST, 18, 19, 36 ADDCST, 12, 13, 29, 40, 44, 45 —B— BAT, 46 BDCCU, 42, 44 BDER, 42, 43, 44 BE, 46 BM, 2, 3, 41, 44, 46 BMM, 44 BMSF, 37, 42, 43 BMSM0, 43 BMSM1, 43 BMT, 42 BPL, 41, 42, 44 BTL, 41, 42 BVF, 43 —C— CCSALES, 4, 69 CDUC, 4, 68 CERSM, 47, 60, 61 CGAT, 51, 52, 53 CGBL, 49, 50 CGCC, 49, 50 CGCR, 3, 49, 51, 52, 56, 57 CGCUF, 53 CGCUFP, 50, 53, 56, 57, 77, 82 CGDC, 50 CGDM, 49 CGDMD, 3, 49, 53, 54, 57, 58, 66, 68, 69,
73, 77 CGDMSW, 49 CGEC, 53, 54, 67 CGFP, 4, 5, 51, 52, 64 CGFP0, 5, 51 CGGC, 49, 51, 52, 53, 57, 73, 77, 82 CGHRT, 50, 52, 53, 54, 56, 57, 66, 77, 82 CGIGC, 52 CGIVTC, 49, 50
INDEX CGLOAD, 54 CGMAP, 66 CGMCE, 50, 51 CGMCE0, 51 CGMSF, 51, 52 CGMSM0, 50, 51 CGMSMI, 50, 51 CGMSMM, 51 CGOF, 50 CGPL, 51 CGPOCA, 57, 58, 82 CGPOCS, 56, 57 CGPOCX, 56, 57, 82 CGPOE, 57, 82 CGPOL, 57, 58 CGPOT, 3, 49, 51, 52 CGR, 51, 52, 57 CGRESI, 49 CGRISK, 49, 50 CGSCM, 52, 53 CGTL, 49, 50 CGUMS, 53, 73, 77 CGVC, 50, 52 CGVCSW, 50 CGVF, 51, 73, 77 CHR, 15, 18, 73, 76 CHRM, 15, 18 CIF, 20, 77, 81 CLDC, 4, 65, 66 CMSF, 26, 27, 28, 29 CMSM0, 26 CMSMI, 26 CONADM, 13, 19, 29, 36, 40, 45 CONCAP, 12, 18, 28, 36, 40, 59 CONEXP, 13, 19, 29, 36, 40, 44, 59 CPRICE, 33, 70, 72, 73, 81 CROIN, 9, 16, 31 CUF, 47, 60 CVF, 26, 27 —D— DAYS, 69 DCC, 2, 5, 6, 7, 8, 9, 10, 11, 12, 21, 37, 40,
42, 59, 60, 62, 71, 77, 79
Systematic Solutions, Inc. 83 Policy Assessment Corp.

ENERGY 2020 Demand Sector
DCC1, 21 DCCM, 7, 10, 12, 28, 40, 61 DCCP, 12, 40, 59, 60, 61, 62, 63 DCCR, 2, 5, 6, 8, 9, 11, 12, 13, 21, 26, 27,
37, 41, 61, 71 DCCR1, 21 DCCRN, 11, 70, 71, 72, 77, 78, 79 DCCRU, 9, 10, 11, 37, 61 DCCT, 6, 77, 78, 79 DCCU, 10, 11, 12, 13, 37, 40, 60, 61, 62, 63 DCMM, 7, 11 DCTC, 77, 78 DDM, 47, 73 DEE, 2, 5, 7, 8, 9, 10, 11, 12, 13, 14, 19, 25,
27, 28, 29, 30, 37, 39, 40, 59, 61, 71, 72, 73, 74, 77, 78, 79, 81
DEEA, 25, 27, 28, 29, 30, 35, 36, 37, 39, 42, 45, 46, 54, 60, 61, 73, 74, 77
DEEP, 10, 11, 60, 61 DEER, 2, 10, 11, 12, 13, 29, 40, 59, 60, 62 DEET, 6, 77, 78, 79 DEM, 19, 77, 78, 81, 82 DEMM, 7, 10, 11, 19 DER, 1, 3, 23, 25, 40, 41, 42, 43, 44, 46, 47,
51, 55, 73, 74, 82, 83 DER1, 52, 56 DERA, 12, 13, 25, 28, 29, 30, 39, 40, 41, 59,
61 DERA1, 55, 56 DERC, 27, 28 DESTD, 7 DESTDP, 7 DFTC, 77, 78 DIVTC, 5, 6, 9, 41, 42, 71 DMD, 4, 5, 46, 47, 48, 54, 58, 64, 65, 66,
67, 68, 69, 73, 82, 83 DMDES, 3, 54 DOCF, 8, 10, 11, 59, 62, 72, 77, 78, 79 DPIVTC, 9 DPKM, 68 DPL, 25, 71 DPLN, 5, 6, 9, 63, 64 DPRICE, 70, 71, 78, 79 DRISK, 5, 6, 9, 41, 42, 71 DST, 22, 23, 24, 45, 46, 60, 61, 73, 74, 75,
77
DST0, 22, 23 DSTI, 22, 23 DSTL, 24 DSTM, 22, 23 DSTP, 22, 23 DTL, 5, 6, 9, 41, 63, 71 DUCFSW, 68 DUF, 68 —E— ECD, 3, 54, 55 ECDUC, 68, 69 ECFP, 4, 5, 7, 8, 11, 12, 14, 37, 42, 45, 48,
50, 55, 61, 70, 71, 72, 77, 79 ECFP0, 5, 10, 48 ECFP0SM, 5 ECFPSM, 4, 5, 70 ECLDC, 4, 65, 66, 67 ECOST, 3, 54, 55 ECOSTS, 3, 54, 55 ECSALES, 4, 66, 67 ECUF, 5, 73, 77 EECONV, 50, 54, 65, 67 EIM, 20 ELAS, 63 ENMSM, 4 ESALES, 4, 66, 67 EUPC, 3, 23, 24, 27, 28, 40, 41, 46, 61, 73,
74, 76 EUPCA, 23, 24, 28, 41 EUPCR, 23, 24, 27, 41 EX, 60, 62 —F— FDCC, 26, 27 FDCCU, 26, 27, 28, 29 FDMD, 48, 49 FDMDES, 48, 49 FMAX, 48 FMSF, 48 FMSM0, 48 FMSMI, 48 FP, 4, 5, 70 FP0, 5 FSDMD, 3, 47, 48, 54, 68, 69 FSPEE, 47 FVF, 48
Systematic Solutions, Inc. 84 Policy Assessment Corp.

ENERGY 2020 Demand Sector
—G— GECONV, 68, 69 GSALES, 4, 69 —H— HOURS, 67 HPEE, 15, 18 HPER, 15, 18 HPKM, 65 —I— IBM, 42, 43 INC, 59 INFLA, 7, 10, 11, 12, 14, 15, 17, 18, 20, 21,
22, 23, 26, 27, 29, 31, 32, 33, 34, 37, 40, 41, 45, 48, 50, 58, 59, 60, 61, 62, 63, 64, 77, 79, 80
INFLA0, 20, 21, 26, 27, 48 INSM, 5, 6, 9, 13, 14, 16, 30, 31, 41, 42, 49,
50, 63, 71, 79 —J— JDA, 21 —L— LI, 19, 20 LIN, 19, 77, 81 LMCAP, 64, 65 LMDCC, 64 LMDCCP, 64 LMDCCR, 63, 64 LMDIVTC, 63 LMDRISK, 63 LMEVF, 64 LMEXP, 64, 65 LMFP, 64 LMIC, 64 LMIMS, 64 LMLSFR, 64, 65 LMMS, 64, 65 LMMSM, 64 LMOCF, 64, 65 LMRT, 64 LMVF, 64 LSF, 64, 65, 66 —M— MCFU, 1, 2, 4, 5, 8, 12, 13, 14, 19, 20, 21,
22, 23, 26, 31, 32, 33, 34, 72, 73, 77, 79,
MCFU0, 20, 21, 22, 23, 26 MCFU1, 21, 55 MECFP, 7, 10, 11 MMSF, 2, 8, 12, 20, 21, 22, 23, 24 MMSF1, 22 MMSM0, 20, 21 MMSMI, 20, 21 MSMM, 20, 21 MVAU, 35, 38, 43 MVDR, 37, 38 MVDR0, 37, 38 MVDU, 42, 43 MVDU0, 43 MVF, 20, 21 MVPR, 34, 35 MVPR0, 34, 35 MVR, 38, 39 MVR0, 38, 39 —O— OM, 59 —P— PC, 5 PC0, 5 PCA, 23, 24 PCC, 2, 13, 15, 16, 17, 18, 31, 59, 60, 61, 62 PCCM, 16, 18, 61, 62 PCCMM, 15, 17 PCCP, 18, 59, 60, 61, 62 PCCR, 2, 13, 16, 18, 31, 33, 61 PCCRN, 77, 79, 80, 81 PCCRU, 16, 61 PCCT, 14, 77, 81 PCCU, 16, 18, 19, 34, 36, 60, 61, 62 PCPL, 23 PCTC, 77, 80, 81 PEE, 1, 2, 8, 12, 13, 14, 15, 16, 17, 18, 19,
20, 21, 22, 23, 24, 25, 26, 30, 59, 61, 73, 75, 76, 80, 81
PEE0, 20, 21, 22, 23 PEE01, 21 PEE1, 21 PEEA, 24, 25, 26, 27, 28, 30, 32, 33, 34, 35,
41, 42, 45, 46, 60, 61, 73, 75, 77, 80 PEEP, 17, 18, 60, 61 PEER, 2, 17, 18, 19, 59, 60, 61, 62 PEET, 14, 77, 81
Systematic Solutions, Inc. 85 Policy Assessment Corp.
80
ENERGY 2020 Demand Sector
PEM, 32, 33, 34, 77, 80, 81 PEMM, 14, 15, 17, 18, 34 PEMX, 32, 80 PEPL, 25, 79 PEPLN, 13, 14, 16, 31 PER, 1, 3, 15, 18, 23, 25, 39, 40, 41, 46, 59,
60, 61, 62, 73, 74, 75, 76 PER1, 55 PERA, 18, 19, 24, 25, 26, 27, 39, 41, 59, 61 PESTD, 14, 17 PESTDP, 14, 17 PETL, 13, 14, 16, 30, 31, 79 PFTC, 77, 80, 81 PIVTC, 13, 14, 16, 30, 31, 79 POCA, 56, 58, 82, 83 POCF, 32, 33, 59, 60, 62, 77, 80 POCS, 55 POCST, 58 POCSTR, 58 POCX, 55, 56, 82, 83 POEM, 56, 82, 83 POP, 5 POP0, 5, 48 PPIVTC, 16, 31 —R— RDCCU, 37, 40, 61, 62 RDMSF, 37, 38, 39, 40, 59, 60, 61, 62 RDMSM0, 37, 38 RDMSMI, 38 RDVF, 37, 38 RMSF, 38, 39, 40 RMSM0, 38 RMSMI, 38 ROIN, 5, 6, 9, 13, 14, 16, 30, 31, 41, 42, 49,
50, 63, 71, 79 RPCC, 32, 34, 36, 59, 60, 62, 63 RPCCT, 33, 34 RPCCU, 34, 36, 61, 62, 63 RPEE, 31, 32, 33, 34, 35 RPEET, 33, 34 RPMSF, 34, 35, 36, 59, 60, 61, 62 RPMSM0, 34, 35 RPMSMI, 34, 35 RPVF, 34, 35 —S— SALES, 4, 66, 67, 69
SEB, 3, 54, 55 SMCFU, 21, 22 SMCFU0, 21, 22 SMSF, 22 SMSM0, 21 SMSMI, 21 SPOP, 5, 20, 21, 22, 23, 26, 27, 35, 38, 39,
43, 48 SPOP0, 5, 20, 21, 22, 23, 26, 27, 35, 38, 39,
43, 48 STCO, 5, 20, 21, 22, 23, 26, 35, 38, 43, 47,
48, 51, 55 STCO0, 5, 20, 21, 22, 23, 26, 35, 38, 43, 48,
51 STX, 7, 8, 10, 11, 15, 17, 18 SVF, 21 —T— TENMSM, 4, 20, 21, 22, 50, 51 TFPOL, 58 TOM, 59, 62 TOU, 63, 65 TOUFR, 63 TOURATIO, 63 TRPC, 58 TSLDC, 66 TSLOAD, 47, 65, 66, 68, 69, 73 TSPOL, 58 TXRT, 5, 6, 9, 13, 14, 16, 30, 31, 41, 42, 49,
50, 63, 71, 79 —U— UEX, 62 UINC, 61 UMEA, 61 UMS, 46, 47 UOM, 62 URV, 61 —W— WCUF, 5, 47, 53, 73 —X— XCCMS, 69 XCGDMD, 53, 54, 77 XCGMSF, 51 XDCC, 72, 77, 78, 81 XDEE, 71 XDMD, 47, 73
Systematic Solutions, Inc. 86 Policy Assessment Corp.
ENERGY 2020 Demand Sector
XFMSF, 48 XFSDMD, 47, 48 XLMCAP, 64, 65 XLMEXP, 65
XLMMS, 65 XPCC, 80, 81 XRMSF, 39 XRPMSF, 35
Systematic Solutions, Inc. 87 Policy Assessment Corp.