energetic particle measurements in the vicinity of dione ... dione... · energetic particle...
TRANSCRIPT
Icarus 226 (2013) 617–628
Contents lists available at SciVerse ScienceDirect
Icarus
journal homepage: www.elsevier .com/locate / icarus
Energetic particle measurements in the vicinity of Dione duringthe three Cassini encounters 2005–2011
0019-1035/$ - see front matter � 2013 Elsevier Inc. All rights reserved.http://dx.doi.org/10.1016/j.icarus.2013.06.007
⇑ Corresponding author.E-mail address: [email protected] (N. Krupp).
N. Krupp a,⇑, E. Roussos a, H. Kriegel c, P. Kollmann d, M.G. Kivelson f, A. Kotova a,b, C. Paranicas d,D.G. Mitchell d, S.M. Krimigis d,e, K.K. Khurana f
a Max-Planck-Institut für Sonnensystemforschung, Max-Planck-Str. 2, 37191 Katlenburg-Lindau, Germanyb Université de Toulouse, UPS-OMP, IRAP, Toulouse, Francec Institute for Theoretical Physics, TU Braunschweig, Germanyd The Johns Hopkins University Applied Physics Laboratory, 11100 Johns Hopkins Road, Laurel, MD 20723-6099, USAe Office of Space Research and Technology, Academy of Athens, Athens, Greecef Institute of Geophysics and Planetary Science, University of California Los Angeles, 3845 Slichter Hall, Los Angeles, CA 90095-1567, USA
a r t i c l e i n f o a b s t r a c t
Article history:Received 10 February 2013Revised 26 May 2013Accepted 1 June 2013Available online 26 June 2013
Keywords:Saturn, MagnetosphereSaturn, SatellitesMagnetospheres
The Cassini spacecraft encountered the moon Dione three times between 2005 and 2011. During the fly-bys particles and fields measurements have been performed and used to study the magnetospheric inter-action between the fourth largest moon in the saturnian system and the surrounding magnetosphericplasma. Here we present the results of the Low Energy Magnetospheric Measurement System (LEMMS),part of the Magnetospheric Imaging Instrument MIMI, measuring energetic ions and electrons above20 keV up to several MeV and results from the magnetometer instrument (MAG) onboard the spacecraft.The trapped particles in the vicinity of Dione bounce and drift in Saturn’s magnetosphere and eventuallyare lost onto the surface of the moon. The location and depth of the absorption signature depends on spe-cies, their energy and on the geometry of the flyby. Only for the upstream flyby D1 were energy-depen-dent ion absorption signatures measured and we conclude that protons present in the upstream regioncan explain the observed dropout features. The other two encounters D2 and D3 went through the moon’sgeometrical wake. During each of the encounters we observed absorption signatures in the fluxes of elec-trons caused by losses of those particles onto the moon during their drift motion in the saturnian mag-netosphere. The profile of these absorption signatures is energy dependent, and becomes asymmetricbetween the planetward and anti-planetward sectors of the moon’s wake at energies above about100 keV. We compare these electron wake profiles with ones resulting from electron guiding center tra-jectory tracings in a simulated environment of Dione’s magnetospheric interaction using the ‘‘Adaptivehybrid model for space plasma simulations (A.I.K.E.F.)’’. Our results indicate that the magnetic and elec-tric field perturbations in Dione’s interaction region, as well as magnetospheric diffusion need to be takeninto account in order to explain the features of the energetic electron data at different energies.
� 2013 Elsevier Inc. All rights reserved.
1. Introduction
The third largest icy satellite of Saturn after Rhea and Iapetus isDione with a radius RDi of about 561.5 km orbiting the ring planetat a distance of about 6.28 Saturn radii RS (1RS = 60,268 km). Dioneis embedded in the E-ring and neutral torus mainly consisting ofwater molecules and related water products, oxygen, and dustoriginating from the Enceladus plumes. The upper limits of watervapor production from sputtering have been calculated to be atleast 100 times less compared to Enceladus’ plumes (Burattiet al., 2011). Those values are similar to those for Rhea (Pitman
et al., 2008). So far no active plume regions have been found onDione by analyzing infrared data and imaging data onboard thespacecraft. However, evidence and prediction of atmospheresaround Saturn’s bigger icy moons was shown in Saur and Strobel(2005). Especially for Dione it was suggested that the moon maybe embedded in a gas envelope. Simon et al. (2011) reported a ten-uous atmosphere around Dione from weak field perturbations up-stream of the moon during the first close Dione flyby D1. Inaddition asymmetry between the magnetic field signals in the Sat-urn-facing versus Saturn-averted side have been identified. How-ever, during the second close flyby D2 no clear evidence of anatmosphere could be identified in the magnetic field data mostprobably because the trajectory passed downstream of the moon.Additionally the Kronian magnetosphere was rather disturbed atthat time resulting in higher particles fluxes. Tokar et al. (2012)

Table 1Characteristic particle parameters in the vicinity of Dione for particles with pitchangles of 45�.
Keplerian velocity 10 km/s
Electrons 10 keV 100 keV 1000 keV
Bounce period 22 s 8 s 4 sRelative drift velocity 39 km/s 31 km/s 20 km/sEquatorial gyroradius 3 km 10 km 42 km
Resonant energy 600 keV
Protons 10 keV 100 keV 1000 keV
Bounce period 1920 s 609 s 192 sRelative drift velocity (assuming 0.8�vcorotation)
40 km/s 48 km/s 130 km/s
Equatorial gyroradius 126 km 400 km 1265 km
618 N. Krupp et al. / Icarus 226 (2013) 617–628
reported the detection of exospheric molecular Oþ2 pick-up ions ob-tained during flyby D2 as the first evidence of a neutral exospherearound Dione. Those measurements are based on low-energy (eV–keV-range) plasma data of the CAPS instrument onboard Cassini.Those observations put the limit of the neutral densities belowthe values mentioned by Simon et al. (2011).
The Kronian magnetosphere in the vicinity of Dione is very dy-namic. Roussos et al. (2008a) reported interplanetary events, e.g.coronal mass ejections hitting Saturn’s magnetosphere. Thoseevents sometimes even create an additional transient radiationbelt between the orbits of Dione and Tethys (inside of Dione’s or-bit) which disappears only after days or weeks. During these peri-ods higher fluxes of energetic particles in the vicinity of the mooncould increase the sputtering rates from the surface. Other pro-cesses, e.g. hot particles from the regions outside Dione’s orbitare injected into cold plasma between 4 and 10RS (Kennellyet al., 2013; Müller et al., 2010; Mauk et al., 2005; Hill et al.,2005) in combination with outward transport of cold plasma. Bothprocesses change the magnetospheric properties in the vicinity ofDione quite dramatically and influence the rates of the sputteredand backscattered particles from the surface as well as the numberof the implanted particles onto the surface.
The expected magnetospheric interaction between the driftingcharged particle population and the moon is sketched in Fig. 1.Shown is the moon in the center of a coordinate system where xpoints in the direction of corotation, y points towards Saturn andz northward. Upstream and downstream of the moon the expectedwake regions for different energies of the particles are drawn. Onthe left the x–z-plane is shown. Black lines identify the regionswhere strong currents perturb the field to form Alfvén-wings con-nected with the close vicinity of the moon slightly downstream ofthe plasma flow. Even a moon without an atmosphere (i.e. a purelyplasma-absorbing obstacle) generates an Alfvén-wing that ‘‘rides’’on its absorption wake. At Dione, however, this effect is weak sinceit is suppressed by the strong background magnetic field (details inSimon et al. (2012)). On the right of the sketch the x–y-plane isshown where the wake regions are sketched in the moon’s equato-rial plane. Due to the importance of the charge-dependent gradi-ent-curvature drift versus the charge-independent corotationalE!� B
!drift the wakes for electrons can be separated into a low-
energy wake and a high-energy wake with respect to the moon.The separation is at the so called resonant energy nicely described
Fig. 1. Schematic sketch of the magnetospheric plasma interaction with an icy moon ipointing in the corotation/low-energy plasma flow direction and z being the north–soequatorial plane of the moon with x corotation direction and y pointing towards Saturn
by van Allen et al. (1980) and by Thomsen and van Allen (1980).The resonance is that energy where the total electron drift velocityis equal to the Keplerian velocity of the moon.
Depletions of electrons at energies above the resonant energyare expected upstream while depletions of ions and electrons ofenergies below the resonant energy should be observed onlydownstream of the moon. The electron dropouts extend to higherlatitudes due to the rapid bounce motion of the particles. At the or-bit of Dione the resonant energy for electrons is 740 keV for 90�pitch angles and about 900 keV for pitch angles of 30� (from vanAllen et al. (1980)) assuming full corotation of the plasma and adipolar magnetic field. The values will be closer to 400 keV and600 keV, respectively, under the more realistic assumption of 70%of full corotation as discussed by Müller et al. (2010).
In this paper we present the energetic particle responses in thekeV to MeV range obtained by the MIMI/LEMMS instrument on-board Cassini during the three Dione flybys D1–D3 in combinationwith the magnetic field measurements of the MAG instrument. Weinterpret the data by using additional information from hybridcode simulations that model the vicinity of Dione in order to ex-plore the structure of the electron dropout regions in response tothe combined perturbations of electric and magnetic fields inDione’s wake. In addition the hybrid code results in this study willbe used as input for particle tracings. Below we list some of thecharacteristic particle parameters in the vicinity of Dione in Table 1for reference:
n a corotating magnetosphere. Left: plane perpendicular to moon’s equator with xuth direction, basically antiparallel to the nominal magnetic field direction; right:.

Table 2Subset of ion and electron channels of the MIMI/LEMMS instrument onboard Cassinimeasured with the low-energy LE or the high-energy HE detector head incident andthe energy range in keV.
Channel name Species Head Energy range(keV)
PHA A (63 channels) Ions LE 20–900PHA E and PHA F1 (126
channels)Electrons LE 20–1900
C0 Electrons LE 18–40C1 Electrons LE 27–48C3 Electrons LE 56–100C6 Electrons HE 265–550BE Electrons LE 1000–2568E0 Electrons HE 110–365E4 Electrons HE 790–4750E6 Electrons HE 1600–21,000G1 Penetrating
electronsOmnidirectional >1000
Table 3Summary of all three Dione flybys of Cassini in the time period between 2005 and 2011. Tithe encounter, and the dust ram velocity are listed.
Flyby Time Distance at CA (km)
D1 2005.284 17:52 498.5D2 2010.097 05:16 503D3 2011.346 09:39 98.8
Fig. 2. Energy spectrogram of pulseheight-analyzed (PHA) ions (upper) and electrons (mD1 as an example of the magnetospheric state in the vicinity of Dione. Energy (in keV) incperformed by detector A, the electron measurements are made in two energy ranges (radifferent geometric factors and sensitivity to penetrating radiation belt particles, whichbetween the two ranges in the spectrograms. Color-coded is the measured differential intangle of the MIMI/LEMMS low-energy head as a function of time. Sharp changes in thvertical lines White vertical lines indicate the time of closest approach to the moon (D1), tthis particular orbit. (For interpretation of the references to color in this figure legend, t
N. Krupp et al. / Icarus 226 (2013) 617–628 619
2. MIMI/LEMMS and MAG data description
In this study we used data of the Magnetospheric ImagingInstrument (MIMI) and data from the magnetometer instrument(MAG), both onboard the Cassini spacecraft. MIMI consists of threesensors (CHEMS, INCA, and LEMMS) able to measure charge statesof ions, energetic neutral atoms, and energetic electrons and ions.In this analysis we concentrated mainly on data from the LowEnergy Magnetospheric Measurement System (LEMMS). MIMI/LEMMS is a charged particle spectrometer with two oppositelydirected instrument heads. The low-energy head LE measureslow-energy particles and the high-energy head HE is used tomeasure high-energy particles. Electrons and ions entering theinstrument through LE are separated by a strong internal magnetand detected by a set of semiconductor detectors at different loca-tions inside the aperture. In HE a stack of 4 semiconductor detec-tors are used for the analysis. Electronic coincidence criteria
me (year, day of the year, UT), distance of closest approach (CA) as well as the type of
Type Dust ram velocity (km/s)
Upstream south 9.1Downstream equatorial 8.4Downstream equatorial 8.7
iddle) as a function of time measured by the MIMI/LEMMS instrument during flybyreases upward for ions and downward for electrons. While all ion measurements arenge 1 and range 2) with two separate detectors E and F1. These two detectors haveis why close to the planet or in locations of low signal to noise a step is observedensity of the particles on the same scale. The lower panel shows the measured pitch
e measured pitch angle caused by spacecraft reorientations are marked by orangehe time of the crossing of Saturn’s ring plane (Ring CRX) and the time of periapsis forhe reader is referred to the web version of this article.)

620 N. Krupp et al. / Icarus 226 (2013) 617–628
between the various detectors are used in both ends to identify theenergy (for HE also the determination between ions and electronsare performed) of the incoming particle. MIMI/LEMMS is mountedon a rotating platform to allow a better pitch angle coverage. After2005 day 32, however, the platform ceased to rotate and thereafterthe two heads point in two oppositely directed positions (two pitchangles) in the spacecraft coordinate system. The time resolution ofMIMI/LEMMS is 5.65 s. We only looked at a subset of energetic par-ticle channels from MIMI/LEMMS representative for low-energy(keV) and high-energy (MeV) measurements from the two differ-ent heads (LE and HE) listed in Table 2. PHA-channels are pulse-height-analyzed data where the voltage signal created inside asingle detector is directly related to its initial energy. All otherchannels (A, B, E, and C channels) are so called rate channels wherethe signals of a combination of energy losses in the detectors areused to calculate the initial energy of the incidenting particle. Inaddition we used channel G1 which is an omnidirectional rate
Fig. 3. Cassini trajectory of Dione flybys D1, D2, D3 projected into the yx (top) and yz (direction of the corotating plasma; y towards Saturn and z northward (DIIS-system). Theinstrument along the trajectory is color-coded. Black arrows indicate the direction of motfigure legend, the reader is referred to the web version of this article.)
channel for background measurements. The MIMI instrument isdescribed in detail in Krimigis et al. (2004) with some updateson the energy channel bandwidth described in Krupp et al. (2009).
The MAG instrument consists of three perpendicular flux gatemagnetometers on the Cassini magnetometer boom, described indetail in Dougherty et al. (2004).
We used in this study data from three flybys at the moon Dione(±10 min around the closest approach to the moon) recorded in2005, 2010 and 2011. The exact times of closest approach andthe flyby distances are listed in Table 3.
3. Energetic particle measurements during the Dione flybys D1,D2, and D3 of the Cassini spacecraft
Fig. 2 gives an overview of the magnetospheric state duringflyby D1, typical for all three Dione encounters. The figure shows
bottom) planes of a moon-centered coordinate system where x points in the flowintensity of electrons in channel C3 (56–100 keV) as measured by the MIMI/LEMMSion of Cassini in the DIIS-system. (For interpretation of the references to color in this

N. Krupp et al. / Icarus 226 (2013) 617–628 621
an energy spectrogram of ions in the upper panel and the same forelectrons in two separate energy ranges in the lower panel as afunction of time. Color-coded is the measured differential inten-sity. The closest approach at Dione is marked by a solid line (D1).For reference the crossings of the ring plane (Ring CRX) and thetime of periapsis are also marked by solid lines. The time-dispersedsignatures in ion and electron spectrograms where particles withdifferent energies arrive to Cassini at different times is a strongindication of ongoing injection events as described in Section 1.Injection features like this are very common in all of the Cassini or-bits and were visible as well during all three Dione encounters.This strengthens the argument that in the vicinity of Dione the Kro-nian magnetosphere is very disturbed and highly dynamic. Abruptchanges in the differential intensities at all energies are due tospacecraft reorientations. The lower panel of Fig. 2 shows how sen-sitively the distributions depend on the measurable pitch anglerange of the instrument. As can be seen, ion fluxes between 5and 9RS) are greatly diminished due to charge exchange losses inthe neutral cloud in this region. Considerable foreground in theMIMI/LEMMS ion channels at Dione may be observed only duringepisodic events, such as large scale injections or the presence of theDione belt, as discussed earlier. On the other hand, energetic elec-trons are constantly present at Dione’s distance, although they arealso diminished due to losses in the neutral cloud relative to mag-netospheric fluxes outside the cloud.
Fig. 3 shows the flyby geometry during the three close encoun-ters of Cassini with Dione. Upstream (negative x) and down-stream (positive x) of the moon means that the spacecraft wasin front or behind the moon with respect to the low-energy coro-tational flow. The size of the moon itself determines the size ofthe flux tube which is that region where geometrically the mag-netic field lines are connected to the moon’s surface along thez-direction. Flyby D1 was upstream but still inside the Dione fluxtube and slightly south of the moon’s equatorial plane while
Fig. 4. Energetic electron measurements of the MIMI/LEMMS instrument and magneticsystem) of the MAG instrument both onboard the Cassini spacecraft during the three Dionlocal time LT. In addition to the data the local pitch angle and the dust ram angle are plochannels and their energy passbands are noted on the right hand side. The plot format icount rate of the G1 channel is about 20 times above its instrumental background, indicateach MIMI/LEMMS channel. For flyby D1 the diameter of the moon is marked by dashed
flybys D2 and D3 were downstream close to the equator. Duringthe second flyby D2 Cassini crossed the corotational wake at adistance of 503 km and at about 98.8 km during D3. The flybydirections are indicated by the black arrows. Color-coded alongthe tracks is the intensity of the measured electrons in channelC3 (56–100 keV). Fig. 4 gives a summary of the energetic electronresponses as measured by the MIMI/LEMMS instrument and themagnetic field components measured by MAG during the threeencounters. During flyby D1 (left panel of Fig. 4) upstream ofthe moon an absorption signature across the full diameter ofthe moon is observed in the intensities of electrons measuredin channels E6, and BE with energies above the resonant energy(�400–600 keV). For those energies the overall motion of the azi-muthally drifting electrons is upstream from the moon oppositeto the low-energy corotational flow direction. Channel E0 (mea-suring nominally electrons of 110–365 keV below the resonantenergies) also responded to electrons with higher energies abovethe resonant energy (similar to E6 and BE), indicative of penetrat-ing high-energy electrons in the vicinity of Dione. In addition adeeper absorption is observed near closest approach, possiblycoming from the low energy electrons channel to which E0 is de-signed to respond. Dropout signatures in the lower-energy chan-nels C1 and C3 are observed with a width of about half a moon’sdiameter. Both MIMI/LEMMS detector heads looked at particleswith pitch angle of about 90�. As shown in Fig. 3 Cassini remainedwithin �1RDi < x < 0 during the encounter so that Dione’s volumeonly partially absorbed those low-energy electrons resulting in asmaller absorption signature. Essentially this means that the low-energy wake begins already, at least partially, to fill in atx = �1RDi. The omnidirectional channel G1 also showed a smalldecrease with the same width as in the E0 and E6 and BE chan-nels. For the G1 channel a decrease of the fluxes is only expectedupstream of the moon where penetrating MeV electrons are ab-sent because they have been absorbed by the moon.
field measurements (KSO-coordinates where B/ = Bx,Br = �By,Bh = �Bz in the DIIS-e flybys D1, D2, D3 between 2005 and 2011 as a function of time, L-shell and Saturn
tted. Time of closest approach is marked by a black solid line. The selected electrons identical to the plots of the Enceladus flybys published in Krupp et al. (2012). Theing a low level of penetrating radiation belt noise is contributing to the total signal of
lines.

622 N. Krupp et al. / Icarus 226 (2013) 617–628
The overall intensities in the vicinity of Dione were nearly oneorder of magnitude higher in the low-energy channels during D2compared to D3 and D1 most probably because an injection eventwas going on during the time of the flyby and possibly because thisflyby occurred only few weeks after an intensification of the Dionebelt, which was present continuously in the second half of 2005(Roussos et al., 2008a). During flybys D2 and D3 (middle and rightpanel of Fig. 4) Cassini was downstream in the corotational low-energy wake of the moon. Absorption signatures in the low-energyelectron channels were observed as expected. However, the loca-tion of the maximum depletion is dependent on electron energyand/or geometry of the flyby. We observed the deepest absorptionafter closest approach (CA) for flyby D2 and before CA in the case ofD3. Both minima occurred on the Saturn-facing side of the wake.The higher-energy electron channels E6 and BE during flyby D2only showed some small-scale dropouts which should be relatedto wake signatures, and G1 hardly varied at all. The data of themagnetometer instrument during the flybys D1 and D2 are alreadywell described by Simon et al. (2011). For flybys D2 and D3 the
Fig. 5. Color-coded intensity-energy spectrogram as a function of y (positive y points towflyby D1. Dotted white lines show the width of Dione. The sloping white line should guidion data. (For interpretation of the references to color in this figure legend, the reader i
main feature in the magnetic field data is the enhancement ofthe Bh-component in the corotational wake to compensate for thelower particle pressure there. The interpretation and influence ofthe moon in the magnetic field data is difficult to interpret becauseof the ongoing strong injection event during flyby D2. During D3 anadditional unexpected spike in the B/-component was observed onday 346 in 2011 at about 09:40:30 which is not yet understood.Measurements of the magnetic field components during flybysD2 and D3 showed more variability compared to flyby D1 (see alsoFig. 9 where the spike is better visible in the B/-component).
In the following we show the high-resolution pulseheight-ana-lyzed PHA energy spectrograms for electrons and ions as a functionof distance y from Dione in Figs. 5–7 to better illustrate the absorp-tion features with respect to the moon. The advantage of pulse-height-analyzed PHA energy spectrograms with respect to therate data shown in Fig. 4 is their higher energy resolution. Theupper and middle panels show electron spectrograms for detectorsE and F1 separately where the energy is shown on the y-axis andthe intensity is shown in color. The lower panel shows the ion
ards Saturn) for electrons (upper two panels) and ions (lower panel) during Dionee the eye to the energy/distance (gyroradius)-dependent absorption signature in thes referred to the web version of this article.)

N. Krupp et al. / Icarus 226 (2013) 617–628 623
spectrogram for detector A in the same format. Dotted white linesmark y = ±1RDi, and solid white lines mark y = 0. The responses dur-ing flyby D1 are shown in detail in Fig. 5. The absorption signaturesof electrons are symmetric around y = 0. Above an energy of about60 keV the width of the signature is exactly the moon diameter. Be-low that energy the dropout is smaller and has a width of about0.35 Dione moon diameters. An additional interesting feature isvisible in the ion energy spectrogram where the width of theabsorption signature is energy dependent. Ions with higher ener-gies and therefore with larger gyroradii are lost onto the moon ear-lier during the inbound pass and with decreasing distance to themoon more and more lower energy ions are also lost resulting ina energy dependent absorption pattern. To guide the eye a whiteline marks the trend of the decrease of ion flux on the anti-Saturnportion of the pass.
We also noticed that the dropout signature in the ion flux dis-appears at higher energies when Cassini is closer to the moon thanabout 2RDi. One possibility to explain that is that since the ions
Fig. 6. Color-coded intensity-energy spectrogram as a function of y (positive y points towflyby D2. The abrupt color change in the ion spectrogram at about �3RDi is real and couldwhite lines show the width of Dione. (For interpretation of the references to color in th
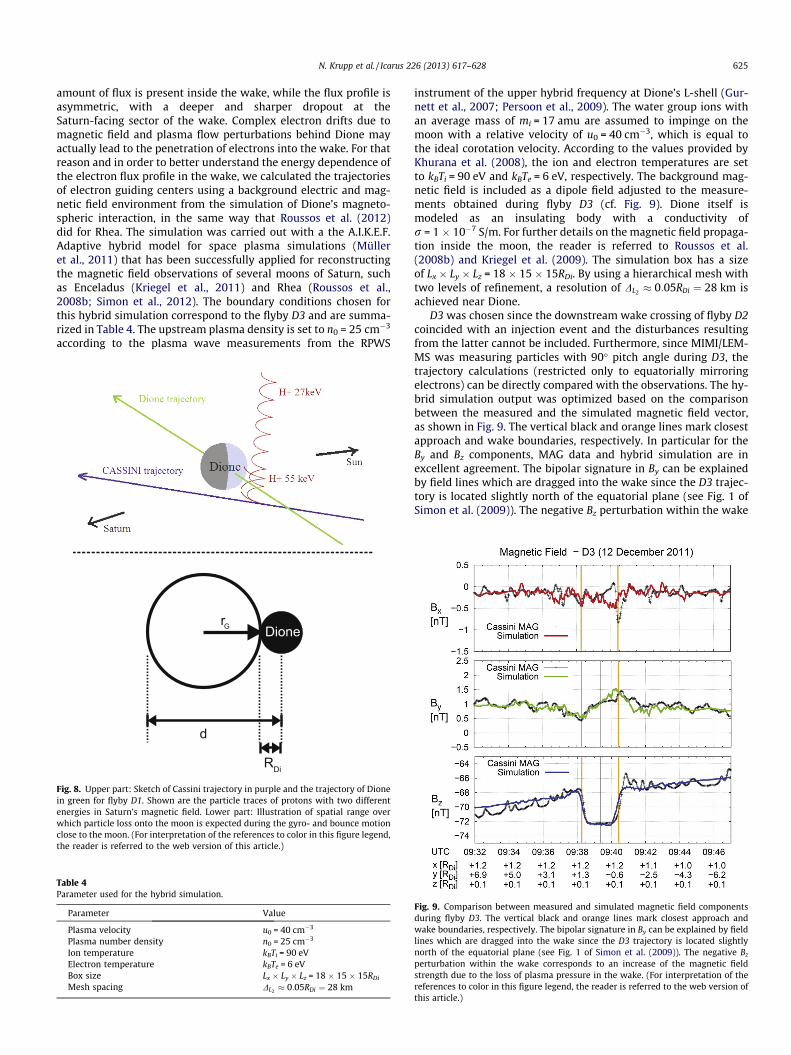
measured by MIMI/LEMMS have gyroradii comparable or biggerthan Dione, their depletion is strongly dependent on Cassini’s loca-tion, given that MIMI/LEMMS observes only at one pitch angle andgyrophase. Fig. 8 shows a result of particle tracing simulations ofprotons spiraling along magnetic field lines during flyby D1. Thespiraling trajectories of protons for two different energies beforethey are lost onto the moon are shown. Absorption can occur ifthe guiding center position of the ion is within one gyroradius rG
(rG ¼ mvqB with q: particle charge, m: particle mass, v: particle
velocity, B: magnetic field strength) from the moon’s surface. Theparticle’s velocity can be associated to the measured total kinetic,non-relativistic energy by E ¼ mv2
2 . Although MIMI/LEMMScannmot distinguish different ion species, by combining these rela-tions we can calculate the mass of the particles responsible for the
ion depletion m ¼ q2B2r2G
2E
� �from the y-distance at which the deple-
tion begins. As sketched in the lower section of Fig. 8 the maximumdistance from the center of the moon where ion absorption is
ards Saturn) for electrons (upper two panels) and ions (lower panel) during Dionebe related to injection events but the signature is not yet fully understood. Dotted
is figure legend, the reader is referred to the web version of this article.)

624 N. Krupp et al. / Icarus 226 (2013) 617–628
observed and is equal to d = 2rG + rDi. This maximum distance canbe extracted directly from the observations and means that the ab-
sorbed particle has had a gyroradius rG ¼ d�rDi2 . It appears that pro-
tons alone can explain the ion dropout signatures seen in Fig. 5.Heavier ions in the vicinity of Dione are less abundant, even inthe ongoing injections, as measured by the MIMI/CHEMS sensor(Hamilton, private communications). Similar features in MIMI/LEMMS data near the moon Rhea show different results becausemore oxygen and water group ions are present further out in themagnetosphere. This will be discussed in detail in a paper by Kot-ova et al. (in preparation).
Figs. 6 and 7 show the detailed measurements for the twodownstream wake encounters. No signatures are seen in the ionspectrograms (lower panel) in the immediate vicinity of Dione.During flyby D3 MIMI/LEMMS the low-energy head LE was lookinginto the Sun direction shortly after closest approach causing somelight contamination in the ion data measured with detector A.Electron spectrograms (upper and middle panels) show the
Fig. 7. Color-coded intensity-energy spectrogram as a function of y (positive y points towflyby D3. Dotted white lines show the width of Dione. (For interpretation of the referenarticle.)
absorption inside the wake of Dione. The higher background inten-sities during D2 are due to an ongoing injection event at the time ofthe flyby. Flyby D3 was closer to Dione than flyby D2 causing amore symmetric and deeper absorption feature for the lower en-ergy range (middle panel) measured in detector E. For higher ener-gies the absorption feature appears more asymmetric and is deeperin the Saturn-facing (positive y) hemisphere for both flybys.
4. Hybrid simulation results
If only the magnetospheric electron drifts are considered, as dis-cussed in Section 1, the energetic electron flux profile in the wakeof Dione should correspond to a simple, rectangular-shaped signa-ture with a width approximately equal to Dione’s diameter andindependent of the electron energy, only being above or belowthe resonant energy. However, MIMI/LEMMS electron observationspresented in the previous section show that this is only true for therange below about 100–150 keV. At higher energies, a considerable
ards Saturn) for electrons (upper two panels) and ions (lower panel) during Dioneces to color in this figure legend, the reader is referred to the web version of this
N. Krupp et al. / Icarus 226 (2013) 617–628 625
amount of flux is present inside the wake, while the flux profile isasymmetric, with a deeper and sharper dropout at theSaturn-facing sector of the wake. Complex electron drifts due tomagnetic field and plasma flow perturbations behind Dione mayactually lead to the penetration of electrons into the wake. For thatreason and in order to better understand the energy dependence ofthe electron flux profile in the wake, we calculated the trajectoriesof electron guiding centers using a background electric and mag-netic field environment from the simulation of Dione’s magneto-spheric interaction, in the same way that Roussos et al. (2012)did for Rhea. The simulation was carried out with a the A.I.K.E.F.Adaptive hybrid model for space plasma simulations (Mülleret al., 2011) that has been successfully applied for reconstructingthe magnetic field observations of several moons of Saturn, suchas Enceladus (Kriegel et al., 2011) and Rhea (Roussos et al.,2008b; Simon et al., 2012). The boundary conditions chosen forthis hybrid simulation correspond to the flyby D3 and are summa-rized in Table 4. The upstream plasma density is set to n0 = 25 cm�3
according to the plasma wave measurements from the RPWS
Fig. 8. Upper part: Sketch of Cassini trajectory in purple and the trajectory of Dionein green for flyby D1. Shown are the particle traces of protons with two differentenergies in Saturn’s magnetic field. Lower part: Illustration of spatial range overwhich particle loss onto the moon is expected during the gyro- and bounce motionclose to the moon. (For interpretation of the references to color in this figure legend,the reader is referred to the web version of this article.)
Table 4Parameter used for the hybrid simulation.
Parameter Value
Plasma velocity u0 = 40 cm�3
Plasma number density n0 = 25 cm�3
Ion temperature kBTi = 90 eVElectron temperature kBTe = 6 eVBox size Lx � Ly � Lz = 18 � 15 � 15RDi
Mesh spacing DL2 � 0:05RDi ¼ 28 km
instrument of the upper hybrid frequency at Dione’s L-shell (Gur-nett et al., 2007; Persoon et al., 2009). The water group ions withan average mass of mi = 17 amu are assumed to impinge on themoon with a relative velocity of u0 = 40 cm�3, which is equal tothe ideal corotation velocity. According to the values provided byKhurana et al. (2008), the ion and electron temperatures are setto kBTi = 90 eV and kBTe = 6 eV, respectively. The background mag-netic field is included as a dipole field adjusted to the measure-ments obtained during flyby D3 (cf. Fig. 9). Dione itself ismodeled as an insulating body with a conductivity ofr = 1 � 10�7 S/m. For further details on the magnetic field propaga-tion inside the moon, the reader is referred to Roussos et al.(2008b) and Kriegel et al. (2009). The simulation box has a sizeof Lx � Ly � Lz = 18 � 15 � 15RDi. By using a hierarchical mesh withtwo levels of refinement, a resolution of DL2 � 0:05RDi ¼ 28 km isachieved near Dione.
D3 was chosen since the downstream wake crossing of flyby D2coincided with an injection event and the disturbances resultingfrom the latter cannot be included. Furthermore, since MIMI/LEM-MS was measuring particles with 90� pitch angle during D3, thetrajectory calculations (restricted only to equatorially mirroringelectrons) can be directly compared with the observations. The hy-brid simulation output was optimized based on the comparisonbetween the measured and the simulated magnetic field vector,as shown in Fig. 9. The vertical black and orange lines mark closestapproach and wake boundaries, respectively. In particular for theBy and Bz components, MAG data and hybrid simulation are inexcellent agreement. The bipolar signature in By can be explainedby field lines which are dragged into the wake since the D3 trajec-tory is located slightly north of the equatorial plane (see Fig. 1 ofSimon et al. (2009)). The negative Bz perturbation within the wake
Fig. 9. Comparison between measured and simulated magnetic field componentsduring flyby D3. The vertical black and orange lines mark closest approach andwake boundaries, respectively. The bipolar signature in By can be explained by fieldlines which are dragged into the wake since the D3 trajectory is located slightlynorth of the equatorial plane (see Fig. 1 of Simon et al. (2009)). The negative Bz
perturbation within the wake corresponds to an increase of the magnetic fieldstrength due to the loss of plasma pressure in the wake. (For interpretation of thereferences to color in this figure legend, the reader is referred to the web version ofthis article.)

626 N. Krupp et al. / Icarus 226 (2013) 617–628
corresponds to an increase of the magnetic field strength due to theloss of plasma pressure in the wake. It is worth pointing out thatthe MAG data clearly shows a field-aligned current signature(bipolar signature in Bx) at the edge of the Dione wake which isnot reproduced by the simulation. A reason for this might be thatthis current is obscured by the limited resolution of the model.
Several test particle tracings are shown in Fig. 10. Each panelshows 350 guiding center trajectories of electrons overlaid on acolor map of the magnetic field magnitude that is extracted fromthe hybrid simulation. The trajectories are representative for theinteraction region of any subsonic, plasma absorbing interactionand qualitatively similar to those calculated for Rhea’s interactionregion so we refer the reader to the work of Roussos et al. (2012)for a detailed explanation.
In brief, the most obvious trajectory perturbations are visible atthe wake flanks just behind Dione. The dominant drift componentdue to magnetic field perturbations at the saturnward sector of thewake is oriented along the corotation direction (as the strongestgradient of jBj is in the negative y-direction). Furthermore, as dem-onstrated in Roussos et al. (2008b), electric fields at this location ofthe wake enforce corotation even further. At the anti-saturnwardsector of the wake, the x-component of the magnetic and electricdrifts point opposite to corotation. As a result, electrons of a givenenergy spend more time in the anti-saturnward sector of Dione’swake compared to the Saturn-facing side and therefore electricfield perturbations that also tend to ‘‘push’’ particles inside thewake from both sides (Roussos et al., 2008b), will be more effectiveat the former location. This could explain the asymmetry observed
Fig. 10. Electron guiding center trajectories (white lines) in Dione’s interaction region fortotal magnetic field strength extracted from the hybrid code simulations of Dione’s magdisturbed even far away from Dione’s wake (e.g. at 2RDi < x < 4RDi and y � �2.5RDi). Theseoutput, which affects mostly high energy tracings due to the energy dependence of thelegend, the reader is referred to the web version of this article.)
in the flux profile of the wake, with a sharper wake boundary aty > 0 (for details see also Roussos et al. (2012)). Still, all trajectorytracings show that particle penetration does not occur into thewake. This is true also for higher energies, not shown in Fig. 10.The reasons that penetration does not occur, are different for thelow and the high energy electrons. For low energies (<100 keV),corotation dominates and moves all the electrons rapidly awayfrom regions where electric field disturbances may push them intothe wake. Access to the wake is forbidden also for the higher ener-gies, although the total drift velocity of these electron is muchslower than corotation and particles should be more sensitive tothese perturbations. The stronger magnetic field in the wake pre-vents electrons from accessing it, as these energetic electrons tendto move on curves of equal jBj. Magnetic field magnitude dropoutsat the two sides of the wake lead to the appearance of forbiddenregions for the same reason. Particle flux there should be low,but relevant flux dropouts are not clearly observed in the data.
A possibility to explain discrepancies with the data is discussedin Roussos et al. (2012): particle diffusion may play a role inpushing particles into the wake or the forbidden regions at thewake sides, since diffusion leads naturally to smearing of fluxinhomogeneities.
We made a series of particle tracings in which we included astochastic velocity component as a first empirical approach to sim-ulate diffusion. The inclusion of this component has also addi-tional, practical purposes: at high-energies (>100 keV) themagnetic drift velocity for each particle is very sensitive to residualmagnetic noise of the hybrid simulation output and particles may
four different particle energies. The background color map color corresponds to thenetospheric interactions. Notice that the electron trajectories appear in some casesdisturbances are due to residual static magnetic field noise in the hybrid simulationgradient drift velocity. (For interpretation of the references to color in this figure
N. Krupp et al. / Icarus 226 (2013) 617–628 627
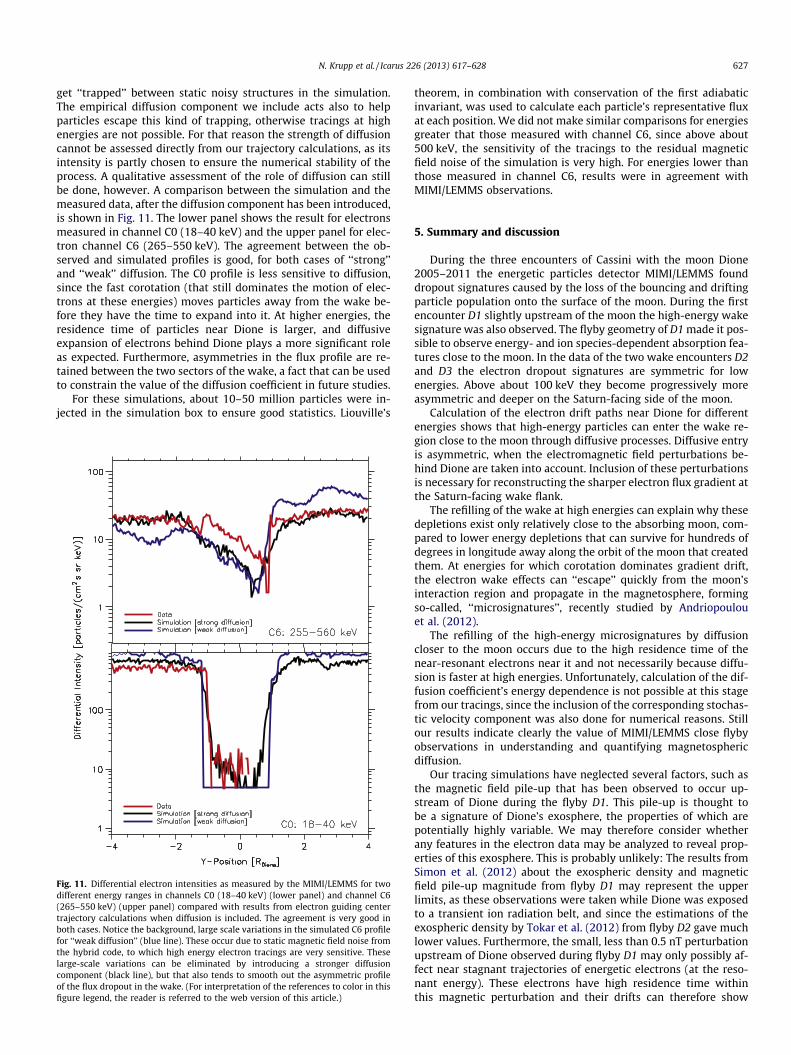
get ‘‘trapped’’ between static noisy structures in the simulation.The empirical diffusion component we include acts also to helpparticles escape this kind of trapping, otherwise tracings at highenergies are not possible. For that reason the strength of diffusioncannot be assessed directly from our trajectory calculations, as itsintensity is partly chosen to ensure the numerical stability of theprocess. A qualitative assessment of the role of diffusion can stillbe done, however. A comparison between the simulation and themeasured data, after the diffusion component has been introduced,is shown in Fig. 11. The lower panel shows the result for electronsmeasured in channel C0 (18–40 keV) and the upper panel for elec-tron channel C6 (265–550 keV). The agreement between the ob-served and simulated profiles is good, for both cases of ‘‘strong’’and ‘‘weak’’ diffusion. The C0 profile is less sensitive to diffusion,since the fast corotation (that still dominates the motion of elec-trons at these energies) moves particles away from the wake be-fore they have the time to expand into it. At higher energies, theresidence time of particles near Dione is larger, and diffusiveexpansion of electrons behind Dione plays a more significant roleas expected. Furthermore, asymmetries in the flux profile are re-tained between the two sectors of the wake, a fact that can be usedto constrain the value of the diffusion coefficient in future studies.
For these simulations, about 10–50 million particles were in-jected in the simulation box to ensure good statistics. Liouville’s
Fig. 11. Differential electron intensities as measured by the MIMI/LEMMS for twodifferent energy ranges in channels C0 (18–40 keV) (lower panel) and channel C6(265–550 keV) (upper panel) compared with results from electron guiding centertrajectory calculations when diffusion is included. The agreement is very good inboth cases. Notice the background, large scale variations in the simulated C6 profilefor ‘‘weak diffusion’’ (blue line). These occur due to static magnetic field noise fromthe hybrid code, to which high energy electron tracings are very sensitive. Theselarge-scale variations can be eliminated by introducing a stronger diffusioncomponent (black line), but that also tends to smooth out the asymmetric profileof the flux dropout in the wake. (For interpretation of the references to color in thisfigure legend, the reader is referred to the web version of this article.)
theorem, in combination with conservation of the first adiabaticinvariant, was used to calculate each particle’s representative fluxat each position. We did not make similar comparisons for energiesgreater that those measured with channel C6, since above about500 keV, the sensitivity of the tracings to the residual magneticfield noise of the simulation is very high. For energies lower thanthose measured in channel C6, results were in agreement withMIMI/LEMMS observations.
5. Summary and discussion
During the three encounters of Cassini with the moon Dione2005–2011 the energetic particles detector MIMI/LEMMS founddropout signatures caused by the loss of the bouncing and driftingparticle population onto the surface of the moon. During the firstencounter D1 slightly upstream of the moon the high-energy wakesignature was also observed. The flyby geometry of D1 made it pos-sible to observe energy- and ion species-dependent absorption fea-tures close to the moon. In the data of the two wake encounters D2and D3 the electron dropout signatures are symmetric for lowenergies. Above about 100 keV they become progressively moreasymmetric and deeper on the Saturn-facing side of the moon.
Calculation of the electron drift paths near Dione for differentenergies shows that high-energy particles can enter the wake re-gion close to the moon through diffusive processes. Diffusive entryis asymmetric, when the electromagnetic field perturbations be-hind Dione are taken into account. Inclusion of these perturbationsis necessary for reconstructing the sharper electron flux gradient atthe Saturn-facing wake flank.
The refilling of the wake at high energies can explain why thesedepletions exist only relatively close to the absorbing moon, com-pared to lower energy depletions that can survive for hundreds ofdegrees in longitude away along the orbit of the moon that createdthem. At energies for which corotation dominates gradient drift,the electron wake effects can ‘‘escape’’ quickly from the moon’sinteraction region and propagate in the magnetosphere, formingso-called, ‘‘microsignatures’’, recently studied by Andriopoulouet al. (2012).
The refilling of the high-energy microsignatures by diffusioncloser to the moon occurs due to the high residence time of thenear-resonant electrons near it and not necessarily because diffu-sion is faster at high energies. Unfortunately, calculation of the dif-fusion coefficient’s energy dependence is not possible at this stagefrom our tracings, since the inclusion of the corresponding stochas-tic velocity component was also done for numerical reasons. Stillour results indicate clearly the value of MIMI/LEMMS close flybyobservations in understanding and quantifying magnetosphericdiffusion.
Our tracing simulations have neglected several factors, such asthe magnetic field pile-up that has been observed to occur up-stream of Dione during the flyby D1. This pile-up is thought tobe a signature of Dione’s exosphere, the properties of which arepotentially highly variable. We may therefore consider whetherany features in the electron data may be analyzed to reveal prop-erties of this exosphere. This is probably unlikely: The results fromSimon et al. (2012) about the exospheric density and magneticfield pile-up magnitude from flyby D1 may represent the upperlimits, as these observations were taken while Dione was exposedto a transient ion radiation belt, and since the estimations of theexospheric density by Tokar et al. (2012) from flyby D2 gave muchlower values. Furthermore, the small, less than 0.5 nT perturbationupstream of Dione observed during flyby D1 may only possibly af-fect near stagnant trajectories of energetic electrons (at the reso-nant energy). These electrons have high residence time withinthis magnetic perturbation and their drifts can therefore show

628 N. Krupp et al. / Icarus 226 (2013) 617–628
higher sensitivity to the weak pile-up. However, this energy rangeis very narrow, and we do not expect that the overall picture in thedepletion profile (over a broader energy range) will change.
Deep microsignatures of Dione, seen very often during themoon’s L-shell crossing (Andriopoulou et al., 2012) indicate thatabsorption of energetic electrons at the LEMMS energy range is acontinuously dominant process, so treating the exospheric modeldensities by Simon et al. (2012) as upper limit is probably a goodestimate.
Acknowledgments
The German contribution of the MIMI/LEMMS Instrument wasin part financed by the German BMWi through the German SpaceAgency DLR under Contract 50 OH 1101 and by the Max PlanckSociety. ‘‘Gefördert von der Raumfahrt-Agentur des DeutschenZentrums für Luft- und Raumfahrt e.V. mit Mitteln des Bundesmin-isteriums für Wirtschaft und Technologie aufgrund eines Beschlus-ses des Deutschen Bundestages unter dem Förderkennzeichen 50OH 1101’’.
We thank Dr. Andreas Lagg (MPS) for extensive software sup-port, Martha Kusterer and Jon Vandegriff (both JHUAPL, USA) forreducing the MIMI data. Many thanks to Prof. Uwe Motschmann(TU Braunschweig, Germany) for providing the hybrid code. TheA.I.K.E.F. hybrid simulations were performed on the systems ofthe North-German Supercomputing Alliance (HLRN).
References
Andriopoulou, M., Roussos, E., Krupp, N., Paranicas, C., Thomsen, M., Krimigis, S.,Dougherty, M.K., Glassmeier, K.-H., 2012. A noon-to-midnight electric field andnightside dynamics in Saturn’s inner magnetosphere, using microsignatureobservations. Icarus 220 (August), 503–513.
Buratti, B.J., Faulk, S.P., Mosher, J., Baines, K.H., Brown, R.H., Clark, R.N., Nicholson,P.D., 2011. Search for and limits on plume activity on Mimas, Tethys, and Dionewith the Cassini Visual Infrared Mapping Spectrometer (VIMS). Icarus 214(August), 534–540.
Dougherty, M.K. et al., 2004. The Cassini magnetic field investigation. Space Sci. Rev.114 (September), 331–383.
Gurnett, D.A. et al., 2007. The variable rotation period of the inner region of Saturn’splasma disk. Science 316 (April), 442–445.
Hill, T.W. et al., 2005. Evidence for rotationally driven plasma transport in Saturn’smagnetosphere. Geophys. Res. Lett. 32 (June), L14S10.
Kennelly, T.J., Leisner, J.S., Hospodarsky, G.B., Gurnett, D.A., 2013. Ordering ofinjection events within saturnian SLS longitude and local time. J. Geophys. Res.118 (2), 832–838. http://dx.doi.org/10.1002/jgra.50152.
Khurana, K.K., Russell, C.T., Dougherty, M.K., 2008. Magnetic portraits of Tethys andRhea. Icarus 193 (February), 465–474.
Kriegel, H. et al., 2009. The plasma interaction of Enceladus: 3D hybrid simulationsand comparison with Cassini MAG data. Planet. Space Sci. 57 (December),2113–2122.
Kriegel, H. et al., 2011. Influence of negatively charged plume grains on thestructure of Enceladus’ Alfvén wings: Hybrid simulations versus Cassinimagnetometer data. J. Geophys. Res. (Space Phys.) 116 (October), 10223.
Krimigis, S.M. et al., 2004. Magnetosphere Imaging Instrument (MIMI) on theCassini Mission to Saturn/Titan. Space Sci. Rev. 114 (September), 233–329.
Krupp, N. et al., 2009. Energetic particles in Saturn’s magnetosphere during theCassini nominal mission (July 2004–July 2008). Planet. Space Sci. 57(December), 1754–1768.
Krupp, N., Roussos, E., Kollmann, P., Paranicas, C., Mitchell, D.G., Krimigis, S.M.,Rymer, A., Jones, G.H., Arridge, C.S., Armstrong, T.P., Khurana, K.K., 2012. TheCassini Enceladus encounters 2005–2010 in the view of energetic electronmeasurements. Icarus 218 (March), 433–447.
Mauk, B.H. et al., 2005. Energetic particle injections in Saturn’s magnetosphere.Geophys. Res. Lett. 32 (June), L14S05.
Müller, A.L., Saur, J., Krupp, N., Roussos, E., Mauk, B.H., Rymer, A.M., Mitchell, D.G.,Krimigs, S.M., 2010. Azimuthal plasma flow in the Kronian magnetosphere. J.Geophys. Res. (Space Phys.) 115 (August), A08203.
Müller, J., Simon, S., Motschmann, U., Schüle, J., Glassmeier, K.-H., Pringle, G.J., 2011.A.I.K.E.F.: Adaptive hybrid model for space plasma simulations. Comput. Phys.Commun. 182 (April), 946–966.
Persoon, A.M. et al., 2009. A diffusive equilibrium model for the plasma density inSaturn’s magnetosphere. J. Geophys. Res. 114 (April), A04211.
Pitman, K.M. et al., 2008. First high solar phase angle observations of Rhea usingCassini VIMS: Upper limits on water vapor and geologic activity. Astrophys. J.680 (June), L65–L68.
Roussos, E., Krupp, N., Armstrong, T.P., Paranicas, C., Mitchell, D.G., Krimigis, S.M.,Jones, G.H., Dialynas, K., Sergis, N., Hamilton, D.C., 2008a. Discovery of atransient radiation belt at Saturn. Geophys. Res. Lett. 35 (November), L22106.
Roussos, E. et al., 2008b. Plasma and fields in the wake of Rhea: 3-D hybridsimulation and comparison with Cassini data. Ann. Geophys. 26 (March), 619–637.
Roussos, E., Kollmann, P., Krupp, N., Paranicas, C., Krimigis, S.M., Mitchell, D.G.,Persoon, A.M., Gurnett, D.A., Kurth, W.S., Kriegel, H., Simon, S., Khurana, K.K.,Jones, G.H., Wahlund, J.-E., Holmberg, M.K.G., 2012. Energetic electronobservations of Rhea’s magnetospheric interaction. Icarus 221 (September),116–134.
Saur, J., Strobel, D.F., 2005. Atmospheres and plasma interactions at Saturn’s largestinner icy satellites. Appl. Phys. J. 620 (February), L115–L118.
Simon, S. et al., 2012. Analysis of Cassini magnetic field observations over the polesof Rhea. J. Geophys. Res. (Space Phys.) 117 (July), A07211.
Simon, S., Saur, J., Neubauer, F.M., Motschmann, U., Dougherty, M.K., 2009. Plasmawake of Tethys: Hybrid simulations versus Cassini MAG data. Geophys. Res.Lett. 36 (February), L04108.
Simon, S., Saur, J., Neubauer, F.M., Wennmacher, A., Dougherty, M.K., 2011.Magnetic signatures of a tenuous atmosphere at Dione. Geophys. Res. Lett. 38(August), L15102.
Thomsen, M.F., van Allen, J.A., 1980. Motion of trapped electrons and protons inSaturn’s inner magnetosphere. J. Geophys. Res. 85 (November), 5831–5834.
Tokar, R.L., Johnson, R.E., Thomsen, M.F., Sittler, E.C., Coates, A.J., Wilson, R.J., Crary,F.J., Young, D.T., Jones, G.H., 2012. Detection of exospheric Oþ2 at Saturn’s moonDione. Geophys. Res. Lett. 39 (February), L03105.
van Allen, J.A., Thomsen, M.F., Randall, B.A., 1980. The energetic charged particleabsorption signature of Mimas. J. Geophys. Res. 85 (November), 5709–5718.