enea 2016 q3 - financial results (english)
TRANSCRIPT
We are building an innovative raw materials and energy group capable of facing market challenges
10 November 2016
Q3, Q1-Q3 2016
2
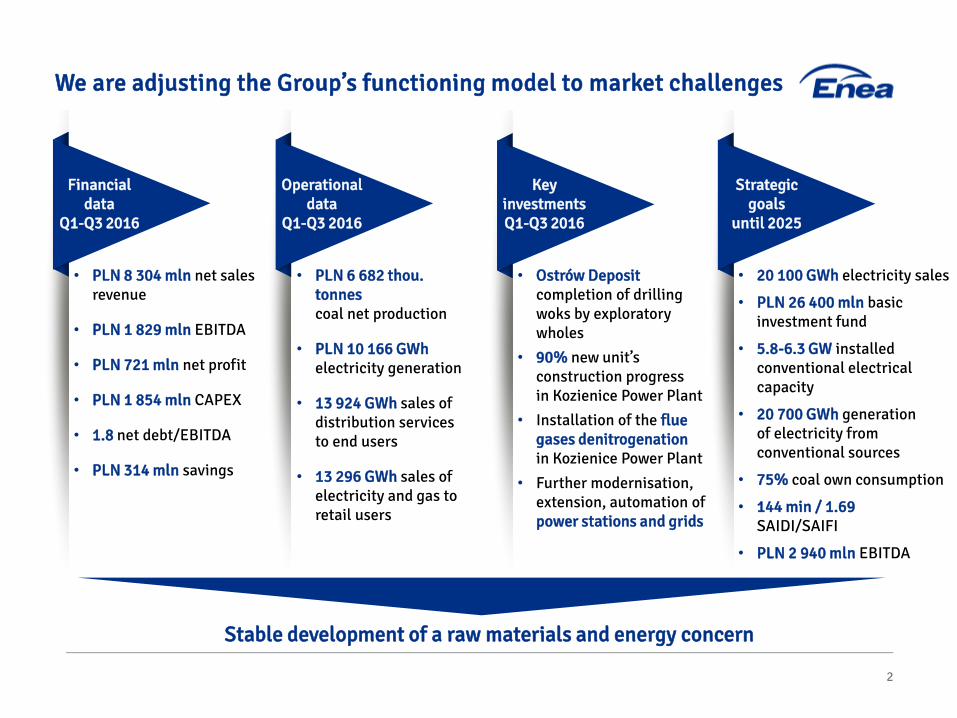
We are adjusting the Group’s functioning model to market challenges
Financial data
Q1-Q3 2016
Operational data
Q1-Q3 2016
Key investments Q1-Q3 2016
Strategic goals
until 2025
• PLN 8 304 mln net sales revenue
• PLN 1 829 mln EBITDA
• PLN 721 mln net profit
• PLN 1 854 mln CAPEX
• 1.8 net debt/EBITDA
• PLN 314 mln savings
• PLN 6 682 thou. tonnes coal net production
• PLN 10 166 GWh electricity generation
• 13 924 GWh sales of distribution services to end users
• 13 296 GWh sales of electricity and gas to retail users
• Ostrów Deposit completion of drilling woks by exploratory wholes
• 90% new unit’s construction progress in Kozienice Power Plant
• Installation of the flue gases denitrogenation in Kozienice Power Plant
• Further modernisation, extension, automation of power stations and grids
• 20 100 GWh electricity sales
• PLN 26 400 mln basic investment fund
• 5.8-6.3 GW installed conventional electrical capacity
• 20 700 GWh generation of electricity from conventional sources
• 75% coal own consumption
• 144 min / 1.69 SAIDI/SAIFI
• PLN 2 940 mln EBITDA
Stable development of a raw materials and energy concern
3
Agenda
Coal, energy markets, key operational and sales data
Enea CG's financial results in Q3 and Q1-Q3 2016
Enea CG’s development strategy
LW Bogdanka's financial results in Q3 and Q1-Q3 2016
Key initiatives implemented in Q1-Q3 2016
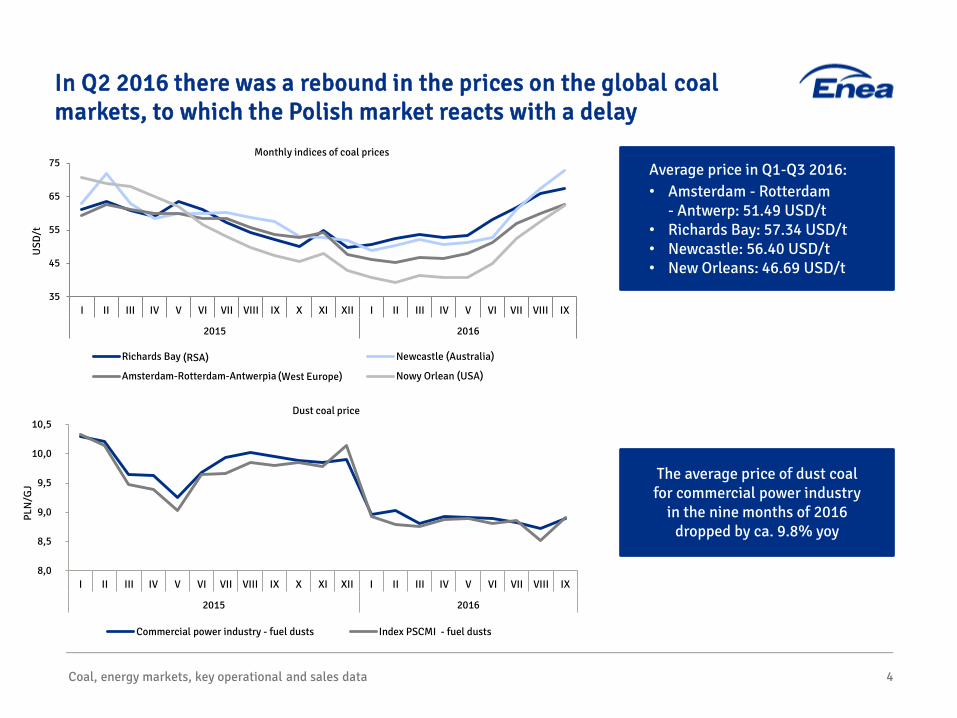
In Q2 2016 there was a rebound in the prices on the global coal markets, to which the Polish market reacts with a delay
Coal, energy markets, key operational and sales data 4
35
45
55
65
75
I II III IV V VI VII VIII IX X XI XII I II III IV V VI VII VIII IX
2015 2016
USD
/t
Monthly indices of coal prices
Richards Bay (RPA) Newcastle (Australia)
Amsterdam-Rotterdam-Antwerpia (Europa Zach.) Nowy Orlean (USA)(West Europe)
(RSA)
8,0
8,5
9,0
9,5
10,0
10,5
I II III IV V VI VII VIII IX X XI XII I II III IV V VI VII VIII IX
2015 2016
PLN
/GJ
Commercial power industry - fuel dusts Index PSCMI - fuel dusts
Dust coal price
The average price of dust coal for commercial power industry
in the nine months of 2016 dropped by ca. 9.8% yoy
Average price in Q1-Q3 2016: • Amsterdam - Rotterdam
- Antwerp: 51.49 USD/t • Richards Bay: 57.34 USD/t • Newcastle: 56.40 USD/t • New Orleans: 46.69 USD/t

Coal, energy markets, key operational and sales data
In Q1-Q3 2016 a slight growth in prices on the spot energy market was reported
5
BASE Y and SPOT prices
• Growth in the average price of baseload on SPOT market in Q1-Q3 2016 by 0.5% yoy to 158.37 PLN/MWh • The average energy price on forward market - baseload for 2017 dropped by 1.85% yoy to 159.02 PLN/MWh in Q1-Q3 2016
130
140
150
160
170
180
190
200
210
I II III IV V VI VII VIII IX X XI XII I II III IV VI VI VII VIII IX
2015 2016
PLN
/MW
h
BASE Y-17 BASE Y-16 SPOT 2012-2015

20
40
60
80
100
120
140
160
180
200
I II III IV V VI VII VIII IX X XI XII I II III IV V VI VII VIII IX
2015 2016
PLN
/MW
h
Indeks sesyjny Indeks OTC
Coal, energy markets, key operational and sales data
In Q1-Q3 2016 we observed a downward trend in the prices of proprietary interests
Prices of Proprietary Interests
• In Q1-Q3 2016 the weighted average value of the session index dropped by 26.8% yoy to 86.18 PLN/MWh in relation to Q4 2015 • OTC market index in that period was by 57% higher than the session index and amounted averagely to 135.23 PLN/MWh
6
Trading index OTC
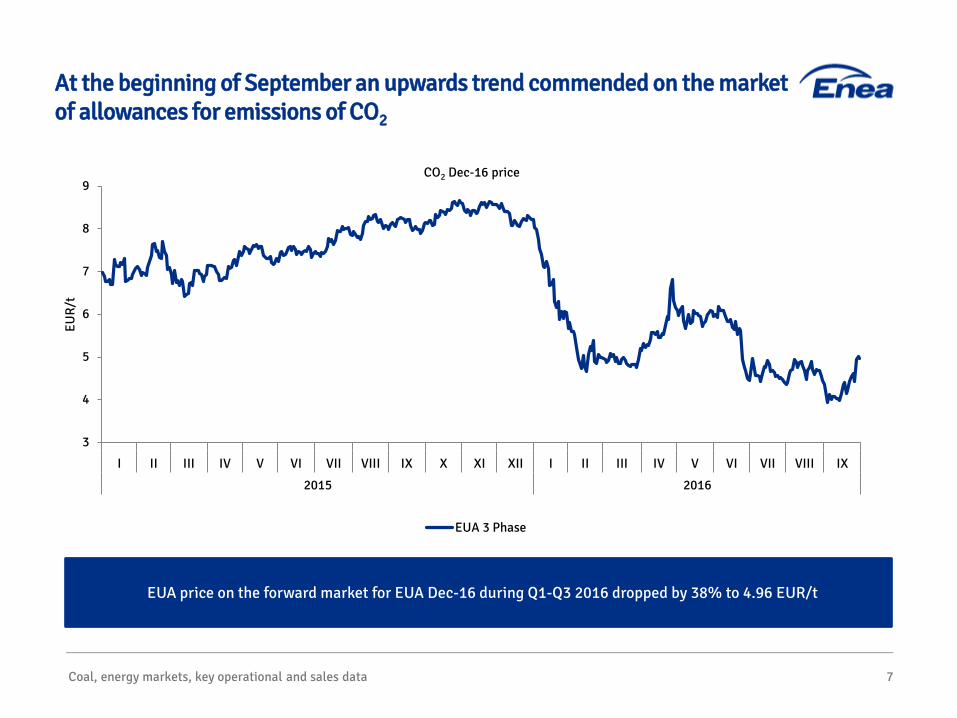
EUA price on the forward market for EUA Dec-16 during Q1-Q3 2016 dropped by 38% to 4.96 EUR/t
At the beginning of September an upwards trend commended on the market of allowances for emissions of CO2
Coal, energy markets, key operational and sales data 7
3
4
5
6
7
8
9
I II III IV V VI VII VIII IX X XI XII I II III IV V VI VII VIII IX
2015 2016
EUR/
t
CO2 Dec-16 price
EUA 3 FazaEUA 3 Phase
3 020
12 495
0
2 000
4 000
6 000
8 000
10 000
12 000
14 000
0500
1 0001 5002 0002 5003 0003 5004 000
PLN
mln
GW
h
0
2 000
4 000
6 000
8 000
10 000
12 000
14 000
0500
1 0001 5002 0002 5003 0003 5004 000
PLN
mln
GW
h
2 938
13 296
0
2 000
4 000
6 000
8 000
10 000
12 000
14 000
0500
1 0001 5002 0002 5003 0003 5004 000
Przychody ze sprzedaży Wolumen sprzedaży
PLN
mln
GW
h
0
2 000
4 000
6 000
8 000
10 000
12 000
14 000
0
1 000
2 000
3 000
4 000
Sales revenue Sales volume
Coal, energy markets, key operational and sales data 8
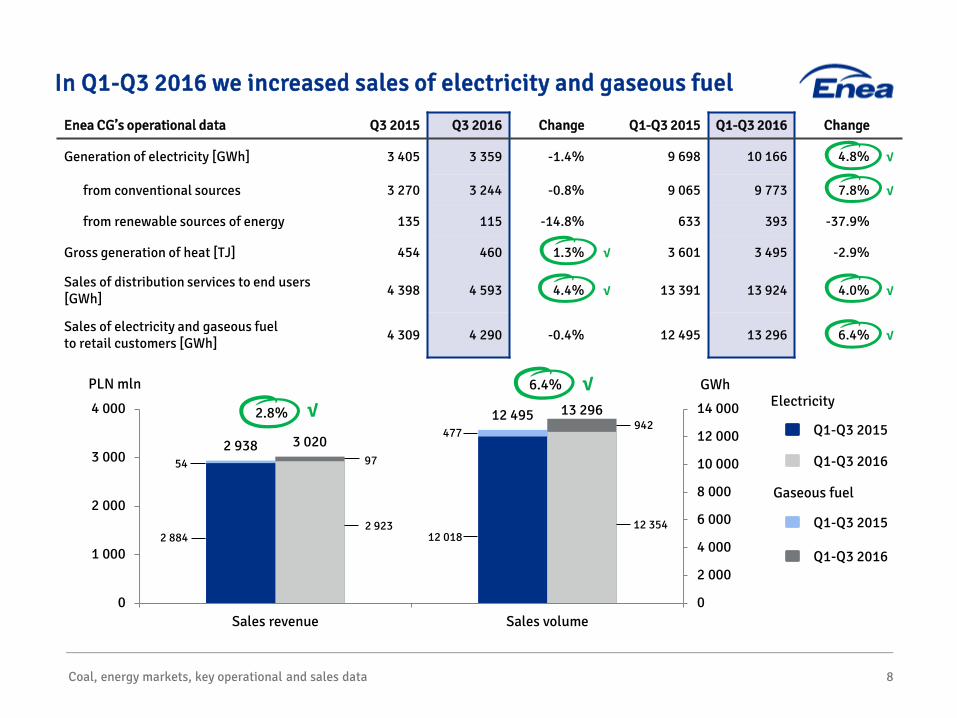
In Q1-Q3 2016 we increased sales of electricity and gaseous fuel
Enea CG’s operational data Q3 2015 Q3 2016 Change Q1-Q3 2015 Q1-Q3 2016 Change
Generation of electricity [GWh] 3 405 3 359 -1.4% 9 698 10 166 4.8% √
from conventional sources 3 270 3 244 -0.8% 9 065 9 773 7.8% √
from renewable sources of energy 135 115 -14.8% 633 393 -37.9%
Gross generation of heat [TJ] 454 460 1.3% √ 3 601 3 495 -2.9%
Sales of distribution services to end users [GWh] 4 398 4 593 4.4% √ 13 391 13 924 4.0% √
Sales of electricity and gaseous fuel to retail customers [GWh] 4 309 4 290 -0.4% 12 495 13 296 6.4% √
Q1-Q3 2015
Q1-Q3 2016
Electricity
Gaseous fuel
942
12 354 12 018
477
97
2 923 2 884
54
2.8% √
GWh PLN mln 6.4% √
Q1-Q3 2015
Q1-Q3 2016
Coal, energy markets, key operational and sales data 9
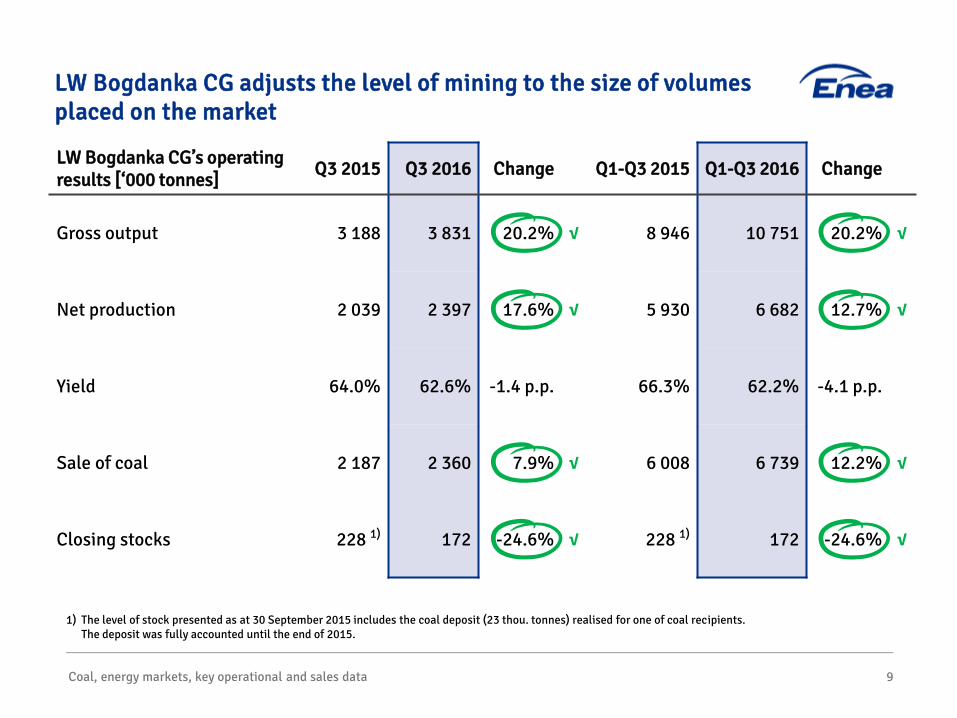
LW Bogdanka CG adjusts the level of mining to the size of volumes placed on the market
LW Bogdanka CG’s operating results [‘000 tonnes] Q3 2015 Q3 2016 Change Q1-Q3 2015 Q1-Q3 2016 Change
Gross output 3 188 3 831 20.2% √ 8 946 10 751 20.2% √
Net production 2 039 2 397 17.6% √ 5 930 6 682 12.7% √
Yield 64.0% 62.6% -1.4 p.p. 66.3% 62.2% -4.1 p.p.
Sale of coal 2 187 2 360 7.9% √ 6 008 6 739 12.2% √
Closing stocks 228 1) 172 -24.6% √ 228 1) 172 -24.6% √
1) The level of stock presented as at 30 September 2015 includes the coal deposit (23 thou. tonnes) realised for one of coal recipients. The deposit was fully accounted until the end of 2015.

Agenda
Coal, energy markets, key operational and sales data
Enea CG's financial results in Q3 and Q1-Q3 2016
Enea CG’s development strategy
LW Bogdanka's financial results in Q3 and Q1-Q3 2016
Key initiatives implemented in Q1-Q3 2016
10

Enea CG's financial results in Q3 and Q1-Q3 2016 11
The comparability of results yoy was affected by the settlement in Q3 2015 of revenue from LTPPA
Enea CG’s financial data [PLN mln] Q3 2015 Q3 2016 Change Q1-Q3 2015 Q1-Q3 2016 Change
Net sales revenue 2 538.1 2 704.5 6.6% √ 7 150.3 8 303.9 16.1% √
EBIT 522.8 338.6 -35.2% 1 047.0 949.1 -9.3%
EBITDA 711.1 622.1 -12.5% 1 605.2 1 828.6 13.9% √
EBITDA excl. LTPPA and LWB CG 418.0 473.6 13.3% √ 1 312.1 1 417.3 8.0% √
Net profit 419.6 249.4 -40.6% 837.8 720.7 -14.0%
Net cash flows from operating activities 562.7 660.3 17.4% √ 1 345.6 1 822.4 35.4% √
CAPEX 831.0 683.0 -17.8% 1 953.7 1 854.1 -5.1%
Net debt / EBITDA 1) 0.8 1.8 1.0 0.8 1.8 1.0
1) Debt = long-term and short-term: credits, loans and debt securities + financial lease liabilities

In Q3 2016 Enea Group realised the greatest growth in EBITDA yoy, by PLN 61 mln, in the area of trade
Enea CG's financial results in Q3 and Q1-Q3 2016
622.1
154.2 133.6
286.8 67.1 3.8 -23.5
Wydobycie Wytwarzanie Dystrybucja Obrót Pozostaładziałalność
Pozycjenieprzypisanei wyłączenia
EBITDA IIIQ2016
12
Q3 2016 [PLN mln] 154.2 133.6 286.8 67.1 3.9 -23.5 622.1
Share in EBITDA in Q3 2016 24.8% 21.5% 46.1% 10.8% 0.6% -3.8% -
EBITDA margin 33.1% 17.4% 38.6% 4.1% 3.1% - 23.0% Change [PLN mln] 154.2 -285.6/7.51) -2.5 60.6 -6.9 -8.8 -89.0
Change [%] 100.0% -68.1%/6.0%1) -0.9% 921.1% -64.0% -59.2% -12.5%
• growth in coal sold by almost 8% √
• drop of sales revenue by almost 4%
• lower selling price of coal by ca. 11%
• investment written-off with no result PLN -7.4 mln
• higher margin on generation by PLN 16.5 mln √
• higher margin on trade and the Balancing Market by PLN 6.2 mln √
• lower result in the segment of RES by PLN 9.6 mln
• settlement of PLN 293.1 mln LTPPA in Q3 2015 (one-off)
• higher revenue from sale of distribution services to end users by PLN 14 mln √
• higher result on other operating activity by PLN 14 mln √
• lower revenue from grid connection fees by PLN 7 mln
• higher average selling price by 1.1% √
• lower costs of ecological obligations by 6.0% √
• lower average purchase price of energy by 3.0% √
1) excluding PLN 293.1 mln revenue from LTPPA (one-off)
Mining Generation Distribution Trade Other activity Exlusions EBITDA Q3 2016
1 828.6
437.1
465.1
857.5 117.7 32.4
-81.1
Wydobycie Wytwarzanie Dystrybucja Obrót Pozostaładziałalność
Pozycjenieprzypisanei wyłączenia
EBITDAI-IIIQ 2016
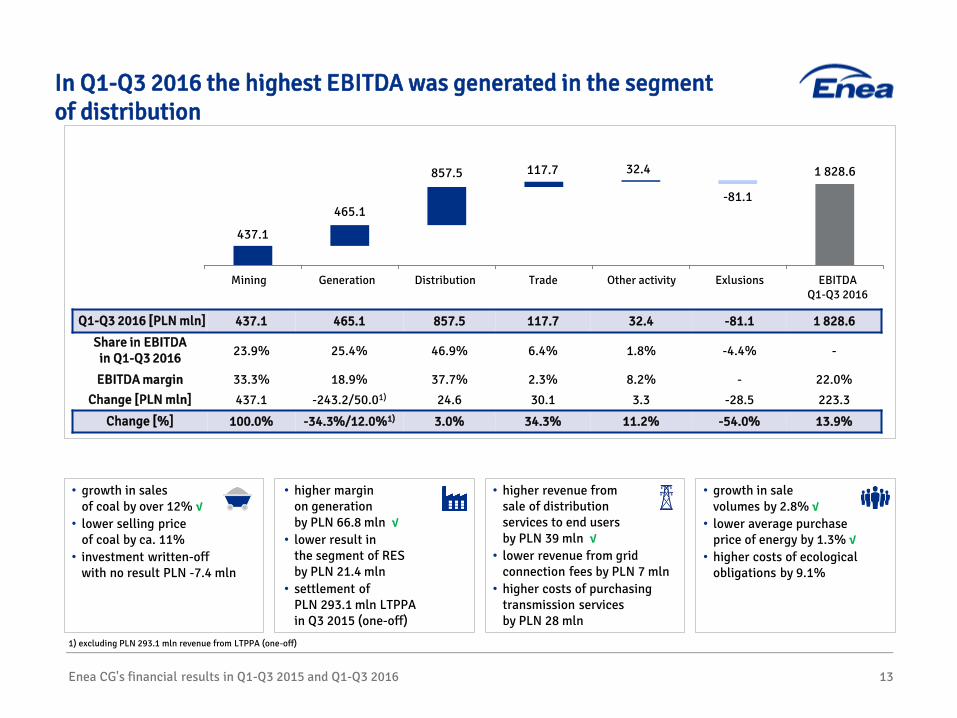
In Q1-Q3 2016 the highest EBITDA was generated in the segment of distribution
Enea CG's financial results in Q1-Q3 2015 and Q1-Q3 2016 13
Q1-Q3 2016 [PLN mln] 437.1 465.1 857.5 117.7 32.4 -81.1 1 828.6
Share in EBITDA in Q1-Q3 2016 23.9% 25.4% 46.9% 6.4% 1.8% -4.4% -
EBITDA margin 33.3% 18.9% 37.7% 2.3% 8.2% - 22.0% Change [PLN mln] 437.1 -243.2/50.01) 24.6 30.1 3.3 -28.5 223.3
Change [%] 100.0% -34.3%/12.0%1) 3.0% 34.3% 11.2% -54.0% 13.9%
• growth in sales of coal by over 12% √
• lower selling price of coal by ca. 11%
• investment written-off with no result PLN -7.4 mln
• higher margin on generation by PLN 66.8 mln √
• lower result in the segment of RES by PLN 21.4 mln
• settlement of PLN 293.1 mln LTPPA in Q3 2015 (one-off)
• higher revenue from sale of distribution services to end users by PLN 39 mln √
• lower revenue from grid connection fees by PLN 7 mln
• higher costs of purchasing transmission services by PLN 28 mln
• growth in sale volumes by 2.8% √
• lower average purchase price of energy by 1.3% √
• higher costs of ecological obligations by 9.1%
1) excluding PLN 293.1 mln revenue from LTPPA (one-off)
Mining Generation Distribution Trade Other activity Exlusions EBITDA Q1-Q3 2016

Agenda
Coal, energy markets, key operational and sales data
Enea CG's financial results in Q1-Q3 2015 and Q1-Q3 2016
Enea CG’s development strategy
LW Bogdanka's financial results in Q1-Q3 2015 and Q1-Q3 2016
Key initiatives implemented in Q1-Q3 2016
14
LW Bogdanka's financial results in Q1-Q3 2015 and Q1-Q3 2016 15
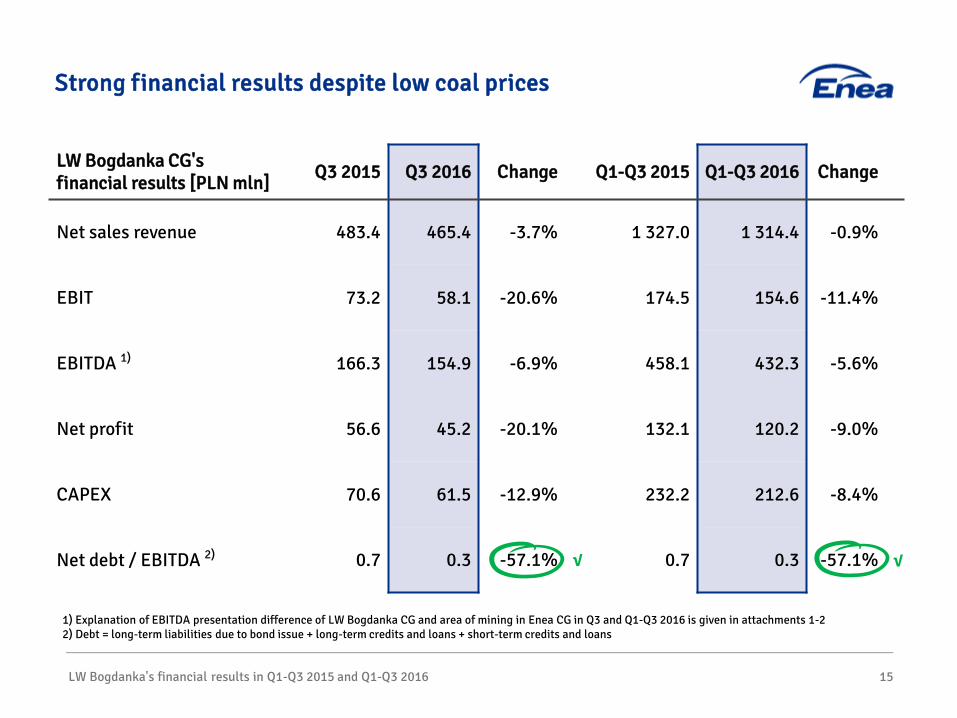
Strong financial results despite low coal prices
LW Bogdanka CG's financial results [PLN mln] Q3 2015 Q3 2016 Change Q1-Q3 2015 Q1-Q3 2016 Change
Net sales revenue 483.4 465.4 -3.7% 1 327.0 1 314.4 -0.9%
EBIT 73.2 58.1 -20.6% 174.5 154.6 -11.4%
EBITDA 1) 166.3 154.9 -6.9% 458.1 432.3 -5.6%
Net profit 56.6 45.2 -20.1% 132.1 120.2 -9.0%
CAPEX 70.6 61.5 -12.9% 232.2 212.6 -8.4%
Net debt / EBITDA 2) 0.7 0.3 -57.1% √ 0.7 0.3 -57.1% √
1) Explanation of EBITDA presentation difference of LW Bogdanka CG and area of mining in Enea CG in Q3 and Q1-Q3 2016 is given in attachments 1-2 2) Debt = long-term liabilities due to bond issue + long-term credits and loans + short-term credits and loans

Lower EBITDA in Q3 2016 was determined by a drop in coal price by 10.7% yoy
LW Bogdanka's financial results in Q3 and Q1-Q3 2016 16
• drop of EBITDA by PLN 11.4 mln (-6.9%) • growth in sale volumes of coal by 7.9% √ • drop in the price of sold coal by 10.7% • drop in the other revenue (lower sales from subsidiaries) • drop in the unit cost of sold products, goods without amortisation
(drop in nominal costs by 1.7% with higher volume of sold coal by 7.9%) √
166.3
-0.7
154.9 13.7
-51.5
25.2 0.6 1.2
EBITDA IIIQ 2015 Ilość sprzedanegowęgla
Cena węgla Pozostałeprzychody
Jednostkowy kosztsprzedanych
produktów, towarówi materiałów
bez amortyzacji
Kosztysprzedaży
i administracyjne
Wynik napozostałej
działalnościoperacyjnej
EBITDA IIIQ 2016
Q3 2016 [PLN mln] 186.9 430.8 4.0 257.6 35.5 -0.5 154.9
Q3 2015 [PLN mln] 173.2 482.3 4.7 282.9 36.0 -1.7 166.3
Change [PLN mln] 13.7 -51.5 -0.7 25.2 0.6 -1.2 -11.4
Change [%] 7.9% -10.7% -14.9% -8.9% -1.6% - -6.9%
EBITDA Q3 2015 Volume of coal sold Coal price Other revenue Unit cost of products and materials sold
without dopreciation
Sales and administration costs
Result on the other operating activity
EBITDA Q3 2016

Lower unit cost and growth in the volume did not fully compensate coal prices decreasing in Q1-Q3 2016
LW Bogdanka's financial results in Q1-Q3 2015 and Q1-Q3 2016 17
• drop of EBITDA by PLN 25.8 mln (-5.6%) • growth in sale volumes of coal by 12.2% √ • drop in the price of sold coal by 10.8% • drop in the unit cost of sold products, goods without amortisation
(growth in nominal costs by 5.9% with a greater growth in the volume of sold coal by 12.2%) √ • other revenue in Q1-Q3 2016 on the level of the same period of 2015 • drop in costs of sales and administration costs (derecognition of costs of management options for 2016
and previous years, lower depreciation of fixed assets) √ • positive result on the other operating activity (release of the provision for claims) √
458.1
-142.2
432.3 53.8
0.0 43.2 9.5 9.8
EBITDA I-IIIQ 2015 Ilość sprzedanegowęgla
Cena węgla Pozostałeprzychody
Jednostkowy kosztsprzedanych
produktów, towarówi materiałów
bez amortyzacji
Kosztysprzedaży
i administracyjne
Wynik napozostałej
działalnościoperacyjnej
EBITDA I-IIIQ 2016
Q1-Q3 2016 [PLN mln] 496.4 1 178.5 16.5 735.9 90.3 9.7 432.3
Q1-Q3 2015 [PLN mln] 442.6 1 320.7 16.5 779.0 99.9 -0.1 458.1
Change [PLN mln] 53.8 -142.2 0.0 43.2 9.5 9.8 -25.8
Change [%] 12.2% -10.8% 0.0% -5.6% -9.5% - -5.6%
EBITDA Q1-Q3 2015
Volume of coal sold Coal price Other revenue Unit cost of products and materials sold
without dopreciation
Sales and administration costs
Result on the other operating activity
EBITDA Q1-Q3 2016

18
Agenda
Coal, energy markets, key operational and sales data
Enea CG's financial results in Q3 and Q1-Q3 2016
Enea CG’s development strategy
LW Bogdanka's financial results in Q3 and Q1-Q3 2016
Key initiatives implemented in Q1-Q3 2016
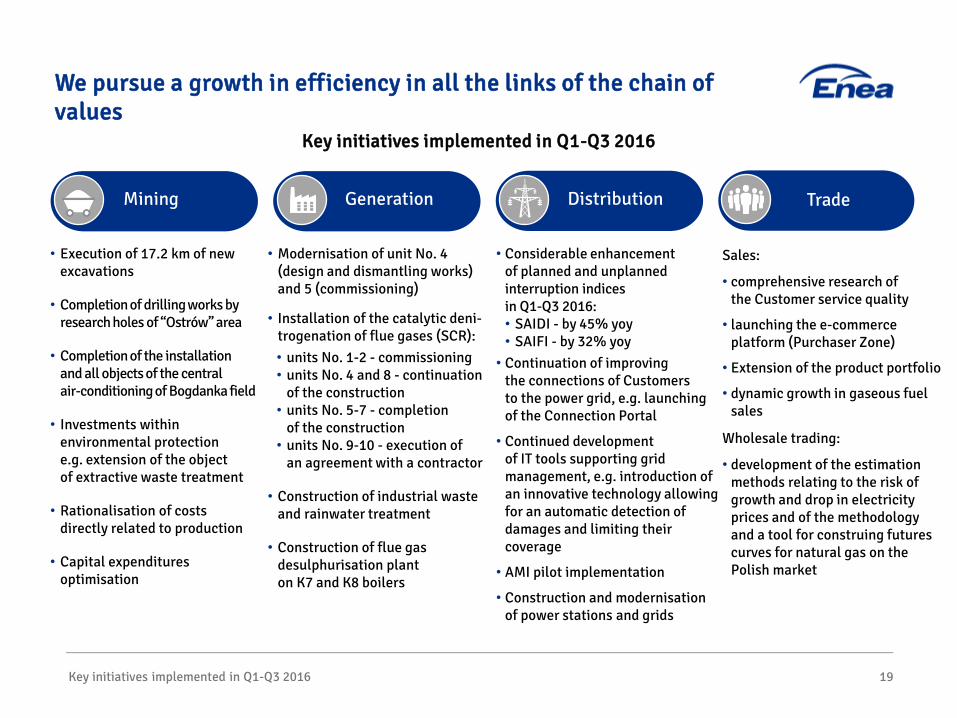
We pursue a growth in efficiency in all the links of the chain of values
Key initiatives implemented in Q1-Q3 2016 19
Mining Generation Distribution Trade
• Execution of 17.2 km of new excavations
• Completion of drilling works by research holes of “Ostrów” area
• Completion of the installation and all objects of the central air-conditioning of Bogdanka field
• Investments within environmental protection e.g. extension of the object of extractive waste treatment
• Rationalisation of costs directly related to production
• Capital expenditures optimisation
• Modernisation of unit No. 4 (design and dismantling works) and 5 (commissioning)
• Installation of the catalytic deni-trogenation of flue gases (SCR): • units No. 1-2 - commissioning • units No. 4 and 8 - continuation
of the construction • units No. 5-7 - completion
of the construction • units No. 9-10 - execution of
an agreement with a contractor
• Construction of industrial waste and rainwater treatment
• Construction of flue gas desulphurisation plant on K7 and K8 boilers
• Considerable enhancement of planned and unplanned interruption indices in Q1-Q3 2016: • SAIDI - by 45% yoy • SAIFI - by 32% yoy
• Continuation of improving the connections of Customers to the power grid, e.g. launching of the Connection Portal
• Continued development of IT tools supporting grid management, e.g. introduction of an innovative technology allowing for an automatic detection of damages and limiting their coverage
• AMI pilot implementation
• Construction and modernisation of power stations and grids
Sales:
• comprehensive research of the Customer service quality
• launching the e-commerce platform (Purchaser Zone)
• Extension of the product portfolio
• dynamic growth in gaseous fuel sales
Wholesale trading:
• development of the estimation methods relating to the risk of growth and drop in electricity prices and of the methodology and a tool for construing futures curves for natural gas on the Polish market
Key initiatives implemented in Q1-Q3 2016
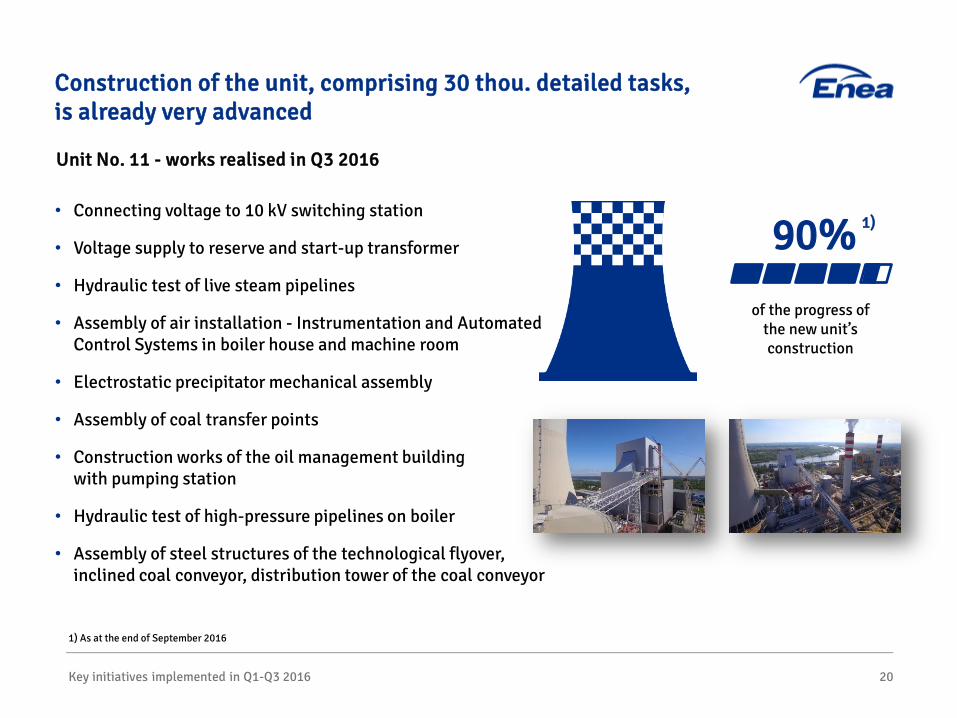
• Connecting voltage to 10 kV switching station
• Voltage supply to reserve and start-up transformer
• Hydraulic test of live steam pipelines
• Assembly of air installation - Instrumentation and Automated Control Systems in boiler house and machine room
• Electrostatic precipitator mechanical assembly
• Assembly of coal transfer points
• Construction works of the oil management building with pumping station
• Hydraulic test of high-pressure pipelines on boiler
• Assembly of steel structures of the technological flyover, inclined coal conveyor, distribution tower of the coal conveyor
Key initiatives implemented in Q1-Q3 2016 20
Construction of the unit, comprising 30 thou. detailed tasks, is already very advanced
Unit No. 11 - works realised in Q3 2016
90%
of the progress of the new unit’s construction
1) As at the end of September 2016
1)
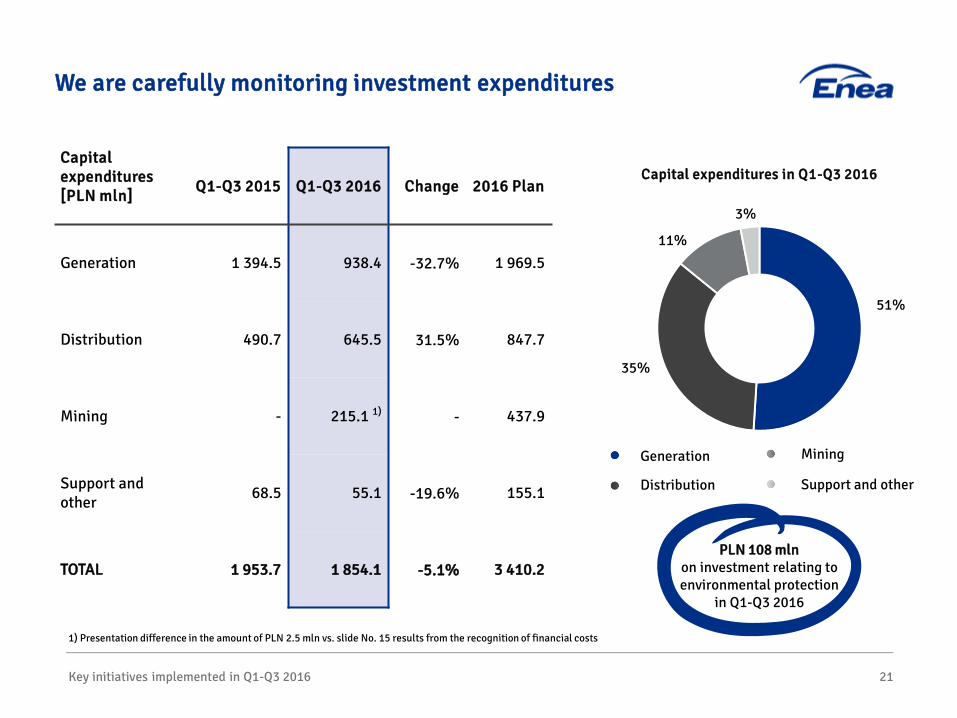
We are carefully monitoring investment expenditures
Key initiatives implemented in Q1-Q3 2016 21
Generation
Distribution
Mining
Support and other
PLN 108 mln on investment relating to environmental protection
in Q1-Q3 2016
51%
35%
11%
3%
Capital expenditures [PLN mln]
Q1-Q3 2015 Q1-Q3 2016 Change 2016 Plan
Generation 1 394.5 938.4 -32.7% 1 969.5
Distribution 490.7 645.5 31.5% 847.7
Mining - 215.1 1) - 437.9
Support and other 68.5 55.1 -19.6% 155.1
TOTAL 1 953.7 1 854.1 -5.1% 3 410.2
Capital expenditures in Q1-Q3 2016
1) Presentation difference in the amount of PLN 2.5 mln vs. slide No. 15 results from the recognition of financial costs

22
Agenda
Coal, energy markets, key operational and sales data
Enea CG's financial results in Q1-Q3 2015 and Q1-Q3 2016
Enea CG’s development strategy
LW Bogdanka's financial results in Q1-Q3 2015 and Q1-Q3 2016
Key initiatives implemented in Q1-Q3 2016
Enea CG’s development strategy 23
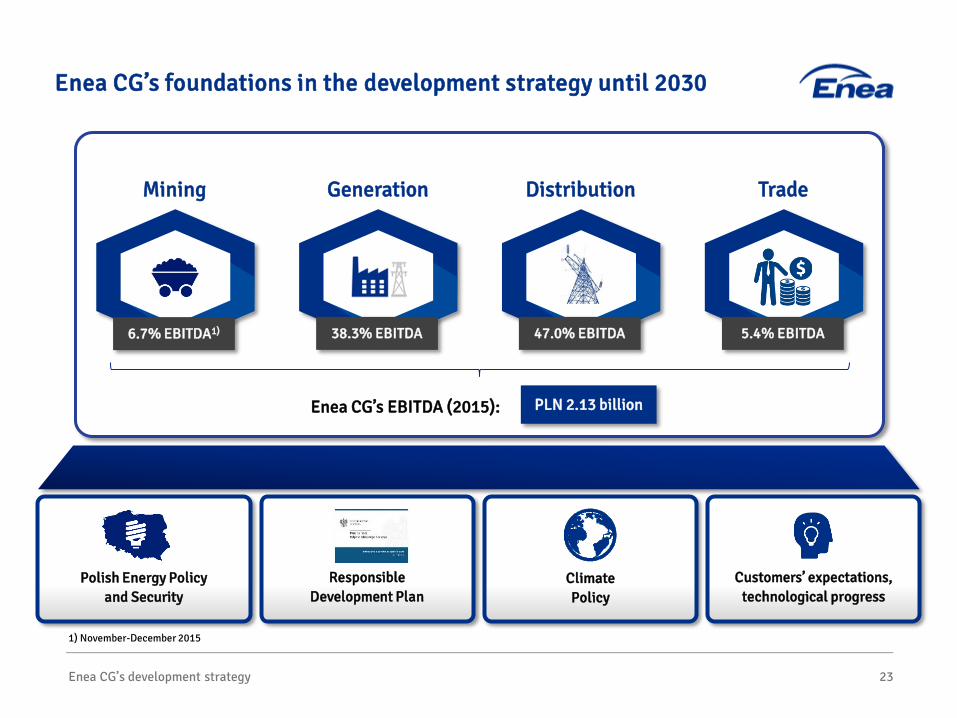
Enea CG’s foundations in the development strategy until 2030
Generation Distribution Trade Mining
Polish Energy Policy and Security
PLN 2.13 billion Enea CG’s EBITDA (2015):
38.3% EBITDA 47.0% EBITDA 6.7% EBITDA1) 5.4% EBITDA
Customers’ expectations, technological progress
Climate Policy
Responsible Development Plan
1) November-December 2015

Enea CG’s development strategy 24
Over 50% of innovative initiatives increasing the business potential
Within the works over the strategy 60 initiatives were described which are grouped under 7 fundamental change areas joining the perspective of all business areas
Within the works over the strategy
60 strategic initiatives were described
Initiatives improving the existing business
Initiatives enhancing the business potential
31 initiatives
Initiatives aiming at the development
of innovative technologies
and business lines
Initiatives realised mainly by
the dedicated entity, Enea Innovation
Well-thought-out investments
in high-margin business lines, products and
services
29 initiatives
Rationalisation and optimisation of
capital expenditures (efficient CAPEX
and financial leverage)
Initiatives realised by the existing
links of the chain of
values
Flexible and innovative concern, focusing on the improvement and growth in the value of current business
Operating efficiency and balanced portfolio
in the complete chain of values
Competitive advantage via diversified portfolio development and high adaptability to changes
Initiatives aiming at
the improvement in current operations
Enea CG’s development strategy 25
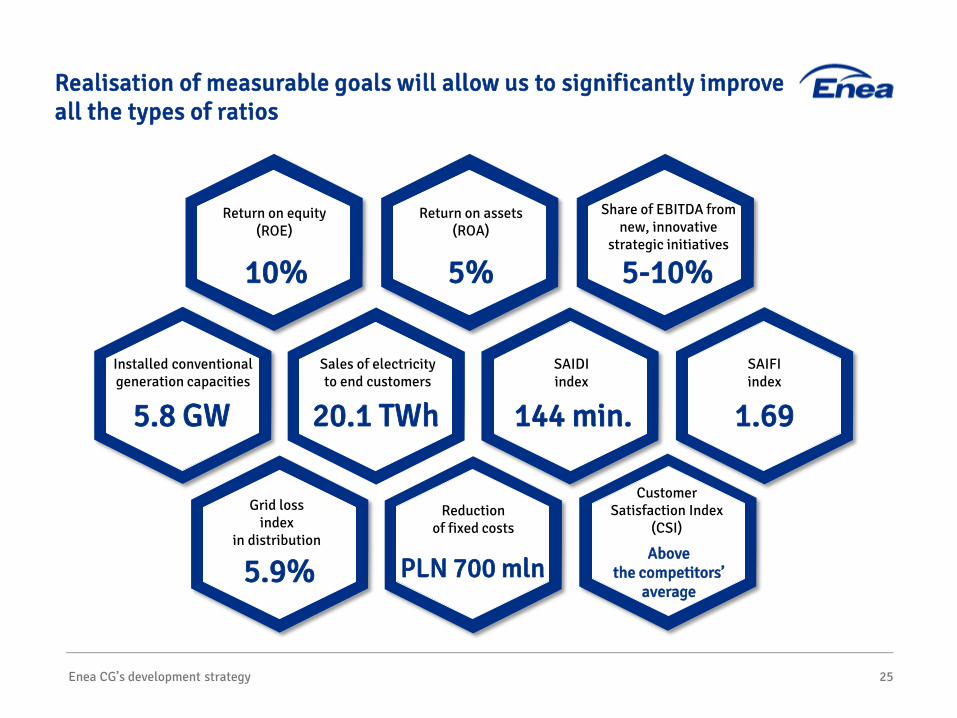
Realisation of measurable goals will allow us to significantly improve all the types of ratios
Reduction of fixed costs
PLN 700 mln
Customer Satisfaction Index
(CSI)
Above the competitors’
average
Sales of electricity to end customers
20.1 TWh
SAIDI index
144 min.
SAIFI index
1.69
Installed conventional generation capacities
5.8 GW
Grid loss index
in distribution
5.9%
Return on equity (ROE)
10%
Return on assets (ROA)
5%
Share of EBITDA from new, innovative
strategic initiatives
5-10%

Enea CG’s development strategy
• Signing of a letter of intent with Energa relating to the construction and operation of a new unit - development of the investment business model which is the best for all the partners
• Favourable impact on the energy security in Poland - guaranteeing reliability and continuity of supplies
• Supercritical unit guaranteeing reduction in CO2 emissions through modern and highly effective combustion technique - satisfaction of the climate agreement terms
• Using the experience gained during the construction of 1,075 MW unit in Kozienice Power Plant
26
Construction of a new unit in Ostrołęka C is part of an important process of the Polish power sector modernisation
Construction of a 1,000 MW type modern coal unit in Ostrołęka Power Plant
efficiency
> 45% annual generation
of electricity
7.5 thou. GWh
CAPEX
PLN 5.5-6 bln planned date
of completion of the investment
realisation
H2 2023

Enea CG’s development strategy
• Submission, jointly with PGE, Energa and PGNiG Termika, of a preliminary, non-binding offer for the purchase of shares in companies belonging to EDF in Poland, holding conventional generating assets and conducting service operations
27
We wish to strengthen the Group’s position on the market of energy producers
Preliminary offer for the purchase of EDF International SAS’s assets
Offer for the acquisition of 100% shares in ENGIE Energia Polska
• Optimal investor for ENGIE - possibility of obtaining synergies:
• Połaniec Power Plant - a plant with similar technical parameters as Kozienice Power Plant and a great importance for the security of the power system in Poland
• LW Bogdanka - coal supplier to Połaniec Power Plant
share in energy generation
8% share in heat
generation
15%
share in energy generation
6%
Optimisation and standardisation of the area of mining and generation

• Signing of a letter of intent with Węglokoks and Towarzystwo Finansowe Silesia expressing a preliminary interest in the financial participation in KHW SA or KHW’s assets
• Dependence of the participation on the satisfaction of numerous conditions related to e.g. presentation of an acceptable business plan and financial model and obtaining the required corporate consents
• Making final decisions e.g. after the analysis of the conducted due-diligence
Enea CG’s development strategy 28
We pursue securing fuels for the needs of our generation activity
Letter of Intent relating to the preliminary interest in the financial participation in Katowicki Holding Węglowy
Estimated growth in own conventional capacities to the level of 5.8 GW - increasing the demand for bituminous coal from the current level
of ca. 5.5 million tonnes annually to ca. 10.9 million tonnes annually in 2025
Enea CG’s development strategy
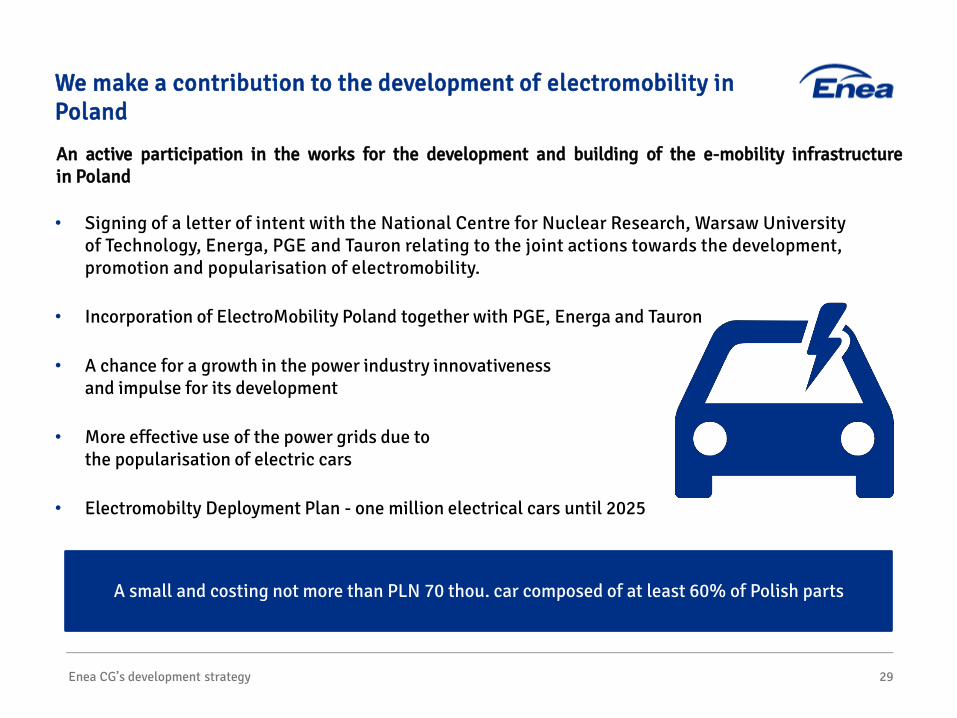
• Signing of a letter of intent with the National Centre for Nuclear Research, Warsaw University of Technology, Energa, PGE and Tauron relating to the joint actions towards the development, promotion and popularisation of electromobility.
• Incorporation of ElectroMobility Poland together with PGE, Energa and Tauron
• A chance for a growth in the power industry innovativeness and impulse for its development
• More effective use of the power grids due to the popularisation of electric cars
• Electromobilty Deployment Plan - one million electrical cars until 2025
29
We make a contribution to the development of electromobility in Poland
An active participation in the works for the development and building of the e-mobility infrastructure in Poland
A small and costing not more than PLN 70 thou. car composed of at least 60% of Polish parts
Enea CG’s development strategy 30
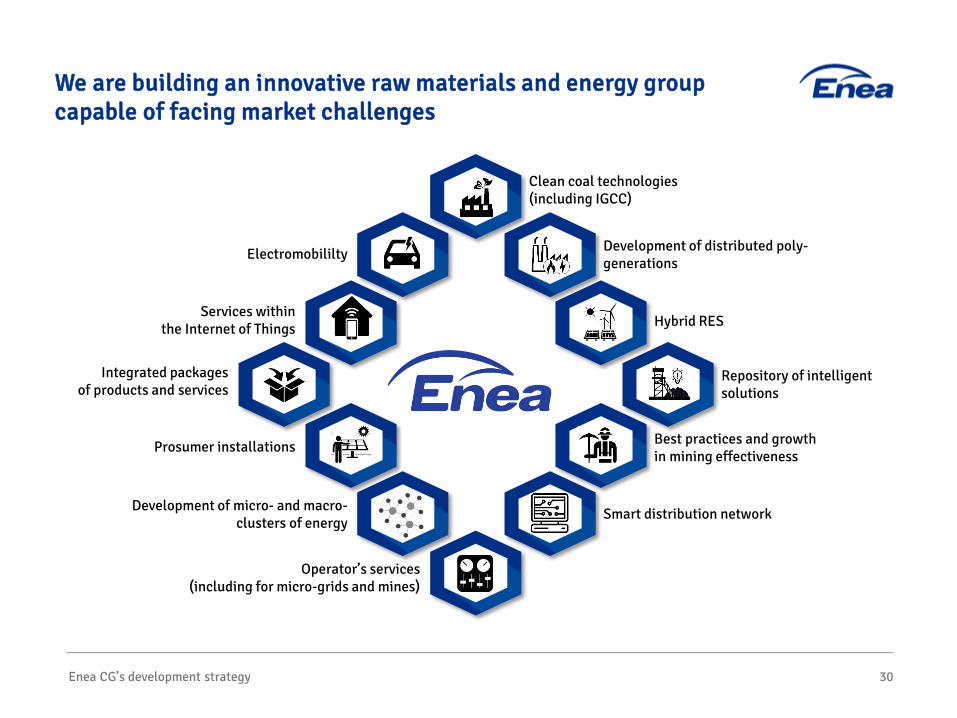
We are building an innovative raw materials and energy group capable of facing market challenges
Clean coal technologies (including IGCC)
Development of distributed poly-generations
Smart distribution network
Best practices and growth in mining effectiveness
Hybrid RES
Repository of intelligent solutions
Operator’s services (including for micro-grids and mines)
Development of micro- and macro-clusters of energy
Electromobililty
Prosumer installations
Services within the Internet of Things
Integrated packages of products and services
We are building an innovative raw materials and energy group capable of facing market challenges Q3, Q1-Q3 2016

Attachments
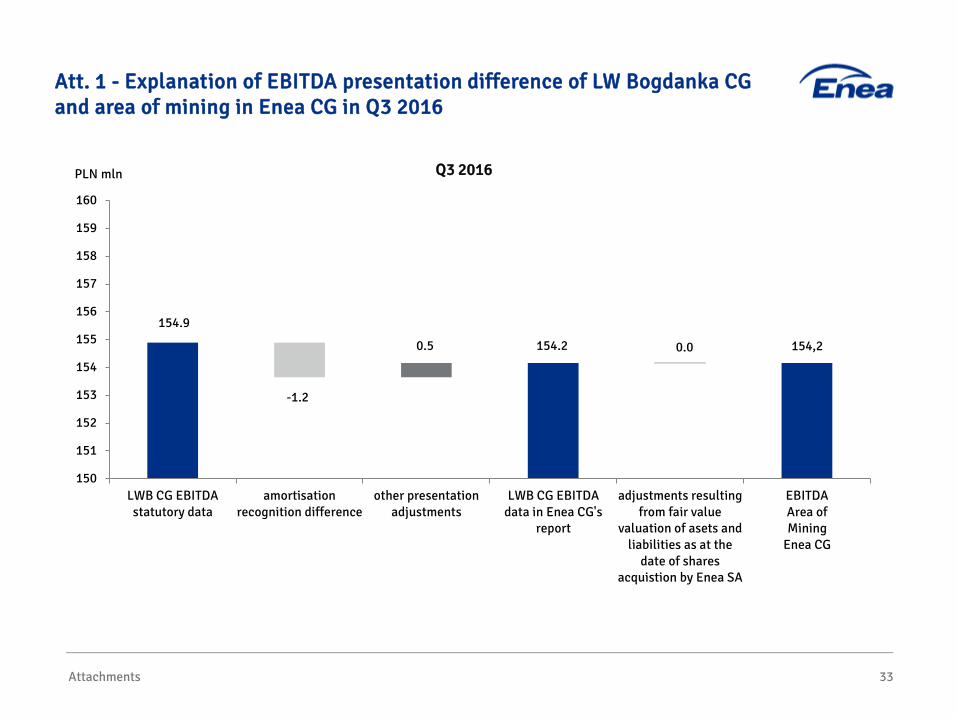
154.9
154.2 154,2 0.5 0.0
-1.2
150
151
152
153
154
155
156
157
158
159
160
LWB CG EBITDAstatutory data
amortisationrecognition difference
other presentationadjustments
LWB CG EBITDAdata in Enea CG's
report
adjustments resultingfrom fair value
valuation of asets andliabilities as at the
date of sharesacquistion by Enea SA
EBITDAArea ofMining
Enea CG
PLN mln
Attachments 33
Att. 1 - Explanation of EBITDA presentation difference of LW Bogdanka CG and area of mining in Enea CG in Q3 2016
Q3 2016

432.3
433.9
437.1
0.5
1.1
3.2
430
431
432
433
434
435
436
437
438
439
440
LWB CG EBITDAstatutory data
amortisationrecognition difference
other presentationadjustments
LWB CG EBITDAdata in Enea CG's
report
adjustments resultingfrom fair value
valuation of asets andliabilities as at the
date of sharesacquistion by Enea SA
EBITDAArea ofMining
Enea CG
PLN mln
Attachments 34
Att. 2 - Explanation of EBITDA presentation difference of LW Bogdanka CG and area of mining in Enea CG in Q1-Q3 2016
Q1-Q3 2016

Att. 3 – We are continuing the commenced investment activities
Attachments 35
Investment CAPEX
Q1-Q3 2016 [PLN mln]
Total CAPEX [PLN mln]
Work progress (%)
Anticipated date of completion
Construction of a 1,075 MW power unit No. 11 742.5 5 922.0 90%1) 2017
IOS IV flue gas desulphurisation plant 9.1 288.3 99% 2016
Modernisation of unit No. 4 12.7 31.8 45% 2017
Modernisation of unit No. 5 74.4 87.9 99% 2016
Construction of industrial waste and rainwater treatment 7.2 29.4 97% 2016
Installation of flue gases denitrification - SCR for units No. 1 and 2 6.3 97.9 98% 2016
Modernisation of unit No. 9 as a part of 2 x 500 MW units modernisation programme 0 90.0 1% 2017
Modernisation of cooling water intake - stabilising checkdam on the Vistula River 0.4 33.0 2% 2017
SCR installation and modernisation of electrostatic precipitators for units No. 9 and 10 as part of the 2 x 500 MW units modernisation programme
1.2 321.9 1%2) 2017
Installation of flue gases denitrification - SCR for units No. 4-8 44.2 203.7 80% 2017
Installation of flue gases denitrification - SNCR for unit No. 3 0 42.6 1% 2017
Construction of flue gas desulphurisation plant on K7 and K8 boilers 33.7 105.5 50% 2017
Modernisation of unit No. 10 as part of 2 x 500 MW units modernisation programme 0 88.1 1% 2018
1) As at the end of September 2016 2) The execution status of the tender stage was presented in H1 2016 report. Currently, the project’s financial progress is presented.
Attachments
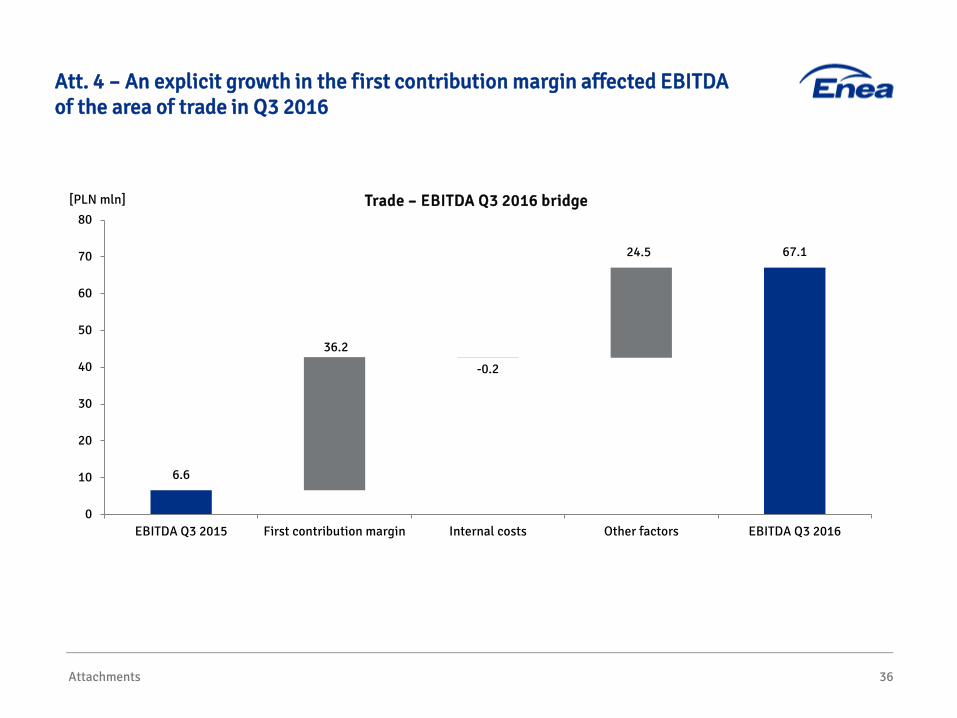
Att. 4 – An explicit growth in the first contribution margin affected EBITDA of the area of trade in Q3 2016
[PLN mln]
36
24.5
36.2
-0.2
6.6
67.1
0
10
20
30
40
50
60
70
80
EBITDA Q3 2015 First contribution margin Internal costs Other factors EBITDA Q3 2016
Trade – EBITDA Q3 2016 bridge

35.1
6.0
-11.0
87.6
117,7
0
20
40
60
80
100
120
140
EBITDAQ1-Q3 2015
First contribution margin Internal costs Other factors EBITDAQ1-Q3 2016
Trade – EBITDA Q1-Q3 2016 bridge
Attachments
Att. 5 - Lower costs of written-off receivables, provisions for litigation and impairment of receivables supported the result of the area of trade in Q1-Q3 2016
[PLN mln]
37
Attachments
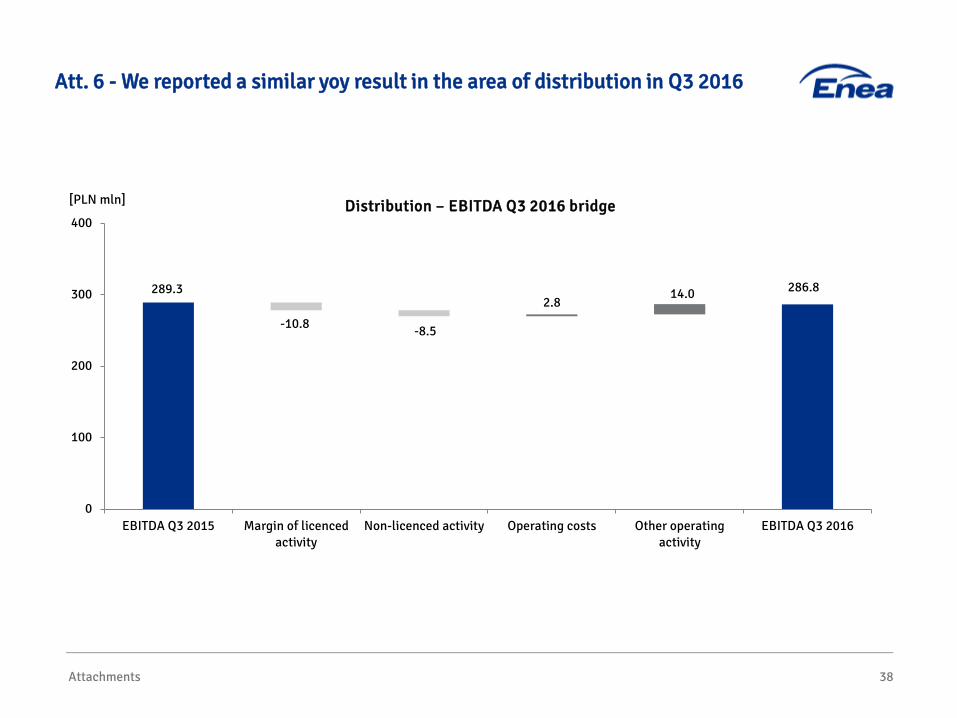
Att. 6 - We reported a similar yoy result in the area of distribution in Q3 2016
[PLN mln]
38
-10.8 -8.5
2.8 14.0 289.3 286.8
0
100
200
300
400
EBITDA Q3 2015 Margin of licencedactivity
Non-licenced activity Operating costs Other operatingactivity
EBITDA Q3 2016
Distribution – EBITDA Q3 2016 bridge

Attachments
Att. 7 - Higher margin on licensed activities and lower operating costs positively affected EBITDA in the area of distribution in Q1-Q3 2016
[PLN mln]
39
8.6 9.0
26.5
-19.5
832.9 857.5
0
200
400
600
800
1 000
EBITDAQ1-Q3 2015
Margin of licencedactivity
Non-licenced activity Operating costs Other operatingactivity
EBITDAQ1-Q3 2016
Distribution – EBITDA Q1-Q3 2016 bridge
Attachments
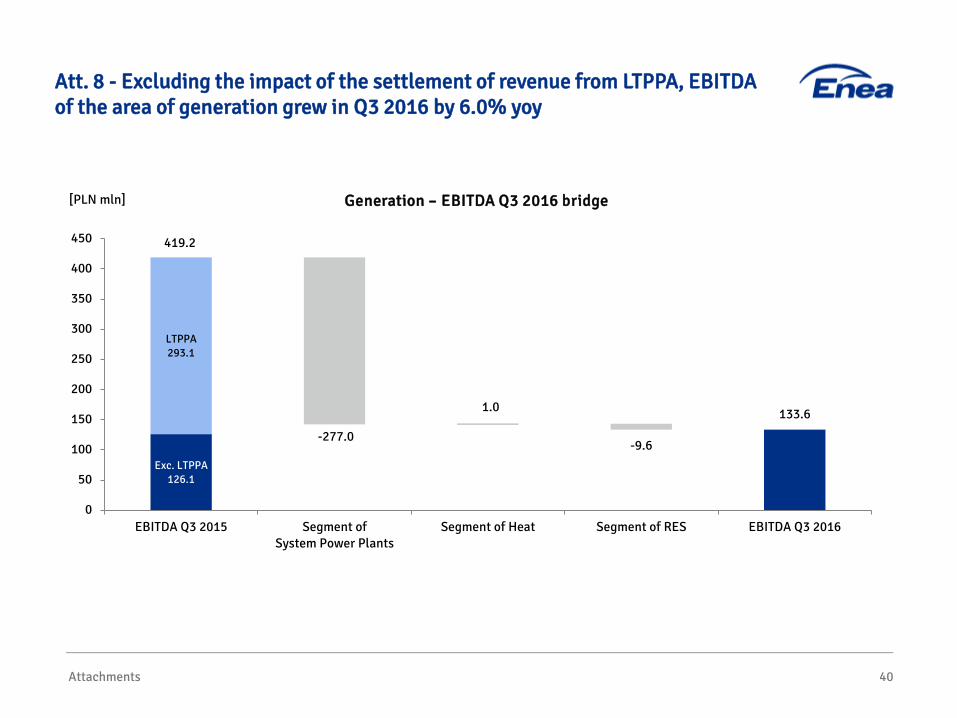
Att. 8 - Excluding the impact of the settlement of revenue from LTPPA, EBITDA of the area of generation grew in Q3 2016 by 6.0% yoy
[PLN mln]
40
419.2
Exc. LTPPA 126.1
-277.0
1.0
-9.6
LTPPA 293.1
133.6
0
50
100
150
200
250
300
350
400
450
EBITDA Q3 2015 Segment ofSystem Power Plants
Segment of Heat Segment of RES EBITDA Q3 2016
Generation – EBITDA Q3 2016 bridge
Attachments
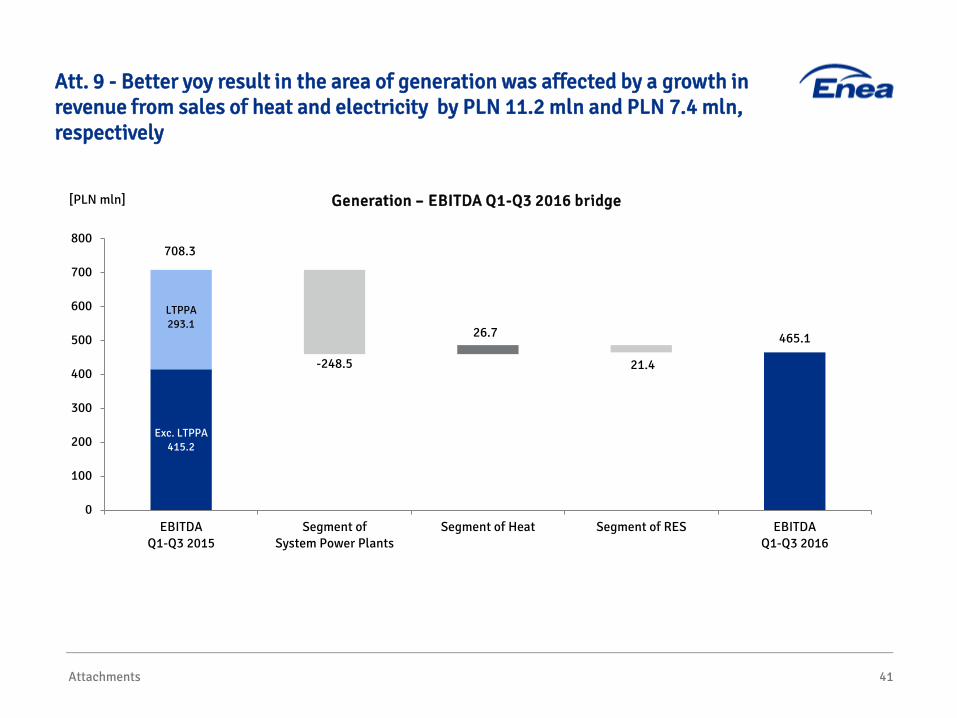
Att. 9 - Better yoy result in the area of generation was affected by a growth in revenue from sales of heat and electricity by PLN 11.2 mln and PLN 7.4 mln, respectively
[PLN mln]
41
708.3
Exc. LTPPA 415.2
-248.5
26.7
21.4
LTPPA 293.1
465.1
0
100
200
300
400
500
600
700
800
EBITDAQ1-Q3 2015
Segment ofSystem Power Plants
Segment of Heat Segment of RES EBITDAQ1-Q3 2016
Generation – EBITDA Q1-Q3 2016 bridge

Attachments
Att. 10 - Financial results of the segment of system power plants in Q3 2015 visibly demonstrate the impact of LTPPA settlement in the amount of PLN 293 mln
42
[PLN mln]
Generation, including:
System power plants Heat RES
Q3 2015 Q3 2016 Change Q3 2015 Q3 2016 Change Q3 2015 Q3 2016 Change
Sales revenue 973 699 -274 67 58 -8 15 12 -3
EBIT 361 90 -271 -14 -11 3 -2 -9 -7
EBITDA 411 134 -277 1 2 1 7 -2 -10
CAPEX 542 354 -188 12 28 16 19 0 -19
[PLN mln] System power plants Heat RES
Q1-Q3 2015
Q1-Q3 2016 Change Q1-Q3
2015 Q1-Q3 2016 Change Q1-Q3
2015 Q1-Q3 2016 Change
Sales revenue 2 312 2 118 -194 292 298 6 61 44 -17
EBIT 475 247 -228 11 46 35 3 -53 -56
EBITDA 622 373 -249 57 84 27 30 8 -21
CAPEX 1 322 880 -442 44 54 11 29 4 -25