endoplasmic reticulum stress links dyslipidemia to...
TRANSCRIPT

MOL(10165)
1
Title Page
Endoplasmic Reticulum Stress Links Dyslipidemia to
Inhibition of Proteasome Activity and Glucose Transport by
HIV Protease Inhibitors
Rex A. Parker, Oliver P. Flint, Ruth Mulvey, Carolina Elosua, Faye Wang,
William Fenderson, Shulin Wang,Wen-Pin Yang, Mustafa A. Noor
Metabolic and Cardiovascular Discovery Biology (R.A.P., S.W.), Discovery
Toxicology (O.P.F., R.M., C.E., F.W.), Applied Genomics (W.F., W.-P.Y.), and
Virology Medical Affairs (M.A.N)
Bristol-Myers Squibb Pharmaceutical Research Institute
311 Pennington-Rocky Hill Rd
Pennington 08534 USA
Molecular Pharmacology Fast Forward. Published on March 8, 2005 as doi:10.1124/mol.104.010165
Copyright 2005 by the American Society for Pharmacology and Experimental Therapeutics.
This article has not been copyedited and formatted. The final version may differ from this version.Molecular Pharmacology Fast Forward. Published on March 8, 2005 as DOI: 10.1124/mol.104.010165
at ASPE
T Journals on M
arch 19, 2020m
olpharm.aspetjournals.org
Dow
nloaded from

MOL(10165)
2
Running Title Page
Running Title:
ER Stress and Lipid Regulation by HIV Protease Inhibitors
Correspondence to:
Rex A. Parker, Ph.D.
Metabolic and Cardiovascular Discovery Biology
Bristol-Myers Squibb Pharmaceutical Research Institute
311 Pennington-Rocky Hill Rd
Pennington, NJ 08534
phone 609-818-3252 fax 609-818-7877 [email protected]
Number of text pages (double spaced), 18
Number of tables, 2
Number of figures, 4
Number of references, 44
Word count - Abstract, 237
Word count - Introduction, 691
Word count- Discussion, 1370
List of non-standard abbreviations:
ATF, activating transcription factor
CHOP, C/EBP homologous protein
ER, endoplasmic reticulum
GADD, growth arrest and DNA-damage inducible
GLUT, glucose transporter
HAART, highly active anti-retroviral treatment
RT-PCR, real time polymerase chain reaction
SREBP, sterol regulatory element binding protein
UPR, unfolded protein response
This article has not been copyedited and formatted. The final version may differ from this version.Molecular Pharmacology Fast Forward. Published on March 8, 2005 as DOI: 10.1124/mol.104.010165
at ASPE
T Journals on M
arch 19, 2020m
olpharm.aspetjournals.org
Dow
nloaded from

MOL(10165)
3
Abstract
The lipid and metabolic disturbances associated with HIV protease inhibitor therapy in AIDS have
stimulated interest in developing newer agents which minimize these side-effects in the clinic. The
underlying explanation of mechanism remains enigmatic, but a recently described link between
endoplasmic reticulum (ER) stress and dysregulation of lipid metabolism suggests a provocative
integration of existing and emerging data. We provide new evidence from in vitro models
indicating that proteasome inhibition and differential glucose transport blockade by protease
inhibitors are proximal events eliciting an ER stress transcriptional response which can regulate
lipogenic pathways in hepatocytes or adipocytes. Proteasome activity was inhibited in vitro by
several protease inhibitors at clinically relevant (micromolar) levels. In the intact cells, protease
inhibitors rapidly elicited a pattern of gene expression diagnostic of intracellular proteasome
inhibition and activation of an ER stress response. This included induction of transcription factors
GADD153, ATF4, and ATF3, amino acid metabolic enzymes, proteasome components, and
certain ER chaperones. In hepatocyte lines the ER stress response was closely linked to moderate
increases in lipogenic and cholesterogenic gene expression. However in adipocytes where glucose
transporter-4 (GLUT4) was directly inhibited by some protease inhibitors, time-dependent
suppression of lipogenic genes and triglyceride synthesis was observed in coordination with the
ER stress response. These results further link ER stress to dyslipidemia and contribute to a
unifying mechanism for the pathophysiology of protease inhibitor-associated lipodystrophy,
helping explain differences in clinical metabolic profiles among protease inhibitors.
This article has not been copyedited and formatted. The final version may differ from this version.Molecular Pharmacology Fast Forward. Published on March 8, 2005 as DOI: 10.1124/mol.104.010165
at ASPE
T Journals on M
arch 19, 2020m
olpharm.aspetjournals.org
Dow
nloaded from

MOL(10165)
4
Introduction
The development and clinical use of HIV-protease inhibitors has contributed greatly to treatment
of HIV-AIDS as a critical component of highly active anti-retroviral therapy (HAART) regimens.
With this efficacy has come recognition of an associated syndrome of metabolic side-effects which
is relevant in evaluating the long-term risk/benefit of treatment options (Calza et al., 2004). The
constellation of metabolic problems with protease inhibitors includes hyperlipidemia, insulin
resistance, peripheral lipoatrophy, central fat accumulation, and hepatic steatosis. Despite several
hypotheses to explain clinical findings, the cellular and molecular mechanisms underlying this
lipodystrophy-like syndrome are incompletely understood. Recent clinical studies in patients
(Calza et al., 2004; Woerle et al., 2003) and in normal subjects (Noor et al., 2004; Noor et al.,
2002; Purnell et al., 2000) have confirmed a direct connection between some protease inhibitors
and metabolic effects, despite the complexity of multi-drug therapy and virological and
immunological responses during HAART. The recent emergence of a newer generation of protease
inhibitor which exhibits antiviral efficacy without adverse affects on lipid or glucose parameters in
the clinic (Cahn et al., 2004; Haas et al., 2003; Murphy et al., 2003; Noor et al., 2004; Sanne et al.,
2003; Squires et al., 2004) provided an opportunity to reexamine the molecular pharmacology and
toxicology of the protease inhibitor class.
Previous studies revealed that protease inhibitors interfere with key intracellular processes
regulating glucose and lipid metabolism in major insulin responsive tissues. Several protease
inhibitors directly inhibit glucose transporter activity in adipocytes, in particular GLUT4 which is
essential for normal insulin-responsive glucose uptake in adipose and muscle (Hertel et al., 2004;
Hruz et al., 2001; Murata et al., 2000). Differential inhibition of GLUT4 is believed to explain
This article has not been copyedited and formatted. The final version may differ from this version.Molecular Pharmacology Fast Forward. Published on March 8, 2005 as DOI: 10.1124/mol.104.010165
at ASPE
T Journals on M
arch 19, 2020m
olpharm.aspetjournals.org
Dow
nloaded from

MOL(10165)
5
differences between HIV protease inhibitors on insulin-stimulated glucose disposal in clinical
studies using the euglycemic hyperinsulinemic clamp technique (Noor et al., 2004; Noor et al.,
2002).
Protease inhibitors also appear to influence lipid and cholesterol metabolism by inhibiting the
degradation of the key transcription factors which control lipid pathways, the sterol regulatory
element binding proteins (SREBPs). Degradation of nuclear SREBPs by the proteasome was
directly demonstrated in mammalian cells (Hirano et al., 2001), and proteasome activity was
unexpectedly shown to be inhibited by some HIV protease inhibitors in vitro.(Pajonk et al., 2002;
Schmidtke et al., 1999) However, effects of HIV protease inhibitors on SREBP levels,
translocation, and on SREBP-targeted lipogenic gene expression in liver and adipose tissue have
proven to be complex.(Caron et al., 2003; Dowell et al., 2000; Hui, 2003) Further insight into the
role of proteasome came from studies showing that processing of apolipoprotein B by proteasome
activity in hepatocytes is perturbed by HIV protease inhibitor treatment in HepG2 cells (Liang et
al., 2001), which could contribute to dyslipidemia.
Interference with proteasome function could underlie the lipid effects of protease inhibitors to a
greater extent than previously suggested. The surveillance function of proteasome coordinates
protein synthesis, folding, and trafficking in the endoplasmic reticulum (ER), and its disruption
triggers an adaptive mechanism termed the unfolded protein response (UPR) or more generally the
ER stress response. This includes activation of transcription factors and downstream effectors
including ER chaperones and amino acid and protein metabolic enzymes (Kaufman et al., 2002;
Travers et al., 2000). Other physiological factors, notably glucose or nutrient deprivation,
influence ER stress and affect the scope and extent of the transcriptional response.(Kaufman et al.,
This article has not been copyedited and formatted. The final version may differ from this version.Molecular Pharmacology Fast Forward. Published on March 8, 2005 as DOI: 10.1124/mol.104.010165
at ASPE
T Journals on M
arch 19, 2020m
olpharm.aspetjournals.org
Dow
nloaded from
MOL(10165)
6
2002) Recently it was reported that ER stress is exacerbated by intracellular lipid deposition, and
that obesity and metabolic disturbances are closely linked to ER stress and its consequences in
both adipose tissue and liver (Ozcan et al., 2004).
The topology and localization of lipid synthetic enzymes in the ER suggested that further
investigation of the relationship between the ER stress response and lipogenesis could provide new
insights into protease inhibitor associated lipid disorders. As first described in preliminary reports
(Parker, 2003), these studies revealed a deeper mechanistic link between cellular adaptive
responses to protease inhibitors and the transcriptional regulation of lipid metabolism in adipocytes
and hepatocytes. The results of these experiments contribute to an integrated mechanism extending
previous hypotheses, and help to explain the differences in metabolic profiles observed among the
HIV protease inhibitors in clinical use.
This article has not been copyedited and formatted. The final version may differ from this version.Molecular Pharmacology Fast Forward. Published on March 8, 2005 as DOI: 10.1124/mol.104.010165
at ASPE
T Journals on M
arch 19, 2020m
olpharm.aspetjournals.org
Dow
nloaded from

MOL(10165)
7
Materials and Methods
Cell culture. HepG2 cells (human hepatoma cell line), TC5 cells (human transformed normal
hepatocyte line), and 3T3-L1 adipocytes (mouse preadipocytes differentiated to mature fat cells by
standard protocols for 5 days prior to studies) were treated for 24 hr or for the time courses
indicated with HIV protease inhibitors at the indicated concentrations in culture media containing
10% FBS. Primary rat adipocytes from normal male Wistar rats were obtained by standard
collagenase isolation technique and incubated in Krebs-Ringer Hepes buffer with 2% albumin.
Biochemicals. Protease inhibitors lopinavir, nelfinavir, ritonavir, and saquinavir were purified by
reverse phase HPLC from commercial pharmaceutical preparations. Atazanavir was provided in
pure form by BMS Chemistry Division. Purified protease inhibitors and stock solutions in DMSO
were stored at -20ºC. Drugs stocks in DMSO were diluted into culture media containing bovine
serum or albumin to aid solublity, and sterile filtered prior to use. Solutions were monitored
microscopically to avoid possible precipitation of drugs. Vehicle control incubations received the
same final DMSO concentration as all drug-treated incubations (0.1%). Proteasome fluorogenic
peptide substrates suc-LLVY-amc and Boc-LRR-amc were obtained from Bachem, and human
20S proteasome preparation was obtained from Chemicon.
Lipid biosynthesis. Triglyceride and cholesterol synthesis were assayed in cells by incorporation
of 2-[14C]-acetate (1 µCi/mL) over the final 3 hr of 24 hr incubations with protease inhibitors or
times indicated. Lipids were extracted from cells in organic solvents and separated by planar
This article has not been copyedited and formatted. The final version may differ from this version.Molecular Pharmacology Fast Forward. Published on March 8, 2005 as DOI: 10.1124/mol.104.010165
at ASPE
T Journals on M
arch 19, 2020m
olpharm.aspetjournals.org
Dow
nloaded from

MOL(10165)
8
chromatography followed by determination of radioactivity by microarray channel detector
(Packard Instant Imager).
Glucose transporter (GLUT) assay. 3T3-L1 adipocytes were incubated with protease inhibitors in
Krebs-Ringer Hepes buffer with 2% fetal bovine serum for 30 min, followed by addition of 1µM
insulin for 20 min, and then GLUT activity was assayed as uptake of [3H]2-deoxyglucose for 10
min essentially as described previously(Murata et al., 2000). Primary adipocytes followed the
same protocol except that the buffer was supplemented with 2% albumin.
FPLC Superose-6 isolation and assay of proteasome activity. Native proteasome fractions were
prepared from cultures of HepG2 cells and 3T3-L1 cells (as undifferentiated preadipocytes)
following the method of Rodgers et al. (Rodgers and Dean, 2003), briefly as follows. Cells grown
in 225 cm2 flasks were harvested at 80-90% confluency, and cells were lysed by shaking for 30
min at 4 degrees C in 20 mM Tris-HCl, pH 7.5, with 10% glycerol, 5 mM ATP, and 0.2% NP-40
(buffer A). Lysates were centrifuged at 10,000 X G for 10 min and the supernatant was collected
and concentrated 10-fold in Centricon Plus-20 centrifuge filters (100 kD MW cutoff), followed
freezing at -80 degrees. Aliquots (150 µL) of once-thawed concentrates were chromatographed by
gel filtration on an AKTA FPLC system using Superose-6 gel filtration in buffer A at 0.50
mL/min, and fractions of 300 µL were collected at 20 degrees C. For the assay of proteasome
activity, 10 µL aliquots of each FPLC fraction were incubated in 96-well plates containing 20 mM
Tris-HCl ph 7.5 with or without respective inhibitors added with mixing to provide final
concentrations indicated in Figures, and a final DMSO level of 0.1%, in a total volume of 100 µL.
The enzyme assay was then initiated by addition of the fluorogenic protease substrate succinyl-7-
amino-4-methylcoumarin (suc-LLVY-amc) at 50 µM (final), mixing, and incubation at 37 degrees
This article has not been copyedited and formatted. The final version may differ from this version.Molecular Pharmacology Fast Forward. Published on March 8, 2005 as DOI: 10.1124/mol.104.010165
at ASPE
T Journals on M
arch 19, 2020m
olpharm.aspetjournals.org
Dow
nloaded from

MOL(10165)
9
C for 45 min, followed by determination of amc product fluorescence in a Cytofluor-2 plate reader
at 380ex/460em. Product formation was linearly proportional to time and enzyme concentration.
Proteasome activity units are defined as relative fluorescence of LLVY-amc product per assay
under these conditions. Purified human erythrocyte 20S proteasome preparations were obtained
from Chemicon Intl. (cat # APT280). Aliquots of 20S proteasome were incubated with protease
inhibitors in vitro, followed by the assay of chymotryptic proteolytic activity using the fluorogenic
substrate suc-LLVY-AMC as described above and essentially according to (Schmidtke et al.,
1999). Reaction rates were determined over a 30 min incubation period and percent inhibition was
calculated.
RNA isolation. Total cellular RNA was isolated from cultured HepG2, TC5, and 3T3-L1 cells,
using the standard Qiagen method including treatment with DNase. cDNA and cRNA were
generated from the cellular RNA using Invitrogen and Enzo LifeScience methods for gene
expression profiles and RT-PCR.
Transcriptional profiling. Affymetrix gene profiling (Human U133A chips, with 22214 total RNA
sequences profiled; and murine U74Av2 chips with 12422 RNA sequences) was conducted to
assess gene expression. RNA samples were isolated from triplicate cell incubation samples
(HepG2) or from duplicate cell incubation samples repeated twice (adipocytes). Affymetrix
recommended protocol was used in the generation of cRNA probe and hybridization of chips.
Suite version 5.0 was used to scan and quantitate the chip. Data were evaluated for Affymetrix P
call, average change in expression (ratio of mean drug-treated/ mean control), and significance of
difference between drug treated and control determined by t test (P<0.01 taken as significant).
Results for key genes were confirmed by real time polymerase chain reaction (RT-PCR).
This article has not been copyedited and formatted. The final version may differ from this version.Molecular Pharmacology Fast Forward. Published on March 8, 2005 as DOI: 10.1124/mol.104.010165
at ASPE
T Journals on M
arch 19, 2020m
olpharm.aspetjournals.org
Dow
nloaded from

MOL(10165)
10
Real-time polymerase chain reaction (RT-PCR). To confirm and extend the transcription profiles,
mRNA for selected genes was assayed by RT-PCR in RNA samples taken from independent
experiments employing cell incubation time courses. SYBR green RT-PCR protocols were used to
assay relative changes in gene expression, quantitated by the ∆∆CT method, and mRNA values for
each gene were normalized to internal control cyclophilin B mRNA. The ratio of normalized mean
value for drug treated groups to vehicle control was calculated and is given in the graphs.
This article has not been copyedited and formatted. The final version may differ from this version.Molecular Pharmacology Fast Forward. Published on March 8, 2005 as DOI: 10.1124/mol.104.010165
at ASPE
T Journals on M
arch 19, 2020m
olpharm.aspetjournals.org
Dow
nloaded from

MOL(10165)
11
Results
Proteasome Inhibition by HIV Protease Inhibitors
Five HIV protease inhibitors currently in clinical use were assayed for inhibition of proteolytic
cleavage activity in purified human 20S proteasome samples. Concentration-dependent inhibition
of chymotryptic activity was observed at levels >1 µM for several of the protease inhibitors
(Figure 1a). The rank order and IC50 values for 20S proteasome inhibition were saquinavir (IC50
= 3 µM), nelfinavir (4 µM), lopinavir (9 µM), ritonavir (11 µM), and atazanavir (26 µM). A
procedure to isolate and assay 26S/20S proteasome from mammalian cells described previously
(Rodgers and Dean, 2003) was adapted to assay the high molecular weight proteolytic activity in
FPLC Superose-6 gel filtration fractions isolated from 3T3-L1 and HepG2 cell lysates (Figure 1b).
The lactacystin-inhibitable fractions were pooled and concentrated, and used as the sources of
26S/20S proteasome to assay the effects of HIV protease inhibitors on the hydrolysis of
chymotryptic and tryptic fluorogenic peptide substrates. In proteasome preparations from both cell
types, lactacystin inhibited chymotryptic activity potently (IC50 < 1 µM) and tryptic activity
moderately (IC50 ~ 20 µM), while MG132 strongly inhibited the tryptic activity (IC50 < 1 µM)
(Figure 1c), consistent with the properties of these well-characterized, high affinity proteasome
inhibitors (Rodgers and Dean, 2003; Zimmermann et al., 2000). In comparison to these controls,
the HIV protease inhibitors moderately inhibited proteasome chymotryptic activity at micromolar
levels in the HepG2 and 3T3-L1 preparations, with modest differences between compounds
observed (Figure 1c). Weaker inhibition of tryptic activity was also observed under these
conditions (Figure 1c).
This article has not been copyedited and formatted. The final version may differ from this version.Molecular Pharmacology Fast Forward. Published on March 8, 2005 as DOI: 10.1124/mol.104.010165
at ASPE
T Journals on M
arch 19, 2020m
olpharm.aspetjournals.org
Dow
nloaded from

MOL(10165)
12
Effects of Protease Inhibitors on Lipogenesis and Glucose Transport in Adipocyte and
Hepatocyte Models
Before incubation with protease inhibitors, 3T3-L1 adipocytes were first differentiated for 5 days
to reach a distinct lipid storage droplet morphology with an avid triglyceride biosynthesis rate.
Under these conditions, exposure to HIV protease inhibitors at micromolar concentrations for 24
hours suppressed adipocyte triglyceride synthesis, assayed as the incorporation of [14C]-acetate
precursor at the end of the incubation (Figure 2a). Varying potencies were observed for the five
protease inhibitors tested. In time course studies (up to 48 hours), the decrease in cellular lipid
biosynthesis was time-dependent with greatest effect at 24 hr incubation (Figure 2b). Under these
conditions protease inhibitors did not affect cellular ATP levels suggesting that they were not
cytotoxic.
In adipose tissue, glucose uptake is required for glycolysis, yielding energy and lactate as well as
provision of glycerol-3-phosphate (through the action of glycerol-3-phosphate dehydrogenase on
dihydroxyacetone phosphate) essential as precursor for the triglyceride backbone. In 3T3-L1
adipocytes under conditions similar to those used to assay lipogenesis, the protease inhibitors
acutely inhibited 2-deoxyglucose uptake assayed in the presence of insulin, with different
magnitudes of glucose transport inhibition seen with each protease inhibitor (Figure 2c). The 3T3-
L1 cells under these conditions expressed approximately equal levels of both GLUT4 and GLUT1
mRNA. To better evaluate GLUT4-dependent effects, additional studies were conducted using
primary rat adipocytes which express relatively high levels of GLUT4. In the primary adipocytes,
ritonavir acutely inhibited insulin-stimulated glucose transport to a level near the insulin-free
control value (Figure 2d). Lactate released into the medium by the adipocytes over a 6 hr
incubation was concomitantly inhibited by ritonavir in parallel incubations, while atazanavir was
This article has not been copyedited and formatted. The final version may differ from this version.Molecular Pharmacology Fast Forward. Published on March 8, 2005 as DOI: 10.1124/mol.104.010165
at ASPE
T Journals on M
arch 19, 2020m
olpharm.aspetjournals.org
Dow
nloaded from

MOL(10165)
13
essentially without effect on either endpoint (Figure 2d). These data demonstrate that protease
inhibitors differentially inhibit GLUT4 mediated glucose uptake by adipocytes, and limit the
intracellular availability of glucose resulting in diminished formation of a glucose-derived
metabolite, lactate.
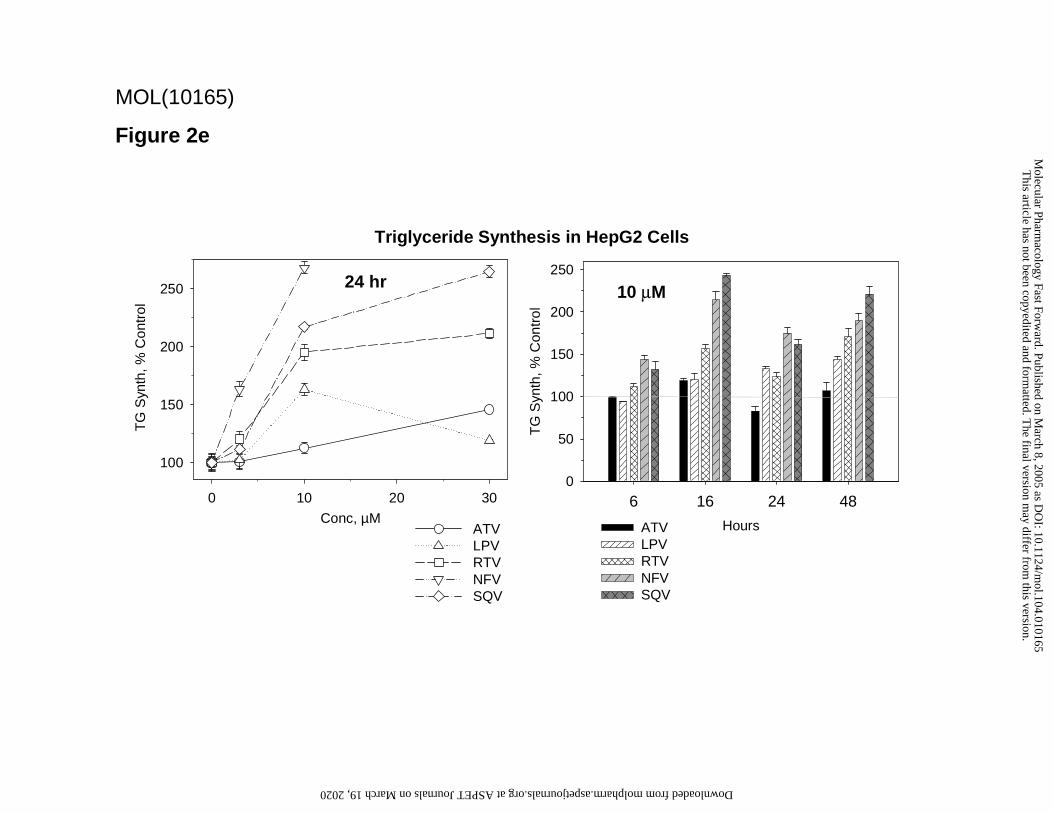
In contrast to the suppression observed in adipocytes, in HepG2 cells protease inhibitors tended to
increase lipogenesis. Triglyceride biosynthesis rate was elevated to varying degrees by the five
compounds studied over 3 to 30 µM at 24 hr, and 6 to 48 hr at 10 µM (Figure 2e). Cholesterol
synthesis under the same conditions in HepG2 cells did not change or was modestly increased (up
to 20% increase over control). No effect on cellular ATP levels was observed under these
conditions, suggesting the lack of cytotoxicity. The increases in lipogenesis in HepG2 cells were
observed at concentration ranges of the protease inhibitors which resulted in proteasome inhibition
in vitro, although the apparent potencies in the two assays were only roughly correlated. Unlike the
adipocytes, under conditions in which lipid synthesis was affected, glucose uptake was not
significantly affected by any of the protease inhibitors studied in HepG2 cells. The lack of glucose
transport inhibition is consistent with the finding that HepG2 cells express GLUT3 and GLUT1,
which are relatively insensitive to inhibition by HIV protease inhibitors, but do not express
GLUT4 which is sensitive.
Gene Expression Profiles in Hepatocyte and Adipocyte Models
Affymetrix gene expression profiling was conducted to further evaluate cellular and molecular
adaptive responses to the effects of protease inhibitors. Cells were treated for 24 hr with vehicle
control or protease inhibitors under the conditions used in the functional assays, followed by
This article has not been copyedited and formatted. The final version may differ from this version.Molecular Pharmacology Fast Forward. Published on March 8, 2005 as DOI: 10.1124/mol.104.010165
at ASPE
T Journals on M
arch 19, 2020m
olpharm.aspetjournals.org
Dow
nloaded from
MOL(10165)
14
mRNA isolation. Overall, fewer than 1% of the profiled RNA sequences increased or decreased by
greater than 2-fold vs. controls for any of the protease inhibitors tested (from a total of 22214 and
12422 total sequences analyzed for HepG2 cells and adipocytes, respectively). Of the genes
significantly affected, approximately four times as many were induced than repressed in HepG2
cells (Figure 3a). In comparison, an opposite general pattern emerged from the adipocytes, with
more genes repressed than induced (Figure 3b). Differences between the individual protease
inhibitors were apparent (Figures 3a and 3b).
Detailed analysis of the expression profile in HepG2 cells revealed induction of several
transcription factors which regulate expression of ER stress response components, including
CHOP/GADD153, ATF4, C/EBP-β, C/EBP-γ, and the proteasome-interacting LIM-domain-only
protein CSRP3e (Table 1). Multiple genes for amino acid biosynthesis and transport, amino acyl
tRNA synthetases, glutathione metabolism, and chaperones such as the DnaJ/HSP40 homologs
involved in the ER stress response were also induced (Table 1). Other genes involved in
proteasome and ER function were also induced, including ubiquitin ligase, stanniocalcin-2,
calmegin, and exportin T. Suppression of serum and glucocorticoid-regulated kinase (SGK), a
regulator of the E3 ubiquitin-protein ligase (Nedd4-2) was observed. The magnitudes of change in
ER stress and UPR gene expression in HepG2 cells were lower for atazanavir than the other
protease inhibitors tested (Table 1).
Lipogenic Gene Expression in Coordination with ER Stress Response
The ER stress response to HIV protease inhibitors in HepG2 cells was associated with moderate
but significant increases in mRNA encoding several enzymes of fatty acid and cholesterol
This article has not been copyedited and formatted. The final version may differ from this version.Molecular Pharmacology Fast Forward. Published on March 8, 2005 as DOI: 10.1124/mol.104.010165
at ASPE
T Journals on M
arch 19, 2020m
olpharm.aspetjournals.org
Dow
nloaded from

MOL(10165)
15
biosynthesis pathways (Table 1). These included acetyl CoA carboxylase, fatty acyl CoA ligase,
fatty acid synthase, diacylglycerol acyltransferase, HMGCoA reductase, mevalonate kinase,
Nieman-Pick protein C1 (NPC1), and the LDL receptor. The gluconeogenic enzyme PEPCK, a
known target of ATF4, was induced along with glucokinase regulatory protein (Table 1). The
expression profile exhibited concentration-dependency over the range of 3 to 10 µM (for
nelfinavir) or 10 to 30 µM (for ritonavir and atazanavir) for several of these genes, similar to the
concentration dependencies in the functional assays. Interestingly, expression of SREBP-1c and
XBP-1 mRNA was not significantly affected by the protease inhibitors.
The Affymetrix transcription profile was confirmed and extended in separate experiments with
HepG2 cells and the human hepatocyte TC5 cell line by quantitative RT-PCR. Coordinate
induction of genes representing the ER stress response, amino acid homeostasis, and
lipid/metabolic pathways were observed in time courses (Fig 4a). Marked, rapid increases in
mRNA for ATF4 (to 15-fold), GADD153 (to 12-fold), and CEBP/β (to 6-fold) were observed for
nelfinavir, ritonavir, and lopinavir in the hepatocyte cell line, while atazanavir treated cells
remained relatively quiescent over the 32 hr time course (Fig 4a). These changes were closely
followed by induction of asparagine synthetase (up to >60-fold with nelfinavir), ACC-α (to 4-fold
with ritonavir), and PEPCK (to 25-fold with lopinavir).
Down-regulation of Lipogenesis Genes in Adipocytes
The expression profile in adipocytes revealed induction of transcription factors and mediators of
the ER stress response (ATF3, GADD153, ATF4, and GADD45), enzymes of amino acid,
glutathione, and protein metabolism, and other components of the ER stress response, consistent
This article has not been copyedited and formatted. The final version may differ from this version.Molecular Pharmacology Fast Forward. Published on March 8, 2005 as DOI: 10.1124/mol.104.010165
at ASPE
T Journals on M
arch 19, 2020m
olpharm.aspetjournals.org
Dow
nloaded from

MOL(10165)
16
with proteasome inhibition and the UPR (Table 2). However, in contrast to the hepatocyte models,
the key lipogenic transcription factors (PPAR-γ and SREBP-1c) and multiple enzymes of the lipid
biosynthesis pathways were down-regulated in the adipocytes (Table 2). Key lipogenic enzymes
suppressed by protease inhibitors in adipocytes included FAS, G3PDH, acyl-CoA ligases, HSL,
hydroxysteroid dehydrogenase-1, and DGAT. An exception to this pattern was the induction of the
cholesterol trafficking protein NPC1 (also induced in HepG2 cells). The adipocytokines
adiponectin and resistin were down-regulated, as was the intracellular cholesterol binding protein
caveolin. Other metabolic enzymes suppressed in adipocytes included PEPCK and
phosphofructokinase-bisphosphatase.
Time course experiments in 3T3-L1 adipocytes using RT-PCR revealed rapid and strong induction
of mRNA for GADD153 (to 6-fold with nelfinavir) and ATF3 (up to 35-fold with lopinavir),
consistent with the ER stress response (Figure 4b). The cholesterol trafficking gene NPC1 was also
induced (to 5-fold with lopinavir). Atazanavir-treated cells were relatively unaffected . In
agreement with the transcription profiles and lipid functional data, PCR assays showed time-
dependent suppression of representative lipid and adipogenic genes in the adipocytes, with
G3PDH, FAS, and adiponectin reaching maximal suppression by 24 hr (Figure 4b). The time
courses also exhibited a return of gene expression towards baseline levels at 32 hr for both the ER
stress and lipogenic genes, suggesting that the cells successfully mounted an effective counter-
regulatory response to the effects of the protease inhibitors.
This article has not been copyedited and formatted. The final version may differ from this version.Molecular Pharmacology Fast Forward. Published on March 8, 2005 as DOI: 10.1124/mol.104.010165
at ASPE
T Journals on M
arch 19, 2020m
olpharm.aspetjournals.org
Dow
nloaded from

MOL(10165)
17
Discussion
The present studies add to a growing body of evidence directly linking the molecular
pharmacology of HIV protease inhibitors to lipid and metabolic disturbances, including
lipoatrophy, dyslipidemia, and insulin resistance. The marked down-regulation of lipogenic
pathways in differentiated adipocytes contrasts with moderate up-regulation in hepatocytes,
mirroring the clinical picture of lipoatrophy due to depletion of adipose triglyceride stores
simultaneously with hepatic lipid overproduction and hyperlipidemia. The current findings help to
integrate several mechanisms previously proposed for clinical side effects of protease inhibitors,
including inhibition of glucose transport (Hertel et al., 2004; Hruz et al., 2001; Murata et al.,
2000), suppression of adipocyte differentiation and lipogenesis (Caron et al., 2003; Dowell et al.,
2000), and overproduction of lipids and disturbed apoB processing by liver (Hui, 2003; Lenhard et
al., 2000; Riddle et al., 2001). The data support an expanded role for the proteasome in linking ER
stress responses with lipid and glucose regulation and membrane formation (Cox et al., 1997;
Ozcan et al., 2004; Werstuck et al., 2001).
HIV protease inhibitors decreased proteasome chymotryptic activity and to a lesser extent tryptic
activity in vitro at concentrations similar to the ranges that elicited gene expression and lipid
functional effects in cells and inhibited glucose transport in adipocytes. These concentration-
dependencies are similar to the ranges of therapeutic plasma levels of protease inhibitors observed
clinically (based on Physician’s Desk Reference values). The data indicate that, relative to the high
affinity (nanomolar) proteasome inhibitors lactacystin and MG132, the HIV protease inhibitors are
weak to moderate inhibitors of proteasome activity. The current results are consistent with
previous reports that ritonavir and saquinavir inhibit chymotryptic activity of 20S proteasome in
This article has not been copyedited and formatted. The final version may differ from this version.Molecular Pharmacology Fast Forward. Published on March 8, 2005 as DOI: 10.1124/mol.104.010165
at ASPE
T Journals on M
arch 19, 2020m
olpharm.aspetjournals.org
Dow
nloaded from

MOL(10165)
18
vitro and decrease protein degradation in cells (Gaedicke et al., 2002; Pajonk et al., 2002;
Schmidtke et al., 1999). Our findings support the idea that protease inhibitors, nanomolar
inhibitors of the HIV protease, are micromolar modulators of mammalian proteasome function and
specificity, and at therapeutic levels can significantly affect processing and trafficking of specific
proteins in the cell and trigger a counter-regulatory response.
Our observations are consistent with previous reports implicating interference by HIV protease
inhibitors with processing of nuclear transcription factors SREBP-1 and –2, C/EBP-α, and PPAR-
γ (Caron et al., 2003; Dowell et al., 2000; Hui, 2003). Proteolytic events control SREBP
processing in the ER and Golgi as well the nucleus (Hirano et al., 2001). Nuclear turnover of
SREBP was shown to be blocked by ritonavir in liver and adipose leading to observed increases in
nuclear SREBP levels. (Hui, 2003; Riddle et al., 2001) These considerations support a broader
role for proteasomal processing and degradation in cytoplasmic translocation, subnuclear
localization, and coactivation of nuclear transcription factors. (Dino Rockel and von Mikecz, 2002;
Nawaz and O'Malley, 2004)
Outside the nucleus, inhibition of proteasome activity in the ER and cytoplasm diminishes the
efficient removal of misfolded nascent proteins, triggering the surveillance function of the
UPR.(Travers et al., 2000) The expression profiles in HepG2 cells and 3T3-L1 adipocytes reveal
induction of the UPR signature genes ATF4, ATF3, GADD153, and GADD34. ATF4 and ATF3
are basic leucine zipper transcription factors which co-regulate the eIF2 kinase stress pathway,
leading to induction of GADD153 and the eIF2 protein phosphatase regulatory subunit GADD34,
ultimately providing feedback control and recovery from the UPR.(Jiang et al., 2004) In our time
course data, gene expression trended back towards baseline at 32 hr, suggesting an effective
This article has not been copyedited and formatted. The final version may differ from this version.Molecular Pharmacology Fast Forward. Published on March 8, 2005 as DOI: 10.1124/mol.104.010165
at ASPE
T Journals on M
arch 19, 2020m
olpharm.aspetjournals.org
Dow
nloaded from
MOL(10165)
19
counter-regulatory response and recovery from the ER stress. The expression profiles for HIV
protease inhibitor treated cells in our studies include several of the genes affected by the high
affinity proteasome inhibitors lactacystin and MG-132 in human glioma cells, including ATF3 and
GADD153 (Zimmermann et al., 2000). The upregulation by HIV protease inhibitors of the
DnaJ/HSP-40 family of chaperone proteins in both the HepG2 and adipocyte profiles is consistent
with the role of these proteins in regulating the ATPase activity and substrate binding of the
chaperone Hsp70 in nascent protein processing (Shen et al., 2002). While the interpretion of the
present data relying largely on mRNA changes would be confirmed by assays of ER stress
responses at the protein or biochemical level, the consistency of the transcrpitional regulation
observed leads to a strong conclusion of UPR and ER stress response under the conditions of the
experiments.
The induction of amino acid synthetic enzymes, transporters, and amino acyl-tRNA synthetases as
seen in our expression profiles suggests signaling through decreased intracellular amino acid and
amino acyl-tRNA pools. Other studies have demonstrated that glucose as well as amino acid
deprivation up-regulates nutrient responsive genes such as asparagine synthetase. This is mediated
by ATF4 and C/EBPβ induction and activation of their target gene promoter nutrient-response
elements, while increasing ATF3 expression serves to counter-regulate these target genes.(Pan et
al., 2003; Siu et al., 2002) Interestingly, asparagine synthetase was highly induced by protease
inhibitors in HepG2 cells, which also exhibited significant elevations in ATF4 and C/EBPβ but not
ATF3. In contrast, adipocytes expressed higher ATF3 than ATF4 and did not increase asparagine
synthetase expression in our profiles. Consistent with a role for ATF4 in HepG2 cell responses, we
also observed high induction of stanniocalcin-2 by protease inhibitors, a gene recently described as
a target of ATF4 induction in the UPR. (Ito et al., 2004)
This article has not been copyedited and formatted. The final version may differ from this version.Molecular Pharmacology Fast Forward. Published on March 8, 2005 as DOI: 10.1124/mol.104.010165
at ASPE
T Journals on M
arch 19, 2020m
olpharm.aspetjournals.org
Dow
nloaded from
MOL(10165)
20
Several clinical studies suggest that lipoatrophy of peripheral/subcutaneous adipose tissues is a
major feature of the HIV-associated lipodystrophy syndrome and of the use of protease
inhibitors.(Carr, 2000) The use of nucleoside reverse transcriptase inhibitors is also associated with
lipoatrophy (Nolan and Mallal, 2004), and it has been proposed that the combination of this class
with protease inhibitors may amplify this component of the syndrome. While it is nearly
impossible to fully separate the effects of the drug classes in the clinical data, animal models have
demonstrated lipoatrophy in protease inhibitor treated mice (Goetzman et al., 2003) as well
hypertriglyceridemia and liver and adipose SREBP pathway disturbances in mice.(Riddle et al.,
2001) It is possible that subcutaneous fat may be more sensitive than central fat depots to
diminished expression of PPAR-gamma and other changes in gene expression which we and others
have observed with protease inhibitors. Since insulin profoundly inhibits lipolysis in adipocytes,
the effects of protease inhibitors on insulin resistance could also contribute to lipolysis and
diminished fat storage seen in lipoatrophy.
In summary, our findings of protease inhibitor-specific effects on gene expression and lipid and
glucose metabolism in in vitro models are consistent with emerging reports of clinical trials that
describe metabolic and lipid profiles following treatment with the various agents (Cahn et al.,
2004; Johnson, 2005; Wood et al., 2004). Future studies directed towards the comparative profiles
of the different members of the protease inhibitor class may help address whether the in vitro
properties are predictive of human clinical findings. The effects observed in the present studies on
glucose transporter activity (particularly GLUT4) in adipocytes are consistent with recent reports
showing differential effects on glucose disposal in human subjects studied by euglycemic
hyperinsulinemic clamp technique.(Noor et al., 2004; Noor et al., 2002). The dysregulation of
This article has not been copyedited and formatted. The final version may differ from this version.Molecular Pharmacology Fast Forward. Published on March 8, 2005 as DOI: 10.1124/mol.104.010165
at ASPE
T Journals on M
arch 19, 2020m
olpharm.aspetjournals.org
Dow
nloaded from

MOL(10165)
21
lipogenesis and the ER stress responses in liver and adipocyte cellular models were seen at
concentrations near or below respective therapeutic plasma levels in patients, suggesting that they
could be related to the clinical lipid profiles of the protease inhibitors (Calza et al., 2004; Haas et
al., 2003; Murphy et al., 2003; Sanne et al., 2003; Squires et al., 2004). Although controlled long
term data on changes in body fat distribution are not yet available, it is interesting to note that
peripheral fat loss and lipodystrophy have not been observed on atazanavir-containing HAART
regimens at up to 48 weeks treatment.(Haerter et al., 2004)
Finally, the data suggest several candidate genes and pathways as targets for further exploration in
genotyping and pharmacogenomic analysis of susceptibility to dyslipidemia, lipodystrophy, and
related metabolic disturbances in HIV. Together with work by others, our findings support a
unifying hypothesis that protease inhibitors induce ER stress through proteasome inhibition,
resulting in contrasting effects on lipogenic pathways in adipocytes and hepatocytes depending on
the cell-specific degree of glucose transport inhibition. Taken together, these processes would
contribute to excessive hepatic lipid production but diminished storage of fat in peripheral
subcutaneous adipose tissue, and may explain clinical observations of dyslipidemia, insulin
resistance, and fat redistribution.
This article has not been copyedited and formatted. The final version may differ from this version.Molecular Pharmacology Fast Forward. Published on March 8, 2005 as DOI: 10.1124/mol.104.010165
at ASPE
T Journals on M
arch 19, 2020m
olpharm.aspetjournals.org
Dow
nloaded from
MOL(10165)
22
References
Cahn PE, Gatell JM, Squires K, Percival LD, Piliero PJ, Sanne IA, Shelton S, Lazzarin A, Odeshoo L, Kelleher TD, Thiry A, Giordano MD and Schnittman SM (2004) Atazanavir--a once-daily HIV protease inhibitor that does not cause dyslipidemia in newly treated patients: results from two randomized clinical trials. J Int Assoc Physicians AIDS Care (Chic Ill) 3:92-8.
Calza L, Manfredi R and Chiodo F (2004) Dyslipidaemia associated with antiretroviral therapy in HIV-infected patients. J Antimicrob Chemother 53:10-4.
Caron M, Auclair M, Sterlingot H, Kornprobst M and Capeau J (2003) Some HIV protease inhibitors alter lamin A/C maturation and stability, SREBP-1 nuclear localization and adipocyte differentiation. Aids 17:2437-44.
Carr A (2000) HIV protease inhibitor-related lipodystrophy syndrome. Clin Infect Dis 30 Suppl 2:S135-42.
Cox JS, Chapman RE and Walter P (1997) The unfolded protein response coordinates the production of endoplasmic reticulum protein and endoplasmic reticulum membrane. Mol Biol Cell 8:1805-14.
Dino Rockel T and von Mikecz A (2002) Proteasome-dependent processing of nuclear proteins is correlated with their subnuclear localization. J Struct Biol 140:189-99.
Dowell P, Flexner C, Kwiterovich PO and Lane MD (2000) Suppression of preadipocyte differentiation and promotion of adipocyte death by HIV protease inhibitors. J Biol Chem 275:41325-32.
Gaedicke S, Firat-Geier E, Constantiniu O, Lucchiari-Hartz M, Freudenberg M, Galanos C and Niedermann G (2002) Antitumor effect of the human immunodeficiency virus protease inhibitor ritonavir: induction of tumor-cell apoptosis associated with perturbation of proteasomal proteolysis. Cancer Res 62:6901-8.
Goetzman ES, Tian L, Nagy TR, Gower BA, Schoeb TR, Elgavish A, Acosta EP, Saag MS and Wood PA (2003) HIV protease inhibitor ritonavir induces lipoatrophy in male mice. AIDS Res Hum Retroviruses 19:1141-50.
Haas DW, Zala C, Schrader S, Piliero P, Jaeger H, Nunes D, Thiry A, Schnittman S and Sension M (2003) Therapy with atazanavir plus saquinavir in patients failing highly active antiretroviral therapy: a randomized comparative pilot trial. AIDS 17:1339-49.
Haerter G, Manfras B, Mueller M, Kern P and Trein A (2004) Regression of lipodystrophy in HIV-infected patients under therapy with the new protease inhibitor atazanavir. AIDS 18:952-955.
Hertel J, Struthers H, Horj CB and Hruz PW (2004) A structural basis for the acute effects of HIV protease inhibitors on GLUT4 intrinsic activity. J Biol Chem 279:55147-52.
Hirano Y, Yoshida M, Shimizu M and Sato R (2001) Direct demonstration of rapid degradation of nuclear sterol regulatory element-binding proteins by the ubiquitin-proteasome pathway. J Biol Chem 276:36431-7.
Hruz PW, Murata H and Mueckler M (2001) Adverse metabolic consequences of HIV protease inhibitor therapy: the search for a central mechanism. Am J Physiol Endocrinol Metab 280:E549-53.
Hui DY (2003) Effects of HIV protease inhibitor therapy on lipid metabolism. Prog Lipid Res 42:81-92.
This article has not been copyedited and formatted. The final version may differ from this version.Molecular Pharmacology Fast Forward. Published on March 8, 2005 as DOI: 10.1124/mol.104.010165
at ASPE
T Journals on M
arch 19, 2020m
olpharm.aspetjournals.org
Dow
nloaded from

MOL(10165)
23
Ito D, Walker JR, Thompson CS, Moroz I, Lin W, Veselits ML, Hakim AM, Fienberg AA and Thinakaran G (2004) Characterization of stanniocalcin 2, a novel target of the mammalian unfolded protein response with cytoprotective properties. Mol Cell Biol 24:9456-69.
Jiang HY, Wek SA, McGrath BC, Lu D, Hai T, Harding HP, Wang X, Ron D, Cavener DR and Wek RC (2004) Activating transcription factor 3 is integral to the eukaryotic initiation factor 2 kinase stress response. Mol Cell Biol 24:1365-77.
Johnson N (2005) Atazanavir, with ritonavir or saquinavir, and lopinavir/ritonavir in patients experiencing multiple virological failures. AIDS accepted for publication.
Kaufman RJ, Scheuner D, Schroder M, Shen X, Lee K, Liu CY and Arnold SM (2002) The unfolded protein response in nutrient sensing and differentiation. Nat Rev Mol Cell Biol 3:411-21.
Lenhard JM, Croom DK, Weiel JE and Winegar DA (2000) HIV protease inhibitors stimulate hepatic triglyceride synthesis. Arterioscler Thromb Vasc Biol 20:2625-9.
Liang JS, Distler O, Cooper DA, Jamil H, Deckelbaum RJ, Ginsberg HN and Sturley SL (2001) HIV protease inhibitors protect apolipoprotein B from degradation by the proteasome: a potential mechanism for protease inhibitor-induced hyperlipidemia. Nat Med 7:1327-31.
Murata H, Hruz PW and Mueckler M (2000) The mechanism of insulin resistance caused by HIV protease inhibitor therapy. J Biol Chem 275:20251-4.
Murphy RL, Sanne I, Cahn P, Phanuphak P, Percival L, Kelleher T and Giordano M (2003) Dose-ranging, randomized, clinical trial of atazanavir with lamivudine and stavudine in antiretroviral-naive subjects: 48-week results. AIDS 17:2603-14.
Nawaz Z and O'Malley BW (2004) Urban renewal in the nucleus: is protein turnover by proteasomes absolutely required for nuclear receptor-regulated transcription? Mol Endocrinol 18:493-9.
Nolan D and Mallal S (2004) The role of nucleoside reverse transcriptase inhibitors in the fat redistribution syndrome. J HIV Ther 9:34-40.
Noor MA, Parker RA, O'Mara E, Grasela DM, Currie A, Hodder SL, Fiedorek FT and Haas DW (2004) The effects of HIV protease inhibitors atazanavir and lopinavir/ritonavir on insulin sensitivity in HIV-seronegative healthy adults. Aids 18:2137-44.
Noor MA, Seneviratne T, Aweeka FT, Lo JC, Schwarz JM, Mulligan K, Schambelan M and Grunfeld C (2002) Indinavir acutely inhibits insulin-stimulated glucose disposal in humans: a randomized, placebo-controlled study. AIDS 16:F1-8.
Ozcan U, Cao Q, Yilmaz E, Lee AH, Iwakoshi NN, Ozdelen E, Tuncman G, Gorgun C, Glimcher LH and Hotamisligil GS (2004) Endoplasmic reticulum stress links obesity, insulin action, and type 2 diabetes. Science 306:457-61.
Pajonk F, Himmelsbach J, Riess K, Sommer A and McBride WH (2002) The human immunodeficiency virus (HIV)-1 protease inhibitor saquinavir inhibits proteasome function and causes apoptosis and radiosensitization in non-HIV-associated human cancer cells. Cancer Res 62:5230-5.
Pan Y, Chen H, Siu F and Kilberg MS (2003) Amino acid deprivation and endoplasmic reticulum stress induce expression of multiple activating transcription factor-3 mRNA species that, when overexpressed in HepG2 cells, modulate transcription by the human asparagine synthetase promoter. J Biol Chem 278:38402-12.
Parker R, Wang, S., Mulvey, R., Fenderson, W., Elosua, C., Laing, N., Yang, W.-P., & Flint, O. (2003) Proteasome and glucose transport inhibition: a unifying hypothesis for the
This article has not been copyedited and formatted. The final version may differ from this version.Molecular Pharmacology Fast Forward. Published on March 8, 2005 as DOI: 10.1124/mol.104.010165
at ASPE
T Journals on M
arch 19, 2020m
olpharm.aspetjournals.org
Dow
nloaded from

MOL(10165)
24
mechanism of protease inhibitor-induced metabolic disturbances and for the superior lipid profile of atazanavir. Antivir Ther 8:S380.
Purnell JQ, Zambon A, Knopp RH, Pizzuti DJ, Achari R, Leonard JM, Locke C and Brunzell JD (2000) Effect of ritonavir on lipids and post-heparin lipase activities in normal subjects. AIDS 14:51-7.
Riddle TM, Kuhel DG, Woollett LA, Fichtenbaum CJ and Hui DY (2001) HIV protease inhibitor induces fatty acid and sterol biosynthesis in liver and adipose tissues due to the accumulation of activated sterol regulatory element-binding proteins in the nucleus. J Biol Chem 276:37514-9.
Rodgers KJ and Dean RT (2003) Assessment of proteasome activity in cell lysates and tissue homogenates using peptide substrates. Int J Biochem Cell Biol 35:716-27.
Sanne I, Piliero P, Squires K, Thiry A and Schnittman S (2003) Results of a phase 2 clinical trial at 48 weeks (AI424-007): a dose-ranging, safety, and efficacy comparative trial of atazanavir at three doses in combination with didanosine and stavudine in antiretroviral-naive subjects. J Acquir Immune Defic Syndr 32:18-29.
Schmidtke G, Holzhutter HG, Bogyo M, Kairies N, Groll M, de Giuli R, Emch S and Groettrup M (1999) How an inhibitor of the HIV-I protease modulates proteasome activity. J Biol Chem 274:35734-40.
Shen Y, Meunier L and Hendershot LM (2002) Identification and characterization of a novel endoplasmic reticulum (ER) DnaJ homologue, which stimulates ATPase activity of BiP in vitro and is induced by ER stress. J Biol Chem 277:15947-56.
Siu F, Bain PJ, LeBlanc-Chaffin R, Chen H and Kilberg MS (2002) ATF4 is a mediator of the nutrient-sensing response pathway that activates the human asparagine synthetase gene. J Biol Chem 277:24120-7.
Squires K, Lazzarin A, Gatell JM, Powderly WG, Pokrovskiy V, Delfraissy JF, Jemsek J, Rivero A, Rozenbaum W, Schrader S, Sension M, Vibhagool A, Thiry A and Giordano M (2004) Comparison of Once-Daily Atazanavir With Efavirenz, Each in Combination With Fixed-Dose Zidovudine and Lamivudine, As Initial Therapy for Patients Infected With HIV. J Acquir Immune Defic Syndr 36:1011-1019.
Travers KJ, Patil CK, Wodicka L, Lockhart DJ, Weissman JS and Walter P (2000) Functional and genomic analyses reveal an essential coordination between the unfolded protein response and ER-associated degradation. Cell 101:249-58.
Werstuck GH, Lentz SR, Dayal S, Hossain GS, Sood SK, Shi YY, Zhou J, Maeda N, Krisans SK, Malinow MR and Austin RC (2001) Homocysteine-induced endoplasmic reticulum stress causes dysregulation of the cholesterol and triglyceride biosynthetic pathways. J Clin Invest 107:1263-73.
Woerle HJ, Mariuz PR, Meyer C, Reichman RC, Popa EM, Dostou JM, Welle SL and Gerich JE (2003) Mechanisms for the deterioration in glucose tolerance associated with HIV protease inhibitor regimens. Diabetes 52:918-25.
Wood R, Phanuphak P, Cahn P, Pokrovskiy V, Rozenbaum W, Pantaleo G, Sension M, Murphy R, Mancini M, Kelleher T and Giordano M (2004) Long-Term Efficacy and Safety of Atazanavir With Stavudine and Lamivudine in Patients Previously Treated With Nelfinavir or Atazanavir. J Acquir Immune Defic Syndr 36:684-692.
Zimmermann J, Erdmann D, Lalande I, Grossenbacher R, Noorani M and Furst P (2000) Proteasome inhibitor induced gene expression profiles reveal overexpression of transcriptional regulators ATF3, GADD153 and MAD1. Oncogene 19:2913-20.
This article has not been copyedited and formatted. The final version may differ from this version.Molecular Pharmacology Fast Forward. Published on March 8, 2005 as DOI: 10.1124/mol.104.010165
at ASPE
T Journals on M
arch 19, 2020m
olpharm.aspetjournals.org
Dow
nloaded from

MOL(10165)
25
Legends - Figures
Figure 1. Inhibition of proteasome activity in vitro by HIV protease inhibitors. (a.) Inhibition
of purified human 20S proteasome activity, assayed as cleavage of the fluorogenic peptide suc-
LLVY-amc, given as mean percent inhibition vs control from triplicate assays for each
concentration of protease inhibitor. (b.) Chymotryptic (suc-LLVY-amc cleavage) activity in
fractions from FPLC Superose-6 gel filtration chromatography of lysates from HepG2 and 3T3-L1
cells, assayed without and with the proteasome inhibitor lactacystin (1 µM). (c.) Inhibition of
proteasome activity by HIV protease inhibitors and reference compounds lactacystin (lacta) and
MG132, assayed with FPLC Superose-6-derived 26S + 20S proteasome preparations from HepG2
and 3T3-L1 cells. Chymotryptic (suc-LLVY-amc) and tryptic (Boc-LRR-amc) activities were
assayed using fluorogenic peptide substrates. HIV protease inhibitors are abbreviated as follows:
atazanavir, ATV; lopinavir, LPV; nelfinavir, NFV; ritonavir, RTV, and saquinavir, SQV.
Figure 2. Effects of protease inhibitors on metabolic functions in differentiated 3T3-L1
adipocytes and HepG2 cells. (a.) Effects of protease inhibitors on lipid synthesis in 3T3-L1
adipocytes at end of 24 hr incubation. The effect of each drug is indicated as percent of control
incorporation of [14C]-acetate into cellular triglyceride determined by quantitative analytical TLC.
Data are mean ± SD for triplicate cultures. (b.) Time-dependency of effect of protease inhibitors
on triglyceride synthesis in 3T3-L1 adipocytes. Different symbols represent preoccupation times
for each drug as indicated prior to assay of triglyceride synthesis. Data are mean ± SD for triplicate
cultures. (c.) Acute effects of protease inhibitors on glucose uptake in differentiated 3T3-L1
adipocytes in the presence of insulin. Effect of each drug is indicated as mean percent of control
transport of [3H]-2-deoxyglucose; text inset provides absolute rates. (d.) Acute effects of ritonavir
This article has not been copyedited and formatted. The final version may differ from this version.Molecular Pharmacology Fast Forward. Published on March 8, 2005 as DOI: 10.1124/mol.104.010165
at ASPE
T Journals on M
arch 19, 2020m
olpharm.aspetjournals.org
Dow
nloaded from

MOL(10165)
26
and atazanavir on insulin-stimulated glucose transport in primary rat adipocytes, assayed as [3H]-
2-deoxyglucose, and on lactate released into the medium over a 6 hr incubation. (e.) Effects of
protease inhibitors on triglyceride synthesis in HepG2 Cells. Effect of each drug is indicated as
percent of control incorporation of [14C]-acetate into cellular triglyceride, for various
concentrations of drug at 24 hr (left panel), or at various times of treatment with 10 µM drug (right
panel). Radiolabeled triglyceride was assayed by quantitative TLC. Data are mean ± SD for 4
experiments. Drug abbreviations are as in Fig. 1.
Figure 3. Gene expression changes in protease inhibitor-treated vs control (p < 0.01)
hepatocyte and adipocyte models using Affymetrix gene chips. Cells were treated for 24 hr
with protease inhibitors at the concentrations indicated, under conditions as per Figures 2a and 2e.
(a.) For HepG2 cells, bars indicate the number of genes induced or repressed to the indicated
extent among 22,214 RNA sequences assayed on Affymetrix U133A gene chips. (b.) For 3T3-L1
adipocytes, bars indicate the number of genes induced or repressed to the indicated extent among
12,422 sequences assayed on Affymetrix U74A-v2 gene chips. Drug abbreviations are as in Fig. 1.
Figure 4. Time dependence of mRNA regulatory responses to protease inhibitors in
hepatocyte and adipocyte models assayed by PCR. (a) mRNA changes in TC-5 hepatocyte cell
line time course of protease inhibitor treatment. Mean values of triplicate samples assayed by RT-
PCR are indicated as a functon of cell incuabtion time. (b) mRNA changes in 3T3-L1 adipocyte
time course of protease inhibitor treatment. Mean values ± SD of two experiments each conducted
in triplicate assayed by RT-PCR are indicated as a function of cell incubation time. Drug
abbreviations are as in Fig. 1.
This article has not been copyedited and formatted. The final version may differ from this version.Molecular Pharmacology Fast Forward. Published on March 8, 2005 as DOI: 10.1124/mol.104.010165
at ASPE
T Journals on M
arch 19, 2020m
olpharm.aspetjournals.org
Dow
nloaded from

MOL(10165)
27
Table 1. Transcriptional profile in protease inhibitor-treated HepG2 cells. HepG2 cells were treated with nelfinavir (3 and 10 µM), ritonavir (10 and 30 µM), or atazanavir (10 and 30 µM) for 24 hr under the conditions used in the lipid synthesis assays. Cells were washed and RNA was isolated from triplicate cell incubations and gene expression profiles were conducted using the Affymetrix protocol. All genes with significant changes in expression for one or more of the treatments are included in the table. Data are expressed as mean mRNA concentration ratio of treated/control for treated/ control for atazanavir 30 µM, ritonavir 30 µM, and nelfinavir 10 µM. Results are grouped by gene function. Significant differences from control, a indicates P < 0.01.
Accession No.
Gene atazanavir 30 µM
ritonavir 30 µM
nelfinavir 10 µM
transcription factors NM_001675 ATF4, activating transcription factor 4 1.19 2.00a 2.27a BC003600 CSRP3e, LIM-domain-only-4 (proteasome-interacting) 1.20 1.51a 2.07a BC003637.1 GADD153 (CHOP) 1.03 1.49 1.88a AL564683 C/EBP-beta 1.17 1.36a 1.83a NM_001806 C/EBP-gamma 1.35 1.73a 1.75a AI843895 SREBP-1c 1.08 1.33 1.48 ER stress response and signaling pathways AI435828 stanniocalcin 2 (ER Ca++ signaling, phosphate transport) 3.28a 6.09a 7.68a NM_019058 RTP-801, HIF responsive protein 1.32 2.57a 5.03a BC005161 activin beta E 1.53 3.04a 4.12a NM_021158 SINK neg regulator of NFKB transactivator P65 1.27 2.81a 2.92a NM_004362 Calmegin, ER chaperone, Ca++ binding 1.27 1.77a 2.01a NM_012328 HSP-40, DnaJ homolog, subfamily B, member 9 1.39 3.03a 1.98a BC002446.1 HSP-40, DnaJ homolog, subfamily B, member 6 1.57a 2.00a 2.38a BG403660 HSP-105B 1.52 1.96a 1.98a AA704004 HSP-70, protein 8 1.19 1.49a 1.51 AF216292.1 BiP, GRP-78 1.11 1.36 1.06 NM_005080.1 XBP-1 X-box binding protein-1 0.89 1.18 0.99 NM_005627 serum/glucocorticoid regulated kinase 0.86 0.30a 0.21a amino acid and protein metabolism NM_001673 asparagine synthetase 1.58 6.99a 7.79a AB040875 cystine/glutamate transporter 2.01a 6.89a 6.12a AA488687 EST 1.04 4.26a 4.70a BE513104 tyrosyl-tRNA synthetase 1.43a 3.33a 3.10a NM_006636 methylene-THF dehydrogenase/cyclohydrolase 1.19 2.51a 2.77a AL354872 cystathionine gamma-lyase 0.97 2.29a 2.59a AB044548 eukaryotic translation initiation factor 4E binding protein 1 1.38 2.85a 2.54a NM_001751 cysteinyl-tRNA synthetase 1.33 2.33a 2.49a NM_006513 seryl-tRNA synthetase 1.08 2.02a 2.35a AI984005 exportin T (nuclear export of tRNA) 1.01 2.46a 2.24a BF340083 glutamate / neutral amino acid transporter 1.21 2.22a 1.94a NM_004990 methionine tRNA synthetase 1.29 2.30a 2.27a NM_021154 phosphoserine aminotransferase 1.37a 2.48a 2.19a NM_003191 threonyl-tRNA synthetase 1.23 1.91a 2.02a NM_005412 serine hydroxymethyltransferase 2 (mitochodrial) 1.35a 2.47a 2.00a NM_004446 glutamyl-prolyl-tRNA synthetase 1.26 1.91a 1.96a NM_013417 isoleucine-tRNA synthetase 0.95 2.19a 1.94a
This article has not been copyedited and formatted. The final version may differ from this version.Molecular Pharmacology Fast Forward. Published on March 8, 2005 as DOI: 10.1124/mol.104.010165
at ASPE
T Journals on M
arch 19, 2020m
olpharm.aspetjournals.org
Dow
nloaded from

MOL(10165)
28
NM_000050 argininosuccinate synthetase 1.31 1.88a 1.92a NM_004184 tryptophanyl-tRNA synthetase 1.19 2.11a 1.81a AF217990 homocys-inducible, ER stress-inducible, ubiquitin-like-1 1.35a 1.81a 1.68a AF176699 ubiquitin ligase 0.92 1.61a 1.41 NM_006398 di-ubiquitin 0.74 0.41a 0.56a lipid metabolism BE855983 ACC, acetyl-Coenzyme A carboxylase alpha 1.32 2.20 2.17a NM_021122 fatty acyl CoA ligase, long-chain 2 1.35 1.58a 1.82 NM_020299 aldose reductase family 1, member 10 1.15 1.60a 1.70a NM_001995 fatty-acid-Coenzyme A ligase, long-chain 1 1.29 1.52a 1.68a NM_013389 NPC1 (Nieman-Pick protein C1) 1.05 1.50a 1.63 AI189359 mevalonate diphosphate decarboxylase 0.98 1.95a 1.61a NM_012347 FAS, fatty acid synthase 1.02 1.49a 1.61a NM_012079 DGAT, diacylglycerol O-acyltransferase 1 1.73a 1.81a 1.60 NM_000786 lanosterol 14-alpha-demethylase 1.03 1.81a 1.47a NM_024090 long chain FA elongase 1.12 1.54a 1.45a NM_000527 LDL receptor 0.90 1.40a 1.43a AL136939 long chain polyunsaturated fatty acid elongation enzyme 2 1.13 1.50a 1.34 NM_001360 7-deydrocholesterol reductase 1.11 1.90a 1.32 AL518627 HMGCoA reductase 1.01 1.53a 1.29 BE540552 fatty acid desaturase 1 1.33 1.71a 1.23 AA639705 squalene epoxidase 1.04 1.60a 1.07 glucose and gluconeogenesis NM_004563 PEPCK, phosphoenolpyruvate carboxykinase 1.27 1.91a 2.04a NM_001486 GKRP, glucokinase regulatory protein 1.23 1.58a 1.97 NM_006931 GLUT-3 0.90 0.38a 0.35a NM_000291 phosphoglycerate kinase 1 1.03 0.79a 0.63a NM_002654 pyruvate kinase, M-type 0.98 0.68a 0.61a
This article has not been copyedited and formatted. The final version may differ from this version.Molecular Pharmacology Fast Forward. Published on March 8, 2005 as DOI: 10.1124/mol.104.010165
at ASPE
T Journals on M
arch 19, 2020m
olpharm.aspetjournals.org
Dow
nloaded from

MOL(10165)
29
Table 2. Transcriptional profile in protease inhibitor-treated 3T3-L1 adipocytes. Differentiated 3T3-L1 cells were treated with protease inhibitors for 24 hr under conditions used in the lipid synthesis assays. RNA from triplicate cell incubations was used for gene expression profiles conducted using Affymetrix protocols. All genes with significant changes in expression for one or more of the treatments are included in the table. Data are expressed as mean mRNA concentration ratio of treated/control for atazanavir 30 µM, ritonavir 30 µM, and nelfinavir 10 µM. Results are grouped by gene function. Significant differences from control, a indicates P < 0.01.
Accession No.
Genes atazanavir 30 µM
lopinavir 30 µM
nelfinavir 10 µM
transcription factors U19118 ATF3, activating transcription factor 3 2.80 7.83a 4.17a X67083 GADD-153, CHOP-10 2.37 3.82a 3.93a X51829 myeloid differentiation primary response gene 116 2.41a 3.68a 3.33a AI852641 nuclear protein 1 2.17a 2.26a 2.62a U00937 GADD-45 1.80 2.88a 2.42a X89749 TGIF, target gene interacting fact or 1.62 2.45a 2.16 M94087 ATF4, activating transcription factor 4 1.45a 1.46a 1.66a U10374 PPAR-gamma 0.67a 0.59a 0.56a AI843895 SREBP-1c 0.76 0.63 0.78 M62362 C/EBP-α 0.76 0.48a 0.55a AI834866 nuclear receptor coactivator-4 0.74 0.60 0.58a ER stress response and signaling pathways AI843119 glutathione S-transferase omega 1 1.27 1.44a 1.72a U53208 HSP-40, DnaJ homolog, subfamily C, member 2 1.31 1.80a 1.51 L02914 aquaporin-1 0.53 0.39 0.23a AF077659 homeodomain interacting protein kinase 2 0.64 0.37a 0.35a amino acid and protein metabolism U40930 sequestosome 1 (binds ubiquitinylated proteins) 1.77a 2.65a 2.41a U95053 glutamate-cysteine ligase, regulatory subunit 1.39 2.16 1.94 AI851163 tryptophanyl-tRNA synthetase 1.39 1.67a 1.78a AI837395 seryl-aminoacyl-tRNA synthetase 1 1.45 1.69a 1.60 AI839158 proteasome 26S subunit-8 1.25 1.80a 1.25 AI836804 proteasome subunit, alpha type 1 0.72 0.46a 0.41a lipid metabolism, adipogenesis AF003348 NPC1, Nieman Pick protein C1 1.68 3.27a 2.68a AB033887 fatty acid-Coenzyme A ligase, long chain 4 1.46 2.03a 2.36a AA718169 resistin 0.52a 0.31a 0.23a Z48670 peroxisomal FA-CoA transporter, ABC-D2 0.54 0.34 0.24a U15977 fatty acyl CoA ligase, long chain 2 0.54 0.31 0.27a X72862 beta-3 adrenergic receptor 0.62 0.34a 0.30a M61737 FSP27, fat specific gene 27 kDA 0.67 0.31a 0.31a M91458 sterol carrier protein 2 0.67 0.31a 0.34a X13135 FAS, fatty acid synthase 0.61 0.39 0.38a X95279 spot14 gene (adipogenic marker, SREBP-regulated) 0.61a 0.35a 0.41a AV290060 glycerol phosphate dehydrogenase 1, cytoplasmic 0.63 0.42 0.45a U37799 SRB1, scavenger receptor B1 0.74 0.48 0.44a U69543 HSL, hormone sensitive lipase 0.75 0.36a 0.45a
This article has not been copyedited and formatted. The final version may differ from this version.Molecular Pharmacology Fast Forward. Published on March 8, 2005 as DOI: 10.1124/mol.104.010165
at ASPE
T Journals on M
arch 19, 2020m
olpharm.aspetjournals.org
Dow
nloaded from

MOL(10165)
30
X83202 hydroxysteroid 11-beta dehydrogenase 1 0.64a 0.49a 0.46a AI747654 caveolin, caveolae protein, 22 kDa 0.62a 0.46a 0.47a AF045887 angiotensinogen 0.76 0.58a 0.52a M69260 annexin A1 0.73 0.57 0.47a U07159 acyl-Coenzyme A dehydrogenase, medium chain 0.73 0.56 0.53a AF078752 DGAT, diacylglycerol acyltransferase 1 0.78 0.58a 0.53a U49915 adiponectin 0.73a 0.54a 0.57a AF057368 7-dehydrocholesterol reductase 0.88 0.60 0.53a X04673 adipsin 0.79 0.66a 0.69a glucose and gluconeogenesis X98848 6-phosphofructo-2-kinase/fructose-2,6-biphosphatase 1 0.44 0.41 0.23a AF009605 PEPCK, phosphoenolpyruvate carboxykinase 0.49 0.23a 0.28a AF020039 isocitrate dehydrogenase 1 (NADP+), soluble 0.62a 0.51 0.45a AI846739 glycogen phosphorylase 0.67a 0.54a 0.50a
This article has not been copyedited and formatted. The final version may differ from this version.Molecular Pharmacology Fast Forward. Published on March 8, 2005 as DOI: 10.1124/mol.104.010165
at ASPE
T Journals on M
arch 19, 2020m
olpharm.aspetjournals.org
Dow
nloaded from

conc µM0.1 1 10 100
chym
otry
ptic
act
ivity
, % c
ontr
ol
0
20
40
60
80
100ATV 26LPV 9RTV 11NFV 4SQV 3
IC50 (µM)
20S Proteasome
MOL(10165)
Figure 1a
This article has not been copyedited and form
atted. The final version m
ay differ from this version.
Molecular Pharm
acology Fast Forward. Published on M
arch 8, 2005 as DO
I: 10.1124/mol.104.010165
at ASPET Journals on March 19, 2020 molpharm.aspetjournals.org Downloaded from

FPLC Fraction
10 15 20 25 30 35 40 45 50 55 60 65
pept
idas
e ac
tivity
, uni
ts/m
L
0
200
400
600
A280, m
AU
x 5
0
200
400
600
LLVY-amc LLVY-amc + lactacystinA280
HepG2FPLC profile
3T3-L1 FPLC profile
0
500
1000
1500
0
500
1000
1500HepG2 FPLC profile
A280, m
AU
x 50
MOL(10165)
Figure 1b
This article has not been copyedited and form
atted. The final version m
ay differ from this version.
Molecular Pharm
acology Fast Forward. Published on M
arch 8, 2005 as DO
I: 10.1124/mol.104.010165
at ASPET Journals on March 19, 2020 molpharm.aspetjournals.org Downloaded from

conc µM3 301 10
% c
ontr
ol
0
20
40
60
80
100
conc µM3 301 10
% c
ontr
ol
0
20
40
60
80
100
HepG2 Chymotryptic Activity 3T3-L1 Chymotryptic Activity
conc µM3 301 10
% c
ontr
ol
0
20
40
60
80
100
ATVLPVRTVNFVSQVLactaMG132
conc µM3 301 10
% c
ontr
ol
0
20
40
60
80
100
HepG2 Tryptic Activity 3T3-L1 Tryptic Activity
MOL(10165)
Figure 1c
This article has not been copyedited and form
atted. The final version m
ay differ from this version.
Molecular Pharm
acology Fast Forward. Published on M
arch 8, 2005 as DO
I: 10.1124/mol.104.010165
at ASPET Journals on March 19, 2020 molpharm.aspetjournals.org Downloaded from

Conc µM
0 10 20 30 40 50
TG
Syn
thes
is, %
Con
trol
0
20
40
60
80
100 ATV LPV RTVNFVSQV
Triglyceride
MOL(10165)
Figure 2a
This article has not been copyedited and form
atted. The final version m
ay differ from this version.
Molecular Pharm
acology Fast Forward. Published on M
arch 8, 2005 as DO
I: 10.1124/mol.104.010165
at ASPET Journals on March 19, 2020 molpharm.aspetjournals.org Downloaded from

µM10 30 50
0
25
50
75
100 6 hr24 hr48 hr
NFV
ATV
LPV
µM10 30 50
0
25
50
75
100 6 hr24 hr48 hr
0
LPV
µM10 30 50
0
25
50
75
100
6 hr24 hr48 hr
0
RTV
µM10 30 50
0
25
50
75
100
6 hr24 hr48 hr
SQV
µM10 30 50
TG
Syn
th, %
Con
trol
0
25
50
75
100
6 hr24 hr48 hr
0
ATV
0 0
TG
Syn
th, %
Con
trol
Triglyceride Synthesis in Adipocytes
MOL(10165)
Figure 2b
This article has not been copyedited and form
atted. The final version m
ay differ from this version.
Molecular Pharm
acology Fast Forward. Published on M
arch 8, 2005 as DO
I: 10.1124/mol.104.010165
at ASPET Journals on March 19, 2020 molpharm.aspetjournals.org Downloaded from

Conc µM0 10 20 30 40 50
2-D
eoxy
gluc
ose
Upt
ake,
% C
ontr
ol
0
20
40
60
80
100 ATV LPV RTV NFV SQV
Glucose Transport
MOL(10165)
Figure 2c
1 Mean and standard deviation of 5 separate experiments2 Untreated control value used to normalize data to 100% in Fig 2c
0.180.23cytochalasin B
1.968.29 2+ insulin
1.354.38− insulin
StdDevMean 1
pMoles⋅min-1 per 106 cellsCONTROL
DATA for Fig 2c
This article has not been copyedited and form
atted. The final version m
ay differ from this version.
Molecular Pharm
acology Fast Forward. Published on M
arch 8, 2005 as DO
I: 10.1124/mol.104.010165
at ASPET Journals on March 19, 2020 molpharm.aspetjournals.org Downloaded from

conc, µM
0 25 50 752-D
eoxy
gluc
ose
upta
ke, %
con
trol
0
20
40
60
80
100
conc, µM
0 25 50 75
media lactate, µM
0
20
40
60
80
100
120
ATVATV
RTV RTV- ins
Glucose Transport Lactate Release
+ insulin
MOL(10165)
Figure 2d
This article has not been copyedited and form
atted. The final version m
ay differ from this version.
Molecular Pharm
acology Fast Forward. Published on M
arch 8, 2005 as DO
I: 10.1124/mol.104.010165
at ASPET Journals on March 19, 2020 molpharm.aspetjournals.org Downloaded from
MOL(10165)
Figure 2e
Conc, µM
0 10 20 30
TG
Syn
th, %
Con
trol
100
150
200
250
ATVLPVRTVNFVSQV
Hours
6 16 24 48
TG
Syn
th, %
Con
trol
0
50
100
150
200
250
ATVLPVRTVNFVSQV
Triglyceride Synthesis in HepG2 Cells
24 hr 10 µM
This article has not been copyedited and form
atted. The final version m
ay differ from this version.
Molecular Pharm
acology Fast Forward. Published on M
arch 8, 2005 as DO
I: 10.1124/mol.104.010165
at ASPET Journals on March 19, 2020 molpharm.aspetjournals.org Downloaded from

1.5 X 2 X 3 X
num
ber
of g
enes
0
40
80
120
160NFV 10 µMRTV 30 µMATV 30 µM
Induced
0.66 X 0.5 X 0.33 Xnu
mbe
r of
gen
es
0
10
20
30
40NFV 10 µMRTV 30 µMATV 30 µM
RepressedHepG2 Cells
MOL(10165)
Figure 3a
This article has not been copyedited and form
atted. The final version m
ay differ from this version.
Molecular Pharm
acology Fast Forward. Published on M
arch 8, 2005 as DO
I: 10.1124/mol.104.010165
at ASPET Journals on March 19, 2020 molpharm.aspetjournals.org Downloaded from

MOL(10165)
Figure 3b
1.5 X 2 X 3 X
num
ber
of g
enes
0
40
80
120NFV 10 µMLPV 30 µMATV 30 µM
Induced
0.66 X 0.5 X 0.33 Xnu
mbe
r of
gen
es0
40
80
120
160NFV 10 µMLPV 30 µMATV 30 µM
RepressedAdipocytes
This article has not been copyedited and form
atted. The final version m
ay differ from this version.
Molecular Pharm
acology Fast Forward. Published on M
arch 8, 2005 as DO
I: 10.1124/mol.104.010165
at ASPET Journals on March 19, 2020 molpharm.aspetjournals.org Downloaded from

MOL(10165)Figure 4a
1
3
5
7
1
5
9
13
3060
norm
aliz
ed m
RN
A, r
atio
to c
ontr
ol1
3
5
71015
ATVLPVRTVNFV
1
3
5
71015
GADD153
C/EBP-β
ATF4
Asn Synth
hours0 8 16 24 32
1
3
5
7
1020
0 8 16 24 32
1
3
ACC
PEPCK
TC5 Hepatocytes
This article has not been copyedited and form
atted. The final version m
ay differ from this version.
Molecular Pharm
acology Fast Forward. Published on M
arch 8, 2005 as DO
I: 10.1124/mol.104.010165
at ASPET Journals on March 19, 2020 molpharm.aspetjournals.org Downloaded from

0
1
2
3
4
5
0.0
0.2
0.4
0.6
0.8
1.0
norm
aliz
ed m
RN
A, r
atio
to c
ontr
ol0
2
4
6
ATVLPVRTVNFV
0
5
10
15
20
40
GADD153
NPC1
ATF3
FAS
hours
0 8 16 24 320.0
0.2
0.4
0.6
0.8
1.0
0 8 16 24 320.0
0.2
0.4
0.6
0.8
1.0
G3PDH
Adiponectin
3T3-L1 Adipocytes
MOL(10165)
Figure 4b
This article has not been copyedited and form
atted. The final version m
ay differ from this version.
Molecular Pharm
acology Fast Forward. Published on M
arch 8, 2005 as DO
I: 10.1124/mol.104.010165
at ASPET Journals on March 19, 2020 molpharm.aspetjournals.org Downloaded from