end of the year graphing quiz review. the government adds a $15 tariff to imported steel. the...
TRANSCRIPT

End of the Year Graphing Quiz Review

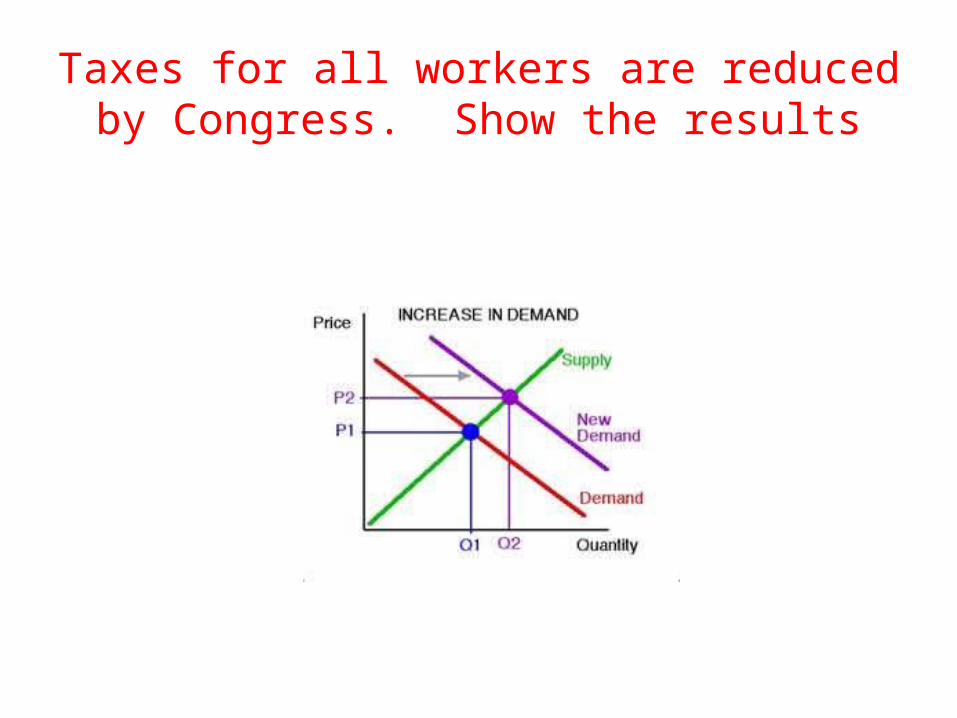
The government adds a $15 tariff to imported steel. The domestic price is $75 w/ a Qd of 10, world price is $50 w/ a Qd of 12 and Qs of 8. The tariff reduces imports by 2 mill. Graph and show dead weight loss and tax revenue
$75 Pd
$50 Pw
$65 Pt
Sd
Dd
10 12
DWL
8 119
Imports = 2
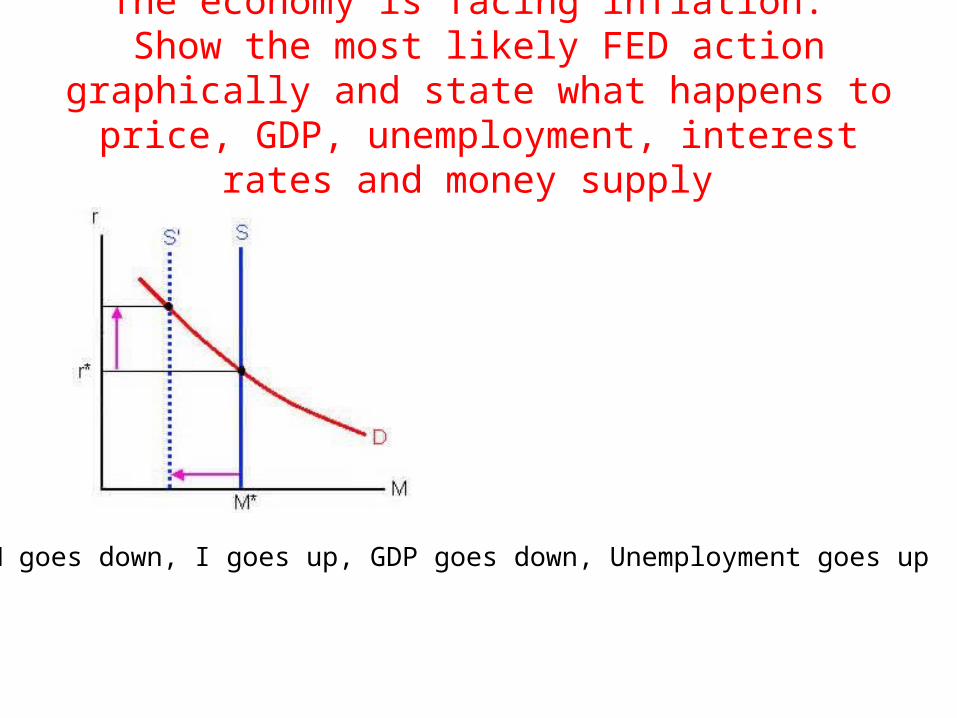
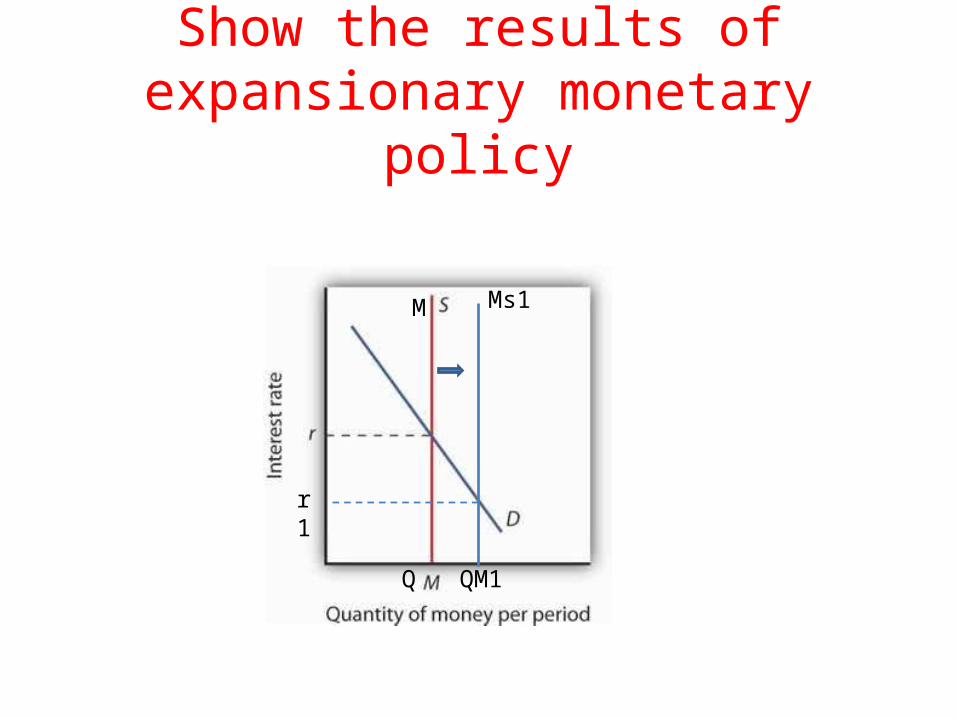
The economy is facing inflation. Show the most likely FED action graphically and state what happens to price, GDP, unemployment, interest rates and money supply
M goes down, I goes up, GDP goes down, Unemployment goes up
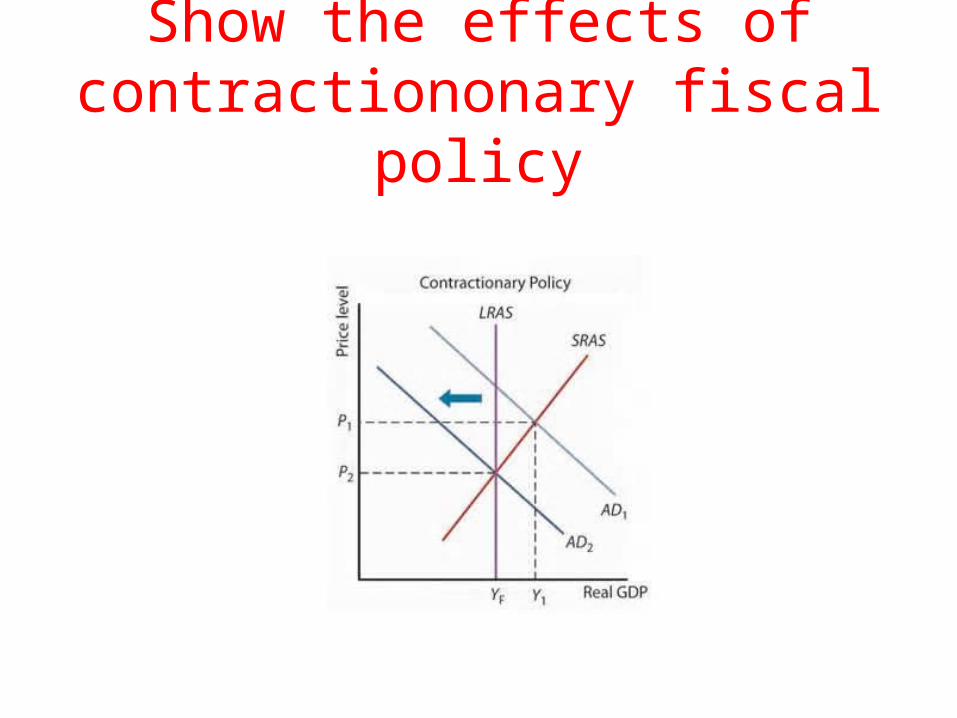
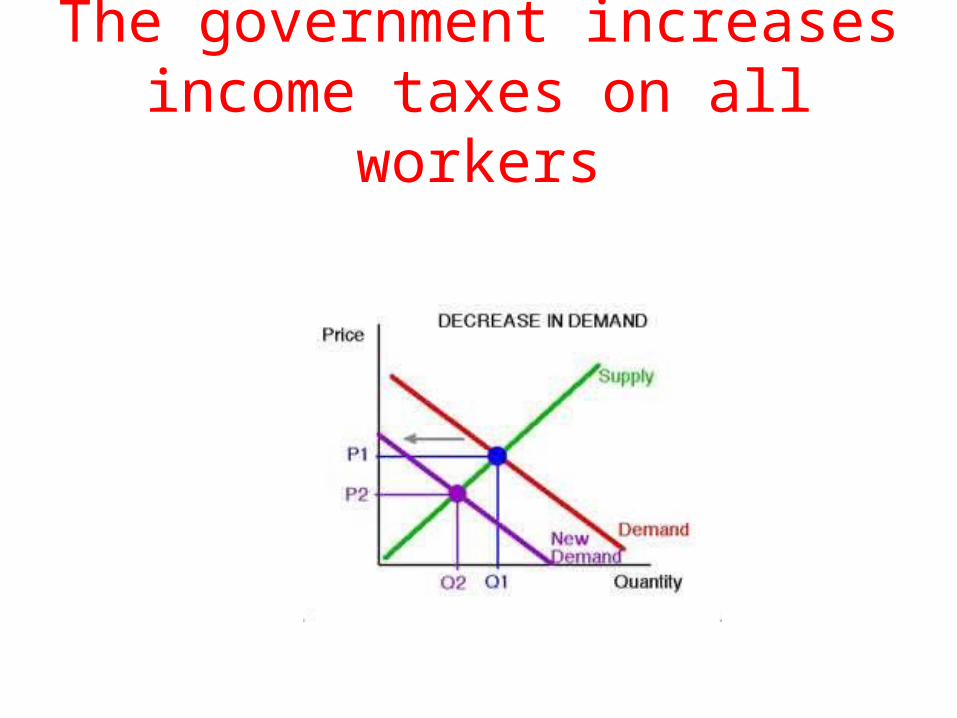
Show the effects of contractiononary fiscal policy
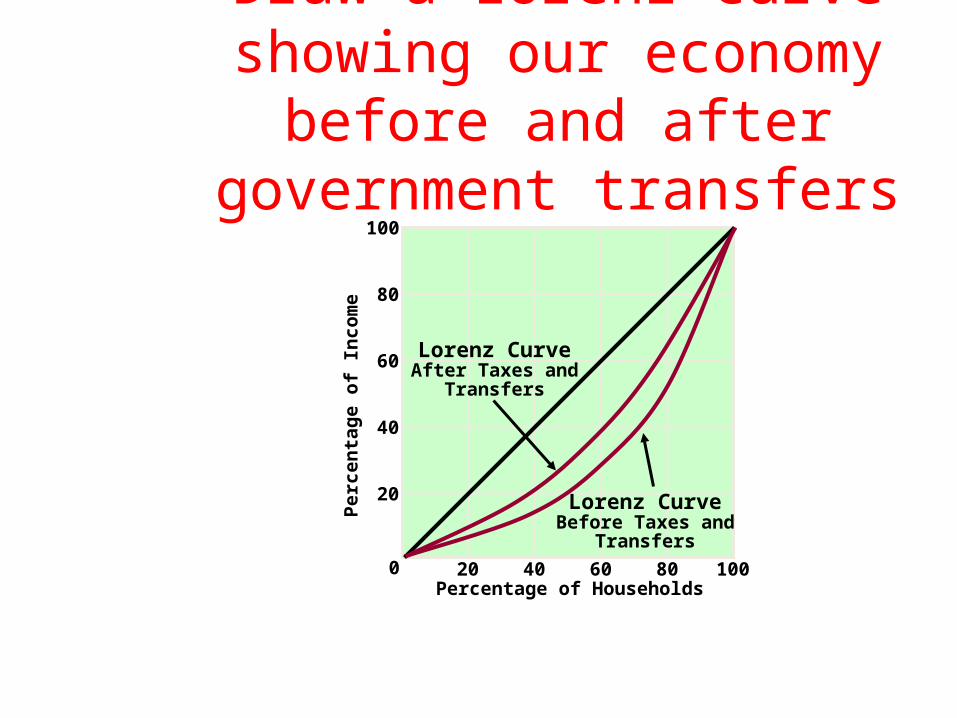
Draw a Lorenz curve showing our economy before and after
government transfers
20 40 60 80 100
20
40
60
80
100
0
Lorenz CurveBefore Taxes and
Transfers
Percentage of Households
Per
cen
tag
e o
f In
co
me
Lorenz CurveAfter Taxes and
Transfers
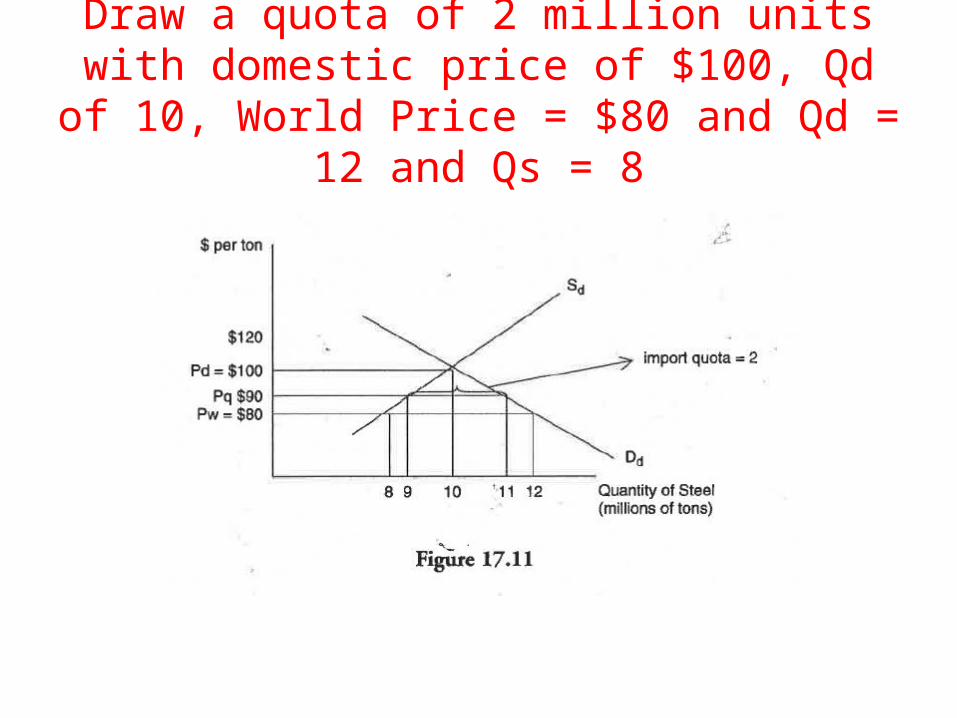
Draw a quota of 2 million units with domestic price of $100, Qd of 10, World Price = $80 and
Qd = 12 and Qs = 8

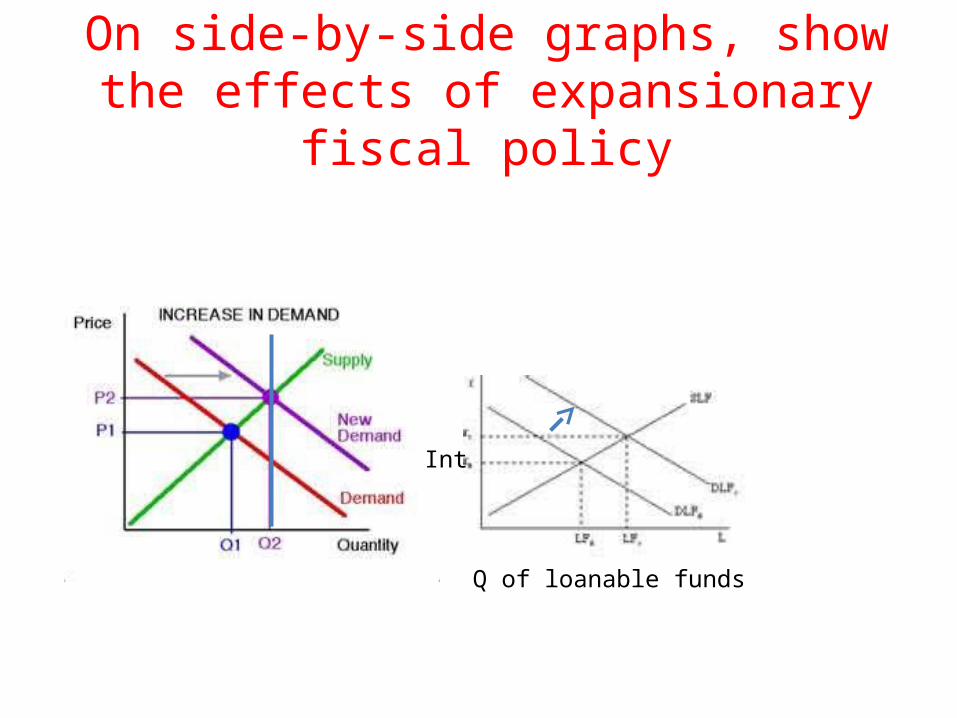
On side-by-side graphs, show the effects of expansionary fiscal policy
Q of loanable funds
Int
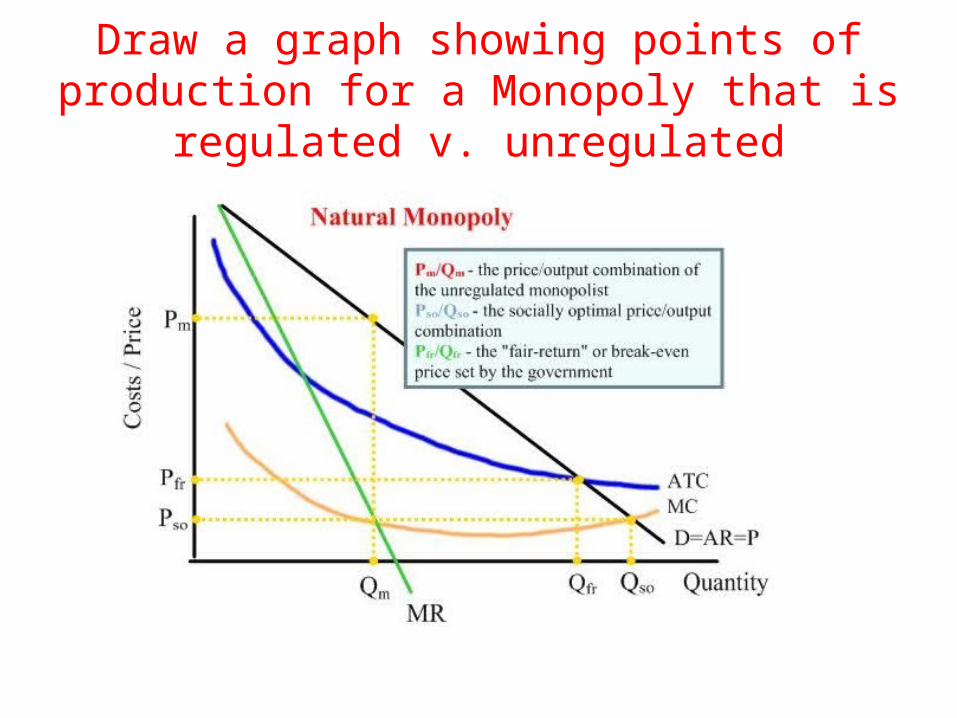
Draw a graph showing points of production for a Monopoly that is regulated v. unregulated
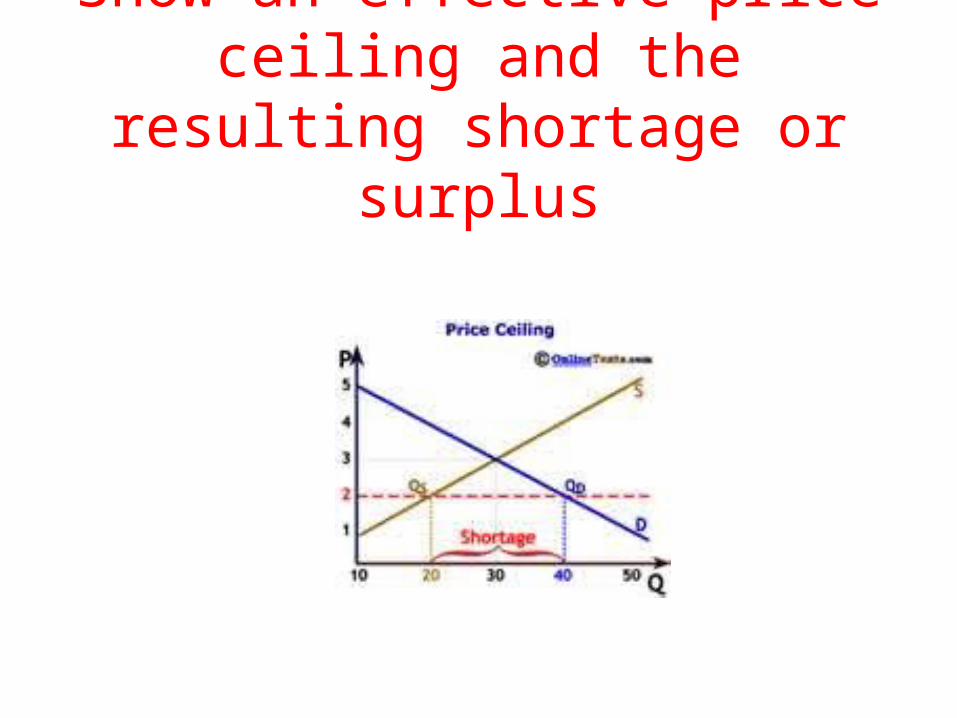
Show an effective price ceiling and the resulting shortage or surplus

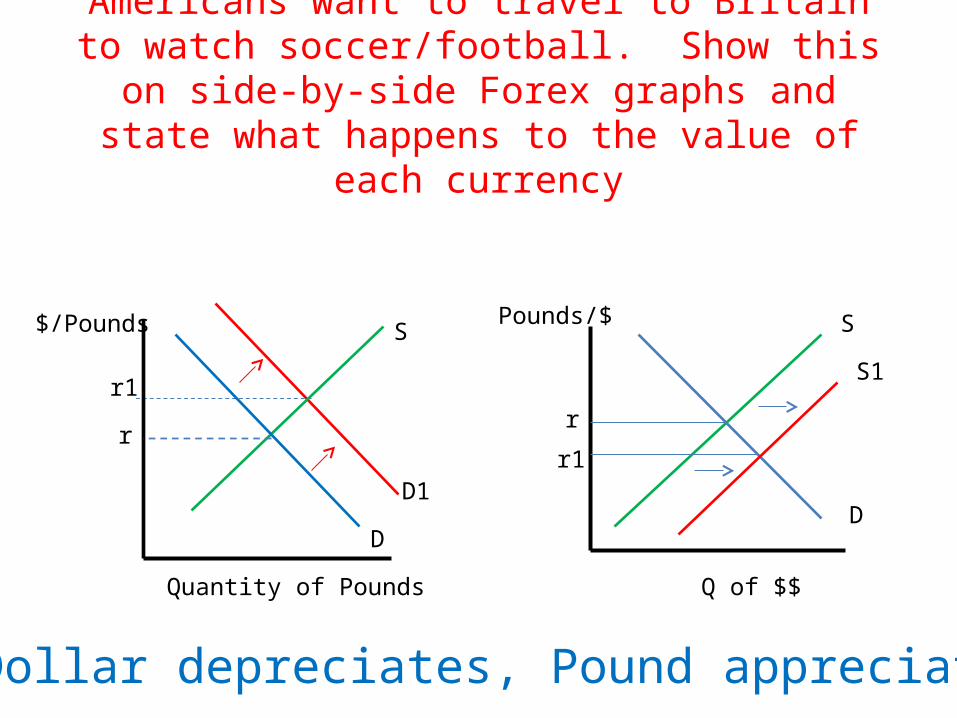
Americans want to travel to Britain to watch soccer/football. Show this on side-by-side Forex graphs and state what happens to the value of each currency
Q of $$
Pounds/$
D
S
S1r1
$/Pounds
Quantity of Pounds
rr
r1
S
D
D1
Dollar depreciates, Pound appreciates
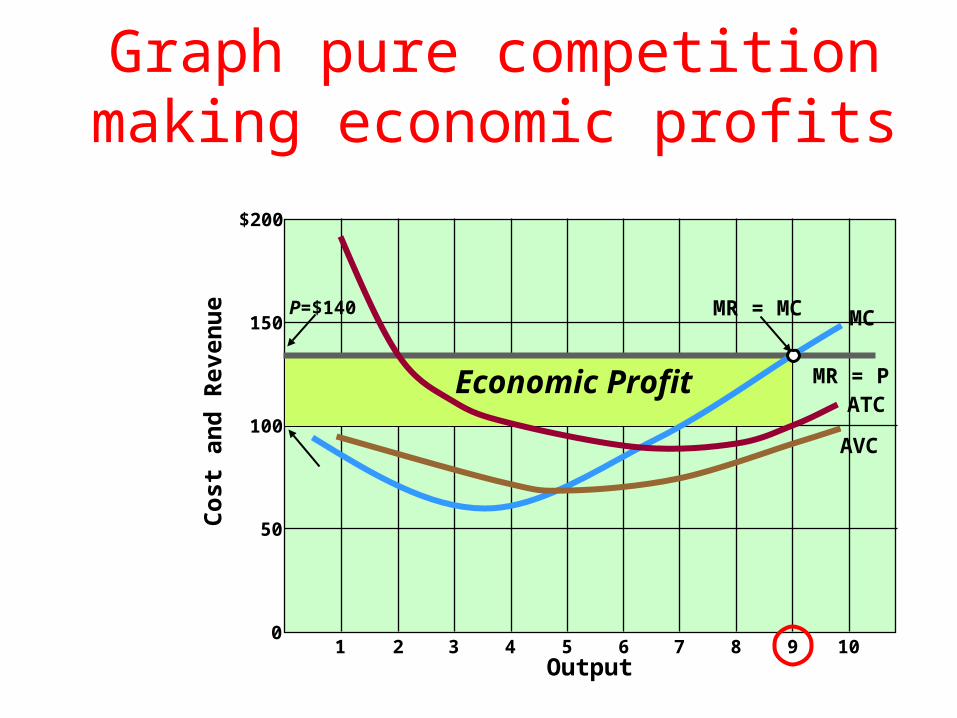
Graph pure competition making economic profits
Cost
and
Rev
enue
$200
150
100
50
01 2 3 4 5 6 7 8 9 10
Output
Economic Profit MR = P
MCMR = MC
AVC
ATC
P=$140

Show economic growth on 2 graphs
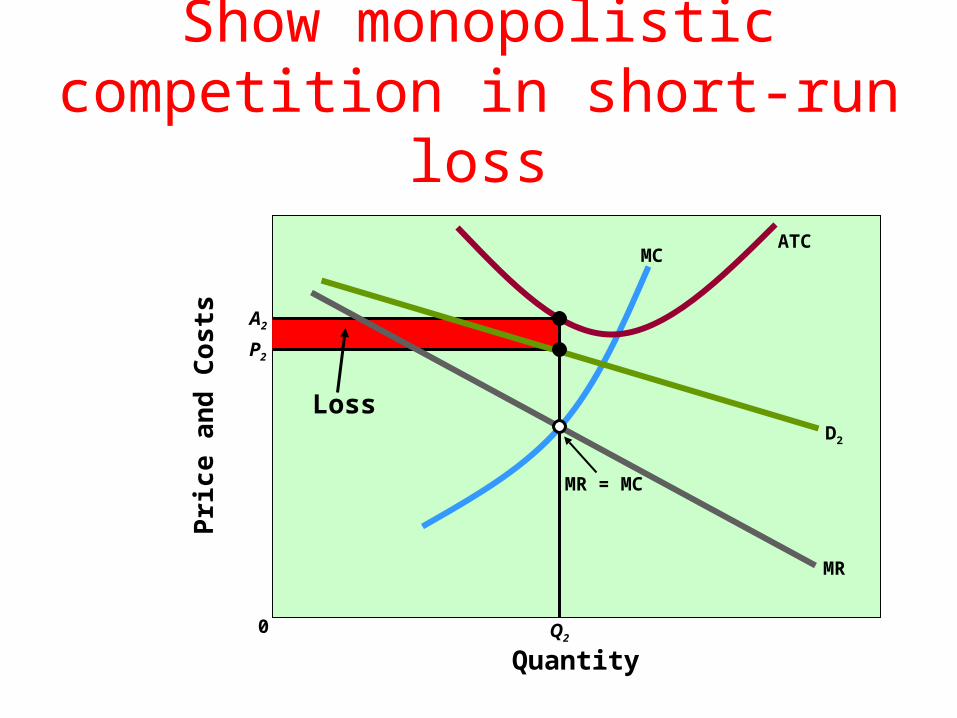
Show monopolistic competition in short-run loss
Quantity
Pri
ce
an
d C
os
ts
MR = MC
MC
MR
D2
ATC
Loss
Q2
A2
P2
0
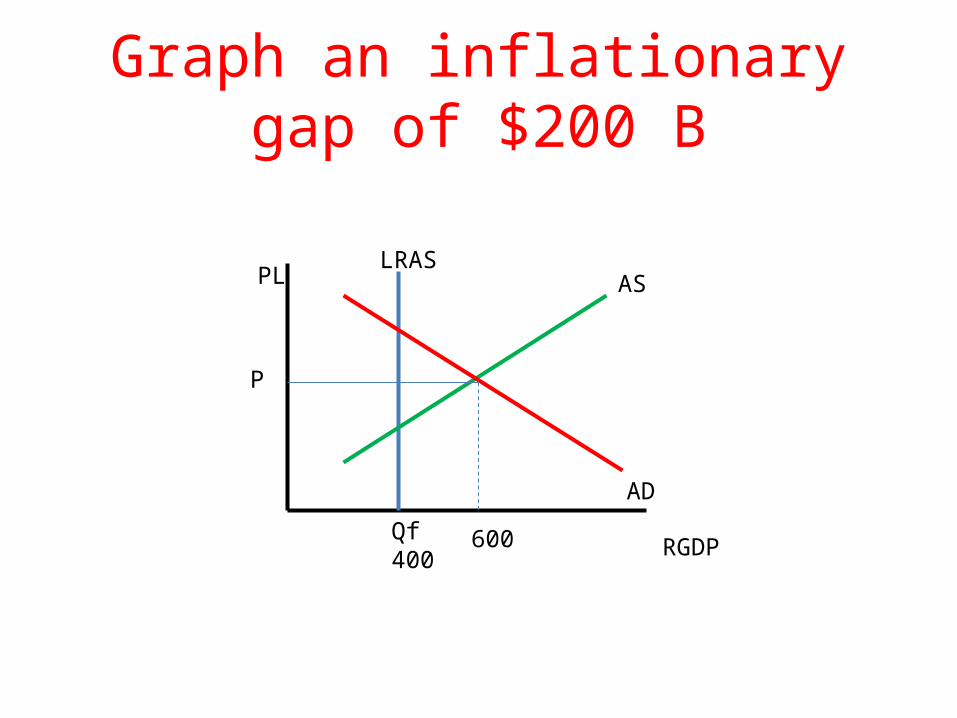
Graph an inflationary gap of $200 B
RGDP
PL AS
AD
600Qf400
P
LRAS
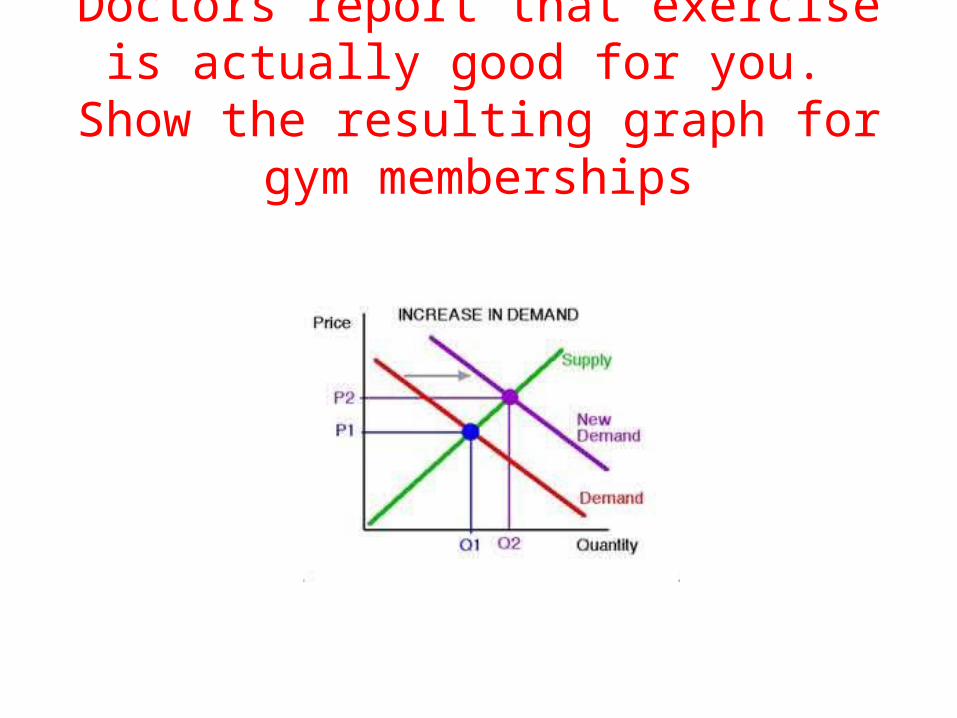
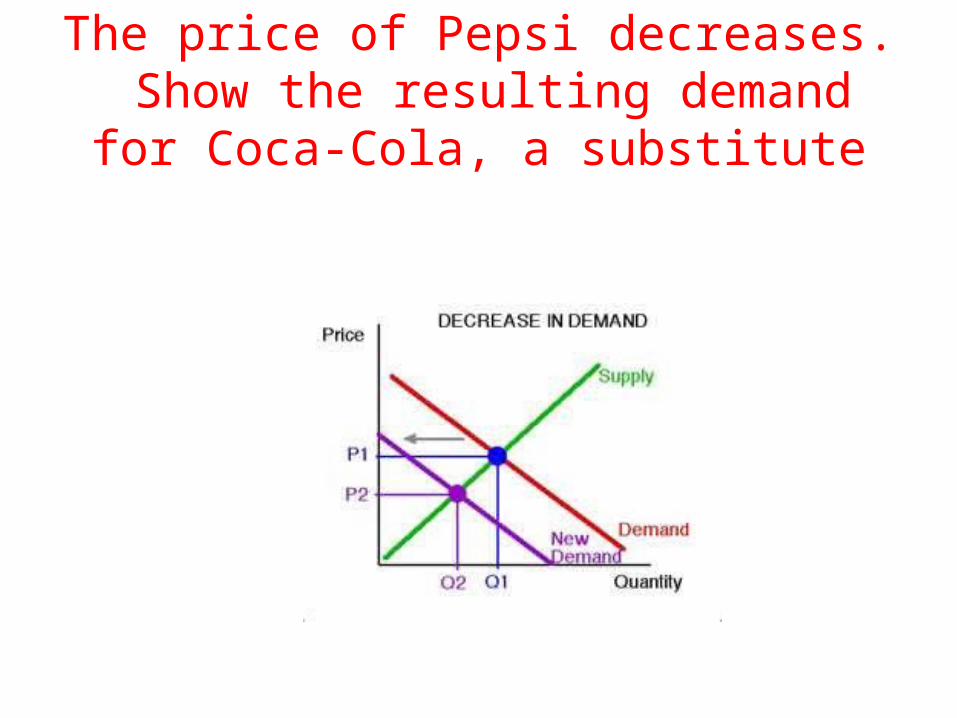
Doctors report that exercise is actually good for you. Show the resulting graph for
gym memberships
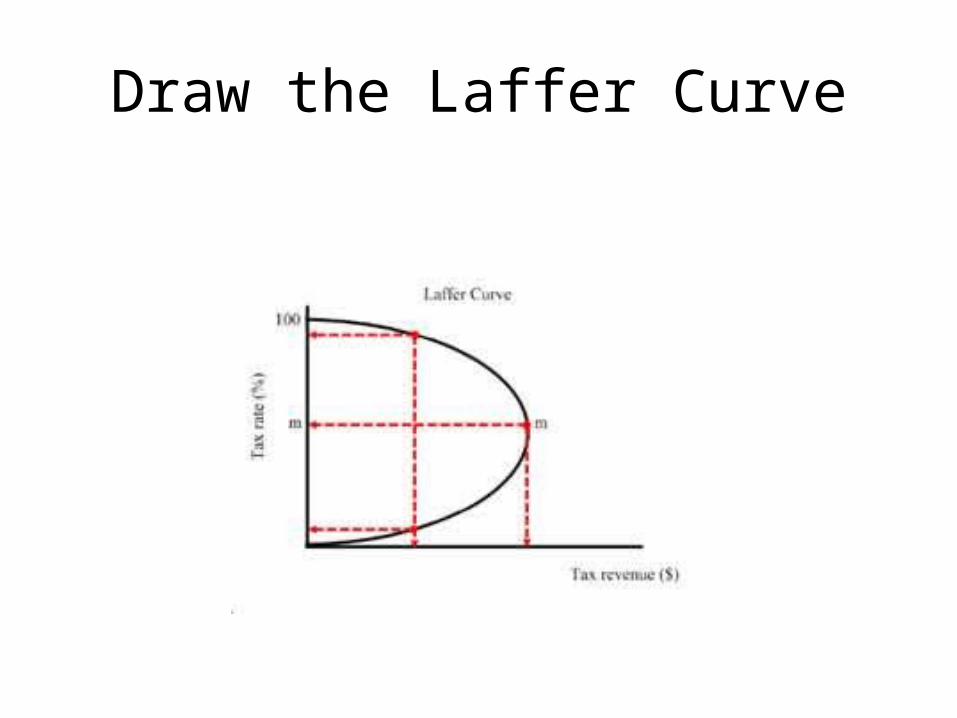
Draw the Laffer Curve
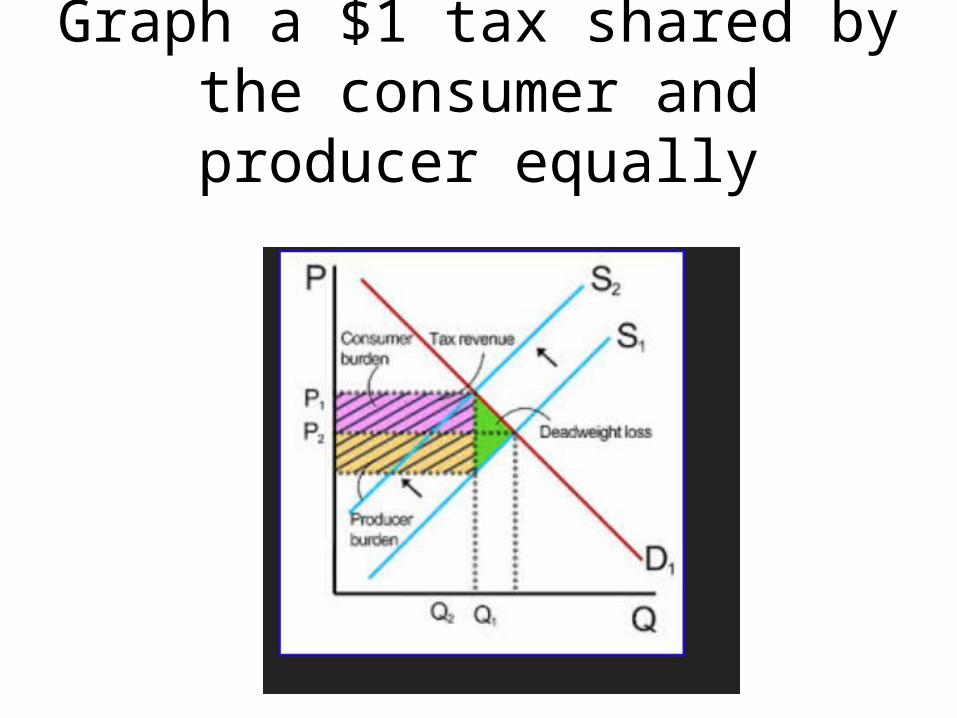
Graph a $1 tax shared by the consumer and producer equally
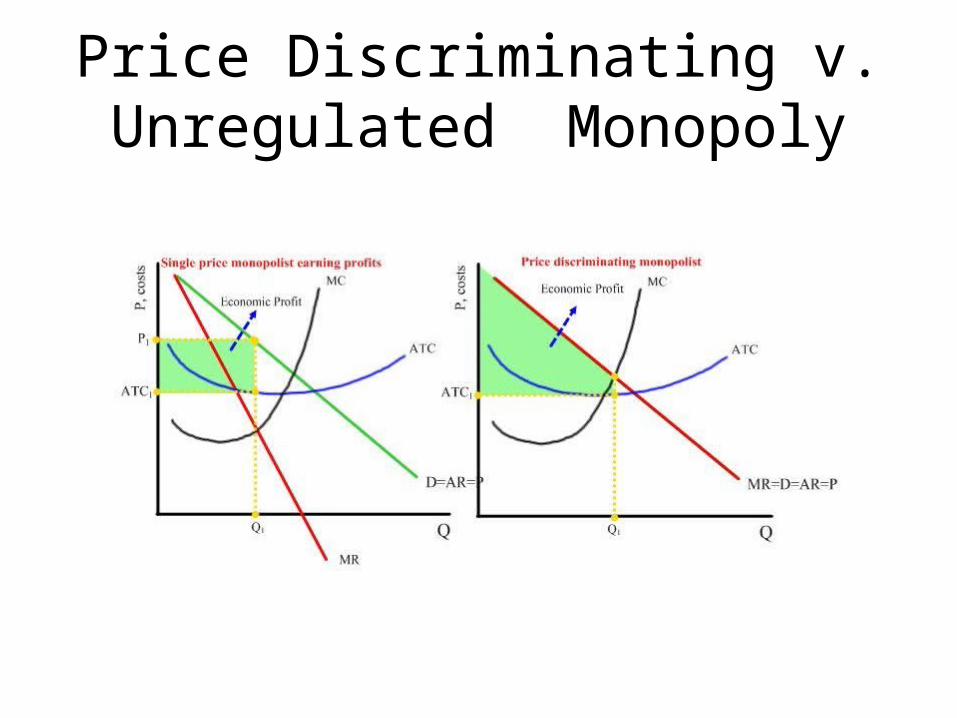
Price Discriminating v. Unregulated Monopoly