end of life care audit – dying in hospital · end of life care audit – dying in hospital report...
TRANSCRIPT
End of Life Care Audit – Dying in Hospital National report for England 2016
Commissioned by:
Acknowledgements The End of Life Care Audit – Dying in Hospital was commissioned by the Healthcare Quality Improvement Partnership (HQIP) on behalf of NHS England. HQIP is led by a consortium of the Academy of Medical Royal Colleges, the Royal College of Nursing and National Voices. Its aim is to promote the use of clinical audit to help drive quality improvement in healthcare.
This report was prepared by the Royal College of Physicians (RCP). We would like to thank all the hospitals and trusts that participated in this audit, with particular thanks to members of staff who submitted their data. We would also like to thank the audit Steering Group (see Appendix III) for their valuable support and advice throughout the project. Particular thanks also go to the national report writing sub‐group: Sam Ahmedzai, Bee Wee, David Brooks, David Jones, Ann Heaton and Amanda Cheesley.
We also acknowledge and thank Marie Curie for contributing additional funding to assist with the dissemination and usage of these audit results for quality improvement purposes.
Useful links Royal College of Physicians www.rcplondon.ac.uk National Council for Palliative Care www.ncpc.org.uk Marie Curie www.mariecurie.org.uk Healthcare Quality Improvement Partnership www.hqip.org.uk Care Quality Commission www.cqc.org.uk
Citation for this document: Royal College of Physicians. End of Life Care Audit – Dying in Hospital. London: RCP, 2016.
Copyright
All rights reserved. No part of this publication may be reproduced in any form (including photocopying or storing it in any medium by electronic means and whether or not transiently or incidentally to some other use of this publication) without the written permission of the copyright owner. Applications for the copyright owner’s written permission to reproduce any part of this publication should be addressed to the publisher. Copyright © Healthcare Quality Improvement Partnership 2016 ISBN: 978‐1‐86016‐610‐5 e‐ISBN: 978‐1‐86016‐611‐2 Royal College of Physicians 11 St Andrews Place Regent’s Park London NW1 4LE www.rcplondon.ac.uk Registered Charity No 210508
End of Life Care Audit – Dying in Hospital National report for England March 2016

End of Life Care Audit – Dying in Hospital report for England
Contents Foreword ........................................................................................................................................................... 3 Executive summary............................................................................................................................................ 4
Background .................................................................................................................................................... 4 Progress since the last audit .......................................................................................................................... 5 Methods ........................................................................................................................................................ 5 Sample ........................................................................................................................................................... 6 Quality indicators for end of life care ............................................................................................................ 6 Key findings ................................................................................................................................................... 8 Key recommendations ................................................................................................................................. 10 Future opportunities and challenges .......................................................................................................... 11
Introduction ..................................................................................................................................................... 12 Background .................................................................................................................................................. 12 National policy context ................................................................................................................................ 12 Aims of the audit ......................................................................................................................................... 13 Audit governance ........................................................................................................................................ 13 Methodology ............................................................................................................................................... 14 Reliability analyses....................................................................................................................................... 15 Confidentiality ............................................................................................................................................. 15 Ethical approval ........................................................................................................................................... 15
Data analysis .................................................................................................................................................... 16 Organisational audit .................................................................................................................................... 16 Clinical case note audit ................................................................................................................................ 16
Results: clinical case note audit ....................................................................................................................... 16 Presentation of results ................................................................................................................................ 16 Inclusion criteria .......................................................................................................................................... 17 Participation (clinical case note audit) ........................................................................................................ 17 Section 1: Demographics ............................................................................................................................. 18 Section 2: Priority of care – recognition of dying ....................................................................................... 23 Section 3: Priority of care – communication .............................................................................................. 26 Section 4: Priority of care – the dying person and those important to them involved in decision making 29 Section 5: Priority of care – needs of families and others ........................................................................... 37 Section 6: Priority of care – an individual plan of care ................................................................................ 41
Results: Organisational audit ........................................................................................................................... 62 Participation figures – organisational audit ................................................................................................ 62 Section 1: Personnel responsible for submitting trust data for this audit .................................................. 62 Section 2: Background information regarding the trusts/hospitals participating in the audit ................... 63 Section 3: Audit and evaluation .................................................................................................................. 66 Section 4a: Trust demographics as at 1 May 2015 ...................................................................................... 68 Section 4b: Supportive information for those important to patients ......................................................... 68 Section 5: Availability of trust-wide continuing education and training ..................................................... 69 Section 6: Trust-wide access to specialist palliative care support .............................................................. 71 Section 7: Trust-wide clinical provisions and protocols .............................................................................. 74 Section 8: Bereaved relatives’ or friends’ perspectives .............................................................................. 76 Summary of organisational audit results .................................................................................................... 77
Appendix I: References .................................................................................................................................... 80 Appendix II: Glossary ....................................................................................................................................... 82 Appendix III: Steering Group membership ...................................................................................................... 85 Appendix IV: Data reliability summary statistics ............................................................................................. 86 Appendix V: Participation / non-participation ............................................................................................... 96 Appendix VI: Site-level end of life care quality indicator data ...................................................................... 100
2 © Healthcare Quality Improvement Partnership 2016

End of Life Care Audit – Dying in Hospital report for England
Foreword This report presents the results of the second biennial national audit of care of the dying in hospitals in England. The first audit report, published in 2014, included data collected during 2013 from three lines of enquiry – an organisational audit of services, a case note clinical audit and a retrospective survey of bereaved carers. This second round of audit is based on data collected during 2015. The 2-year period has seen major changes in end of life care in the NHS and we are pleased that many of the audit measures show that there has been improvement in the delivery of care to dying people and those important to them.
The changes since 2013 include the momentous step, for both the NHS and the important charitable sector in end of life care, of the phasing out of the Liverpool Care Pathway. This was recommended by the 2013 Neuberger review in its report More care, less pathway. The Leadership Alliance had also published its report One chance to get it right. Further influential documents that have emerged on the English healthcare landscape in the intervening period include the Parliamentary and Health Service Ombudsman’s report Dying without dignity and the Ambitions Framework. Finally, the National Institute for Health and Care Excellence (NICE) published its eagerly awaited guidelines on Care of the dying adult in December 2015. Although the latter were published after the data collection for the audit published here, the comprehensive audit design enables us to view the results in the light of many of their key recommendations.
As with the last audit, we present herein two elements: an organisational review of services and protocols; and a clinical case note based audit depicting the end of life care of patients who died during May 2015.
Although many questions in the current audit are identical or very similar to the 2013 exercise, enabling us to make some direct comparisons, in other aspects it has gone further and asked new and more searching questions, in both of the sections. One reason for this divergence is that we wanted the current audit to reflect the important changes since 2013 and, in particular, the recommendations of the Neuberger review and One chance to get it right. Thus the results are presented in such a way as to demonstrate how well trusts are performing against the ‘five priorities for care’ in the latter document. We have also looked carefully for evidence of ‘individualised’ care, as recommended by Neuberger.
I was honoured to be appointed as the clinical lead for this audit. I take great pleasure in thanking the many organisations and individuals who have helped us to shape, undertake and review the audit and this substantial report presented here. These include the colleagues and patient representatives who attended the first scoping workshop; the audit’s Steering Group which comprises consumers as well as a wide range of health and social care professionals; and NHS England for its commitment and support. I must also acknowledge the dedicated team consisting of project and programme managers and a statistician at the Clinical Effectiveness and Evaluation Unit of the Royal College of Physicians, who not only undertook all phases of the work but also – with its clinical director – ‘trained’ me over the past year in their audit processes and methods.
The results in the following pages should give us cause for satisfaction that end of life care has – far from being set back by the phasing out of the Liverpool Care Pathway – advanced the already acknowledged British prowess in this area of healthcare. But we cannot be complacent, for it also shows areas where the NHS is under-performing against the national policy agenda. We recognise the need to continue this series of biennial audits and, to that end, we eagerly await the decision about future funding of this important work.
Sam H Ahmedzai FRCP
Emeritus Professor Clinical Lead for the End of Life Care Audit – Dying in Hospital, Royal College of Physicians
© Healthcare Quality Improvement Partnership 2016 3

End of Life Care Audit – Dying in Hospital report for England
Executive summary The aim of this report is to contribute to learning that can help to improve the quality of care and services for patients who have reached the end of their lives, and who are dying in hospitals in England.
Background Nearly half of all deaths in England occur in hospitals – 223007 out of a total of 469975 in 2014.1
For this reason, trust boards, managers and clinicians should recognise that a core responsibility of hospitals is to deliver high-quality care for patients in their final days of life and appropriate support to their families, carers and those close to them. Government policy in recent years has reinforced this requirement.2–5
In 2013 the independent Neuberger review (More care, less pathway)6 found that there had been failings of the Liverpool Care Pathway in achieving good deaths for a significant proportion of people who were managed using this tool. It recommended that the Liverpool Care Pathway should be phased out by 2014 and be replaced by a more individualised approach. Following this, the Leadership Alliance for the Care of Dying People report7 (One chance to get it right) set out an approach to caring for dying people that healthcare organisations should adopt in the future. The new approach set out by the Alliance focuses on achieving five ‘priorities of care’, which make the dying person themselves the focus of care in the last few days and hours of life and exemplify the high-level outcomes that must be delivered for every dying person. The priorities for the care of the dying person are that, when it is thought that a person may die within the next few days or hours:
• this possibility is recognised and communicated clearly, decisions made and actions taken in accordance with the person’s needs and wishes, and these are regularly reviewed and decisions revised accordingly
• sensitive communication takes place between staff and the dying person, and those identified as important to them
• the dying person, and those identified as important to them, are involved in decisions about treatment and care to the extent that the dying person wants
• the needs of families and others identified as important to the dying person are actively explored, respected and met as far as possible
• an individual plan of care, which includes food and drink, symptom control and psychological, social and spiritual support, is agreed, coordinated and delivered with compassion.
The Royal College of Physicians (RCP) published National care of the dying audit for hospitals8 in 2014, using data collected in 2013 when the Liverpool Care Pathway was still being used. As well as building on the recommendations of the 2014 report, this 2015 RCP audit is designed to ensure that the five priorities of care for the dying person have been implemented and are monitored at a national level. National audit data will support end of life care commissioners, service providers and policymakers to audit the care and to facilitate quality improvement initiatives.
This audit comprised the following two sections. • An organisational audit – key organisational elements that underpin the delivery of care. • A case note review – a consecutive, anonymised case note review of all the patients who died
within participating sites* within a defined time frame.
*Within the context of the audit, trusts registered their participation as either a trust or some or all individual hospitals within a trust. Therefore, a participating ‘site’ may either be a trust or an individual hospital within a trust.
4 © Healthcare Quality Improvement Partnership 2016
End of Life Care Audit – Dying in Hospital report for England
Progress since the last audit Following the Neuberger review of 2013, its key recommendation for the phasing out of the Liverpool Care Pathway in July 2014 was endorsed by all national organisations in the Leadership Alliance, which produced its ‘five priorities of care’ as an interim measure to give providers direction on how to deliver consistently good end of life care. However, there was palpable concern in some sections of the palliative care community that the gap left after the Liverpool Care Pathway’s withdrawal could result in a degradation of services to people in the last days and hours of life. This report demonstrates that, far from a deterioration, comparing the 2013 and 2015 audits, there has been a broad front of improvements in nearly all aspects of care of the dying in hospitals in those trusts who participated.
It should be said that in many areas, trusts need to perform better against national policy drivers and protocols. There are also still many items that were audited that show unreasonably wide variations between organisations. This may arise, admittedly, because of the hitherto lack of national standards: something that the publication in December 2015 of the NICE guidance NG31: Care of adults in the last days of life9 will rectify.
Methods Registration Letters explaining the nature and purpose of the national audit were sent to chief executives and copied to clinical audit departments and palliative care leads of all acute hospital trusts in England. These were accompanied by formal registration process participation details. It was then the responsibility of each trust to register their participation and they did this by providing managerial, clinical, administration and audit representative contact details. Usernames and passwords to access a web-based data entry tool were emailed to nominated personnel within each site ahead of the audit start date. For the clinical case note review element, trusts could choose to register at either trust or hospital level. Therefore, a participating ‘site’ could either be a trust or an individual hospital within a trust.
All acute trusts in which adult patients were ‘expected’ to die were eligible to take part in the audit. Mental health trusts, ambulance trusts, children’s trusts, orthopaedic/rheumatology trusts, women’s trusts and specialist eye trusts were excluded. Organisational element This element sought trust-level information to gain an understanding of the size, scope and environment in which care was provided, as well as structural provisions in terms of policies and procedures for the care of dying patients and those people that are important to them. This information enabled the assessment of trust performance against key national standards and to contextualise the findings from the clinical case note review. Clinical case note review element This clinical element was based upon a set of case note review questions which were devised to reflect the five priorities of care for the dying patient and involved consultation with a multidisciplinary audit steering group following an initial workshop event involving another multidisciplinary group comprised of audit stakeholders. The case note review entailed a consecutive, anonymised clinical case note audit of all adult (ie aged 18 years or older) deaths occurring between 1 and 31 May 2015, where each patient had been under the care of the trust for a minimum of 4 hours.
The data entry requirement was capped at 80 patients per trust; however sites were able to continue to include further cases if they wished in order to provide themselves with a more robust local sample for benchmarking against national statistics.
© Healthcare Quality Improvement Partnership 2016 5

End of Life Care Audit – Dying in Hospital report for England
Submission of data A secure, web-based data collection tool was designed to capture data pertaining to both the organisational and clinical audit elements. Explanatory notes were devised to assist the site audit coordinators to establish a robust sample, access the web-based data entry tool and submit the organisational and clinical case note review data. Details of all audit information were sent to the named audit coordinators following registration, and data entry responsibility was decided by personnel within the participating trusts. Telephone help-line and email support services were made available during the data submission period to facilitate data collection and to answer any queries.
The data entry period for the organisational audit was between 6 July 2015 and 31 July 2015. Participating trusts were responsible for completing the online organisational audit proforma and were advised to liaise with their clinical information department in order to fill out certain elements of this organisational audit.
The clinical case note review data entry period was between 6 July 2015 and 30 September 2015. Clinical governance/information departments within participating sites were responsible for identifying and collating eligible case notes. Participating trusts were responsible for completing the case note review proforma with patient-level data derived directly from information held within the patient case notes.
Sites were also requested to provide two independent entries of the first three patient data sets for an internal inter-auditor reliability study. The ‘repeat’ entries were entered separately via a separate username and password to distinguish them from the original entries. Auditors were also advised to mark ‘repeat’ entries as such by clicking the relevant tick-box on the online proforma.
Sample In total, 142 sites from 137 out of 142 possible trusts submitted data to the organisational audit. The number of sites being greater than the number of trusts is attributable to the fact that three trusts each submitted data for two separate sites (due to recent mergers), while two other trusts were community trusts that wished to take part in the audit. The community trusts have been excluded from the participation figures.
A total of 9302 unique patient datasets (ie a complete case note review addressing each of the clinical audit questions) were submitted for the national clinical case note review sample. These were submitted by a total of 145 sites from 139 out of a possible 142 trusts.
The sample had a median age of 82 years and 19.8% had a primary diagnosis of cancer: 51% of patients were female. The audit covered all patients who had died after a minimum of 4 hours following admission (by comparison, the 2013 audit included deaths that had occurred 24 hours following admission).
Each participating site received an individual report of their performance against the national sample for the organisational and case note review elements of the audit. In addition, individual site results were downloadable separately from within the audit web tool.
Quality indicators for end of life care In the report of the 2013 audit, we published a set of key performance indicators (KPIs), by which hospital trusts could benchmark themselves for future performance. The changing healthcare landscape and terminology have led us to re-conceive these as quality indicators (QIs) for this 2015 audit. Essentially, they retain the same function and are derived from the actual results of participating trusts during the audit.
We have chosen a range of activities, both organisational and clinical, which reflect the ‘individualised’ care plans recommended by the 2013 Neuberger More care, less pathway review,6 and the ‘five priorities of care for the dying person’ which were published in the One chance to get it right report.7 We particularly picked aspects of care for these QIs in which the audit showed a variance of results, with many trusts 6 © Healthcare Quality Improvement Partnership 2016

End of Life Care Audit – Dying in Hospital report for England
performing well but some also under-performing. The trust-level QI data presented in Appendix VI of this report show these services how their own results stand up to the national picture summarised below (Table A). We hope that they will encourage investment into changes to consolidate good achievements, or to rectify weaknesses.
Table A: National achievement against end of life care quality indicators
CLINICAL AUDIT National result
Cases in clinical audit n=9302
Clinical audit indicator % of cases
1 Is there documented evidence within the last episode of care that it was recognised that the patient would probably die in the coming hours or days? %YES 83%
2
Is there documented evidence within the last episode of care that health professional recognition that the patient would probably die in the coming hours or days (imminent death) had been discussed with a nominated person(s) important to the patient? %YES 79%
3 Is there documented evidence that the patient was given an opportunity to have concerns listened to? %YES or NO BUT 84%
4 Is there documented evidence that the needs of the person(s) important to the patient were asked about? %YES or NO BUT 56%
5 Is there documented evidence in the last 24 hours of life of a holistic assessment of the patient’s needs regarding an individual plan of care? % YES 66%
ORGANISATIONAL AUDIT
Sites in organisational audit n=142
Organisational audit indicator % of sites
6 Is there a lay member on the trust board with a responsibility/role for end of life care? 49%
7 Did your trust seek bereaved relatives’ or friends’ views during the last 2 financial years (ie from 1 April 2013 to 31 March 2015)? 80%
8A Between 1 April 2014 and 31 March 2015, did formal in-house training include/cover specifically communication skills training for care in the last hours or days of life for medical staff?
63%
8B Between 1 April 2014 and 31 March 2015, did formal in-house training include/cover specifically communication skills training for care in the last hours or days of life for nursing (registered) staff?
71%
8C Between 1 April 2014 and 31 March 2015, did formal in-house training include/cover specifically communication skills training for care in the last hours or days of life for nursing (non-registered) staff?
62%
8D Between 1 April 2014 and 31 March 2015, did formal in-house training include/cover specifically communication skills training for care in the last hours or days of life for allied health professional staff?
49%
9 Was there face-to-face access to specialist palliative care for at least 9am to 5pm, Monday to Sunday? 37%
10 Does your trust have one or more end of life care facilitators as of 1 May 2015? 59%
© Healthcare Quality Improvement Partnership 2016 7

End of Life Care Audit – Dying in Hospital report for England
Key findings Clinical patient case note review key findings
Recognition of dying • Ninety-three per cent of patients whose death was predictable had documentation that they would
probably die. In 76% of cases, a senior doctor was involved in the recognition of dying. For half the patients, recognition of dying occurred within 5 days after admission; and for half the patients this occurred less than 34 hours before death. In total, only 25% of people who were recognised as being likely to die had documented evidence of a discussion with a healthcare professional about their likely imminent death. In 95% of the cases where it had been recognised that the patient was likely to die, there was documented discussion with those nominated as important to the dying person.
Communication and treatment decisions • Where there was an advance care plan, the team took the contents into account when making
decisions (91%) and it was reviewed (79%); however only 4% (415/9302) of patients had documented evidence of an advance care plan made prior to admission to hospital.
• A do not attempt cardiopulmonary resuscitation (DNACPR) order was in place for 94% (8711/9302) of patients’ notes at the time of death. Where sudden deaths are excluded, discussion about CPR by a senior doctor with the patient was recorded in 36% (2748/7707). Overall, for 16% (961/6072) there was no reason recorded why a discussion did not take place. Discussion about the CPR decision with the nominated person(s) important to the patient was documented in 81% of cases.
• It was recorded that 32% of patients had opportunities to have their concerns listened to and, of these, 94% were given the opportunity to have questions answered about their concerns.
Communication with people important to the patient • In 38% of cases, there was documented evidence in the last episode of care that the patient’s needs
had been discussed with the people important to them. • In total, 54% of case records showed that the needs of persons important to the person were asked
about. Of these, 62% had needs identified. • It was recorded that nominated person(s) important to 80% of patients had opportunities to discuss
the patient’s condition with a senior healthcare professional. • Excluding the cases of sudden or unexpected deaths, in 84% of cases the people important to the dying
patient were notified of the imminent death. Of those notified, 63% were recorded as being present at the time of death. There was documented evidence of care and support of the patient’s family at the time of, and immediately after death, in 65% of cases with wide variance between different sites.
Individual plan of care
Symptom control • Excluding sudden deaths and cases where the patient had died less than 24 hours after admission, 73% of
case records showed that there had been a holistic assessment of the patient’s needs with a view to making an individual plan of care.
• Of the key symptoms that could be present around the time of death, there was documented evidence that: pain was controlled in 79% of cases; agitation/delirium in 72%; breathing difficulties in 68%; noisy breathing / death rattle in 62% and nausea/vomiting in 55%. If results are restricted to those with known length of stay (LOS) ≥24 hours, there was documented evidence that anticipatory medication (prn) was prescribed for the key symptoms: for pain in 75% of cases; agitation/delirium 69%; breathing difficulties 66%; nausea/vomiting 66%; noisy breathing / death rattle 62%.
• The prescribing of specific drugs for prn and regular use, including the use of continuous subcutaneous (SC) and intravenous (IV) infusions, was extensively documented. However there were problems with the recording of some drugs on the audit data collection web tool. Thus there will be a limited analysis of these data at this time. In total, 65% of the medications that patients received had been reviewed in the last 24 hours of life.
8 © Healthcare Quality Improvement Partnership 2016

End of Life Care Audit – Dying in Hospital report for England
Drinking and eating • In the last 24 hours of life there was documented evidence that: in two-thirds of cases the patient’s ability
to drink had been assessed; thirty-nine per cent of patients were documented as drinking, and in 45% of cases that the patient had been supported to drink.
• In total, 18% of patients had a ‘nil by mouth’ (NBM) order in their last 24 hours. Ninety-three per cent of NBM orders had a documented reason. Twenty-three per cent of patients with an NBM order had been informed of it; 64% of the people important to the patient had been informed. The majority (54%) of the NBM decisions had involved a consultant (other than palliative medicine); 20% involved speech and language therapists (SALTs) and 16% a staff nurse.
• In 71% of cases, there was documented evidence that the patient had an assessment regarding the need for clinically assisted (artificial) hydration (CAH) at any time between the final admission and death. There was documented evidence that discussion regarding drinking and the need for CAH was undertaken with the patient between the date of final admission and death in 18%; and in 39% these discussions had taken place with nominated people, or the nominated independent mental capacity advocate (IMCA), or lasting power of attorney (LPA) for personal welfare.
• CAH was in place during the last 24 hours before death in 43% of patients. • In 61% of cases there was documented evidence that the patient’s ability to eat had been assessed in the
last 24 hours of life. In 26% of cases, it was documented that the patient was eating in the last 24 hours. In 36% of cases there was evidence that the patient had been supported to eat in the last 24 hours.
• In 34% of cases, there was documented evidence that the patient had an assessment regarding the need for clinically assisted (artificial) nutrition (CAN) at any time between the time of the final admission and death. CAN was in place during the last 24 hours before death in 8% of patients.
Spiritual care • There was documented evidence of discussion during the last episode of care regarding the patient’s
spiritual/cultural/religious/practical needs with 15% of patients who were capable of participating in such discussions. In a further 27% there had been discussion with a nominated person important to the patient. It was documented that in 89% of cases, the identified spiritual/cultural/religious/practical needs had been met.
• There was documented evidence of care of the patient immediately prior to, or at the time of, death in 73% of cases. Immediately after death, care of the patient was recorded in 63% of cases.
Organisational element key findings
Staffing and training • In total, 13% of trusts (18/142) reported that they had specialist palliative care beds. • Almost all (97%) trusts had their own specialist palliative care service; 70% also used a specialist palliative
care service funded and based outside the trust. • There was a median of 1.08 specialist palliative care (SPC) consultant whole-time equivalent (WTE) filled
posts (for direct clinical care of hospital inpatients excluding those in SPC beds) per 1,000 adult beds; and a median of 5.08 clinical nurse specialist WTE filled posts per 1,000 adult beds. The availability of SPC staff around the clock varied widely, but 11% (16) of trusts offered a 24/7 face-to-face service. The availability of out-of-hours telephone service was more comprehensive, with the majority of services providing this every day of the week. Twenty-six trusts did not indicate any level of provision of face-to-face specialist palliative care involving doctors, at any time.
• Thirty-seven per cent (53/142) of sites had face-to-face access to a palliative care service Monday to Sunday, 9am to 5pm.
• Fifty-nine per cent of trusts had one or more end of life care facilitators in place. • Ninety-six per cent of trusts had a formal in-house continuing education programme on the subject of end
of life care. Formal in-house, communications skills training was available for 71% of registered nurses, 63% of medical staff, 62% of non-registered nurses and 49% of allied health professionals.
© Healthcare Quality Improvement Partnership 2016 9
End of Life Care Audit – Dying in Hospital report for England
Guidance and policies • Only 46% of trusts were involved in the Transforming End of Life Care in Acute Hospitals Programme; and
only 35% of trusts are using electronic palliative care coordination systems (EPaCCSs). • Ninety-eight per cent of trusts reported ‘locally developed programmes of work to support end of life
care’, which probably represents the changes needed after the withdrawal of the Liverpool Care Pathway. • There was a 66% uptake of a formal process for discussing and reporting on the five priorities of care. • As of 1 May 2015, 78% of trusts had a mechanism for flagging complaints that related to end of life care.
For organisations where there was an end of life care strategy group, 68% of these had complaints routinely reported to them.
• In total, 99-100% of trusts stated that they had guidance on prescribing medications for each of the five key symptoms that can be present in patients in the last days/hours of life. Most trusts had policies for ensuring patients’ comfort and dignity; and for offering family and friends access to the body after death, and a prayer room. All trusts reported that they had a policy for recording DNACPR decisions, while 80% had a policy for the deactivation of implantable cardioverter defibrillators (ICDs). Seventy-five per cent reported that they had designated quiet spaces for relatives.
• The 2014 National care of the dying audit for hospitals report (on 2013 data)8 recommended that all trusts should have a named member on the board responsible for end of life care. Ninety-eight per cent have achieved this.
• The last audit also recommended that all trusts have a lay member with responsibility for end of life care on their board. Only 49% of trusts achieved this.
• Seventy-eight per cent of trusts stated that they gave leaflets to families and those important to dying patients about what to expect.
Using relative’s views and auditing care • Sixty-five per cent of trusts had undertaken a formal audit of care for patients in the last hours or days.
Seventy-six per cent fed audit results back to the trust board. • In total, 80% of trusts sought bereaved relatives’ and friends’ views using a variety of mechanisms
between 1 April 2013 and 31 March 2015. Eighty-two per cent of trusts shared the results of bereavement surveys with the clinical team; 64% with the trust board; and 31% with the public. Sixty-seven per cent of trusts reported that they implemented change to their service as a result of their assessment of bereaved relatives’ or friends’ perspectives.
Key recommendations Clinical case note review element recommendations
• Recognition of the possibility that a patient may die should be communicated to the patient, people important to the patient and staff, and documented in the case notes as early as possible. The recognition of dying should be reviewed by a senior doctor or nurse.
• When the possibility of dying is not discussed with the patient or the nominated person important to them, the reasons for this should always be documented in the case notes.
• All professionals, especially those working with people living with chronic conditions, multiple comorbidities, and in particular people for whom future loss of mental capacity is anticipated (eg people with dementia), should initiate and encourage advance care planning.
• Assessment of holistic needs of patients, leading to an individualised care plan, should be undertaken more frequently and uniformly once it is recognised that the patient is dying. These assessments should cover:
o all the commonly experienced symptoms seen in dying patients o the possible need for CAH o the dying patient’s ability and desire to eat o the possible need for CAN.
• Medication prescribed for the dying patient in the last 24 hours of life should be reviewed; and this review should record the degree of symptom control for each of the five key symptoms.
10 © Healthcare Quality Improvement Partnership 2016
End of Life Care Audit – Dying in Hospital report for England
• There needs to be better documentation of justification for NBM orders and improved communication of them to patients (if they are conscious) and to those important to them. NBM orders should only be made by a senior doctor, nurse or SALT specialist.
• For patients who are unconscious or lack capacity, there should be better documentation of attempts to contact and discuss hydration and/or nutrition needs with those important to them, especially those nominated to have responsibility for decisions so that they are involved in discussions.
• The documentation should be improved regarding the: o discussions undertaken about the dying patient’s spiritual/cultural/religious/practical needs o identification of the needs of the dying patient and those important to them o identification of patients’ concerns, and those of the people important to them o recording who was present at the time of the patient’s death o care of the patient undertaken immediately before and after death (especially if there were
special religious/cultural requirements) Organisational element recommendations
• Where trusts are not already using EPaCCSs or an equivalent system for record sharing, they should take steps to do so.
• All trusts should have access to specialist palliative care services 9am to 5pm, 7 days a week. • All medical and nursing staff with responsibility for the care of dying people should attend
communication skills training specifically on care in the last days/hours of life, and this should be recorded in their portfolios. Health and social care professionals should receive training or information about advance care planning (eg www.e-lfh.org.uk/programmes/end-of-life-care).
• There should be at least one lay member with specific responsibility for end of life care on every NHS trust board.
• Trusts should provide protocols to ensure provision of patient comfort, dignity and privacy – up to, including and after the death of the patient.
• All trusts should seek bereaved relatives’ views, and results should be fed back to the trust’s board as well as the public.
• Trusts should perform audits of end of life care and the results should be fed back to their boards.
Future opportunities and challenges The big opportunity for the End of Life Care Audit – Dying in Hospital (and also the biggest set of challenges) in the coming years will be to align NHS practices to the new NICE guideline (NG31).9 For example, it has highlighted many areas where access to more experienced staff and especially to specialist palliative care professionals will need to be improved. Given the current low level of 9am to 5pm, 7-day access to specialists shown in this report – never mind 24/7 access – this could have major implications for the way that NHS trusts and charitable providers must work together. New programmes of training will be needed to help staff recognise the signs and symptoms when someone may be dying – or possibly improving – and how to communicate the uncertainties around those subtle clinical changes. For clinicians, reviewing the need for maintaining hydration and discussing the advantages and disadvantages of CAH will also necessitate training and improved communication skills. Trusts in England will have to change their policies on prescribing ‘as required’ and in particular for ‘anticipatory medications’ – moving from a blanket approach to a tailored one. Overall, there will have to be explicit changes to ensure that care for dying people, and for those important to them, must become truly individualised.
We hope that the next audit in 2017/2018 will show that the upheaval in end of life care experienced in England between 2013 and 2015 will have further positive outcomes for patients, families and staff. Ideally, that audit should also encompass the full picture of end of life care in all settings.
© Healthcare Quality Improvement Partnership 2016 11

End of Life Care Audit – Dying in Hospital report for England
Introduction
Background The End of Life Care Audit – Dying in Hospital is a national clinical audit funded by NHS England, commissioned by the Healthcare Quality Improvement Partnership (HQIP) and managed by the Royal College of Physicians (RCP). Additional funding was also provided by Marie Curie to assist with the dissemination and usage of the audit results for quality improvement purposes. The audit builds on the recommendations of the 2014 National care of the dying audit for hospitals8 and is designed to ensure that the priorities for care of the dying person outlined in the document One chance to get it right7 and summarised in the executive summary of this report are monitored at a national level. National audit data will support end of life care commissioners, service providers and policymakers to audit care and to facilitate quality improvement initiatives.
National policy context
I can make the last stage of my life as good as possible because everyone works together confidently, honestly and consistently to help me and the people who are important to me, including my carer(s).
This summary statement, which was first articulated in Every moment counts,10 a narrative for person-centred, coordinated care for people near the end of life produced by National Voices and the National Council for Palliative Care, has been adopted as the overarching vision in the Ambitions for palliative and end of life care: A national framework for local action 2015-2020 (the Ambitions Framework).11
The Ambitions Framework was jointly developed by 27 national organisations, including NHS England and the RCP. It builds on the national End of life care strategy (2008)2 and takes into account the findings and recommendations of the many reports and publications on palliative and end of life care that have been published in recent years, including More care less pathway (2013),6 the independent review of the Liverpool Care Pathway, and One chance to get it right (2014),7 the system-wide response to that independent review. The approach taken in the Ambitions Framework is aligned to the NHS Five Year Forward View and recognises that the emphasis in today’s health and social care system is on local decision-making and delivery. The Ambitions Framework sets out six ambitions to bring about that overarching vision:
1. each person is seen as an individual 2. each person gets fair access to care 3. comfort and wellbeing is maximised 4. care is coordinated 5. all staff are prepared to care 6. each community is prepared to help.
The Ambitions Framework identifies eight foundations that underpin all these ambitions, and building blocks that are specific to each ambition. The foundations required are: personalised care planning; shared records; 24/7 access; education and training; involving, supporting and caring for those important to the dying person; evidence and information; co-design; and leadership – all of which are pertinent to care of dying people in hospitals, as well as palliative and end of life care earlier in the illness trajectory and across all settings.
12 © Healthcare Quality Improvement Partnership 2016
End of Life Care Audit – Dying in Hospital report for England
End of Life Care Audit – Dying in Hospital
In the world we now live in, improvement cannot be brought about through central direction. It requires local leadership and collective local effort, working in respectful partnership with everyone involved, to achieve improvements in all aspects of care. Robust and valid data and information are necessary to help drive quality improvement, but this can be difficult to collect and test in palliative care solely through conventional research methodologies. A national audit programme such as this is necessary to support critical evaluation and reflection on the current clinical practice regarding the care of dying people and those important to them, both within and across organisations. This audit includes a focus on the priorities for care of the dying person, set out in One chance to get it right.7 More recently, after this audit had been carried out, the NICE clinical guidelines Care of dying adults in the last days of life (2015)9 has been published. This includes recommendations that reflect similar emphases to that in the priorities for care of the dying person, and for which information is sought in this audit. It should be borne in mind that the ability of audit participants to gather and submit information is dependent on the availability of documented evidence, and so this audit can only report on what was documented and may under-represent processes of care.
Aims of the audit
The overarching aim of this audit was to improve the quality of care and services for patients who have reached the end of their life, in hospitals in England.
This aim was to be achieved via the following objectives:
1. To build on the learning from previous care of the dying audits to date, preserving and further developing the most successful design features in order to maximise its quality improvement impact while moving away from a focus on a ‘pathway’.
2. To achieve and maintain close alignment with relevant national guidance – One chance to get it right,7 NICE clinical guidelines and the NICE Quality Standard for end of life care – throughout the audit, as appropriate.
3. To consider how the experience of relatives and carers could be incorporated in the audit moving forwards and achieving a granularity that would enable the future comparison of providers of healthcare and address any potential for duplication.
4. To develop from the dataset markers of best practice for end of life care to enable comparison over time, with the potential to be used in other national audits.
5. To enable improvements through the provision of timely, high-quality data that will enable the future comparison of healthcare providers, and comprise an integrated mixture of named trust, multidisciplinary team (MDT) and consultant-level reporting.
Audit governance Delivery and performance of the audit was accountable to HQIP. It was managed by the RCP and supported by a multidisciplinary and multiagency advisory steering group. Membership of this steering group reflected the breadth of clinical and service expertise needed to represent the different perspectives of end of life care within acute hospital settings. A clinical lead provided clinical guidance throughout the course of the project.
© Healthcare Quality Improvement Partnership 2016 13
End of Life Care Audit – Dying in Hospital report for England
Methodology Letters explaining the nature and purpose of the national audit were sent out to chief executives of all acute hospital trusts in England and copied to clinical audit departments and palliative care leads in each acute hospital trust. These were accompanied by details of the formal registration process for participation. It was then the responsibility of each trust to register their participation. For the clinical case note review element, trusts could choose to register at either trust or hospital level. Therefore, a participating ‘site’ could either be a trust or an individual hospital within a trust.
Sites registered their participation by providing managerial, clinical, administration and audit representative contact details. Usernames and passwords to access a web-based data entry tool were emailed to nominated personnel within each site ahead of the audit start date.
Organisational element All acute trusts in which adult patients were ‘expected’ to die were eligible to take part in the audit. Mental health trusts, ambulance trusts, children’s trusts, orthopaedic/rheumatology trusts, women’s trusts and specialist eye trusts were excluded. This element sought trust-level information from participating trusts to gain an understanding of the size, scope and environment in which care was provided, as well as structural provisions in terms of policies and procedures for the care of dying patients and those people who are important to them. This information enabled the assessment of trust performance against key national standards and to contextualise the findings from the clinical case note review.
Clinical case note review element This clinical element was based upon a set of case note review questions (see www.rcplondon.ac.uk/eolca for these) that were devised to reflect the five priorities of care for the dying patient and involved consultation with a multidisciplinary audit steering group following an initial workshop event involving another multidisciplinary group composed of audit stakeholders. The case note review entailed a consecutive, anonymised clinical case note audit of all adult (ie aged 18 years or older) deaths occurring between 1 and 31 May 2015, where each patient had been under the care of the trust for a minimum of 4 hours.
The data entry requirement was capped at 80 patients per trust; however sites were able to continue to include further cases if they wished, in order to provide themselves with a more robust local sample for benchmarking against national statistics
Tools A secure, web-based data collection tool was designed to capture data pertaining to both the organisational and clinical audit elements.
Submission of data Explanatory notes were devised to assist the site audit coordinators to establish a robust sample, access the web-based data entry tool and submit the organisational and clinical case note review data. Details of all audit information were sent to the named audit coordinators following registration, and data entry responsibility was decided by personnel within the participating trusts. Telephone help-line and email support services were made available during the data submission period, to facilitate data collection and to answer any queries.
The data entry period for the organisational audit was between 6 July and 31 July 2015. Participating trusts were responsible for completing the online organisational audit proforma and were advised to liaise with their clinical information department in order to fill out certain elements of this organisational audit.
The clinical case note review data entry period was between 6 July and 30 September 2015. Clinical governance/information departments within participating sites were responsible for identifying and
14 © Healthcare Quality Improvement Partnership 2016
End of Life Care Audit – Dying in Hospital report for England
collating eligible case notes. Participating trusts were responsible for completing the case note review proforma with patient-level data derived directly from information held within the patient case notes.
Reliability analyses Reliability (agreement between auditors) is not the same as validity (accuracy of measure). However establishing good agreement between auditors is an important part of the process of validation, as valid data by definition will have to be reliable. Sites were requested to provide two independent entries of the first three patient datasets for an internal inter-auditor reliability study. The ‘repeat’ entries were entered separately via a separate username and password, to distinguish them from the original entries. Auditors were also advised to mark ‘repeat’ entries as such by clicking the relevant tick-box on the online proforma. In total, 468 pairs of cases from 140 sites (6 sites with 1-2, 103 sites with 3, 21 sites with 4, and 10 sites with 5-10) were analysed. Levels of agreement were found to be generally ‘good’, with 77% of computed kappa values* over 0.60, 59% over 0.70 and 40% over 0.80. Of 235 kappa values computed, their median was 0.73, with an IQR of 0.62-0.88.
*Please refer to Appendix IV for an explanation of kappa values.
Confidentiality Organisational audit and clinical case note review
No patient-identifiable data were collected as part of this audit. Audit coordinators accessed the web-based data entry tool via a unique username and password. The web-based data entry tool was accessed via a secure https website, to ensure that any data submitted were encrypted, and all submitted data were stored on a secure server.
Web server
HQIP is the data controller for the audit dataset. Access to the RCP servers is restricted. Measures have been taken to prevent unauthorised individuals accessing data stored on the RCP servers. Processes are certified to ISA 7001: the recognised standard for data security. Information held on the servers can be accessed by information technology (IT) staff. All individuals with administrative access to the website must have had a third-party security screening, as per BS 7858:2006 (the standard code of practice for the security screening of individuals).12
Back up of information held on the server
A back up of the server is performed on a regular basis, to ensure that a recent copy of the content can be recovered should the server fail. The back-up server is stored in a fireproof location in a building separate from the location of the computer servers.
All data made available for analysis were in electronic format. As per the current information governance policy, the project datasets will be stored for 15 years from the end of the project, and confidentially destroyed after this period of time.
Ethical approval The audit concurs with the definition stipulated by the National Research Ethics Service (NRES) as service improvement, and as such, ethical approval was not required.13
© Healthcare Quality Improvement Partnership 2016 15

End of Life Care Audit – Dying in Hospital report for England
Data analysis Organisational audit Data have been analysed using descriptive statistics and summarised in tabular format to illustrate the national picture of the provision of end of life care. This data also provides useful contextual data with which to interpret the clinical case note review findings. Sites will see their own data benchmarked against national data in associated site-level reports.
Clinical case note audit National data have been analysed using tables of descriptive statistics:
• median and interquartile ranges (IQRs) (or occasionally 10th, 20th, 80th and 90th percentile ranges), where appropriate
• percentages relating to each of the question response options within the case note review.
Results: clinical case note audit Presentation of results This report gives national results for all units participating in this audit.
Where applicable, 2013 national audit data are recorded beneath tables to allow an assessment of change at the national level. However, the previous audit asked many different questions to the current audits, and only a few questions were applicable for providing historical comparisons. The inclusion criteria also varied between audits in that the previous audit required patients to have been under the care of the hospital trust for ≥24 hours, whereas it was ≥4 hours for this current audit. To make results more comparable, it has been necessary to restrict the current audit results to cases with a known length of stay (LOS) of ≥24 hours, while for some questions it was necessary to also restrict the denominator to those cases for which there was recognition of dying. Direct historical comparison can be problematic even with apparently small subtle changes in wording and this must be borne in mind when considering a temporal change in results. Visual methods are used to convey site variation in some results. Some of the graphics are what are known as ‘funnel plots’, which are diagrams that show site results plotted against site sample size, in comparison with a line that indicates the overall national result and dotted lines that indicate limits of control. Control limits are often shaped like a ‘funnel’ and serve as boundaries. Any results falling above the upper boundary or below the lower boundary are considered to be outliers. The chance of results being outside these limits due to chance alone is very small (5% for the inner and 0.2% for the outer limits), so when site results do fall outside, these are inconsistent with the overall national result in relation to their sample size. This implies that something else is happening, non-random in nature, probably systematic organisational differences rather than randomness of scatter. Each section of the report is preceded by a short summary of key messages and of areas needing improvement. The executive summary, earlier in this report, provides an overview of these key messages and recommendations, particularly in relation to standards relating to care in the last days of life. After the key messages and areas for improvement we present the detailed data, usually in the form of tables but sometimes figures. Text is also given to expand on the interpretation of these data, especially when extra analyses were made to bring the current audit’s selection criteria and time frames to match those of the previous audit. Finally, we present textual discussions of the findings, bringing out comparisons with the previous audit and putting the results in the context of national policy documents such as NICE guidance. Although this may seem repetitive, it provides the reader with an overview of the data for each section.
16 © Healthcare Quality Improvement Partnership 2016

End of Life Care Audit – Dying in Hospital report for England
There was some data cleansing required to account for illogical data. The drug doses were particularly problematic. There was also some data cleaning required of ‘other’ free-text entries where these were notably large numbers. In tables and text, please note that when categories are combined to give a combined percentage, it is the numbers that are added and not the percentages. When presenting the results in this report, the audit questions are reproduced as they appeared on the data collection proforma.
Inclusion criteria The included cases were: all consecutive adult patients aged 18 years or above (at the time of death) starting from 1 May 2015 and continuing to 31 May 2015, who died in hospital in England and had been under the care of the hospital trust for 4 or more hours prior to their death. Patients who died in a hospital not directly managed by the trust being audited were not to be included. In order to cap the audit workload within reasonable bounds, sites with more than 80 eligible adult deaths were asked to audit their first 80.
Participation (clinical case note audit) • In total, 145 sites submitted data for the clinical audit case note review element of the audit. • Three trusts each submitted data for two separate sites (due to recent mergers) (= 142 trusts). • Three sites that submitted data were community sites/trusts that wished to take part in the
audit. The community sites have been excluded from the participation figures (= 139 trusts). • Three trusts did not participate in the clinical audit, making participation 98% (139/142).
There were 9770 records exported from the web-data collection tool, of which 468 were duplicate records for use in reliability analyses when paired against the original record. This left 9302 unique patients from 145 sites in the main analysis. The median number of patient records submitted by each site was 77 (IQR 51-80). In total, 142 sites submitted data to both the organisational and clinical audits, and data from both audits enables response to the clinical audit to be estimated. From the organisational audit data, there were 9787 adult deaths meeting the clinical audit inclusion criteria in hospitals that submitted clinical data. These 142 sites actually submitted audit data on 9249 adult deaths (95%). Note that a very small percentage of the audit deaths (1%: 97 patients) did not appear to have occurred in May 2015. These were from 52 unique sites. Two of these sites had been granted permission to collect data over a longer period, to gain a larger local sample, and these account for 31 of the 97 patients. The other instances were most likely data input errors regarding date of death. The project group decided to retain all cases in the analysis. Where comparisons with the 2013 audit data are made throughout this report, please be aware that these refer to the previous National care of the dying audit for hospitals,8 which was published in May 2014 but audited 2013 data.
© Healthcare Quality Improvement Partnership 2016 17
End of Life Care Audit – Dying in Hospital report for England
Section 1: Demographics Gender
The audit sample comprised 49% (4594) males and 51% (4708) females. Age
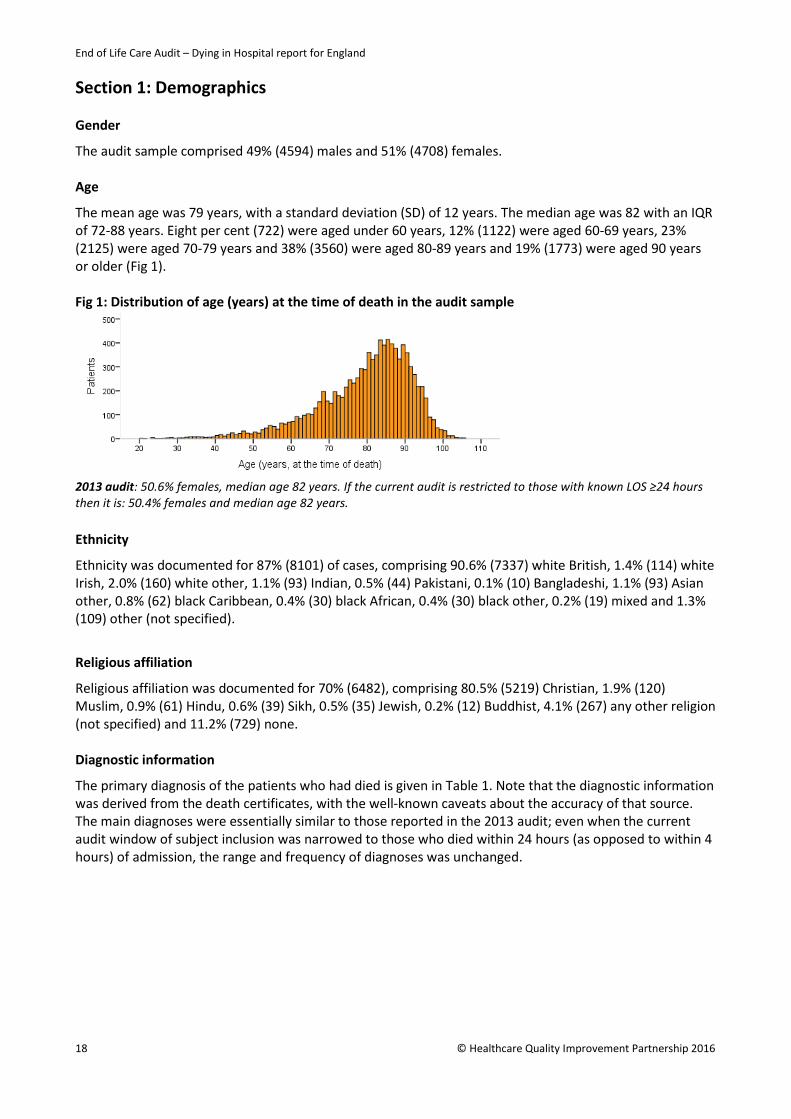
The mean age was 79 years, with a standard deviation (SD) of 12 years. The median age was 82 with an IQR of 72-88 years. Eight per cent (722) were aged under 60 years, 12% (1122) were aged 60-69 years, 23% (2125) were aged 70-79 years and 38% (3560) were aged 80-89 years and 19% (1773) were aged 90 years or older (Fig 1). Fig 1: Distribution of age (years) at the time of death in the audit sample
2013 audit: 50.6% females, median age 82 years. If the current audit is restricted to those with known LOS ≥24 hours then it is: 50.4% females and median age 82 years. Ethnicity
Ethnicity was documented for 87% (8101) of cases, comprising 90.6% (7337) white British, 1.4% (114) white Irish, 2.0% (160) white other, 1.1% (93) Indian, 0.5% (44) Pakistani, 0.1% (10) Bangladeshi, 1.1% (93) Asian other, 0.8% (62) black Caribbean, 0.4% (30) black African, 0.4% (30) black other, 0.2% (19) mixed and 1.3% (109) other (not specified).
Religious affiliation
Religious affiliation was documented for 70% (6482), comprising 80.5% (5219) Christian, 1.9% (120) Muslim, 0.9% (61) Hindu, 0.6% (39) Sikh, 0.5% (35) Jewish, 0.2% (12) Buddhist, 4.1% (267) any other religion (not specified) and 11.2% (729) none. Diagnostic information
The primary diagnosis of the patients who had died is given in Table 1. Note that the diagnostic information was derived from the death certificates, with the well-known caveats about the accuracy of that source. The main diagnoses were essentially similar to those reported in the 2013 audit; even when the current audit window of subject inclusion was narrowed to those who died within 24 hours (as opposed to within 4 hours) of admission, the range and frequency of diagnoses was unchanged.
18 © Healthcare Quality Improvement Partnership 2016

End of Life Care Audit – Dying in Hospital report for England
Table 1 National audit (n=9302) What is the primary diagnosis? This is to be taken from the death certificate. 1c, then 1b and if nothing in either record then 1a
Pneumonia 24% 2277 Cancer 20% 1843 Heart failure 10% 895 Stroke 6% 597 Chronic respiratory disease 6% 593 Neurological conditions (such as motor neurone disease) 2% 180 Other 31% 2917
2013 audit: pneumonia 23%, cancer 23%, heart failure 8%, stroke 8%, chronic respiratory disease 7% and other 32%. If the current audit is restricted to those with known LOS ≥24 hours, the results were: pneumonia 25%, cancer 20%, heart failure 10%, stroke 6%, chronic respiratory disease 6%, neurological condition 2% and others 30%.
Looking at the diagnoses by age groups, cancer was more frequently seen in those under the age of 70 years, while the incidence of stroke, pneumonia and heart failure were highest in those aged 90 years and older. The breakdown of cancers by primary area is given in Table 2.
Table 2 National audit (n=1843)
If primary diagnosis was cancer, please specify the primary area:
Lung 25% 461 Upper gastrointestinal 14% 266 Colorectal 11% 198 Urological system 7% 121 Breast 6% 119 Uterus/other gynaecological 6% 113 Prostate 6% 102 Brain 2% 31 Other 23% 432 2013 audit: lung 24%, colorectal 9%, upper gastrointestinal 9%, prostate 7% and other 51%. If the current audit is restricted to those with known LOS ≥24 hours, the results were: lung 25%, upper gastrointestinal 15%, colorectal 11%, urological system 7%, breast 6%, uterus/other gynaecological 6%, prostate 5%, brain 2% and other 23%.
Existing comorbidity
In this audit, we asked for the presence of documented comorbidities. This was reported in 82% of the sample overall, and 69% had two or more separate comorbid conditions (Table 3). As expected, comorbidities were more commonly documented in older patients: only 13% of those aged 90 years and over had no comorbid conditions, compared with 48% of those aged under 40 years. Conversely, 32% of patients aged over 90 years had three or more comorbid conditions, compared with 9% of those aged under 40 years. The majority of comorbid diagnoses were cardiovascular, respiratory or endocrine (Table 4).
© Healthcare Quality Improvement Partnership 2016 19

End of Life Care Audit – Dying in Hospital report for England
Table 3 National audit (n=9302) Did the patient have any existing comorbidities documented?
YES 82% 7605
If ‘yes’, how many existing comorbidities were documented? • ONE 31% 2386 • TWO 33% 2485 • THREE 20% 1512 • FOUR or more 16% 1222
Table 4
National audit (n=9302)
What comorbidities? This is what is on section 2 of the death certificate. • Cardiovascular 47% 4414 • Respiratory 22% 2055 • Endocrine 18% 1694 • Dementia 12% 1160 • Genitourinary 11% 1033 • Malignancy 10% 923 • Central nervous system 8% 773 • Musculoskeletal 8% 712 • Other 25% 2350
Characteristics of the deaths in hospital Deaths were reported with stable frequency from Mondays to Thursdays during the data collection period. There was a slight increase in deaths occurring on the Friday to Sunday period (Fig 2). Fig 2: Distribution of day of death in the audit sample
Each day is defined as 00:00 to 23:59 hours. In total, 24% (2237) of audit deaths occurred between working hours (defined as 09:00 to 17:00, Monday to Friday), 46% (4307) occurred out of hours (defined as 17:01 to 08:59 from Monday to Friday, and 17:01 Friday to 08:59 Saturday), and 30% (2758) occurred at the weekend (defined as Saturday 09:00 to Monday 08:59). This apparent excess of deaths ‘out of hours’ and at ‘weekends’, compared with during ‘working hours’, is true in terms of absolute numbers, but it gives an artificial picture because of the unequal number of hours in the three time periods. But when expressed as the hourly death rate in the three periods (focusing on patients whose LOS was ≥24 hours and excluding sudden and unexpected deaths), it was 40.9 deaths per
20 © Healthcare Quality Improvement Partnership 2016
End of Life Care Audit – Dying in Hospital report for England
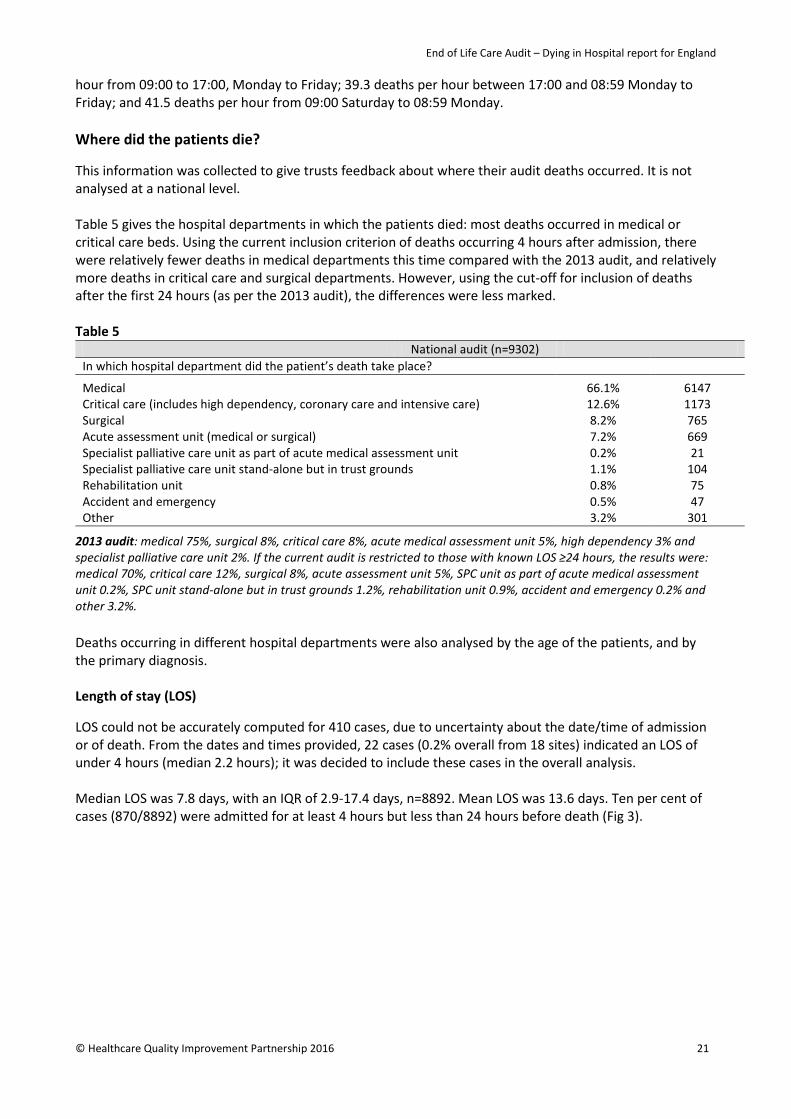
hour from 09:00 to 17:00, Monday to Friday; 39.3 deaths per hour between 17:00 and 08:59 Monday to Friday; and 41.5 deaths per hour from 09:00 Saturday to 08:59 Monday. Where did the patients die? This information was collected to give trusts feedback about where their audit deaths occurred. It is not analysed at a national level. Table 5 gives the hospital departments in which the patients died: most deaths occurred in medical or critical care beds. Using the current inclusion criterion of deaths occurring 4 hours after admission, there were relatively fewer deaths in medical departments this time compared with the 2013 audit, and relatively more deaths in critical care and surgical departments. However, using the cut-off for inclusion of deaths after the first 24 hours (as per the 2013 audit), the differences were less marked. Table 5
National audit (n=9302) In which hospital department did the patient’s death take place?
Medical 66.1% 6147 Critical care (includes high dependency, coronary care and intensive care) 12.6% 1173 Surgical 8.2% 765 Acute assessment unit (medical or surgical) 7.2% 669 Specialist palliative care unit as part of acute medical assessment unit 0.2% 21 Specialist palliative care unit stand-alone but in trust grounds 1.1% 104 Rehabilitation unit 0.8% 75 Accident and emergency 0.5% 47 Other 3.2% 301
2013 audit: medical 75%, surgical 8%, critical care 8%, acute medical assessment unit 5%, high dependency 3% and specialist palliative care unit 2%. If the current audit is restricted to those with known LOS ≥24 hours, the results were: medical 70%, critical care 12%, surgical 8%, acute assessment unit 5%, SPC unit as part of acute medical assessment unit 0.2%, SPC unit stand-alone but in trust grounds 1.2%, rehabilitation unit 0.9%, accident and emergency 0.2% and other 3.2%. Deaths occurring in different hospital departments were also analysed by the age of the patients, and by the primary diagnosis. Length of stay (LOS) LOS could not be accurately computed for 410 cases, due to uncertainty about the date/time of admission or of death. From the dates and times provided, 22 cases (0.2% overall from 18 sites) indicated an LOS of under 4 hours (median 2.2 hours); it was decided to include these cases in the overall analysis. Median LOS was 7.8 days, with an IQR of 2.9-17.4 days, n=8892. Mean LOS was 13.6 days. Ten per cent of cases (870/8892) were admitted for at least 4 hours but less than 24 hours before death (Fig 3).
© Healthcare Quality Improvement Partnership 2016 21

End of Life Care Audit – Dying in Hospital report for England
Fig 3: Distribution of LOS in days
The graphic was truncated at 100 days for reasons of presentation, with 0.7% of stays being more than 100 days 2013 audit: median LOS was 9 days, with an IQR of 4-19 days. Note that only those with LOS ≥24 hours were included. If the current audit is restricted to those with known LOS ≥24 hours then the median was also 9 days, with an IQR of 4-19 days. It was clear from the notes of 17% (1595/9302) of patients that they died suddenly and unexpectedly. Median LOS was 4.4 days, with an IQR of 1.4-12.1 days (n=1523) if death was sudden and unexpected, otherwise the median was 8.6 days, with an IQR of 3.3-18.4 days (n=7369).
22 © Healthcare Quality Improvement Partnership 2016

End of Life Care Audit – Dying in Hospital report for England
Section 2: Priority of care – recognition of dying
‘The possibility that a person may die within the next few days or hours is recognised and communicated clearly, decisions made and actions taken in accordance with the person’s needs and wishes, and these are regularly reviewed and decisions revised accordingly.’7 Key findings • In total, 93% of patients whose death was predictable had documentation that they would probably
die. • In 76% of cases, a senior doctor was involved in the recognition of dying. • For half the patients, recognition of dying occurred within 5 days after admission, and for half the
patients this occurred less than 34 hours before death. • The recognition that the patient was thought to be dying was reviewed regularly in 91% of patients;
however it should be noted that the inter-auditor reliability score for this particular question was poor. Recommendation • The recognition of the possibility that a patient may die should be communicated to the patient, people
important to the patient, and staff, and documented in the case notes as early as possible. The recognition of dying should be reviewed by a senior doctor or nurse.
Question 1.1 In 83% (7675/9302) of patients there was documented evidence within the last episode of care that it was recognised that the patient would probably die in the coming hours or days. If sudden/unexpected deaths are excluded then this result (%1.1=yes) is revised to 93% (7199/7707) of patients. 2013 audit: ‘Is there documented evidence within the last episode of care of a decision within the Multi-disciplinary Team (a minimum of a senior doctor and a trained nurse) that the patient was expected to die in the coming hours or days?’ Result: 87% with recognition documented of decision taken either by an MDT or by at least one health professional, 13% with no recognition documented. If the current audit is restricted to those with known LOS ≥24 hours then the result for audit question 1.1 was 83% (6658/7997). Table 6
National audit (n=7675) 1.2. If the answer is ‘Yes’ to question 1.1: who took part in the discussion about this recognition?
Senior doctor (such as a consultant or GP) 76% 5811 Other doctors 71% 5437 Those important to the patient (family, close friends, carers and others important to the patient) 64% 4930
Staff nurse 32% 2494 Member of the specialist palliative care team 18% 1344 Patient 13% 978 Ward sister 11% 854 Clinical nurse specialist 8% 628 Physiotherapist 3% 226 Healthcare assistant 2% 184 Dietician 2% 153 Speech and language therapist 2% 130 Occupational therapist 1% 87 Chaplain 0.9% 72 Social worker 0.6% 47 Pharmacist 0.5% 38 Other 2% 191
© Healthcare Quality Improvement Partnership 2016 23

End of Life Care Audit – Dying in Hospital report for England
Table 7
National audit (n=7675) 1.3. What was the date and time of the first documented evidence of the recognition that the patient would probably die in the coming hours or days?
Median (IQR) HOURS between recognition and death 34 (11-89), n=7007* Median (IQR) HOURS between admission and recognition 118 (25-332), n=6834**
*668 patients were excluded because of uncertainty about the date/time of recognition or of death. **841 patients were excluded because of uncertainty about the date/time of recognition or of admission. 2013 audit: the median number of hours between the first documented evidence of the recognition that the patient was expected to die and the actual death was 36 hours, with an IQR of 12-89 hours. If the current audit is restricted to those with known LOS ≥24 hours then the median was 41 hours, with an IQR of 15-97 hours, n=6157. Fig 4: Hours from first recognition of dying to death
The graphic was truncated at 15 days (360 hours) for reasons of presentation, with first recognition of dying to death being longer than this in 2.8% of cases. Table 8
National audit (n=7675) 1.4. Is there documented evidence that the recognition (1.3) that the patient who was dying was regularly reviewed?
YES 91%* 6953
If ‘yes’ to 1.4, did this review include: • The recognition that the patient was dying 98% 6784 • That the patient was recovering 7% 499
*A kappa coefficient of agreement value of 0.42 indicates poor inter-auditor reliability for this question.
24 © Healthcare Quality Improvement Partnership 2016
End of Life Care Audit – Dying in Hospital report for England
Summary
In 83% of audited deaths, there was documented evidence within the last episode of care that it was recognised that the patient would probably die in the coming hours or days. While there is some variation between trusts, this falls within the limits of what would be regarded as random variation. When the patients for whom death was clearly sudden and unexpected were excluded, 93% of patients had documentation that they would probably die. In 76% of cases, a senior doctor was involved in recognition (Table 6) and in 64% those important to the dying person were involved in the discussion about recognition of dying. In 71% of cases, other doctors were involved and in 42% of cases, nursing staff (staff nurse and/or ward sister) took part. For half the patients, recognition occurred less than 34 hours before death (Table 7), and for a quarter of cases it was less than 11 hours before death. However some of this is explained by the inclusion of patients who died between 4 and 24 hours after admission, as when these patients are removed the median time increases to 41 hours. The recognition that the patient was thought to be dying was reviewed regularly in 91% of patients (Table 8). In 7% of patients, it was recognised that, after initial suspicion the patient was likely to be dying, there were some signs that the patient might be recovering. However, all these patients subsequently died. In patients who died in hospital there were consistently high levels of documented evidence within the last episode of care that it was recognised that the patient would probably die in the coming hours or days. For the majority of these decisions, senior doctors were involved in the decision-making process and there were significant levels of involvement of those important to the patient. Nurses of all levels are less often recorded as being involved. There is evidence that these decisions are almost always being reviewed regularly. However it appears that for a significant proportion of patients these decisions are being made close to death, perhaps not early enough for the person to be fully involved in decision making about their care. The fact that there were signs of recovery in a significant minority of those who subsequently died underlines how difficult these decisions are and why we need to communicate the possibilities about dying and recovery even when we cannot be certain. One of the priorities of care for the dying person in the One chance to get it right7 recommendations is that: ‘The possibility that a person may die within the next few days or hours is recognised and communicated clearly, decisions made and actions taken in accordance with the person’s needs and wishes, and these are regularly reviewed and decisions revised accordingly.’ The requirement for senior and regular review and multiprofessional involvement is also recommended. These results suggest that this recommendation is largely being followed, but in many cases there is little evidence of multiprofessional involvement. It is encouraging to make these observations in the light of the new NICE guidance (NG31),9 which stresses the importance of recognising the uncertainties about the possibility of dying or of recovering, and of communicating these honestly and effectively with patients and those important to them. While there is widespread evidence of good practice, areas for improvement could include: ensuring senior review is undertaken where possible; involving nurses and other professionals more frequently in these decisions and documenting their involvement; and, where possible, ensuring that recognition of the possibility that a patient may die is documented and communicated earlier in the hospital stay.
© Healthcare Quality Improvement Partnership 2016 25

End of Life Care Audit – Dying in Hospital report for England
Section 3: Priority of care – communication
‘Sensitive communication takes place between staff and the dying person, and those identified as important to them.’7 Key findings • In total, only 25% of people who were recognised as being likely to die had documented evidence of a
discussion with a healthcare professional about their likely imminent death. Overall, where there was not a documented discussion, there was no reason recorded in 17% of cases.
• In 95% of the cases where it had been recognised that the patient was likely to die, there was a documented discussion with those nominated as important to the dying person. Where there was not a documented discussion with a nominated person, there was no record of why in 49% of cases.
Recommendation • When the possibility of dying is not discussed with the patient or the nominated person important to
them, the reasons for this should always be documented in the case notes. Table 9
National audit (n=9302) 2.1. Is there documented evidence within the last episode of care that health professional recognition that the patient would probably die in the coming hours or days (imminent death) had been discussed with the patient?
YES 20%* 1898
If ‘no’ to 2.1 (n=7404), were any of the following reasons documented as to why discussion did not take place?
• The patient was semi-conscious or unconscious 44% 3226 • The patient had cognitive impairment and did not
have the capacity to understand 21% 1569
• The notes indicate that the patient died suddenly and unexpectedly
13% 935
• The patient’s mental state could be ‘harmed’ by the knowledge that they were dying
0.8% 60
• There is evidence to confirm the patient’s request not to receive bad news
0.7% 55
• No reasons recorded 17% 1256 • Other 4% 303
*If sudden/unexpected deaths are excluded then this result (%2.1=yes) is revised to 23% (1788/7707). If the analysis is further restricted to where there was recognition (1.1=yes) then this result (%2.1=yes) is 25% (1772/7199). In 16% (866/5477) of those recognised as likely to die, and where there was not a documented discussion with a nominated person, there was no record of why. 2013 audit: ‘Is there documented evidence within the last episode of care that Health Professional recognition that the patient was expected to die in the coming hours or days had been discussed with the patient?’. The result was 19% of those with recognition. If the current audit is restricted to those with known LOS ≥24 hours and recognition of dying (1.1=yes), the result for 2.1 was 25% (1672/6658).
26 © Healthcare Quality Improvement Partnership 2016
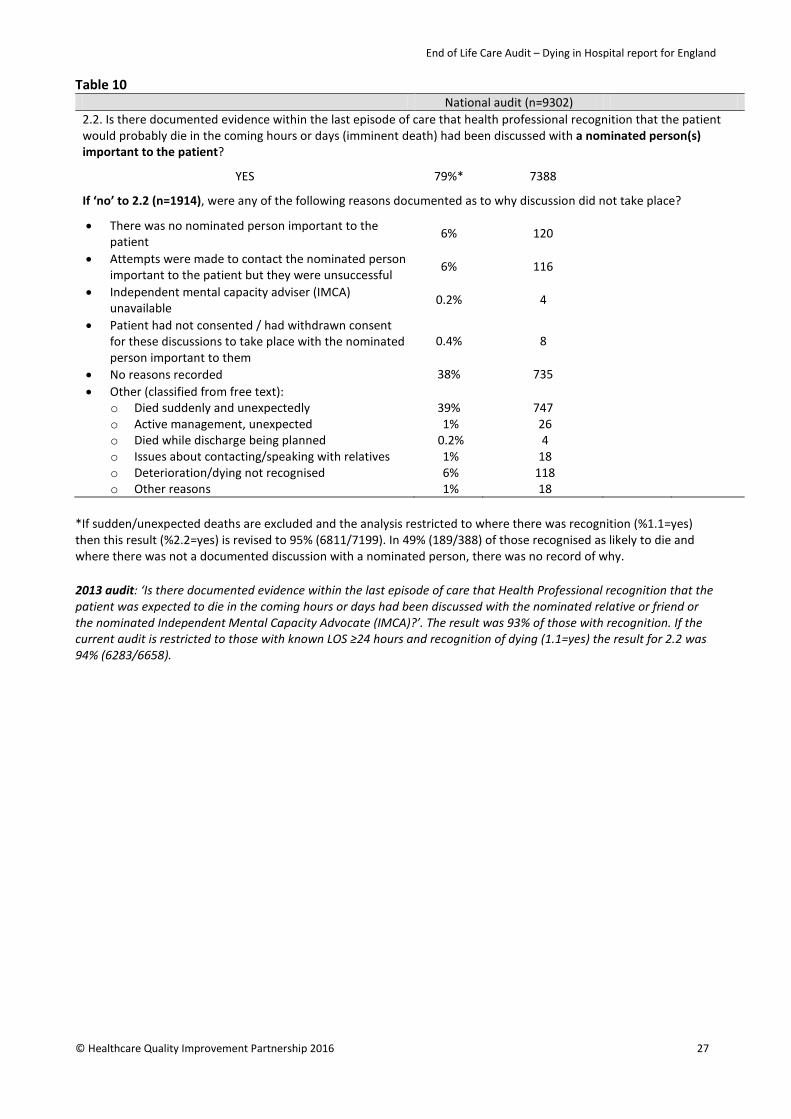
End of Life Care Audit – Dying in Hospital report for England
Table 10 National audit (n=9302) 2.2. Is there documented evidence within the last episode of care that health professional recognition that the patient would probably die in the coming hours or days (imminent death) had been discussed with a nominated person(s) important to the patient?
YES 79%* 7388
If ‘no’ to 2.2 (n=1914), were any of the following reasons documented as to why discussion did not take place?
• There was no nominated person important to the patient
6% 120
• Attempts were made to contact the nominated person important to the patient but they were unsuccessful
6% 116
• Independent mental capacity adviser (IMCA) unavailable
0.2% 4
• Patient had not consented / had withdrawn consent for these discussions to take place with the nominated person important to them
0.4% 8
• No reasons recorded 38% 735 • Other (classified from free text):
o Died suddenly and unexpectedly 39% 747 o Active management, unexpected 1% 26 o Died while discharge being planned 0.2% 4 o Issues about contacting/speaking with relatives 1% 18 o Deterioration/dying not recognised 6% 118 o Other reasons 1% 18
*If sudden/unexpected deaths are excluded and the analysis restricted to where there was recognition (%1.1=yes) then this result (%2.2=yes) is revised to 95% (6811/7199). In 49% (189/388) of those recognised as likely to die and where there was not a documented discussion with a nominated person, there was no record of why. 2013 audit: ‘Is there documented evidence within the last episode of care that Health Professional recognition that the patient was expected to die in the coming hours or days had been discussed with the nominated relative or friend or the nominated Independent Mental Capacity Advocate (IMCA)?’. The result was 93% of those with recognition. If the current audit is restricted to those with known LOS ≥24 hours and recognition of dying (1.1=yes) the result for 2.2 was 94% (6283/6658).
© Healthcare Quality Improvement Partnership 2016 27

End of Life Care Audit – Dying in Hospital report for England
Summary
One in five patients who died had documented evidence of a discussion with a healthcare professional that they were dying (Table 9). In those for whom dying was recognised, this increased to one in every four patients. For the majority where there was not documented evidence of a discussion about dying, this was because the patients were unable to communicate or did not have the capacity to understand at the time they were recognised to be dying. However, for almost one in five (17%) there was no reason recorded for not communicating with the patient. On the other hand, when dying was recognised, a discussion was recorded in almost all cases (95%) with a nominated person important to the patient (Table 10). Where there was no discussion documented, it was most frequently recorded that this was because there was no nominated person (21%, 83) or that attempts to contact the nominated person were unsuccessful (19%, 73). However in almost half of the cases (49%, 189) where discussion was not held, there was no reason recorded. Discussion with the patients about their imminent death appears to be infrequent, but this mostly stems from recognition of dying occurring so late that the patient is unable to have such discussions in the majority of cases. However, allowing for differences in the sample, such discussion appears to be increasing in frequency compared with the last audit. Discussion with a nominated person important to the patient is reassuringly commonplace, in line with findings in the last audit. However, in cases where communication has not occurred, documentation of the reason for non-communication is far from universal so we cannot be completely assured that every opportunity to communicate is being sought and taken. In the One chance to get it right7 recommendations, ‘Sensitive communication takes place between staff and the dying person, and those identified as important to them’ is the second priority of care for the dying person. The importance of communication is also stressed by NICE in its 2012 guidance CG138 Patient experience in adult NHS services: improving the experience of care for people using adult NHS services,14 as well as in the new 2015 guidance NG31 on care of the dying adult.9 This audit cannot assess the quality of the communication, but it is evident that communication is frequently occurring about the fact that the person is recognised as dying with those important to them, but less commonly with the dying person themselves. Earlier recognition that the person is dying is necessary to allow more opportunity to discuss this with the dying person and enable their involvement in decisions about their care. Documentation needs to be improved to ensure there are always reasons recorded about why discussions are not held with the patient or their nominated representatives.
28 © Healthcare Quality Improvement Partnership 2016
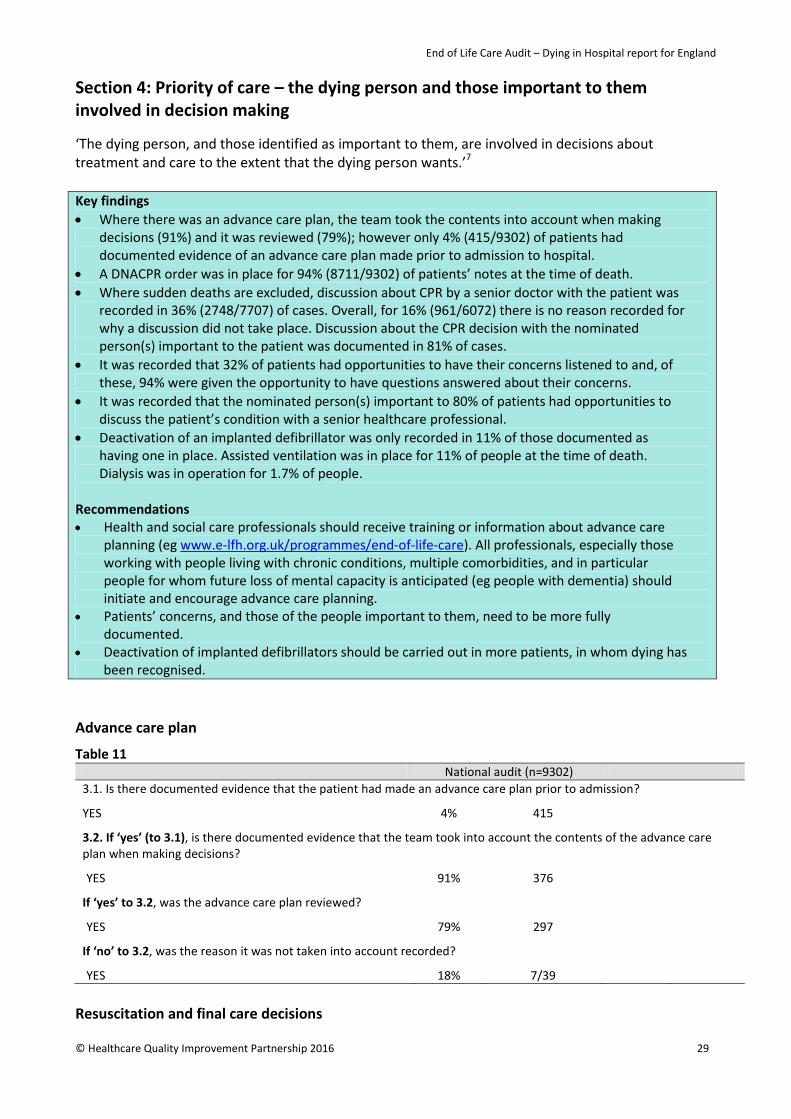
End of Life Care Audit – Dying in Hospital report for England
Section 4: Priority of care – the dying person and those important to them involved in decision making
‘The dying person, and those identified as important to them, are involved in decisions about treatment and care to the extent that the dying person wants.’7 Key findings • Where there was an advance care plan, the team took the contents into account when making
decisions (91%) and it was reviewed (79%); however only 4% (415/9302) of patients had documented evidence of an advance care plan made prior to admission to hospital.
• A DNACPR order was in place for 94% (8711/9302) of patients’ notes at the time of death. • Where sudden deaths are excluded, discussion about CPR by a senior doctor with the patient was
recorded in 36% (2748/7707) of cases. Overall, for 16% (961/6072) there is no reason recorded for why a discussion did not take place. Discussion about the CPR decision with the nominated person(s) important to the patient was documented in 81% of cases.
• It was recorded that 32% of patients had opportunities to have their concerns listened to and, of these, 94% were given the opportunity to have questions answered about their concerns.
• It was recorded that the nominated person(s) important to 80% of patients had opportunities to discuss the patient’s condition with a senior healthcare professional.
• Deactivation of an implanted defibrillator was only recorded in 11% of those documented as having one in place. Assisted ventilation was in place for 11% of people at the time of death. Dialysis was in operation for 1.7% of people.
Recommendations • Health and social care professionals should receive training or information about advance care
planning (eg www.e-lfh.org.uk/programmes/end-of-life-care). All professionals, especially those working with people living with chronic conditions, multiple comorbidities, and in particular people for whom future loss of mental capacity is anticipated (eg people with dementia) should initiate and encourage advance care planning.
• Patients’ concerns, and those of the people important to them, need to be more fully documented.
• Deactivation of implanted defibrillators should be carried out in more patients, in whom dying has been recognised.
Advance care plan
Table 11 National audit (n=9302) 3.1. Is there documented evidence that the patient had made an advance care plan prior to admission?
YES 4% 415
3.2. If ‘yes’ (to 3.1), is there documented evidence that the team took into account the contents of the advance care plan when making decisions?
YES 91% 376
If ‘yes’ to 3.2, was the advance care plan reviewed?
YES 79% 297
If ‘no’ to 3.2, was the reason it was not taken into account recorded?
YES 18% 7/39 Resuscitation and final care decisions
© Healthcare Quality Improvement Partnership 2016 29

End of Life Care Audit – Dying in Hospital report for England
Table 12
National audit (n=9302) 3.3. Is there documented evidence that a discussion regarding cardiopulmonary resuscitation (CPR) was undertaken by a senior doctor with the patient that was relevant to the last episode of care?
YES 35%* 3230
If ‘no’ (n=6072), were any of the following reasons documented as to why discussion did not take place?
• The patient was semi-conscious or unconscious 38% 2312 • The patient displayed a longstanding lack of mental
capacity (eg dementia) for the issue of CPR 19% 1184
• The patient displayed an acute lack of mental capacity (eg delirium) for the issue of CPR
15% 906
• The patient had asked not to be involved in this discussion
1% 71
• No reason recorded 16% 961 • Other 10% 638
*If sudden/unexpected deaths are excluded then this result (%3.3=yes) is revised to 36% (2748/7707). In 14% (710/4959) of those recognised as likely to die and where there was not a documented discussion with the patient regarding CPR, there was no record of why. 2013 audit: ‘Is there documented evidence that a discussion regarding the CPR decision was undertaken with the patient during the last episode of care?’ The result for the overall sample was 21%. If the current audit is restricted to those with known LOS ≥24 hours, the result for 3.3 was 36% (2887/7997). Table 13: ‘Other’ reasons documented as to why a discussion regarding CPR in 3.3 did not take place
3.3 OTHER reasons documented as to why discussion did not take place Total
Death unexpected/rapid deterioration 145 Too unwell 103 Community or existing DNR or discussions had taken place 100 Active treatment/for CPR 78 Other 69 Discussion would distress 39 Language/communication barrier 34 No CPR decision made 33 Discussion with family 14 Lacked capacity 8 Discussed with junior doctor or specialist registrar (SpR) or unrecorded grade 8 Discussion refused 3 Treatment discussions only 2 Discussed with power of attorney/LPA 2 Total 638
Fig 5: Site variation in 3.3
Per cent with documented evidence that a discussion regarding CPR was undertaken by a senior doctor with the patient that was relevant to the last episode of care (the red line shows the national 36% when analysis excludes sudden and unexpected deaths)
30 © Healthcare Quality Improvement Partnership 2016
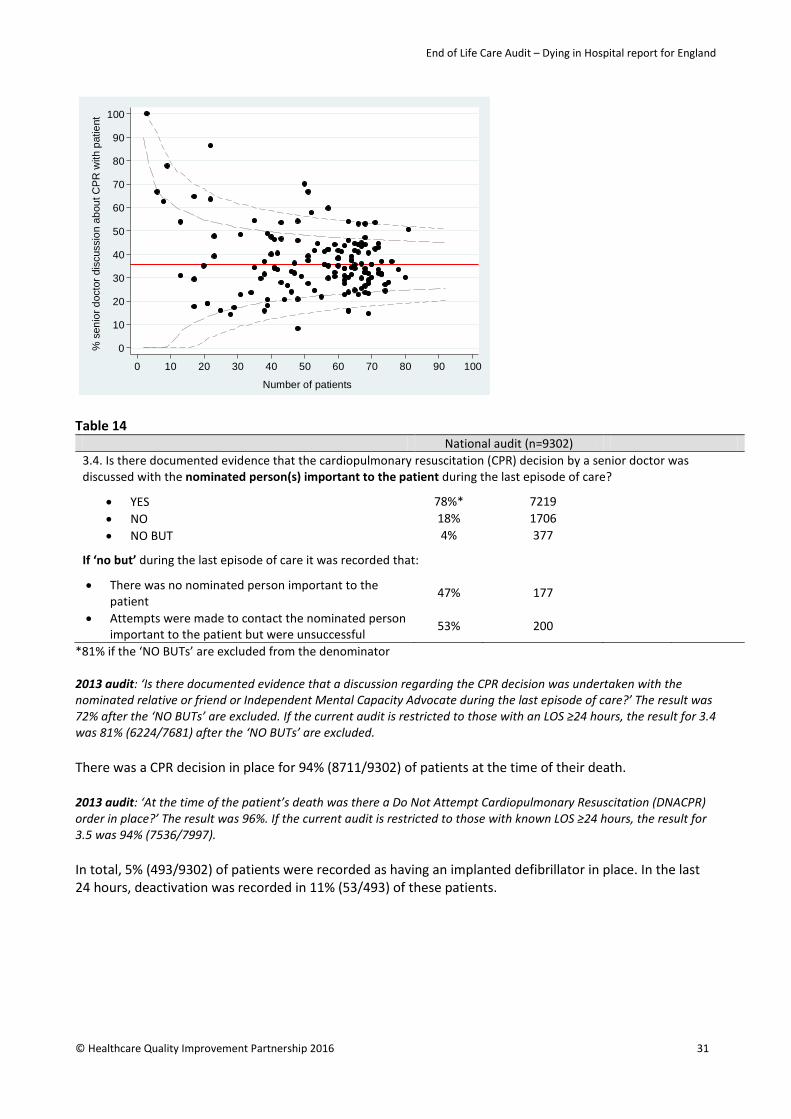
End of Life Care Audit – Dying in Hospital report for England
Table 14
National audit (n=9302) 3.4. Is there documented evidence that the cardiopulmonary resuscitation (CPR) decision by a senior doctor was discussed with the nominated person(s) important to the patient during the last episode of care?
• YES 78%* 7219 • NO 18% 1706 • NO BUT 4% 377
If ‘no but’ during the last episode of care it was recorded that:
• There was no nominated person important to the patient
47% 177
• Attempts were made to contact the nominated person important to the patient but were unsuccessful
53% 200
*81% if the ‘NO BUTs’ are excluded from the denominator 2013 audit: ‘Is there documented evidence that a discussion regarding the CPR decision was undertaken with the nominated relative or friend or Independent Mental Capacity Advocate during the last episode of care?’ The result was 72% after the ‘NO BUTs’ are excluded. If the current audit is restricted to those with an LOS ≥24 hours, the result for 3.4 was 81% (6224/7681) after the ‘NO BUTs’ are excluded. There was a CPR decision in place for 94% (8711/9302) of patients at the time of their death. 2013 audit: ‘At the time of the patient’s death was there a Do Not Attempt Cardiopulmonary Resuscitation (DNACPR) order in place?’ The result was 96%. If the current audit is restricted to those with known LOS ≥24 hours, the result for 3.5 was 94% (7536/7997). In total, 5% (493/9302) of patients were recorded as having an implanted defibrillator in place. In the last 24 hours, deactivation was recorded in 11% (53/493) of these patients.
0
10
20
30
40
50
60
70
80
90
100
% s
enio
r doc
tor d
iscu
ssio
n ab
out C
PR
with
pat
ient
0 10 20 30 40 50 60 70 80 90 100
Number of patients
© Healthcare Quality Improvement Partnership 2016 31

End of Life Care Audit – Dying in Hospital report for England
Assisted ventilation A small proportion of patients (11%) were having assisted ventilation around the time of death (Table 15). Only in a minority of cases (23%) was there a documented discussion with the patient about continuing or stopping ventilation. Table 15
National audit (n=9302) 3.7a. In the last 24 hours, was the patient having assisted ventilation?
YES 11% 1009
3.7ai. If ‘yes’ to 3.7a (n=1009) is there documented evidence within the last episode of care of a discussion undertaken by a senior doctor regarding whether to continue or stop assisted ventilation with the patient?
YES 23% 228/1009
If ‘No’ to 3.7ai (n=781), were any of the following reasons documented as to why discussion did not take place?
• The patient was semi-conscious or unconscious 78% 612 • The patient displayed an acute lack of mental capacity
(eg delirium) for this issue 4% 31
• The patient displayed a longstanding lack of mental capacity (eg dementia) for this issue
3% 20
• The patient had asked not to be involved in this discussion
0.5% 4
• No reason recorded 9% 68 • Other 6% 46
3.7aii. If ‘yes’ to 3.7a (n=1009), is there documented evidence that the continuation or withdrawal of assisted ventilation was discussed by a senior doctor with the nominated person(s) important to the patient during the last episode of care?
• YES 78% 783 • NO 19% 190 • NO BUT 4% 36
If ‘No but’ to 3.7aii (n=36), during the last episode of care it was recorded that:
• There was no nominated person important to the patient
47% 17
• Attempts were made to contact the nominated relative or friend but were unsuccessful
53% 19
32 © Healthcare Quality Improvement Partnership 2016
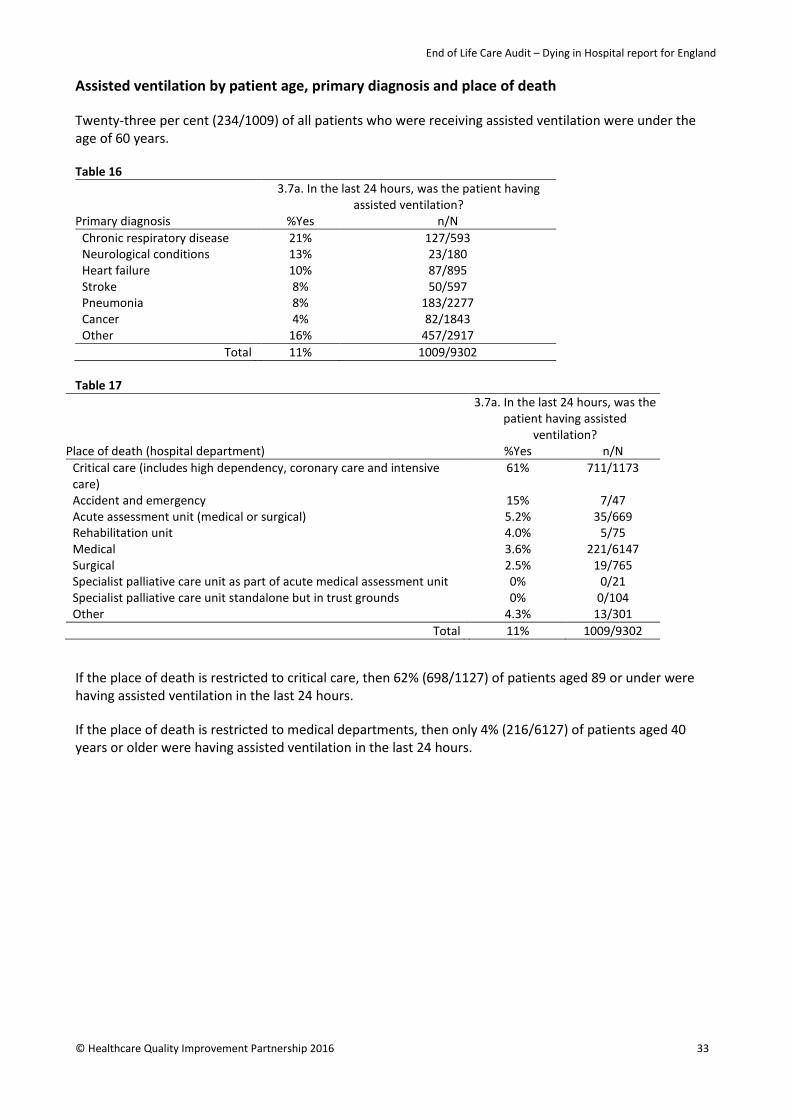
End of Life Care Audit – Dying in Hospital report for England
Assisted ventilation by patient age, primary diagnosis and place of death Twenty-three per cent (234/1009) of all patients who were receiving assisted ventilation were under the age of 60 years. Table 16
Primary diagnosis
3.7a. In the last 24 hours, was the patient having assisted ventilation?
%Yes n/N Chronic respiratory disease 21% 127/593
Neurological conditions 13% 23/180 Heart failure 10% 87/895 Stroke 8% 50/597 Pneumonia 8% 183/2277 Cancer 4% 82/1843 Other 16% 457/2917
Total 11% 1009/9302 Table 17
Place of death (hospital department)
3.7a. In the last 24 hours, was the patient having assisted
ventilation? %Yes n/N
Critical care (includes high dependency, coronary care and intensive care)
61% 711/1173
Accident and emergency 15% 7/47 Acute assessment unit (medical or surgical) 5.2% 35/669 Rehabilitation unit 4.0% 5/75 Medical 3.6% 221/6147
Surgical 2.5% 19/765 Specialist palliative care unit as part of acute medical assessment unit 0% 0/21 Specialist palliative care unit standalone but in trust grounds 0% 0/104 Other 4.3% 13/301
Total 11% 1009/9302 If the place of death is restricted to critical care, then 62% (698/1127) of patients aged 89 or under were having assisted ventilation in the last 24 hours.
If the place of death is restricted to medical departments, then only 4% (216/6127) of patients aged 40 years or older were having assisted ventilation in the last 24 hours.
© Healthcare Quality Improvement Partnership 2016 33

End of Life Care Audit – Dying in Hospital report for England
Dialysis Table 18 National audit (n=9302) 3.7b. In the last 24 hours, was the patient having dialysis?
YES 1.7% 162
3.7bi. If ‘yes’ to 3.7b (n=162), is there documented evidence within the last episode of care of a discussion undertaken by a senior doctor regarding whether to continue or stop dialysis with the patient?
YES 14% 22/162
If ‘No’ to 3.7bi, (n=140), were any of the following reasons documented as to why discussion did not take place?
• The patient was semi-conscious or unconscious 71% 100 • The patient displayed an acute lack of mental capacity (eg
delirium) for this issue 5% 7
• The patient displayed a longstanding lack of mental capacity (eg dementia) for this issue
3% 4
• The patient had asked not to be involved in this discussion - 0
• No reason recorded 9% 13 • Other 11% 16
3.7bii. If ‘yes’ to 3.7b (n=162), is there documented evidence that the continuation or withdrawal of dialysis was discussed by a senior doctor with the nominated person(s) important to the patient during the last episode of care?
• YES 65% 105 • NO 33% 54 • NO BUT 2% 3
If ‘No but’ to 3.7a.ii (n=3), during the last episode of care it was recorded that:
• There was no nominated person important to the patient 1 • Attempts were made to contact the nominated relative or
friend but were unsuccessful 2
34 © Healthcare Quality Improvement Partnership 2016

End of Life Care Audit – Dying in Hospital report for England
Patient concerns listened to and their questions answered Table 19
National audit (n=9302) 3.8a. Is there documented evidence that the patient was given an opportunity to have concerns listened to?
• YES 32% 2936 • NO 16% 1475 • NO BUT 52% 4891
If ‘NO BUT’ (n=4891):
• The patient displayed a longstanding lack of mental capacity (eg dementia) to raise concerns
25% 1222
• The patient displayed an acute lack of mental capacity (eg delirium) for this issue
19% 941
• The patient was semi-conscious or unconscious 56% 2728 If ‘YES’ to 3.8a (n=2936), is there documented evidence that the patient was given an opportunity to have questions answered about concerns?
• YES 94% 2769 • NO 3% 96 • NO BUT 2% 71
If ‘NO BUT’ (n=71):
• The patient displayed a longstanding lack of mental capacity (eg dementia) to raise concerns
18% 13
• The patient displayed an acute lack of mental capacity (eg delirium) for this issue
44% 31
• The patient was semi-conscious or unconscious 38% 27 Opportunities for the person(s) important to the patient to have discussions with a senior healthcare professional Table 20
National audit (n=9302) 3.9. Is there documented evidence that the nominated person(s) important to the patient during the last episode of care was given regular opportunities to discuss the patient’s condition with a senior healthcare professional?
• YES 80% 7459 • NO 16% 1475 • NO BUT 4% 368
If ‘NO BUT’ (n=368):
• There was no nominated person important to the patient
45% 167
• Attempts were made to contact the nominated relative or friend but were unsuccessful
49% 181
• Discussion was declined by nominated person(s) important to the patient
5% 20
If ‘yes’ to 3.9, how often were there recorded discussions with the nominated person(s) important to the patient and a senior healthcare professional during the last 24 hours of care?
Median (IQR) 2 (1-3)
© Healthcare Quality Improvement Partnership 2016 35
End of Life Care Audit – Dying in Hospital report for England
Summary
There has been emphasis (One chance to get it right7 and Ambitions for palliative and end of life care11) on the need for people to have the opportunity to make advance care plans so that their wishes for care at the end of life can be followed, especially when they are too ill to partake in these discussions. In this audit, only 4% (415/9302) of patients had documented evidence of an advance care plan made prior to hospital admission. However, where there was an advance care plan, the contents were taken into account when making decisions in 91% of cases and it was reviewed in 79% of cases. The median age of the sample was 82 years, with 82% (7605/9302) documented as having one or more existing comorbidities that could have precipitated advance care planning. Discussing what the patient wants done if their heart stops is an essential but often difficult discussion to have. At the time of death, 94% of patients had a DNACPR decision in place. Documented evidence that a discussion regarding CPR was undertaken by a senior doctor with the patient was recorded for 35% (3230/9302) of people. When sudden and unexpected deaths are removed, this equates to 36% (2748/7707). The reasons documented for the lack of discussion are appropriate, but for 16% (961/6072) there was no reason recorded. In the 2013 audit, a discussion about CPR was carried out with 21% of the overall sample and 41% of the patients who were capable of participating in such discussions. Following a complaint by the family of a patient who had died in an English hospital with a DNACPR order placed on her without her or the family’s knowledge, in 2014 the Court of Appeal ruled that the hospital trust had violated her right to respect for private life, in failing to involve her in the process that led to making a do not attempt resuscitation (DNAR) decision (based on Article 8 of the European Convention on Human Rights). This ‘Tracey ruling’ has had profound implications for all the settings where people are likely to die and CPR is being ruled out. Dying without dignity15 (2015) emphasised the need to improve communication by reporting that ‘It is clear that healthcare professionals do not always have the open and honest conversations with family members and carers that are necessary for them to understand the severity of the situation, and the subsequent choices they will have to make’. In the current audit, the senior doctor CPR decision was documented as having been discussed with the nominated person(s) important to the patient in 81% (6224/7681) of cases with LOS ≥24 hours. This represents an increase from 72% in the 2013 audit. Despite 80% (113/142) of sites stating that they had a deactivation of implantable defibrillator policy, only 11% (53/493) of patients who had a defibrillator had it recorded that it was deactivated in the last 24 hours of life. Assisted ventilation was in place for 11% (1009/9302) of people. This was mainly in critical care areas, and most people were aged 69 years and under. Discussion about treatment decisions with the patient was documented in 23% (228/1009) of cases, and with people important to the patient in 78% (783/1009). The main reason recorded when no such discussion had taken place with the patient was that they were semi-conscious or unconscious (78%). Dialysis was in place for 1.7% (162/9302) of people. Discussion about treatment decisions had taken place with the patient in 14% (22/162) of these cases, and with people important to the patient in 65% (105/162) of cases. The main reason recorded when no such discussion had taken place with the patient was that they were semi-conscious or unconscious (71%). For 32% (2936/9302) of patients there was evidence that they were given the opportunity to have their concerns listened to, but for 16% (1475/9302) of patients there was no record of such opportunity. In 94% (2769/2936), the opportunity for patients to have questions answered about their concerns was recorded. In 80% (7459/9302) of patients, it is documented that the nominated person(s) important to the patient had regular opportunities to discuss the patient’s condition. There was a median (IQR) of 2 (1-3) of these discussions taking place in the last 24 hours of life.
36 © Healthcare Quality Improvement Partnership 2016

End of Life Care Audit – Dying in Hospital report for England
Section 5: Priority of care – needs of families and others
‘The needs of families and others identified as important to the dying person are actively explored, respected and met as far as possible.’7 Key findings • In 38% of cases there was documented evidence in the last episode of care that the patient’s needs
had been discussed with the people important to them. • In total, 54% of case records showed that the needs of persons important to the patient were asked
about. Of these, 62% had needs identified. • Excluding the cases of sudden or unexpected deaths, in 84% of cases the people important to the
dying patient were notified of the imminent death. Of those notified, 63% were recorded as being present at the time of death.
• There was documented evidence of care and support of the patient’s family at the time of and immediately after death in 65% of cases, with wide variance between different sites (Fig 6).
Recommendations • Documentation of the needs of the dying patient and those important to them should be improved. • Evidence of who was present at the time of death should be clearly documented.
Table 21 National audit (n=9302) 4.1. Is there documented evidence that the needs of the person(s) important to the patient were asked about?
• YES 54% 5031 • NO 44% 4049 • NO BUT 2% 222
4.1i. If ‘Yes’ to 4.1, were any needs identified?
YES 62% 3128/5031
If ‘Yes’ to 4.1i (n=3128), what was the outcome of identifying these needs?
• Attempts were made to address these needs, without success
6% 182
• Needs were partially met 18% 550 • Needs were addressed successfully 73% 2274 • No record 4% 122
Table 22
National audit (n=3128*) 4.2. Of which of the following needs of the person(s) important to the patient is there documented evidence within the last episode of care that they were assessed?
Psychological 71% 2223 Spiritual/religious 40% 1248 Cultural 28% 873 Practical 88% 2745
*Note that in the web tool the denominator for 4.2 was restricted to those having documented evidence that the needs of the person(s) important to the patient were asked about (ie 4.1=Yes) and if any needs were identified (ie 4.1i=Yes).
© Healthcare Quality Improvement Partnership 2016 37

End of Life Care Audit – Dying in Hospital report for England
Table 23 National audit 4.3. (dependent on 4.2) Of which of the following needs of the person(s) important to the patient is there documented evidence within the last episode of care that they were addressed?
Psychological 97% 2149/2223 Spiritual/religious 92% 1150/1248 Cultural 92% 800/873 Practical 95% 2615/2745
Table 24
National audit (n=9203) 4.4. Is there documented evidence within the last episode of care of discussion regarding the patient’s spiritual/religious/cultural/practical needs with the nominated person(s) important to the patient?
• YES 38% 3519 • NO 56% 5236 • NO BUT it is recorded that the attempts made to
contact the nominated person(s) important to the patient were unsuccessful
2% 167
• NO BUT there was no nominated person(s) important to the patient
2% 169
• Missing data 2% 211 Communication at the time of dying with those important to the dying person (excluding sudden or unexpected deaths) Table 25
National audit (n=9302) 4.5. Were those important to the patient notified of the patient’s imminent death?
• YES* 77% 7139 • NO 13% 1239 • NO BUT there was no person(s) important to the
patient 2% 166
• NO BUT the notes indicate the patient died suddenly and unexpectedly
8 758
4.5i. If ‘Yes’ to 4.5 (n=7139), were those important to the patient present at the time of the patient’s death?
• YES 63% 4520 • NO 32% 2277 • NO BUT requested not to be present 5% 342
4.5ii. (n=8063**) Was anyone else recorded as being with the patient at the time of death?
YES 36% 2910/8063 *If the earlier stated sudden or unexpected deaths are excluded then this result (4.5) is revised to 84% (6495/7707) YES; 13% (994/7707) NO; 2% (129/7707) NOT BUT there was no person(s) important to the patient; and a further 1% (89/7707) also stating NO BUT the notes indicate the patient died suddenly and unexpectedly. **On the audit web tool this denominator applied to all those not answering no for 4.5, ie 9302-1239=8063.
38 © Healthcare Quality Improvement Partnership 2016

End of Life Care Audit – Dying in Hospital report for England
Table 26 National audit (n=9302) 4.6. Is there documented evidence of care and support of the patient’s family and those important to them at the time of and immediately after death?
• YES 64%* 5944 • NO 34% 3133 • NO BUT there was no family or person(s) important to
the patient 2% 225
4.6i. If ‘Yes’ or ‘No’ to 4.6 (n=9077), is there documented evidence that the family and those people that are important to the deceased were given any culturally appropriate verbal information following the death of the patient?
YES 56% 5103/9077 4.6ii. If ‘Yes’ or ‘No’ to 4.6 (n=9077), is there documented evidence that the family and those people that are important to the deceased were given any culturally appropriate written information, in the appropriate language, following the death of the patient?
YES 44% 3993/9077 *65% (5944/9077) if the ‘NO BUTs’ are excluded from the denominator Fig 6: Site variation in 4.6 Per cent with documented evidence of care and support of the patient’s family and those important to them at the time of and immediately after death (the red line shows the national 65%, after excluding the ‘NO BUTs’ from the denominator)
0
10
20
30
40
50
60
70
80
90
100
%w
ith d
ocum
ente
d ev
iden
ce o
f car
e an
d su
ppor
t
0 10 20 30 40 50 60 70 80 90 100
Number of patients
© Healthcare Quality Improvement Partnership 2016 39
End of Life Care Audit – Dying in Hospital report for England
Summary
Where it was recognised that the patient would probably die in the coming hours or days, this was discussed with a nominated person important to the patient in 95% of cases (6811/7199). In contrast, it was only documented in 54% of cases (5031/9302) that anyone asked about the nominated person’s needs and in only a third of all cases (3128/9302) were any needs identified or explored. Yet where practical, psychological, spiritual or cultural needs were identified, they were able to be addressed in over 90% of cases. Those important to the patient were notified of the patient’s imminent death in 77% of all deaths included in the audit (7139/9302). Where they were notified that death was imminent, those close to the patient were recorded as being present at the time of death in 63% of cases (4520/7139). If those important to the patient were not present, someone else may have been present. In 54% of cases, records showed that the needs of persons important to the person were asked about. Of these, 62% had needs identified. These identified needs were mostly practical (88% of case records) and psychological (71%) in nature; whereas 40% were spiritual/religious needs and 28% were cultural needs. There was documented evidence that >90% of cases had these needs addressed. Support for the family and those important to the patient was higher at the time of death and after the patient has died than when the patient was alive. In 64% (5944/9302) of cases, support was given. However, culturally appropriate written information was only provided in 44% (3993/9077) of cases, despite the fact that such information is recorded as being available in 97% of trusts. There was also very wide variation between sites in the support and care given immediately after death to those important to the patient. Many sites fell outside the control limits, with some showing that support was given in more than 90% of cases while others showed support as being given in well under half of cases. These results suggest that, while information is being provided about the physical condition of the patient, the needs of those close to the dying patient are not yet being seen as a core part of the hospital’s duty of care.
40 © Healthcare Quality Improvement Partnership 2016
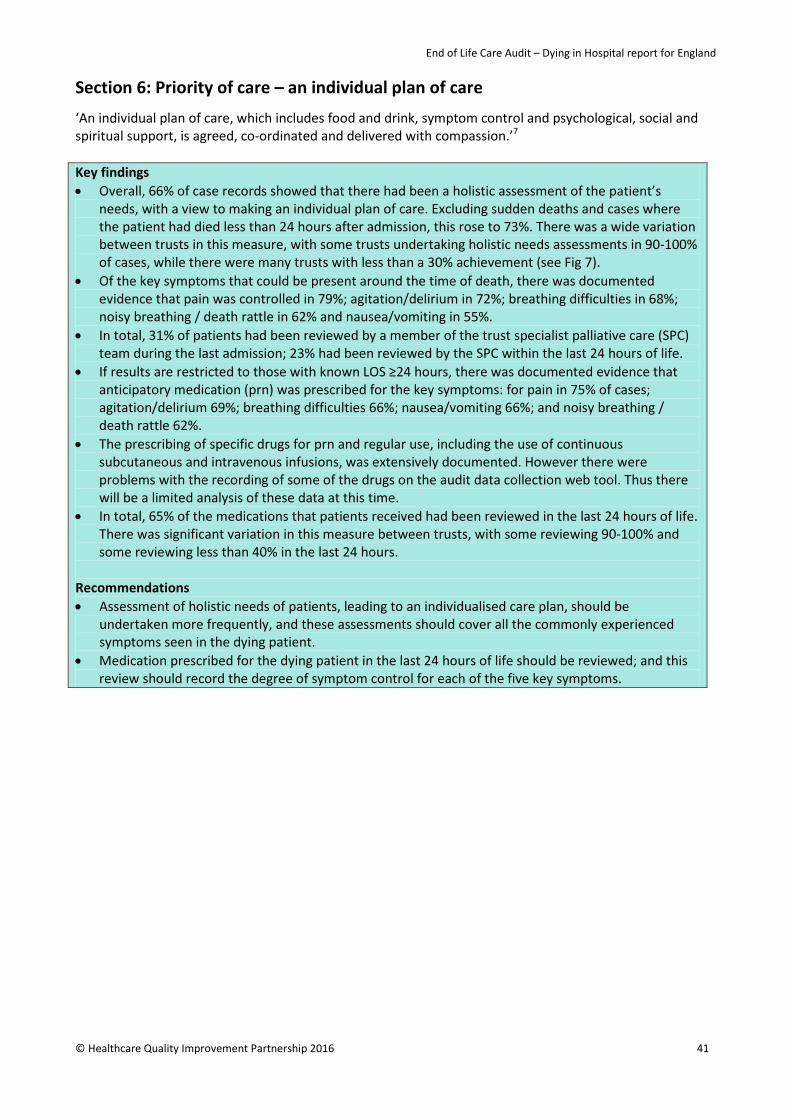
End of Life Care Audit – Dying in Hospital report for England
Section 6: Priority of care – an individual plan of care ‘An individual plan of care, which includes food and drink, symptom control and psychological, social and spiritual support, is agreed, co-ordinated and delivered with compassion.’7 Key findings • Overall, 66% of case records showed that there had been a holistic assessment of the patient’s
needs, with a view to making an individual plan of care. Excluding sudden deaths and cases where the patient had died less than 24 hours after admission, this rose to 73%. There was a wide variation between trusts in this measure, with some trusts undertaking holistic needs assessments in 90-100% of cases, while there were many trusts with less than a 30% achievement (see Fig 7).
• Of the key symptoms that could be present around the time of death, there was documented evidence that pain was controlled in 79%; agitation/delirium in 72%; breathing difficulties in 68%; noisy breathing / death rattle in 62% and nausea/vomiting in 55%.
• In total, 31% of patients had been reviewed by a member of the trust specialist palliative care (SPC) team during the last admission; 23% had been reviewed by the SPC within the last 24 hours of life.
• If results are restricted to those with known LOS ≥24 hours, there was documented evidence that anticipatory medication (prn) was prescribed for the key symptoms: for pain in 75% of cases; agitation/delirium 69%; breathing difficulties 66%; nausea/vomiting 66%; and noisy breathing / death rattle 62%.
• The prescribing of specific drugs for prn and regular use, including the use of continuous subcutaneous and intravenous infusions, was extensively documented. However there were problems with the recording of some of the drugs on the audit data collection web tool. Thus there will be a limited analysis of these data at this time.
• In total, 65% of the medications that patients received had been reviewed in the last 24 hours of life. There was significant variation in this measure between trusts, with some reviewing 90-100% and some reviewing less than 40% in the last 24 hours.
Recommendations • Assessment of holistic needs of patients, leading to an individualised care plan, should be
undertaken more frequently, and these assessments should cover all the commonly experienced symptoms seen in the dying patient.
• Medication prescribed for the dying patient in the last 24 hours of life should be reviewed; and this review should record the degree of symptom control for each of the five key symptoms.
© Healthcare Quality Improvement Partnership 2016 41

End of Life Care Audit – Dying in Hospital report for England
Assessment Table 27
National audit (n=9302) 5.1. Is there documented evidence in the last 24 hours of life of a holistic assessment of the patient’s needs regarding an individual plan of care?
YES 66%* 6125
5.1i. If ‘yes’ to 5.1, does this include an assessment of the following (in the last 24 hours)?
a) Agitation/delirium 79% 4835 b) Dyspnoea / breathing difficulty 82% 5000 c) Nausea/vomiting 62% 3802 d) Pain 87% 5350 e) Noisy breathing / death rattle 67% 4077 f) Anxiety/distress 76% 4657 g) Bladder function 90% 5507 h) Bowel function 82% 5025 i) Pressure areas 92% 5659 j) Hygiene requirements 90% 5525 k) Mouth care 82% 5039 *If the sudden or unexpected deaths are excluded and the analysis is also restricted to where LOS ≥24 hours then this result (%5.1=yes) is revised to 73% (4947/6773).
Fig 7: Site variation in 5.1 Per cent with documented evidence in the last 24 hours of life of a holistic assessment of the patient’s needs regarding an individual plan of care (the red line shows the national 66%)
0
10
20
30
40
50
60
70
80
90
100
% w
ith d
ocum
ente
d ev
iden
ce o
f hol
istic
ass
essm
ent
0 10 20 30 40 50 60 70 80 90 100Number of patients
42 © Healthcare Quality Improvement Partnership 2016
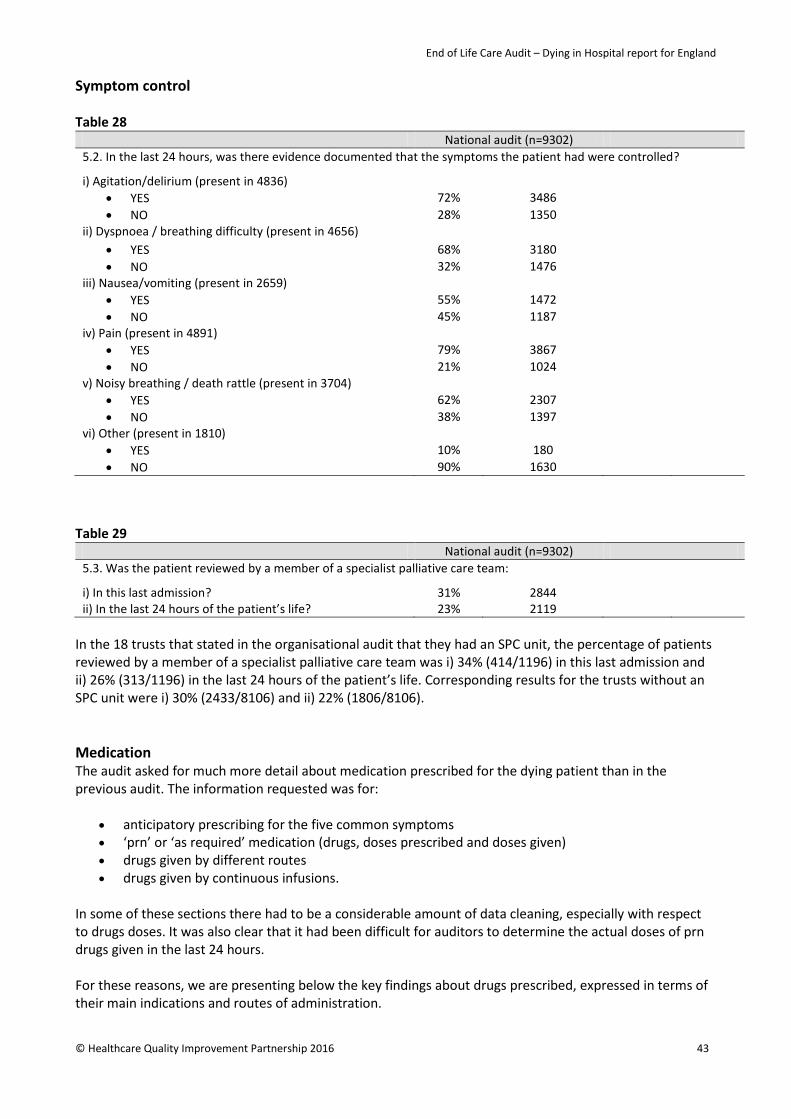
End of Life Care Audit – Dying in Hospital report for England
Symptom control Table 28
National audit (n=9302) 5.2. In the last 24 hours, was there evidence documented that the symptoms the patient had were controlled?
i) Agitation/delirium (present in 4836) • YES 72% 3486 • NO 28% 1350
ii) Dyspnoea / breathing difficulty (present in 4656) • YES 68% 3180 • NO 32% 1476
iii) Nausea/vomiting (present in 2659) • YES 55% 1472 • NO 45% 1187
iv) Pain (present in 4891) • YES 79% 3867 • NO 21% 1024
v) Noisy breathing / death rattle (present in 3704) • YES 62% 2307 • NO 38% 1397
vi) Other (present in 1810) • YES 10% 180 • NO 90% 1630
Table 29
National audit (n=9302) 5.3. Was the patient reviewed by a member of a specialist palliative care team:
i) In this last admission? 31% 2844 ii) In the last 24 hours of the patient’s life? 23% 2119
In the 18 trusts that stated in the organisational audit that they had an SPC unit, the percentage of patients reviewed by a member of a specialist palliative care team was i) 34% (414/1196) in this last admission and ii) 26% (313/1196) in the last 24 hours of the patient’s life. Corresponding results for the trusts without an SPC unit were i) 30% (2433/8106) and ii) 22% (1806/8106). Medication The audit asked for much more detail about medication prescribed for the dying patient than in the previous audit. The information requested was for:
• anticipatory prescribing for the five common symptoms • ‘prn’ or ‘as required’ medication (drugs, doses prescribed and doses given) • drugs given by different routes • drugs given by continuous infusions.
In some of these sections there had to be a considerable amount of data cleaning, especially with respect to drugs doses. It was also clear that it had been difficult for auditors to determine the actual doses of prn drugs given in the last 24 hours. For these reasons, we are presenting below the key findings about drugs prescribed, expressed in terms of their main indications and routes of administration.
© Healthcare Quality Improvement Partnership 2016 43
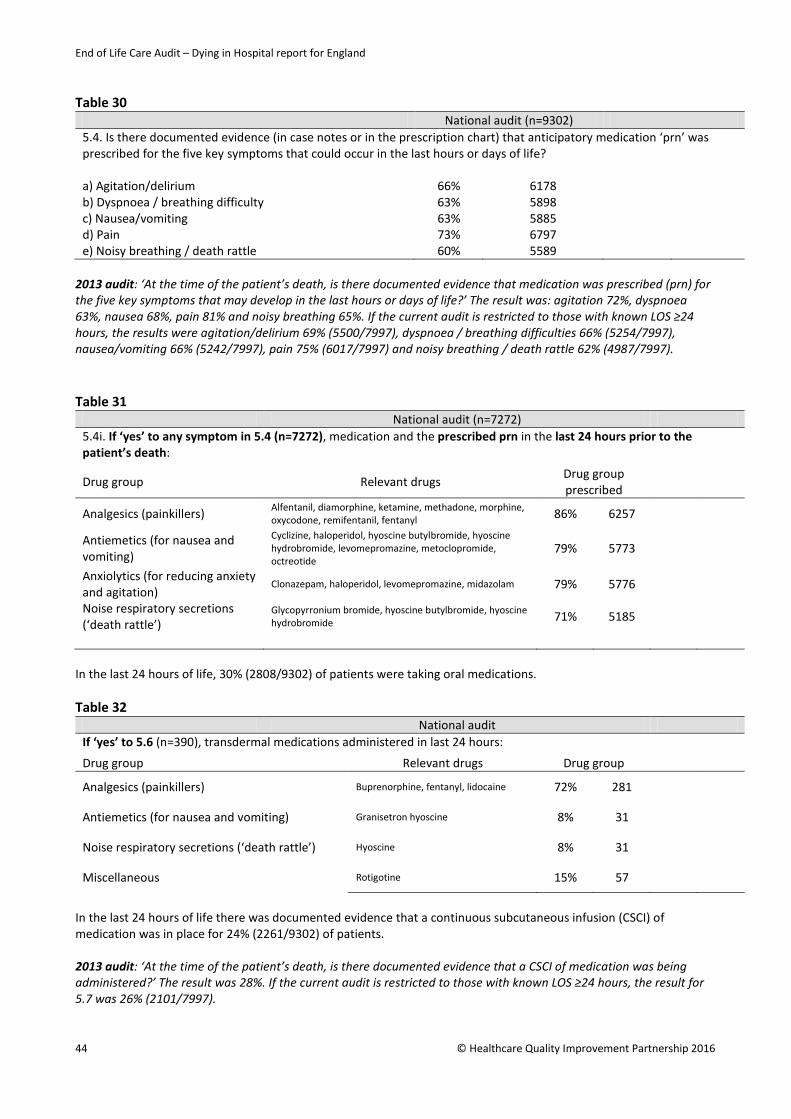
End of Life Care Audit – Dying in Hospital report for England
Table 30
National audit (n=9302) 5.4. Is there documented evidence (in case notes or in the prescription chart) that anticipatory medication ‘prn’ was prescribed for the five key symptoms that could occur in the last hours or days of life?
a) Agitation/delirium 66% 6178 b) Dyspnoea / breathing difficulty 63% 5898 c) Nausea/vomiting 63% 5885 d) Pain 73% 6797 e) Noisy breathing / death rattle 60% 5589
2013 audit: ‘At the time of the patient’s death, is there documented evidence that medication was prescribed (prn) for the five key symptoms that may develop in the last hours or days of life?’ The result was: agitation 72%, dyspnoea 63%, nausea 68%, pain 81% and noisy breathing 65%. If the current audit is restricted to those with known LOS ≥24 hours, the results were agitation/delirium 69% (5500/7997), dyspnoea / breathing difficulties 66% (5254/7997), nausea/vomiting 66% (5242/7997), pain 75% (6017/7997) and noisy breathing / death rattle 62% (4987/7997). Table 31
National audit (n=7272) 5.4i. If ‘yes’ to any symptom in 5.4 (n=7272), medication and the prescribed prn in the last 24 hours prior to the patient’s death:
Drug group Relevant drugs Drug group prescribed
Analgesics (painkillers) Alfentanil, diamorphine, ketamine, methadone, morphine, oxycodone, remifentanil, fentanyl 86% 6257
Antiemetics (for nausea and vomiting)
Cyclizine, haloperidol, hyoscine butylbromide, hyoscine hydrobromide, levomepromazine, metoclopromide, octreotide
79% 5773
Anxiolytics (for reducing anxiety and agitation)
Clonazepam, haloperidol, levomepromazine, midazolam 79% 5776
Noise respiratory secretions (‘death rattle’)
Glycopyrronium bromide, hyoscine butylbromide, hyoscine hydrobromide 71% 5185
In the last 24 hours of life, 30% (2808/9302) of patients were taking oral medications. Table 32
National audit If ‘yes’ to 5.6 (n=390), transdermal medications administered in last 24 hours:
Drug group Relevant drugs Drug group
Analgesics (painkillers) Buprenorphine, fentanyl, lidocaine 72% 281
Antiemetics (for nausea and vomiting) Granisetron hyoscine 8% 31
Noise respiratory secretions (‘death rattle’) Hyoscine 8% 31
Miscellaneous Rotigotine 15% 57
In the last 24 hours of life there was documented evidence that a continuous subcutaneous infusion (CSCI) of medication was in place for 24% (2261/9302) of patients. 2013 audit: ‘At the time of the patient’s death, is there documented evidence that a CSCI of medication was being administered?’ The result was 28%. If the current audit is restricted to those with known LOS ≥24 hours, the result for 5.7 was 26% (2101/7997).
44 © Healthcare Quality Improvement Partnership 2016

End of Life Care Audit – Dying in Hospital report for England
Fig 8: Site variation in 5.7 Per cent with documented evidence in the last 24 hours of life that a CSCI of medication was in place (the red line shows the national 24%)
Table 33
National audit 5.7i. If ‘yes’ to 5.7 (n=2261), medication prescribed in the CSCI in the last 24 hours prior to the patient’s death:
Drug group Relevant drugs Drug group
Analgesics (painkillers) Alfentanil, diamorphine, ketamine, methadone, morphine, oxycodone, remifentanil, fentanyl 86% 1955
Antiemetics (for nausea and vomiting)
Cyclizine, haloperidol, hyoscine butylbromide, hyoscine hydrobromide, levomepromazine, metoclopromide, octreotide
54% 1222
Anxiolytics (for reducing anxiety and agitation)
Clonazepam, haloperidol, levomepromazine, midazolam 78% 1774
Noise respiratory secretions (‘death rattle’)
Glycopyrronium bromide, hyoscine butylbromide, hyoscine hydrobromide 41% 924
In the last 24 hours of life there was documented evidence that a continuous intravenous infusion of medication (including patient controlled analgesia – PCA) was in place in 5.2% (482/9302) of patients.
0
10
20
30
40
50
60
70
80
90
100
% d
ocum
ente
d th
at C
SCI o
f med
icatio
n in
pla
ce
0 10 20 30 40 50 60 70 80 90 100Number of patients
© Healthcare Quality Improvement Partnership 2016 45
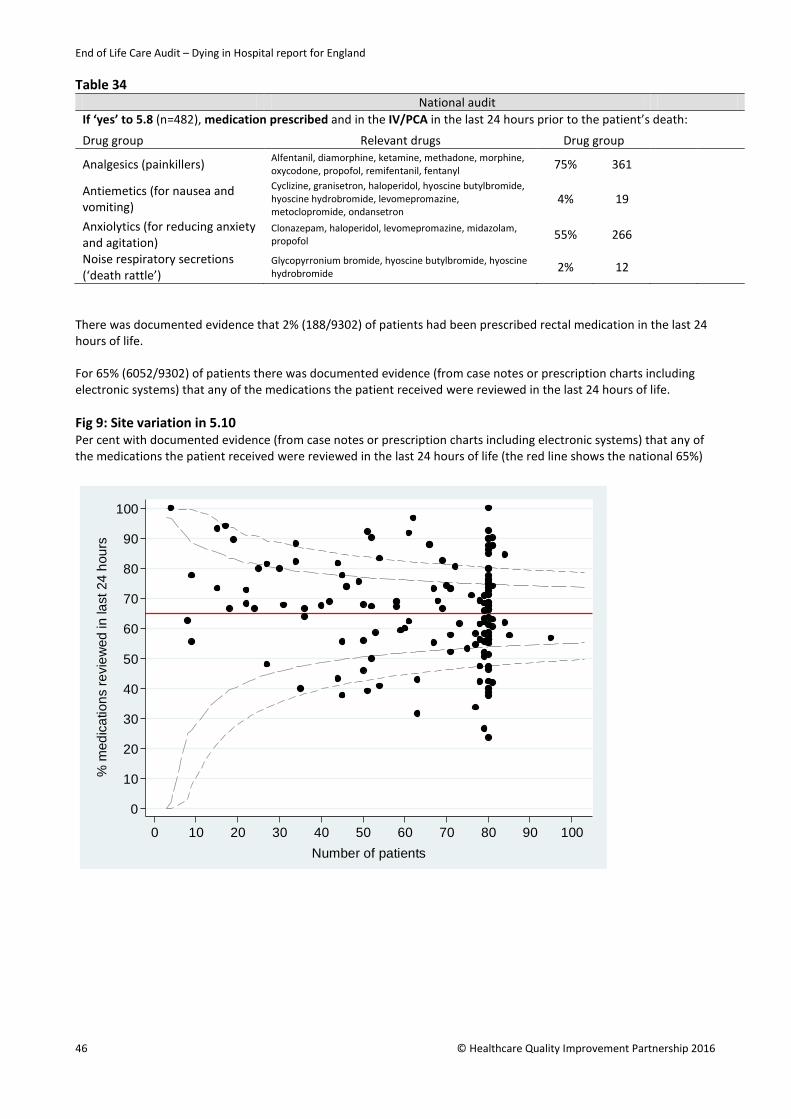
End of Life Care Audit – Dying in Hospital report for England
Table 34 National audit If ‘yes’ to 5.8 (n=482), medication prescribed and in the IV/PCA in the last 24 hours prior to the patient’s death:
Drug group Relevant drugs Drug group
Analgesics (painkillers) Alfentanil, diamorphine, ketamine, methadone, morphine, oxycodone, propofol, remifentanil, fentanyl 75% 361
Antiemetics (for nausea and vomiting)
Cyclizine, granisetron, haloperidol, hyoscine butylbromide, hyoscine hydrobromide, levomepromazine, metoclopromide, ondansetron
4% 19
Anxiolytics (for reducing anxiety and agitation)
Clonazepam, haloperidol, levomepromazine, midazolam, propofol 55% 266
Noise respiratory secretions (‘death rattle’)
Glycopyrronium bromide, hyoscine butylbromide, hyoscine hydrobromide 2% 12
There was documented evidence that 2% (188/9302) of patients had been prescribed rectal medication in the last 24 hours of life. For 65% (6052/9302) of patients there was documented evidence (from case notes or prescription charts including electronic systems) that any of the medications the patient received were reviewed in the last 24 hours of life. Fig 9: Site variation in 5.10 Per cent with documented evidence (from case notes or prescription charts including electronic systems) that any of the medications the patient received were reviewed in the last 24 hours of life (the red line shows the national 65%)
0
10
20
30
40
50
60
70
80
90
100
% m
edic
atio
ns re
view
ed in
last
24
hour
s
0 10 20 30 40 50 60 70 80 90 100Number of patients
46 © Healthcare Quality Improvement Partnership 2016

End of Life Care Audit – Dying in Hospital report for England
Drinking and assisted hydration Key findings • In two-thirds of cases there was documented evidence that the patient’s ability to drink had
been assessed in the last 24 hours of life. This figure is unchanged if sudden and unexpected deaths were excluded. In total, 39% of patients were documented as drinking in the last 24 hours. In 45% of cases there was evidence that the patient had been supported to drink in the last 24 hours.
• Eighteen per cent of patients had a ‘nil by mouth’ (NBM) order in their last 24 hours. There was some noticeable variation between trusts in the frequency of NBM orders. In total, 93% of NBM orders had a documented reason. Twenty-three per cent of patients with an NBM order had been informed of it; 64% of the people important to the patient had been informed. The majority (54%) of the NBM decisions involved a consultant (other than palliative medicine); 20% of the orders involved speech and language therapists (SALTs) and 16% involved a staff nurse.
• In 71% of cases, there was documented evidence that the patient had an assessment regarding the need for clinically assisted (artificial) hydration (CAH) at any time between the time of the final admission and death. There is considerable variation between trusts in the assessment for CAH (Fig 11): some trusts assessed between 90-100% patients and some assessed less than 50%.
• There was documented evidence that discussion regarding drinking and need for CAH was undertaken with the patient between the date of final admission and death in 18%; and in 39% of cases these discussions had taken place with the nominated people, or the nominated independent mental capacity advocate (IMCA), or LPA for personal welfare.
• CAH was in place during the last 24 hours before death in 43% of patients. There was variation between trusts in this measure, with some recording CAH being in place in up to 70% of cases, and others recording 0-20%.
Recommendations • NBM orders should only be made by a senior doctor, nurse or SALT specialist. • There needs to be better documentation of justification for NBM orders and improved
communication of them to patients (if conscious) and to those important to the patient. • Assessment of the possible need for CAH needs to be undertaken and documented more
uniformly once it is recognised that the patient is dying. • For patients who lack capacity, there should be better documentation of attempts to contact and
discuss hydration needs with those important to the patient, including those nominated to have responsibility for decisions.
Table 35
National audit (n=9302) 5.11. Was there a documented assessment of the patient’s ability to drink in the last 24 hours of life?
YES 67%* 6195
5.12. Is there evidence that the patient was supported to drink in the last 24 hours of life?
YES 45% 4229 5.13. Was the patient drinking in the last 24 hours of life?
YES 39% 3584 *If sudden or unexpected deaths are excluded then the percentage for 5.11 is revised to 67% (5154/7707).
© Healthcare Quality Improvement Partnership 2016 47
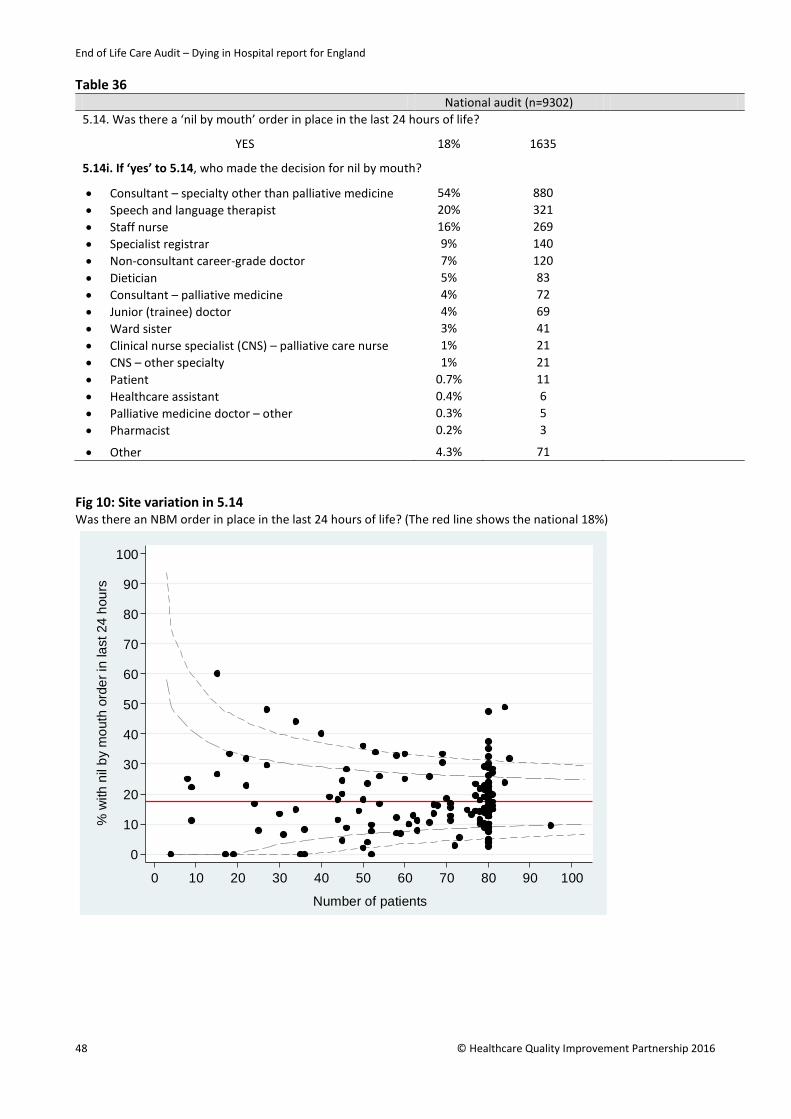
End of Life Care Audit – Dying in Hospital report for England
Table 36 National audit (n=9302) 5.14. Was there a ‘nil by mouth’ order in place in the last 24 hours of life?
YES 18% 1635
5.14i. If ‘yes’ to 5.14, who made the decision for nil by mouth?
• Consultant – specialty other than palliative medicine 54% 880 • Speech and language therapist 20% 321 • Staff nurse 16% 269 • Specialist registrar 9% 140 • Non-consultant career-grade doctor 7% 120 • Dietician 5% 83 • Consultant – palliative medicine 4% 72 • Junior (trainee) doctor 4% 69 • Ward sister 3% 41 • Clinical nurse specialist (CNS) – palliative care nurse 1% 21 • CNS – other specialty 1% 21 • Patient 0.7% 11 • Healthcare assistant 0.4% 6 • Palliative medicine doctor – other 0.3% 5 • Pharmacist 0.2% 3
• Other 4.3% 71 Fig 10: Site variation in 5.14 Was there an NBM order in place in the last 24 hours of life? (The red line shows the national 18%)
0
10
20
30
40
50
60
70
80
90
100
% w
ith n
il by
mou
th o
rder
in la
st 2
4 ho
urs
0 10 20 30 40 50 60 70 80 90 100
Number of patients
48 © Healthcare Quality Improvement Partnership 2016
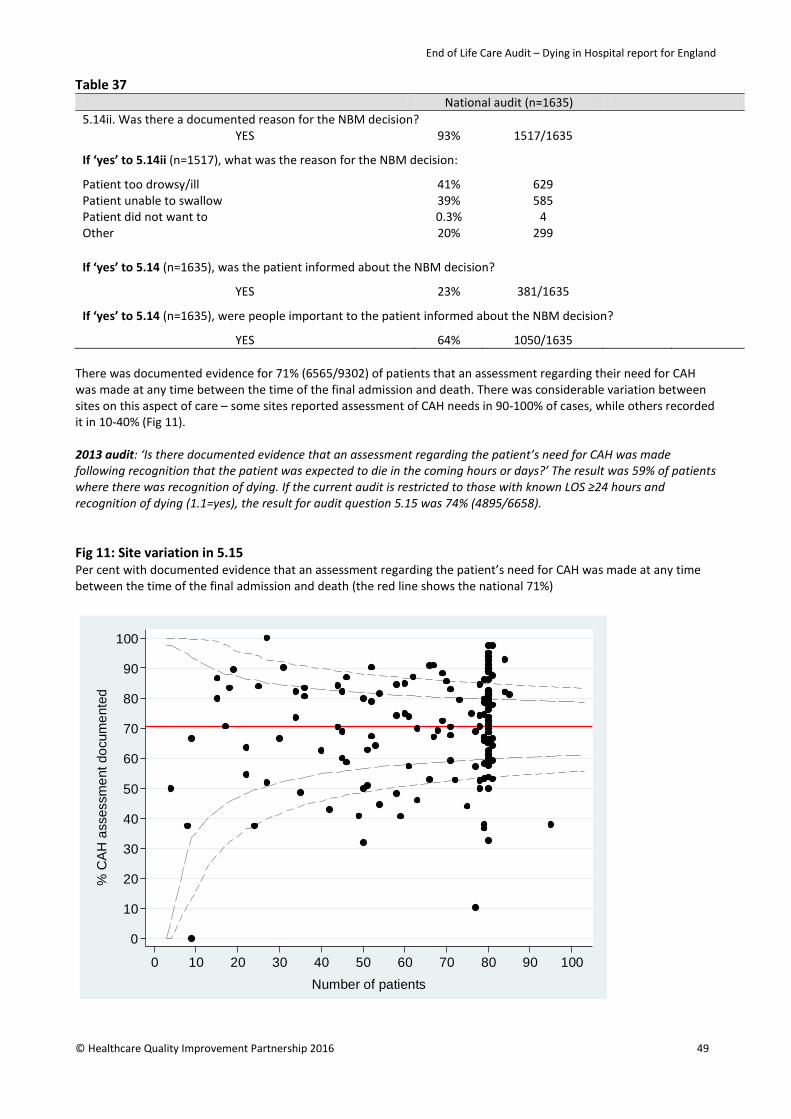
End of Life Care Audit – Dying in Hospital report for England
Table 37 National audit (n=1635) 5.14ii. Was there a documented reason for the NBM decision?
YES 93% 1517/1635
If ‘yes’ to 5.14ii (n=1517), what was the reason for the NBM decision:
Patient too drowsy/ill 41% 629 Patient unable to swallow 39% 585 Patient did not want to 0.3% 4 Other 20% 299 If ‘yes’ to 5.14 (n=1635), was the patient informed about the NBM decision?
YES 23% 381/1635
If ‘yes’ to 5.14 (n=1635), were people important to the patient informed about the NBM decision?
YES 64% 1050/1635 There was documented evidence for 71% (6565/9302) of patients that an assessment regarding their need for CAH was made at any time between the time of the final admission and death. There was considerable variation between sites on this aspect of care – some sites reported assessment of CAH needs in 90-100% of cases, while others recorded it in 10-40% (Fig 11). 2013 audit: ‘Is there documented evidence that an assessment regarding the patient’s need for CAH was made following recognition that the patient was expected to die in the coming hours or days?’ The result was 59% of patients where there was recognition of dying. If the current audit is restricted to those with known LOS ≥24 hours and recognition of dying (1.1=yes), the result for audit question 5.15 was 74% (4895/6658). Fig 11: Site variation in 5.15 Per cent with documented evidence that an assessment regarding the patient’s need for CAH was made at any time between the time of the final admission and death (the red line shows the national 71%)
0
10
20
30
40
50
60
70
80
90
100
% C
AH
ass
essm
ent d
ocum
ente
d
0 10 20 30 40 50 60 70 80 90 100Number of patients
© Healthcare Quality Improvement Partnership 2016 49
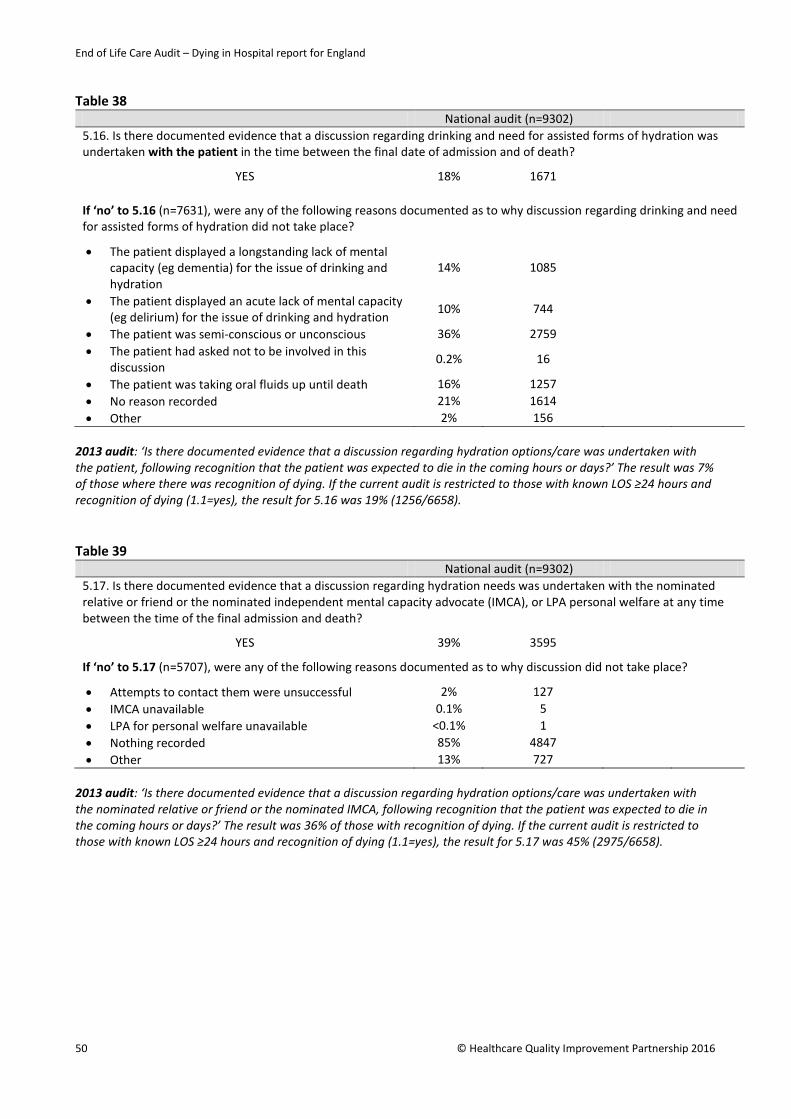
End of Life Care Audit – Dying in Hospital report for England
Table 38
National audit (n=9302) 5.16. Is there documented evidence that a discussion regarding drinking and need for assisted forms of hydration was undertaken with the patient in the time between the final date of admission and of death?
YES 18% 1671 If ‘no’ to 5.16 (n=7631), were any of the following reasons documented as to why discussion regarding drinking and need for assisted forms of hydration did not take place?
• The patient displayed a longstanding lack of mental capacity (eg dementia) for the issue of drinking and hydration
14% 1085
• The patient displayed an acute lack of mental capacity (eg delirium) for the issue of drinking and hydration
10% 744
• The patient was semi-conscious or unconscious 36% 2759 • The patient had asked not to be involved in this
discussion 0.2% 16
• The patient was taking oral fluids up until death 16% 1257 • No reason recorded 21% 1614 • Other 2% 156
2013 audit: ‘Is there documented evidence that a discussion regarding hydration options/care was undertaken with the patient, following recognition that the patient was expected to die in the coming hours or days?’ The result was 7% of those where there was recognition of dying. If the current audit is restricted to those with known LOS ≥24 hours and recognition of dying (1.1=yes), the result for 5.16 was 19% (1256/6658). Table 39
National audit (n=9302) 5.17. Is there documented evidence that a discussion regarding hydration needs was undertaken with the nominated relative or friend or the nominated independent mental capacity advocate (IMCA), or LPA personal welfare at any time between the time of the final admission and death?
YES 39% 3595
If ‘no’ to 5.17 (n=5707), were any of the following reasons documented as to why discussion did not take place?
• Attempts to contact them were unsuccessful 2% 127 • IMCA unavailable 0.1% 5 • LPA for personal welfare unavailable <0.1% 1 • Nothing recorded 85% 4847 • Other 13% 727
2013 audit: ‘Is there documented evidence that a discussion regarding hydration options/care was undertaken with the nominated relative or friend or the nominated IMCA, following recognition that the patient was expected to die in the coming hours or days?’ The result was 36% of those with recognition of dying. If the current audit is restricted to those with known LOS ≥24 hours and recognition of dying (1.1=yes), the result for 5.17 was 45% (2975/6658).
50 © Healthcare Quality Improvement Partnership 2016

End of Life Care Audit – Dying in Hospital report for England
Table 40 National audit (n=9302) 5.18 In the last 24 hours before the patient’s death, was clinically assisted (artificial) Hydration (CAH) in place?
YES 43% 4020
If ‘yes’, what was the route?
• SC 6% 251 • Nasogastric (NG) 5% 204 • Percutaneous endoscopic gastrostomy (PEG) 2% 67 • IV 87% 3498
2013 audit: ‘At the time of the patient’s death was clinically assisted (artificial) Hydration (CAH) in place?’ The result was 29%. If the current audit is restricted to those with known LOS ≥24 hours, the result for 5.18 was 41% (3282/7997). Eating and assisted nutrition Key findings • In 61% of cases there was documented evidence that the patient’s ability to eat had been
assessed in the last 24 hours of life. In 26% of cases it was documented that the patient was eating in the last 24 hours. In 36% there was evidence that the patient had been supported to eat in the last 24 hours.
• In 34% of cases, there was documented evidence that the patient had an assessment regarding the need for clinically assisted (artificial) nutrition (CAN) at any time between the time of the final admission and death.
• CAN was in place during the last 24 hours before death in 8% of patients. Recommendations • There should be more frequent assessment of the dying patient’s ability and desire to eat. • For patients who are unconscious or lacking capacity, there needs to be more documentation
that the nominated person was involved in decisions about feeding and the possible need for CAN.
Table 41
National audit (n=9302) 5.19. Was there a documented assessment of the patient’s ability to eat in the last 24 hours of life?
YES 61% 5632 5.20. Is there evidence that the patient was supported to eat in the last 24 hours of life?
YES 36% 3335 5.21. Was the patient eating in the last 24 hours of life?
YES 26% 2431 5.22. Is there documented evidence that an assessment regarding the patient’s need for CAN was made at any time between the time of the final admission and death?
YES 34% 3197 2013 audit: ‘Is there documented evidence that an assessment regarding the patient’s ability to take oral nutrition was made following recognition that the patient was expected to die in the coming hours or days?’ The result was 59% for those with recognition of dying. If the current audit is restricted to those with known LOS ≥24 hours and recognition of dying (1.1=yes), the result for 5.19 was 62% (4126/6658). 2013 audit: ‘Is there documented evidence that an assessment regarding the patient’s need for CAN was made following recognition that the patient was expected to die in the coming hours or days?’ The result was 45% for those
© Healthcare Quality Improvement Partnership 2016 51
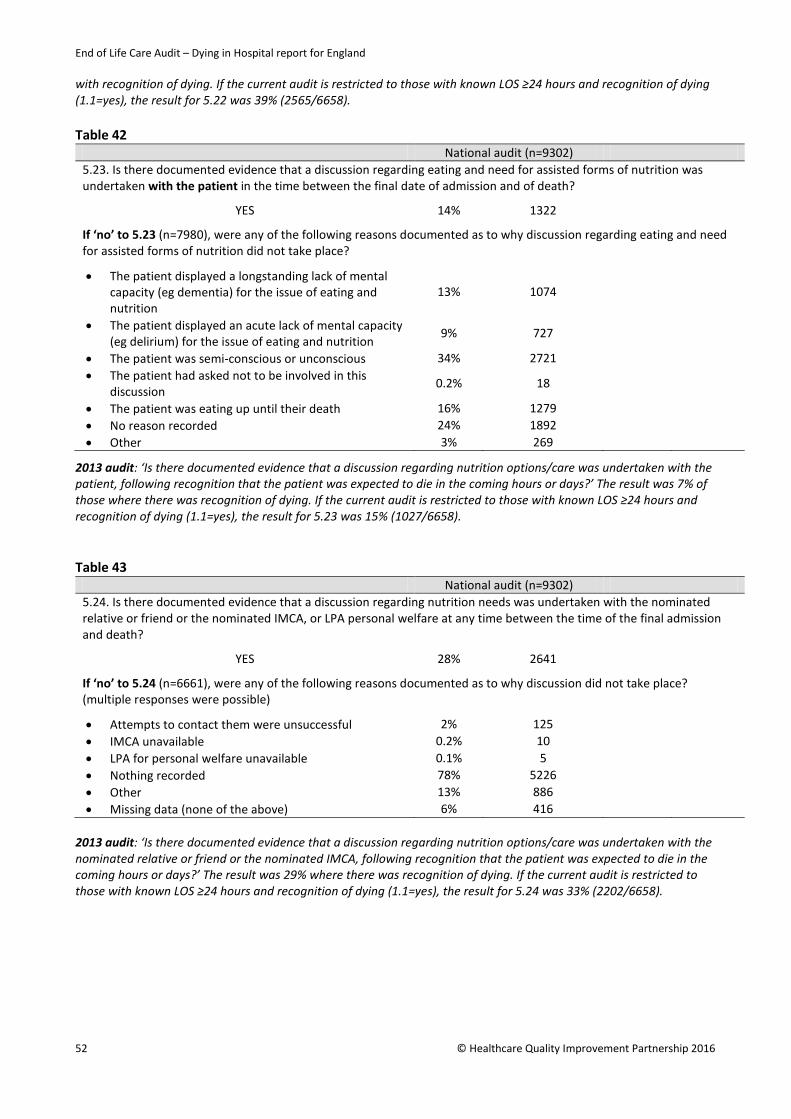
End of Life Care Audit – Dying in Hospital report for England
with recognition of dying. If the current audit is restricted to those with known LOS ≥24 hours and recognition of dying (1.1=yes), the result for 5.22 was 39% (2565/6658). Table 42
National audit (n=9302) 5.23. Is there documented evidence that a discussion regarding eating and need for assisted forms of nutrition was undertaken with the patient in the time between the final date of admission and of death?
YES 14% 1322
If ‘no’ to 5.23 (n=7980), were any of the following reasons documented as to why discussion regarding eating and need for assisted forms of nutrition did not take place?
• The patient displayed a longstanding lack of mental capacity (eg dementia) for the issue of eating and nutrition
13% 1074
• The patient displayed an acute lack of mental capacity (eg delirium) for the issue of eating and nutrition
9% 727
• The patient was semi-conscious or unconscious 34% 2721 • The patient had asked not to be involved in this
discussion 0.2% 18
• The patient was eating up until their death 16% 1279 • No reason recorded 24% 1892 • Other 3% 269
2013 audit: ‘Is there documented evidence that a discussion regarding nutrition options/care was undertaken with the patient, following recognition that the patient was expected to die in the coming hours or days?’ The result was 7% of those where there was recognition of dying. If the current audit is restricted to those with known LOS ≥24 hours and recognition of dying (1.1=yes), the result for 5.23 was 15% (1027/6658). Table 43
National audit (n=9302) 5.24. Is there documented evidence that a discussion regarding nutrition needs was undertaken with the nominated relative or friend or the nominated IMCA, or LPA personal welfare at any time between the time of the final admission and death?
YES 28% 2641
If ‘no’ to 5.24 (n=6661), were any of the following reasons documented as to why discussion did not take place? (multiple responses were possible)
• Attempts to contact them were unsuccessful 2% 125 • IMCA unavailable 0.2% 10 • LPA for personal welfare unavailable 0.1% 5 • Nothing recorded 78% 5226 • Other 13% 886 • Missing data (none of the above) 6% 416
2013 audit: ‘Is there documented evidence that a discussion regarding nutrition options/care was undertaken with the nominated relative or friend or the nominated IMCA, following recognition that the patient was expected to die in the coming hours or days?’ The result was 29% where there was recognition of dying. If the current audit is restricted to those with known LOS ≥24 hours and recognition of dying (1.1=yes), the result for 5.24 was 33% (2202/6658).
52 © Healthcare Quality Improvement Partnership 2016

End of Life Care Audit – Dying in Hospital report for England
Table 44 National audit (n=9302) 5.25. At the time of the patient’s death was CAN in place?
YES 8% 758 If ‘yes’, what was the route?
• NG 67% 511 • PEG 13% 96 • IV 20% 151
2013 audit: ‘At the time of the patient’s death was CAN in place?’ The result was 7% for the overall sample. If the current audit is restricted to those with known LOS ≥24 hours, the result for 5.25 was 8% (667/7997). Spiritual, cultural, religious and practical needs Key findings • There was documented evidence of discussion during the last episode of care regarding the
patient’s spiritual/cultural/religious/practical needs with 15% of patients who were capable of participating in such discussions. In a further 27%, there had been discussion with a nominated person important to the patient.
• There was considerable variation between trusts with respect to the recording of these discussions with either the patient or the nominated person important to the patient: the national average was 42% but many trusts recorded these discussions for 60-100% of cases, while many also recorded them for less than 20% of cases (see Fig 12)
• It was documented that in 89% of cases, the identified spiritual/cultural/religious/practical needs had been met.
Recommendation • The documentation of discussions about the dying patient’s spiritual/cultural/religious/
practical needs is low and should be increased.
Table 45 National audit (n=9302) 5.26. Is there documented evidence within the last episode of care of discussion regarding the patient’s spiritual/cultural /religious/practical needs with patients who were capable of participating in such discussions?
• Yes, to the patient 15% 1366 • Yes, to the nominated person important to the patient
as a proxy for the patient 27% 2520
• No to the patient or the nominated person important to the patient as a proxy for the patient
56% 5237
• There was no nominated person important to the patient
1% 94
• Attempts were made to contact the nominated person important to the patient but were unsuccessful
1% 85
If sudden or unexpected deaths are excluded and the analysis is also restricted to where there was recognition (1.1=yes), then this result (5.26) is revised to: 15% (1079/7199) Yes – to the patient; 32% (2276/7199) Yes – to the nominated person important to the patient as a proxy for the patient; 52% (3729/7199) No to the patient or the nominated person important to the patient as a proxy for the patient; 1% (59/7199) There was no nominated person important to the patient; 1% (56/7199) Attempts were made to contact the nominated person important to the patient but were unsuccessful.
© Healthcare Quality Improvement Partnership 2016 53
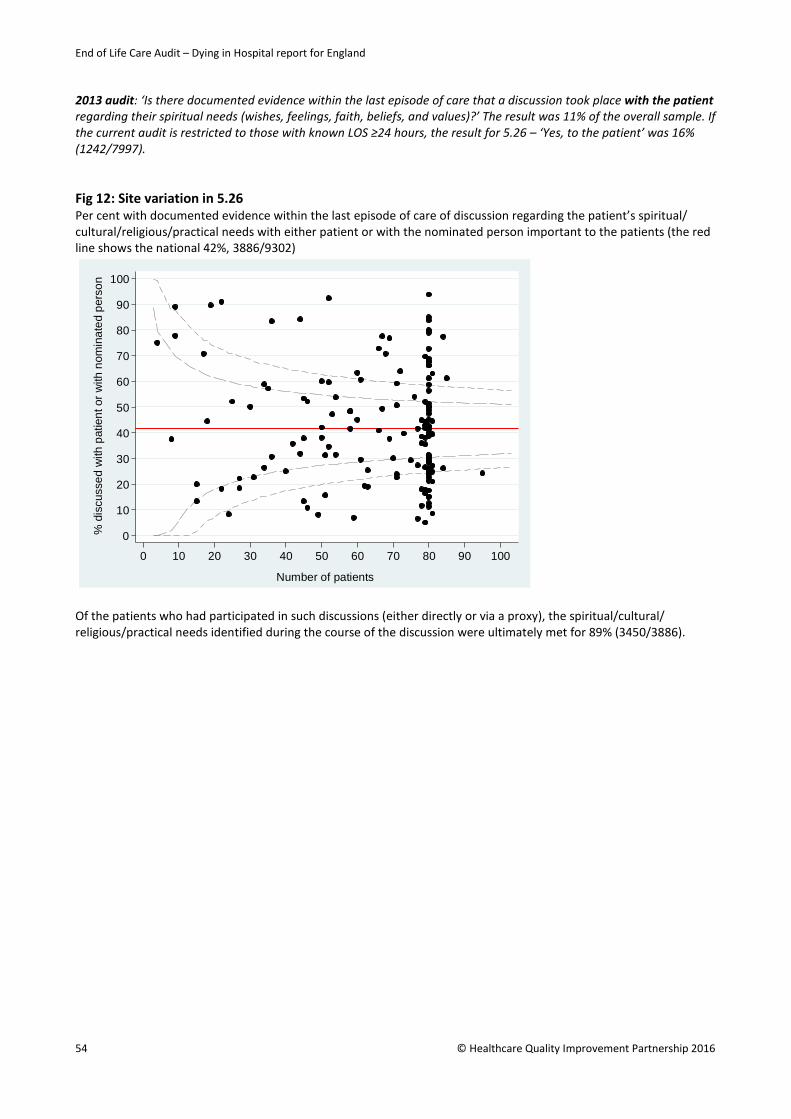
End of Life Care Audit – Dying in Hospital report for England
2013 audit: ‘Is there documented evidence within the last episode of care that a discussion took place with the patient regarding their spiritual needs (wishes, feelings, faith, beliefs, and values)?’ The result was 11% of the overall sample. If the current audit is restricted to those with known LOS ≥24 hours, the result for 5.26 – ‘Yes, to the patient’ was 16% (1242/7997). Fig 12: Site variation in 5.26 Per cent with documented evidence within the last episode of care of discussion regarding the patient’s spiritual/ cultural/religious/practical needs with either patient or with the nominated person important to the patients (the red line shows the national 42%, 3886/9302)
Of the patients who had participated in such discussions (either directly or via a proxy), the spiritual/cultural/ religious/practical needs identified during the course of the discussion were ultimately met for 89% (3450/3886).
0
10
20
30
40
50
60
70
80
90
100
% d
iscu
ssed
with
pat
ient
or w
ith n
omin
ated
per
son
0 10 20 30 40 50 60 70 80 90 100
Number of patients
54 © Healthcare Quality Improvement Partnership 2016
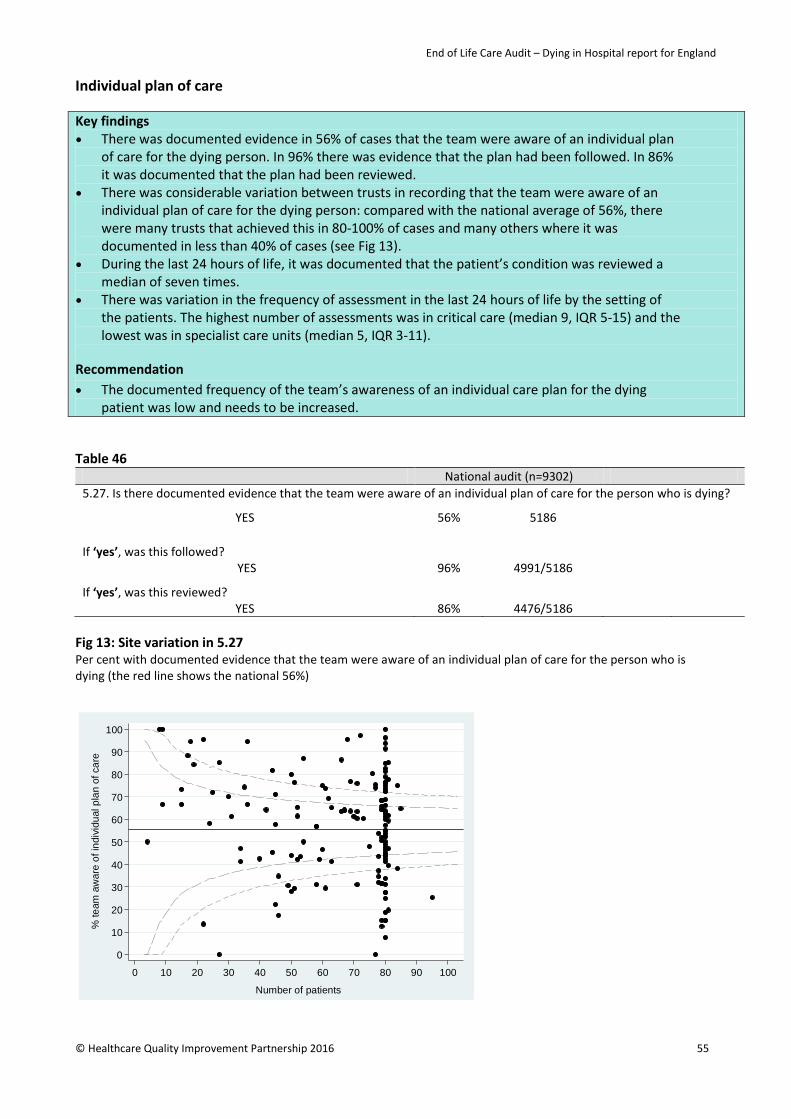
End of Life Care Audit – Dying in Hospital report for England
Individual plan of care Key findings • There was documented evidence in 56% of cases that the team were aware of an individual plan
of care for the dying person. In 96% there was evidence that the plan had been followed. In 86% it was documented that the plan had been reviewed.
• There was considerable variation between trusts in recording that the team were aware of an individual plan of care for the dying person: compared with the national average of 56%, there were many trusts that achieved this in 80-100% of cases and many others where it was documented in less than 40% of cases (see Fig 13).
• During the last 24 hours of life, it was documented that the patient’s condition was reviewed a median of seven times.
• There was variation in the frequency of assessment in the last 24 hours of life by the setting of the patients. The highest number of assessments was in critical care (median 9, IQR 5-15) and the lowest was in specialist care units (median 5, IQR 3-11).
Recommendation • The documented frequency of the team’s awareness of an individual care plan for the dying
patient was low and needs to be increased. Table 46
National audit (n=9302) 5.27. Is there documented evidence that the team were aware of an individual plan of care for the person who is dying?
YES 56% 5186 If ‘yes’, was this followed?
YES 96% 4991/5186
If ‘yes’, was this reviewed? YES 86% 4476/5186
Fig 13: Site variation in 5.27 Per cent with documented evidence that the team were aware of an individual plan of care for the person who is dying (the red line shows the national 56%)
0
10
20
30
40
50
60
70
80
90
100
% te
am a
war
e of
indi
vidu
al p
lan
of c
are
0 10 20 30 40 50 60 70 80 90 100
Number of patients
© Healthcare Quality Improvement Partnership 2016 55

End of Life Care Audit – Dying in Hospital report for England
Table 47 National audit (n=9302) 5.28. During the last 24 hours of the patient’s life, how many times was it documented that the patient’s condition was reviewed by a doctor or nurse?
Median (IQR) times reviewed 7 (4-11) 20-80th centile range 4-12 10-90th centile range 3-16
If sudden or unexpected deaths are excluded and the analysis is also restricted to cases where there was LOS ≥24 hours and there was recognition (1.1=yes), then this result (5.28) is revised to median (IQR) 7 (5-11), 20-80th centile range 4-12, 10-90th centile range 3-16, n=6327. 2013 audit: ‘During the last 24 hours of the patient’s life, how many clinical assessments by a doctor or nurse regarding the patient’s condition were documented?’ The overall result was in categories: <5 assessments 18%, 5-10 assessments 57%, 11-15 assessments 15%, 16-20 assessments 5.2%, 21-25 assessments 2.6%, 26-30 assessments 1.3% and >30 assessments 1.2%. If the current audit is restricted to those with known LOS ≥24 hours, the result for 5.28 was: <5 assessments 25%, 5-10 assessments 48%, 11-15 assessments 16%, 16-20 assessments 6.1%, 21-25 assessments 2.4%, 26-30 assessments 1.4% and >30 assessments 1.0%.
56 © Healthcare Quality Improvement Partnership 2016

End of Life Care Audit – Dying in Hospital report for England
Care immediately prior to and after death Key findings • There was documented evidence of care of the patient immediately prior to, or at the time of
death, in 73% of cases. • Immediately after death, care of the patient was recorded in 63% of cases. There was
considerable variation between trusts in the documentation of care of the patient immediately after death: compared with the national average of 63%, many trusts documented this occurring in 80-100% of cases, while others recorded it in less than 40% of cases (Fig 14).
Recommendation • The documentation that there was care of the patient immediately before and after death
(especially if there were special religious/cultural requirements) needs to be increased. Table 48
National audit (n=9302) 5.29. Is there documented evidence of care of the patient immediately prior to or at the time of death?
YES 73% 6774 5.30. Is there documented evidence of care of the patient immediately after death?
YES 63% 5815 2013 audit: ‘Is there documented evidence that the care of the body of the deceased was undertaken?’ The result was 46% of the overall sample. If the current audit is restricted to those with known LOS ≥24 hours, the result for 5.30 was 62% (4972/7997). Fig 14: Site variation in 5.30 Per cent with documented evidence of care of the patient immediately after death (the red line shows the national 63%)
0
10
20
30
40
50
60
70
80
90
100
% e
vide
nce
of c
are
imm
edia
tely
afte
r dea
th
0 10 20 30 40 50 60 70 80 90 100Number of patients
© Healthcare Quality Improvement Partnership 2016 57

End of Life Care Audit – Dying in Hospital report for England
Summary
An individual plan of care
Overall, 66% of case records showed that there had been a holistic assessment of the patient’s needs, with a view to producing an individual plan of care. If sudden deaths and cases where the patient had died less than 24 hours after admission were excluded, this rose to 73% of cases. There was a wide variation between trusts in this measure, with some sites undertaking holistic needs assessments in 90-100% of cases, while others reached less than a 30% achievement (Fig 7). The most commonly assessed needs were pressure areas (92%); hygiene requirements and bladder function (90%); pain (87%); and mouth care, bowel care and breathing difficulties (82%). The needs that were assessed in <80% of cases were agitation/delirium; nausea/vomiting; noisy breathing / death rattle; and anxiety/distress. In total, 31% of patients had been reviewed by a member of the trust specialist palliative care (SPC) team during the last admission; 23% had been reviewed by the SPC within the last 24 hours of life. Comparing sites with the SPC beds and those without specialist beds, there was a small difference in the SPC frequency of reviews, with 4% of extra reviews in the sites with the SPC beds. Of the key symptoms that could be present around the time of death, there was documented evidence that pain was controlled in 79% of cases; agitation/delirium in 72%; breathing difficulties in 68%; noisy breathing / death rattle in 62% and nausea/vomiting in 55%.
Medication
Compared with the 2013 audit, there were many more questions asked about the details of prescribing in the last days of life, in particular about the use of ‘prn’ or as required and anticipatory prescriptions, the use of patches and of continuous subcutaneous and intravenous infusions. The audit also searched for details of doses of drugs prescribed and actually given in the last 24 hours of life. However there were problems with the recording of some of the drugs on the audit data collection web tool. If results are restricted to those with known LOS ≥24 hours, there was documented evidence that anticipatory medication (prn) was prescribed for the key symptoms: for pain in 75% of cases; agitation/delirium 69%; breathing difficulties 66%; nausea/vomiting 66%; and noisy breathing / death rattle 62%. Overall and for those reporting symptoms, analgesics (painkillers) were prescribed for prn use in 86% of cases; antiemetics (for nausea and vomiting) in 79%; sedatives in 79%; and drugs for noisy breathing / death rattle in 71%. In the last 24 hours of life, 30% of patients were taking oral medications; 4% were having medication delivered via a patch; 24% were having medications via a subcutaneous infusion; 5% via an intravenous infusion; and 2% received rectal medication. With subcutaneous infusions, the frequency of prescribing was: painkillers in 86% of cases; sedatives 78%; antiemetics 54%; and death rattle 41%. With intravenous infusions, the frequencies were: painkillers 75%; sedatives 55%; antiemetics 4%; and death rattle 2%. In total, 65% of the medications that patients received had been reviewed in the last 24 hours of life. There was significant variation, with some trusts reviewing 90-100% and some reviewing less than 40%.
58 © Healthcare Quality Improvement Partnership 2016
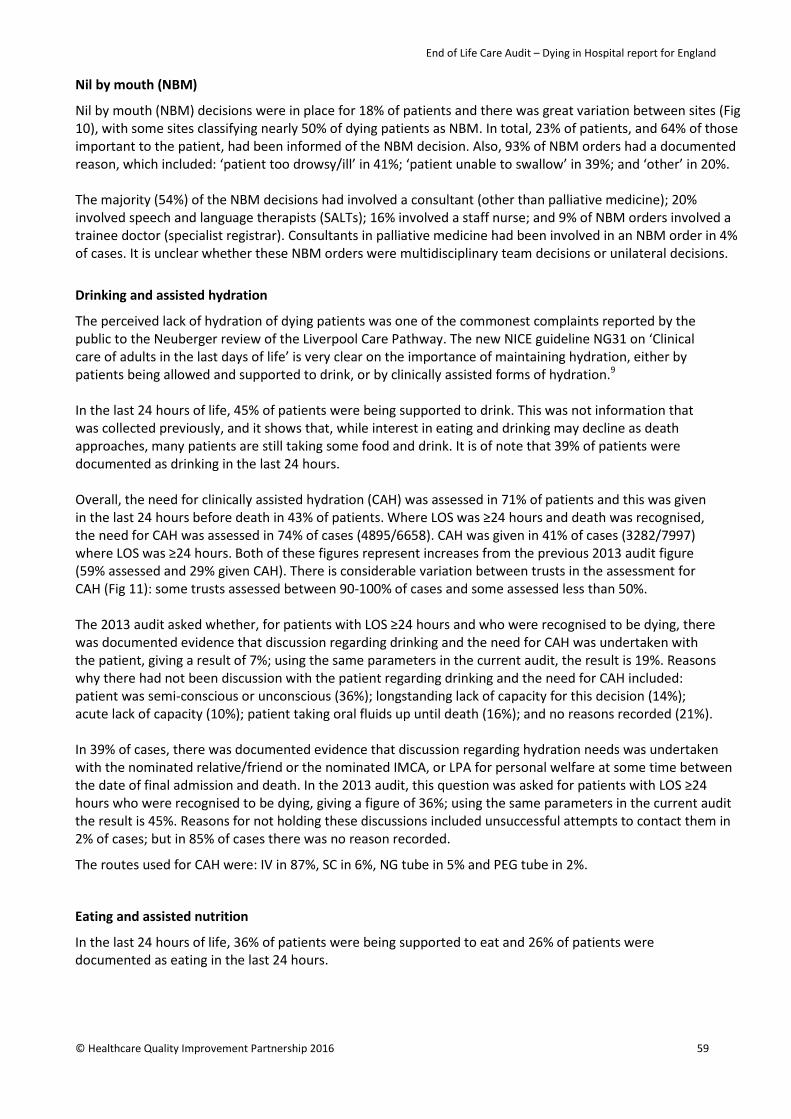
End of Life Care Audit – Dying in Hospital report for England
Nil by mouth (NBM)
Nil by mouth (NBM) decisions were in place for 18% of patients and there was great variation between sites (Fig 10), with some sites classifying nearly 50% of dying patients as NBM. In total, 23% of patients, and 64% of those important to the patient, had been informed of the NBM decision. Also, 93% of NBM orders had a documented reason, which included: ‘patient too drowsy/ill’ in 41%; ‘patient unable to swallow’ in 39%; and ‘other’ in 20%. The majority (54%) of the NBM decisions had involved a consultant (other than palliative medicine); 20% involved speech and language therapists (SALTs); 16% involved a staff nurse; and 9% of NBM orders involved a trainee doctor (specialist registrar). Consultants in palliative medicine had been involved in an NBM order in 4% of cases. It is unclear whether these NBM orders were multidisciplinary team decisions or unilateral decisions.
Drinking and assisted hydration
The perceived lack of hydration of dying patients was one of the commonest complaints reported by the public to the Neuberger review of the Liverpool Care Pathway. The new NICE guideline NG31 on ‘Clinical care of adults in the last days of life’ is very clear on the importance of maintaining hydration, either by patients being allowed and supported to drink, or by clinically assisted forms of hydration.9 In the last 24 hours of life, 45% of patients were being supported to drink. This was not information that was collected previously, and it shows that, while interest in eating and drinking may decline as death approaches, many patients are still taking some food and drink. It is of note that 39% of patients were documented as drinking in the last 24 hours. Overall, the need for clinically assisted hydration (CAH) was assessed in 71% of patients and this was given in the last 24 hours before death in 43% of patients. Where LOS was ≥24 hours and death was recognised, the need for CAH was assessed in 74% of cases (4895/6658). CAH was given in 41% of cases (3282/7997) where LOS was ≥24 hours. Both of these figures represent increases from the previous 2013 audit figure (59% assessed and 29% given CAH). There is considerable variation between trusts in the assessment for CAH (Fig 11): some trusts assessed between 90-100% of cases and some assessed less than 50%. The 2013 audit asked whether, for patients with LOS ≥24 hours and who were recognised to be dying, there was documented evidence that discussion regarding drinking and the need for CAH was undertaken with the patient, giving a result of 7%; using the same parameters in the current audit, the result is 19%. Reasons why there had not been discussion with the patient regarding drinking and the need for CAH included: patient was semi-conscious or unconscious (36%); longstanding lack of capacity for this decision (14%); acute lack of capacity (10%); patient taking oral fluids up until death (16%); and no reasons recorded (21%). In 39% of cases, there was documented evidence that discussion regarding hydration needs was undertaken with the nominated relative/friend or the nominated IMCA, or LPA for personal welfare at some time between the date of final admission and death. In the 2013 audit, this question was asked for patients with LOS ≥24 hours who were recognised to be dying, giving a figure of 36%; using the same parameters in the current audit the result is 45%. Reasons for not holding these discussions included unsuccessful attempts to contact them in 2% of cases; but in 85% of cases there was no reason recorded.
The routes used for CAH were: IV in 87%, SC in 6%, NG tube in 5% and PEG tube in 2%.
Eating and assisted nutrition
In the last 24 hours of life, 36% of patients were being supported to eat and 26% of patients were documented as eating in the last 24 hours.
© Healthcare Quality Improvement Partnership 2016 59

End of Life Care Audit – Dying in Hospital report for England
Restricting the analysis to patients with LOS ≥24 hours and those recognised to be dying, 62% of cases had documented evidence that the patient’s ability to eat had been assessed in the last 24 hours of life. This figure is essentially unchanged from the 2013 audit, which asked about ‘the patient’s ability to take oral nutrition’.
For 34% of patients, there was documented evidence that an assessment regarding the need for clinically assisted (artificial) nutrition (CAN) at any time between the time of the final admission and death had taken place. The comparative figure for the 2013 audit (for patients with LOS ≥24 hours and recognised to be dying) was 45%. Using the same parameters (LOS ≥24 hours and recognition of death), in the current audit the figure is 39%.
In 28% of cases, there was documented evidence that discussion regarding nutrition needs was undertaken with the nominated relative/friend or the nominated independent mental capacity advocate (IMCA), or LPA for personal welfare at some time between the date of final admission and death. In the 2013 audit, this question was asked for patients with LOS ≥24 hours and recognised to be dying, giving a figure of 29%; using the same parameters in the current audit the result is 33%. Reasons for not holding these discussions included unsuccessful attempts to contact them in 2%; but in 78% of cases there was no reason recorded.
Clinically assisted nutrition (CAN) was in place during the last 24 hours before death in 8% of patients. In the 2013 audit, this question was asked for patients with LOS ≥24 hours, giving a figure of 7%; using the same parameters in the current audit the result is again 8%. The routes used for CAN were: NG tube (67%); IV (20%); and PEG tube (13%).
Spiritual, cultural, religious and practical needs
There was documented evidence of discussion during the last episode of care regarding the patient’s spiritual/ cultural/religious/practical needs with 15% of patients who were capable of participating in such discussions. In a further 27%, there had been discussion with a nominated person important to the patient. In 56% of cases there had been no such discussions with the patient or with their nominated proxy.
In the 2013 audit, this question was asked for patients with LOS ≥24 hours and recognised to be dying, giving a result of 11%; using the same parameters in the current audit the result is 16%.
There was considerable variation between trusts with respect to the recording of these discussions with either the patient or the nominated person important to the patient: the national average was 42%, but many trusts recorded these for 60-100% of cases, while many also recorded them for less than 20% of cases (Fig 12). It was documented that in 89% of cases, the identified spiritual/cultural/religious/practical needs had been met.
Individual plan of care
Both the Neuberger review and the new NICE guideline NG319 have stressed the need for making individual care plans for dying patients. The NICE guidance also emphasises the need for the plan of care to be shared with the patient, those important to them and among the multiprofessional team. NICE NG31 recommends that the patient’s needs are reviewed regularly, and that the individual care plan is updated accordingly.
There was documented evidence in 56% of cases that the team were aware of an individual plan of care for the dying person. There was considerable variation between sites in recording that the team were aware of an individual plan of care for the dying person; compared with the national average of 56%, there were many trusts that achieved this in 80-100% of cases and many others where it was documented in less than 40% of cases (Fig 13). In 96% of cases there was evidence that the plan had been followed, and the plan was reviewed in 86%.
During the last 24 hours of life, it was documented that the patient’s condition was reviewed a median of seven times. This figure is unchanged if sudden or unexpected deaths are excluded, and where LOS was ≥24 hours and dying was recognised.
60 © Healthcare Quality Improvement Partnership 2016
End of Life Care Audit – Dying in Hospital report for England
In the 2013 audit, a different question was asked for patients with LOS ≥24 hours, ie the number of reviews were in categories of: <5 assessments; 5-10; 11-15; 16-20; 21-25; 26-30; >30 assessments. Comparing the 2013 audit with the current audit, there was very little difference in the reporting of these categories, with the category of <5 assessments rising from 18% in 2013 to 25% in 2015; and a fall in 5-10 assessments from 57% to 48%.
There was variation in the frequency of assessment in the last 24 hours of life by the setting of the patients. The highest number of assessments was in critical care (median 9, IQR 5-15) and the lowest was in specialist care units (median 5, IQR 3-11).
Care immediately prior to and after death
There was documented evidence of care of the patient immediately prior to, or at the time of, death in 73% of cases. The care of the patient immediately after death was recorded in 63% of cases. There was considerable variation between sites in the documentation of care of the patient immediately after death: compared with the national average of 63%, many sites documented that this occurred in 80-100% of cases, and many others recorded it in less than 40% (Fig 14).
© Healthcare Quality Improvement Partnership 2016 61

End of Life Care Audit – Dying in Hospital report for England
Results: Organisational audit Participation figures – organisational audit • In total, 142 sites submitted data for the organisational audit. • Three trusts each submitted data for two separate sites (due to recent mergers) (= 139 trusts). • Two sites that submitted data were community sites/trusts that wished to take part in the audit. The
community sites have been excluded from the participation figures (= 137 trusts). • Five trusts did not participate in the organisational audit, making the participation rate 96%
(137/142).
Temporal comparison with the previous organisational audit (2013)
The 2013 audit summarised responses from 131 trusts. Some of the questions asked in the 2013 audit are the same as the questions asked in this current audit, and some have only minor variation in wording, which should allow comparison. Where possible and as relevant, comparable results from the previous audit are inserted as a footnote below each table.
Section 1: Personnel responsible for submitting trust data for this audit Table 49 National audit (n=142) 1a. What is the discipline of the auditor completing the organisational audit data collection form? Clinical governance/audit staff 6% 9
Medical staff 44% 63 Nursing staff 23% 33 End of life care facilitator/team 20% 29 Data manager - - Other* 6% 8
*Other comprised: audit staff and lead palliative care consultant, clinical operational manager (specialist palliative), hospice practice development lead, MDT facilitator, medical and nursing staff, nursing and clinical governance staff, palliative care education lead, trust end of life care clinical lead. 2013 audit: clinical governance/audit staff (14%), medical staff (24%), nursing staff (24%), end of life care / Liverpool Care Pathway facilitator (25%), data manager (-) and other (12%). In total, 81% (115/142) of auditors completing the organisational audit data form were a member of the hospital specialist palliative care service (78% in the 2013 audit).
62 © Healthcare Quality Improvement Partnership 2016
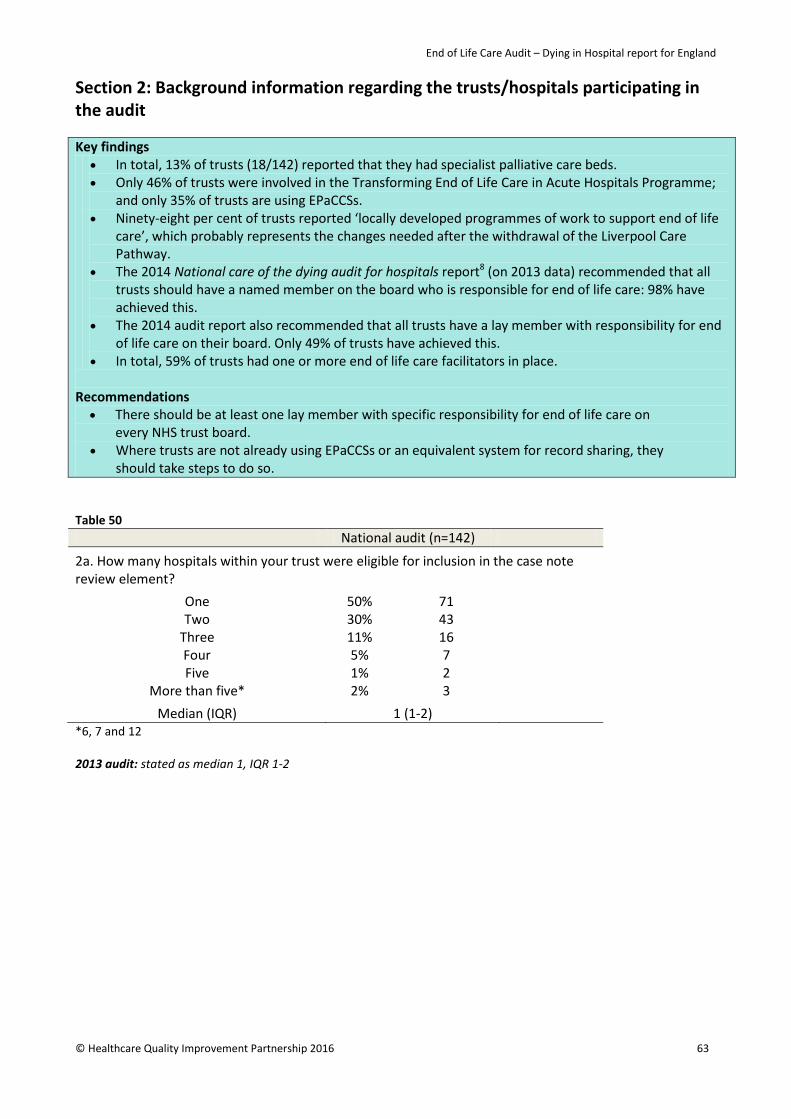
End of Life Care Audit – Dying in Hospital report for England
Section 2: Background information regarding the trusts/hospitals participating in the audit
Key findings • In total, 13% of trusts (18/142) reported that they had specialist palliative care beds. • Only 46% of trusts were involved in the Transforming End of Life Care in Acute Hospitals Programme;
and only 35% of trusts are using EPaCCSs. • Ninety-eight per cent of trusts reported ‘locally developed programmes of work to support end of life
care’, which probably represents the changes needed after the withdrawal of the Liverpool Care Pathway.
• The 2014 National care of the dying audit for hospitals report8 (on 2013 data) recommended that all trusts should have a named member on the board who is responsible for end of life care: 98% have achieved this.
• The 2014 audit report also recommended that all trusts have a lay member with responsibility for end of life care on their board. Only 49% of trusts have achieved this.
• In total, 59% of trusts had one or more end of life care facilitators in place.
Recommendations
• There should be at least one lay member with specific responsibility for end of life care on every NHS trust board.
• Where trusts are not already using EPaCCSs or an equivalent system for record sharing, they should take steps to do so.
Table 50 National audit (n=142)
2a. How many hospitals within your trust were eligible for inclusion in the case note review element?
One 50% 71
Two 30% 43 Three 11% 16 Four 5% 7 Five 1% 2
More than five* 2% 3
Median (IQR) 1 (1-2) *6, 7 and 12 2013 audit: stated as median 1, IQR 1-2
© Healthcare Quality Improvement Partnership 2016 63

End of Life Care Audit – Dying in Hospital report for England
Table 51 National audit (n=142) 2b. What types of bed, as well as numbers of each, did your trust have on 1 May 2015?
Median IQR Total • Medical 150 98-209 24095 • Surgical 172 107-244 25775 • Acute medical admissions unit 44 30-60 6762 • Rehabilitation 19 0-38 3564 • Oncology 9 0-30 2810 • Cardiology unit 26 12-42 4580 • Respiratory unit 28 3-51 4615 • Renal unit 0 0-22 1697 • Care of older people unit 68 14-118 10726 • Specialist palliative care unit 0 0-0 278 • Paediatric 40 23-61 6943 • Teenage and young adult unit 0 0-0 223 • Intensive care 16 11-28 3693 • Maternity 49 28-73 7882 • Other 23 0-50 6311
Total number of adult beds in the trust* 684 449-916 102788 *This field is calculated from figures entered in audit question 2b, excluding paediatrics and the teenage and young adult unit. The 278 specialist palliative care unit beds were from 13% (18/142) of trusts. A small number of trusts reported difficulty in separating out beds; in particular, overall the ‘medical’ bed number may overestimate the actual numbers, with specific types of medical bed being underestimated. In total, 46% (66/142) of trusts were involved in the Transforming End of Life Care in Acute Hospitals Programme. If the specialist hospital trusts are excluded then this gave 48% (65/136) of trusts that were involved in the programme. Fig 15: Which of the following are used within your trust?
2013 audit: ACP 55%, EPaCCS 21%, AMBER 19% and rapid discharge home to die care pathway 59%
64 © Healthcare Quality Improvement Partnership 2016
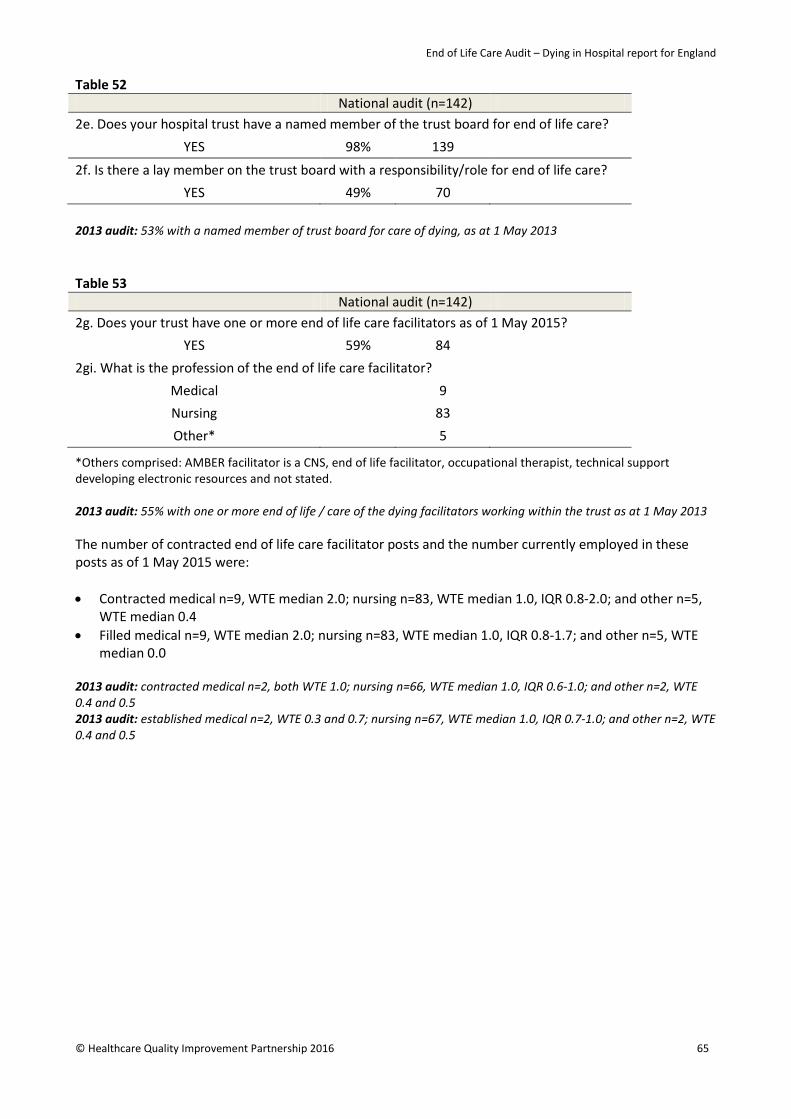
End of Life Care Audit – Dying in Hospital report for England
Table 52 National audit (n=142) 2e. Does your hospital trust have a named member of the trust board for end of life care?
YES 98% 139
2f. Is there a lay member on the trust board with a responsibility/role for end of life care? YES 49% 70
2013 audit: 53% with a named member of trust board for care of dying, as at 1 May 2013 Table 53 National audit (n=142) 2g. Does your trust have one or more end of life care facilitators as of 1 May 2015?
YES 59% 84 2gi. What is the profession of the end of life care facilitator?
Medical 9 Nursing 83 Other* 5
*Others comprised: AMBER facilitator is a CNS, end of life facilitator, occupational therapist, technical support developing electronic resources and not stated. 2013 audit: 55% with one or more end of life / care of the dying facilitators working within the trust as at 1 May 2013 The number of contracted end of life care facilitator posts and the number currently employed in these posts as of 1 May 2015 were: • Contracted medical n=9, WTE median 2.0; nursing n=83, WTE median 1.0, IQR 0.8-2.0; and other n=5,
WTE median 0.4 • Filled medical n=9, WTE median 2.0; nursing n=83, WTE median 1.0, IQR 0.8-1.7; and other n=5, WTE
median 0.0 2013 audit: contracted medical n=2, both WTE 1.0; nursing n=66, WTE median 1.0, IQR 0.6-1.0; and other n=2, WTE 0.4 and 0.5 2013 audit: established medical n=2, WTE 0.3 and 0.7; nursing n=67, WTE median 1.0, IQR 0.7-1.0; and other n=2, WTE 0.4 and 0.5
© Healthcare Quality Improvement Partnership 2016 65
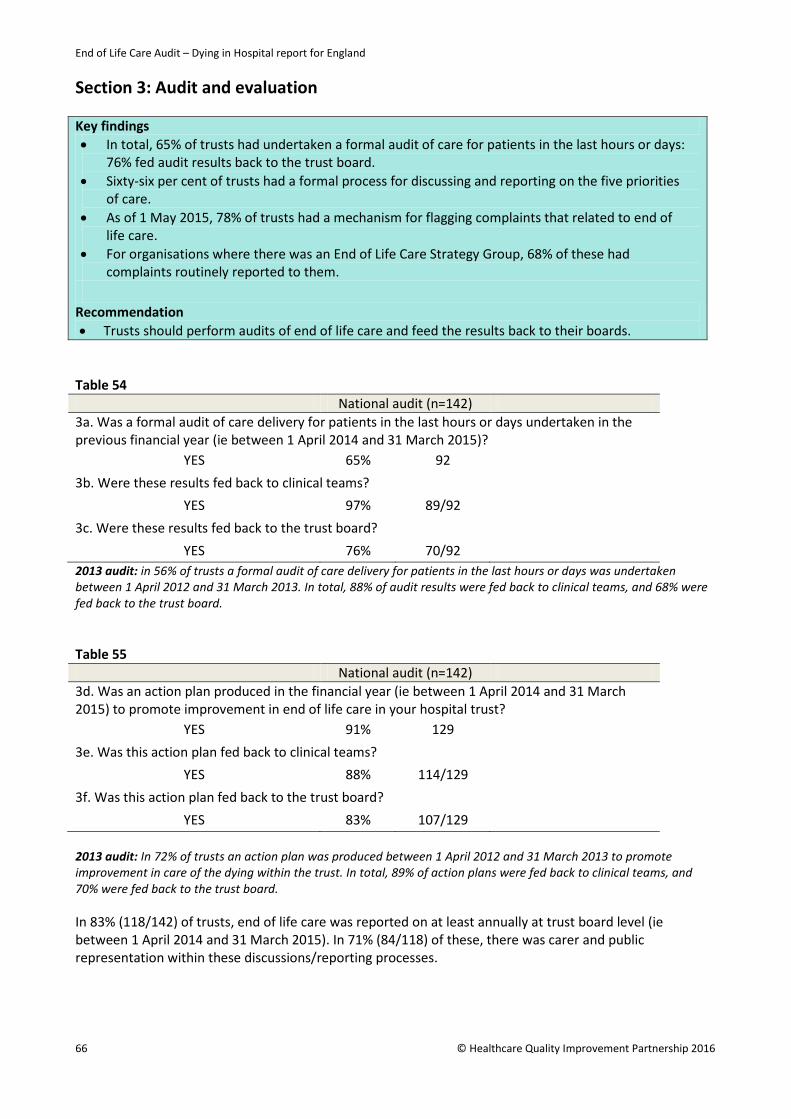
End of Life Care Audit – Dying in Hospital report for England
Section 3: Audit and evaluation Key findings • In total, 65% of trusts had undertaken a formal audit of care for patients in the last hours or days:
76% fed audit results back to the trust board. • Sixty-six per cent of trusts had a formal process for discussing and reporting on the five priorities
of care. • As of 1 May 2015, 78% of trusts had a mechanism for flagging complaints that related to end of
life care. • For organisations where there was an End of Life Care Strategy Group, 68% of these had
complaints routinely reported to them.
Recommendation • Trusts should perform audits of end of life care and feed the results back to their boards.
Table 54 National audit (n=142) 3a. Was a formal audit of care delivery for patients in the last hours or days undertaken in the previous financial year (ie between 1 April 2014 and 31 March 2015)?
YES 65% 92 3b. Were these results fed back to clinical teams?
YES 97% 89/92 3c. Were these results fed back to the trust board?
YES 76% 70/92 2013 audit: in 56% of trusts a formal audit of care delivery for patients in the last hours or days was undertaken between 1 April 2012 and 31 March 2013. In total, 88% of audit results were fed back to clinical teams, and 68% were fed back to the trust board. Table 55 National audit (n=142) 3d. Was an action plan produced in the financial year (ie between 1 April 2014 and 31 March 2015) to promote improvement in end of life care in your hospital trust?
YES 91% 129 3e. Was this action plan fed back to clinical teams?
YES 88% 114/129 3f. Was this action plan fed back to the trust board?
YES 83% 107/129 2013 audit: In 72% of trusts an action plan was produced between 1 April 2012 and 31 March 2013 to promote improvement in care of the dying within the trust. In total, 89% of action plans were fed back to clinical teams, and 70% were fed back to the trust board. In 83% (118/142) of trusts, end of life care was reported on at least annually at trust board level (ie between 1 April 2014 and 31 March 2015). In 71% (84/118) of these, there was carer and public representation within these discussions/reporting processes.
66 © Healthcare Quality Improvement Partnership 2016
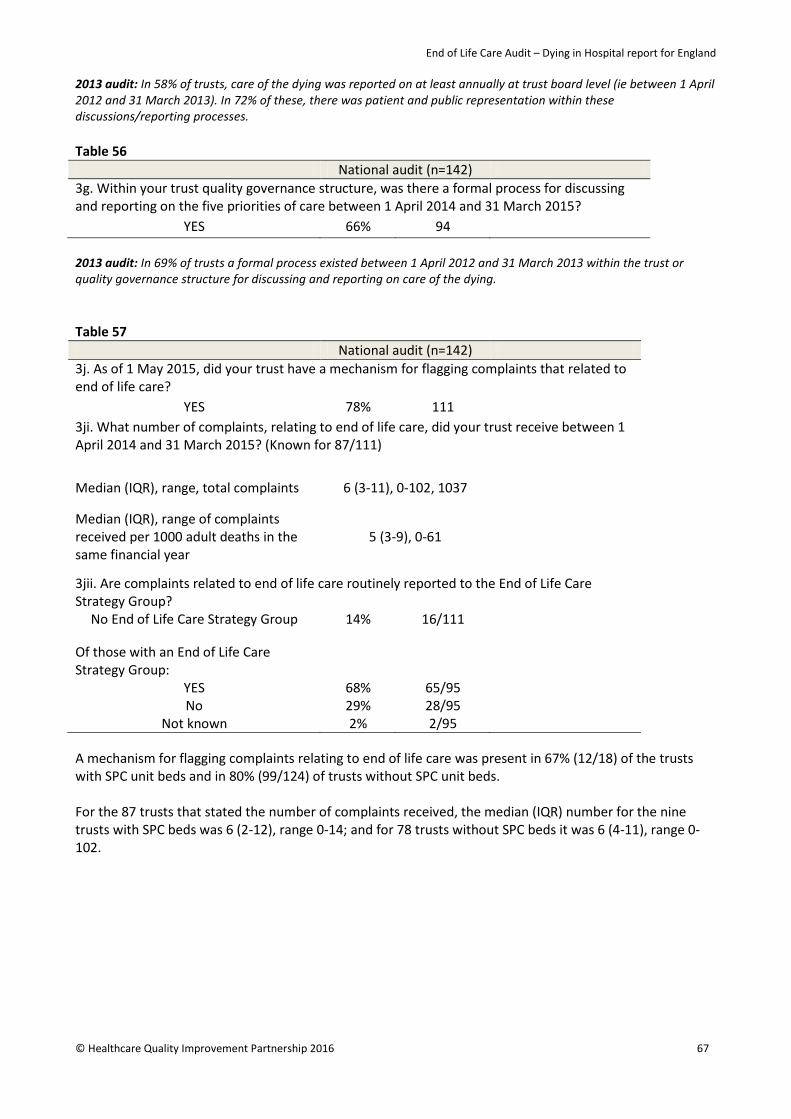
End of Life Care Audit – Dying in Hospital report for England
2013 audit: In 58% of trusts, care of the dying was reported on at least annually at trust board level (ie between 1 April 2012 and 31 March 2013). In 72% of these, there was patient and public representation within these discussions/reporting processes. Table 56 National audit (n=142) 3g. Within your trust quality governance structure, was there a formal process for discussing and reporting on the five priorities of care between 1 April 2014 and 31 March 2015?
YES 66% 94 2013 audit: In 69% of trusts a formal process existed between 1 April 2012 and 31 March 2013 within the trust or quality governance structure for discussing and reporting on care of the dying. Table 57 National audit (n=142) 3j. As of 1 May 2015, did your trust have a mechanism for flagging complaints that related to end of life care?
YES 78% 111 3ji. What number of complaints, relating to end of life care, did your trust receive between 1 April 2014 and 31 March 2015? (Known for 87/111)
Median (IQR), range, total complaints 6 (3-11), 0-102, 1037
Median (IQR), range of complaints received per 1000 adult deaths in the same financial year
5 (3-9), 0-61
3jii. Are complaints related to end of life care routinely reported to the End of Life Care Strategy Group?
No End of Life Care Strategy Group 14% 16/111
Of those with an End of Life Care Strategy Group:
YES 68% 65/95 No 29% 28/95
Not known 2% 2/95 A mechanism for flagging complaints relating to end of life care was present in 67% (12/18) of the trusts with SPC unit beds and in 80% (99/124) of trusts without SPC unit beds. For the 87 trusts that stated the number of complaints received, the median (IQR) number for the nine trusts with SPC beds was 6 (2-12), range 0-14; and for 78 trusts without SPC beds it was 6 (4-11), range 0-102.
© Healthcare Quality Improvement Partnership 2016 67

End of Life Care Audit – Dying in Hospital report for England
Section 4a: Trust demographics as at 1 May 2015
Key findings • In total, 78% of trusts stated that they gave leaflets to families and those important to dying patients
about what to expect. Leaflets were used after the patient died in 97% of cases. Recommendation • Information about coping with dying and what to do after death should be available in a variety of
formats. Table 58 National audit (n=142)
Median (IQR) Total
4a. Number of adult beds in the trust 684 (449-916) 102788, n=142
4b. Number of adult single patient occupancy rooms in the trust per 100 adult beds* 22 (15-28) 23467, n=139
4c. Number of all adult deaths occurring in the previous financial year (ie 1 April 2014 to 31 March 2015) per 100 adult beds 206 (172-228) 202407, n=142
4d. Number of all adult deaths occurring in the national data collection period (ie 1 May 2015 to 31 May 2015) per 100 adult beds 16 (14-19) 16520, n=142
4e. Number of all adult deaths meeting the audit inclusion/exclusion criteria, occurring in the national data collection period (ie 1 May 2015 to 31 May 2015) in those hospitals that submitted data to the case note review, per 100 adult beds
14 (12-17) 14498, n=142
*Note that trusts had particular difficulty in obtaining accurate numbers of adult single occupancy rooms (4b)
Section 4b: Supportive information for those important to patients Table 59
National audit (n=142)
4f. Does your trust give the following written information to families and those people that are important to the patient while the patient is dying and when the patient has died?
• A leaflet outlining the changes that may occur in patients in the hours before death (eg the Coping with dying or What to expect when someone important to you is dying leaflets or equivalent)
78% 111
• A leaflet explaining local procedures to be undertaken after the death of a patient (for relatives or friends)
97% 138
• Department for Work and Pensions (DWP) leaflet 1027, What to do after a death in England and Wales or equivalent?
90% 128
2013 audit: 90% of trusts gave a leaflet outlining the changes that may occur in patients in the hours before death. Note that the specific reference to the two example documents was not given in the 2013 audit nor was the reference ‘for families and those people that are important to them’. Seventy-six per cent gave A leaflet explaining local procedures to be undertaken after the death of a patient and 91% gave the Department for Work and Pensions (DWP) leaflet 1027 What to do after a death in England and Wales or equivalent.
68 © Healthcare Quality Improvement Partnership 2016

End of Life Care Audit – Dying in Hospital report for England
Section 5: Availability of trust-wide continuing education and training Key findings
• In total, 96% of trusts had a formal in-house continuing education programme on the subject of end of life care.
• Formal in-house, communication skills training was available for 71% of registered nurses, 63% of medical staff, 62% of non-registered nurses and 49% of allied health professionals.
Recommendation • All medical and nursing staff with responsibility for the care of dying people should attend
communication skills training specifically on care in the last days/hours of life, and this should be recorded in their portfolios.
Education and training on care of the dying
Question 5a: Between 1 April 2014 and 31 March 2015 there was a formal in-house continuing education training programme on the subject of end of life care in place at 96% (136/142) of trusts. 2013 audit: 82% had a formal in-house continuing education training programme on the subject of care of the dying during the financial year 1 April 2012 to 31 March 2013. Table 60 National audit (n=136) 5b. In the period between 1 April 2014 and 31 March 2015, what continuing education and training was available for the following staff groups?
Medical 1 April 2014 to 31 March 2015
1 April 2012 to 31 March 2013*
• E-learning 47% 64 54% • Update session (every 6-12 months) 68% 93 63% • Session in trust mandatory training 22% 30 19% • Session in trust induction programme 58% 79 51%
Nursing – registered** • E-learning 51% 70 54% • Update session (every 6-12 months) 70% 95 69% • Session in trust mandatory training 29% 39 28% • Session in trust induction programme 63% 86 52%
Nursing – non-registered • E-learning 46% 63 53% • Update session (every 6-12 months) 64% 87 60% • Session in trust mandatory training 24% 32 23% • Session in trust induction programme 52% 71 45%
Allied health professionals • E-learning 44% 60 52% • Update session (every 6-12 months) 53% 72 50% • Session in trust mandatory training 19% 26 20% • Session in trust induction programme 34% 46 29%
Other • E-learning 33% 45 Not asked • Update session (every 6-12 months) 39% 53 Not asked • Session in trust mandatory training 15% 20 Not asked • Session in trust induction programme 26% 35 Not asked
*As per the 2013 audit. **The 2013 audit used the term ‘qualified’ rather than ‘registered’.
© Healthcare Quality Improvement Partnership 2016 69

End of Life Care Audit – Dying in Hospital report for England
Fig 16: Between 1 April 2014 and 31 March 2015, did this formal in-house training include/cover specifically communication skills training for care in the last hours or days of life for the following staff? (Audit question 5c.)
2013 audit: medical 61%, nursing qualified 69%, nursing non-qualified 56% and allied health professionals 48%.
Note that the above percentages are based on a question 5a=Yes denominator, unlike the quality indicator results in the executive summary which take all sites as the denominator. Overall, formal in-house, communication skills training was available for 71% of registered nurses, 63% of medical staff, 62% of non-registered nurses and 49% of allied health professionals.
70 © Healthcare Quality Improvement Partnership 2016
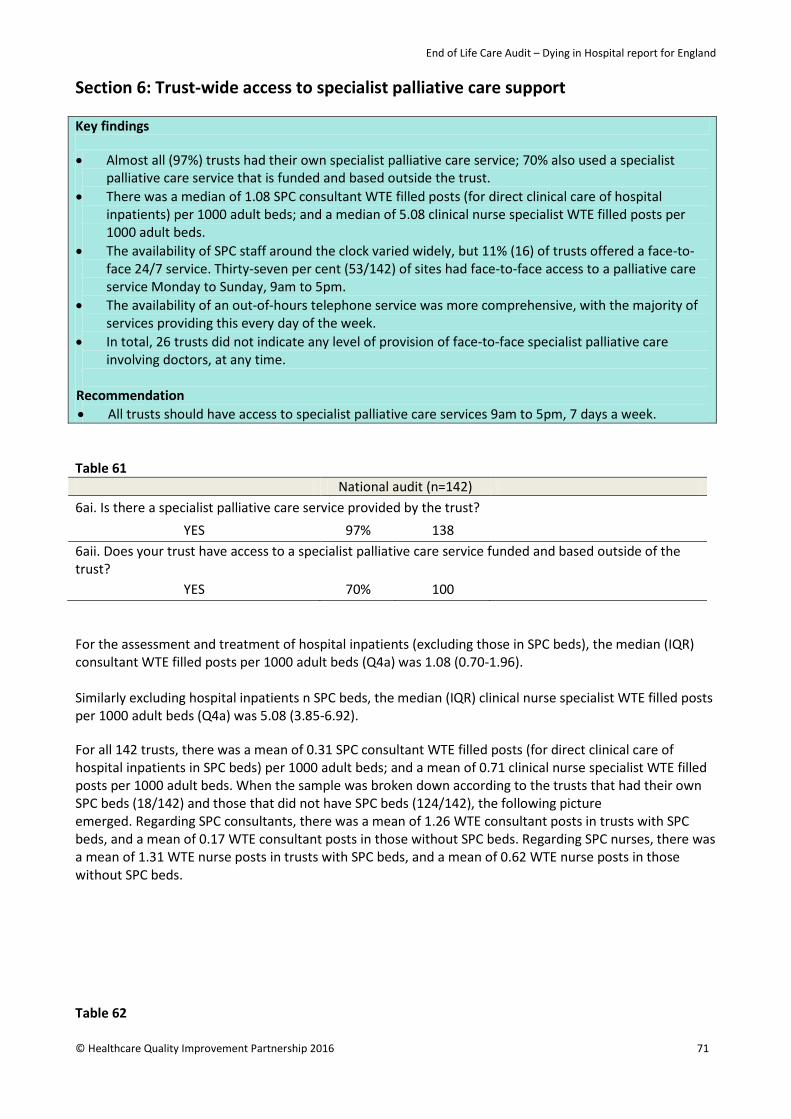
End of Life Care Audit – Dying in Hospital report for England
Section 6: Trust-wide access to specialist palliative care support Key findings
• Almost all (97%) trusts had their own specialist palliative care service; 70% also used a specialist palliative care service that is funded and based outside the trust.
• There was a median of 1.08 SPC consultant WTE filled posts (for direct clinical care of hospital inpatients) per 1000 adult beds; and a median of 5.08 clinical nurse specialist WTE filled posts per 1000 adult beds.
• The availability of SPC staff around the clock varied widely, but 11% (16) of trusts offered a face-to-face 24/7 service. Thirty-seven per cent (53/142) of sites had face-to-face access to a palliative care service Monday to Sunday, 9am to 5pm.
• The availability of an out-of-hours telephone service was more comprehensive, with the majority of services providing this every day of the week.
• In total, 26 trusts did not indicate any level of provision of face-to-face specialist palliative care involving doctors, at any time.
Recommendation • All trusts should have access to specialist palliative care services 9am to 5pm, 7 days a week.
Table 61 National audit (n=142) 6ai. Is there a specialist palliative care service provided by the trust?
YES 97% 138 6aii. Does your trust have access to a specialist palliative care service funded and based outside of the trust?
YES 70% 100 For the assessment and treatment of hospital inpatients (excluding those in SPC beds), the median (IQR) consultant WTE filled posts per 1000 adult beds (Q4a) was 1.08 (0.70-1.96). Similarly excluding hospital inpatients n SPC beds, the median (IQR) clinical nurse specialist WTE filled posts per 1000 adult beds (Q4a) was 5.08 (3.85-6.92). For all 142 trusts, there was a mean of 0.31 SPC consultant WTE filled posts (for direct clinical care of hospital inpatients in SPC beds) per 1000 adult beds; and a mean of 0.71 clinical nurse specialist WTE filled posts per 1000 adult beds. When the sample was broken down according to the trusts that had their own SPC beds (18/142) and those that did not have SPC beds (124/142), the following picture emerged. Regarding SPC consultants, there was a mean of 1.26 WTE consultant posts in trusts with SPC beds, and a mean of 0.17 WTE consultant posts in those without SPC beds. Regarding SPC nurses, there was a mean of 1.31 WTE nurse posts in trusts with SPC beds, and a mean of 0.62 WTE nurse posts in those without SPC beds.
Table 62
© Healthcare Quality Improvement Partnership 2016 71

End of Life Care Audit – Dying in Hospital report for England
National audit (n=142) 6c. Please indicate the level of face-to-face specialist palliative care service in your trust (applicable as at 1 May 2015).
Doctor Nurse
24 hours per day, 7 days per week 13 9 9-5, 7 days a week 3 38 9-5, Mon to Sat only, exceptionally 7 days if required - 1 9-5, Mon to Sat only - 8 9-5, Mon to Fri only, exceptionally 7 days if required 36 8 9-5, Mon to Fri only, exceptionally Sat if required 4 - 9-5, Mon to Fri only 56 77 Exceptionally 7 days if required 4 - Exceptionally Sat if required - 1 None of these 26 -
To aid interpretation and to simplify matters in further analyses, the level of face-to-face options were reclassified as: none; Monday to Friday, 9am to 5pm only; more than Monday to Friday, 9am to 5pm but not 24/7; and 24/7. The last two ‘exceptionally’ options (n=5) were omitted from this classification, as their meaning was unclear. Thirty-seven per cent (53/142) of sites had face-to-face access to a palliative care service Monday to Sunday, 9am to 5pm.
Table 63
National audit (n=142) 6c. Level of out-of-hours (telephone) specialist palliative care service in the trust (applicable as at 1 May 2015)
Yes Exceptionally No Out-of-hours telephone service (Monday to Friday) • Doctor 127 NA 15 • Nurse 84 NA 58
Out-of-hours telephone service (Saturday) • Doctor 124 6 12 • Nurse 89 3 50
Out-of-hours telephone service (Sunday) • Doctor 124 6 12 • Nurse 86 4 52
2013 audit: The question about out-of-hours telephone service was asked differently, in that there was no split by doctor/nurse nor by day of the week. In all, 91% had an out-of-hours telephone service available as at 1 May 2013. The availability of SPC staff around the clock varied widely, but only a minority of trusts offered an out-of-hours or a 24/7 service. Specifically, combining doctor and/or nurse availability (ie considering when one or other was available) then 11% (16/142) of trusts offered a 24/7 service, 49% (70/142) offered a better than Monday to Friday, 9am to 5pm service but not a 24/7 service, while 39% (56/142) offered only a Monday to Friday, 9am to 5pm service.
Trusts that had an SPC bedded unit were more likely to have a higher level of out-of-hours doctor service for dying patients.
72 © Healthcare Quality Improvement Partnership 2016
End of Life Care Audit – Dying in Hospital report for England
The 18 trusts that had an SPC bedded unit were more likely to have a higher level of out-of-hours doctor service for dying patients: 22% (3) offered a 24/7 service; 56% (10) offered a more than Monday to Friday, 9am to 5pm but not a 24/7 service; 22% (3) had a Monday to Friday, 9am to 5pm only service; and none had no face-to-face doctor service.
© Healthcare Quality Improvement Partnership 2016 73

End of Life Care Audit – Dying in Hospital report for England
Section 7: Trust-wide clinical provisions and protocols Key findings • In total, 99-100% of trusts stated that they had guidance on prescribing medications for each of the
five key symptoms that can be present in patients in the last days/hours of life. • Most trusts had policies for ensuring patient comfort and dignity, and for offering family and friends
access to the body after death and a prayer room (Fig 17). • All trusts reported that they had a policy for recording DNACPR decisions, while 80% had a policy for
the deactivation of implantable cardioverter defibrillators (ICDs). Seventy-five per cent reported that they had designated quiet spaces for relatives.
• There was a wide variation between trusts on support services for people important to the dying patient (Fig 18) and for staff and volunteers (Fig 19).
Recommendation • Trusts should provide protocols to ensure provision of patient comfort, dignity and privacy up to,
including and after the death of the patient.
Table 64 National audit (n=142)
7a. Guidance for the prescription of medications for patients in the last hours or days of life: • Agitation/delirium 100% 142 • Dyspnoea / breathing difficulty 100% 142 • Nausea/vomiting 100% 142 • Pain 99% 141 • Noisy breathing / death rattle 99% 141
2013 audit: Protocols for the prescription of medications for patients’ symptoms at the end of life: pain 99%, agitation 99%, noisy breathing 99%, nausea and vomiting 99%, and dyspnoea 98%.
Fig 17: Prevalence of trust-wide clinical provisions and protocols promoting patient comfort, dignity and privacy – up to, including and after the death of the patient (questions 7b-7j)
2013 audit: clinical provision/protocols up to and including after the death of the patient: pastoral care/chaplaincy 70%, for decision and documentation of a DNACPR order 100%, for the deactivation of ICDs 75%, for carrying out care of the body in the immediate time after the death of a patient 96%, for providing relatives/friends regarding the verification and certification of the patient’s death 85%, for viewing the body in the immediate time after the death of a patient 82%, designated formal quiet spaces available for relatives/friends 64% and designated religious/spiritual rooms 100%.
74 © Healthcare Quality Improvement Partnership 2016

End of Life Care Audit – Dying in Hospital report for England
Fig 18: Please state what support processes are available in the trust for people important to the dying patient (question 7k)
Note also that a question was asked about access to ‘PALS volunteers / Patient Support Services / Patient Experience Team’ and while this was intended to refer to access for people important to the dying patient, this question was inadvertently worded on the web tool as referring to staff and volunteers. Consequently, this was omitted from the analysis. Fig 19: Please state what support processes are available in the trust to staff and volunteers (question 7k)
© Healthcare Quality Improvement Partnership 2016 75
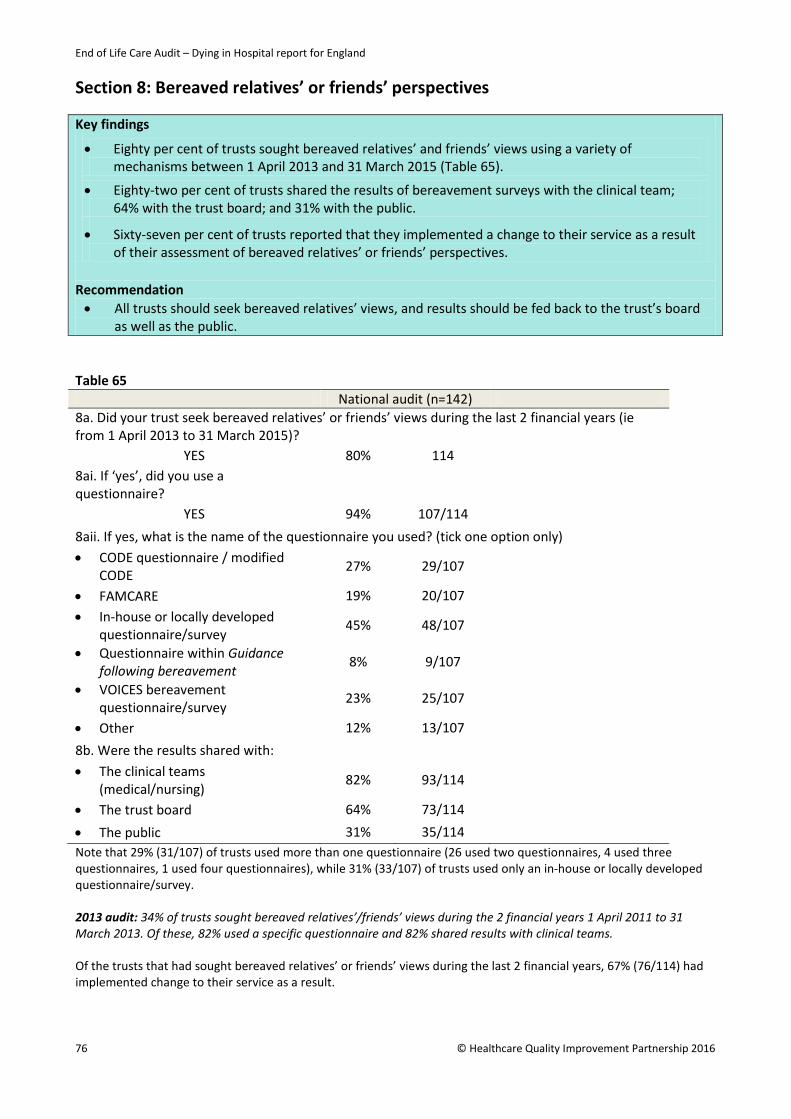
End of Life Care Audit – Dying in Hospital report for England
Section 8: Bereaved relatives’ or friends’ perspectives Key findings
• Eighty per cent of trusts sought bereaved relatives’ and friends’ views using a variety of mechanisms between 1 April 2013 and 31 March 2015 (Table 65).
• Eighty-two per cent of trusts shared the results of bereavement surveys with the clinical team; 64% with the trust board; and 31% with the public.
• Sixty-seven per cent of trusts reported that they implemented a change to their service as a result of their assessment of bereaved relatives’ or friends’ perspectives.
Recommendation • All trusts should seek bereaved relatives’ views, and results should be fed back to the trust’s board
as well as the public. Table 65 National audit (n=142) 8a. Did your trust seek bereaved relatives’ or friends’ views during the last 2 financial years (ie from 1 April 2013 to 31 March 2015)?
YES 80% 114 8ai. If ‘yes’, did you use a questionnaire?
YES 94% 107/114 8aii. If yes, what is the name of the questionnaire you used? (tick one option only) • CODE questionnaire / modified
CODE 27% 29/107
• FAMCARE 19% 20/107 • In-house or locally developed
questionnaire/survey 45% 48/107
• Questionnaire within Guidance following bereavement 8% 9/107
• VOICES bereavement questionnaire/survey
23% 25/107
• Other 12% 13/107 8b. Were the results shared with: • The clinical teams
(medical/nursing) 82% 93/114
• The trust board 64% 73/114 • The public 31% 35/114 Note that 29% (31/107) of trusts used more than one questionnaire (26 used two questionnaires, 4 used three questionnaires, 1 used four questionnaires), while 31% (33/107) of trusts used only an in-house or locally developed questionnaire/survey. 2013 audit: 34% of trusts sought bereaved relatives’/friends’ views during the 2 financial years 1 April 2011 to 31 March 2013. Of these, 82% used a specific questionnaire and 82% shared results with clinical teams. Of the trusts that had sought bereaved relatives’ or friends’ views during the last 2 financial years, 67% (76/114) had implemented change to their service as a result.
76 © Healthcare Quality Improvement Partnership 2016

End of Life Care Audit – Dying in Hospital report for England
Summary of organisational audit results Background information
In total, 98% (139/142) of trusts reported ‘locally developed programmes of work to support end of life care’. This probably represents the need for local initiatives after the use of the Liverpool Care Pathway ceased in 2014. Forty-six per cent (66/142) of trusts were involved in the Transforming End of Life Care in Acute Hospitals Programme. EPaCCs was used by 35% (50/142) of trusts, which has increased from the 21% reported for 2013. The ambition of the National Information Board is for national roll-out of EPaCCs by 100% of providers by 2020.
The 2013 audit recommended that all trusts should have a named member on the board who is responsible for end of life care, and 98% (139/142) of trusts have achieved this. It also recommended that trusts should have a lay member with responsibility for end of life care on their board. Only 49% (70/142) of trusts achieved this.
As of 1 May 2015, 59% (84/142) of trusts had one or more end of life care facilitators in place, compared with 55% on 1 May 2013.
Audit, evaluation and complaints procedures
A formal audit of care for patients in the last hours or days had been undertaken by 65% (92/142) of trusts between 1 April and 31 March 2015. In the 2013 audit, it was reported as 56% for the period 1 April 2012 to March 2013. In total, 76% (70/92) of trusts had fed back the audit results to their trust board, compared with 68% in the 2013 audit.
The uptake of a formal process for discussing and reporting on the five priorities of care was 66% (94/142).
In 83% (118/142) of trusts, end of life care was reported on at least annually at trust board level (ie between 1 April 2014 and 31 March 2015). In 71% (84/118) of these, there was carer and public representation within these discussions/reporting processes. In the 2013 audit, 58% of trusts reported on care of the dying at least annually at trust board level (ie between 1 April 2012 and 31 March 2013); and in 72% of these, there was patient and public representation.
As of 1 May 2015, 78% (111/142) of trusts had a mechanism for flagging complaints that related to end of life care. For organisations where there was an End of Life Care Strategy Group, only 68% (65/95) of these had complaints routinely reported to them. Having SPC beds did not appear to influence the trusts having a mechanism for reporting complaints about end of life care.
Trust bed composition and mortality rates as at 1 May 2015
The 142 participating trusts reported having a total of 102788 beds; the median (IQR) number of beds (excluding paediatrics and teenage and young adult unit beds) per trust was 684 (449-916). Participating trusts had a median of 22 single beds per 100 adult care beds.
Out of the 142 sites, 18 (13%) had their own specialist palliative care (SPC) bedded units. These contained a total of 278 SPC beds, representing 0.27% (278/102,788) of all the hospital beds.
Trusts reported a median of 206 deaths per 100 adult care beds in the whole financial year of 2014-2015, and a median of 16 deaths per 100 adult care beds during the national data collection period. Of these, a median of 14 deaths per 100 adult care beds met the audit inclusion/exclusion criteria.
© Healthcare Quality Improvement Partnership 2016 77

End of Life Care Audit – Dying in Hospital report for England
Giving out supportive information
In total, 78% (111/142) of trusts stated that they gave leaflets to families and those important to dying patients about what to expect before death; this compared with 90% in the 2013 audit. Use of leaflets explaining local procedures after a patient had died was 97% (138/142).
Note that the Department for Work and Pensions (DWP) leaflet 1027 What to do after a death in England and Wales was withdrawn from use on 3 September 2015. Information can now be found on www.gov.uk (‘What to do after someone dies’) and it is likely that trusts will increasingly direct families to this resource, but printed leaflets will still be needed for specific populations.
Availability of trust-wide continuing education and training
In total, 96% (136/142) of trusts had a formal in-house continuing education programme on the subject of end of life care. There were variations between trusts in the provision of education programmes by different mechanisms and for different staff groups. Across the staff groups, there was a slight reduction (3-8%) in e-learning since the 2013 audit and an increase (5-11%) in education via induction programme. Twenty-two per cent (30/136) of trusts provided mandatory training sessions on end of life care to doctors, 29% (39/136) to registered nurses and 24% (32/136) to non-registered nurses. There were no significant differences in the provision of such training for these staff groups from the 2013 audit.
With respect to communication skills training specifically on care in the last days and hours of life, there was a small trend towards increased training since 2013, with 74% (101/136) of trusts offering this to registered nurses; 65% (89/136) to medical staff; 65% (88/136) to non-registered nurses and 51% (70/136) to allied health professionals from 1 April 2014 to 31 March 2015.
Trust-wide access to specialist palliative care support
Almost all (97%, 138/142) trusts had their own specialist palliative care service; 70% (100/142) also used a specialist palliative care service that is funded and based outside the trust.
For all 142 trusts, there was a mean of 0.31 SPC consultant WTE filled posts (for direct clinical care of hospital inpatients in SPC beds) per 1000 adult beds; and a mean of 0.71 clinical nurse specialist WTE filled posts per 1000 adult beds. When the sample was broken down according to the trusts that had their own SPC beds (18/142) and those that did not have SPC beds (124/142), the following picture emerged. Regarding SPC consultants, there was a mean of 1.26 WTE consultant posts in trusts with SPC beds, and a mean of 0.17 WTE consultant posts in those without SPC beds. Regarding SPC nurses, there was a mean of 1.31 WTE nurse posts in trusts with SPC beds, and a mean of 0.62 WTE nurse posts in those without SPC beds. The availability of SPC staff around the clock varied widely, but only a minority of trusts offered an out-of-hours or a 24/7 service. Specifically, combining doctor and/or nurse availability (ie considering when one or other was available) then 11% (16/142) of trusts offered a face-to-face 24/7 service, 49% (70/142) offered a better than Monday to Friday, 9am to 5pm service but not a 24/7 service, while 39% (56/142) offered only a Monday to Friday, 9am to 5pm service. Thirty-seven per cent (53/142) of sites had face-to-face access to a palliative care service Monday to Sunday, 9am to 5pm.
The 18 trusts that had an SPC bedded unit were more likely to have a higher level of out-of-hours doctor service for dying patients. Doctors more frequently offered an ‘out of hours’ telephone service than nurses.
In total, 18% (26/142) of trusts did not indicate any level of provision of face-to-face specialist palliative care by doctors at any time.
These findings should be considered in the context of the new NICE guideline for ‘Clinical care of adults in the last days of life’ (NG31, December 2015),9 where recommendations are made about access to specialist level of help and advice for healthcare professionals working with dying people. In the section on ‘Shared decision-making’, the guidance states:
78 © Healthcare Quality Improvement Partnership 2016

End of Life Care Audit – Dying in Hospital report for England
1.3.3 Identify a named lead healthcare professional, who is responsible for encouraging shared decision-making in the person’s last days of life. The named healthcare professional should give information about how they can be contacted and contact details for relevant out-of-hours services to the dying person and those important to them.
1.3.9 Ensure that shared decision-making can be supported by experienced staff at all times. Seek further specialist advice if additional support is needed.
Under the section ‘Pharmacological interventions’, the NICE guideline states:
1.5.9 Seek specialist palliative care advice if the dying person’s symptoms do not improve promptly with treatment or if there are undesirable side effects, such as unwanted sedation.
Although other ‘experienced’ hospital staff including senior consultants and ward sisters could fulfil some of these recommendations, there will clearly be an expectation in the future that around-the-clock access to specialist palliative care will have to be addressed by the majority of hospital trusts.
Trust-wide clinical provisions and protocols
In total, 99-100% of trusts stated that they had guidance on prescribing medications for each of the five key symptoms that can be present in patients in the last days/hours of life.
Most trusts had policies for ensuring patient comfort and dignity, for offering family and friends access to the body after death, and a prayer room. The areas that were not covered by >90% of trusts were: 77% (110/142) stated that they had a policy for referral to pastoral care / chaplaincy team; and 82% (117/142) stated that they had a policy for promoting dignity.
All trusts reported that they had a policy for recording DNACPR decisions, while 80% (113/142) had a policy for the deactivation of implantable cardioverter defibrillators (ICDs). Seventy-five per cent of trusts (106/142) reported that they had designated quiet spaces for relatives.
There was a wide variation between trusts on support services for people important to the dying patient, and for staff and volunteers. Areas in which support services for people important to the dying patient were reported by <70% of trusts were: access to counselling services; psychologist; achieving priorities of care document; comfort packs; and complementary therapies. Support services reported by <70% of trusts for staff and volunteers were: health and wellbeing team; hospice services support; bereavement cards/leaflets; access to bereavement services; achieving priorities of care document; psychologist; and complementary therapies.
Bereaved relatives’ or friends’ perspectives
In total, 80% (114/142) of trusts had a mechanism for seeking bereaved relatives’ and friends’ views between 1 April 2013 and 31 March 2015. In the 2013 audit, this figure had been 34%.
Ninety-four per cent (107/114) of trusts had used a questionnaire for this purpose: a variety of tools were used, with 45% (48/107) using their own in-house questionnaire.
Nationally available questionnaires were used by the majority of trusts (57%, 61/107). The tools used were: CODE (27%, 29/107); VOICES (23%, 25/107); and FAMCARE (19%, 20/107). In the previous audit, 82% of trusts had used a specific questionnaire.
In total, 82% (93/114) of trusts shared the results of bereavement surveys with the clinical team; 64% (73/114) with the trust board; and 31% (35/114) with the public. Sixty-seven per cent (76/114) of trusts reported that they had made a change to their service as a result of their assessment of bereaved relatives’ or friends’ perspectives.
© Healthcare Quality Improvement Partnership 2016 79
End of Life Care Audit – Dying in Hospital report for England
Appendix I: References 1. Office for National Statistics (ONS) mortality statistics. Deaths registered in England and Wales (Series
DR): 2014. Tables 1–4 and tables 6–14 (Excel sheet 1051 Kb) (table 12). Deaths registered by age, sex and selected underlying cause of death ‚ 2015. www.ons.gov.uk/peoplepopulationandcommunity/birthsdeathsandmarriages/deaths/bulletins/deathsregisteredinenglandandwalesseriesdr/2015-11-09/relateddata [Accessed 7 March 2016]
2. Department of Health. End of life care strategy: promoting high quality care for all adults at the end of life. London: DH, 2008. www.gov.uk/government/uploads/system/uploads/attachment_data/file/136431/End_of_life_strategy.pdf [Accessed 26 January 2014]
3. Department of Health. End of life care strategy: quality markers and measures for end of life care. London: DH, 2009. http://webarchive.nationalarchives.gov.uk/20130107105354/http://www.dh.gov.uk/prod_consum_dh/groups/dh_digitalassets/documents/digitalasset/dh_101684.pdf [Accessed 26 January 2014]
4. National Institute for Health and Clinical Excellence. NICE Quality Standards: Information for adults who use NHS end of life care services and their families and carers. London: NICE, 2011. www.nice.org.uk/guidance/qs13/resources/end-of-life-care-for-adults-436888045 [Accessed 2 February 2016]
5. Department of Health. The Mandate: a mandate from the government to the NHS Commissioning Board: April 2013 to March 2015. London: DH, 2013. www.gov.uk/government/uploads/system/uploads/attachment_data/file/256497/13-15_mandate.pdf [Accessed 26 January 2016]
6. Neuberger J. More care less pathway; a review of the Liverpool Care Pathway. 2013. www.gov.uk/government/uploads/system/uploads/attachment_data/file/212450/Liverpool_Care_Pathway.pdf [Accessed 7 January 2016]
7. Leadership Alliance for the Care of Dying People. One chance to get it right – Improving people’s experience of care in the last few days and hours of life, 2014. www.gov.uk/government/uploads/system/uploads/attachment_data/file/323188/One_chance_to_get_it_right.pdf [Accessed 26 January 2016]
8. Royal College of Physicians. National care of the dying audit for hospitals, England – National report. London: RCP, 2014. www.rcplondon.ac.uk/projects/outputs/national-care-dying-audit-hospitals [Accessed 26 January 2016]
9. National Institute for Health and Care Excellence. Care of dying adults in the last days of life – NICE Guideline. London: NICE, 2015. www.nice.org.uk/guidance/ng31/resources/care-of-dying-adults-in-the-last-days-of-life-1837387324357 [Accessed 7 January 2016]
10. National Voices. Every moment counts – A narrative for person centred coordinated care for people near the end of life. London: National Voices, 2015. www.nationalvoices.org.uk/pages/every-moment-counts-narrative-person-centred-coordinated-care-people-near-end-life [Accessed 26 January 2016]
11. National Palliative and End of Life Care Partnership. Ambitions for palliative and end of life care: A national framework for local action 2015-20. 2015. http://endoflifecareambitions.org.uk/wp-content/uploads/2015/09/Ambitions-for-Palliative-and-End-of-Life-Care.pdf [Accessed 2 February 2016]
12. Royal College of Physicians. Clinical standards information governance policy, V11. London: RCP, 2013.
13. National Research Ethics Service. Defining Research: NRES guidance to help you decide if your project requires review by a Research Ethics Committee. London: NRES, 2009 (Rev. 2013) www.hra.nhs.uk/documents/2013/09/defining-research.pdf [Accessed 2 February 2016]
80 © Healthcare Quality Improvement Partnership 2016

End of Life Care Audit – Dying in Hospital report for England
14. National Institute for Health and Care Excellence. Patient experience in adult NHS services: improving the experience of care for people using adult NHS services – CG138. London: NICE, 2012. www.nice.org.uk/guidance/cg138 [Accessed 10 February 2016]
15. Parliamentary and Health Service Ombudsman. Dying without dignity – Investigations by the Parliamentary and Health Service Ombudsman into complaints about end of life care. London: PHSO, 2015. www.ombudsman.org.uk/__data/assets/pdf_file/0019/32167/Dying_without_dignity_report.pdf [Accessed 7 January 2015]
16. Altman DG. Practical statistics for medical research. London: Chapman and Hall, 1991.
© Healthcare Quality Improvement Partnership 2016 81

End of Life Care Audit – Dying in Hospital report for England
Appendix II: Glossary Advance care planning: The process of discussing the type of care and treatment that a patient would or would not wish to receive in the event that they lose capacity, in order to create a record of a patient’s wishes and values, preferences and decisions, to ensure that care is planned and delivered in a way that meets their needs; and it ideally also involves and meets the needs of those close to the patient.
Advance decision: A statement of a patient’s wish to refuse a particular type of medical treatment or care if they become unable to make or communicate decisions for themselves. They are called advance decisions in England and Wales. If an advance refusal is valid and applicable to the person’s current circumstances, it must be respected. It will be legally binding on those providing care in England and Wales provided that, if it relates to life-prolonging treatment, it satisfies the additional legal criteria.
Assisted ventilation: A machine that does the work of breathing for a patient, or assists a patient to breathe, when he or she is unable to do so independently.
Bereavement: The overall response to a loss, which includes the process of ‘recovery’ or healing from the loss.
Capacity: The ability to make a decision. An adult is deemed to have capacity unless, having been given all appropriate help and support, it is clear that they cannot understand, retain, use or weigh up the information needed to make a particular decision or to communicate their wishes. Capacity always refers to a specific decision, as a person may have capacity for one decision but not for another.
Cardiopulmonary resuscitation (CPR): A procedure used when a patient′s heart stops beating: it can involve compressions of the chest or electrical stimulation.
Clinically assisted hydration (CAH): This includes intravenous or subcutaneous infusion of fluids (use of a ‘drip’). The fluids may be also given via a pre-existing tube in the nose (nasogastric) or directly in the stomach (percutaneous endoscopic gastrostomy – PEG). The term ‘clinically assisted hydration’ does not refer to help given to patients to drink, for example sips of water.
Clinically assisted nutrition (CAN): This includes nasogastric feeding and percutaneous endoscopic gastrostomy (PEG). In some cases if there is a pre-existing central venous line (for example in a critical care unit), feeding may be given intravenously. The term ‘clinically assisted nutrition’ does not refer to help given to patients to eat, for example spoon feeding.
Clinician: A health professional, such as a doctor or nurse, involved in clinical practice.
Cohen’s kappa co-efficient: When two individuals attempt to code the same information, Cohen’s kappa (often simply called kappa) can be used as a measure of agreement between the two individuals. Kappa adjusts for the amount of agreement that could be expected due to chance alone. Kappa lies between -1 and +1. A value of 1 implies perfect agreement and values less than 1 imply less than perfect agreement (perfect agreement is rare). Altman16 suggests one possible interpretation of kappa.
• Poor agreement = less than 0.20
• Fair agreement = 0.20 to 0.39
• Moderate agreement = 0.40 to 0.59
• Good agreement = 0.60 to 0.79
• Very good agreement = 0.80 to 1.00
Dialysis: This includes haemodialysis and peritoneal dialysis, which are processes to remove waste products, maintain the balance of chemicals and fluid in the body, and supporting the kidneys when they are not working well.
82 © Healthcare Quality Improvement Partnership 2016

End of Life Care Audit – Dying in Hospital report for England
DNACPR: Is an abbreviation of ‘do not attempt cardiopulmonary resuscitation’, which is a decision not to attempt CPR if a patient′s heart or breathing stops. The decision not to attempt cardiopulmonary resuscitation should be discussed with the patient (unless this would cause extreme distress) and with the family. The decision is signed and recorded in the patient’s notes and reviewed as required.
End of life: Patients are ‘approaching the end of life’ when they are likely to die within the next 12 months. This includes those patients who have advanced, progressive incurable conditions; those with general frailty and co-existing conditions that mean they are expected to die within 12 months; those at risk of dying from a sudden acute crisis in an existing condition; and those with life-threatening acute conditions caused by sudden catastrophic events. The term ‘approaching the end of life’ can also apply to patients who are diagnosed as being in a persistent vegetative state (PVS) for whom a decision to withdraw treatment and care may lead to their death. The term ‘last days of life’ is reserved for those who are very close to death, within hours or days.
Hydration: The process of providing water or fluid by mouth, tube, subcutaneously or intravenously.
Independent mental capacity adviser (IMCA): Neuberger recommendation 32 suggests that: ‘for each patient on an end of life care plan that has no means of expressing preferences and no representation by a relative or carer, views on their care should be represented by an independent advocate, whether appointed under the Mental Capacity Act 2005, a chaplain, or an appropriate person provided through a voluntary organisation. This applies to people of whatever age who lack capacity’.
Inter-auditor reliability: The second coding of a number of audit data collection forms by an independent auditor, to assess the level of agreement in coding. Reliability (agreement between auditors) is not the same as validity (accuracy of measure). However establishing good agreement between auditors is an important part of the process of validation, as valid data by definition will have to be reliable. (See Cohen’s kappa coefficient.)
Interquartile range (IQR): Where appropriate, the IQR is presented within the tables. It often gives a more useful indication of the range of scores for an outcome than a simple median or mean. Twenty-five per cent of cases score below the first stated value, 50% of cases have a score that lies between the two values, and 25% have a score that lies between the higher value and 100%. Comparing one’s own score against this IQR allows a judgement of how well a trust/hospital has performed in comparison with the others.
Legal proxy: A person with legal authority to make certain decisions on behalf of another adult. Legal proxies who can make healthcare decisions include: a person holding a lasting power of attorney (England and Wales) or a court appointed deputy (England and Wales).
Mean: The conventional way of expressing an average, made by adding up all the scores and dividing by the number of scores. If a sample is not uniformly distributed, eg if there are many outliers on one or other side of the median (see below) then the mean gives a distorted picture.
Median: An alternative way of expressing the average, found by arranging all the recorded values in order and then selecting the one in the middle. Exactly half of the sample will have values below that number and exactly half will be above it.
Nasogastric (NG): This refers to a tube that goes in through the nose and into the stomach, which is used for the administration of medication or for fluids or feeding when oral intake is not suitable.
Palliative care: Care towards the end of life that aims to provide relief from pain and other distressing symptoms, to integrate the psychological and spiritual aspects of the person’s care and to offer a support system that allows people to live as actively as possible until their death. The objective is to support patients to live as well as possible until they die and to die with dignity.
Percutaneous endoscopic gastrostomy (PEG): This is an endoscopic procedure in which a tube (PEG tube) is passed into a patient’s stomach through the abdominal wall, usually to provide feeding when oral intake is not adequate. This makes use of the natural digestive process of the gastrointestinal tract.
Symptom: An upsetting or distressing feeling a patient has that indicates a disorder or disease.
© Healthcare Quality Improvement Partnership 2016 83

End of Life Care Audit – Dying in Hospital report for England
Specialist palliative care services: These are those services with palliative care as their core speciality and that are provided by an interdisciplinary team, under the direction of a consultant physician in palliative medicine.
Those important to the patient: Anyone nominated by the patient, close relatives, partners, close friends, paid or unpaid carers outside the healthcare team and independent advocates. In some circumstances, it may include attorneys for property and financial affairs, and other legal proxies.
84 © Healthcare Quality Improvement Partnership 2016
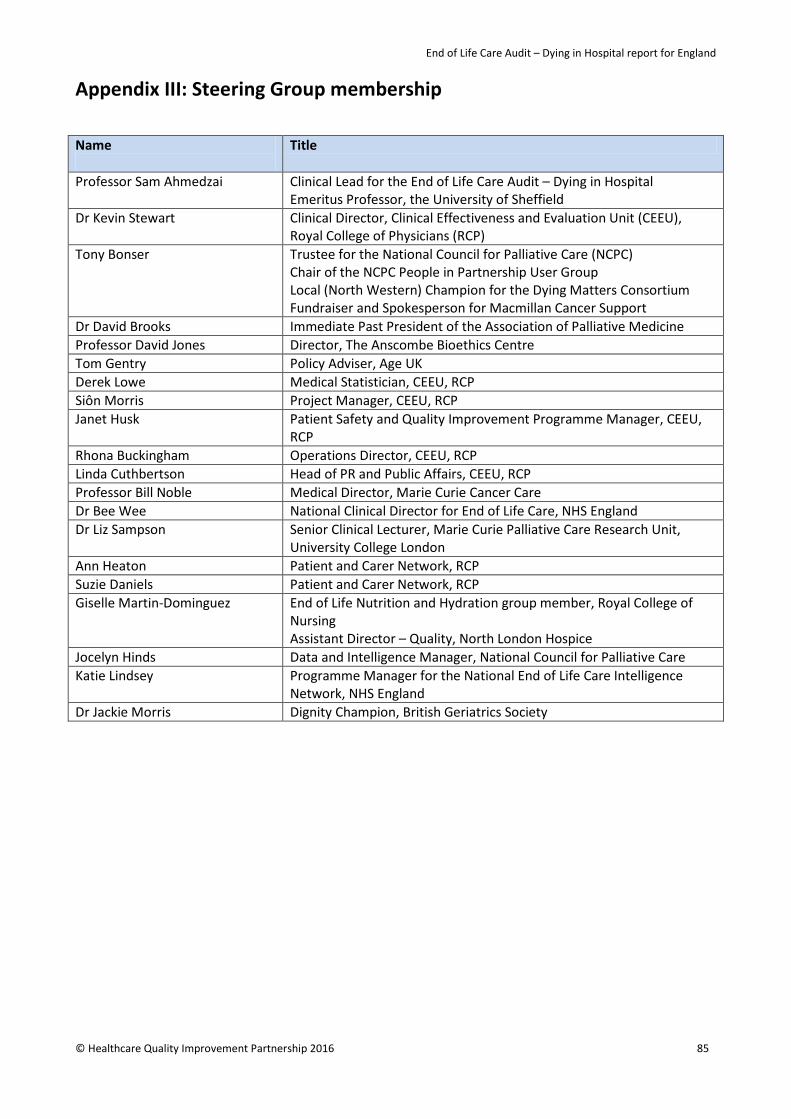
End of Life Care Audit – Dying in Hospital report for England
Appendix III: Steering Group membership
Name
Title
Professor Sam Ahmedzai Clinical Lead for the End of Life Care Audit – Dying in Hospital Emeritus Professor, the University of Sheffield
Dr Kevin Stewart Clinical Director, Clinical Effectiveness and Evaluation Unit (CEEU), Royal College of Physicians (RCP)
Tony Bonser Trustee for the National Council for Palliative Care (NCPC) Chair of the NCPC People in Partnership User Group Local (North Western) Champion for the Dying Matters Consortium Fundraiser and Spokesperson for Macmillan Cancer Support
Dr David Brooks Immediate Past President of the Association of Palliative Medicine Professor David Jones Director, The Anscombe Bioethics Centre Tom Gentry Policy Adviser, Age UK Derek Lowe Medical Statistician, CEEU, RCP Siôn Morris Project Manager, CEEU, RCP Janet Husk Patient Safety and Quality Improvement Programme Manager, CEEU,
RCP Rhona Buckingham Operations Director, CEEU, RCP Linda Cuthbertson Head of PR and Public Affairs, CEEU, RCP Professor Bill Noble Medical Director, Marie Curie Cancer Care Dr Bee Wee National Clinical Director for End of Life Care, NHS England Dr Liz Sampson
Senior Clinical Lecturer, Marie Curie Palliative Care Research Unit, University College London
Ann Heaton Patient and Carer Network, RCP Suzie Daniels Patient and Carer Network, RCP Giselle Martin-Dominguez End of Life Nutrition and Hydration group member, Royal College of
Nursing Assistant Director – Quality, North London Hospice
Jocelyn Hinds Data and Intelligence Manager, National Council for Palliative Care Katie Lindsey Programme Manager for the National End of Life Care Intelligence
Network, NHS England Dr Jackie Morris Dignity Champion, British Geriatrics Society
© Healthcare Quality Improvement Partnership 2016 85

End of Life Care Audit – Dying in Hospital report for England
Appendix IV: Data reliability summary statistics For categorical data, the kappa statistic was used to measure agreement. Kappa values of 0.41 to 0.60 are said to indicate moderate agreement, values of 0.61-0.80 indicate good agreement while values of over 0.80 are very good. In practice any value of kappa much below 0.50 will indicate inadequate agreement. Often, agreement is an amalgamation of separate components. One component is the agreement between auditors as to whether or not they find the required information, and another is agreement in data when both auditors have found relevant information. Where possible, this distinction is made. The kappa statistic does not measure the nature of any disagreement between auditors and for this we need to inspect the raw data tables. Any future attempt to improve on the reliability of any audit item (ie when planning a repeat audit) will bear most fruit if it focuses on the more frequent discrepancies in judgement. For numerical data, the percentage with exact auditor agreement is reported, as is the quantification of the extent of disagreement between auditors. The nesting of some questions that are conditional on the response to previous questions sometimes resulted in rather small denominators within the national audit proper, and consequently very small denominators in this re-audit sample. For such questions and also for rare findings (low prevalence) the confidence interval around the estimate of kappa is often wide or not computable. For rare findings, a low kappa value may appear paradoxical, as it does not reflect the high rate of overall agreement; for example in the vast majority of cases both auditors may agree on ‘No’ as a response with ‘Yes’ being a rare finding – a low kappa statistic in this instance would indicate inability of auditors to agree on the rare finding of ‘Yes’, or put in another way an inability to agree on distinguishing between ‘Yes’ and ‘No’. In summary, levels of agreement were found to be generally ‘good’ with 77% of computed kappa values over 0.60, 59% over 0.70 and 40% over 0.80. Of 235 kappa values computed, their median was 0.73, with an IQR of 0.62-0.88. Kappa value distribution by section of clinical audit proforma was as tabulated and depicted in Table B and Figure A below. Agreement was strongest in regard to clinical/demographic characteristics and medication prescribing, and least strong within the section relating to the recognition of dying. In hindsight, it would have been more informative to have asked for five re-audit cases, as has been usual for previous audits, instead of reducing this to three cases. Table B: Kappa value distribution by section of clinical audit proforma
Median (IQR) kappa value Section 1: Clinical/demographic characteristics
0.76 (0.64-0.91), n=30
Section 2: Recognition of dying 0.60 (0.50-0.66), n=20 Section 3: Communication 0.71 (N/C), n=4 Section 4: Dying person and those important to them in decision making
0.69 (0.55-0.81), n=20
Section 5: Needs of families and other 0.67 (0.63-0.72), n=18 Section 6 (non-medication): Individual plan of care 0.66 (0.55-0.72), n=76 Section 6 (medication): Individual plan of care 0.95 (0.83-1.00), n=67
86 © Healthcare Quality Improvement Partnership 2016

End of Life Care Audit – Dying in Hospital report for England
Fig A: Kappa value distribution by section of clinical audit proforma
Summary tables are presented below for categorical data (Table C), dates (Table D), numerical data (Table E) and drug dosage data (Table F), with the data items being organised as much as possible in the way they appeared in the audit proforma. Below these are the main body text of agreement tables and statistics, which provide further detail about the nature of agreement and disagreement. Items are grouped according to the value of kappa statistic, with the 95% confidence interval (CI) in brackets. Items with kappa values below 0.50 are highlighted. Some CIs could not be computed and in such circumstance the term ‘N/C’ appears.
© Healthcare Quality Improvement Partnership 2016 87
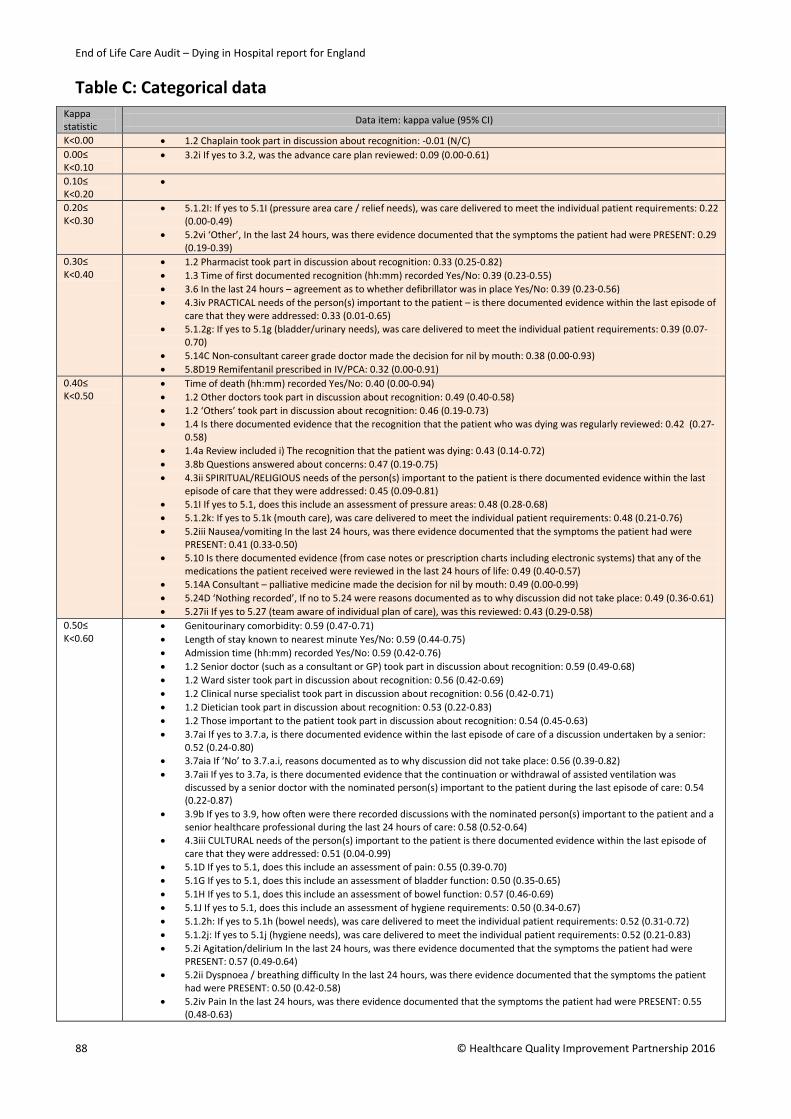
End of Life Care Audit – Dying in Hospital report for England
Table C: Categorical data Kappa statistic Data item: kappa value (95% CI)
K<0.00 • 1.2 Chaplain took part in discussion about recognition: -0.01 (N/C) 0.00≤ K<0.10
• 3.2i If yes to 3.2, was the advance care plan reviewed: 0.09 (0.00-0.61)
0.10≤ K<0.20
•
0.20≤ K<0.30
• 5.1.2I: If yes to 5.1I (pressure area care / relief needs), was care delivered to meet the individual patient requirements: 0.22 (0.00-0.49)
• 5.2vi ‘Other’, In the last 24 hours, was there evidence documented that the symptoms the patient had were PRESENT: 0.29 (0.19-0.39)
0.30≤ K<0.40
• 1.2 Pharmacist took part in discussion about recognition: 0.33 (0.25-0.82) • 1.3 Time of first documented recognition (hh:mm) recorded Yes/No: 0.39 (0.23-0.55) • 3.6 In the last 24 hours – agreement as to whether defibrillator was in place Yes/No: 0.39 (0.23-0.56) • 4.3iv PRACTICAL needs of the person(s) important to the patient – is there documented evidence within the last episode of
care that they were addressed: 0.33 (0.01-0.65) • 5.1.2g: If yes to 5.1g (bladder/urinary needs), was care delivered to meet the individual patient requirements: 0.39 (0.07-
0.70) • 5.14C Non-consultant career grade doctor made the decision for nil by mouth: 0.38 (0.00-0.93) • 5.8D19 Remifentanil prescribed in IV/PCA: 0.32 (0.00-0.91)
0.40≤ K<0.50
• Time of death (hh:mm) recorded Yes/No: 0.40 (0.00-0.94) • 1.2 Other doctors took part in discussion about recognition: 0.49 (0.40-0.58) • 1.2 ‘Others’ took part in discussion about recognition: 0.46 (0.19-0.73) • 1.4 Is there documented evidence that the recognition that the patient who was dying was regularly reviewed: 0.42 (0.27-
0.58) • 1.4a Review included i) The recognition that the patient was dying: 0.43 (0.14-0.72) • 3.8b Questions answered about concerns: 0.47 (0.19-0.75) • 4.3ii SPIRITUAL/RELIGIOUS needs of the person(s) important to the patient is there documented evidence within the last
episode of care that they were addressed: 0.45 (0.09-0.81) • 5.1I If yes to 5.1, does this include an assessment of pressure areas: 0.48 (0.28-0.68) • 5.1.2k: If yes to 5.1k (mouth care), was care delivered to meet the individual patient requirements: 0.48 (0.21-0.76) • 5.2iii Nausea/vomiting In the last 24 hours, was there evidence documented that the symptoms the patient had were
PRESENT: 0.41 (0.33-0.50) • 5.10 Is there documented evidence (from case notes or prescription charts including electronic systems) that any of the
medications the patient received were reviewed in the last 24 hours of life: 0.49 (0.40-0.57) • 5.14A Consultant – palliative medicine made the decision for nil by mouth: 0.49 (0.00-0.99) • 5.24D ‘Nothing recorded’, If no to 5.24 were reasons documented as to why discussion did not take place: 0.49 (0.36-0.61) • 5.27ii If yes to 5.27 (team aware of individual plan of care), was this reviewed: 0.43 (0.29-0.58)
0.50≤ K<0.60
• Genitourinary comorbidity: 0.59 (0.47-0.71) • Length of stay known to nearest minute Yes/No: 0.59 (0.44-0.75) • Admission time (hh:mm) recorded Yes/No: 0.59 (0.42-0.76) • 1.2 Senior doctor (such as a consultant or GP) took part in discussion about recognition: 0.59 (0.49-0.68) • 1.2 Ward sister took part in discussion about recognition: 0.56 (0.42-0.69) • 1.2 Clinical nurse specialist took part in discussion about recognition: 0.56 (0.42-0.71) • 1.2 Dietician took part in discussion about recognition: 0.53 (0.22-0.83) • 1.2 Those important to the patient took part in discussion about recognition: 0.54 (0.45-0.63) • 3.7ai If yes to 3.7.a, is there documented evidence within the last episode of care of a discussion undertaken by a senior:
0.52 (0.24-0.80) • 3.7aia If ‘No’ to 3.7.a.i, reasons documented as to why discussion did not take place: 0.56 (0.39-0.82) • 3.7aii If yes to 3.7a, is there documented evidence that the continuation or withdrawal of assisted ventilation was
discussed by a senior doctor with the nominated person(s) important to the patient during the last episode of care: 0.54 (0.22-0.87)
• 3.9b If yes to 3.9, how often were there recorded discussions with the nominated person(s) important to the patient and a senior healthcare professional during the last 24 hours of care: 0.58 (0.52-0.64)
• 4.3iii CULTURAL needs of the person(s) important to the patient is there documented evidence within the last episode of care that they were addressed: 0.51 (0.04-0.99)
• 5.1D If yes to 5.1, does this include an assessment of pain: 0.55 (0.39-0.70) • 5.1G If yes to 5.1, does this include an assessment of bladder function: 0.50 (0.35-0.65) • 5.1H If yes to 5.1, does this include an assessment of bowel function: 0.57 (0.46-0.69) • 5.1J If yes to 5.1, does this include an assessment of hygiene requirements: 0.50 (0.34-0.67) • 5.1.2h: If yes to 5.1h (bowel needs), was care delivered to meet the individual patient requirements: 0.52 (0.31-0.72) • 5.1.2j: If yes to 5.1j (hygiene needs), was care delivered to meet the individual patient requirements: 0.52 (0.21-0.83) • 5.2i Agitation/delirium In the last 24 hours, was there evidence documented that the symptoms the patient had were
PRESENT: 0.57 (0.49-0.64) • 5.2ii Dyspnoea / breathing difficulty In the last 24 hours, was there evidence documented that the symptoms the patient
had were PRESENT: 0.50 (0.42-0.58) • 5.2iv Pain In the last 24 hours, was there evidence documented that the symptoms the patient had were PRESENT: 0.55
(0.48-0.63)
88 © Healthcare Quality Improvement Partnership 2016

End of Life Care Audit – Dying in Hospital report for England
• 5.2v Noisy breathing / death rattle In the last 24 hours, was there evidence documented that the symptoms the patient had were PRESENT: 0.53 (0.45-0.60)
• 5.11 Was there a documented assessment of the patient’s ability to drink in the last 24 hours of life: 0.52 (0.43-0.60) • 5.14F Junior (trainee) doctor made the decision for nil by mouth: 0.55 (0.09-0.99) • 5.15 Is there documented evidence that an assessment regarding the patient’s need for clinically assisted (artificial)
hydration (CAH) was made at any time between the time of the final admission and death: 0.56 (0.48-0.64) • 5.16i If no to 5.16, reasons documented as to why discussion regarding drinking and need for assisted forms of hydration
did not take place: 0.59 (0.53-0.65) • 5.26i Were the spiritual/cultural/religious/practical needs of the patient, as identified from the discussion in question 5.26,
met: 0.57 (0.40-0.75) • 5.4D19 Fentanyl prescribed prn (info obtained from free-text comment): 0.50 (0.00-0.99)
0.60≤ K <0.70
• Ethnicity known Yes/No: 0.64 (0.53-0.74) • Ethnicity group (if known) : 0.67 (0.53-0.81) • Number of comorbidities including other: 0.66 (0.61-0.72) • Number of comorbidities excluding other: 0.67 (0.61-0.72) • Malignancy comorbidity: 0.69 (0.57-0.81) • Musculoskeletal comorbidity: 0.63 (0.51-0.76) • ‘Other’ comorbidity: 0.63 (0.55-0.72) • 1.2 Staff nurse took part in discussion about recognition: 0.62 (0.54-0.70) • 1.2 Speech and language therapist took part in discussion about recognition: 0.66 (0.42-0.90) • 1.2 Physiotherapist took part in discussion about recognition: 0.63 (0.43-0.83) • 1.2 Occupational therapist took part in discussion about recognition: 0.66 (0.35-0.97) • 1.2 Social worker took part in discussion about recognition: 0.67 (0.05-0.99) • 1.2 Patient took part in discussion about recognition: 0.66 (0.55-0.76) • 1.4b Review included ii) That the patient was recovering: 0.61 (0.42-0.80) • 2.1i If no to 2.1, reasons as to why discussion did not take place: 0.62 (0.55-0.68) • If no to 2.2, reasons as to why discussion did not take place: 0.64 (0.48-0.82) • If no to 3.3, were any of the following reasons documented as to why discussion did not take place: 0.68 (0.61-0.74) • 3.5 At the time of the patient’s death was there a cardiopulmonary resuscitation decision in place: 0.63 (0.46-0.81) • 3.8a: if ‘No But’ to 3.8, why so: 0.63 (0.53-0.73) • 4.2i PSYCHOLOGICAL needs of the person(s) important to the patient is there documented evidence within the last episode
of care that they were assessed: 0.63 (0.49-0.77) • 4.2iv PRACTICAL needs of the person(s) important to the patient is there documented evidence within the last episode of
care that they were assessed: 0.68 (0.48-0.89) • 4.3i PSYCHOLOGICAL needs of the person(s) important to the patient is there documented evidence within the last episode
of care that they were addressed: 0.66 (0.21-0.99) • 4.4 Is there documented evidence within the last episode of care of discussion regarding the patient’s
spiritual/religious/cultural/practical needs with the nominated person(s) important to the patient: 0.65 (0.59-0.72) • 4.5 Were those important to the patient notified of the patient’s imminent death: 0.63 (0.54-0.71) • 4.5ii Was anyone else recorded as being with the patient at the time of death: 0.66 (0.58-0.74) • 4.6 Is there documented evidence of care and support of the patient’s family and those important to them at the time of
and immediately after death: 0.65 (0.58-0.72) • 4.6i Is there documented evidence that the family and those people that are important to the deceased were given any
culturally appropriate verbal information following the death of the patient: 0.68 (0.61-0.75) • 5.1A If yes to 5.1, does this include an assessment of agitation/delirium: 0.68 (0.57-0.78) • 5.1B If yes to 5.1, does this include an assessment of dyspnoea / breathing difficulty: 0.66 (0.54-0.78) • 5.1F If yes to 5.1, does this include an assessment of anxiety/distress: 0.61 (0.50-0.72) • 5.1K If yes to 5.1, does this include an assessment of mouth care: 0.64 (0.52-0.76) • 5.2ii Dyspnoea / breathing difficulty In the last 24 hours, was there evidence documented that the symptoms the patient
had were CONTROLLED: 0.65 (0.55-0.76) • 5.2iv Pain In the last 24 hours, was there evidence documented that the symptoms the patient had were CONTROLLED:
0.63 (0.49-0.77) • 5.12 Is there evidence that the patient was supported to drink in the last 24 hours of life: 0.66 (0.60-0.73) • 5.14M Dietician made the decision for nil by mouth: 0.64 (0.26-0.99) • 5.16 Is there documented evidence that a discussion regarding drinking and need for assisted forms of hydration was
undertaken with the patient in the time between the final date of admission and of death: 0.64 (0.54-0.73) • 5.19 Was there a documented assessment of the patient’s ability to eat in the last 24 hours of life: 0.63 (0.56-0.70) • 5.23i If no to 5.23, were any of the following reasons documented as to why discussion regarding eating and need for
assisted forms of nutrition did not take place: 0.61 (0.54-0.67) • 5.24E Other, If no to 5.24 were reasons documented as to why discussion did not take place: 0.65 (0.51-0.79) • 5.27i If yes to 5.27, was this followed: 0.62 (0.40-0.85) • 5.29 Is there documented evidence of care of the patient immediately prior to or at the time of death: 0.61 (0.53-0.68) • 5.4D3 Clonazepam prescribed prn: 0.67 (0.05-0.99) • 5.4D18 Remifentanil prescribed prn: 0.67 (0.05-0.99) • 5.8D18 Propofol prescribed in IV/PCA: 0.69 (0.37-0.99)
0.70≤ K <0.80
• Religious affiliation known Yes/No: 0.71 (0.64-0.78) • Central nervous system comorbidity: 0.70 (0.59-0.81) • Endocrine comorbidity: 0.77 (0.70-0.85) • Sudden unexpected death: 0.74 (0.65-0.84) • 1.2 Member of the specialist palliative care team took part in discussion about recognition: 0.71 (0.62-0.79)
© Healthcare Quality Improvement Partnership 2016 89

End of Life Care Audit – Dying in Hospital report for England
• 2.1 Is there documented evidence within the last episode of care that health professional recognition that the patient would probably die in the coming hours or days (imminent death) had been discussed with the patient: 0.78 (0.71-0.84)
• 2.2 Is there documented evidence within the last episode of care that health professional recognition that the patient would probably die in the coming hours or days (imminent death) had been discussed with a nominated person(s) important to the patient: 0.79 (0.71-0.87)
• 3.1 Is there documented evidence that the patient had made an advance care plan prior to admission: 0.71 (0.56-0.86) • 3.4 Is there documented evidence that the cardiopulmonary resuscitation (CPR) decision by a senior doctor was discussed
with the nominated person(s) important to the patient during the last episode of care: 0.76 (0.69-0.83) • 3.6 In the last 24 hours, (where both auditors agreed defibrillator was in place) was deactivation of an implanted
defibrillator recorded: 0.75 (0.31-0.99) • 3.8 Is there documented evidence that the patient was given an opportunity to have: (a) Concerns listened to: 0.70 (0.64-
0.75) • 3.9 Is there documented evidence that the nominated person(s) important to the patient during the last episode of care
was given regular opportunities to discuss the patient’s condition with a senior healthcare professional: 0.71 (0.62-0.79) • 4.1 Is there documented evidence that the needs of the person(s) important to the patient were asked about: 0.73 (0.67-
0.79) • 4.1i If ‘Yes’ to 4.1, were any needs identified: 0.72 (0.62-0.82) • 4.1ia If ‘Yes’ to 4.1i, what was the outcome of identifying these needs: 0.71 (0.60-0.83) • 4.2ii SPIRITUAL/RELIGIOUS needs of the person(s) important to the patient is there documented evidence within the last
episode of care that they were assessed: 0.78 (0.68-0.89) • 4.2iii CULTURAL needs of the person(s) important to the patient is there documented evidence within the last episode of
care that they were assessed: 0.71 (0.57-0.84) • 4.5i Were those important to the patient present at the time of the patient’s death: 0.76 (0.70-0.83) • 5.1 Is there documented evidence in the last 24 hours of life of a holistic assessment of the patient’s needs regarding an
individual plan of care: 0.73 (0.66-0.80) • 5.1C If yes to 5.1, does this include an assessment of nausea/vomiting: 0.74 (0.66-0.82) • 5.1E If yes to 5.1, does this include an assessment of noisy breathing / death rattle: 0.71 (0.63-0.80) • 5.2i Agitation/delirium In the last 24 hours, was there evidence documented that the symptoms the patient had were
CONTROLLED: 0.72 (0.61-0.83) • 5.2iii Nausea/vomiting In the last 24 hours, was there evidence documented that the symptoms the patient had were
CONTROLLED: 0.77 (0.64-0.90) • 5.2v Noisy breathing / death rattle In the last 24 hours, was there evidence documented that the symptoms the patient
had were CONTROLLED: 0.70 (0.58-0.82) • 5.13 Was the patient drinking in the last 24 hours of life: 0.74 (0.68-0.80) • 5.14 Was there a ‘nil by mouth’ order in place in the last 24 hours of life: 0.74 (0.66-0.83) • 5.14I Ward sister made the decision for nil by mouth: 0.79 (0.40-0.99) • 5.14R Was there a documented reason for the nil by mouth decision: 0.73 (0.38-0.99) • 5.17 Is there documented evidence that a discussion regarding hydration needs was undertaken with the nominated
relative or friend or the nominated independent mental capacity advocate (IMCA), or LPA personal welfare at any time between the time of the final admission and death: 0.70 (0.63-0.76)
• 5.17i If no to 5.17, reasons documented as to why discussion did not take place: 0.75 (0.63-0.87) • 5.20 Is there evidence that the patient was supported to eat in the last 24 hours of life: 0.72 (0.65-0.79) • 5.21 Was the patient eating in the last 24 hours of life: 0.75 (0.69-0.82) • 5.22 Is there documented evidence that an assessment regarding the patient’s need for clinically assisted (artificial)
nutrition (CAN) was made at any time between the time of the final admission and death: 0.71 (0.64-0.77) • 5.23 Is there documented evidence that a discussion regarding eating and need for assisted forms of nutrition was
undertaken with the patient in the time between the final date of admission and of death: 0.70 (0.61-0.79) • 5.24 Is there documented evidence that a discussion regarding nutrition needs was undertaken with the nominated
relative or friend or the nominated independent mental capacity advocate (IMCA), or LPA personal welfare at any time between the time of the final admission and death: 0.74 (0.67-0.81)
• 5.26 Is there documented evidence within the last episode of care of discussion regarding the patient’s spiritual/cultural/ religious/practical needs with patients who were capable of participating in such discussions: 0.75 (0.70-0.81)
• 5.27 Is there documented evidence that the team were aware of an individual plan of care for the person that is dying: 0.74 (0.68-0.80)
• 5.30 Is there documented evidence of care of the patient immediately after death: 0.72 (0.65-0.78) • 5.4B Is there documented evidence (in case notes or in prescription chart) that anticipatory medication ‘prn’ was
prescribed for dyspnoea / breathing difficulty in the last hours or days of life: 0.79 (0.73-0.85) • 5.4 Analgesics (painkillers) prescribed prn: 0.77 (0.67-0.87) • 5.5 In the last 24 hours of life, was the patient taking prescribed oral medications: 0.72 (0.66-0.79) • 5.6 In the last 24 hours of life, was the patient prescribed any transdermal medications (skin patches): 0.77 (0.64-0.90) • 5.7D9 Hyoscine hydrobromide prescribed in CSCI: 0.77 (0.60-0.95) • 5.8 In the last 24 hours of life is there documented evidence that a continuous intravenous infusion of medication was in
place (includes patient controlled analgesia (PCA)): 0.76 (0.64-0.89) 0.80≤ K<0.90
• Religious affiliation group (if known): 0.87 (0.80-0.94) • Primary diagnosis group: 0.87 (0.83-0.91) • Cardiovascular comorbidity: 0.81 (0.75-0.86) • Respiratory comorbidity: 0.80 (0.73-0.87) • Place of death group: 0.86 (0.82-0.91) • Time of day of death: 0.89 (0.86-0.92) • 1.1 Is there documented evidence within the last episode of care that it was recognised that the patient would probably
90 © Healthcare Quality Improvement Partnership 2016
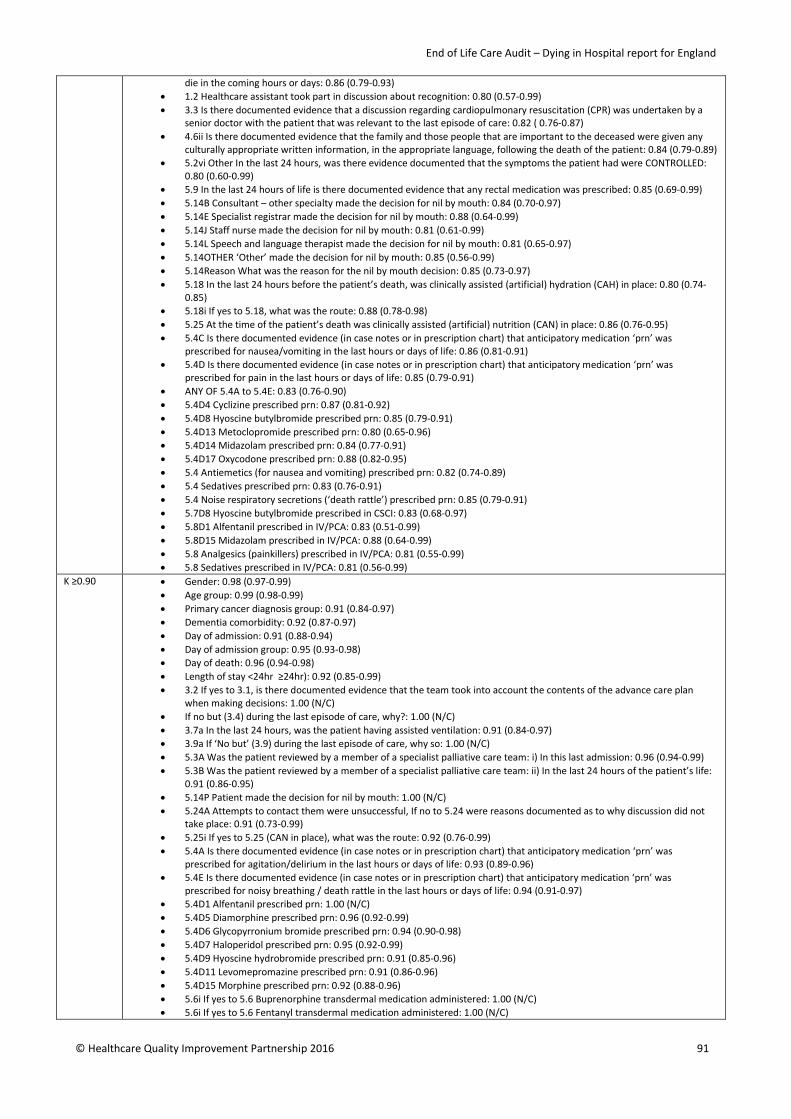
End of Life Care Audit – Dying in Hospital report for England
die in the coming hours or days: 0.86 (0.79-0.93) • 1.2 Healthcare assistant took part in discussion about recognition: 0.80 (0.57-0.99) • 3.3 Is there documented evidence that a discussion regarding cardiopulmonary resuscitation (CPR) was undertaken by a
senior doctor with the patient that was relevant to the last episode of care: 0.82 ( 0.76-0.87) • 4.6ii Is there documented evidence that the family and those people that are important to the deceased were given any
culturally appropriate written information, in the appropriate language, following the death of the patient: 0.84 (0.79-0.89) • 5.2vi Other In the last 24 hours, was there evidence documented that the symptoms the patient had were CONTROLLED:
0.80 (0.60-0.99) • 5.9 In the last 24 hours of life is there documented evidence that any rectal medication was prescribed: 0.85 (0.69-0.99) • 5.14B Consultant – other specialty made the decision for nil by mouth: 0.84 (0.70-0.97) • 5.14E Specialist registrar made the decision for nil by mouth: 0.88 (0.64-0.99) • 5.14J Staff nurse made the decision for nil by mouth: 0.81 (0.61-0.99) • 5.14L Speech and language therapist made the decision for nil by mouth: 0.81 (0.65-0.97) • 5.14OTHER ‘Other’ made the decision for nil by mouth: 0.85 (0.56-0.99) • 5.14Reason What was the reason for the nil by mouth decision: 0.85 (0.73-0.97) • 5.18 In the last 24 hours before the patient’s death, was clinically assisted (artificial) hydration (CAH) in place: 0.80 (0.74-
0.85) • 5.18i If yes to 5.18, what was the route: 0.88 (0.78-0.98) • 5.25 At the time of the patient’s death was clinically assisted (artificial) nutrition (CAN) in place: 0.86 (0.76-0.95) • 5.4C Is there documented evidence (in case notes or in prescription chart) that anticipatory medication ‘prn’ was
prescribed for nausea/vomiting in the last hours or days of life: 0.86 (0.81-0.91) • 5.4D Is there documented evidence (in case notes or in prescription chart) that anticipatory medication ‘prn’ was
prescribed for pain in the last hours or days of life: 0.85 (0.79-0.91) • ANY OF 5.4A to 5.4E: 0.83 (0.76-0.90) • 5.4D4 Cyclizine prescribed prn: 0.87 (0.81-0.92) • 5.4D8 Hyoscine butylbromide prescribed prn: 0.85 (0.79-0.91) • 5.4D13 Metoclopromide prescribed prn: 0.80 (0.65-0.96) • 5.4D14 Midazolam prescribed prn: 0.84 (0.77-0.91) • 5.4D17 Oxycodone prescribed prn: 0.88 (0.82-0.95) • 5.4 Antiemetics (for nausea and vomiting) prescribed prn: 0.82 (0.74-0.89) • 5.4 Sedatives prescribed prn: 0.83 (0.76-0.91) • 5.4 Noise respiratory secretions (‘death rattle’) prescribed prn: 0.85 (0.79-0.91) • 5.7D8 Hyoscine butylbromide prescribed in CSCI: 0.83 (0.68-0.97) • 5.8D1 Alfentanil prescribed in IV/PCA: 0.83 (0.51-0.99) • 5.8D15 Midazolam prescribed in IV/PCA: 0.88 (0.64-0.99) • 5.8 Analgesics (painkillers) prescribed in IV/PCA: 0.81 (0.55-0.99) • 5.8 Sedatives prescribed in IV/PCA: 0.81 (0.56-0.99)
K ≥0.90 • Gender: 0.98 (0.97-0.99) • Age group: 0.99 (0.98-0.99) • Primary cancer diagnosis group: 0.91 (0.84-0.97) • Dementia comorbidity: 0.92 (0.87-0.97) • Day of admission: 0.91 (0.88-0.94) • Day of admission group: 0.95 (0.93-0.98) • Day of death: 0.96 (0.94-0.98) • Length of stay <24hr ≥24hr): 0.92 (0.85-0.99) • 3.2 If yes to 3.1, is there documented evidence that the team took into account the contents of the advance care plan
when making decisions: 1.00 (N/C) • If no but (3.4) during the last episode of care, why?: 1.00 (N/C) • 3.7a In the last 24 hours, was the patient having assisted ventilation: 0.91 (0.84-0.97) • 3.9a If ‘No but’ (3.9) during the last episode of care, why so: 1.00 (N/C) • 5.3A Was the patient reviewed by a member of a specialist palliative care team: i) In this last admission: 0.96 (0.94-0.99) • 5.3B Was the patient reviewed by a member of a specialist palliative care team: ii) In the last 24 hours of the patient’s life:
0.91 (0.86-0.95) • 5.14P Patient made the decision for nil by mouth: 1.00 (N/C) • 5.24A Attempts to contact them were unsuccessful, If no to 5.24 were reasons documented as to why discussion did not
take place: 0.91 (0.73-0.99) • 5.25i If yes to 5.25 (CAN in place), what was the route: 0.92 (0.76-0.99) • 5.4A Is there documented evidence (in case notes or in prescription chart) that anticipatory medication ‘prn’ was
prescribed for agitation/delirium in the last hours or days of life: 0.93 (0.89-0.96) • 5.4E Is there documented evidence (in case notes or in prescription chart) that anticipatory medication ‘prn’ was
prescribed for noisy breathing / death rattle in the last hours or days of life: 0.94 (0.91-0.97) • 5.4D1 Alfentanil prescribed prn: 1.00 (N/C) • 5.4D5 Diamorphine prescribed prn: 0.96 (0.92-0.99) • 5.4D6 Glycopyrronium bromide prescribed prn: 0.94 (0.90-0.98) • 5.4D7 Haloperidol prescribed prn: 0.95 (0.92-0.99) • 5.4D9 Hyoscine hydrobromide prescribed prn: 0.91 (0.85-0.96) • 5.4D11 Levomepromazine prescribed prn: 0.91 (0.86-0.96) • 5.4D15 Morphine prescribed prn: 0.92 (0.88-0.96) • 5.6i If yes to 5.6 Buprenorphine transdermal medication administered: 1.00 (N/C) • 5.6i If yes to 5.6 Fentanyl transdermal medication administered: 1.00 (N/C)
© Healthcare Quality Improvement Partnership 2016 91

End of Life Care Audit – Dying in Hospital report for England
• 5.6i If yes to 5.6 Granisetron transdermal medication administered: 1.00 (N/C) • 5.6i If yes to 5.6 Hyoscine transdermal medication administered: 1.00 (N/C) • 5.6i If yes to 5.6 Rigotidine transdermal medication administered: 1.00 (N/C) • 5.6i If yes to 5.6 Analgesics (painkillers) transdermal medication administered: 1.00 (N/C) • 5.6i If yes to 5.6 Antiemetics (for nausea and vomiting) transdermal medication administered: 1.00 (N/C) • 5.6i If yes to 5.6 Noise respiratory secretions (‘death rattle’) medication administered: 1.00 (N/C) • 5.6i If yes to 5.6 Miscellaneous medication administered: 1.00 (N/C) • 5.7 In the last 24 hours of life is there documented evidence that a continuous subcutaneous infusion (CSCI) of medication
was in place: 0.97 (0.94-0.99) • 5.7D1 Alfentanil prescribed in CSCI: 1.00 (N/C) • 5.7D3 Clonazepam prescribed in CSCI: 1.00 (N/C) • 5.7D4 Cyclizine prescribed in CSCI: 1.00 (N/C) • 5.7D5 Diamorphine prescribed in CSCI: 1.00 (N/C) • 5.7D6 Glycopyrronium bromide prescribed in CSCI: 0.97 (0.92-0.99) • 5.7D7 Haloperidol prescribed in CSCI: 1.00 (N/C) • 5.7D11 Levomepromazine prescribed in CSCI: 0.97 (0.92-0.99) • 5.7D12 Methadone prescribed in CSCI: 1.00 (N/C) • 5.7D13 Metoclopromide prescribed in CSCI: 1.00 (N/C) • 5.7D14 Midazolam prescribed in CSCI: 0.97 (0.92-0.99) • 5.7D15 Morphine prescribed in CSCI: 0.98 (0.96-0.99) • 5.7D16 Octreotide prescribed in CSCI: 1.00 (N/C) • 5.7D17 Oxycodone prescribed in CSCI: 1.00 (N/C) • 5.7 Analgesics (painkillers) prescribed in CSCI: 0.96 (0.87-0.99) • 5.7 Antiemetics (for nausea and vomiting) prescribed in CSCI: 0.97 (0.93-0.99) • 5.7 Sedatives prescribed in CSCI: 0.96 (0.90-0.99) • 5.7 Noise respiratory secretions (‘death rattle’) prescribed in CSCI: 1.00 (N/C) • 5.8D6 Glycopyrronium bromide prescribed in IV/PCA: 1.00 (N/C) • 5.8D14 Morphine prescribed in IV/PCA: 1.00 (N/C) • 5.8D20 Fentanyl prescribed in IV/PCA (info obtained from free-text comment): 1.00 (N/C) • 5.8 Noise respiratory secretions (‘death rattle’) prescribed in IV/PCA: 1.00 (N/C)
Kappa not computable
• 3.2ii If no to 3.2, was the reason it was not taken into account recorded • 3.7a11a If ‘No but’ to 3.7a.ii • 3.8bi If ‘No but’ (3.8b), why so • 5.14D Palliative medicine doctor – Other made the decision for nil by mouth • 5.14G CNS – palliative care nurse made the decision for nil by mouth • 5.14H CNS – other specialty made the decision for nil by mouth • 5.14K Healthcare assistant made the decision for nil by mouth • 5.14N Pharmacist made the decision for nil by mouth • 5.24B IMCA unavailable, If no to 5.24, were reasons documented as to why discussion did not take place • 5.24C LPA personal welfare, If no to 5.24, were reasons documented as to why discussion did not take place • 5.4D2 Apomorphine prescribed prn • 5.4D9 Hyoscine hydrobromide prescribed prn • 5.4D10 Ketamine prescribed prn • 5.4D12 Methadone prescribed prn • 5.4D16 Octreotide prescribed prn • 5.7D2 Apomorphine prescribed in CSCI • 5.7D10 Ketamine prescribed in CSCI • 5.7D18 Remifentanil prescribed in CSCI • 5.7D19 Fentanyl prescribed in CSCI (information obtained from free-text comment) • 5.7 Miscellaneous prescribed in CSCI • 5.8D2 Clonazepam prescribed in IV/PCA • 5.8D3 Cyclizine prescribed in IV/PCA • 5.8D4 Diamorphine prescribed in IV/PCA • 5.8D5 Granisetron prescribed in IV/PCA • 5.8D7 Haloperidol prescribed in IV/PCA • 5.8D8 Hyoscine Butylbromide prescribed in IV/PCA • 5.8D9 Hyoscine Hydrobromide in IV/PCA • 5.8D10 Ketamine prescribed in IV/PCA • 5.8D11 Levomepromazine prescribed in IV/PCA • 5.8D12 Methadone prescribed in IV/PCA • 5.8D13 Metoclopromide prescribed in IV/PCA • 5.8D16 Ondansetron prescribed in IV/PCA • 5.8D17 Oxycodone prescribed in IV/PCA • 5.8 Antiemetics (for nausea and vomiting) prescribed in IV/PCA
92 © Healthcare Quality Improvement Partnership 2016
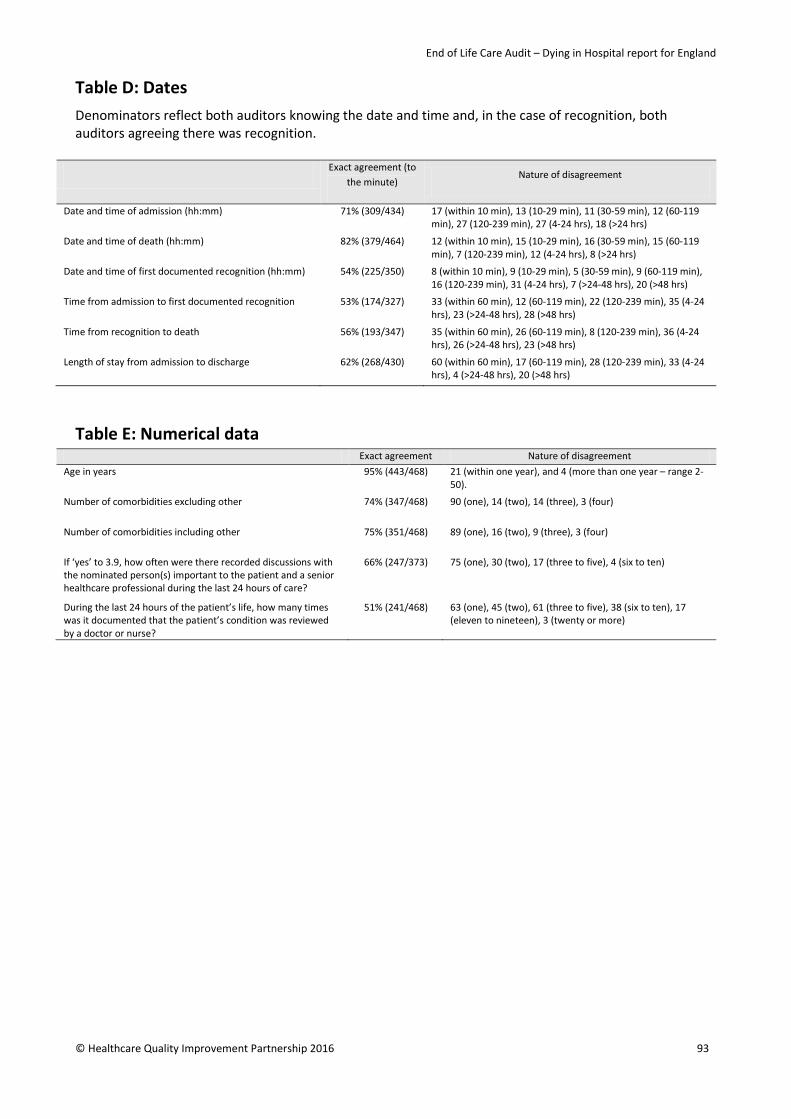
End of Life Care Audit – Dying in Hospital report for England
Table D: Dates Denominators reflect both auditors knowing the date and time and, in the case of recognition, both auditors agreeing there was recognition.
Exact agreement (to the minute)
Nature of disagreement
Date and time of admission (hh:mm) 71% (309/434) 17 (within 10 min), 13 (10-29 min), 11 (30-59 min), 12 (60-119 min), 27 (120-239 min), 27 (4-24 hrs), 18 (>24 hrs)
Date and time of death (hh:mm) 82% (379/464) 12 (within 10 min), 15 (10-29 min), 16 (30-59 min), 15 (60-119 min), 7 (120-239 min), 12 (4-24 hrs), 8 (>24 hrs)
Date and time of first documented recognition (hh:mm) 54% (225/350) 8 (within 10 min), 9 (10-29 min), 5 (30-59 min), 9 (60-119 min), 16 (120-239 min), 31 (4-24 hrs), 7 (>24-48 hrs), 20 (>48 hrs)
Time from admission to first documented recognition 53% (174/327) 33 (within 60 min), 12 (60-119 min), 22 (120-239 min), 35 (4-24 hrs), 23 (>24-48 hrs), 28 (>48 hrs)
Time from recognition to death 56% (193/347) 35 (within 60 min), 26 (60-119 min), 8 (120-239 min), 36 (4-24 hrs), 26 (>24-48 hrs), 23 (>48 hrs)
Length of stay from admission to discharge 62% (268/430) 60 (within 60 min), 17 (60-119 min), 28 (120-239 min), 33 (4-24 hrs), 4 (>24-48 hrs), 20 (>48 hrs)
Table E: Numerical data Exact agreement Nature of disagreement
Age in years 95% (443/468) 21 (within one year), and 4 (more than one year – range 2-50).
Number of comorbidities excluding other 74% (347/468) 90 (one), 14 (two), 14 (three), 3 (four)
Number of comorbidities including other 75% (351/468) 89 (one), 16 (two), 9 (three), 3 (four)
If ‘yes’ to 3.9, how often were there recorded discussions with the nominated person(s) important to the patient and a senior healthcare professional during the last 24 hours of care?
66% (247/373) 75 (one), 30 (two), 17 (three to five), 4 (six to ten)
During the last 24 hours of the patient’s life, how many times was it documented that the patient’s condition was reviewed by a doctor or nurse?
51% (241/468) 63 (one), 45 (two), 61 (three to five), 38 (six to ten), 17 (eleven to nineteen), 3 (twenty or more)
© Healthcare Quality Improvement Partnership 2016 93
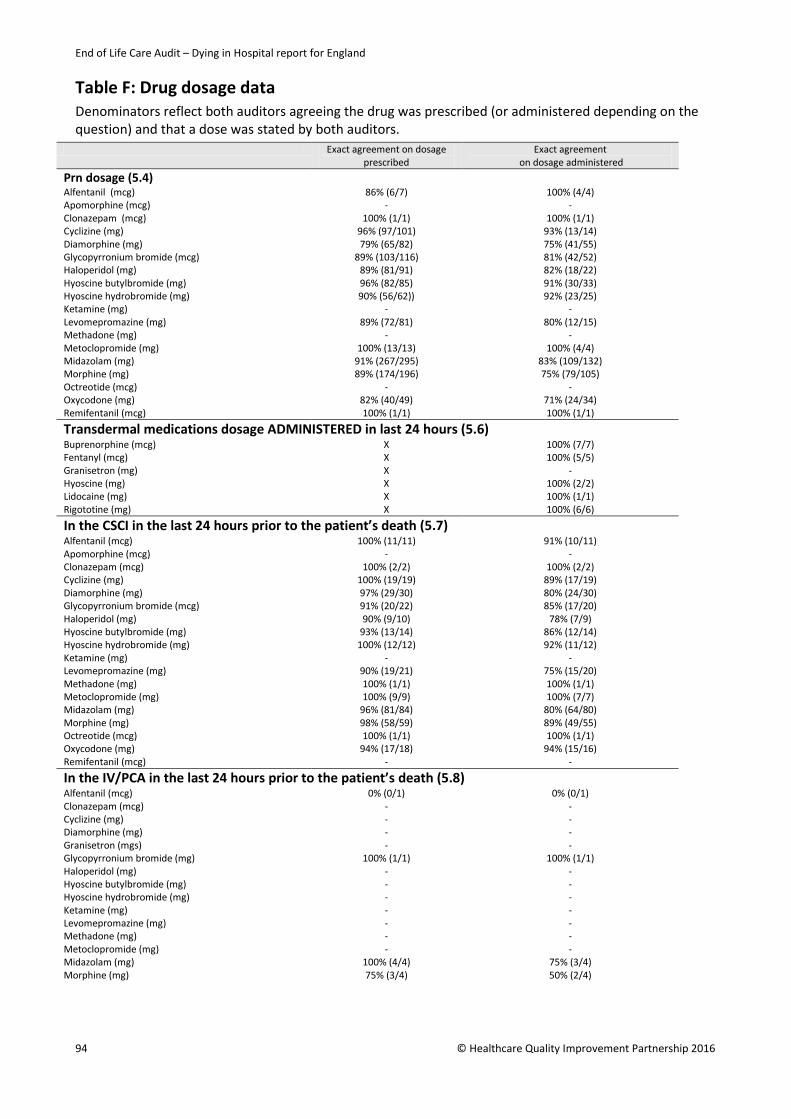
End of Life Care Audit – Dying in Hospital report for England
Table F: Drug dosage data Denominators reflect both auditors agreeing the drug was prescribed (or administered depending on the question) and that a dose was stated by both auditors.
Exact agreement on dosage prescribed
Exact agreement on dosage administered
Prn dosage (5.4) Alfentanil (mcg) 86% (6/7) 100% (4/4) Apomorphine (mcg) - - Clonazepam (mcg) 100% (1/1) 100% (1/1) Cyclizine (mg) 96% (97/101) 93% (13/14) Diamorphine (mg) 79% (65/82) 75% (41/55) Glycopyrronium bromide (mcg) 89% (103/116) 81% (42/52) Haloperidol (mg) 89% (81/91) 82% (18/22) Hyoscine butylbromide (mg) 96% (82/85) 91% (30/33) Hyoscine hydrobromide (mg) 90% (56/62)) 92% (23/25) Ketamine (mg) - - Levomepromazine (mg) 89% (72/81) 80% (12/15) Methadone (mg) - - Metoclopromide (mg) 100% (13/13) 100% (4/4) Midazolam (mg) 91% (267/295) 83% (109/132) Morphine (mg) 89% (174/196) 75% (79/105) Octreotide (mcg) - - Oxycodone (mg) 82% (40/49) 71% (24/34) Remifentanil (mcg) 100% (1/1) 100% (1/1)
Transdermal medications dosage ADMINISTERED in last 24 hours (5.6) Buprenorphine (mcg) X 100% (7/7) Fentanyl (mcg) X 100% (5/5) Granisetron (mg) X - Hyoscine (mg) X 100% (2/2) Lidocaine (mg) X 100% (1/1) Rigototine (mg) X 100% (6/6)
In the CSCI in the last 24 hours prior to the patient’s death (5.7) Alfentanil (mcg) 100% (11/11) 91% (10/11) Apomorphine (mcg) - - Clonazepam (mcg) 100% (2/2) 100% (2/2) Cyclizine (mg) 100% (19/19) 89% (17/19) Diamorphine (mg) 97% (29/30) 80% (24/30) Glycopyrronium bromide (mcg) 91% (20/22) 85% (17/20) Haloperidol (mg) 90% (9/10) 78% (7/9) Hyoscine butylbromide (mg) 93% (13/14) 86% (12/14) Hyoscine hydrobromide (mg) 100% (12/12) 92% (11/12) Ketamine (mg) - - Levomepromazine (mg) 90% (19/21) 75% (15/20) Methadone (mg) 100% (1/1) 100% (1/1) Metoclopromide (mg) 100% (9/9) 100% (7/7) Midazolam (mg) 96% (81/84) 80% (64/80) Morphine (mg) 98% (58/59) 89% (49/55) Octreotide (mcg) 100% (1/1) 100% (1/1) Oxycodone (mg) 94% (17/18) 94% (15/16) Remifentanil (mcg) - -
In the IV/PCA in the last 24 hours prior to the patient’s death (5.8) Alfentanil (mcg) 0% (0/1) 0% (0/1) Clonazepam (mcg) - - Cyclizine (mg) - - Diamorphine (mg) - - Granisetron (mgs) - - Glycopyrronium bromide (mg) 100% (1/1) 100% (1/1) Haloperidol (mg) - - Hyoscine butylbromide (mg) - - Hyoscine hydrobromide (mg) - - Ketamine (mg) - - Levomepromazine (mg) - - Methadone (mg) - - Metoclopromide (mg) - - Midazolam (mg) 100% (4/4) 75% (3/4) Morphine (mg) 75% (3/4) 50% (2/4)
94 © Healthcare Quality Improvement Partnership 2016

End of Life Care Audit – Dying in Hospital report for England
Ondansetron (mg) - - Oxycodone (mg) - - Propofol (mg) 60% (3/5) 60% (3/5) Remifentanil (mcg) 100% (1/1) 100% (1/1)
© Healthcare Quality Improvement Partnership 2016 95

End of Life Care Audit – Dying in Hospital report for England
Appendix V: Participation / non-participation
Participating sites (Please note that where sites have entered 10 cases or fewer, these results have been omitted from the Appendix VI table.)
Aintree University Hospitals NHS Foundation Trust Airedale NHS Foundation Trust Ashford and St Peter's Hospitals NHS Foundation Trust Barking, Havering and Redbridge University Hospitals NHS Trust Barnsley Hospital NHS Foundation Trust Barts Health NHS Trust Basildon and Thurrock University Hospitals NHS Foundation Trust Bedford Hospital NHS Trust Blackpool Teaching Hospitals NHS Foundation Trust Bolton NHS Foundation Trust Bradford Teaching Hospitals NHS Foundation Trust Brighton and Sussex University Hospitals NHS Trust Buckinghamshire Healthcare NHS Trust Burton Hospitals NHS Foundation Trust Calderdale and Huddersfield NHS Foundation Trust Cambridge University Hospitals NHS Foundation Trust Central Manchester University Hospitals NHS Foundation Trust Chelsea and Westminster Hospital NHS Foundation Trust Chesterfield Royal Hospital NHS Foundation Trust City Hospitals Sunderland NHS Foundation Trust Colchester Hospital University NHS Foundation Trust Countess of Chester Hospital NHS Foundation Trust Croydon Health Services NHS Trust Dartford and Gravesham NHS Trust Derby Hospitals NHS Foundation Trust Doncaster and Bassetlaw NHS Foundation Trust Dorset County Hospital NHS Foundation Trust Dudley Group of Hospitals NHS Foundation Trust Ealing Hospital East and North Hertfordshire NHS Trust East Cheshire NHS Trust East Kent Hospitals University NHS Foundation Trust East Lancashire Hospitals NHS Trust East Sussex Healthcare NHS Trust Epsom and St Helier University Hospitals NHS Trust Frimley Health NHS Foundation Trust Gateshead Health NHS Foundation Trust George Eliot Hospital NHS Trust Gloucestershire Hospitals NHS Foundation Trust Great Western Hospital (Community sites) Great Western Hospitals NHS Foundation Trust Guy’s and St Thomas’ NHS Foundation Trust Hampshire Hospitals NHS Foundation Trust Harefield Harrogate & District NHS Foundation Trust
96 © Healthcare Quality Improvement Partnership 2016
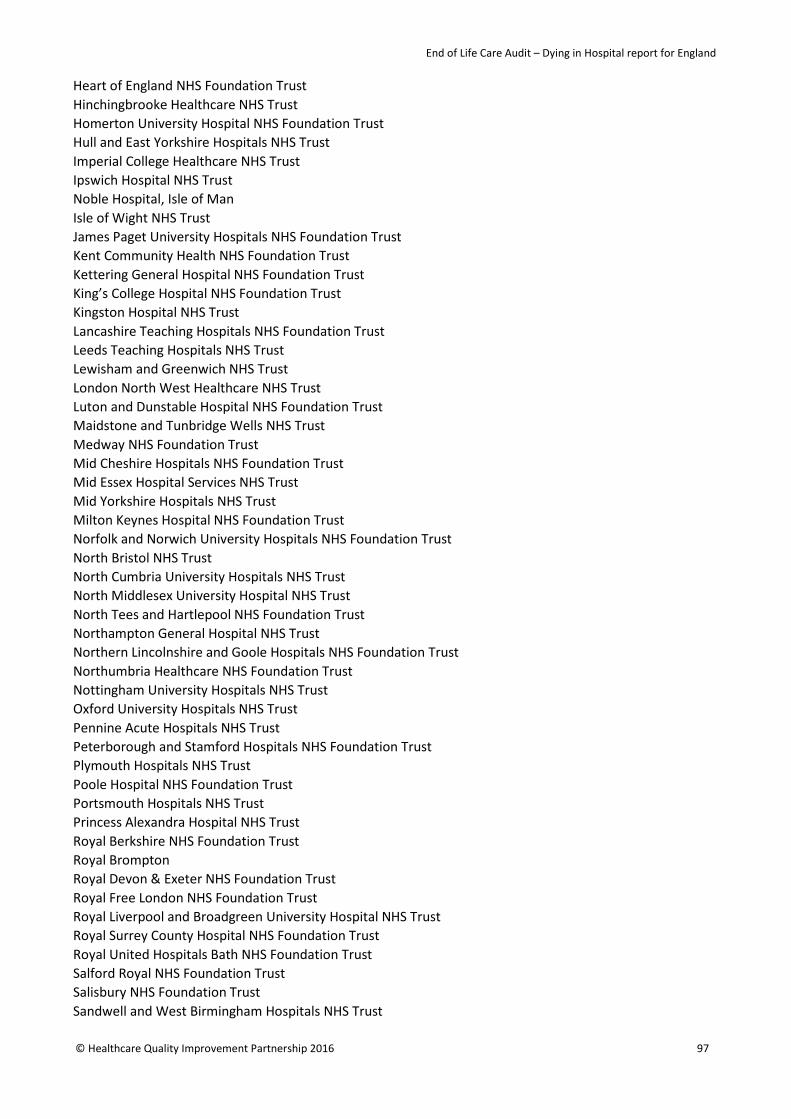
End of Life Care Audit – Dying in Hospital report for England
Heart of England NHS Foundation Trust Hinchingbrooke Healthcare NHS Trust Homerton University Hospital NHS Foundation Trust Hull and East Yorkshire Hospitals NHS Trust Imperial College Healthcare NHS Trust Ipswich Hospital NHS Trust Noble Hospital, Isle of Man Isle of Wight NHS Trust James Paget University Hospitals NHS Foundation Trust Kent Community Health NHS Foundation Trust Kettering General Hospital NHS Foundation Trust King’s College Hospital NHS Foundation Trust Kingston Hospital NHS Trust Lancashire Teaching Hospitals NHS Foundation Trust Leeds Teaching Hospitals NHS Trust Lewisham and Greenwich NHS Trust London North West Healthcare NHS Trust Luton and Dunstable Hospital NHS Foundation Trust Maidstone and Tunbridge Wells NHS Trust Medway NHS Foundation Trust Mid Cheshire Hospitals NHS Foundation Trust Mid Essex Hospital Services NHS Trust Mid Yorkshire Hospitals NHS Trust Milton Keynes Hospital NHS Foundation Trust Norfolk and Norwich University Hospitals NHS Foundation Trust North Bristol NHS Trust North Cumbria University Hospitals NHS Trust North Middlesex University Hospital NHS Trust North Tees and Hartlepool NHS Foundation Trust Northampton General Hospital NHS Trust Northern Lincolnshire and Goole Hospitals NHS Foundation Trust Northumbria Healthcare NHS Foundation Trust Nottingham University Hospitals NHS Trust Oxford University Hospitals NHS Trust Pennine Acute Hospitals NHS Trust Peterborough and Stamford Hospitals NHS Foundation Trust Plymouth Hospitals NHS Trust Poole Hospital NHS Foundation Trust Portsmouth Hospitals NHS Trust Princess Alexandra Hospital NHS Trust Royal Berkshire NHS Foundation Trust Royal Brompton Royal Devon & Exeter NHS Foundation Trust Royal Free London NHS Foundation Trust Royal Liverpool and Broadgreen University Hospital NHS Trust Royal Surrey County Hospital NHS Foundation Trust Royal United Hospitals Bath NHS Foundation Trust Salford Royal NHS Foundation Trust Salisbury NHS Foundation Trust Sandwell and West Birmingham Hospitals NHS Trust
© Healthcare Quality Improvement Partnership 2016 97
End of Life Care Audit – Dying in Hospital report for England
Sheffield Teaching Hospitals NHS Foundation Trust Sherwood Forest Hospitals NHS Foundation Trust Solent NHS Trust South Tees Hospitals NHS Foundation Trust South Tyneside NHS Foundation Trust South Warwickshire NHS Foundation Trust Southend University Hospital NHS Foundation Trust Southport and Ormskirk Hospital NHS Trust St George’s University Hospitals NHS Foundation Trust St Helens & Knowsley NHS Trust Stockport NHS Foundation Trust Surrey and Sussex NHS Trust Tameside Hospital NHS Foundation Trust Taunton and Somerset NHS Foundation Trust The Christie NHS Foundation Trust The Clatterbridge Cancer Centre NHS Foundation Trust The Hillingdon Hospitals NHS Foundation Trust The Newcastle upon Tyne Hospitals NHS Foundation Trust The Queen Elizabeth Hospital King's Lynn NHS Foundation Trust The Rotherham NHS Foundation Trust The Royal Bournemouth & Christchurch Hospitals NHS Foundation Trust The Royal Marsden NHS Foundation Trust The Royal Wolverhampton NHS Trust The Shrewsbury and Telford Hospital NHS Trust Torbay and South Devon Healthcare NHS Foundation Trust United Lincolnshire Hospitals NHS Trust University College London Hospitals NHS Foundation Trust University Hospital Birmingham NHS Foundation Trust University Hospital of South Manchester NHS Foundation Trust University Hospital Southampton NHS Foundation Trust University Hospitals Bristol NHS Foundation Trust University Hospitals of Coventry and Warwickshire NHS Trust University Hospitals of Leicester NHS Trust University Hospitals of Morecambe Bay University Hospitals of North Midlands – County Hospital Stafford University Hospitals of North Midlands – Royal Stoke University Hospital Walsall Healthcare NHS Trust Warrington and Halton Hospitals NHS Foundation Trust West Hertfordshire Hospitals NHS Trust West Middlesex University Hospital NHS Trust West Suffolk NHS Foundation Trust Western Sussex Hospitals NHS Trust Weston Area Health NHS Trust Whittington Health NHS Trust Wirral University Teaching Hospital NHS Foundation Trust Worcestershire Acute Hospitals NHS Trust Wrightington, Wigan and Leigh NHS Foundation Trust Wye Valley NHS Trust Yeovil District Hospital NHS Foundation Trust York Teaching Hospital NHS Foundation Trust
98 © Healthcare Quality Improvement Partnership 2016

End of Life Care Audit – Dying in Hospital report for England
Non-participating sites County Durham and Darlington NHS Foundation Trust North Devon Healthcare NHS Trust Royal Cornwell Hospitals NHS Trust
© Healthcare Quality Improvement Partnership 2016 99
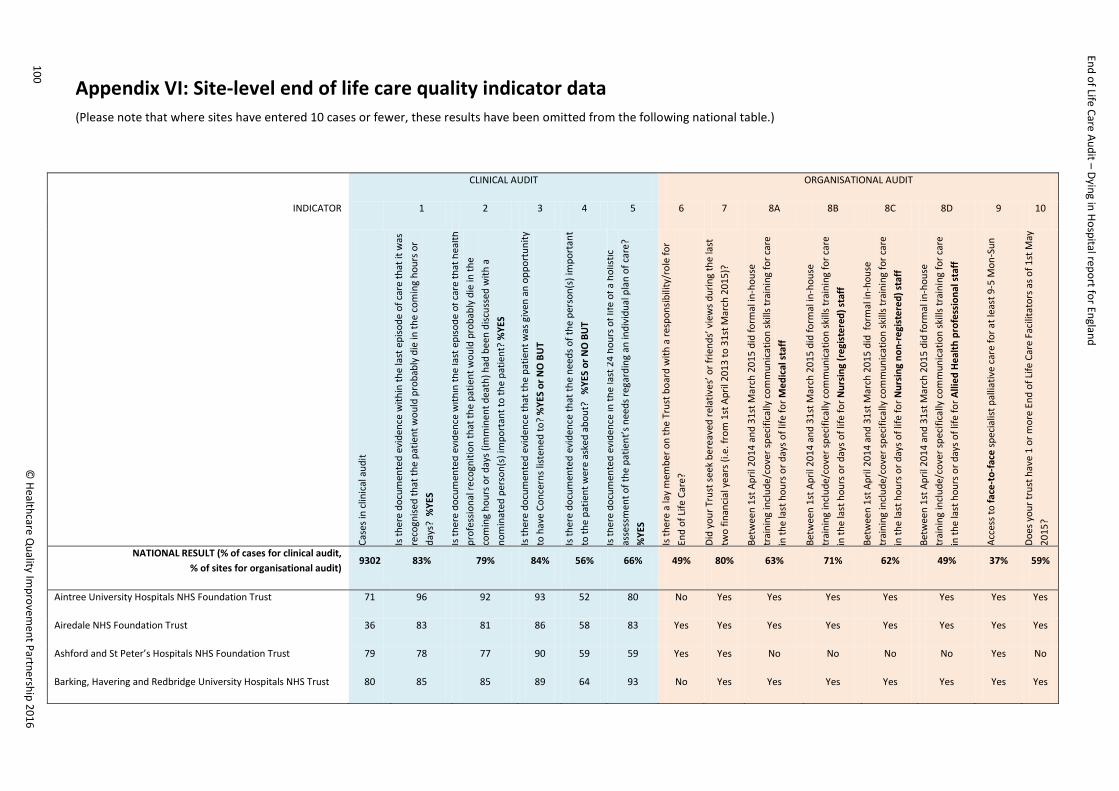
End of Life Care Audit – Dying in Hospital report for England
Appendix VI: Site-level end of life care quality indicator data (Please note that where sites have entered 10 cases or fewer, these results have been omitted from the following national table.)
CLINICAL AUDIT ORGANISATIONAL AUDIT
INDICATOR 1 2 3 4 5 6 7 8A 8B 8C 8D 9 10
Case
s in
clin
ical
aud
it
Is th
ere
docu
men
ted
evid
ence
with
in th
e la
st e
piso
de o
f car
e th
at it
was
re
cogn
ised
that
the
patie
nt w
ould
pro
babl
y di
e in
the
com
ing
hour
s or
days
? %
YES
Is th
ere
docu
men
ted
evid
ence
with
in th
e la
st e
piso
de o
f car
e th
at h
ealth
pr
ofes
siona
l rec
ogni
tion
that
the
patie
nt w
ould
pro
babl
y di
e in
the
com
ing
hour
s or d
ays (
imm
inen
t dea
th) h
ad b
een
disc
usse
d w
ith a
no
min
ated
per
son(
s) im
port
ant t
o th
e pa
tient
? %
YES
Is th
ere
docu
men
ted
evid
ence
that
the
patie
nt w
as g
iven
an
oppo
rtun
ity
to h
ave
Conc
erns
list
ened
to?
%YE
S or
NO
BU
T
Is th
ere
docu
men
ted
evid
ence
that
the
need
s of t
he p
erso
n(s)
impo
rtan
t to
the
patie
nt w
ere
aske
d ab
out?
%
YES
or N
O B
UT
Is th
ere
docu
men
ted
evid
ence
in th
e la
st 2
4 ho
urs o
f life
of a
hol
istic
as
sess
men
t of t
he p
atie
nt’s
nee
ds re
gard
ing
an in
divi
dual
pla
n of
car
e?
%YE
S
Is th
ere
a la
y m
embe
r on
the
Trus
t boa
rd w
ith a
resp
onsib
ility
/rol
e fo
r En
d of
Life
Car
e?
Did
your
Tru
st se
ek b
erea
ved
rela
tives
’ or f
riend
s’ v
iew
s dur
ing
the
last
tw
o fin
anci
al y
ears
(i.e
. fro
m 1
st A
pril
2013
to 3
1st M
arch
201
5)?
Betw
een
1st A
pril
2014
and
31s
t Mar
ch 2
015
did
form
al in
-hou
se
trai
ning
incl
ude/
cove
r spe
cific
ally
com
mun
icat
ion
skill
s tra
inin
g fo
r car
e in
the
last
hou
rs o
r day
s of l
ife fo
r Med
ical
staf
f
Betw
een
1st A
pril
2014
and
31s
t Mar
ch 2
015
did
form
al in
-hou
se
trai
ning
incl
ude/
cove
r spe
cific
ally
com
mun
icat
ion
skill
s tra
inin
g fo
r car
e in
the
last
hou
rs o
r day
s of l
ife fo
r Nur
sing
(reg
iste
red)
staf
f
Betw
een
1st A
pril
2014
and
31s
t Mar
ch 2
015
did
form
al in
-hou
se
trai
ning
incl
ude/
cove
r spe
cific
ally
com
mun
icat
ion
skill
s tra
inin
g fo
r car
e in
the
last
hou
rs o
r day
s of l
ife fo
r Nur
sing
non
-reg
iste
red)
staf
f
Betw
een
1st A
pril
2014
and
31s
t Mar
ch 2
015
did
form
al in
-hou
se
trai
ning
incl
ude/
cove
r spe
cific
ally
com
mun
icat
ion
skill
s tra
inin
g fo
r car
e in
the
last
hou
rs o
r day
s of l
ife fo
r Alli
ed H
ealth
pro
fess
iona
l sta
ff
Acce
ss to
face
-to-
face
spec
ialis
t pal
liativ
e ca
re fo
r at l
east
9-5
Mon
-Sun
Does
you
r tru
st h
ave
1 or
mor
e En
d of
Life
Car
e Fa
cilit
ator
s as o
f 1st
May
20
15?
NATIONAL RESULT (% of cases for clinical audit, % of sites for organisational audit)
9302 83% 79% 84% 56% 66% 49% 80% 63% 71% 62% 49% 37% 59%
Aintree University Hospitals NHS Foundation Trust 71 96 92 93 52 80 No Yes Yes Yes Yes Yes Yes Yes
Airedale NHS Foundation Trust 36 83 81 86 58 83 Yes Yes Yes Yes Yes Yes Yes Yes
Ashford and St Peter’s Hospitals NHS Foundation Trust 79 78 77 90 59 59 Yes Yes No No No No Yes No
Barking, Havering and Redbridge University Hospitals NHS Trust 80 85 85 89 64 93 No Yes Yes Yes Yes Yes Yes Yes
100 ©
Healthcare Quality Im
provement Partnership 2016
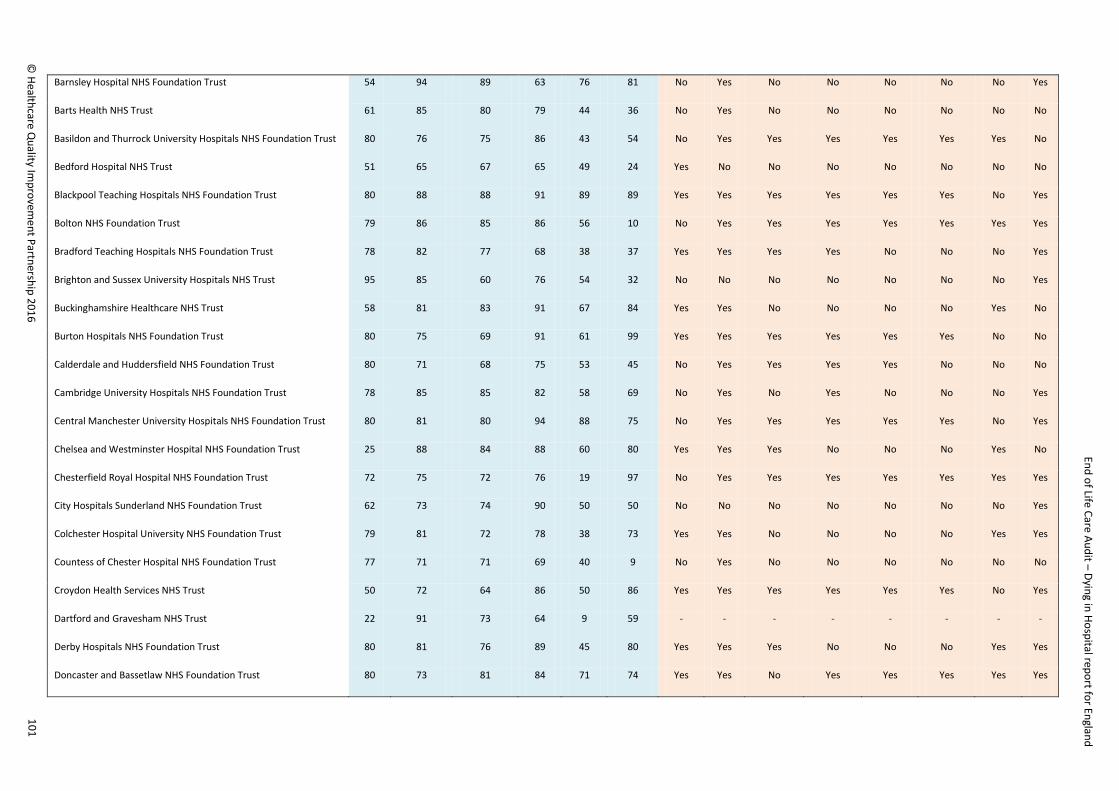
End of Life Care Audit – Dying in Hospital report for England
Barnsley Hospital NHS Foundation Trust 54 94 89 63 76 81 No Yes No No No No No Yes
Barts Health NHS Trust 61 85 80 79 44 36 No Yes No No No No No No
Basildon and Thurrock University Hospitals NHS Foundation Trust 80 76 75 86 43 54 No Yes Yes Yes Yes Yes Yes No
Bedford Hospital NHS Trust 51 65 67 65 49 24 Yes No No No No No No No
Blackpool Teaching Hospitals NHS Foundation Trust 80 88 88 91 89 89 Yes Yes Yes Yes Yes Yes No Yes
Bolton NHS Foundation Trust 79 86 85 86 56 10 No Yes Yes Yes Yes Yes Yes Yes
Bradford Teaching Hospitals NHS Foundation Trust 78 82 77 68 38 37 Yes Yes Yes Yes No No No Yes
Brighton and Sussex University Hospitals NHS Trust 95 85 60 76 54 32 No No No No No No No Yes
Buckinghamshire Healthcare NHS Trust 58 81 83 91 67 84 Yes Yes No No No No Yes No
Burton Hospitals NHS Foundation Trust 80 75 69 91 61 99 Yes Yes Yes Yes Yes Yes No No
Calderdale and Huddersfield NHS Foundation Trust 80 71 68 75 53 45 No Yes Yes Yes Yes No No No
Cambridge University Hospitals NHS Foundation Trust 78 85 85 82 58 69 No Yes No Yes No No No Yes
Central Manchester University Hospitals NHS Foundation Trust 80 81 80 94 88 75 No Yes Yes Yes Yes Yes No Yes
Chelsea and Westminster Hospital NHS Foundation Trust 25 88 84 88 60 80 Yes Yes Yes No No No Yes No
Chesterfield Royal Hospital NHS Foundation Trust 72 75 72 76 19 97 No Yes Yes Yes Yes Yes Yes Yes
City Hospitals Sunderland NHS Foundation Trust 62 73 74 90 50 50 No No No No No No No Yes
Colchester Hospital University NHS Foundation Trust 79 81 72 78 38 73 Yes Yes No No No No Yes Yes
Countess of Chester Hospital NHS Foundation Trust 77 71 71 69 40 9 No Yes No No No No No No
Croydon Health Services NHS Trust 50 72 64 86 50 86 Yes Yes Yes Yes Yes Yes No Yes
Dartford and Gravesham NHS Trust 22 91 73 64 9 59 - - - - - - - -
Derby Hospitals NHS Foundation Trust 80 81 76 89 45 80 Yes Yes Yes No No No Yes Yes
Doncaster and Bassetlaw NHS Foundation Trust 80 73 81 84 71 74 Yes Yes No Yes Yes Yes Yes Yes
© Healthcare Q
uality Improvem
ent Partnership 2016 101

End of Life Care Audit – Dying in Hospital report for England
Dorset County Hospital NHS Foundation Trust 49 82 65 59 20 27 Yes No No No No No No No
Dudley Group of Hospitals NHS Foundation Trust 80 84 81 96 59 80 Yes Yes No Yes Yes Yes No No
Ealing Hospital 40 73 70 88 45 53 Yes No Yes No No No No No
East and North Hertfordshire NHS Trust 50 78 80 90 80 76 Yes Yes Yes Yes Yes Yes Yes Yes
East Cheshire NHS Trust 45 84 76 84 53 64 Yes Yes Yes Yes No Yes No Yes
East Kent Hospitals University NHS Foundation Trust 80 80 76 60 29 50 Yes Yes Yes Yes Yes No Yes No
East Lancashire Hospitals NHS Trust 80 85 79 95 63 25 Yes Yes No Yes Yes No Yes Yes
East Sussex Healthcare NHS Trust 81 79 77 95 36 91 No Yes No No No No No Yes
Epsom and St Helier University Hospitals NHS Trust 80 76 74 74 44 25 Yes Yes Yes Yes Yes No No Yes
Frimley Health NHS Foundation Trust 80 80 78 88 76 73 No Yes Yes Yes Yes No Yes Yes
Gateshead Health NHS Foundation Trust 77 82 82 81 71 88 Yes Yes Yes Yes Yes Yes No Yes
George Eliot Hospital NHS Trust 52 75 73 85 58 52 No Yes Yes Yes No No No Yes
Gloucestershire Hospitals NHS Foundation Trust 71 83 85 79 30 54 No Yes Yes No No No No No
Great Western Hospitals NHS Foundation Trust 80 78 75 71 16 4 Yes Yes Yes Yes Yes Yes No Yes
Guy’s and St Thomas’ NHS Foundation Trust 80 84 80 94 86 79 No Yes Yes Yes Yes Yes Yes Yes
Hampshire Hospitals NHS Foundation Trust 80 93 93 90 75 75 No Yes Yes Yes Yes Yes Yes Yes
Harefield 15 87 87 80 67 80 No Yes Yes Yes Yes No No No
Harrogate & District NHS Foundation Trust 45 96 87 91 69 69 No Yes No No No No No Yes
Heart of England NHS Foundation Trust 27 78 78 59 37 78 - - - - - - - -
Hinchingbrooke Healthcare NHS Trust 31 90 90 94 39 58 No No No Yes Yes Yes No No
Homerton University Hospital NHS Foundation Trust 34 91 85 88 74 44 Yes Yes No No No No No No
Hull and East Yorkshire Hospitals NHS Trust 80 86 83 80 49 45 No Yes Yes Yes Yes Yes No No
102 ©
Healthcare Quality Im
provement Partnership 2016

End of Life Care Audit – Dying in Hospital report for England
Imperial College Healthcare NHS Trust 80 88 83 94 81 81 Yes No No No No No No No
Ipswich Hospital NHS Trust 79 80 77 63 18 29 No Yes Yes Yes Yes Yes No Yes
Noble Hospital, Isle of Man 27 78 78 100 89 89 No No Yes Yes Yes Yes No No
Isle of Wight NHS Trust 24 92 88 42 46 92 Yes No Yes Yes Yes Yes Yes Yes
James Paget University Hospitals NHS Foundation Trust 69 86 84 88 45 96 No Yes Yes Yes Yes Yes No Yes
Kettering General Hospital NHS Foundation Trust 80 75 71 73 41 41 Yes Yes Yes Yes Yes Yes No Yes
King’s College Hospital NHS Foundation Trust 85 88 84 95 68 78 Yes Yes Yes Yes Yes No No No
Kingston Hospital NHS Trust 44 86 84 100 70 93 Yes Yes Yes Yes Yes Yes No Yes
Lancashire Teaching Hospitals NHS Foundation Trust 80 83 78 86 55 58 No Yes Yes Yes Yes Yes No Yes
Leeds Teaching Hospitals NHS Trust 80 81 75 94 80 93 No Yes No No No No No Yes
Lewisham and Greenwich NHS Trust 70 73 74 77 54 80 Yes No No Yes Yes No No No
London North West Healthcare NHS Trust 45 71 71 76 11 20 Yes Yes Yes Yes Yes No No No
Luton and Dunstable Hospital NHS Foundation Trust 67 78 84 76 64 67 No Yes Yes Yes Yes Yes Yes No
Maidstone and Tunbridge Wells NHS Trust 44 64 64 70 45 48 No No Yes Yes Yes Yes No Yes
Medway NHS Foundation Trust 80 85 83 93 61 60 No Yes No No No No No Yes
Mid Cheshire Hospitals NHS Foundation Trust 73 89 82 88 62 73 Yes Yes Yes Yes Yes Yes No Yes
Mid Essex Hospital Services NHS Trust 78 91 87 81 47 42 Yes No Yes No No No Yes Yes
Mid Yorkshire Hospitals NHS Trust 80 85 85 98 54 63 Yes Yes No Yes No No No Yes
Milton Keynes Hospital NHS Foundation Trust 50 92 86 88 58 52 No Yes Yes Yes Yes No Yes No
Norfolk and Norwich University Hospitals NHS Foundation Trust 81 88 80 83 48 72 No Yes Yes Yes Yes Yes No Yes
North Bristol NHS Trust 52 79 77 98 58 71 No No Yes Yes No No No Yes
North Cumbria University Hospitals NHS Trust 79 85 82 77 35 44 Yes No Yes Yes Yes Yes No No
103 ©
Healthcare Quality Im
provement Partnership 2016

End of Life Care Audit – Dying in Hospital report for England
North Middlesex University Hospital NHS Trust 63 76 71 89 16 40 Yes No Yes No No No No No
North Tees and Hartlepool NHS Foundation Trust 80 70 74 73 60 70 Yes Yes Yes Yes No Yes No Yes
Northampton General Hospital NHS Trust 80 70 65 84 46 50 Yes No No Yes Yes No No Yes
Northern Lincolnshire and Goole Hospitals NHS Foundation Trust 77 82 79 79 34 83 Yes Yes Yes Yes Yes Yes No Yes
Northumbria Healthcare NHS Foundation Trust 58 93 90 91 60 59 Yes Yes No Yes Yes No Yes No
Nottingham University Hospitals NHS Trust 80 88 84 91 78 84 Yes Yes Yes Yes Yes Yes No No
Oxford University Hospitals NHS Trust 81 78 75 73 41 89 No Yes No No No No No No
Pennine Acute Hospitals NHS Trust 78 81 82 81 36 60 No Yes Yes No No No No Yes
Peterborough and Stamford Hospitals NHS Foundation Trust 80 85 83 86 68 66 No Yes No No No No Yes No
Plymouth Hospitals NHS Trust 78 85 85 81 28 35 Yes Yes Yes Yes Yes Yes No Yes
Poole Hospital NHS Foundation Trust 66 86 85 94 91 88 No Yes Yes Yes Yes Yes No Yes
Portsmouth Hospitals NHS Trust 80 85 81 90 64 69 No Yes Yes Yes Yes Yes Yes No
Princess Alexandra Hospital NHS Trust 58 78 72 84 53 67 Yes Yes Yes Yes Yes Yes No No
Royal Berkshire NHS Foundation Trust 84 86 82 96 90 92 Yes Yes Yes Yes Yes Yes Yes Yes
Royal Devon & Exeter NHS Foundation Trust 79 89 89 85 51 68 No No Yes Yes Yes No No Yes
Royal Free London NHS Foundation Trust 79 86 76 76 62 90 No Yes Yes Yes No No No No
Royal Liverpool and Broadgreen University Hospital NHS Trust 69 77 77 91 86 68 Yes Yes Yes Yes Yes Yes Yes Yes
Royal Surrey County Hospital NHS Foundation Trust 60 92 90 85 63 63 No Yes Yes Yes Yes Yes Yes Yes
Royal United Hospitals Bath NHS Foundation Trust 80 81 81 94 78 86 No Yes Yes Yes Yes Yes No Yes
Salford Royal NHS Foundation Trust 80 88 83 99 79 96 Yes Yes Yes Yes Yes Yes Yes Yes
Salisbury NHS Foundation Trust 42 83 86 81 40 76 Yes Yes Yes Yes Yes Yes Yes No
Sandwell and West Birmingham Hospitals NHS Trust 80 98 93 96 85 94 No Yes Yes Yes Yes No Yes Yes
104 ©
Healthcare Quality Im
provement Partnership 2016

End of Life Care Audit – Dying in Hospital report for England
Sheffield Teaching Hospitals NHS Foundation Trust 80 86 80 74 30 24 No Yes No No No No Yes Yes
Sherwood Forest Hospitals NHS Foundation Trust 81 85 84 91 69 95 No Yes Yes Yes Yes Yes Yes Yes
South Tees Hospitals NHS Foundation Trust 79 91 89 95 87 81 Yes Yes No No No No No No
South Tyneside NHS Foundation Trust 53 75 75 87 75 26 No Yes No No No No No Yes
South Warwickshire NHS Foundation Trust 46 89 89 87 70 43 No Yes Yes Yes Yes Yes No Yes
Southend University Hospital NHS Foundation Trust 80 85 78 83 46 65 Yes Yes No Yes Yes Yes No No
Southport and Ormskirk Hospital NHS Trust 34 82 79 97 68 50 No Yes Yes Yes Yes Yes Yes Yes
St George’s University Hospitals NHS Foundation Trust 35 86 83 89 94 63 No Yes Yes Yes No No Yes No
St Helens & Knowsley NHS Trust 67 88 84 82 76 72 No Yes Yes Yes Yes Yes Yes Yes
Stockport NHS Foundation Trust 80 78 76 100 88 90 Yes Yes No No No No Yes Yes
Surrey and Sussex NHS Trust 79 80 76 73 34 48 Yes Yes Yes Yes Yes Yes No No
Tameside Hospital NHS Foundation Trust 66 67 64 100 68 92 Yes Yes No Yes Yes No Yes Yes
Taunton and Somerset NHS Foundation Trust 80 83 83 76 43 33 No Yes No No No No No No
The Christie NHS Foundation Trust 22 100 100 100 95 91 Yes No Yes Yes Yes Yes Yes No
The Clatterbridge Cancer Centre NHS Foundation Trust 19 95 95 95 95 100 No Yes No Yes No No Yes Yes
The Hillingdon Hospitals NHS Foundation Trust 59 98 95 97 69 36 No Yes No Yes Yes Yes No No
The Newcastle upon Tyne Hospitals NHS Foundation Trust 80 90 88 99 93 100 Yes Yes Yes Yes Yes Yes No Yes
The Queen Elizabeth Hospital King’s Lynn NHS Foundation Trust 60 77 72 95 72 88 Yes Yes Yes Yes Yes Yes Yes No
The Rotherham NHS Foundation Trust 80 83 78 94 65 58 No No Yes Yes No No Yes No
The Royal Bournemouth & Christchurch Hospitals NHS Foundation Trust 80 88 80 83 51 84 No Yes No Yes No No No Yes
The Royal Marsden NHS Foundation Trust 17 100 94 88 76 100 No Yes Yes Yes Yes Yes Yes No
The Royal Wolverhampton NHS Trust 80 71 69 99 85 96 Yes Yes Yes Yes Yes Yes No No
105 ©
Healthcare Quality Im
provement Partnership 2016
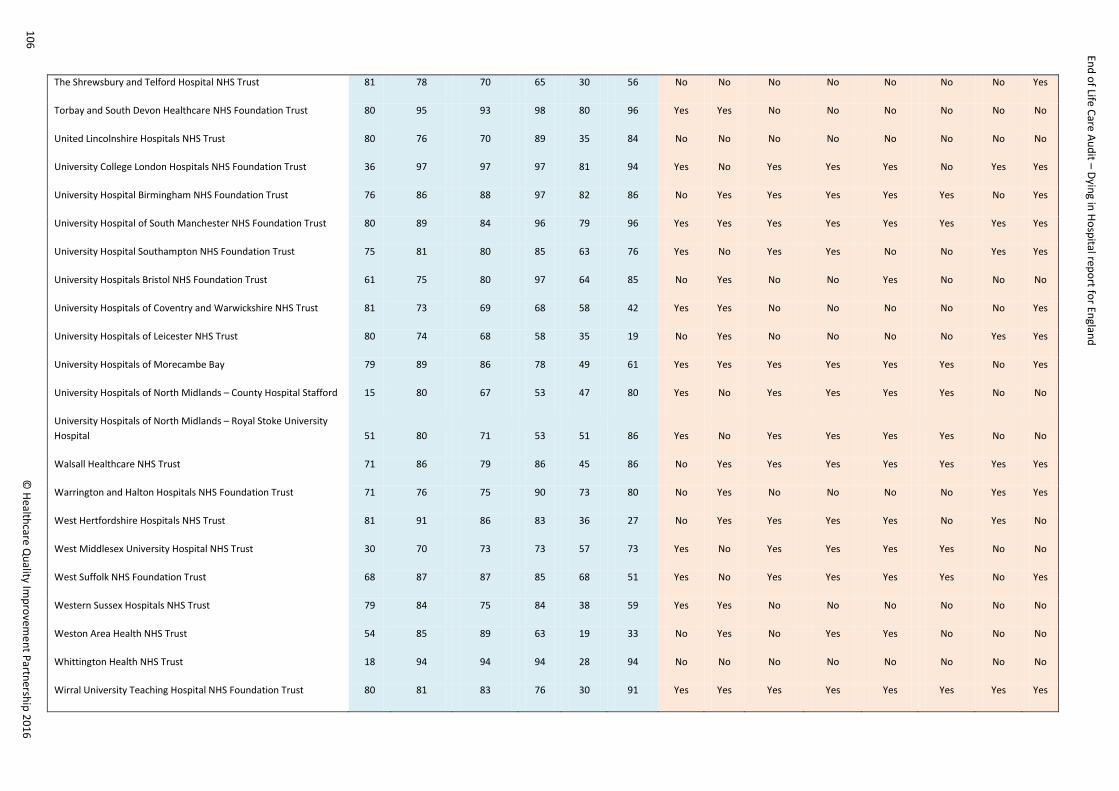
End of Life Care Audit – Dying in Hospital report for England
The Shrewsbury and Telford Hospital NHS Trust 81 78 70 65 30 56 No No No No No No No Yes
Torbay and South Devon Healthcare NHS Foundation Trust 80 95 93 98 80 96 Yes Yes No No No No No No
United Lincolnshire Hospitals NHS Trust 80 76 70 89 35 84 No No No No No No No No
University College London Hospitals NHS Foundation Trust 36 97 97 97 81 94 Yes No Yes Yes Yes No Yes Yes
University Hospital Birmingham NHS Foundation Trust 76 86 88 97 82 86 No Yes Yes Yes Yes Yes No Yes
University Hospital of South Manchester NHS Foundation Trust 80 89 84 96 79 96 Yes Yes Yes Yes Yes Yes Yes Yes
University Hospital Southampton NHS Foundation Trust 75 81 80 85 63 76 Yes No Yes Yes No No Yes Yes
University Hospitals Bristol NHS Foundation Trust 61 75 80 97 64 85 No Yes No No Yes No No No
University Hospitals of Coventry and Warwickshire NHS Trust 81 73 69 68 58 42 Yes Yes No No No No No Yes
University Hospitals of Leicester NHS Trust 80 74 68 58 35 19 No Yes No No No No Yes Yes
University Hospitals of Morecambe Bay 79 89 86 78 49 61 Yes Yes Yes Yes Yes Yes No Yes
University Hospitals of North Midlands – County Hospital Stafford 15 80 67 53 47 80 Yes No Yes Yes Yes Yes No No
University Hospitals of North Midlands – Royal Stoke University Hospital 51 80 71 53 51 86 Yes No Yes Yes Yes Yes No No
Walsall Healthcare NHS Trust 71 86 79 86 45 86 No Yes Yes Yes Yes Yes Yes Yes
Warrington and Halton Hospitals NHS Foundation Trust 71 76 75 90 73 80 No Yes No No No No Yes Yes
West Hertfordshire Hospitals NHS Trust 81 91 86 83 36 27 No Yes Yes Yes Yes No Yes No
West Middlesex University Hospital NHS Trust 30 70 73 73 57 73 Yes No Yes Yes Yes Yes No No
West Suffolk NHS Foundation Trust 68 87 87 85 68 51 Yes No Yes Yes Yes Yes No Yes
Western Sussex Hospitals NHS Trust 79 84 75 84 38 59 Yes Yes No No No No No No
Weston Area Health NHS Trust 54 85 89 63 19 33 No Yes No Yes Yes No No No
Whittington Health NHS Trust 18 94 94 94 28 94 No No No No No No No No
Wirral University Teaching Hospital NHS Foundation Trust 80 81 83 76 30 91 Yes Yes Yes Yes Yes Yes Yes Yes
106 ©
Healthcare Quality Im
provement Partnership 2016

End of Life Care Audit – Dying in Hospital report for England
Worcestershire Acute Hospitals NHS Trust 84 83 80 92 48 60 Yes Yes Yes Yes Yes Yes Yes Yes
Wrightington, Wigan and Leigh NHS Foundation Trust 63 65 65 41 35 32 No Yes No No No No Yes Yes
Wye Valley NHS Trust 46 96 87 89 30 93 No Yes Yes Yes Yes Yes No No
Yeovil District Hospital NHS Foundation Trust 52 79 75 92 60 81 No Yes No No No No No Yes
York Teaching Hospital NHS Foundation Trust 80 80 76 70 50 55 Yes Yes No Yes Yes No No Yes
107 ©
Healthcare Quality Im
provement Partnership 2016

End of Life Care Audit – Dying in Hospital National report for England 2016