enbridge: a north american infrastructure leader presentation/media/enb/documents/investor...
TRANSCRIPT

Presentation
President & CEO, Enbridge Inc.
Al Monaco
Al Monaco
Enbridge:
A North American Infrastructure Leader

Legal Notice
This presentation includes certain forward looking statements and information (FLI) to provide shareholders of Enbridge Inc. (“Enbridge” or the “Company”) and Enbridge Income Fund Holdings Inc. (“ENF”)
and potential investors with information about Enbridge, ENF and their respective subsidiaries and affiliates, including management’s assessment of Enbridge, ENF and their respective subsidiaries’ and
affiliates’ future plans and operations, which FLI may not be appropriate for other purposes. FLI is typically identified by words such as “anticipate”, “expect”, “project”, “estimate”, “forecast”, “plan”, “intend”,
“target”, “believe”, “likely” and similar words suggesting future outcomes or statements regarding an outlook. All statements other than statements of historical fact may be FLI. In particular, this presentation
contains FLI pertaining to, but not limited to, information with respect to the following: adjusted earnings; adjusted EBIT; ACFFO; the proposed merger of Enbridge and Spectra Energy (the “Transaction”);
the combined company’s scale, financial flexibility and growth program; future business prospects and performance; annual cost, revenue and financing benefits; future shareholder returns; annual dividend
growth and anticipated dividend increases; run rate synergies; potential asset monetization transactions; integration plans; project execution, including expected construction and in service dates; system
throughput and capacity; and investor communications plans.
Although we believe that the FLI is reasonable based on the information available today and processes used to prepare it, such statements are not guarantees of future performance and you are cautioned
against placing undue reliance on FLI. By its nature, FLI involves a variety of assumptions, which are based upon factors that may be difficult to predict and that may involve known and unknown risks and
uncertainties and other factors which may cause actual results, levels of activity and achievements to differ materially from those expressed or implied by the FLI, including, but not limited to, the following:
the timing and completion of the Transaction, including receipt of regulatory approvals and the satisfaction of other conditions precedent; the realization of anticipated benefits and synergies of the
Transaction and the timing thereof; the success of integration plans; the focus of management time and attention on the Transaction and other disruptions arising from the Transaction; expected future
adjusted EBIT, adjusted earnings and ACFFO; estimated future dividends; financial strength and flexibility; debt and equity market conditions, including the ability to access capital markets on favourable
terms or at all; cost of debt and equity capital; expected supply and demand for crude oil, natural gas, natural gas liquids and renewable energy; prices of crude oil, natural gas, natural gas liquids and
renewable energy; economic and competitive conditions; expected exchange rates; inflation; interest rates; changes in tax laws and tax rates; completion of growth projects; anticipated construction and in-
service dates; capital project funding; success of hedging activities; the ability of management of Enbridge, ENF, and their respective subsidiaries and affiliates, to execute key priorities, including those in
connection with the Transaction; availability and price of labour and construction materials; operational performance and reliability; customer, shareholder, regulatory and other stakeholder approvals and
support; regulatory and legislative decisions and actions; public opinion; and weather. We caution that the foregoing list of factors is not exhaustive. Additional information about these and other
assumptions, risks and uncertainties can be found in applicable filings with Canadian and U.S. securities regulators, including any proxy statement, prospectus or registration statement filed in connection
with the Transaction. Due to the interdependencies and correlation of these factors, as well as other factors, the impact of any one assumption, risk or uncertainty on FLI cannot be determined with
certainty.
Except to the extent required by law, we assume no obligation to publicly update or revise any FLI, whether as a result of new information, future events or otherwise. All FLI in this presentation is expressly
qualified in its entirety by these cautionary statements.
This presentation makes reference to non-GAAP measures, including adjusted earnings before interest and taxes (adjusted EBIT), adjusted earnings, available cash flow from operations (ACFFO) and
ACFFO per share. Adjusted EBIT is defined as earnings before interest and taxes, as adjusted for unusual, non-recurring or non-operating factors. Adjusted earnings represents earnings attributable to
common shareholders adjusted for unusual, non-recurring or non-operating factors included in adjusted EBIT, as well as adjustments for unusual, non-recurring or non-operating factors in respect of
interest expense, income taxes, non-controlling interests and redeemable non-controlling interests on a consolidated basis. ACFFO is defined as cash flow provided by operating activities before changes
in operating assets and liabilities (including changes in environmental liabilities) less distributions to non-controlling interests and redeemable non-controlling interests, preference share dividends and
maintenance capital expenditures, and further adjusted for unusual, non-recurring or non-operating factors. Management of Enbridge and ENF believe the presentation of these measures provides useful
information to investors and shareholders as they provide increased transparency and insight into the performance of Enbridge and ENF. Management uses adjusted EBIT and adjusted earnings to set
targets and to assess the performance of Enbridge and ENF. Management uses ACFFO to assess performance and to set its dividend payout targets. These measures are not measures that have a
standardized meaning prescribed by generally accepted accounting principles in the United States of America (U.S. GAAP) and may not be comparable with similar measures presented by other issuers.
Additional information on Enbridge and ENF’s use of non-GAAP measures can be found in their respective Management’s Discussion and Analysis (MD&A) available on their websites and on
www.sedar.com.
SLIDE 2

SLIDE 3
Premier North American Infrastructure Footprint
Gas Distribution
Utilities
Liquids
Transportation
Gas
Transportation
17%
47% 34%
• Best in class assets
• Superior growth outlook
• Low risk commercial model
• Execution expertise
• Strong financial position
2017e EBITDA by Segment

0
2
4
6
Oil Coal Gas Bioenergy Nuclear Hydro Renewables
2040
2014
Strong Global Energy Fundamentals
4
Global Energy Supply Mix (million tonnes of oil equivalent)
0
5
10
15
20
2014 2020 2025 2030 2035 2040
Global Energy Demand by Region (million tonnes of oil equivalent)
Non-OECD Other
Non-OECD Asia
OECD
~30% increase in demand; drives need for all fuel sources SLIDE 4
Source: 2016 IEA World Energy Outlook, New Policies Case Total Primary Energy Demand

Positive Natural Gas Fundamentals
• Rising demand
• Abundant, low cost supply
• Lower energy costs
• Ideal for power generation
• Reduced carbon intensity
Strong fundamentals support significant demand growth SLIDE 5
0
1
2
3
4
5
6
2014 Power Industry Buildings Transport Other 2040
Global Gas Demand (Thousand BCM)
Source: 2016 IEA World Energy Outlook, New Policies Case

The Need for Infrastructure
SLIDE 6
Fix regional price dislocations and connect to export markets
Sources: Wood Mackenzie, EIA, SNL
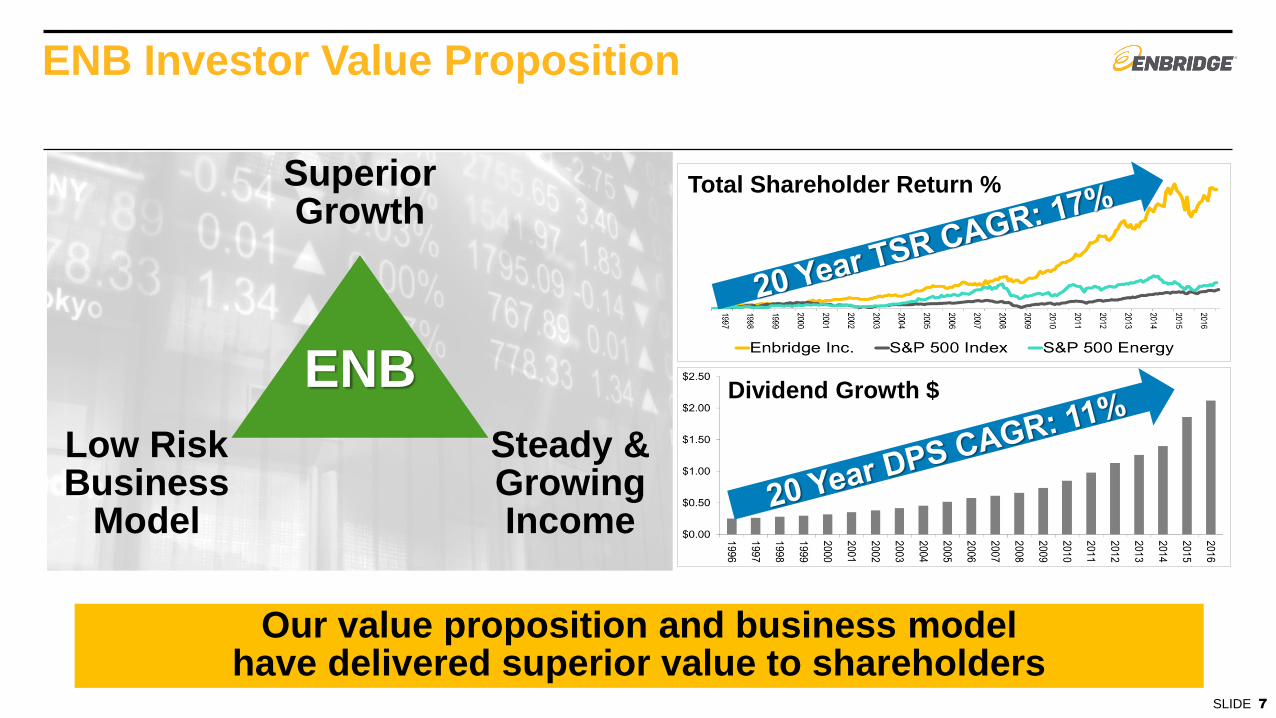
ENB Investor Value Proposition
SLIDE 7
Our value proposition and business model have delivered superior value to shareholders
ENB
Superior Growth
Low Risk Business
Model
Steady & Growing Income
Total Shareholder Return %
Dividend Growth $

Superior Growth
SLIDE 8
Strategically located to serve demand pull markets, transporting ~20% of North America’s natural gas
One of the largest midstream footprints in western Canada
Largest US midstream footprint in the United States
World’s largest and most complex liquids pipelines system,
transporting ~60% of US crude imports from Canada
Largest gas distribution utilities in Canada
One of the largest wind and solar power generators in
Canada
Canadian Midstream
North American Liquids
Pipelines
North American
Gas Pipelines
Utilities
Renewable Power
U.S. Midstream
6 strategic platforms
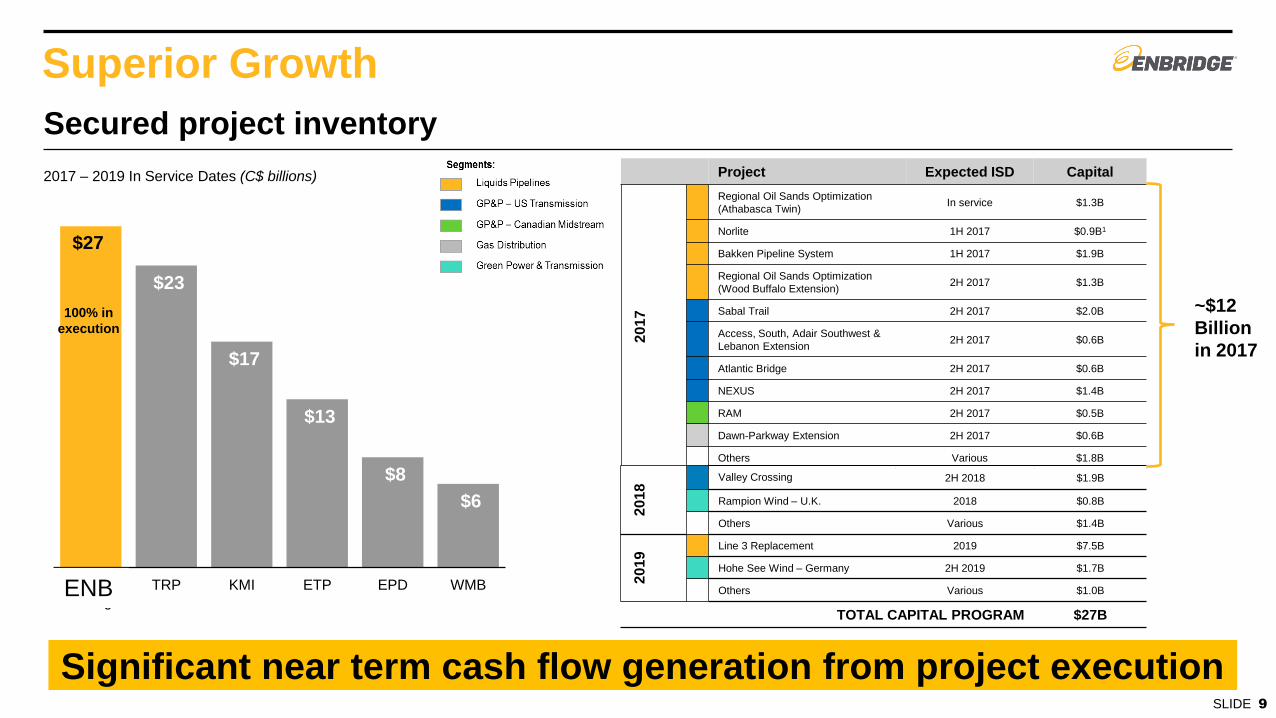
Superior Growth
SLIDE 9
2017 – 2019 In Service Dates (C$ billions)
$6
$8
$13
$17
$23
$27
WMBEPDETPKMITRPPro FormaEnbridge
100% in
execution
Significant near term cash flow generation from project execution
ENB
Secured project inventory
Project Expected ISD Capital
2017
Regional Oil Sands Optimization
(Athabasca Twin) In service $1.3B
Norlite 1H 2017 $0.9B1
Bakken Pipeline System 1H 2017 $1.9B
Regional Oil Sands Optimization
(Wood Buffalo Extension) 2H 2017 $1.3B
Sabal Trail 2H 2017 $2.0B
Access, South, Adair Southwest &
Lebanon Extension 2H 2017 $0.6B
Atlantic Bridge 2H 2017 $0.6B
NEXUS 2H 2017 $1.4B
RAM 2H 2017 $0.5B
Dawn-Parkway Extension 2H 2017 $0.6B
Others Various $1.8B
2018 Valley Crossing 2H 2018 $1.9B
Rampion Wind – U.K. 2018 $0.8B
Others Various $1.4B
2019 Line 3 Replacement 2019 $7.5B
Hohe See Wind – Germany 2H 2019 $1.7B
Others Various $1.0B
TOTAL CAPITAL PROGRAM $27B
~$12
Billion
in 2017
North American Liquids
Pipelines
North American
Gas Pipelines
Utilities
Canadian & U.S. Midstream
Renewable Power
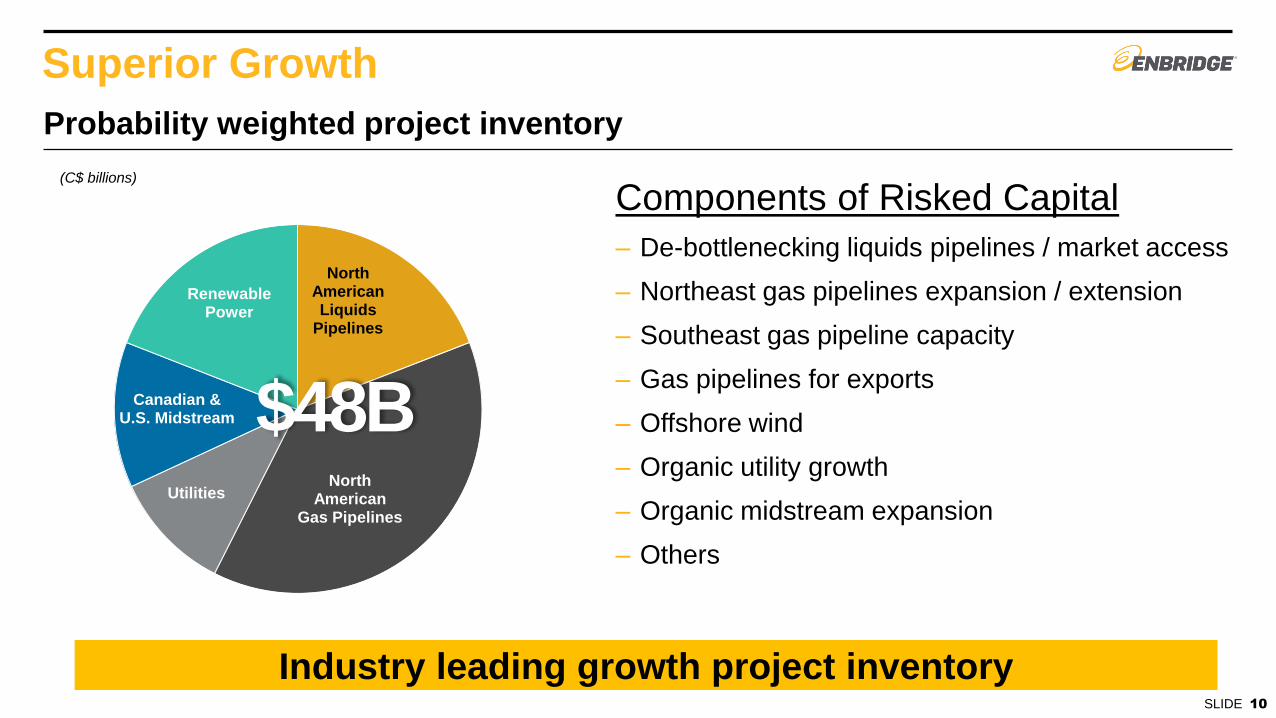
Superior Growth
SLIDE 10
(C$ billions)
$48B
Industry leading growth project inventory
Components of Risked Capital
– De-bottlenecking liquids pipelines / market access
– Northeast gas pipelines expansion / extension
– Southeast gas pipeline capacity
– Gas pipelines for exports
– Offshore wind
– Organic utility growth
– Organic midstream expansion
– Others
Probability weighted project inventory
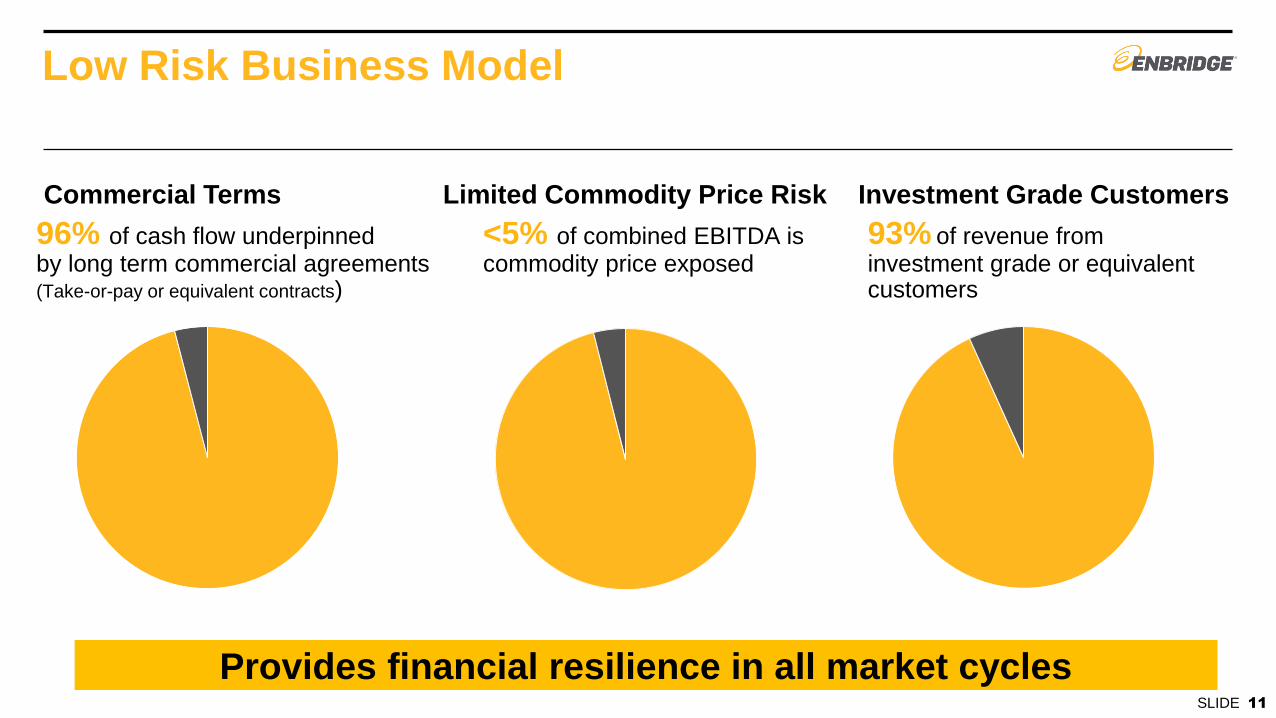
Low Risk Business Model
Commercial Terms Limited Commodity Price Risk Investment Grade Customers
96% of cash flow underpinned by long term commercial agreements (Take-or-pay or equivalent contracts)
<5% of combined EBITDA is commodity price exposed
93% of revenue from investment grade or equivalent customers
Provides financial resilience in all market cycles SLIDE 11

2016E 2017E 2018E 2019E 2020E 2021E 2022E 2023E 2024E
Steady and Growing Income
– 15% dividend increase in 2017
– 10-12% annual dividend growth from 2018 through 2024
– Conservative ACFFO payout ratio of 50-60%
Premium dividend growth with conservative payout ratio SLIDE 12

Balance Sheet Strength
Strong investment grade credit profile SLIDE 13
– Committed to strong investment grade credit rating
– Significant size, scale and asset diversity supports credit profile
– Debt/EBITDA naturally improves as high quality projects under construction are placed
into service
Credit Metric Target
FFO / Debt ≥15%
Debt / EBITDA ≤5.0x
Total Debt / EBITDA
6.2x5.5x
5.1x4.4x
2016 2017E 2018E 2019E
Projected Pro Forma Debt / EBITDA
Total Debt / EBITDA
6.2x5.5x
5.1x4.3x
2016 2017E 2018E 2019E
5.0x
Target
Key Credit Metrics and Targets
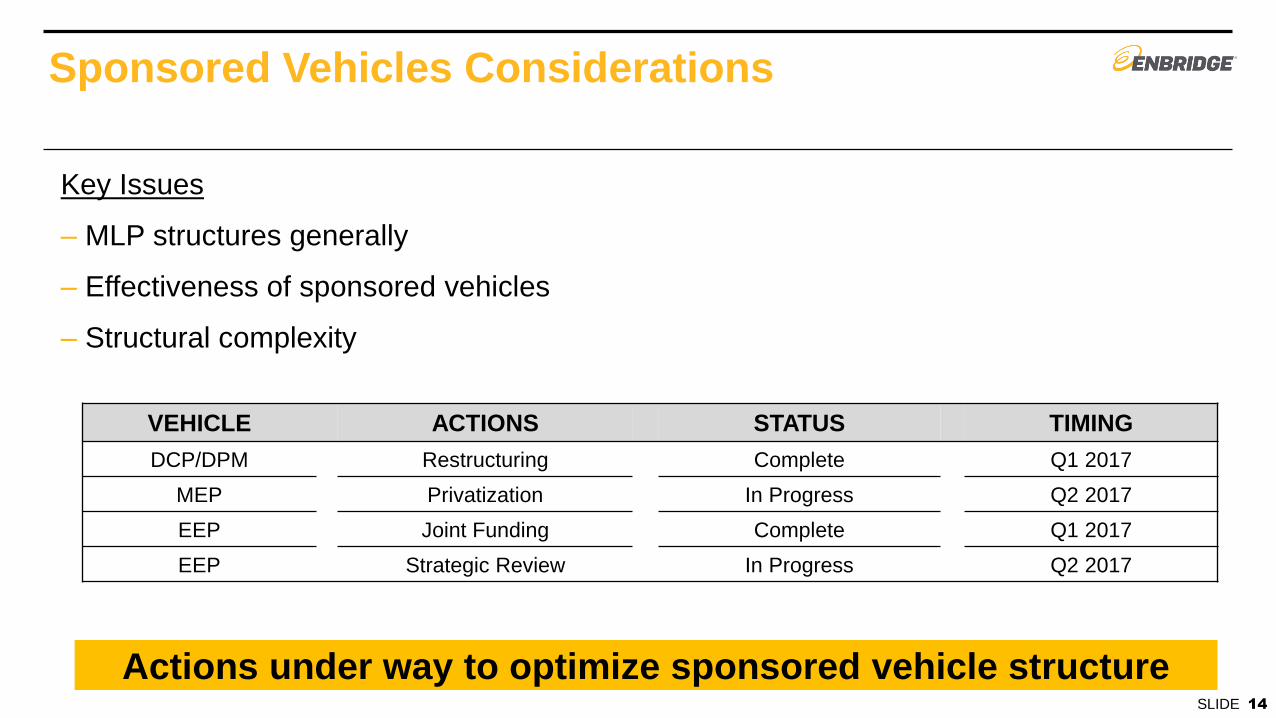
Sponsored Vehicles Considerations
Actions under way to optimize sponsored vehicle structure SLIDE 14
Key Issues
– MLP structures generally
– Effectiveness of sponsored vehicles
– Structural complexity
VEHICLE ACTIONS STATUS TIMING
DCP/DPM Restructuring Complete Q1 2017
MEP Privatization In Progress Q2 2017
EEP Joint Funding Complete Q1 2017
EEP Strategic Review In Progress Q2 2017
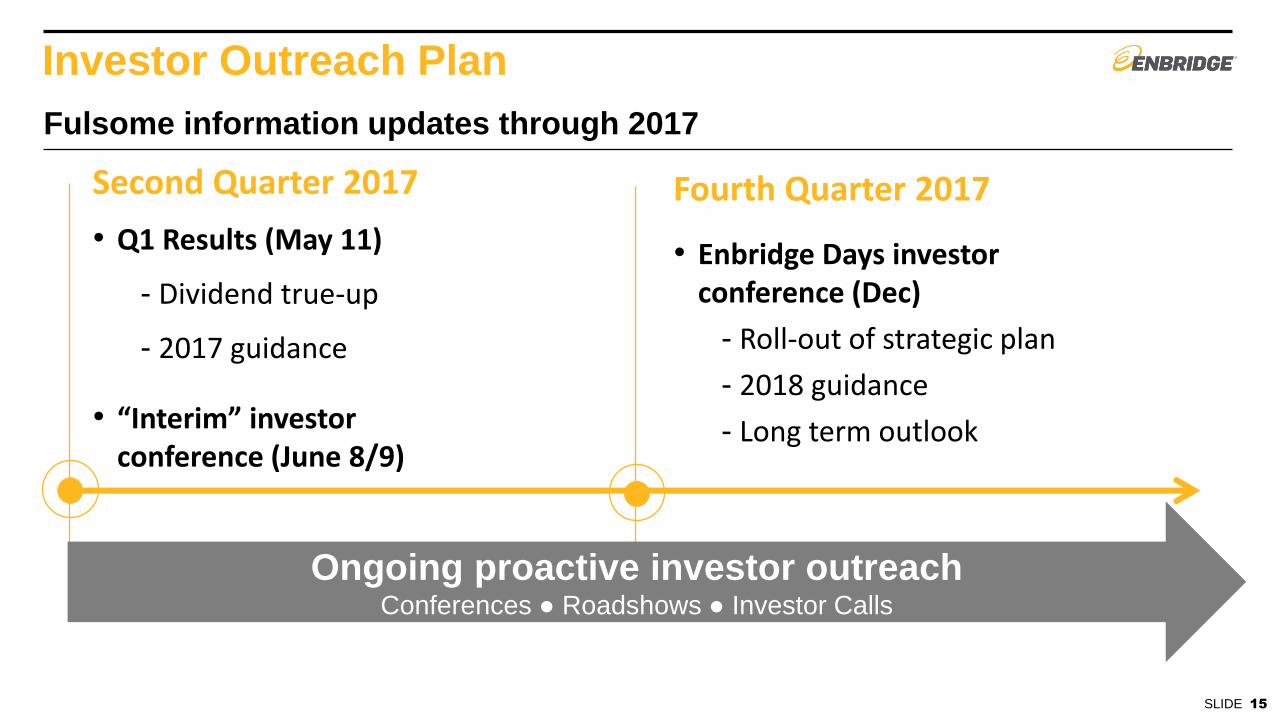
Investor Outreach Plan
SLIDE 15
Second Quarter 2017
• Q1 Results (May 11)
- Dividend true-up
- 2017 guidance
• “Interim” investor conference (June 8/9)
Fourth Quarter 2017
• Enbridge Days investor conference (Dec)
- Roll-out of strategic plan
- 2018 guidance
- Long term outlook
Ongoing proactive investor outreach
Conferences ● Roadshows ● Investor Calls
Fulsome information updates through 2017

SLIDE 16 SLIDE 16
• $165B enterprise value
• Highest quality liquids and natural gas franchises
• Low risk business model
• Strong balance sheet and access to capital
• $27B secured growth program
• 12-14% CAGR ACFFO/share growth (2014-2019)
• $48B development project pipeline driving 10-12% annual dividend growth through 2024
Global “must own” investment
(C$, billions)

Q&A

Liquids Pipelines
EVP & President Liquids Pipelines Guy Jarvis

Liquids Pipelines System Overview
• World class liquids infrastructure spanning North America
• Serves two high quality producing basins
• Provides access to the best markets
• Offers unparalleled terminal and operational flexibility
• Competitive and stable tolls
SLIDE 2

Financial Results
ADJUSTED EBIT (Millions of Canadian dollars) 2015 2016
Canadian Mainline 896 931
Lakehead System 1,108 1,425
Mid-Continent and Gulf Coast 516 656
Express-Platte System1 323 275
Regional Oil Sands System 341 384
Bakken System 213 198
Feeder Pipelines and Other 155 196
Southern Lights Pipeline 155 168
Consolidated Adjusted EBIT2 3,707 4,233
1 Express-Platte System reflect results under its previous ownership by Spectra Corporation/Spectra Energy Partners, LP 2 Consolidated Adjusted EBIT includes results from Express-Platte, which were not under Enbridge’s ownership in the two periods presented
SLIDE 3

Fundamentals – WCSB/Bakken Region
• Near term growth of ~400 kbpd by 2020 • Expect WCSB supply to increase an additional 300
kbpd by 2025 • Outlook suggests 700 kbpd of incremental pipeline
capacity required by 2025
• Rig activity responding to price and new infrastructure
• Jumped from 27 a year ago to 46 (March 2017)
• Production expected to grow by ~450 kbpd by 2025 • Additional pipeline capacity required by 2025
Source: CAPP June 2016 Forecast
0.0
0.5
1.0
1.5
2015 2016 2017 2018 2019 2020 2021 2022 2023 2024 2025
(MMbpd)
Crude Production
North Dakota and Eastern Montana Crude Production Forecast
0
1
2
3
4
5
6
2015 2016 2017 2018 2019 2020 2021 2022 2023 2024 2025
(MMbpd)
WCSB Supply Outlook
CAPP June 2016
SLIDE 4

Oil Sands
• Established footprint in the region with optionality to Edmonton or Hardisty
• Current throughput capacity into Edmonton & Hardisty hubs ~2MMbpd
• Unparalleled gathering system that connects WCSB crude oil with transportation access to valuable markets
• 9 connected Oil Sands projects
SLIDE 5
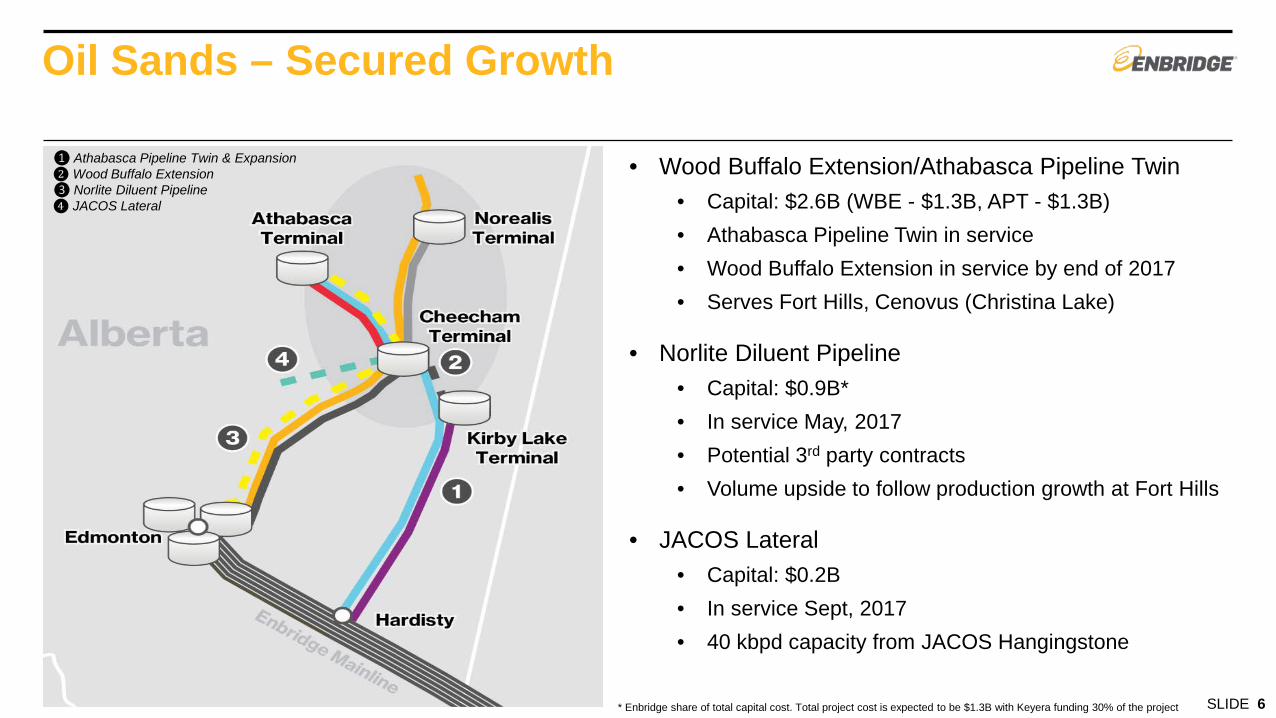
Oil Sands – Secured Growth
• Wood Buffalo Extension/Athabasca Pipeline Twin • Capital: $2.6B (WBE - $1.3B, APT - $1.3B) • Athabasca Pipeline Twin in service • Wood Buffalo Extension in service by end of 2017 • Serves Fort Hills, Cenovus (Christina Lake)
• Norlite Diluent Pipeline • Capital: $0.9B* • In service May, 2017 • Potential 3rd party contracts • Volume upside to follow production growth at Fort Hills
• JACOS Lateral • Capital: $0.2B • In service Sept, 2017 • 40 kbpd capacity from JACOS Hangingstone
❶ Athabasca Pipeline Twin & Expansion ❷ Wood Buffalo Extension ❸ Norlite Diluent Pipeline ❹ JACOS Lateral
* Enbridge share of total capital cost. Total project cost is expected to be $1.3B with Keyera funding 30% of the project SLIDE 6

Oil Sands – Strategic and Competitive Position
Commercial Structure • Long term “Take or Pay” agreements in place • Majority modelled on a capital cost multiplier
basis or Cost of Service • Power costs collected on flow through basis • Strong credit counterparties
Competitive Positioning • Existing infrastructure provides opportunity to
stage new production and leverage to dedicated facilities
• Large portfolio allows flexibility to respond to changing production developments
• Expected production growth from cost effective brownfield expansions and technology gains
• Customers well positioned for success
Financial Modelling Considerations • Stable cash flows • Growth tied to:
• Capital additions • Tilted return projects
• Low double digit ROEs
0
100
200
300
400
2014 2015 2016
ADJUSTED EBIT (Millions of Canadian dollars)
SLIDE 7

Mainline
• Comprised of Canadian Mainline and Lakehead System in the United States
• Largest, longest and most complex petroleum pipeline system in the world
• Combined annual operating capacity of approximately 2.85 MMbpd
• Ex-Gretna record deliveries averaged 2.645 MMbpd in January 2017
• Accounted for 56% of CDN exports to the U.S. (2016)
• Access to ~3.5 MMbpd of connected refineries and downstream pipelines
• Expansive terminal presence provides operational flexibility
• Competitive tolls • Top shippers include fully integrated oil companies
and refiners (strong credit parties)
SLIDE 8

Mainline – Secured Growth
Line 3 Replacement • Restores line capacity to 760 kbpd
• Expected In-Service: 2019
• Capital: $7.5B
• 15 year toll surcharge
• Solid return on significant incremental investment
Southern Access Expansion • Expands line capacity to 1,200 kbpd
• Expected In-Service: 2019
• Capital: $0.4B
• Connects restored Line 3 volumes to Market Access pipelines
SLIDE 9

Mainline – Commercial Model
Other Existing Pipelines
Competitive Tolling Settlement (“CTS”)
• 10 Year Agreement
• Provides substantial toll certainty for shippers and incentive for Enbridge to optimize and facilitate additional transportation capacity
• Agreement contains provisions to protect Enbridge from significant downside volume risk
• Agreement expires in June 2021
• Renegotiations with shippers scheduled to start 2 years in advance of CTS expiration
Tolling Methodology • Shippers pay International Joint Tariff (“IJT”)
• IJT escalates on July 1st each year by 75% of Canadian GDPP
• Toll is split between Lakehead System and Canadian Mainline
• Additional surcharges have been negotiated with the shipping community for some recently completed expansion projects, including:
• Edmonton to Hardisty Expansion • Southern Access Expansion • Line 78
SLIDE 10
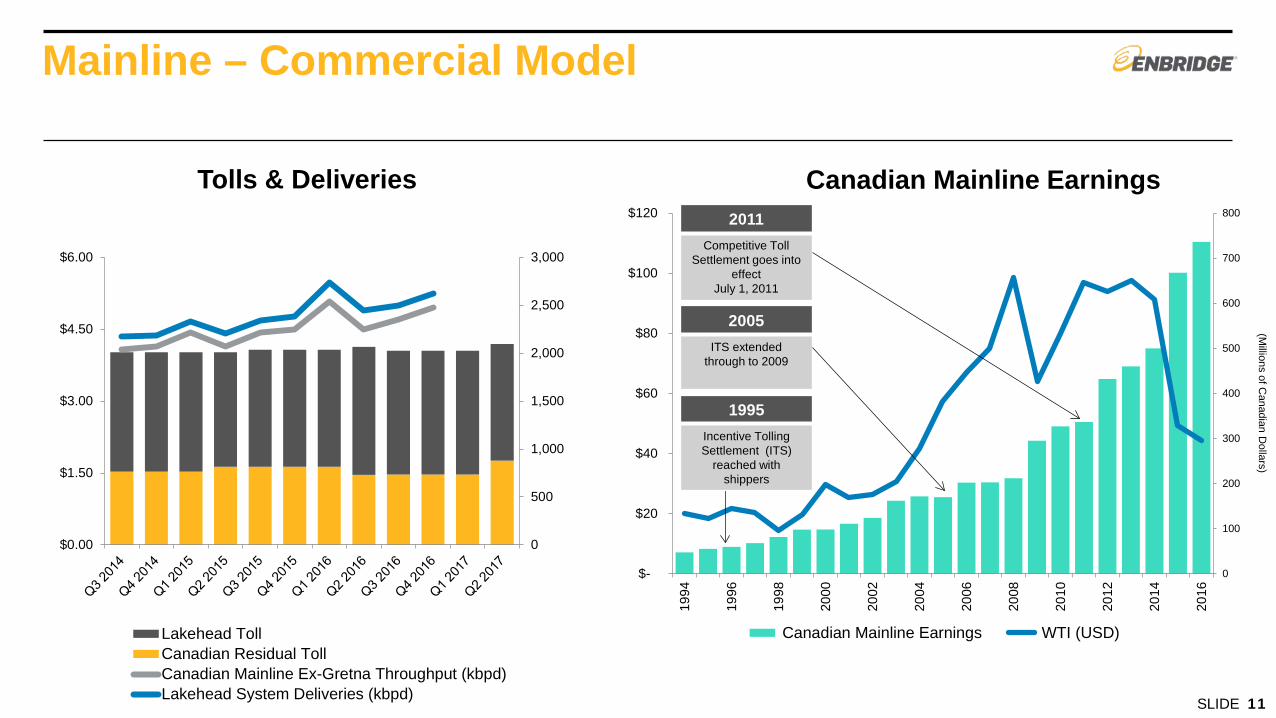
Mainline – Commercial Model
Western Canadian Refineries
Other Existing Pipelines
0
500
1,000
1,500
2,000
2,500
3,000
$0.00
$1.50
$3.00
$4.50
$6.00
Lakehead TollCanadian Residual TollCanadian Mainline Ex-Gretna Throughput (kbpd)Lakehead System Deliveries (kbpd)
Tolls & Deliveries Canadian Mainline Earnings
0
100
200
300
400
500
600
700
800
$-
$20
$40
$60
$80
$100
$120
1994
1996
1998
2000
2002
2004
2006
2008
2010
2012
2014
2016
Canadian Mainline Earnings WTI (USD)
2011 Competitive Toll
Settlement goes into effect
July 1, 2011
2005 ITS extended
through to 2009
1995 Incentive Tolling Settlement (ITS)
reached with shippers
(Millions of C
anadian Dollars)
SLIDE 11

Market Access
• Long term “Take or Pay” agreements in place
• Commercial structures provide revenue certainty to Enbridge over the term of the contracts
• International Joint Tariffs provide incentivized long-haul service from the Enbridge Mainline to downstream markets
• Commitments on Market Access Pipelines represents ~75% of capacity
• Light and heavy crude service to refineries in Eastern Canada, US Midwest, US Midcontinent and US Gulf Coast
• Access to tidewater is provided through FSP/Seaway systems
SAX – 300 KBPD
Flanagan South/Seaway – 600 KBPD
Line 9 – 300 KBPD
SLIDE 12

CAPACITY(kbpd)
Mainline Connected Refineries 1,900Mainline Connected Markets (Pipeline Access) 1,575Total 3,475
Strong demand from refineries and connected markets❸
Mainline – Strategic and Competitive Position
Production growth with limited alternative takeaway capacity ❶
❷ Pipeline/Rail Receipt and
Delivery Range (per bbl)
Enbridge Mainline/FSP
Hardisty to USGC $6.93 to $8.79
Keystone XL Hardisty to Houston ???
Rail Edmonton to Houston
$12.00* to $14.00**
Highly competitive tolls into key USGC markets
* Unit train cost/barrel ** Manifest train cost/barrel (Source: Argus)
SLIDE 13
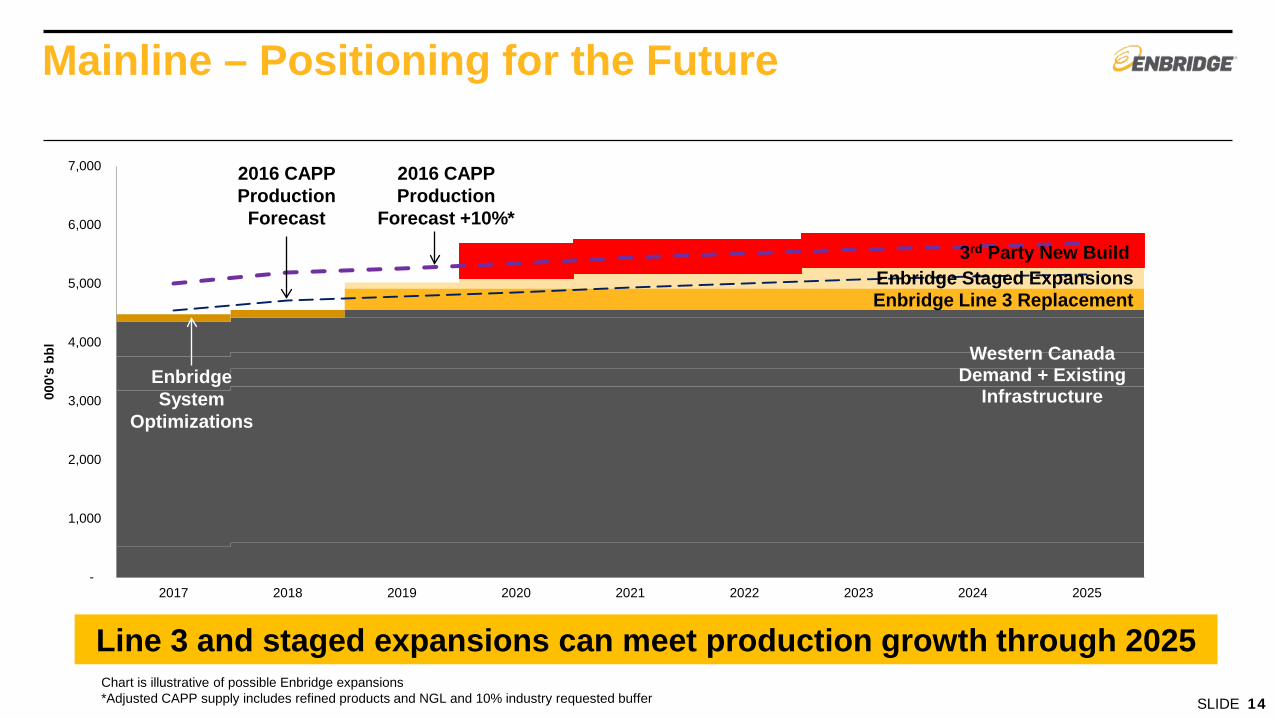
Western Canada Demand + Existing
Infrastructure
3rd Party New Build
-
1,000
2,000
3,000
4,000
5,000
6,000
7,000
2017 2018 2019 2020 2021 2022 2023 2024 2025
000'
s bb
l Mainline – Positioning for the Future
Chart is illustrative of possible Enbridge expansions *Adjusted CAPP supply includes refined products and NGL and 10% industry requested buffer
2016 CAPP Production
Forecast +10%*
Enbridge System
Optimizations
2016 CAPP Production
Forecast
Enbridge Staged Expansions
Line 3 and staged expansions can meet production growth through 2025
SLIDE 14
Enbridge Line 3 Replacement

Bakken Region
• Extensive infrastructure accommodates current and planned growth
• North Dakota System (210 kbpd) & Bakken Expansion Pipeline (150 kbpd) combined for total current system capacity of 360 kbpd
• Gathers crude from North Dakota and delivers to Enbridge Mainline which provides unparalleled access to refineries in the US Midwest, Gulf Coast and Eastern Canada
• Dakota Access Pipeline & Energy Transfer Crude Oil Pipeline
• DAPL originates in the Bakken/Three Forks Area and accesses Patoka, Illinois hub
• ETCO originates in Patoka and provides access to the Eastern U.S. Gulf Coast market
• Enbridge’s effective interest in DAPL is 27.6%
• Market access targets high value markets SLIDE 15

North Dakota System – Strategic and Competitive Position
Commercial Structure • North Dakota System: Common Carrier with
indexed rates • Bakken Expansion Pipeline: 5 & 10 year “Take
or Pay” agreements, utilizing ~70% of capacity
Competitive Positioning • Established gathering system with multiple
entry points • Access to Enbridge Mainline system and
superior value markets • Low cost transportation option
• High customer volume demand • Merchant tankage opportunities • Expansion and reversal capability • Opportunities for synergies with connecting
customers
Financial Modelling Considerations • Stable results and utilization of Classic System
• Phase V and VI surcharge expired in 2015
• Stable cash flow from Bakken Expansion Pipeline
• Future growth tied to:
• Capital additions • Repurpose under-utilized assets
ADJUSTED EBIT (Millions of Canadian dollars)
050
100150200250300
2014 2015 2016 SLIDE 16

DAPL – Strategic and Competitive Position
Commercial Structure • 90 % contracted with “Take or Pay” agreements
in place • Local tariff on DAPL to Patoka, Illinois
• Joint tariff service available through commitment on DAPL and ETCO
• Supplemental Open Season commenced March 29, 2017
• Limited spot volume available
Competitive Positioning • Highly competitive tolls
• Affords greater optionality for shippers & enhanced market access
• Expansion opportunities
• Provides potential synergies with existing Enbridge assets
Ownership Structure
Financial Modelling Considerations
• $1.5B USD Cash Purchase Price; Assumed $0.7B USD in project debt
• In Service: Q2 2017
• Tilted return profile
• Low to Mid Teens Full Life DCFROE
SLIDE 17

Express/Platte
Express Pipeline
• Hardisty - Casper
• Annual capacity of 280 kbpd
• Uniquely situated pipeline for import of growing Canadian crude supply
• Stable, secure fee-for-service revenue
Platte Pipeline
• Casper - Wood River
• Annual capacity of 170 kbpd
• Enhanced connectivity to provide increased utilization
• Brings diverse crude supply to the Midwest
• Mix of producers, refiners, marketers
Complimentary system presents connectivity opportunity for enhanced service offering
SLIDE 18

Express/Platte – Strategic and Competitive Position
Commercial Structure Express • 90% contracted
• Majority of contracts 5-20 year terms • High credit quality customers
Platte • Open Access Pipeline
• No contracts • Historical allocation procedure when prorated
Competitive Positioning
• Provides Enbridge with direct access to PADD IV refining customers
• Additional flexibility with integration into the Enbridge system, potential to optimize crude allocation & crude movements
EBITDA (Millions of United States dollars)
Financial Modelling Considerations • Contracted toll escalation on Express
• Platte tolls subject to FERC escalator
• Legacy Express contracts displaced by new contracts starting 2016
• 21 kbpd expansion in service Q4 2016; contracted 11 years and poised to deliver 2017 growth
- 50
100 150 200 250
2014 2015 2016 SLIDE 19

Unmatched Liquids Transportation System
Western Canadian Refineries
Other Existing Pipelines
• Unparalleled mainline flexibility and market access
• Highly executable, low cost staged expansions
• Competitive tolls and operationally reliable system • Positioned to capture growth in growing basins
• Evaluating options to leverage Express/Platte system
SLIDE 20

Finance
EVP & Chief Financial Officer John Whelen

Finance Practices at Enbridge
• Financial strength and flexibility
• Strong, investment grade credit ratings
• Ample liquidity for contingencies
• Rigorous risk management
• Low risk commercial structures
• Proactive management of residual risks
• Disciplined investment process
• Strict investment criteria
• Rigorous evaluation process
• Cost of capital optimization
• Diversified sources of debt and equity financing
• Sponsored vehicles

6.2x 5.5x
5.1x
4.3x
2016 2017 2018 2019
Financial Strength and Flexibility Financial planning parameters reflect a commitment to balance sheet strength
Consolidated Pro Forma Debt to EBITDA End of year
5.0x
* Not expected to change materially
Metric Target
Credit Policy
Strong, Investment Grade
Dividend Payout
50-60% ACFFO
FFO / Debt
≥15%
Debt / EBITDA
≤5.0x
Liquidity
>1x forward year capex
Floating to Fixed Rate Debt
< 25%
Earnings at Risk (EaR)
< 5% for forward 12 months*

$ Billions (CAD) 3 20164 2017
Equity Funding1
ENB Common Shares 2.3 -
ENF Common Shares 0.6 -
ENB/ENF DRIP, EEP PIK & SEP ATM 1.12 0.32
Debt Funding
Term Loans 1.3 0.2
EPI 0.8 -
EGD 0.3 -
ENB 2.0 -
Hybrid Financing
Preferred shares 0.8 -
Hybrid equity (L.T. Subordinated Debt) 1.1 -
Total Capital Raised $10.3 $0.5
Asset Monetization 1.4 0.95
Total4 $11.7 $1.4
Financial Strength and Flexibility
1 All numbers are presented before deduction of fees and commissions where applicable. 2Includes US$0.2B (2016) raised through EEP PIK distributions and US$0.1 (2017) raised through EEP PIK/SEP ATM. 3U.S. dollars values have been
translated at a rate of 1.3427 USD/CAD. 4 Excludes $1.6B debt and $1.7B in equity capital raised in 2016 by legacy Spectra entities. 5Includes gross proceeds of $0.6B from secondary of ENF shares, projected to close on or about April 18, 2017.
Demonstrated access to capital. Ample liquidity to support post merger business plan
Committed Credit Facilities ($ Billions CAD)
Enbridge Financing Execution
Mar. 31/16 Mar. 31/17
$30B
$20B
$14B
available
liquidity
Cash
Committed Credit Lines (Available)
Committed Credit Lines (Drawn)

Financial Strength and Flexibility Secured capital program can be readily financed through internal cash flow and alternative sources of equity capital
Enbridge Group Funding Requirements 2017e – 2019e
Uses Sources
Debt maturities $10 JV Contributions $2
Capital expenditures $25 DRIP/ SV Equity Issuances/
Hybrids/ Monetizations
$9
Debt issuances (ENB and
subsidiaries)
$10
Internal cash flow, net of dividends $14
Ample sources of alternative equity financing 2017-2019
• $9B of alternative sources of equity
capital:
• Spectra Energy Partners ATM
• Enbridge Income Fund Common Equity
• Enbridge Energy Partners PIK
• Enbridge Inc. DRIP
• Hybrids
• Monetization of over $2B in non-core
assets
• Other identified asset monetizations
could provide an incremental $5-$6B of
capital

Rigorous Risk Management
Limited Commodity Price Risk Investment Grade Customers
<5% of combined EBITDA is commodity price exposed
93%2 of revenue from investment grade or equivalent customers
Combination further diversifies exposure and strengthens business risk profile
Investment grade or equivalent 93%
Sub investment grade 7%
Fee-based >95%
Price sensitive <5%
Slide reflects pro-forma combination with Spectra Energy. For more information please refer to the presentation and news release dated September 6, 2016 which is available on Enbridge’s website.
(1) Equivalent includes Competitive Tolling Settlement and fee for service contracts.
(2) Excludes low risk regulated distribution utility revenues.
Business Mix 96% of cash flow underpinned by long term commercial agreements
Take-or-pay , cost of service or equivalent (1) 96%
Volumetric risk 4%
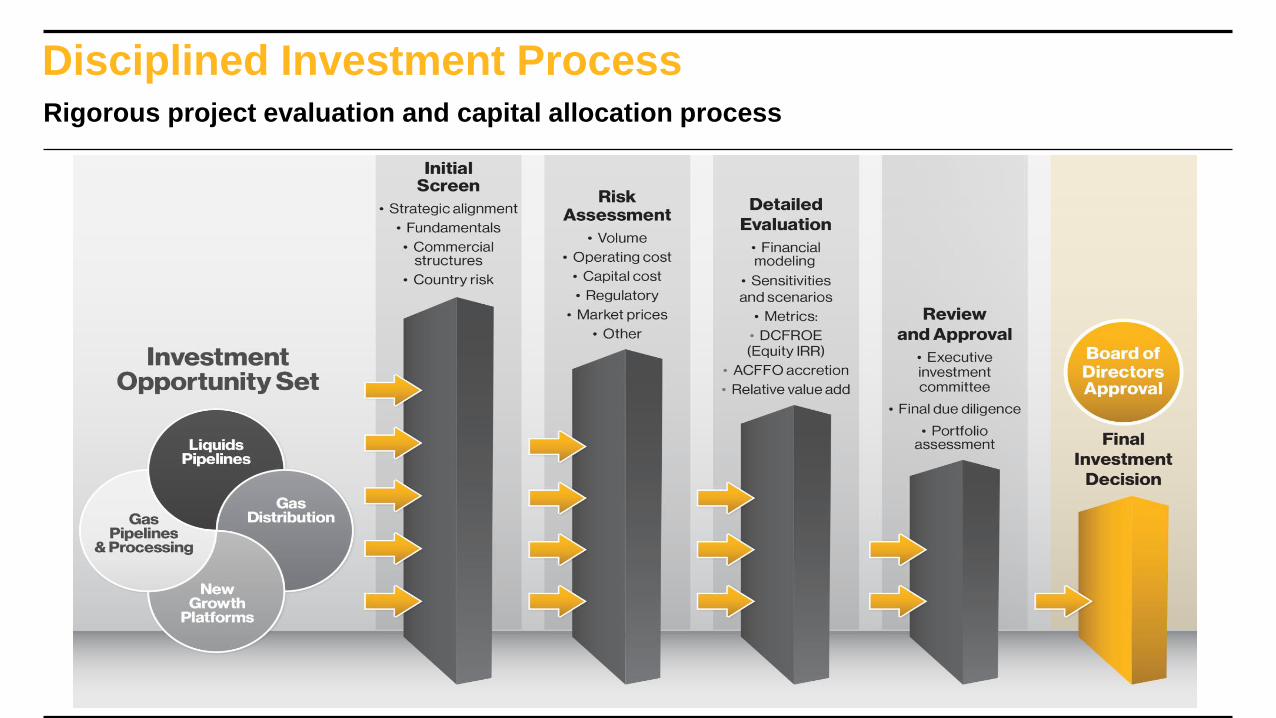
Disciplined Investment Process Rigorous project evaluation and capital allocation process

Sponsored Vehicles Considerations
Actions under way to optimize sponsored vehicle structure SLIDE 8
Key Issues
– MLP structures generally
– Effectiveness of sponsored vehicles
– Structural complexity
VEHICLE ACTIONS STATUS TIMING
DCP/DPM Restructuring Complete Q1 2017
MEP Privatization In Progress Q2 2017
EEP Joint Funding Complete Q1 2017
EEP Strategic Review In Progress Q2 2017

Appendix

Investor Relations Principles
SLIDE 10
Committed to “Best in Class” practices
Guiding Principles
• Knowledgeable
• Responsive
• Accessible
• Transparent
• Proactive
Best in Class Principles taken from IPREO research
Investor Relations Contacts Enbridge Inc.
Jonathan Gould
403-231-3916
Spectra Energy Partners
Roni Cappadonna
713-627-4778
Enbridge Energy Partners
Adam McKnight
403-266-7922
Enbridge Income Fund Holdings
Adam McKnight
403-266-7922

Financial Results – Enbridge
SLIDE 11
ADJUSTED EBIT (Millions of Canadian dollars) 2014 2015 2016
Liquids Pipelines 2,592 3,384 3,958
Gas Distribution 391 446 494
Gas Pipelines and Processing 293 336 366
Green Power and Transmission 151 175 165
Energy Services 42 61 28
Eliminations and Other (60) (246) (349)
Consolidated Adjusted EBIT 3,409 4,156 4,662

Consolidated Financial Results – Enbridge
SLIDE 12
(Millions of Canadian dollars, except share information and per share amounts) 2014 2015 2016
Consolidated Adjusted EBIT* 3,409 4,156 4,662
Depreciation and amortization 1,577 2,024 2,240
Maintenance capital (970) (720) (671)
Interest expense (926) (1,273) (1,545)
Current income taxes (12) (160) (92)
Preferred share dividends (245) (288) (293)
Distributions to noncontrolling and redeemable noncontrolling interests (614) (794) (922)
Cash distributions in excess of equity earnings 196 244 183
Other non-cash adjustments 91 (35) 151
ACFFO* 2,506 3,154 3,713
Weighted average common shares outstanding (millions) 829 847 911
ACFFO* per Share $3.02 $3.72 $4.08
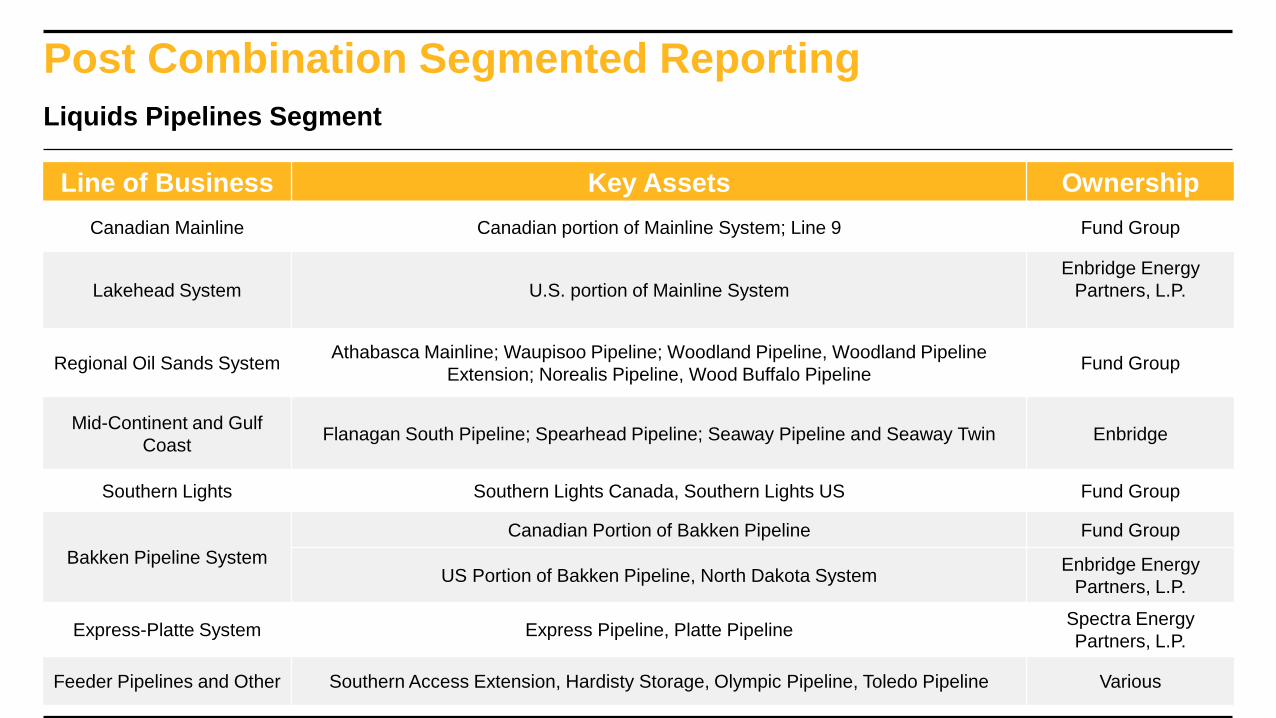
Post Combination Segmented Reporting
Liquids Pipelines Segment
Line of Business Key Assets Ownership
Canadian Mainline Canadian portion of Mainline System; Line 9 Fund Group
Lakehead System U.S. portion of Mainline System
Enbridge Energy
Partners, L.P.
Regional Oil Sands System Athabasca Mainline; Waupisoo Pipeline; Woodland Pipeline, Woodland Pipeline
Extension; Norealis Pipeline, Wood Buffalo Pipeline Fund Group
Mid-Continent and Gulf
Coast Flanagan South Pipeline; Spearhead Pipeline; Seaway Pipeline and Seaway Twin Enbridge
Southern Lights Southern Lights Canada, Southern Lights US Fund Group
Bakken Pipeline System
Canadian Portion of Bakken Pipeline Fund Group
US Portion of Bakken Pipeline, North Dakota System Enbridge Energy
Partners, L.P.
Express-Platte System Express Pipeline, Platte Pipeline Spectra Energy
Partners, L.P.
Feeder Pipelines and Other Southern Access Extension, Hardisty Storage, Olympic Pipeline, Toledo Pipeline Various

Line of Business Key Assets Ownership
U.S. Transmission
Algonquin Gas Transmission, Big Sandy Pipeline, Bobcat Gas Storage, East
Tennessee Natural Gas, Market Hub Partners , Ozark Gas Transmission, Saltville Gas
Storage Texas Eastern Transmission, Maritimes & Northeast US, Gulfstream Natural
Gas, Southeast Supply Header and Steckman Ridge
Spectra Energy
Partners, L.P.
Canadian Midstream BC Pipeline, BC Field, Maritime & Northeast Canada, Cabin Gas Plant, Pipestone &
Sexsmith Gathering, Tupper West & Tupper Main Enbridge
Alliance Pipeline Canadian and U.S. portions of Alliance Pipeline Fund Group
U.S. Midstream
Aux Sable, DCP (Field) Enbridge
US Gas Gathering & Processing Enbridge Energy
Partners, L.P.
Other Vector, Gulf Offshore Enbridge
Post Combination Segmented Reporting
Gas Pipelines & Processing Segment