enabling ventura county’s entrepreneurial … · ii.4 the ventura global water challenge 8 ii.5...
TRANSCRIPT
ECONOMIC DEVELOPMENT COLLABORATIVE
EDC
Thanks to the County of Ventura, the A.A. and Jeanne W. Milligan Fund and Ventura County Community Foundation for funding this study. Special thanks to the EDC Board and Economic Roundtable for their expert input.
ENABLING VENTURA COUNTY’S
A REPORT PREPARED FOR THE ECONOMIC DEVELOPMENT COLLABORATIVE | BY XOPOLIS LLC
ENTREPRENEURIAL ECOSYSTEM-2018

TABLE OF CONTENTS
I. Introduction 3
I.1 The Study of Entrepreneurial Ecosystems 3
I.2 The Structure of Our Report 5
II. Top Policy Priorities for Ventura County 6
II.1 Increasing Early Stage Firm Access to Equity Investment 6
II.2 Naval Base Ventura County Technology Transfer 7
II.3 The Port of Hueneme Entrepreneur Exchange Program 7
II.4 The Ventura Global Water Challenge 8
II.5 The Ventura Global Lemonade Stand 8
II.6 Job Matching and Mentorship Platform for the Gig Economy 9
II.7 Increasing the Accessibility of Commercial Kitchen Space 9
III. Assessing Ventura County’s Performance Relative to Other CA Counties 10
III.1 Four Dimensions of Ecosystem Performance 10
a. Entrepreneurial Density 12
b. Startup Connectivity 13
c. Resource Fluidity 13
d. Economic Diversity 14
III.2 Interpreting the Rankings for Ventura County and California 15
IV. Understanding the Policy Structure of Ventura County’s Entrepreneurial Ecosystem 16

V. Mapping the Economic Capabilities of Ventura County that Provide the Basis for Entrepreneurial Opportunity (The Economic Substrate) 18
V.1 The Full Ecosystem, Represented in Three Tiers 18
V.2 Regional Entrepreneurial Clusters 20
a. Advanced Manufacturing 20
b. Agriculture 21
c. Biotechnology 22
d. Defense-Related 23
e. Entertainment & Tourism 24
f. Information & Communication Technologies (ICT) & Professional Services 25
VI. Summary Remarks 26
Appendix I. Entrepreneurial Ecosystem Ranking Tool 27
Appendix II. Ventura County’s Economic Substrate 29
Appendix III. Cross-Cluster Relatedness – Opportunities 31
Appendix IV. Policy Rubric – Opportunities 32
2019 Board of Directors 33

This report, while concentrated on entrepreneurship, is developed intentionally to help guide the actions of a larger economic development agenda for Ventura County and its surrounding regions.
We start by mentioning this, because too often, when economic development officials start talking about strategies to develop regional entrepreneurship, the discussion turns immediately to hackathons, accelerators, and the activities of university technology transfer offices. That is regrettable, because most entrepreneurship is not digital, most entrepreneurial learning does not take place in accelerator programs, and most entrepreneurial dynamism does not come from the licensing of technology from universities.
In reality, entrepreneurial ecosystems are a tangible part of the day-to-day reality of economic life—that is, within the larger domain of economic development activity— deeply embedded within every dimension of regional economies. Every new restaurant, every corporate spin-off, every startup dream nurtured in a community college classroom or retirement seminar is part of the ecosystem. The capacities of people in the region to do real work are like the DNA of the ecosystem. The ability to combine and re-combine those productive capacities into new goods and services—including ones that are new to the region or new to a neighborhood, even if not new to the world—is the essence of the entrepreneurial process.
This is a report on the entrepreneurial ecosystem in Ventura County. It is about the real entrepreneurial activity of the region, along every dimension—about real outcomes of entrepreneurship for the region and about real options for making a strong ecosystem stronger. It is the outcome of an intensive six-month research effort undertaken by Xopolis LLC that comprises both extensive interviews with key players in the Ventura County entrepreneurial ecosystem and the use of novel data analytic techniques.
If one word can capture both the strengths and weaknesses of the Ventura County economy, and the reason why this report matters, it is “maturity”. For a regional economy, maturity is obviously a positive characteristic. It suggests that the region possesses highly evolved
I. INTRODUCTION
This is a report on the entrepreneurial ecosystem in Ventura County. It is about the real entrepreneurial activity of the region, along every dimension; about real outcomes of entrepreneurship for the region and about real options for making a strong ecosystem stronger.
3
I.1 THE STUDY OF ENTREPRENEURIAL ECOSYSTEMS

Nurturing an entrepreneurial ecosystem in a place like Ventura County is really about making the most of the upsides of regional economic maturity, while avoiding its downsides. It is about making continued evolution a reality and finding new pathways for authentic economic development.
capacities that are unlikely to exist in other places—the economic equivalent of the presence of a snow leopard or white rhinoceros in a biological ecosystem. The possession of such rare capacities makes the mature economy the envy of less-mature economies.
However, “maturity” can also imply stasis —the possibility of a hard reality that substantive evolution has come to an end, terminating at a developmental plateau.
Nurturing an entrepreneurial ecosystem in a place like Ventura County is really about making the most of the upsides of regional economic maturity, while avoiding its downsides. It is about making continued evolution a reality and finding new pathways for authentic economic development.
The essence of an entrepreneurial ecosystem is its people and the culture of trust and
collaboration that allows them to interact successfully. The ecosystem allows for the fast
flow of talent, information, and resources so that entrepreneurs can quickly find what they need at each stage of growth. As a result, the whole is greater than the sum of its parts.A thriving ecosystem includes these elements:
• Entrepreneurs who aspire to start and grow new businesses and the people who support entrepreneurs.
• Talent that can help companies grow. • People and institutions with knowledge and resources to help entrepreneurs. • Individuals and institutions that champion entrepreneurs and the ecosystem. • Onramps (or access points) to the ecosystem so that anyone and everyone can participate.
• Intersections that facilitate the interaction of people, ideas and resources. • Stories that people tell about themselves and their ecosystem. • Culture that is rich in social capital – collaboration, cooperation, trust, reciprocity and a focus on the common good.
From the Kauffman Foundation, The Entrepreneurial Ecosystem Playbook, www.kauffman.org
4

We start right in with our report, in Section II, featuring several priorities for action, a set of specific recommendations for strengthening Ventura County’s economy through increased entrepreneurial dynamism that have emerged from our work.
We provide the research foundations for the work in two sections. The first, in Section III, introduces an index of entrepreneurial ecosystem performance that is newly developed for this report and that provides a guide for action in the county. The second, in Section V, describes a novel method for identifying pathways of entrepreneurial activity that extend naturally from the county’s strongest, and most distinct, current capacities. The first is an easily grasped set of performance indicators for each of California’s 58 counties, allowing comparisons between and among them. The second makes for a denser read, but offers value as it provides an analytic framework for identifying strengths and opportunities for entrepreneurial growth by industry sector.
Section IV displays Ventura County’s strengths and weaknesses in a graphic format, organized around the several “domains” of an entrepreneurial ecosystem: Policy/Leadership, Finance, Culture, Supports, Human Capital and Markets. This display facilitates our development of strategy moving forward for both policy and practice for nurturing our entrepreneurial ecosystem.
Finally, Section VI provides our summary remarks, followed by the technical appendices displaying and describing in greater detail the methods we used.
It is our hope and intent that this report contributes positively to Ventura County’s overall economic development capacity and agenda, helping to deliver an expansion of economic opportunity and an enhancement of regional quality of life.
A healthy and vibrant entrepreneurial ecosystem is fundamental to supporting a competitive local economy.
5
I.2 THE STRUCTURE OF OUR REPORT

The EDC, through its Small Business Development Center, and in partnership with OCTANe LaunchPad Orange County and Iron Pond VC, are launching a venture forum for firms seeking second stage funding. The companies serviced under this program will have both a viable product and teams in place to qualify for this program, with a mini-mum request for $1 million. The premise of this program is that firms at this stage tend to create more economic impact to our economy in the form of jobs and revenue. Further, the focus on second stage financing fills a current gap in local capital networks for entrepre-neurs and is complementary to several earlier business stage venture capital forums and competitions.
This program’s goal is to provide business guidance and create access to capital growth resources through its network of investors, companies, subject matter advisors, and academics. In essence, this program will connect innovation and business growth by aligning experts that help entrepreneurs with business models, investment presentations, and general business guidance in all areas required to create a successful business plan and pitch that will interest financiers, and have a sustainable impact, on the life science, agribusiness, defense and technology sectors in Ventura and Santa Barbara counties.
• Value proposition – Increase deal-flow and enhance and highlight the profile of the region as active both in spawning new ventures and as a place to access the resources essential for firm growth. • Key partners – OCTANe LaunchPad, Matter Labs, Hub 101, a broad network of local business leaders serving as panelists evaluating and mentoring early stage firms. • Ecosystem tiers1 – Identify the most promising industry verticals for integrating NBVC and Port of Hueneme spin-off technologies into the broader economy.
II. TOP POLICY & PRACTICE PRIORITIES FOR VENTURA COUNTY
Through a combination of data analytics and expert interviews, we identified the specific sectors within the Ventura County economy that offer the greatest promise for opening up new development pathways. Based on that analysis and additional consultations, we arrived at a set of 19 policy alternatives. (For a display of the full set of 19 in the policy rubric, see Appendix IV).
We present here the top seven policy pathways identified by Xopolis and EDC for catalyzing Ventura County’s entrepreneurial ecosystem for a new phase of authentic development, setting the County on a path to be a national and global leader in innovation in its areas of strength.
It is important to note that we offer these pathways as illustrative examples of new directions that EDC and partners might take to build on existing activities with the specific goal of ensuring the dynamism of the county’s entrepreneurial ecosystem. They are not to be interpreted as a description of a full economic program or set of activities, even if adopted as a set.
1 For a description of Ecosystem tiers see Section V.6
II.1 INCREASING EARLY STAGE FIRM ACCESS TO EQUITY INVESTMENT

EDC works with regional stakeholders and partners to increase the rate and impact of technology transfer from Naval Base Ventura County (NBVC), with a particular focus on VC-based entrepreneurs.
• Value proposition – Provide a vehicle for increasing the impact of Navy research and development in the region. Provide Ventura County entrepreneurs with access to the novel technical applications that are developed at NBVC.
• Key partners – Various commands at NBVC, Matter Labs, Port of Hueneme, California State University Channel Islands, California Lutheran University.
• Ecosystem tiers – Identify industries to engage in the program based on match to local ecosystem.
Send entrepreneurs to discover new opportunities. Receive entrepreneurs to explore Ventura County’s entrepreneurship ecosystem. For a sample of this model, see www.startupexchanges.com.
• Value proposition – Increase the international profile of the region’s entrepreneurship. Improve connectivity of new startups with established industry for better mentoring and knowledge exchange.
• Key partners – Port of Hueneme, Naval Base Ventura County, Babson College, Hub101, local manufacturing and cottage industries, Cal State University Channel Islands, California Lutheran University.
• Ecosystem Tiers – Identify industries with connection to the maritime cluster to engage in program based on match to local ecosystem and international pairs of cities.
This recommendation builds on, and extends, the Port of Hueneme’s Maritime Advanced Systems and Technology (MAST) program (www.portofhueneme.org/ business/mast/).
We propose a consideration for MAST to join the startup exchange program and offer space in conjunction with partners such as EDC and NBVC. This strategy builds on the development of a technology exchange consortium partnership with NBVC, though specifically targets the maritime cluster of needs and technologies. The Port and EDC would facilitate partnerships with other incubators that are working on Port-related technologies. The Port may be able to start and accelerate this network through the port association to which they belong by:
• Hosting entrepreneurs in collaboration with NBVC for a several weeks or months program, • Organizing coursework at CSUCI, Cal Lutheran, community colleges and K-12, where possible and advantageous, providing a for-credit internship opportunity for entrepreneurs,
• Engaging local manufacturing and technology firm talent for tours of business.7
II.2 NAVAL BASE VENTURA COUNTY (NBVC) TECHNOLOGY TRANSFER
II.3 THE PORT OF HUENEME ENTREPRENEUR EXCHANGE PROGRAM

Ventura County commits to becoming the global leader for innovation in water treatment and efficiency, managing contaminated runoff, and long-term agricultural sustainability by 2026—America’s 250th anniversary—and issues a global challenge for water conservation, treatment and development technologies.
• Value proposition – Solidify the county’s long-term competitiveness in agriculture while fostering entrepreneurship in a global industry. Build a brand and mobilize the community with a big hairy audacious goal.
• Key partners – Calleguas Municipal Water District, United Water Conservation District, Metropolitan Water District, Fox Canyon Groundwater Management Agency, Ventura County Watershed Protection District, Ventura County Community Foundation, Naval Base Ventura County, Cal State University Channel Islands, California Lutheran University.
• Ecosystem tiers– Identify adjacent businesses engaged in water-related industries; define and strengthen a regional water industry cluster.The Ventura Global Water Challenge builds on existing water-related innovation involving local water districts, and may take advantage of the already established Metropolitan Water District (MWD) Innovates program (http://mwdinnovates.com/). The MWD program has local reach but has focused much of its activity in Los Angeles County. EDC proposes that local partners use this program as a starting point for a broader, multi-year, county-wide initiative that will set a water management perfor-mance standard for the nation.
Ventura County hosts a global entrepreneurship week for ag-tech.
• Value proposition – Entrepreneurial branding for Ventura County as the place to start a “lemonade stand” or any other entrepreneurial venture involving food systems with the aim of attracting global talent to visit Ventura County.
• Key partners – Limoneira, other leadership in the regional Ag and Food Systems economy, Port of Hueneme, Visitors and Convention Bureaus, Cal State University Channel Islands, California Lutheran University.
• Ecosystem tiers – Identify international cities to connect and engage in the programThe initiative will build from existing world-class capabilities within the county at Limoneira and several other leading agriculture and food systems firms and the University of California’s agriculture and natural resources programs. The program will feature agricultural technology, narrowly conceived, but will promote entrepreneurship and innovation related to food systems more broadly.
8
II.4 THE VENTURA GLOBAL WATER CHALLENGE
II.5 THE VENTURA GLOBAL LEMONADE STAND

• Value proposition – Increase gig-entrepreneurship by leveraging untapped talent and facilitating mentorship. Increase the reach and profile of Ventura County's entrepreneurial networks.
• Key partners – Matter-Labs, Hub 101, Workforce Development Board of Ventura County, The Kauffman Foundation, Cal State University Channel Islands, California Lutheran University and Ventura County Community College District.
• Ecosystem tiers – Match entrepreneurs with mentor networks in cities that have entrepreneurial competencies in their venture space. Algorithms to drive skills-based matching for the platform.
EDC proposes to launch the platform as a partnership with the Workforce Development Board of Ventura County. The platform will identify needs as well as individuals by asking names of independent contractors who work for some of our key firms, as well as the skill sets they outsource. EDC proposes that the job matching platform be designed such that the matching capacity and branding can be extended naturally to include mentor matching and mapping of dealmaker networks.
• Value proposition – Unleash scalability for local cottage industries with commercial kitchens.
• Key partners – Local food systems partners, restaurateurs, cities, Hub 101.
• Ecosystem tiers – Identify adjacent businesses relying on cottage industries.
EDC proposes to enable technical assistance in conjunction with local commercial kitchens and to encourage the development of others. EDC may also develop a listing of other restaurants that are willing to rent during their off-peak times.
II.6 JOB MATCHING AND MENTORSHIP PLATFORM FOR THE GIG ECONOMY
II.7 INCREASING THE ACCESSIBILITY OF COMMERCIAL KITCHEN SPACE
9

As of 2018, Ventura County ranks 9th among California’s 58 counties for its entrepreneurial ecosystem performance.
Ventura County’s relatively strong rank at 9th, and ahead of Santa Barbara County at 12th (by criteria described in detail below) is counter to popular perception. Rather than recognizing Ventura County’s competitive strengths, we more commonly heard in the development of this report that Ventura County does not host a vibrant or competitive entrepreneurial ecosystem. The data tells a more nuanced story.
While it is encouraging to see the county’s relative strong overall standing, the purpose of the methodology and ranking is not for credit or blame, rather it is to provide an analytical framework that may inform what actions the region’s leadership might consider to nurture the entrepreneurial ecosystem and thereby improve the county’s economic competitiveness.
What becomes apparent in the several indicator summaries following is that Ventura County is characterized by a diversity of strengths and weaknesses; recognizing and understanding those provides meaningful guidance for priorities in policy and practice moving forward.
III.1 FOUR DIMENSIONS OF ECOSYSTEM PERFORMANCE
As of 2018, Ventura County ranks 9th among California’s 58 counties for its Entrepreneurial Ecosystem performance.
10
III ASSESSING VENTURA COUNTY’S PERFORMANCE RELATIVE TO OTHER CALIFORNIA COUNTIES

Ventura County performs best in terms of its startup connectivity, ranking 8th in the state. The County’s ecosystem also ranks very high, 10th and 11th, respectively, in terms of the resource fluidity and economic diversity indicators.
To assess Ventura County’s performance in some consider-able detail relative to California’s 58 counties, we adapted a toolkit developed in 2015 by the Kauffman Foundation for measuring entrepreneurial ecosystems to make county- level entrepreneurship assessments.
Upon that basis, we ranked the vibrancy and performance of each California county, specifically along four entrepre-neurship indicators:
• entrepreneurial density, • startup connectivity, • resource fluidity, and • economic diversity. Each of these four indicators is informed by several sub-mea-sures, described in more detail in the following summaries.
We also in the following summaries compare the indicator rankings of Ventura County with those of Santa Cruz, Santa Barbara, and Orange counties, as these counties provide a reasonably diverse set of comparatives in the geography and culture of coastal California.
A full list of indicators and standing by county is provided in Appendix I. Figure 1 provides a radar chart showing the overall comparative entrepreneurial ecosystem indicator rankings of:
• Orange County, rank 4; • Ventura County, rank 9; • Santa Cruz County, rank 11; • Santa Barbara County, rank 12. In Figure 1, the top vertex shows the overall county rank, and the remaining four vertices show the individual indicator ranks for each of the counties.
Higher ranks— for example Orange County ranked number 4 overall, near the top of Figure 1—are represented away from the center.
Ventura County performs best in terms of its startup connectivity, ranking 8th in the state. The county’s ecosystem also ranks very high, 10th and 11th, respectively, in terms of the resource fluidity and economic diversity indicators.
Less competitively, however, the County’s entrepreneurial ecosystem significantly underperforms in generating entrepreneurial density—defined as the concentration of entrepreneurial activity in the region in terms of new business activity—ranking 21st in the state.
The following provides detail on the several economic measures that comprise the indicators, along with a summary of Ventura County’s relative standing.
FIGURE 1: ENTREPRENEURIAL ECOSYSTEM INDICATOR RANKINGS FOR SELECT COUNTIES IN CA, 2018.
11

FIGURE 2: ENTREPRENEURIAL DENSITY RANKINGS FOR SELECT COUNTIES IN CA, 2018.
a Entrepreneurial Density Entrepreneurial density measures the concentration of entrepreneurial activity in the region, in terms of new business activity and its potential for growth and successful exit.
Here we measure:
• The concentration of new business activity registered on the Crunchbase database in the past year because we want to capture the density of entrepreneurial new firms actively advertising a desire for growth by engaging with investor networks.
• The number of initial public offerings (IPOs) issued since 2015 to companies headquartered in the county, to reflect the potential for successful growth and exit.
• The rate of incorporated self-employment activity in the workforce to reflect the entrepreneurialism of residents, and the professional support available to local startups.
12
Ventura County underperforms significantly in the entrepre-neurial density indicator, ranking 21st overall. The county’s ranking lags especially because of a low incorporated self-employment rate of 3.8 percent, 27th out of the state’s 58 counties. Ventura County also ranks a relatively low 16th for the number of growth-oriented companies, but a relatively high 8th rank for the number of IPOs issued in the county since 2015. See Figure 2.

c Resource FluidityEcosystem resource fluidity is a measure of how effectively the entrepreneurial ecosystem is in using existing resources to create new opportunity. This indica-tor includes:
• The rate at which the county adds net new business establishments to its economy, as this captures the expansion of economic activity in the region.
• The incidence of high-growth firms to reflect the potential for new economic activity to be transformative for the ecosystem.
• The number of successful second stage rounds funded to companies headquartered in the county to capture the ecosystem assets that enable the high growth activities.
Ventura County ranks 10th in the state for its ecosystem fluidity, outranking both Santa Cruz (11th) and Santa Barbara (14th) on this indicator but lagging Orange County (6th).
Ventura County added 351 net new establishments to its economy in 2015, growing at a rate of 1.7 percent, placing it 12th in the state, and has 17 companies listed on the Inc. 500 list as of 2018, providing the County with a rank of 8th for high growth firms. Investors closed 48 second-stage deals with companies in Ventura County in the last 3 years, giving it a relatively low dealmaker’s rank of 15th in California.
b Startup ConnectivityEcosystem connectivity measures the presence of institutional and individual agents that facilitate the formation, growth and success of local startups. In this indicator we assess:
• The number of startup events hosted in the county. • The number of entrepreneurship programs in local higher education institutions.
•The density of individual angel investors reported active in the county.Ventura County ranks 8th in the state for its entrepreneurial startup connec-tivity. The county outperforms both Santa Barbara (10th) and Santa Cruz (16th) on this indicator but still lags Orange County (7th). For this indicator, Ventura County also ranks 8th both for the number of startup events and entrepreneurship programs hosted in the county.
However, Ventura County underperforms in the number of angel investors actively investing in local businesses, ranking 13th in California, with Crunch-base reporting 37 active individual angel investors in the County.
Ventura County’s strongest suits in this indicator are in hosting start-up events and entrepreneurship programs, with 15 startup events and 13 entrepreneur-ship programs listed on Crunchbase in the past year.
13
FIGURE 3: STARTUP CONNECTIVITY INDICATOR RANKINGS FOR SELECT COUNTIES IN CA, 2018.
FIGURE 4: RESOURCE FLUIDITY INDICATOR RANKINGS FOR SELECT COUNTIES IN CA, 2018.

FIGURE 5: ECONOMIC DIVERSITY INDICATOR RANKINGS FOR SELECT COUNTIES IN CA, 2018.
d Economic DiversityEconomic diversity captures the variety of available resources in the ecosystem for the generation of new ideas and business ventures. We measure diversity along two dimensions – people and processes. This indicator includes:
• People – the share of foreign-born residents in the county as a reflection not only of a higher propensity for entrepreneurship, but also to capture the pres- ence of cross-country and cultural networks that facilitate the introduction of new ideas and resources into the entrepreneurial ecosystem.
• Processes – the diversity of inter-related economic production processes at work in the county. This estimated measure provides an idea of how well- aligned different industrial activities are to one another, such that entrepreneurs can more effec- tively ‘bricolage’ existing knowledge and resources for innovation. Appendix 2 of this report provides a detailed assessment of Ventura County’s economic ‘substrate’.
Ventura County ranks a low 17th in California for the diversity of its entrepreneurial ecosystem. The county ranks 16th for its foreign-born share of population and 12th in terms of its economic diversification index.
Policies that engage technical exchange across different industry specializations are likely to have high entrepreneurial payoffs.
14
Ventura County boasts a strong diversity of economic activity that ranges across the agriculture, advanced manufacturing, biotechnology, defense related technologies, professional services, and the entertainment and tourism sectors. However, many of the county’s industry specializations do not share substantial interdependencies, resulting in potential loss of economic efficiencies that can bolster entrepreneurial growth. For instance, the policies that engage technical exchange across different industry specializations are likely to have high entrepreneurial payoffs for the County.
More detail is provided on the economic ‘substrate’ and industrial diversity of Ventura County in the next sections.

As displayed in Appendix I, five counties in California tend to significantly outperform all the other counties in the state in the ecosystem indicators. These counties are Los Angeles, San Francisco, Santa Clara, San Mateo, and San Diego.
This effect is partially due to the size of the counties (but not only, as San Mateo is not among the state’s largest counties) but also to the wide distribution of economic, demographic and geographic characteristics of counties in California. An implication of this fact is that breaking into the ranks of the top five counties in California is significantly more difficult than entering the top 10. Yet, even considering the skewed competitiveness of entrepreneurialism by county in California, our look in the summaries at what informs Ventura County’s overall ranking reveals that the county underperforms in several important measures relative to its peers. The county has a strong mix of the pre-requisites for a robust entrepreneurial ecosystem—a diverse economy, entrepreneurial culture, capacity to deepen entrepreneurial and investor networks—but the ecosystem requires attention relative to its capacity to increase entrepreneurial density.
The following section provides more insight into Ventura County’s relative strengths and weaknesses, as well as guidance on priorities for improving the region’s competitiveness.
III.2 INTERPRETING THE RANKINGS FOR VENTURA COUNTY AND CALIFORNIA
15

To better understand the policy structure, strengths and weaknesses of Ventura County’s entrepreneurial ecosystem, we mapped our indicator measures to Daniel Isenberg’s 2011 domains of entrepreneurial ecosystems, highlighted in color below, in Figure 6.
Figure 6 provides a visual representation for where policy and practice may be concentrated to improve entrepreneurial outcomes.
IV. UNDERSTANDING THE POLICY STRUCTURE OF VENTURA COUNTY’S ENTREPRENEURIAL ECOSYSTEM
FIGURE 6: THE DOMAINS OF VENTURA COUNTY’S ENTREPRENEURIAL ECOSYSTEM.
16

For a sample of how this chart may help guide our regional formation of policy and practice, we note the green Finance domain, which displays that Ventura County ranks 14th and 15th, respectively, in angel investors and second stage funding. This validates what is commonly believed, that Ventura County’s entrepreneurial ecosys-tem is weak in terms of access to equity investment. While Ventura County’s ranking in the Finance domain isn’t dire, it does suggest opportunity for improvement. As such, our top policy priority identi-fied in Section II is the launch of a second stage financing program through EDC in partnership with Matter Labs.
Further, related to the Policy/Leadership domain, we see that Ventura County ranks 22nd in new business growth. This is a more difficult indicator to influence—that is, there is no single policy action or practice that alone will move the needle—though the data clearly suggests that the county’s startup environment needs attention. With that awareness, the EDC Small Business Development Center is encouraged to direct more effort on startups and, especially, the growth of early stage firms.Note that two additional measures—the amount of federal contracting dollars awarded to businesses and the net migration rate—are included in Figure 6 but were not included in the rankings.
While we did not include these two measures in the core evaluation structure—mostly out of a desire to keep to a manageable set of variables—these additional measures help highlight important entrepreneurial ecosystem issues.
The federal contracting data, attached to the blue Policy/Leadership domain, is a bit of a mixed message. On the upside, Ventura County attracted $2.8 billion in federal contracting dollars by place of perfor-mance, which represents extraordinary opportunity for accelerating growth through public/private partnerships. But on the downside, our levels remain far shy of San Diego and Los Angeles counties, which attracted about $31 billion each, and, worse, currently there is little in strategic programming to optimize the value of the local federal investment. This data supports our number two policy priority identified in Section II, for increasing activity in technology transfer in collaboration with Naval Base Ventura County.
While Ventura County’s ranking in the Finance domain isn’t dire, it does suggest opportunity for improvement. As such, our top policy priority identified in Section II is the launch of a second stage financing program through EDC in partnership with Matter Labs.
The net migration flow data, attached to the pink Culture domain, reveals a profound weakness, that Ventura County ranks near the bottom quintile in California. That is, the county has been losing domestic migrants over recent years, even while it has gained in foreign migrants. This net outflow in domestic migration justifies an increasing anxiety among local policy leaders about the county’s future, that our population is getting older and the high cost of living makes Ventura County less attractive than other parts of the state.
As a balance to that concern, we do note with some encouragement the orange colored Supports domain, which shows that Ventura County is stronger than generally believed for startup events and entrepreneur programs. As positive as that is, it is also motivation to concentrate ever more effort in this area, nurturing an emerging strength of the region’s entrepreneurship ecosystem.
17

Ventura County’s economic ecosystem is very diverse with 111 four-digit NAICS industries showing a regional concentration of business activity greater than the national average, suggesting broad sectoral specialization.
Focusing on the most specialized business activity in the county and their related industries, we identified six entrepreneurial clusters in Ventura County. 1. Agriculture
2. Advanced Manufacturing
3. Biotechnology
4. Defense Related
5. Information and Communication Technologies (ICT)
6. Entertainment, Tourism and Professional Services
“Related industries” are those that share a high degree of interdependence with each other. This interdependence may result from shared supply-chains, common labor pools, or requiring similar infrastructure. In short, related industries tend to share overlapping economic agglomerations that bolster entrepreneurial output.
V. MAPPING THE ECONOMIC CAPABILITIES OF VENTURA COUNTY THAT PROVIDE THE BASIS FOR ENTREPRENEURIAL OPPORTUNITY (“THE ECONOMIC SUBSTRATE”)
Figure 7 shows the economic ecosystem of Ventura County segmented into three tiers according to the level of specialization of each industry. Only those industries present in one of the six entrepreneurial clusters of Ventura County are represented in the figure, and each tier’s core characteristics are listed alongside.
V.1 THE FULL ECOSYSTEM, REPRESENTED IN THREE TIERS
18

Tier 1 industries are at least twice as concentrated as the national average, revealing that businesses in these industries gain high competitive advantages from locating in Ventura County. Tier 1 businesses tend to be the oldest on average (median age 14 years) than other industries in the region, making them well-established and entrenched in the region’s economy. Tier 1 businesses had cumulative sales of $3,121 million in 2014, which amounted to $112,277 in sales per worker, highest in the county’s economy.
Tier 2 industries bare some competitive advantage in the regional economy being more concentrated than the national average, but less than Tier 1 industries. Businesses in this cluster have a greater turnover than Tier 1 industries and are also younger with a median age of 6 years. Nonetheless, in Ventura County business in this Tier pay the highest median wages to their employees at approximately $75,000 annually and bring in the most sales at $6,735 million in 2014, amounting to $109,853 sales per worker.
Tier 3 industries show no competitive advantages to being in Ventura County, and may even face regulatory or resource disadvantages that impede their growth. Businesses in these industries have a lower concentration than the national average and some, such as “restaurants and other eating places” are primarily local serving and lower paying. The median earnings per worker in this tier are the lowest at $37,840 with the tier’s total sales in 2014 at $4,247 million, or about $71,882 sales per worker.
FIGURE 7: MAP OF VENTURA COUNTY’S ECONOMIC ECOSYSTEM
19

Employment level 27,569 empaloyees
Total Annual Sales $3,880 million
Tier 1 - Establishments under 5 years (%) 22% (62 establishments)
Tier 2 - Establishments under 5 years (%) 30% (229 establishments)
Tier 3 - Establishments under 5 years (%) 20% (35 establishments)
Cluster Establishments under 5 years (%) 27% (326 establishments)
*Data for these charts and tables from Dunn & Bradstreet’s 2014 NETS database.
V.2 REGIONAL ENTREPRENEURIAL CLUSTERS
a Advanced ManufacturingThe Advanced Manufacturing cluster in Ventura County is well-established, with the median business having started or located into the county around 9 years ago. Most of the cluster’s activity is concentrated in Tiers 1 and 2, indicating that most of the county's businesses in this cluster are gaining some degree of local competitive advantage.
The largest employment share in Advanced Manufacturing in Ventura County either works for businesses in “semiconductor and electronic components manufacturing” (Tier 1), “electronic instrument manufacturing” (Tier 2) or “metalworking machinery manufacturing” (Tier 3).
20

Employment level 12,297 employees
Total Annual Sales $862 million
Tier 1 - Establishments under 5 years (%) 16% (72 establishments)
Tier 2 - Establishments under 5 years (%) 49% (150 establishments)
Tier 3 - Establishments under 5 years (%) 46% (188 establishments)
Cluster Establishments under 5 years (%) 35% (410 establishments)
*Data for these charts and tables from Dunn & Bradstreet’s 2014 NETS database
b AgricultureThe Agricultural cluster in Ventura County, broadly defined to include aquaculture and food-related activities, is well-established with the median business having started or located into the county around 9 years ago, and 16 years for Tier 1 industries in the cluster. The cluster’s activity is almost evenly distributed across all three tiers, but most young businesses less than 5 years of age are in Tier 2 or Tier 3.
The largest employment share in the Agricultural cluster in Ventura County either work for businesses in “fruit and tree nut farming” (Tier 1), “support activities for animal production” (Tier 1), or “vegetable and melon farming” (Tier 1).
21

*Data for these charts and tables from Dunn & Bradstreet’s 2014 NETS database.
Employment level 15,355 employees
Total Annual Sales $2,348 million
Tier 1 - Establishments under 5 years (%) -
Tier 2 - Establishments under 5 years (%) 31% (134 establishments)
Tier 3 - Establishments under 5 years (%) 34% (276 establishments)
Cluster Establishments under 5 years (%) 33% (410 establishments)
The Biotech cluster shows potential for growth and can be defined still to be in a nascent stage regionally— identifying as an important growth opportunity for the region.
c BiotechnologyThe Biotechnology cluster in Ventura County is young and emergent with no industries specializing in Tier 1 and other activities distributed across Tier 2 and Tier 3. The region’s biotech activity has historically developed around a handful of large companies, including Amgen, however this activity has not converted into significant spillover through sustained regional spinoffs to foster a thriving and entrepreneurial biotech cluster. New ventures in this space tend to follow venture capital and relocate outside of Ventura County (though there is some emergent activity for local equity investment). Additionally, the low presence of “medical and diagnostic laboratories” (Tier 3) in the county hampers the growth of new biotech venture startups that require wet-lab spaces to innovate and grow. The Biotech cluster shows potential for growth and can be defined still to be in a nascent stage regionally—identifying as an important growth opportunity for the region. The largest employment share in the Biotechnology cluster in Ventura County either work for businesses in “health and personal care stores” (Tier 3) “druggists’ goods and merchant wholesalers” (Tier 2), or “commercial equipment merchant wholesalers” (Tier 3).
22

Employment level 13,689 employees
Total Annual Sales $1,454 million
Tier 1 - Establishments under 5 years (%) 17% (13 establishments)
Tier 2 - Establishments under 5 years (%) 43% (1,131 establishments)
Tier 3 - Establishments under 5 years (%) 46% (11 establishments)
Cluster Establishments under 5 years (%) 42% (1,155 establishments)
*Data for these charts and tables from Dunn & Bradstreet’s 2014 NETS database
d Defense-relatedThe Defense-related cluster in Ventura County, narrowly defined to include maritime and aerospace activities, is an older regional cluster with the median business having started or located into the county around 6 years ago and 12 years for Tier 1 industries in the cluster. The cluster’s activity is almost entirely concentrated in Tier 2 industries (96% of establishments), and young firms appear in Tiers 2 and 3 industries of the cluster at nearly the same rate. This suggests the cluster to have dominant established companies in the Tier 1 space industries that dissuade new entrepreneurial entry.
The largest employment share in the Defense-related cluster in Ventura County either work for businesses in “building equipment contractors” (Tier 2), “building finishing contractors” (Tier 2), or “aerospace products and parts manufacturing” (Tier 1).
23

Employment level 35,282 employees
Total Annual Sales $1,690 million
Tier 1 - Establishments under 5 years (%) 37% (108 establishments)
Tier 2 - Establishments under 5 years (%) 42% (396 establishments)
Tier 3 - Establishments under 5 years (%) 34% (817 establishments)
Cluster Establishments under 5 years (%) 36% (1,321 establishments)
*Data for these charts and tables from Dunn & Bradstreet’s 2014 NETS database.
e Entertainment and TourismThe Entertainment and Tourism cluster in Ventura County is underdeveloped with potential for future growth. Most businesses in the cluster are between 6 and 9 years of age, making it a relatively young cluster in the county. The cluster’s activity is mostly concentrated in Tier 3 industries (66% of establishments) and in mostly local serving industries such as “restaurants and other eating places.” Young firms are mostly evenly distributed across the three tiers suggesting there is no specific entrepreneurial entry advantage to businesses in one tier over another. The largest employment share in the Entertainment and Tourism cluster in Ventura County either work for businesses in “restaurants and other eating places” (Tier 3) “motion picture and video industries” (Tier 2), or “advertising and related services” (Tier 2).
24

Employment level 43,948 employees
Total Annual Sales $3,868 million
Tier 1 - Establishments under 5 years -
Tier 2 - Establishments under 5 years 47% (2,100 establishments)
Tier 3 - Establishments under 5 years 51% (1,871 establishments)
Cluster Establishments under 5 years 49% (3,971 establishments)
*Data for these charts and tables from Dunn & Bradstreet’s 2014 NETS database.
f Information and Communication Technologies (ICT) and Professional ServicesThe ICT and Professional Services cluster in Ventura County has emerged largely as a support cluster for other regional economic activities. This is evident in the fact that less than 1% of establishments in this cluster are present among Tier 1 industries, all concentrated in “satellite telecom- munications.” Most businesses in the cluster are young, around 5 years of age, yet those in “satellite telecommunications” have been in Ventura County for a median 19 years. Most of the cluster’s business activity concentrates in Tier 2 industries (55% of establishments). Young firms are evenly distributed across the Tiers 2 and 3, suggesting possible barriers to entrepreneurial entry in Tier 1.
The largest employment share in the ICT and Professional Services cluster in Ventura County either work for businesses in “employment services” (Tier 3), “computer systems design and related services” (Tier 3), or “architectural and engineering services” (Tier 2).
25

A healthy and vibrant entrepreneurial ecosystem is fundamental to supporting a competitive local economy. Understanding what makes up that ecosystem—its strengths and weaknesses—is thereby fundamental to the work of local economic development.
This report’s contribution to that understanding is significant in several ways: • Its look at statewide data reveals that while competitive overall, Ventura County's Entrepreneurial Ecosystem is primed for further economic growth. To tap into this potential, this study identified the county's ecosystem strengths in the Diversity of its entrepreneurial industries; the Connectivity between its entrepreneurial agents; and the Fluidity with which the ecosystem creates existing resources into new opportunities. More concretely, entrepreneurship in Ventura County can be boosted by leveraging the region's assets for hosting startup events, entrepre- neurship programs, and fostering a more integrated network of investors.
• Ventura County's competitive advantages lie in its industrial mix, entrepreneurial culture, and an established policy infrastructure for economic growth. Yet, these features have not sufficiently converted into more businesses that start and grow in the county. To address this, this study recommended strategic initiatives in Section II that are rooted in the local economy and will serve to unlock nascent entrepreneurial talent and attract startups from outside of the region.
• Organizing the county-level indicator data by the domains of entrepreneurial ecosystems, coupled with the identification of the county’s strongest, and most distinct, current capacities by industry sector, informs our strategies and priorities for programs and investments to improve our regional economic competitiveness.
• The introduction of a comprehensive mix of measures at the county level allows us to track our progress over time and to understand our actual circumstance within the context of the larger California and US economy.
The analysis herein reported, of course, is only the start of a newly re-energized and better informed economic development strategy. As stated, Section II of this report identifies several strategies for moving forward, all of which will take resources, partnerships and regional com-mitments. We are encouraged to observe that the first of the several are already moving ahead. Finally, the authors and EDC offer our most gracious thanks to the several—too many all to be listed here—who generously contributed your time, your craft and passion to supporting this report and the work going forward.
Xopolis: Urban Analytics Philip Auerswald and Lokesh Dani
VI. SUMMARY REMARKS
26

APPENDIX I: ENTREPRENEURIAL ECOSYSTEM RANKING TOOL
County County Rank Entrepreneurial Density Startup Connectivity Resource Fluidity Economic Diversity
San Francisco 1 1 1 1 1
Los Angeles 2 2 3 3 3
San Mateo 3 8 4 5 4
San Diego 4 8 4 3 8
Orange 4 4 7 6 6
Alameda 6 21 6 2 4
Santa Clara 7 27 2 7 1
Marin 8 3 9 21 16
Ventura 9 21 8 10 11
Contra Costa 10 19 15 7 10
Santa Cruz 11 17 16 11 23
Sonoma 12 8 19 14 29
Santa Barbara 12 29 10 14 17
Riverside 14 35 18 13 8
Napa 15 35 13 18 12
Placer 16 25 28 9 24
San Luis Obispo 17 12 21 20 34
Sacramento 18 42 11 19 19
Monterey 19 40 12 29 12
Yolo 20 46 17 12 21
El Dorado 21 12 20 36 31
Nevada 21 6 26 29 38
San Bernardino 23 38 34 16 14
Kern 24 43 14 23 29
Plumas 25 12 27 16 56
Fresno 26 49 24 31 18
Mono 27 29 40 27 28
Mendocino 28 8 36 49 35
Stanislaus 29 52 23 25 31
27

County County Rank Entrepreneurial Density Startup Connectivity Resource Fluidity Economic Diversity
Merced 30 55 40 24 15
Butte 31 33 22 40 41
Humboldt 32 17 40 39 43
Tulare 32 53 25 35 26
Modoc 32 21 40 26 52
Lake 35 27 31 40 42
San Benito 35 49 33 21 37
San Joaquin 37 54 39 32 19
Siskiyou 37 16 32 43 53
Shasta 39 34 29 36 46
Calaveras 40 24 30 38 54
Sutter 40 47 40 34 25
Imperial 42 58 37 45 7
Solano 43 56 38 33 21
Tuolumne 44 15 40 44 51
Amador 45 19 40 46 49
Sierra 46 7 40 50 58
Trinity 47 4 40 55 57
Glenn 48 31 40 47 40
Colusa 48 38 40 53 27
Madera 50 48 40 40 31
Tehama 51 44 40 28 48
Alpine 52 25 40 58 39
Mariposa 53 32 40 54 45
Yuba 54 37 40 51 47
Del Norte 55 40 40 48 49
Kings 56 57 35 52 36
Inyo 57 44 40 57 43
Lassen 58 51 40 56 55
APPENDIX I: ENTREPRENEURIAL ECOSYSTEM RANKING TOOL
28

APPENDIX II. VENTURA COUNTY’S ECONOMIC SUBSTRATE
FIGURE 8: MAP OF VENTURA COUNTY’S ECONOMIC SUBSTRATE, WITH INDUSTRY LABELS
29
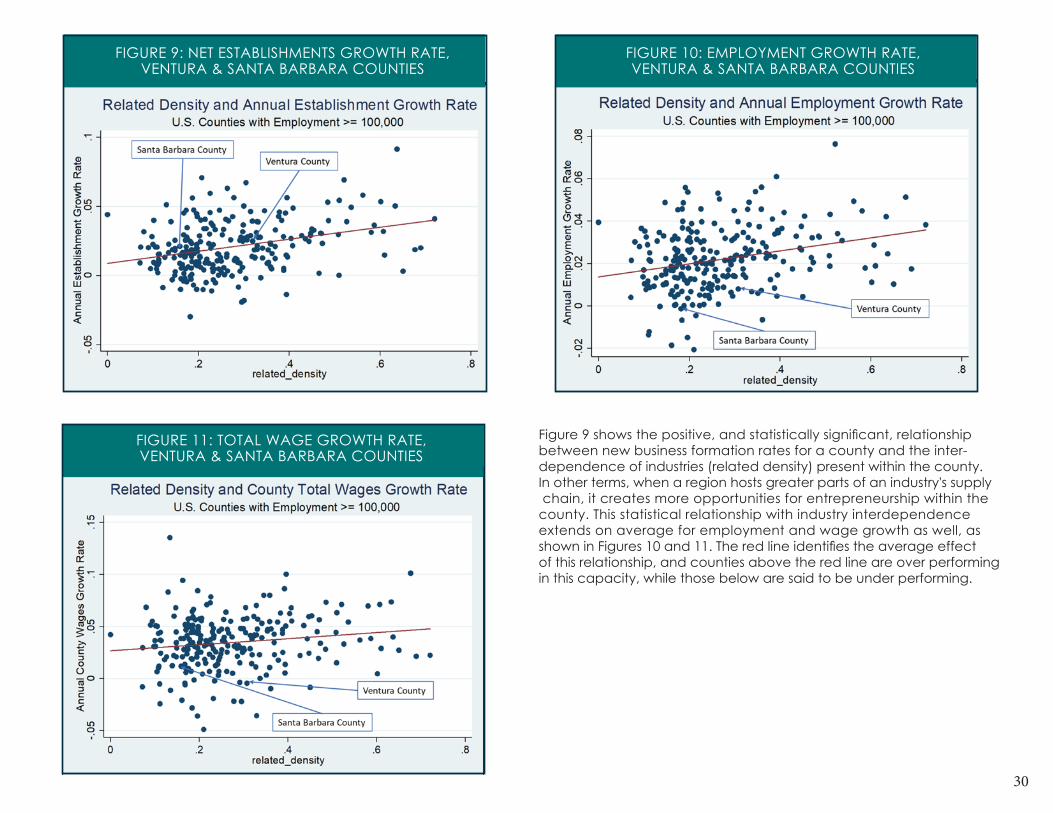
FIGURE 9: NET ESTABLISHMENTS GROWTH RATE, VENTURA & SANTA BARBARA COUNTIES
30
Figure 9 shows the positive, and statistically significant, relationship between new business formation rates for a county and the inter- dependence of industries (related density) present within the county. In other terms, when a region hosts greater parts of an industry's supply chain, it creates more opportunities for entrepreneurship within the county. This statistical relationship with industry interdependence extends on average for employment and wage growth as well, as shown in Figures 10 and 11. The red line identifies the average effect of this relationship, and counties above the red line are over performing in this capacity, while those below are said to be under performing.
FIGURE 10: EMPLOYMENT GROWTH RATE, VENTURA & SANTA BARBARA COUNTIES
FIGURE 11: TOTAL WAGE GROWTH RATE, VENTURA & SANTA BARBARA COUNTIES

APPENDIX III. CROSS-CLUSTER RELATEDNESS – OPPORTUNITIES
The chart below serves to highlight the density of related connections that cross Ventura County’s entrepreneurial clusters. Noticeably, the Defense-related cluster, the ICT & Professional Services cluster, and the Advanced Manufacturing clusters share the densest interdependencies with each other.
The Biotechnology cluster, as an emergent opportunity, connects strongly with all three of these clusters, suggestive that it could gain substantially from the technical know-how of local labor pools and technologies developed in these adjacent industries.
*Map with labelled nodes in Figure 8. Size of node corresponds to industry employment. Edge connection between nodes indicates a high level of relatedness between the two
industries because shared supply chains, labor pools, common infrastructure, or regulatory advantage. Establishment count, employment, and wages from Quarterly Census of
Employment and Wages 2016 with some values not disclosed.31

APPENDIX IV. POLICY RUBRIC – OPPORTUNITIES
32

Haider Alawami Economic Development Round Table Representative, City of Thousand Oaks
Gerhard Apfelthaler California Lutheran University
Mayor Will Berg City of Port Hueneme
Mayor Pro Tem Dee Dee Cavanaugh City of Simi Valley
Gary Cushing Chambers of Commerce Alliance
Kristin Decas Oxnard Harbor District/Port of Hueneme
Victor Dollar Ventura County Lodging Association
Nan Drake, Vice Chair E.J. Harrison Industries
Henry Dubroff Pacific Coast Business TimesHarold S. Edwards Limoneira Company
Council Member Bob Engler City of Thousand Oaks
Amy Fonzo California Resources Corporation
Mayor Clint Garman City of Santa Paula
Greg Gillespie Ventura County Community College District
Council Member Cheryl Heitmann City of Ventura
Supervisor Bob Huber County of Ventura
Supervisor Kelly Long County of Ventura
Nancy Mayerson Mayerson Marketing & Public Relations
Chris Meissner Meissner Filtration Products, Inc.
Council Member Roseann Mikos City of Moorpark
Council Member Manuel Minjares City of Fillmore
Susan Mulligan Calleguas Municipal Water District
Michele Newell VCEDA
Mayor Pro Tem Carmen Ramirez, Chair City of Oxnard
Jim Scanlon Arthur J. Gallagher & Co. Insurance
Alex Schneider The Trade Desk
Laurel Shockley Southern California Edison
Cari Shore Rabobank, N.A.
Tony Skinner I.B.E.W. - Local 952
2019 BOARD OF DIRECTORS
Trace Stevenson AeroVironment, Inc.
Sim Tang-Paradis City National Bank
Vice Mayor Tony Trembley City of Camarillo
Ysabel Trinidad California State University, Channel Islands
Council Memeber William Weirick City of Ojai
Peter Zierhut Secretary/Treasurer Haas Automation, Inc.
Nancy Kierstyn Schreiner Legal Counsel Law Offices of Nancy Kierstyn SchreinerBruce Stenslie President & CEO EDC
33


ECONOMIC DEVELOPMENT COLLABORATIVE
EDCEconomic Development Collaborative4001 Mission Oaks Blvd, Suite A-1Camarillo, CA 93012805.384.1800 www.edcollaborative.com