enabling our clients to meet the world’s evolving energy needs
TRANSCRIPT

Enabling our clients to meet the world’s evolving energy needs
2020 Annual report and accounts

We design, build, manage and maintain infrastructure for the energy industries. Our comprehensive and tailored service offering covers each stage of the project life cycle and a variety of commercial models, giving our clients the flexibility they need.
Engineering expertise, expertly delivered, is at the heart of everything we do. Our engineering excellence enables us to design and build world-class energy facilities that are engineered for safety and efficiency.
Enabling our clients to meet the world’s evolving energy needs
Read more atwww.petrofac.com
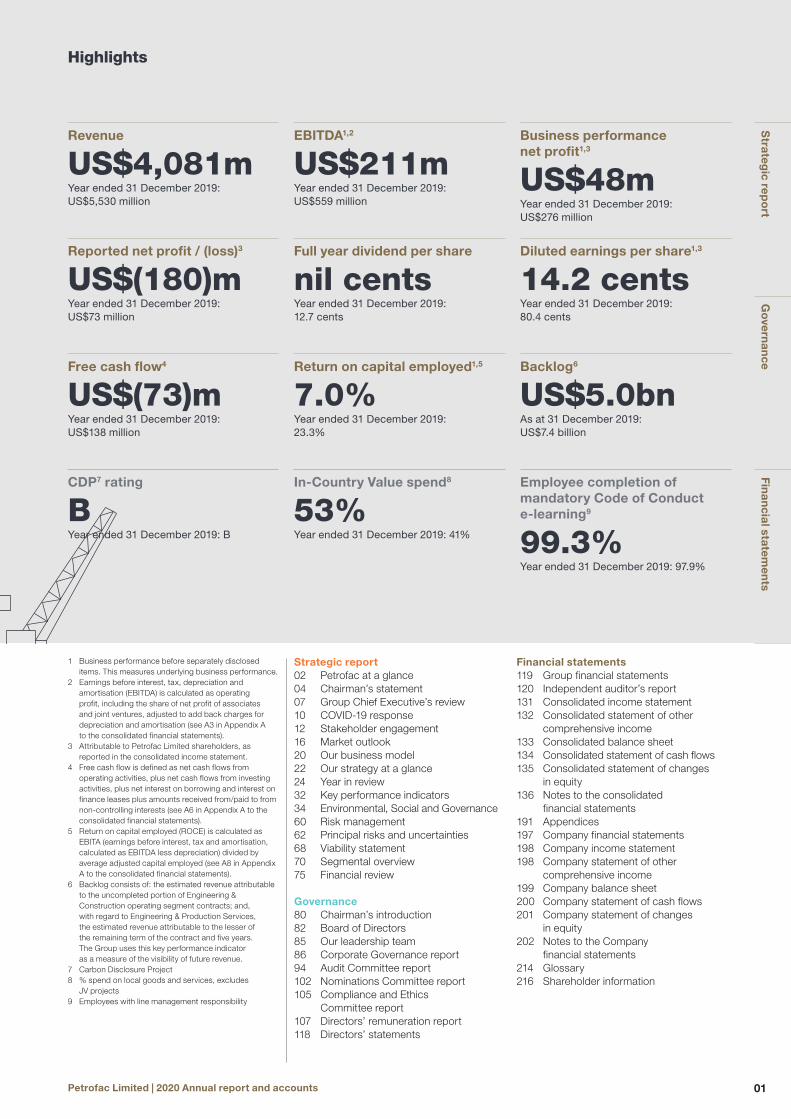
Revenue
US$4,081mYear ended 31 December 2019: US$5,530 million
EBITDA1,2
US$211mYear ended 31 December 2019: US$559 million
Business performance net profit1,3
US$48mYear ended 31 December 2019: US$276 million
Reported net profit / (loss)3
US$(180)mYear ended 31 December 2019: US$73 million
Full year dividend per share
nil centsYear ended 31 December 2019: 12.7 cents
Diluted earnings per share1,3
14.2 centsYear ended 31 December 2019: 80.4 cents
Free cash flow4
US$(73)mYear ended 31 December 2019: US$138 million
Return on capital employed1,5
7.0%Year ended 31 December 2019: 23.3%
Backlog6
US$5.0bnAs at 31 December 2019: US$7.4 billion
CDP7 rating
BYear ended 31 December 2019: B
In-Country Value spend8
53%Year ended 31 December 2019: 41%
Employee completion of mandatory Code of Conduct e-learning9
99.3%Year ended 31 December 2019: 97.9%
1 Business performance before separately disclosed items. This measures underlying business performance.
2 Earnings before interest, tax, depreciation and amortisation (EBITDA) is calculated as operating profit, including the share of net profit of associates and joint ventures, adjusted to add back charges for depreciation and amortisation (see A3 in Appendix A to the consolidated financial statements).
3 Attributable to Petrofac Limited shareholders, as reported in the consolidated income statement.
4 Free cash flow is defined as net cash flows from operating activities, plus net cash flows from investing activities, plus net interest on borrowing and interest on finance leases plus amounts received from/paid to from non-controlling interests (see A6 in Appendix A to the consolidated financial statements).
5 Return on capital employed (ROCE) is calculated as EBITA (earnings before interest, tax and amortisation, calculated as EBITDA less depreciation) divided by average adjusted capital employed (see A8 in Appendix A to the consolidated financial statements).
6 Backlog consists of: the estimated revenue attributable to the uncompleted portion of Engineering & Construction operating segment contracts; and, with regard to Engineering & Production Services, the estimated revenue attributable to the lesser of the remaining term of the contract and five years. The Group uses this key performance indicator as a measure of the visibility of future revenue.
7 Carbon Disclosure Project8 % spend on local goods and services, excludes
JV projects9 Employees with line management responsibility
Strategic report02 Petrofac at a glance04 Chairman’s statement07 Group Chief Executive’s review10 COVID-19 response12 Stakeholder engagement16 Market outlook20 Our business model22 Our strategy at a glance24 Year in review32 Key performance indicators34 Environmental, Social and Governance60 Risk management62 Principal risks and uncertainties68 Viability statement70 Segmental overview75 Financial review
Governance80 Chairman’s introduction82 Board of Directors 85 Our leadership team86 Corporate Governance report94 Audit Committee report102 Nominations Committee report105 Compliance and Ethics
Committee report107 Directors’ remuneration report118 Directors’ statements
Financial statements119 Group financial statements120 Independent auditor’s report131 Consolidated income statement132 Consolidated statement of other
comprehensive income133 Consolidated balance sheet134 Consolidated statement of cash flows135 Consolidated statement of changes
in equity136 Notes to the consolidated
financial statements191 Appendices197 Company financial statements198 Company income statement198 Company statement of other
comprehensive income199 Company balance sheet200 Company statement of cash flows201 Company statement of changes
in equity202 Notes to the Company
financial statements214 Glossary216 Shareholder information
Highlights
01Petrofac Limited | 2020 Annual report and accounts
Strateg
ic repo
rtG
overn
ance
Finan
cial statemen
ts

Petrofac at a glance
A leading international service provider to the energy industry
Our diverse client portfolio includes many of the world’s leading integrated, independent and national energy companies
Our purpose
We enable our clients to meet the world’s evolving energy needs
Our vision
To be the preferred services partner to the energy industry
Our strategy
Best-in-class delivery that positions us for market-leading growth to achieve superior returns
Our values
— Driven — Agile — Respectful — Open
Our services
— Design — Build — Operate — Train — Decommission
Engineering & ConstructionThe Engineering & Construction (E&C) division delivers onshore and offshore engineering, procurement, construction, installation and commissioning services. Lump-sum turnkey is the predominant commercial model used, but we also offer our clients the flexibility of other models. The division has a 39-year track record in designing and building major energy infrastructure projects.
Engineering & Production ServicesThe Engineering & Production Services (EPS) division manages and maintains client operations, both onshore and offshore, delivers small to medium scale EPC projects and provides concept, feasibility and front-end engineering design (FEED) services. The division is also home to market-leading well engineering, decommissioning and training capabilities. The majority of EPS’ services are executed on a reimbursable basis, but we are responsive to clients’ preferred commercial models to deliver our expertise.
Integrated Energy ServicesIntegrated Energy Services (IES) is Petrofac’s upstream oil and gas business, providing an integrated service for clients under flexible commercial models that are aligned with their requirements. These range from Production Enhancement Contracts (PECs) to traditional Production Sharing Contracts (PSCs).
Our approach to Environmental, Social and GovernanceAt Petrofac, we believe that how we do business is just as important as what we do.
We have a clear purpose: to enable our clients to meet the world’s evolving energy needs. We also have four clear values that underpin our purpose and govern how we operate: driven, agile, respectful and open; these core values are superseded only by our unyielding commitment to safety and ethical behaviour.
As we discharge our responsibilities to all stakeholders, we aim to be a force for good. Our approach is structured around three pillars:
Environment – ensuring that Petrofac is able to minimise its own environmental impact, while supporting our clients in achieving their lower carbon ambitions
Social – promoting safe local delivery of our projects and services, drawing on ethical supply chains to create in-country value, address skills gaps, and build a diverse and inclusive workforce
Governance – underpinning everything we do with clear, consistent standards of ethical behaviour, bound by rigorous compliance and governance
A highlight for 2020 was the launch of our new sustainability strategy and supporting targets. Developed by a Sustainability Committee chaired by our Chief Financial Officer, and approved by the Board in August 2020, this is structured around the three ESG pillars above. For each of them, we have set targets, including a commitment to reduce our Scope 1 and 2 emissions to Net Zero by 2030 and to achieve 30% of women in senior roles by 2030.
See pages 34-59
Highlights of the year — While the COVID-19 pandemic significantly impacted E&C’s operational performance, we continued to make progress on all projects — Major milestones successfully reached, such as the mechanical completion of bp’s upstream gas Ghazeer project — Extended offshore wind track record by securing the EPC contract for the Seagreen project in Scotland
Highlights of the year — Operational performance in 2020 was relatively resilient, despite the impact of the COVID-19 pandemic — Robust order intake, despite tightening market conditions — Progress in new energies, with awards in CCUS, hydrogen and waste to fuels
Highlights of the year — Completion in November 2020 of the sale of our 51% interest in the Mexican operations — Gross proceeds from the sale of non-core assets of US$140 million
Revenue
US$3,090m(2019: US$4,475m)
EBITDA
US$113m(2019: US$412m)
Business performance net profit
US$62m(2019: US$278m)
Employees
4,760(as at 31 December 2020)
% of revenue
75%
Revenue
US$933m(2019: US$889m)
EBITDA
US$59m(2019: US$67m)
Business performance net profit
US$39m(2019: US$48m)
Employees
4,135(as at 31 December 2020)
% of revenue
22%
Revenue
US$110m(2019: US$195m)
EBITDA
US$39m(2019: US$83m)
Business performance net profit / (loss)
US$(18)m(2019: US$(4)m)
Employees
254(as at 31 December 2020)
% of revenue
3%
02
Strategic report
Petrofac Limited | 2020 Annual report and accounts

Engineering & ConstructionThe Engineering & Construction (E&C) division delivers onshore and offshore engineering, procurement, construction, installation and commissioning services. Lump-sum turnkey is the predominant commercial model used, but we also offer our clients the flexibility of other models. The division has a 39-year track record in designing and building major energy infrastructure projects.
Engineering & Production ServicesThe Engineering & Production Services (EPS) division manages and maintains client operations, both onshore and offshore, delivers small to medium scale EPC projects and provides concept, feasibility and front-end engineering design (FEED) services. The division is also home to market-leading well engineering, decommissioning and training capabilities. The majority of EPS’ services are executed on a reimbursable basis, but we are responsive to clients’ preferred commercial models to deliver our expertise.
Integrated Energy ServicesIntegrated Energy Services (IES) is Petrofac’s upstream oil and gas business, providing an integrated service for clients under flexible commercial models that are aligned with their requirements. These range from Production Enhancement Contracts (PECs) to traditional Production Sharing Contracts (PSCs).
Our approach to Environmental, Social and GovernanceAt Petrofac, we believe that how we do business is just as important as what we do.
We have a clear purpose: to enable our clients to meet the world’s evolving energy needs. We also have four clear values that underpin our purpose and govern how we operate: driven, agile, respectful and open; these core values are superseded only by our unyielding commitment to safety and ethical behaviour.
As we discharge our responsibilities to all stakeholders, we aim to be a force for good. Our approach is structured around three pillars:
Environment – ensuring that Petrofac is able to minimise its own environmental impact, while supporting our clients in achieving their lower carbon ambitions
Social – promoting safe local delivery of our projects and services, drawing on ethical supply chains to create in-country value, address skills gaps, and build a diverse and inclusive workforce
Governance – underpinning everything we do with clear, consistent standards of ethical behaviour, bound by rigorous compliance and governance
A highlight for 2020 was the launch of our new sustainability strategy and supporting targets. Developed by a Sustainability Committee chaired by our Chief Financial Officer, and approved by the Board in August 2020, this is structured around the three ESG pillars above. For each of them, we have set targets, including a commitment to reduce our Scope 1 and 2 emissions to Net Zero by 2030 and to achieve 30% of women in senior roles by 2030.
See pages 34-59
Highlights of the year — While the COVID-19 pandemic significantly impacted E&C’s operational performance, we continued to make progress on all projects — Major milestones successfully reached, such as the mechanical completion of bp’s upstream gas Ghazeer project — Extended offshore wind track record by securing the EPC contract for the Seagreen project in Scotland
Highlights of the year — Operational performance in 2020 was relatively resilient, despite the impact of the COVID-19 pandemic — Robust order intake, despite tightening market conditions — Progress in new energies, with awards in CCUS, hydrogen and waste to fuels
Highlights of the year — Completion in November 2020 of the sale of our 51% interest in the Mexican operations — Gross proceeds from the sale of non-core assets of US$140 million
Revenue
US$3,090m(2019: US$4,475m)
EBITDA
US$113m(2019: US$412m)
Business performance net profit
US$62m(2019: US$278m)
Employees
4,760(as at 31 December 2020)
% of revenue
75%
Revenue
US$933m(2019: US$889m)
EBITDA
US$59m(2019: US$67m)
Business performance net profit
US$39m(2019: US$48m)
Employees
4,135(as at 31 December 2020)
% of revenue
22%
Revenue
US$110m(2019: US$195m)
EBITDA
US$39m(2019: US$83m)
Business performance net profit / (loss)
US$(18)m(2019: US$(4)m)
Employees
254(as at 31 December 2020)
% of revenue
3%
Strateg
ic repo
rtG
overn
ance
Finan
cial statemen
ts
03Petrofac Limited | 2020 Annual report and accounts

Chairman’s statement
In 2020, the COVID-19 pandemic had a profound impact on our market, on the way we delivered our projects, and on our ability to replenish our order backlog.
— The Board oversaw a swift and decisive reaction, cutting costs and conserving cash, while protecting our operational capability
—We also celebrate several notable achievements, including the seamless transition to a new Group Chief Executive, an acceleration of our ESG agenda, growth in our new energies business, and the successful delivery of some complex project milestones in the face of extremely challenging conditions
— As and when the recovery comes, we aim to be in a strong position to re-build our business and, ultimately, return to growth in the medium term
Clearly, our performance in 2020 was eclipsed by COVID-19.
The pandemic had a deep impact on our core markets, it put our clients under significant financial pressure, it compromised our supply chain, and it hindered our ability to deliver projects. The severity of the situation is reflected in our financial results as well as our new business performance.
We moved quickly to cut costs and conserve cash, bracing the Company for an extended downturn. Although we worked hard to protect our people and our subcontractors, we did experience a concerning deterioration in our safety performance. All the while, the unresolved Serious Fraud Office inquiry continued to cast its shadow and, disappointingly, resulted in our suspension from one of our core markets in early 2021.
René MédoriNon-executive Chairman
Petrofac Limited | 2020 Annual report and accounts04
Strategic report
Alongside the ongoing challenges, however, there were many achievements which deserve to be celebrated.
We appointed a new Group Chief Executive and managed his seamless onboarding; we made clear diversity and Net Zero carbon commitments; employee morale and engagement remained resilient; we continued to build our credentials in adjacent sectors, particularly in new energies; and, despite the significant disruption around us, we extended our reputation for executional excellence.
A case in point was the flawless delivery of the Ghazeer project in Oman for bp – which came in ahead of schedule and within budget. The safety record on the project was impeccable, worker welfare was exemplary, in-country value targets
were exceeded by a wide margin, several new environmentally-friendly techniques were introduced, and many ingenious ways were devised to progress and commission the project in the face of the pandemic.
Suspending the dividendAn important facet of our response to COVID-19 was to protect our financial strength, and we asked everyone in the business to make difficult sacrifices. We asked all of our people, from the Board down, to accept a 10% pay cut as we rebased salaries, 2020 merit increases were reversed, certain other allowances relinquished, and the response from the entire Petrofac team was exceptional.
In a similar vein, we took the decision not to pay a dividend for 2020.
I know how important the dividend is to our shareholders, and I have spoken to many about the rationale behind our decision. From these discussions, there was a clear consensus on the need to prioritise balance sheet strength as we navigate this period of uncertainty, ahead of making external distributions.
Appointing and onboarding a new Group Chief ExecutiveA major achievement for the year was the appointment and onboarding of Sami Iskander as our new Group Chief Executive. He has an excellent industry pedigree both in international oilfield services and upstream engineering and production, a deep and local understanding of our markets and client landscape, and a proven track record in business transformation.
This was a well-planned, well-executed transition, and credit goes to Ayman Asfari for adeptly facilitating and supporting the process (see sidebar).
The Board is extremely pleased with the appointment. We relish the energy and enthusiasm and the fresh perspectives that Sami is bringing to the role. We look forward to working with him closely to take the business forward.
Accelerating the ESG agendaIn 2020, we really accelerated the ESG agenda.
The shock to the oil and gas ecosystem during 2020 refocused our attention on Petrofac’s purpose and core strengths, the resilience of our existing markets, and the role we can play as the energy transition gathers pace.
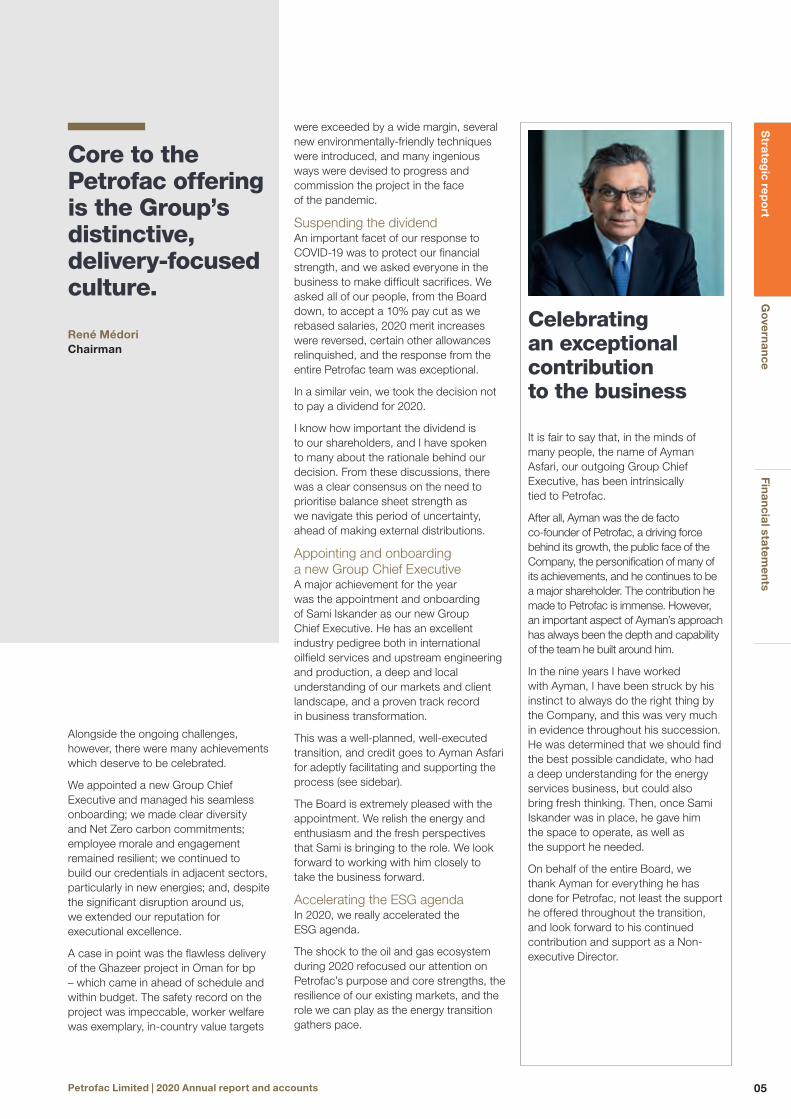
Celebrating an exceptional contribution to the business
It is fair to say that, in the minds of many people, the name of Ayman Asfari, our outgoing Group Chief Executive, has been intrinsically tied to Petrofac.
After all, Ayman was the de facto co-founder of Petrofac, a driving force behind its growth, the public face of the Company, the personification of many of its achievements, and he continues to be a major shareholder. The contribution he made to Petrofac is immense. However, an important aspect of Ayman’s approach has always been the depth and capability of the team he built around him.
In the nine years I have worked with Ayman, I have been struck by his instinct to always do the right thing by the Company, and this was very much in evidence throughout his succession. He was determined that we should find the best possible candidate, who had a deep understanding for the energy services business, but could also bring fresh thinking. Then, once Sami Iskander was in place, he gave him the space to operate, as well as the support he needed.
On behalf of the entire Board, we thank Ayman for everything he has done for Petrofac, not least the support he offered throughout the transition, and look forward to his continued contribution and support as a Non-executive Director.
Core to the Petrofac offering is the Group’s distinctive, delivery-focused culture.
René MédoriChairman
Strateg
ic repo
rtG
overn
ance
Finan
cial statemen
ts
05Petrofac Limited | 2020 Annual report and accounts

The Board has a strong conviction that, by helping clients to pursue their decarbonisation ambitions, Petrofac is optimising the breadth of its offering to clients as the world shifts to a low carbon future. We therefore see the energy transition as a strategic opportunity, and we will further develop this positioning as Sami becomes more established in his role.
As for 2020, we made a clear Net Zero carbon commitment by 2030. We also recognised that, although we are content with the composition of the Board itself, we need to bring more diversity to the wider Group. In terms of gender, we have set a series of targets and, in terms of ethnicity, we are determined that our teams should become more representative of the societies in which they work.
Safety remains an important issue. Our aspiration is for zero safety incidents and, most of the time, we do live up to this goal. In 2020 we fell short, including the tragic fatalities of two colleagues on our project sites in India and Oman. Irrespective of the challenging circumstances, this was unacceptable, and I am pleased that Sami is so resolute on the matter.
Ethical conduct is another clear priority. At the start of the year, I participated in the global launch of our updated Code of Conduct, making it clear to the entire Company that the Board expects the highest standards of behaviour. As part of the succession process, we satisfied ourselves that Sami is similarly uncompromising in this area. Along with a new management team, a comprehensive suite of compliance and financial controls, and clearly defined behavioural expectations, I am confident Petrofac operates at the highest levels of integrity.
Adapting the way the Board works The COVID-19 pandemic also brought challenges to the Board itself.
We aim to have at least one meeting at a project site, which gives us an important insight into the inner workings of the Group. In 2020, this was not possible, so we found ways to compensate.
We met more frequently, albeit virtually, and ensured that a wider range of executives could join our discussions. Meanwhile, as part of our diversity and inclusion initiatives, our three female Non-executive Directors participated in a series of virtual events, which included sessions with the 20 most
senior women and separate sessions with our female graduates. The entire Board also attended the launch of our revised Code of Conduct.
We were fortuitous that our Workforce Forum, created in 2019 is in place. Of all the options we considered for increased employee engagement, I am delighted that we took such a progressive approach. In this most challenging of years, the Forum was an invaluable source of deep insights and sage advice and provided real engagement for the Board.
Looking ahead to 2021 and beyondFor 2021 the clear priority for the Board is to continue to monitor the transition process, ensuring that the new Group Chief Executive has the support he requires. The immediate priorities are to realise more than US$100 million in additional cost savings in 2021, conserve cash, rebuild the backlog and maintain our record for operational excellence. We also expect to bring more granularity to Petrofac’s positioning in new energies and strategy for growth.
Another matter for the Board will be to manage my own succession. Whilst I was due to step down this year, I have agreed to remain in post for one more year to provide continuity during the transition, further details are set out on page 103.
Although the near-term economic and business outlook is far from clear, we believe we will be well-positioned for growth as our core markets recover, as client needs evolve, and as we extend and expand our track record in new energies.
For now, I would like to thank our shareholders for their patience and loyalty. I would also like to pay tribute to the entire Petrofac team for their exceptional response to a uniquely challenging set of circumstances.
René MédoriNon-executive Chairman20 April 2021
Chairman’s statement continued
Petrofac Limited | 2020 Annual report and accounts06
Strategic report

Group Chief Executive’s review
Overview — Petrofac has a differentiated positioning in some of the world’s most resilient oil and gas markets, the ability to help clients reduce the carbon intensity of their existing operations, a demonstrable track record in offshore wind and the ideal skill set for other new energy markets including carbon capture and hydrogen, and waste to fuel.
— Many of the challenges of 2020 will extend into 2021. Whilst we flexed our approach in 2020 to cope with these exceptional conditions, our fundamental, medium-term strategy remains largely unchanged: best-in-class delivery, return to growth, and superior returns.
— We will accelerate our transition to a simpler, agile business to better service existing and new clients through a new operating model, whereby efficiency and consistency of execution will be enabled by a single technical organisation that provides support and assurance to E&C and EPS.
— How we do business is just as important as what we do. Our ESG culture will be characterised by an implacable commitment to consistent ethical behaviour, uncompromising safety, employee wellbeing, diversity and inclusion, delivering on our Net Zero carbon commitments, and bringing tangible benefits to the societies in which we operate.
Sami IskanderGroup Chief Executive
Strateg
ic repo
rtG
overn
ance
Finan
cial statemen
ts
07Petrofac Limited | 2020 Annual report and accounts
Q As incoming Group Chief Executive, what attracted you to Petrofac, and what are your early impressions of the business?
A. Despite the recent challenges, from my time in the industry, I have known, admired and worked with Petrofac for many years, and I am excited to be joining the business, albeit at a challenging time.
Petrofac benefits from a strong heritage in traditional oil and gas markets, thanks to its outstanding people and expertise, its strong commitment to safety, and its local delivery model – which is key to the efficiency of the business, while also creating in-country value.
Thanks to our transferable skills and subject matter expertise, we also have a strong, and growing, foothold in the new energy sector, with a decade of experience in offshore wind, expertise in hydrogen, and an embryonic position in carbon capture. We will pivot more of our business development and execution efforts towards this part of the business which, whilst small today, is disproportionately important and growing.
Importantly, Petrofac is a capital light business, which gives us the ability to generate attractive free cashflow and returns as soon as our markets recover.
Q Clearly, 2020 was dominated by the COVID-19 pandemic. Broadly, what was the impact on Petrofac?
A. The impact has been significant, from an operational perspective and also in terms of the commercial environment.
Operationally, with strict travel restrictions and the need for stringent health protocols, we had to find solutions, which were often costly. Many of our people were confined to project sites for months at a time, with no opportunity for the usual rotations, which brought added worry and fatigue. Tragically, we also lost two of our employees and one contractor to COVID-19, so we know how deadly this virus can be.
Commercially, we saw clients coming under real pressure due to the crash in commodity prices. Like us, they were seeking to conserve cash, resulting in a tightening of conditions, tougher stances on commercial settlements, the delay or deferral of several project awards, and a scarcity of new bidding opportunities.
Q What was Petrofac’s response to the pandemic?
A. The safety and security of our people, sub-contractors and clients was our number one priority. Across all project sites, we implemented consistent COVID-secure standards, and quickly enabled remote working for office-based employees, securing at-home access to our enterprise and engineering applications.
We also saw new benefits from our ongoing digitalisation initiatives, enabling us to find ingenious solutions, some of which will become standard practice. For example, we deployed drone technology to conduct remote inspections, we adapted our PetrofacGo app to mobilise our teams, and Connected Worker provided a digital connection between onsite personnel and subject matter experts.
We were also swift and decisive in rightsizing the business and conserving cash. This included a significant reduction in our headcount, which was painful and saddening for everyone. For 2021, we must continue to protect the business by bringing costs down, and have targeted more than US$100 million in additional cost savings, taking the total to US$250 million relative to pre-pandemic levels.
At the same time, we have been careful to protect our core capability. The net result should be a leaner, more competitive business, which can spring back as the market recovers.
Q How was Petrofac’s performance impacted?
A. The severity of the situation was reflected in our performance.
In E&C, contract losses, a decline in project activity, increased operational costs, and changes in project mix all weighed heavily on our results, with full-year revenues of US$3.1 billion. EPS remained resilient, in part due to its reimbursable commercial model, and a strong order intake. The fall in commodity prices had a material impact on IES revenues.
While our win rate was consistent with previous years, the Group’s new order intake of US$1.6 billion reflected a much lower level of industry awards and resulted in a decline in our backlog. It is encouraging nonetheless that 22% of these awards are in renewable energy projects.
In 2020, our strategic approach was flexed to reflect the circumstances, and we adopted four immediate priorities to help us navigate the environment: cutting costs, conserving cash, rebuilding the order backlog, and delivering operational excellence.
Q Looking ahead, how do you see the strategy evolving under your leadership?
A. Since joining Petrofac I have met and listened to many of our people, our clients and our stakeholders. These first months have reinforced my view of our fundamental strengths. They have also clarified what we need to do better to restore confidence in the business and set it on a course to grow with existing and new clients.
Our strategy, with its three clear pillars: best-in-class delivery, return to growth, and superior returns remains sound; and I am confident that executing unfailingly against this strategy will put us on the path to success in the medium term.
However, on top of this, I am committed to a better future, which brings greater consistency of execution, universal recognition of our ethical conduct and business practices, and which delivers sustainable growth in existing and new markets, including new energies.
Shortly before the publication of this report, an unanticipated and disappointing decision by a client in the UAE, to suspend Petrofac for the time being from competing for new work, led us to adjust both the emphasis and speed of several planned short-term strategic objectives.
We will therefore accelerate our planned simplification and reshaping of the Group, to better serve existing and new clients, and our transition to new energies. At our core will be a new operating model founded on a single standard of excellence, driving consistent execution and customer quality. The glue that holds this together will be a single technical services organisation that provides support and assurance – enabling one Petrofac, operating with optimal efficiency, with common systems and procedures, backed by transparent checks and balances.
We will accelerate the growth of our newly-created new energies business, which will blend the best of our EPC know-how with the client management of our EPS offering to offer an enhanced service in available core markets, and new ones, as markets begin to recover.
I am confident that in the medium term, this approach will give us a clear path for growth.
The energy transition also represents a strategic opportunity for us, and one that is moving at pace. We not only have a role to play but have the inherent skills to help the industry transition to a greener future. The credentials and capabilities we have developed in the past 30 years have already
Chief Executive’s review continued
Petrofac Limited | 2020 Annual report and accounts08
Strategic report

proven to be transferable to new energies. In fact, we are already helping clients to reduce the carbon intensity of their existing operations; we are extending our ten-year track record in offshore wind; and, as recent new business wins demonstrate, we have the ideal skill set to compete in nascent opportunities such as hydrogen and carbon capture, and waste to fuel.
Q Can you give us your perspective on the ESG agenda? What aspects are most important to a company like Petrofac?
A. How we do business is just as important as what we do. We have a clear purpose: to enable our clients to meet the world’s evolving energy needs; and we aim to be a force for good as we discharge our responsibilities to all stakeholders. This is underpinned by both our values and a clear set of behaviours that are an integral part of our performance management process.
Safety has always been a Petrofac strength, and the deterioration in performance in 2020 was unacceptable. As well as losing colleagues to the virus, there were two fatalities on our project sites. The COVID-19 pandemic did bring challenges, but we should have done better at overcoming them. Going forward, my ambition is for Petrofac to be the world’s safest workplace.
A second priority for me is our continued commitment to operating with the highest standards of ethical business practice, from the compliance and financial controls we have in place to our practical behaviours, and the significant enhancements and investments made over the past few years. Unethical behaviour has no place in our business, and I have every confidence that the Petrofac I have joined is a highly compliant, responsible organisation; one that I am proud to lead, and which I will work hard to ensure our stakeholders recognise.
Our environmental commitments were an ESG highlight for 2020. The challenge now is to get more granular on how we achieve our Net Zero carbon commitment, and further develop our positioning in new energies.
In terms of diversity and inclusion, there are pockets of good practice, such as at Board level and our graduate programmes. But we have much more work to do across our business as a whole, which is why we have set stretching gender diversity targets for 2025 and 2030. I am also keen for all of our teams to become more representative of the markets in which they operate.
Q How about the Petrofac people? How have the developments of 2020 affected morale and engagement? And what are your priorities going forward?
A. It was a punishing year for everyone in Petrofac, particularly those working on our project sites. Together with the operational challenges, we went through a painful rightsizing process, and introduced tough remuneration cuts. 2021 has so far offered little respite, with the SFO’s announcement in January related to additional pleas to bribery offences by a former employee resulting in our suspension from the UAE market. Despite these ongoing challenges I have been impressed with the response of our employees. I offer my profound thanks to everyone for their continuing commitment to the Company.
Given the circumstances of the year, there was some trepidation over the results of PetroVoices, our employee engagement survey. However, eight of the nine survey categories showed a year-on-year improvement, and the metric of Sustainable Engagement – which is the overall barometer of how people are feeling – improved from 85% to 87%. This speaks of the loyalty and commitment of our people and these are quite exceptional results in the current circumstances.
Ultimately, this is a people business. It is our employees who set us apart. I am determined that Petrofac should always be a place where people feel proud to work, without reservation, as well as a place where they feel safe and cared for.
Q What’s your sense of the outlook for 2021 and beyond?
A. The challenges of 2020 will extend into 2021, however they have given us an opportunity to accelerate our organisational transition, and look for growth beyond some of our traditional core markets. This means reshaping our business in order to rebuild our backlog, capitalising on the recovery in accessible existing markets, diversifying into new geographies and accelerating our pivot to new energies.
The Group has a diverse tendering pipeline of around US$20 billion of opportunities scheduled for award by the end of 2021 and US$34 billion of opportunities due for award in 2022. We also expect spending in new energies to continue to grow and nascent markets in carbon capture and hydrogen, for example, to become increasingly material. Already, these projects account for 8% of our E&C bidding pipeline, and we expect that proportion to increase in the future.
We expect late 2021 to mark the start of a recovery period for the industry, with a return to pre 2020 capex spend levels by 2023. We will seek to capitalise on this recovery in our core accessible markets, whilst also targeting growth in selective new geographies and accelerating our transition to new energies. In parallel, we will deliver on our ESG commitments and continue to improve our cost-competitiveness. I am confident that through these measures and the execution of our strategy we will recover to deliver sustainable value for all our stakeholders over the medium term.
Sami IskanderGroup Chief Executive20 April 2021
Strateg
ic repo
rtG
overn
ance
Finan
cial statemen
ts
09Petrofac Limited | 2020 Annual report and accounts

COVID-19 response
A robust response to COVID-19The COVID-19 pandemic brought major disruption to the energy sector and a deterioration in market conditions which, for Petrofac, led to project delays and increased costs.
Meanwhile, the sharp decline in oil prices put both national and international oil companies under financial pressure, with many of them seeking to reduce costs and protect their balance sheets. This resulted in the deferral of capital spending and a scarcity of industry awards. We also experienced slower payments, and a more challenging commercial environment with respect to contractual claims.
Our response to these challenges was swift and decisive.
We continued to deliver for clients while protecting the health and wellbeing of our people, clients and suppliers. We also took robust action to protect the long-term health of the business and mitigate the impact of the COVID-19-related headwinds on our financial performance.
The risks relating to COVID-19 that could have a longer-term impact on the business are set out in the Principal Risks and uncertainties section on pages 62-67.
Focusing on four immediate priorities
1 Protecting the health and wellbeing of our people, clients, suppliers and communities
This was our number one priority. A Group-wide COVID-19 response and recovery programme was quickly instigated (see page 44), with regular Group Crisis Team and Business Support Team meetings to oversee our response to the pandemic. We worked hard to protect our people, especially those who were required to stay on project sites for extended periods as a result of travel restrictions. In recognition of the added pressure, we increased our focus on wellbeing, for example, we extended our Employee Assistance Programme, which gives all of our people and their family members easy 24/7 access to independent advice and counselling (see page 44). We also offered charitable donations to frontline healthcare services in several countries (see page 49).
Clearly, the COVID-19 pandemic and our response to it has been challenging for Petrofac’s people. We were therefore pleased with the results of PetroVoices, our employee engagement survey, conducted in October 2020. Eight of the nine survey categories showed an improvement in score year-on-year and the metric of Sustainable Engagement – which is the overall barometer of how people are feeling – improved from 85% to 87% (see page 47).
March April June July August November December11 March – the World Health Organization declares a global pandemic.
31 March – the price of Brent Crude Oil continued its rapid slide to US$23 a barrel
March/April – mobility restrictions and safety protocols began to have material impact on our construction progress
6 April – we issued a statement in response to COVID-19 and the collapse in the oil price, which included the notification that the final dividend would be suspended
16 April – A notice of termination issued for the recently awarded Dalma Gas Development Project
20 April – record levels of over-supply and storage concerns drove oil prices to historical lows, with the West Texas Intermediate price briefly crashing to -US$38
29 April – the invitations for shareholders to attend our 2020 AGM was withdrawn, in line with the UK Government’s ‘Stay at home’ measures
April/May – Some projects went into lockdown, and all our training centres were temporarily closed
24 June – we announced further cost cutting measures
July – most lockdown restrictions eased, but safety protocols continued to materially disrupt progress on most of our sites
July – our training centres gradually began to reopen
30 August – the number of global confirmed COVID-19 cases passed 25 million
20 November – positive developments with vaccines prompted an increase in oil prices
16 December – we announced further cost cutting measures for 2021 in response to continued project disruption and a lack of industry awards
31 December – the price of Brent Crude Oil climbed above US$50 based on vaccine-driven optimism for demand
COVID-19 response timeline
Petrofac Limited | 2020 Annual report and accounts10
Strategic report

2 Protecting the financial strength of the Group
With delays to projects, the deferral of awards and a toughening commercial environment, it became necessary to preserve strength in our balance sheet. For 2020, we delivered a reduction in overheads and project support costs of US$140 million, and aim to deliver more than US$100 million in additional cost savings in 2021. As Petrofac is a people-based business, the majority of these savings relate to personnel costs. We asked our people, including our Board and senior management, to accept a 10-15% pay cut, as well as forgoing certain other allowances. As the challenges intensified, it became necessary to also make a number of redundancies across the Group, with staff numbers reducing by 16% on 2019 (see page 46). As well as reducing capital expenditure by 60% and suspending the dividend, we conserved approximately US$275 million of cashflow. At the year- end, net debt stood at US$116 million, with liquidity of US$1.1 billion (see page 78).
3 Protecting our competitiveness
In addition to protecting our balance sheet strength, cost savings ensure that Petrofac maximises its competitiveness, while preserving its delivery capability. This means that we should be in a better position to secure awards when the market recovers.
4 Protecting our delivery capability
Our second priority was to ensure that our business operations were able to continue, and that clients were able to receive the essential services we provide. With lockdowns and travel restrictions across much of the world, this entailed close collaboration with clients, vendors and subcontractors. Often, we deployed new digital technologies such as PetrofacGo and Microsoft Teams to conduct virtual site audits, remote inspections and connect onsite teams with remotely-located subject matter experts. For our office-based people, we pivoted swiftly to working from home, providing secure access to our enterprise and engineering applications. Then, as lockdowns eased, a Return to Workplace Guide and toolkit were developed which outlined Petrofac precautions and protocols, as well as individual responsibilities (see page 44).
The impact on our business unitsEngineering & ConstructionThe E&C financial performance in 2020 was significantly impacted by the pandemic, which delayed project schedules and increased costs. Meanwhile, the decline in oil prices brought a reduction in capital spending among clients, resulting in widespread delays to awards, the termination of our Dalma Gas Development Project in Abu Dhabi, and a tighter commercial environment. See E&C segmental review on page 71.
Engineering Production ServicesThe impact on EPS was less pronounced, with 2020 revenue growing relative to 2019. The training services business was most affected, as all centres worldwide were temporarily closed during initial lockdowns. See EPS Segmental review on page 73.
Integrated Energy ServicesThe IES financial performance in 2020 was significantly impacted by the sharp fall in oil prices. The operational impact was relatively limited, although planned capital spending for bringing additional wells online in Malaysia was deferred in order to conserve cash. See IES Segmental review on page 74.
Longer-term impacts on the business and our strategyThe COVID-19 pandemic brought significant uncertainties to the outlook for the global energy sector. The duration of the pandemic, the shape of the recovery, and the response from governments will all have an impact on future demand for energy and the likely energy mix. However, the pandemic has likely contributed to a renewed appetite for clean energy policies and investments. It is therefore possible that this will be a catalyst for change and will accelerate the global transition to cleaner fuels, expanding the opportunities for Petrofac in these markets (see Market Outlook section on page 16).
It has also been a catalyst internally, accelerating our digitalisation programmes, adoption of cloud technology, and the consequent rightsizing of the Group. As a result, we expect to emerge with a more efficient and cost-competitive business.
March April June July August November December11 March – the World Health Organization declares a global pandemic.
31 March – the price of Brent Crude Oil continued its rapid slide to US$23 a barrel
March/April – mobility restrictions and safety protocols began to have material impact on our construction progress
6 April – we issued a statement in response to COVID-19 and the collapse in the oil price, which included the notification that the final dividend would be suspended
16 April – A notice of termination issued for the recently awarded Dalma Gas Development Project
20 April – record levels of over-supply and storage concerns drove oil prices to historical lows, with the West Texas Intermediate price briefly crashing to -US$38
29 April – the invitations for shareholders to attend our 2020 AGM was withdrawn, in line with the UK Government’s ‘Stay at home’ measures
April/May – Some projects went into lockdown, and all our training centres were temporarily closed
24 June – we announced further cost cutting measures
July – most lockdown restrictions eased, but safety protocols continued to materially disrupt progress on most of our sites
July – our training centres gradually began to reopen
30 August – the number of global confirmed COVID-19 cases passed 25 million
20 November – positive developments with vaccines prompted an increase in oil prices
16 December – we announced further cost cutting measures for 2021 in response to continued project disruption and a lack of industry awards
31 December – the price of Brent Crude Oil climbed above US$50 based on vaccine-driven optimism for demand
Strateg
ic repo
rtG
overn
ance
Finan
cial statemen
ts
11Petrofac Limited | 2020 Annual report and accounts

Stakeholder engagement
Stakeholder engagement
We are focused on driving long-term sustainable performance for the benefit of all our stakeholders.
Stakeholder considerations are integral to all Board discussions and decisions. In compliance with the UK Code, we set out how the Board has engaged proactively with our key stakeholder groups during the year, to understand what matters to them and how this has informed decision-making and actions taken during 2020.
We also provide details of stakeholder engagement below Board level and how these requirements are considered in business decisions taken across the Group to ensure effective and continued engagement.
Further details on Board stakeholder engagement, can be found on page 92.
Shareholders Delivering an attractive return to our shareholders is a key priority for the Board. Their views are also considered during strategy discussions to enable the Board to provide information that will drive informed investment decisions.
EmployeesOur employees, their capabilities and skills set us apart from our competitors. We are committed to ensuring we have safe and effective working environments, which enable everyone within the business to perform to their true potential, in an inclusive environment with fair labour practices.
Communities We actively support local communities to address local issues responsibly, develop closer ties, and manage the social and environmental impacts of our business which we believe will bring long-term sustainability to the communities where we work.
Key interests Key interests Key interests
— Financial performance and returns — Application of the business model, implementation of our strategy and growth potential — Governance matters, including the effectiveness of the Board, succession and remuneration — Sustainability and ESG performance — The status of the ongoing investigation by the SFO
— Career and development opportunities — Diversity and inclusion matters — Implementation of the strategic agenda and the impact of digitalisation — Energy transition agenda and climate change matters — Compliance and whistleblowing matters
— Human Rights matters — Local employment opportunities — Investments in local supply chains — Supporting infrastructure improvement programmes — The impact of activities on the wider community — STEM education initiatives
How we engage at Board level and across the Company How we engage at Board level and across the Company How we engage at Board level and across the Company
— Regular meetings and roadshows held with key investors to discuss strategy, operational and financial performance — Management presentations provided to institutional investors and research analysts following publication of our results, which are streamed live via a webcast and are available on our website — The Chairman and the Remuneration Committee Chair engage with investors on matters relating to governance, succession and remuneration — Shareholders given the opportunity to ask questions at our AGM — Regular updates provided to the Board on investor sentiment
— Regular interaction with the management team during and after Board meetings, focusing on performance and strategy — Talent management and succession plan discussions — Direct engagement by the Board and senior management with employees during site visits — Direct engagement via the Employee Workforce Forum — Senior management attendance at townhalls held throughout the year — Annual employee surveys
— Ad hoc face-to-face meetings with local communities — A range of vocational development programmes with our local partners — Public consultations — Our ICV programmes are continually reviewed and extended to grow sustainable economies and create value for the Group as well as local communities
Actions taken during 2020 Actions taken during 2020 Actions taken during 2020
— Numerous calls were held with key shareholders and analysts, as well as broker sales teams, as the impact of the COVID-19 pandemic began to have an effect on the business — As a result of the macro-economic changes during the year, the Board reflected on the impacts on the Group and took decisive action to cut costs and conserve cash, which included the decision to cancel the final dividend — Through extensive shareholder engagement, it was clear that the majority of key shareholders were supportive that the Company was taking all measures possible to conserve cash and protect the balance sheet — The Board recognised the impact the appointment of our new Group Chief Executive would have on stakeholders, with engagement taking place with both internal and external stakeholders — The Board approved the launch of a new sustainability strategy, structured around our three ESG pillars — Meetings were held with our Remuneration Chair and Director of HR and the proxy advisory agencies to explain remuneration matters
— Directors and senior management attended three Workforce Forums to hear directly from employee representatives, with one meeting specifically arranged to review the impacts relating to the pandemic — Directors and senior management attended the launch of the Company’s revised Code of Conduct in early 2020, making themselves available to answer queries related to the Group’s compliance culture — Numerous meetings, consultations and townhalls were held throughout the year to discuss the implications on employees of the cost cutting measures introduced as a result of the pandemic, including pay cuts and redundancies — Worker welfare initiatives were reinforced, especially for employees required to stay on project sites for long periods — Townhalls were held to provide reassurance to employees following the announcement about the change of Group Chief Executive Engagement with local employees to ensure a successful transition to the new owner following the disposal of our Mexican assets — Issuance of our annual employee survey
— Continued enhancement throughout the year of initiatives to align our ICV priorities, with a Best Practice Award achieved in Oman — Engaged in a wide range of COVID-19 response initiatives, such as donating medical equipment and vacating accommodation facilities in order that they could be used as quarantine facilities. Further details are set out on page 49 — The Board approved the revision of the principal risks to incorporate the upholding of ethical standards (see page 67) — Several social programmes are in place focused on building capacity with the local supply chain, creating local jobs and supporting vocational training and apprenticeships and scholarship programmes. Further details are set out on pages 50 to 51 — The transfer of our pre-existing community engagement programmes in Mexico were closely managed following the sale of assets to the new owner
Petrofac Limited | 2020 Annual report and accounts12
Strategic report

Shareholders Delivering an attractive return to our shareholders is a key priority for the Board. Their views are also considered during strategy discussions to enable the Board to provide information that will drive informed investment decisions.
EmployeesOur employees, their capabilities and skills set us apart from our competitors. We are committed to ensuring we have safe and effective working environments, which enable everyone within the business to perform to their true potential, in an inclusive environment with fair labour practices.
Communities We actively support local communities to address local issues responsibly, develop closer ties, and manage the social and environmental impacts of our business which we believe will bring long-term sustainability to the communities where we work.
Key interests Key interests Key interests
— Financial performance and returns — Application of the business model, implementation of our strategy and growth potential — Governance matters, including the effectiveness of the Board, succession and remuneration — Sustainability and ESG performance — The status of the ongoing investigation by the SFO
— Career and development opportunities — Diversity and inclusion matters — Implementation of the strategic agenda and the impact of digitalisation — Energy transition agenda and climate change matters — Compliance and whistleblowing matters
— Human Rights matters — Local employment opportunities — Investments in local supply chains — Supporting infrastructure improvement programmes — The impact of activities on the wider community — STEM education initiatives
How we engage at Board level and across the Company How we engage at Board level and across the Company How we engage at Board level and across the Company
— Regular meetings and roadshows held with key investors to discuss strategy, operational and financial performance — Management presentations provided to institutional investors and research analysts following publication of our results, which are streamed live via a webcast and are available on our website — The Chairman and the Remuneration Committee Chair engage with investors on matters relating to governance, succession and remuneration — Shareholders given the opportunity to ask questions at our AGM — Regular updates provided to the Board on investor sentiment
— Regular interaction with the management team during and after Board meetings, focusing on performance and strategy — Talent management and succession plan discussions — Direct engagement by the Board and senior management with employees during site visits — Direct engagement via the Employee Workforce Forum — Senior management attendance at townhalls held throughout the year — Annual employee surveys
— Ad hoc face-to-face meetings with local communities — A range of vocational development programmes with our local partners — Public consultations — Our ICV programmes are continually reviewed and extended to grow sustainable economies and create value for the Group as well as local communities
Actions taken during 2020 Actions taken during 2020 Actions taken during 2020
— Numerous calls were held with key shareholders and analysts, as well as broker sales teams, as the impact of the COVID-19 pandemic began to have an effect on the business — As a result of the macro-economic changes during the year, the Board reflected on the impacts on the Group and took decisive action to cut costs and conserve cash, which included the decision to cancel the final dividend — Through extensive shareholder engagement, it was clear that the majority of key shareholders were supportive that the Company was taking all measures possible to conserve cash and protect the balance sheet — The Board recognised the impact the appointment of our new Group Chief Executive would have on stakeholders, with engagement taking place with both internal and external stakeholders — The Board approved the launch of a new sustainability strategy, structured around our three ESG pillars — Meetings were held with our Remuneration Chair and Director of HR and the proxy advisory agencies to explain remuneration matters
— Directors and senior management attended three Workforce Forums to hear directly from employee representatives, with one meeting specifically arranged to review the impacts relating to the pandemic — Directors and senior management attended the launch of the Company’s revised Code of Conduct in early 2020, making themselves available to answer queries related to the Group’s compliance culture — Numerous meetings, consultations and townhalls were held throughout the year to discuss the implications on employees of the cost cutting measures introduced as a result of the pandemic, including pay cuts and redundancies — Worker welfare initiatives were reinforced, especially for employees required to stay on project sites for long periods — Townhalls were held to provide reassurance to employees following the announcement about the change of Group Chief Executive Engagement with local employees to ensure a successful transition to the new owner following the disposal of our Mexican assets — Issuance of our annual employee survey
— Continued enhancement throughout the year of initiatives to align our ICV priorities, with a Best Practice Award achieved in Oman — Engaged in a wide range of COVID-19 response initiatives, such as donating medical equipment and vacating accommodation facilities in order that they could be used as quarantine facilities. Further details are set out on page 49 — The Board approved the revision of the principal risks to incorporate the upholding of ethical standards (see page 67) — Several social programmes are in place focused on building capacity with the local supply chain, creating local jobs and supporting vocational training and apprenticeships and scholarship programmes. Further details are set out on pages 50 to 51 — The transfer of our pre-existing community engagement programmes in Mexico were closely managed following the sale of assets to the new owner
Strateg
ic repo
rtG
overn
ance
Finan
cial statemen
ts
13Petrofac Limited | 2020 Annual report and accounts

Stakeholder engagement continued
ClientsTo understand our clients’ needs and concerns and communicate on various operating issues so that they are considered, while gaining relevant feedback and views, in the identification of growth opportunities.
SuppliersWherever the Company operates, we are committed to employing local people, working with local suppliers and developing local capabilities.
Governments, regulators and industry bodiesWe work with governments on a range of issues, as government policy and regulation can have implications for our business.
Key interests Key interests Key interests
— Operational delivery — Implementation of the strategic agenda — Ethical credentials — Consideration and development of an ESG strategy
— Implementation of the strategic agenda — Business model application — Ethical credentials
— Health and safety matters — Taxation — The UK’s exit from the European Union — Governance matters — The Energy Transition agenda — The UN Climate Change Conference (COP26)
How we engage at Board level and across the Company How we engage at Board level and across the Company How we engage at Board level and across the Company
— Ad hoc meetings with key clients, by Executive Directors and members of senior management — At industry events — Via our website — At trade shows and conferences — Online materiality review surveys
— Attendance at industry events, such as EIC Connect Oil, Gas & Beyond — Meetings held with our supply chain partners — Formal engagement with suppliers to align our ESG priorities — We work with our extended supply chain to uphold and advance human rights throughout our operations to ensure everyone who works with and for us are treated with respect, fairness and dignity
— Through the UK regulator Oil and Gas Authority (OGA) — Through our representation with trade bodies, such as Oil & Gas UK, the EIC, CBI and Renewable UK — Participation in round table and industry consultations on issues that are relevant to our business, e.g. Carbon capture, utilisation and storage (CCUS) business models — Responding to consultations on issues affecting the industry
Actions taken during 2020 Actions taken during 2020 Actions taken during 2020
— Close collaboration with clients was of paramount importance throughout the year to ensure operations and projects could continue uninterrupted, despite the enforced restrictions as a result of the COVID-19 pandemic — Greater deployment of new digital technologies enabled us to overcome many of the challenges presented by COVID-19 and conduct virtual site audits, perform equipment inspections and safely mobilise our people in offshore locations
— A new supplier portal was established as a key tool that will enable each supplier’s offering to be understood, allowing improved collaboration through the procurement cycle (see page 27) — As part of our new sustainability strategy, we committed to work with our supply chain to assist in setting their own emissions targets to support their lower-carbon ambitions — Performed annual assessment of our operations for human rights issues. This review is detailed in our annual Modern Slavery Statement. Further details are set out on page 52 — Petrofac remains a member of the UK Prompt Payment Code
— In the UK, we hosted a group of government and industry representatives in Aberdeen to showcase digital technologies that drive efficiency and emissions reduction — In Oman, we hosted UK Government representatives at our site at Duqm — A working group was established to review the implications of the UK’s transition from the European Union and to consider options to mitigate any potential risks — We are represented on the BEIS CCUS Expert Group and the CCUS Supply Chain Working Group in the UK — In 2020, we joined the North East Carbon Capture, Utilisation and Storage (NECCUS) Alliance, the UK/UAE Business Council and the Hydrogen Fuel Cell Association
Petrofac Limited | 2020 Annual report and accounts14
Strategic report

ClientsTo understand our clients’ needs and concerns and communicate on various operating issues so that they are considered, while gaining relevant feedback and views, in the identification of growth opportunities.
SuppliersWherever the Company operates, we are committed to employing local people, working with local suppliers and developing local capabilities.
Governments, regulators and industry bodiesWe work with governments on a range of issues, as government policy and regulation can have implications for our business.
Key interests Key interests Key interests
— Operational delivery — Implementation of the strategic agenda — Ethical credentials — Consideration and development of an ESG strategy
— Implementation of the strategic agenda — Business model application — Ethical credentials
— Health and safety matters — Taxation — The UK’s exit from the European Union — Governance matters — The Energy Transition agenda — The UN Climate Change Conference (COP26)
How we engage at Board level and across the Company How we engage at Board level and across the Company How we engage at Board level and across the Company
— Ad hoc meetings with key clients, by Executive Directors and members of senior management — At industry events — Via our website — At trade shows and conferences — Online materiality review surveys
— Attendance at industry events, such as EIC Connect Oil, Gas & Beyond — Meetings held with our supply chain partners — Formal engagement with suppliers to align our ESG priorities — We work with our extended supply chain to uphold and advance human rights throughout our operations to ensure everyone who works with and for us are treated with respect, fairness and dignity
— Through the UK regulator Oil and Gas Authority (OGA) — Through our representation with trade bodies, such as Oil & Gas UK, the EIC, CBI and Renewable UK — Participation in round table and industry consultations on issues that are relevant to our business, e.g. Carbon capture, utilisation and storage (CCUS) business models — Responding to consultations on issues affecting the industry
Actions taken during 2020 Actions taken during 2020 Actions taken during 2020
— Close collaboration with clients was of paramount importance throughout the year to ensure operations and projects could continue uninterrupted, despite the enforced restrictions as a result of the COVID-19 pandemic — Greater deployment of new digital technologies enabled us to overcome many of the challenges presented by COVID-19 and conduct virtual site audits, perform equipment inspections and safely mobilise our people in offshore locations
— A new supplier portal was established as a key tool that will enable each supplier’s offering to be understood, allowing improved collaboration through the procurement cycle (see page 27) — As part of our new sustainability strategy, we committed to work with our supply chain to assist in setting their own emissions targets to support their lower-carbon ambitions — Performed annual assessment of our operations for human rights issues. This review is detailed in our annual Modern Slavery Statement. Further details are set out on page 52 — Petrofac remains a member of the UK Prompt Payment Code
— In the UK, we hosted a group of government and industry representatives in Aberdeen to showcase digital technologies that drive efficiency and emissions reduction — In Oman, we hosted UK Government representatives at our site at Duqm — A working group was established to review the implications of the UK’s transition from the European Union and to consider options to mitigate any potential risks — We are represented on the BEIS CCUS Expert Group and the CCUS Supply Chain Working Group in the UK — In 2020, we joined the North East Carbon Capture, Utilisation and Storage (NECCUS) Alliance, the UK/UAE Business Council and the Hydrogen Fuel Cell Association
‘We believe that open and constructive engagement is central to how Petrofac does business to ensure the effective delivery of our strategy.’
Strateg
ic repo
rtG
overn
ance
Finan
cial statemen
ts
15Petrofac Limited | 2020 Annual report and accounts
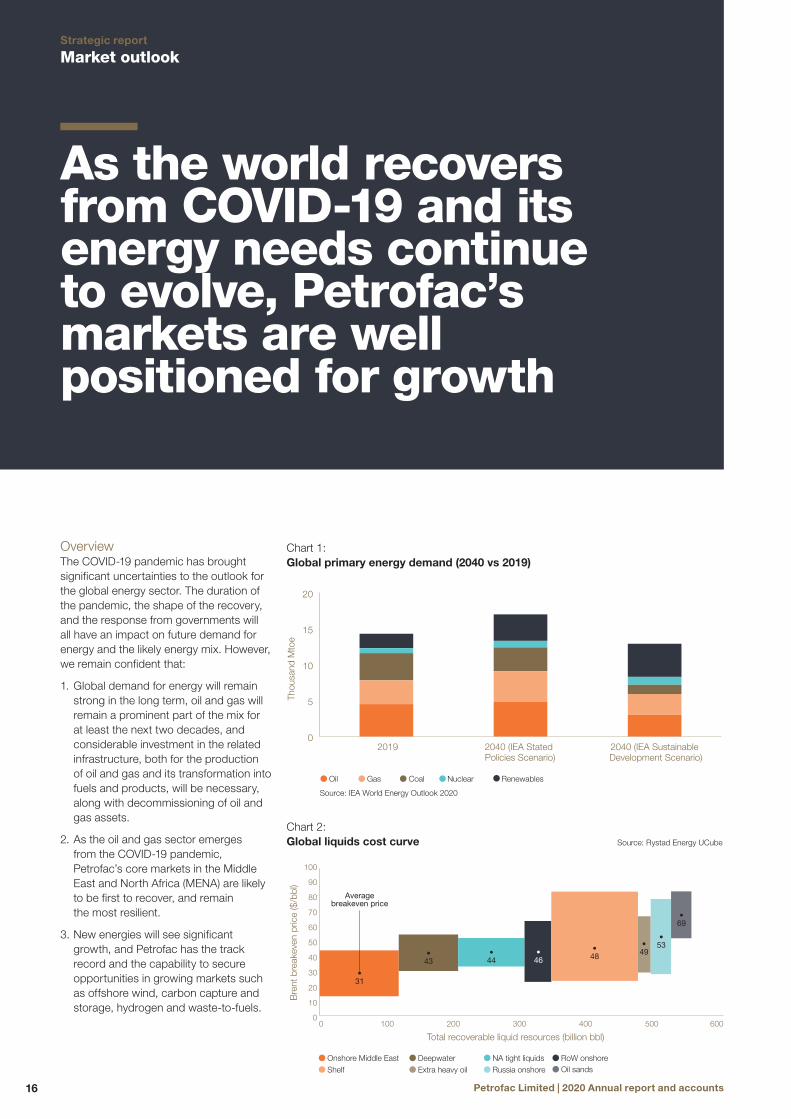
Chart 1: Global primary energy demand (2040 vs 2019)
0
5
10
15
20
Thou
sand
Mto
e
2019 2040 (IEA Stated Policies Scenario)
2040 (IEA Sustainable Development Scenario)
Oil Gas Coal Nuclear
Source: IEA World Energy Outlook 2020
Renewables
Chart 2: Global liquids cost curve
100 200 300 600400 500
Onshore Middle East Oil sands RoW onshore
Source: Rystad Energy UCube
Deepwater NA tight liquids Shelf Extra heavy oil Russia onshore
00
10
20
30
40
50
Bre
nt b
reak
even
pric
e ($
/bbl
)
Total recoverable liquid resources (billion bbl)
60
70
80
90
100
•31
Averagebreakeven price
•44
•46
•53•
49•48
•69
•43
Market outlook
As the world recovers from COVID-19 and its energy needs continue to evolve, Petrofac’s markets are well positioned for growth
OverviewThe COVID-19 pandemic has brought significant uncertainties to the outlook for the global energy sector. The duration of the pandemic, the shape of the recovery, and the response from governments will all have an impact on future demand for energy and the likely energy mix. However, we remain confident that:
1. Global demand for energy will remain strong in the long term, oil and gas will remain a prominent part of the mix for at least the next two decades, and considerable investment in the related infrastructure, both for the production of oil and gas and its transformation into fuels and products, will be necessary, along with decommissioning of oil and gas assets.
2. As the oil and gas sector emerges from the COVID-19 pandemic, Petrofac’s core markets in the Middle East and North Africa (MENA) are likely to be first to recover, and remain the most resilient.
3. New energies will see significant growth, and Petrofac has the track record and the capability to secure opportunities in growing markets such as offshore wind, carbon capture and storage, hydrogen and waste-to-fuels.
Petrofac Limited | 2020 Annual report and accounts16
Strategic report
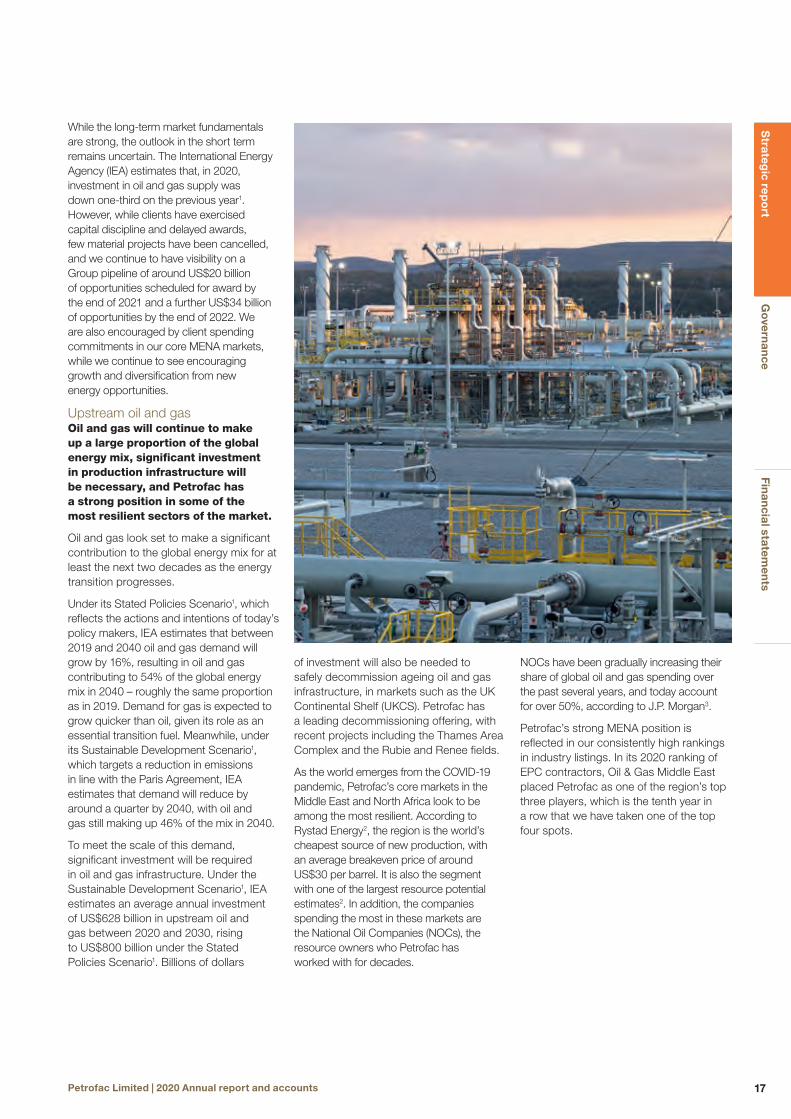
While the long-term market fundamentals are strong, the outlook in the short term remains uncertain. The International Energy Agency (IEA) estimates that, in 2020, investment in oil and gas supply was down one-third on the previous year1. However, while clients have exercised capital discipline and delayed awards, few material projects have been cancelled, and we continue to have visibility on a Group pipeline of around US$20 billion of opportunities scheduled for award by the end of 2021 and a further US$34 billion of opportunities by the end of 2022. We are also encouraged by client spending commitments in our core MENA markets, while we continue to see encouraging growth and diversification from new energy opportunities.
Upstream oil and gas Oil and gas will continue to make up a large proportion of the global energy mix, significant investment in production infrastructure will be necessary, and Petrofac has a strong position in some of the most resilient sectors of the market.
Oil and gas look set to make a significant contribution to the global energy mix for at least the next two decades as the energy transition progresses.
Under its Stated Policies Scenario1, which reflects the actions and intentions of today’s policy makers, IEA estimates that between 2019 and 2040 oil and gas demand will grow by 16%, resulting in oil and gas contributing to 54% of the global energy mix in 2040 – roughly the same proportion as in 2019. Demand for gas is expected to grow quicker than oil, given its role as an essential transition fuel. Meanwhile, under its Sustainable Development Scenario1, which targets a reduction in emissions in line with the Paris Agreement, IEA estimates that demand will reduce by around a quarter by 2040, with oil and gas still making up 46% of the mix in 2040.
To meet the scale of this demand, significant investment will be required in oil and gas infrastructure. Under the Sustainable Development Scenario1, IEA estimates an average annual investment of US$628 billion in upstream oil and gas between 2020 and 2030, rising to US$800 billion under the Stated Policies Scenario1. Billions of dollars
of investment will also be needed to safely decommission ageing oil and gas infrastructure, in markets such as the UK Continental Shelf (UKCS). Petrofac has a leading decommissioning offering, with recent projects including the Thames Area Complex and the Rubie and Renee fields.
As the world emerges from the COVID-19 pandemic, Petrofac’s core markets in the Middle East and North Africa look to be among the most resilient. According to Rystad Energy2, the region is the world’s cheapest source of new production, with an average breakeven price of around US$30 per barrel. It is also the segment with one of the largest resource potential estimates2. In addition, the companies spending the most in these markets are the National Oil Companies (NOCs), the resource owners who Petrofac has worked with for decades.
NOCs have been gradually increasing their share of global oil and gas spending over the past several years, and today account for over 50%, according to J.P. Morgan3.
Petrofac’s strong MENA position is reflected in our consistently high rankings in industry listings. In its 2020 ranking of EPC contractors, Oil & Gas Middle East placed Petrofac as one of the region’s top three players, which is the tenth year in a row that we have taken one of the top four spots.
Strateg
ic repo
rtG
overn
ance
Finan
cial statemen
ts
17Petrofac Limited | 2020 Annual report and accounts
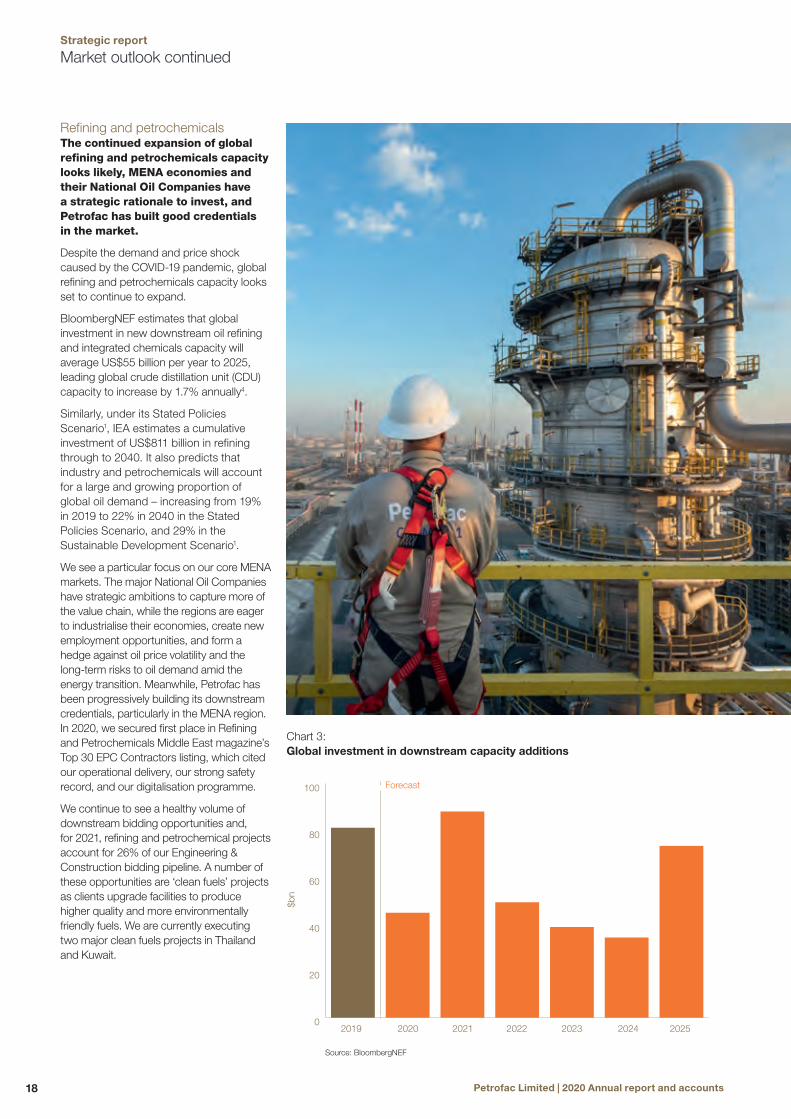
Chart 3: Global investment in downstream capacity additions
0
20
40
60
80
100
$bn
Forecast
2019 2021 20222020 2023 2024 2025
Source: BloombergNEF
Refining and petrochemicals The continued expansion of global refining and petrochemicals capacity looks likely, MENA economies and their National Oil Companies have a strategic rationale to invest, and Petrofac has built good credentials in the market.
Despite the demand and price shock caused by the COVID-19 pandemic, global refining and petrochemicals capacity looks set to continue to expand.
BloombergNEF estimates that global investment in new downstream oil refining and integrated chemicals capacity will average US$55 billion per year to 2025, leading global crude distillation unit (CDU) capacity to increase by 1.7% annually4.
Similarly, under its Stated Policies Scenario1, IEA estimates a cumulative investment of US$811 billion in refining through to 2040. It also predicts that industry and petrochemicals will account for a large and growing proportion of global oil demand – increasing from 19% in 2019 to 22% in 2040 in the Stated Policies Scenario, and 29% in the Sustainable Development Scenario1.
We see a particular focus on our core MENA markets. The major National Oil Companies have strategic ambitions to capture more of the value chain, while the regions are eager to industrialise their economies, create new employment opportunities, and form a hedge against oil price volatility and the long-term risks to oil demand amid the energy transition. Meanwhile, Petrofac has been progressively building its downstream credentials, particularly in the MENA region. In 2020, we secured first place in Refining and Petrochemicals Middle East magazine’s Top 30 EPC Contractors listing, which cited our operational delivery, our strong safety record, and our digitalisation programme.
We continue to see a healthy volume of downstream bidding opportunities and, for 2021, refining and petrochemical projects account for 26% of our Engineering & Construction bidding pipeline. A number of these opportunities are ‘clean fuels’ projects as clients upgrade facilities to produce higher quality and more environmentally friendly fuels. We are currently executing two major clean fuels projects in Thailand and Kuwait.
Market outlook continued
Petrofac Limited | 2020 Annual report and accounts18
Strategic report

0
100
200
300
400
500
600
700
$800m
2015 – 2019 2020 – 2030 2031 – 2040
Chart 4: Average annual global investment in renewables generation (2015-2040)
IEA Stated Policies IEA Sustainable Development Scenario Source: IEA World Energy Outlook 2020
New energies Increasing investment in new energies markets is forecast, Petrofac has the right skills and track record to capitalise on this growth, and such projects accounted for a significant proportion of new business in 2020.
While hydrocarbons will continue to satisfy a majority of energy demand over the next two decades, renewable energy sources are expected to grow rapidly. Under the IEA’s Stated Policies Scenario1, for example, demand for renewables will almost double to reach around 22% of total energy demand in 2040 (rising to 36% under the IEA’s Sustainable Development Scenario1).
Meanwhile, for 2021, IHS Markit expects global capex spending in renewables to return to its pre-pandemic level of US$255 billion. It expects that global offshore wind investment will accelerate swiftly during the 2021-2025 period, with a cumulative investment of US$170 billion – a nearly threefold increase from cumulative 2015-2019 levels5.
By leveraging the expertise we have developed over several decades through the design and execution of complex oil and gas projects, we are continuing to develop our track record in major new energies markets:
— Offshore wind – track record of over ten years, specialising to date in the EPC execution of HVDC and HVAC offshore and onshore substations; 13 projects completed to date and currently executing the Alpha and Beta HVAC platforms for the Netherlands HKZ offshore grid connection and the HVAC substations for the UK’s Seagreen project
— Carbon capture, utilisation & storage (CCUS) – leveraging our expertise in gas processing, transport and storage, and our brownfield EPC and well plug and abandonment capability, to support large scale CCUS projects, such as the UK’s Acorn project
— Hydrogen – leveraging our hydrocarbons expertise, as well as our wind, solar and CCUS know-how, to support large scale blue and green hydrogen projects, such as Australia’s Arrowsmith project
— Waste to fuels – using our petrochemical design skills to support projects which transform waste feedstocks into valuable products, such as Greenergy’s plant in the UK
In 2020, new energies projects accounted for around 22% of our order intake. 8% of our E&C bidding pipeline for 2021 is comprised of new energies opportunities.
1 International Energy Agency, World Energy Outlook 20202 Rystad Energy, Oil production costs reach new lows,
October 20203 J.P. Morgan equity research, January 20214 BloombergNEF, Downstream Oil Investment Shrugs Off
COVID-19, September 20205 IHS Markit: Global Investment in Renewables to
Bounce Back in Coming Year to Pre-COVID Levels, December 2020
Strateg
ic repo
rtG
overn
ance
Finan
cial statemen
ts
19Petrofac Limited | 2020 Annual report and accounts
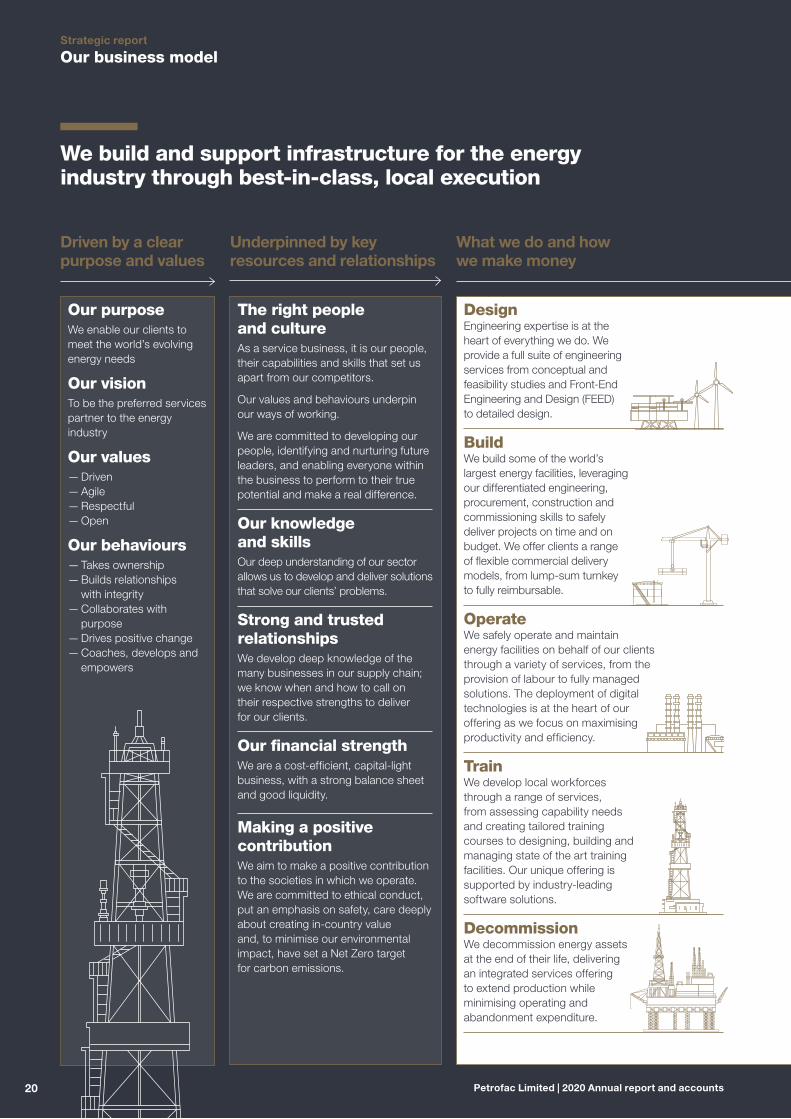
Our business model
Our purpose We enable our clients to meet the world’s evolving energy needs
Our vision To be the preferred services partner to the energy industry
Our values — Driven — Agile — Respectful — Open
Our behaviours — Takes ownership — Builds relationships with integrity — Collaborates with purpose — Drives positive change — Coaches, develops and empowers
The right people and cultureAs a service business, it is our people, their capabilities and skills that set us apart from our competitors.
Our values and behaviours underpin our ways of working.
We are committed to developing our people, identifying and nurturing future leaders, and enabling everyone within the business to perform to their true potential and make a real difference.
Our knowledge and skillsOur deep understanding of our sector allows us to develop and deliver solutions that solve our clients’ problems.
Strong and trusted relationshipsWe develop deep knowledge of the many businesses in our supply chain; we know when and how to call on their respective strengths to deliver for our clients.
Our financial strengthWe are a cost-efficient, capital-light business, with a strong balance sheet and good liquidity.
Making a positive contributionWe aim to make a positive contribution to the societies in which we operate. We are committed to ethical conduct, put an emphasis on safety, care deeply about creating in-country value and, to minimise our environmental impact, have set a Net Zero target for carbon emissions.
DesignEngineering expertise is at the heart of everything we do. We provide a full suite of engineering services from conceptual and feasibility studies and Front-End Engineering and Design (FEED) to detailed design.
BuildWe build some of the world’s largest energy facilities, leveraging our differentiated engineering, procurement, construction and commissioning skills to safely deliver projects on time and on budget. We offer clients a range of flexible commercial delivery models, from lump-sum turnkey to fully reimbursable.
OperateWe safely operate and maintain energy facilities on behalf of our clients through a variety of services, from the provision of labour to fully managed solutions. The deployment of digital technologies is at the heart of our offering as we focus on maximising productivity and efficiency.
TrainWe develop local workforces through a range of services, from assessing capability needs and creating tailored training courses to designing, building and managing state of the art training facilities. Our unique offering is supported by industry-leading software solutions.
DecommissionWe decommission energy assets at the end of their life, delivering an integrated services offering to extend production while minimising operating and abandonment expenditure.
We build and support infrastructure for the energy industry through best-in-class, local execution
Driven by a clear purpose and values
Underpinned by key resources and relationships
What we do and how we make money
Petrofac Limited | 2020 Annual report and accounts20
Strategic report
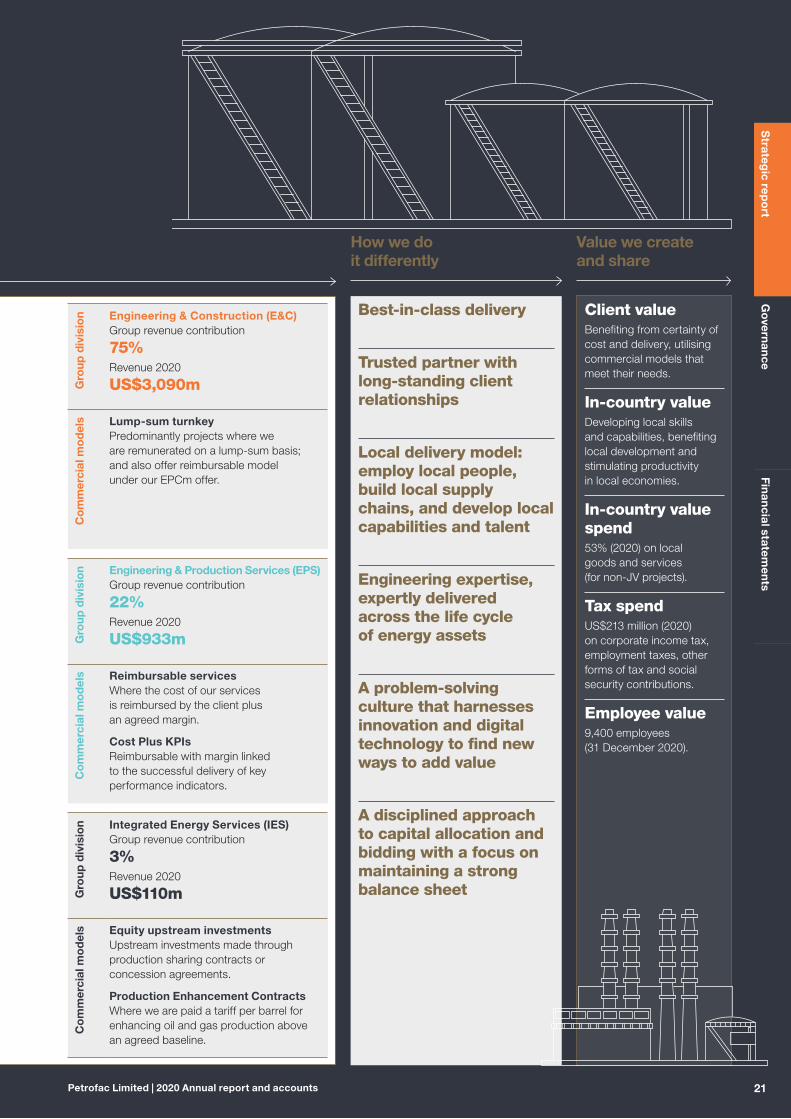
Client valueBenefiting from certainty of cost and delivery, utilising commercial models that meet their needs.
In-country valueDeveloping local skills and capabilities, benefiting local development and stimulating productivity in local economies.
In-country value spend53% (2020) on local goods and services (for non-JV projects).
Tax spendUS$213 million (2020) on corporate income tax, employment taxes, other forms of tax and social security contributions.
Employee value9,400 employees (31 December 2020).
How we do it differently
Value we create and share
Gro
up d
ivis
ion Engineering & Construction (E&C)
Group revenue contribution
75%Revenue 2020
US$3,090m
Co
mm
erci
al m
od
els Lump-sum turnkey
Predominantly projects where we are remunerated on a lump-sum basis; and also offer reimbursable model under our EPCm offer.
Gro
up d
ivis
ion Engineering & Production Services (EPS)
Group revenue contribution
22%Revenue 2020
US$933m
Co
mm
erci
al m
od
els Reimbursable services
Where the cost of our services is reimbursed by the client plus an agreed margin.
Cost Plus KPIsReimbursable with margin linked to the successful delivery of key performance indicators.
Gro
up d
ivis
ion Integrated Energy Services (IES)
Group revenue contribution
3%Revenue 2020
US$110m
Co
mm
erci
al m
od
els Equity upstream investments
Upstream investments made through production sharing contracts or concession agreements.
Production Enhancement ContractsWhere we are paid a tariff per barrel for enhancing oil and gas production above an agreed baseline.
Best-in-class delivery
Trusted partner with long-standing client relationships
Local delivery model: employ local people, build local supply chains, and develop local capabilities and talent
Engineering expertise, expertly delivered across the life cycle of energy assets
A problem-solving culture that harnesses innovation and digital technology to find new ways to add value
A disciplined approach to capital allocation and bidding with a focus on maintaining a strong balance sheet
Strateg
ic repo
rtG
overn
ance
Finan
cial statemen
ts
21Petrofac Limited | 2020 Annual report and accounts

Our strategy at a glance
Enabling our clients to meet the world’s evolving energy needs
Going forward, the strategy will be underpinned by a new operating model and structure.Implemented in the first half of 2021, this will entail a single Group-wide technical services organisation, which delivers functional excellence to all Petrofac projects and operations globally. It will be supplemented by a standalone, self-governing assurance function.
The new structure will enable: —Consistency of delivery to a single, global Petrofac standard, ensuring quality and efficiency, and enabling our subject matter expertise and digitalisation initiatives to be applied globally
We design, build, manage and maintain infrastructure for energy industries. Our diverse service offering covers every stage of the project life cycle and offers a variety of commercial models, giving our clients the flexibility they need.
While the COVID-19 pandemic brought significant disruption to the global energy sector, the longer-term fundamentals of our business are sound, and our strategy remains valid – enabling Petrofac to build on its established strengths, enhance competitiveness, maintain resilience and, through our newly-created new energies business, pursue the opportunities presented by the energy transition.
Best-in-class delivery — Simplify the organisation — Global capability, local execution — Digitally enabled — Strategic partnerships/technology neutral
Our record for safety, agility and efficiency is the bedrock of our delivery capability. It allows us to progressively increase our performance and deliver more value to clients, while also applying consistent global standards. This approach extends well beyond our operational performance, encompassing considerations like safety, environment, people, and social and corporate governance.
Our model of local execution to global standards sets us apart. It is central to the way Petrofac operates and goes beyond our contractual or regulatory requirements. For us, in-country value means we work more cost-effectively and sustainably. It allows us to create local supply chains that allow SMEs to flourish, upskill and train local workforces, and implement community programmes that leave a positive and lasting impact beyond the assets we build and operate.
We invest both in digital and in our technical expertise to maximise productivity and provide optimal solutions to our clients. Being technology neutral ensures we can support clients in specifying the best solution for their particular needs, without being tied to any particular solutions. To this end, we have exceptional subject matter experts, and support a full range of technologies within our Engineering Centres of Excellence. We combine this knowledge with our experience of technology application in plants and operations to inform the bespoke solutions we can offer clients.
Priorities for 2021 — Implement a new operating model and structure with the creation of a single, Group-wide technical services function and, sitting within it, a standalone, self-governing independent assurance capability — Improve our cost-competitiveness and develop an optimal cost structure — Continue to digitalise the business with a focus on procurement, engineering and additional back office activities — Further build our subject matter expertise in new domains and markets with a focus on new energies — Maximise in-country value through investment in new local leadership with a mandate to build a Petrofac business ecosystem in each of our core markets
Petrofac Limited | 2020 Annual report and accounts22
Strategic reportStrategic report

— Leveraging our global expertise to ensure best practice and consistency of execution everywhere we operate, and drive optimum value for customers and the communities in which we work
— Effective management of technical and operational risks, through consistent and rigorous peer reviews, and a value assurance framework that provides independent challenge of all project and operational challenges
— Optimal resource sharing, so the true breadth of our technical expertise is always on-tap and deployable, increasing our ability to win new contracts and deliver complex projects
— Maximum efficiency of all our shared services, including value engineering centres, so the Group is able to benefit from the best economies of scale and scope
— Clear functional stewardship, with robust checks and balances and single points of accountability, bringing one Petrofac standard of excellence
— An independent value assurance framework that provides challenge, rigour and stage-gate verification
We are confident that our strategy, underpinned by an operating model that drives consistency, efficiency and stringent assurance, will position us well to capitalise on a range of diverse growth opportunities that will deliver superior returns and value to all stakeholders over the medium term.
Return to growth — Customer centric approach — Rebuild backlog — Selective growth in new geographies — Leverage capabilities in new energies
The near-term economic outlook remains unclear, and market uncertainty remains. Clients are delaying awards and adopting tough commercial positions.
We expect late 2021 to mark the start of a recovery period for the industry, with a return to pre-2020 capex spend levels by 2023. As the oil and gas sector emerges from the COVID-19 pandemic, MENA markets are expected to be first to recover. In this environment, and with the UAE market curtailed in the short term, our clear priorities are to seek to capitalise on this recovery in our core accessible markets, whilst also targeting growth in selective new geographies, and accelerating our transition to new energies. Throughout the pandemic, our EPS business remained resilient, and has a healthy pipeline ahead.
Meanwhile, we continue to extend our downstream credentials with good progress on several refinery projects, and we are poised to benefit from forthcoming investments in petrochemical facilities.
Going forward, new energies will inevitably see significant growth, and drawing on Petrofac’s track record, capabilities, and subject matter expertise, we have identified an addressable market of US$20 billion by 2025. This includes established markets like offshore wind, and emerging markets such as carbon capture and storage, hydrogen production, and waste to fuel.
Priorities for 2021 — Rebuild the order backlog from a diverse pipeline of opportunities in available core markets and target growth in selective new markets — Accelerating our transition to new energies — Continue to leverage our capabilities in new energies by targeting FEED and early concept design opportunities with the creation of a specific Small Projects organisation within our E&C division — Pursue further opportunities in refining and expand into petrochemicals — Focus on integration of our life-of-asset service offerings to create pull-through, for example, from FEED to brownfield modifications, emissions reductions, operations, to full EPC and decommissioning
Superior returns — Enhanced risk management framework — Deliver premium margins, consistently — Capital light business model — Maintain strong balance sheet
Petrofac has a strong reputation for operating with financial efficiency and earning differentiated margins. Nonetheless, in 2020, we recognised losses related to a small number of projects, which had a material impact on our financial performance. By achieving our best-in-class delivery priorities, together with returning to growth, we expect to return to delivering premium margins, consistently. This strategic priority is also supported by the introduction of a new risk management framework.
Over recent years, we have been successful in reducing capital intensity by divesting non-core assets, and this helped us withstand the shocks of the COVID-19 pandemic.
For 2021 we will continue to deliver reductions in overheads and project support costs, while also bringing increased rigour to cash management.
Priorities for 2021 — Deliver more than US$100 million in additional cost savings, taking the total to US$250 million relative to pre-pandemic levels — Continue to conserve cash and maintain financial discipline — Embed the One Petrofac operating model with enhanced risk management processes to ensure consistent delivery and differentiated margins — Deliver on our ESG targets through emissions reduction, greater diversity and inclusivity of gender and nationality, and maintaining the highest standards of business ethics
Strateg
ic repo
rtG
overn
ance
Finan
cial statemen
ts
23Petrofac Limited | 2020 Annual report and accounts
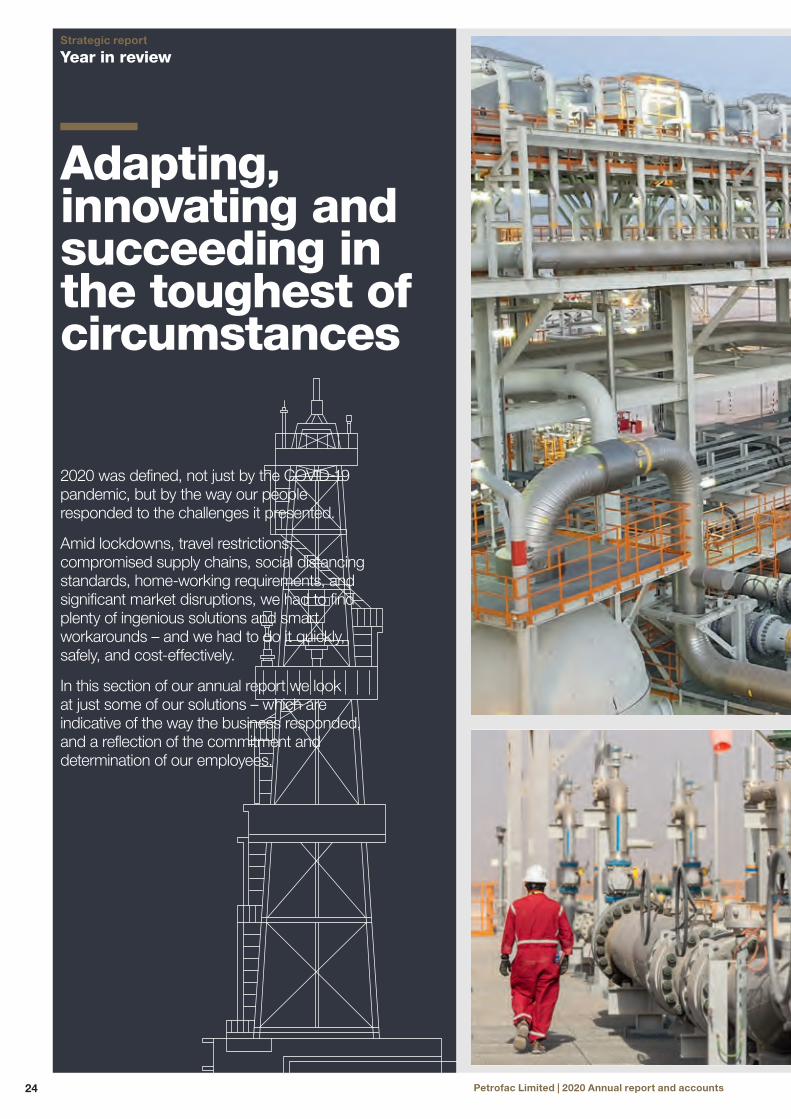
Year in review
Adapting, innovating and succeeding in the toughest of circumstances
2020 was defined, not just by the COVID-19 pandemic, but by the way our people responded to the challenges it presented.
Amid lockdowns, travel restrictions, compromised supply chains, social distancing standards, home-working requirements, and significant market disruptions, we had to find plenty of ingenious solutions and smart workarounds – and we had to do it quickly, safely, and cost-effectively.
In this section of our annual report we look at just some of our solutions – which are indicative of the way the business responded, and a reflection of the commitment and determination of our employees.
Petrofac Limited | 2020 Annual report and accounts24
Strategic report
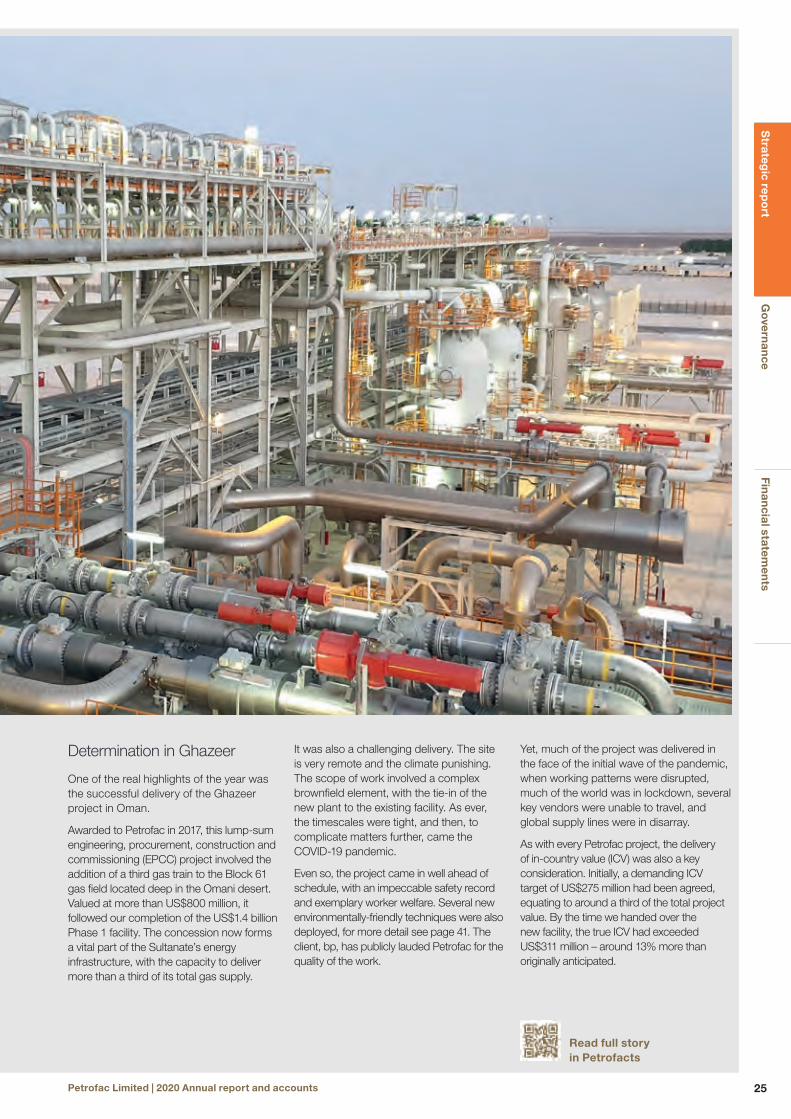
Determination in Ghazeer
One of the real highlights of the year was the successful delivery of the Ghazeer project in Oman.
Awarded to Petrofac in 2017, this lump-sum engineering, procurement, construction and commissioning (EPCC) project involved the addition of a third gas train to the Block 61 gas field located deep in the Omani desert. Valued at more than US$800 million, it followed our completion of the US$1.4 billion Phase 1 facility. The concession now forms a vital part of the Sultanate’s energy infrastructure, with the capacity to deliver more than a third of its total gas supply.
It was also a challenging delivery. The site is very remote and the climate punishing. The scope of work involved a complex brownfield element, with the tie-in of the new plant to the existing facility. As ever, the timescales were tight, and then, to complicate matters further, came the COVID-19 pandemic.
Even so, the project came in well ahead of schedule, with an impeccable safety record and exemplary worker welfare. Several new environmentally-friendly techniques were also deployed, for more detail see page 41. The client, bp, has publicly lauded Petrofac for the quality of the work.
Yet, much of the project was delivered in the face of the initial wave of the pandemic, when working patterns were disrupted, much of the world was in lockdown, several key vendors were unable to travel, and global supply lines were in disarray.
As with every Petrofac project, the delivery of in-country value (ICV) was also a key consideration. Initially, a demanding ICV target of US$275 million had been agreed, equating to around a third of the total project value. By the time we handed over the new facility, the true ICV had exceeded US$311 million – around 13% more than originally anticipated.
Read full storyin Petrofacts
Strateg
ic repo
rtG
overn
ance
Finan
cial statemen
ts
25Petrofac Limited | 2020 Annual report and accounts

Year in review continued
Transferring enterprise applications to working from home
The sudden onset of the pandemic meant our digital and IT teams had to come up with a new way of working for our engineers – fast.
Across the world, thousands of Petrofac people had to decamp from their offices and work from home, sometimes with only a few hours’ notice. However, for our engineers, home working was not as simple as grabbing their laptops. They require sophisticated software for 3D modelling, which is typically held on
powerful desktop computers and connects to nearby data servers.
Petrofac’s digital and IT teams had already started evaluating a more flexible cloud-based engineering hub that would encompass 3D modelling software. In the face of COVID-19, they successfully – and securely – implemented this new way of working in a matter of days to avoid delays to projects that were in the critical engineering phase.
‘ The sudden onset of the pandemic meant our digital and IT teams had to come up with a new way of working for our engineers – fast.’
Read full storyin Petrofacts
Petrofac Limited | 2020 Annual report and accounts26
Strategic report

Driven to deliver at Duqm
With stakeholders from around the world unable to travel, conducting a crucial test for the Duqm Refinery project in Oman seemed like a tall order. The perseverance of our people paid off.
Working with multiple vendors based in Bahrain, Germany, India, Malaysia, South Korea, Spain, and the UAE, the instrumentation team came up with an ingenious way of conducting a remote integration test – a critical task in the delivery of the refinery’s sophisticated Continuous Emission Monitoring Systems (CEMS), which will enable the facility to operate to tough new environmental standards.
In normal circumstances, the operation would have involved the mobilisation and coordination of many different people and technologies from across the world. Drawing on a combination of secure high-speed data links, a range of remote collaboration tools, and a spirit of collective determination, the test was successfully delivered, and the project kept on track.
This way of remote testing should also enable future benefits. For example, it was a useful way of training young engineers and, by avoiding the need for so much travel, costs could be optimised. The same approach is therefore likely to be recommended to clients in the future, as it is a great way to bring everyone together using the same technology platform.
Read full storyin Petrofacts
‘ Working with multiple vendors, the Oman-based instrumentation team came up with an ingenious way of conducting a remote integration test.’
Strengthening the supply chain
Italy, South Korea, China and India are Petrofac’s biggest sources of manufactured material. They are also some of the countries that were hardest hit by the COVID-19 pandemic, particularly in its early stages.
So, when lockdown restrictions began putting a strain on the supply chain, the relationships our teams had built with key suppliers paid off. Another factor that made a big difference was our technology.
In particular, our new supplier portal is a key tool that enables us to understand each supplier’s offering, and collaborate with them through the procurement cycle. This uses a digital assistant, called BuyBot, which is trained to collaborate with suppliers during the tendering process and keep them apprised of progress. It brings far greater efficiency and transparency – both to Petrofac and our suppliers – which helped ease the pressure throughout 2020.
Read full storyin Petrofacts
Strateg
ic repo
rtG
overn
ance
Finan
cial statemen
ts
27Petrofac Limited | 2020 Annual report and accounts

Keeping everything on track in Kuwait
The Lower Fars Heavy Oil Development is one of the biggest upstream projects in the Middle East.
Awarded in 2015 by Kuwait Oil Company (KOC), Petrofac is leading a consortium, and our share of the project is valued at more than US$3 billion.
The scope of work on the seven square kilometre site covers greenfield and brownfield facilities and includes engineering, procurement, construction, pre-commissioning, commissioning, start-up, and operations and maintenance work for the main central processing facility and associated infrastructure. The project also includes a production support complex, and a 162 kilometre pipeline to connect the facility to a tank farm in Ahmadi on the Kuwaiti coast, ready for export.
Lower Fars is the first project of its kind in Kuwait, enabling the country to tap into the vast quantities of heavy oil in the Ratqa field. Extracting this heavy oil can be more complex than lighter crude because of its viscosity. However, the potential is huge.
A bank of towering steam generators is one of the most striking features of Lower Fars. Made from carbon steel they generate the vast quantities of steam needed to inject into the wells and lower the viscosity of the oil.
Petrofac also upgraded the technology and equipment in the south’s Crude Oil Control Centre. This centre controls the blends of heavy oil from the Ratqa field in the north with lighter crudes from the south using a blending package.
Read full storyin Petrofacts
Year in review continued
Petrofac Limited | 2020 Annual report and accounts28
Strategic report

Strateg
ic repo
rtG
overn
ance
Finan
cial statemen
ts
29Petrofac Limited | 2020 Annual report and accounts

Year in review continued
Using mobile to mobilise our teams
Amid the pandemic, we needed to provide extra support to our offshore teams in the UK North Sea – to keep them and their families informed and help them get safely to and from their worksites.
So, to help with the mobilisation of our offsite teams, we fast-tracked the development of PetrofacGo, a new mobile app. Inspired by the popularity of smartphone taxi apps, it enables our people to easily access all the details for their current and upcoming trips, including the latest COVID advice, travel information and check-in times. Push notifications can be sent to specific people to notify them of any change, ensuring they always have instant access to the right information.
PetrofacGo has helped our Delivery Hub team to arrange over 14,000 offshore trips during a particularly challenging period.
Digitalising maintenance and inspection operations
In December 2020, Petrofac’s work to digitalise its operations and maintenance delivery was recognised with a prestigious award from Oil & Gas (OGUK), the leading representative body for the offshore energy industry in the UK.
The judges were impressed by the benefits driven by our Connected Working approach. Combining use of digital twin and mobile technologies, along with our proprietary software, BuildME(TM), we have digitalised our inspection processes. Proven across more than 4,000 North Sea inspections, the approach is driving a 200% improvement in productivity.
Increasing the efficiency of our operations is an important strategic and environmental imperative – which becomes all the more valuable in the face of the COVID-19 pandemic.
Read full storyin Petrofacts
Petrofac Limited | 2020 Annual report and accounts30
Strategic report

Find all the latest stories about Petrofac at www.petrofac.com/petrofacts/
Extending our work in new energies and decarbonisation
As the global energy transition gathers pace, it is clear that our core expertise and capabilities can play an important role in helping clients to meet the world’s evolving energy needs.
We therefore see the energy transition as a strategic opportunity, partly to help existing clients to pursue their decarbonisation ambitions, and partly to pursue new energy projects. In 2020, we made significant progress.
Notable new business wins include the Arrowsmith project, which is Australia’s largest commercial scale green hydrogen project; the Acorn project, an innovative UK-based carbon capture and storage initiative; and one of the largest windfarms in the North Sea for Seagreen Wind Energy.
Meanwhile, for our more traditional energy clients, decarbonisation has become a dominant theme. In the design and engineering phase, for example, we are routinely challenged to come up with concepts that will minimse the carbon intensity of a plant’s future operations; in the construction phase, our sites are looking very different with, banks of generators being replaced with
renewable power, flaring being replaced by green completions, novel ways to re-use and recycle materials, and so on. On our operations and maintenance contracts, almost all of what we do is about helping our clients find new efficiencies, which also support a reduction in emissions and drive broader environmental benefits.
Strateg
ic repo
rtG
overn
ance
Finan
cial statemen
ts
31Petrofac Limited | 2020 Annual report and accounts

Revenue
-26%
Diluted earnings per share (EPS)1
-82%
Free cash flow and cash conversion
Return on capital employed (ROCE)1
7.0%
18 US$5,829m
19 US$5,530m
20 US$4,081m
18 26.2%
19 23.3%
20 7%
18 102.3¢/s
19 80.4¢/s
20 14.2c/s
18 US$921m
19 US$138m
20 US$(73)m
18 101%
19 71%
20 36%
Free cash flow
Cash conversion
Key performance indicators
Measuring our progress
Petrofac sets key performance (KPI) targets and assesses performance against these benchmarks on a regular basis.
Part of the 2020 Executive Directors’ Remuneration
DescriptionMeasures the level of revenue of the business.
MeasurementRevenue for the year as reported in the consolidated income statement.
DescriptionEPS provides a measure of net profitability of the Group taking into account changes in the capital structure, for example, the issuance of additional share capital.
MeasurementBusiness performance EPS attributable to Petrofac Limited shareholders, as reported in the consolidated income statement and calculated in accordance with note 9 to the consolidated financial statements.
DescriptionThese KPIs measure both the absolute amount of cash generated from operations and the conversion of EBITDA to cash.
MeasurementFree cash flow, as per appendix A6 to the consolidated financial statements. Cash conversion is calculated as cash generated from operations divided by business performance EBITDA.
DescriptionROCE is a measure of the efficiency with which the Group is generating operating profits from its capital.
MeasurementReturn on capital employed (ROCE) is calculated as EBITA (earnings before interest, tax and amortisation, calculated as EBITDA less depreciation) divided by average capital employed (see A8 in Appendix A to the consolidated financial statements).
1 Business performance before separately disclosed items. This measurement is shown by Petrofac as a means of measuring underlying business performance.
Petrofac Limited | 2020 Annual report and accounts32
Strategic report

EBITDA1
-62%
Employee numbers
-18%
Reported net profit
>-100%Business performance net profit1
-83%
Lost time injury and recordable injury frequency rates per 200,000 man-hours
Backlog
-32%
US$211m
18 US$671m
19 US$559m
20
US$64m
US$73m
18
19
20 US$(180)m
18 US$353m
19 US$276m
20 US$48m
18 US$9.6bn
19 US$7.4bn
20 US$5.0bn
18 11,500
19 11,500
20 9,400
18 0.018
19 0.013
20 0.013
18 0.06
19 0.06
20 0.065
Lost time injury
Recordable injury frequency rates
DescriptionEBITDA means earnings before interest, tax, depreciation and amortisation and provides a measure of the operating profitability of the business.
MeasurementEarnings before interest, tax, depreciation and amortisation (EBITDA) is calculated as operating profit/(loss), including the share of profit from associates and joint ventures, adjusted to add back charges for depreciation and amortisation (see A3 in Appendix A to the consolidated financial statements).
DescriptionProvides an indication of the Group’s service capacity.
MeasurementFor the purposes of the Annual Report, employee numbers include contract staff and the Group’s share of joint venture employees.
DescriptionMeasures the reported net profitability of the business.
MeasurementReported net profit/(loss) attributable to Petrofac Limited shareholders as per the consolidated income statement.
DescriptionProvides a measure of the net profitability of the business.
MeasurementBusiness performance net profit attributable to Petrofac Limited shareholders, as reported in the consolidated income statement.
DescriptionProvides measures of the safety performance of the Group, including partners and subcontractors.
MeasurementLost time injury (LTI) and recordable injury (RI) frequency rates are measured on the basis of reported LTI and RI statistics for all Petrofac companies, subcontractors and partners, expressed as a frequency rate per 200,000 man-hours. We aim continually to improve our safety record, but our target for these measures is zero.
DescriptionProvides a measure of the visibility of future revenues.
MeasurementBacklog consists of: the estimated revenue attributable to the uncompleted portion of Engineering & Construction operating segment contracts; and, with regard to Engineering & Production Services, the estimated revenue attributable to the lesser of the remaining term of the contract and five years. The Group uses this key performance indicator as a measure of the visibility of future revenue.
Strateg
ic repo
rtG
overn
ance
Finan
cial statemen
ts
33Petrofac Limited | 2020 Annual report and accounts

Never before have we had such an awareness of the importance of sustainability. We now have a duty of care to do all we can to put this awareness into action.
Sami IskanderGroup Chief Executive
Sources of strength for PetrofacI arrived at Petrofac with the conviction that Environmental, Social and Governance (ESG) considerations are indivisible from what a company is and does. I see them, not as boxes to be ticked nor risks to be managed, but as sources of strength.
One of the many things that attracted me to Petrofac was, therefore, the progress it has been making on ESG initiatives.
In 2020, for example, the Company launched its new sustainability strategy, including an unequivocal Net Zero carbon goal, a determination to increase diversity, and a continued commitment to meet the highest standards of ethical behaviour. The recent developments add to a good past performance in many ESG matters, a strong ESG governance structure, plus a clear recognition that, by enabling clients to meet the world’s evolving energy needs, the coming energy transition represents a tangible commercial opportunity.
All of this is a great basis to build upon, and this report should give insights into the specifics of our ESG performance.
It should also demonstrate the rigour of our approach, including the way we have identified and prioritised our material issues, the targets we have set, and the way we have aligned our approach to wider initiatives, such as the UN Global Compact, the UN Sustainable Development Goals, and the Task Force on Climate-Related Disclosures (TFCD).
I would, however, like to pull out three points which are indicative of my own ESG priorities:
1. Our emphasis on health, safety and wellbeing
Generally, Petrofac has a strong health and safety culture, and performs well ahead of industry norms. In 2020, however, and influenced partly by COVID, we did see a deterioration in our safety record, including two tragic fatalities. Going forward, I want Petrofac to be among the safest places to work, for us to remain better attuned to the wellbeing of our colleagues, and for everyone on our sites to feel valued and cared for.
2. Our commitment to the highest standards of ethical behaviour
In recent years, to reinforce our continued commitment to ethical behaviour, we enhanced our compliance function, launched a revised Code of Conduct, and made it easier for colleagues and partners to voice any concerns. This work will continue. Irrespective of geography or circumstance, we will always insist on a single standard of Petrofac behaviours.
3. Our environmental positioning and performance
One of our 2020 ESG highlights was our Net Zero carbon commitment. During 2021, we expect to provide more granularity on how that will be achieved. We also intend to give more details on our competitive positioning for the energy transition – including the opportunity to work on more green energy projects, and broadening the work we are doing to help our clients reduce the carbon intensity of their existing operations.
I should stress that, although these three points are important, they exist within the context of a broader ESG agenda, which encapsulates our approach to how we do business.
Sami IskanderGroup Chief Executive
Environmental, Social and Governance
Petrofac Limited | 2020 Annual report and accounts34
Strategic report

Incorporated into sustainability plan
Imp
ort
an
ce
to e
xte
rna
l sta
keh
old
ers
Hig
h m
ater
ialit
yM
ater
ial
Som
ewha
t mat
eria
l
Somewhat material Material High materialityImportance to Petrofac
1
23
67
89
10
11
12
1314
45
Understanding what matters most to our stakeholdersTo fully understand what matters most to them, we formally engage with representatives from various stakeholder groups, including clients, suppliers, investors, NGOs, policymakers, employees, and our supply chain. We align our Environment, Social and Governance (ESG) priorities to the material issues identified.
In 2020, we continued the process with a mix of online surveys and one-to-one discussions. We also consulted employees from across the business to better understand their priorities and engage them as advocates of our sustainability programmes – and we will keep on engaging and listening as we go forward.
Defining our material issues
‘ Cultivating a sustainable mindset is critical to advancing in the energy transition.’
Alastair CochranChief Financial Officer and Chair of the Sustainability Steering Committee
The ESG issues that matter most to our stakeholders
1. Define internal & external stakeholders
Broad selection taken from key stakeholder groups and geographies.
2. Stakeholder information gathered
Via survey questionnaires, stakeholder roadshows, and various engagement events.
3. Follow-up engagement sessions
One-to-one sessions with key stakeholders to ‘deep dive’ on specific topics and emerging issues.
4. Materiality reviews
Collate and evaluate data, review accompanying commentary and rank issues.
5. Finalise materiality matrix
Material issues presented to Sustainability Steering Committee to inform strategy and disclosure.
Material issues
Environmental aspects1. Tackling Climate Change2. Environmental accidents
Social aspects3. Diversity and inclusion4. Worker welfare5. Human rights6. In-country value7. Process safety8. Emergency preparedness9. Safety systems10. Worker safety
Governance aspects11. Whistleblowing12. Responsible governance13. Anti-bribery and corruption14. Ethical conduct
Strateg
ic repo
rtG
overn
ance
Finan
cial statemen
ts
35Petrofac Limited | 2020 Annual report and accounts

*Scope 1 and 2 (Petrofac Emissions & power consumption)
Environmental, Social and Governance continued
Our strategic goals Our material issues Our targets Our stakeholders
Addressing climate risk Net Zero by 2030 (EPS by 2025)
Clients
Shareholders
Employees
Communities
Partners
Supply chain
Governments
NGOs
Spill prevention and response
Zero pollution
Promoting a circular economy
Circular economy adopted by all sites
Sector leading health and safety
Zero harm
Enhancing diversity and inclusion
30% women in leadership roles by 2030
Respecting human rights
All third parties screened for human rights
Optimising in-country value
Sector leading local delivery
Embedding ethical values and behaviours
No regulatory non-compliance
Enhancing transparency, governance and disclosure
Full compliance with TCFD
An ESG Framework to create shared value
Launching our new sustainability strategyA highlight of 2020 was the launch of our new sustainability strategy. Developed by a Sustainability Committee chaired by our Chief Financial Officer, and approved by the Board in August 2020, this is structured around the three ESG pillars:
Environment – ensuring that Petrofac is able to minimise its own environmental impact, while supporting our clients in reducing their environmental impact
Social – promoting safe local delivery of our projects and services, drawing on ethical supply chains to create in-country value, helping to address skills gaps, and building a truly diverse workforce
Governance – underpinning everything we do with clear, consistent standards of ethical behaviour, bound by rigorous compliance and governance
For each pillar, we have set targets – including a commitment to reduce our Scope 1 and 2 emissions to Net Zero by 2030, and to achieve 30% of women in senior roles by 2030.
Aligning with the Sustainable Development GoalsAs we enter the ‘decade of delivery’ for the UN Sustainable Development Goals, we have aligned our sustainability strategy with the seven goals that are most relevant to Petrofac’s business.
We aim to work in partnership with our stakeholders to progress strategies that improve health and wellbeing, reduce inequality, tackle climate change, and preserve biodiversity – while championing a low-carbon economy and enabling economic growth.
EnvironmentalMinimise our environmental impact
SocialInform, educate and engage
GovernanceEmbed integrity,
transparency and trust
Petrofac Limited | 2020 Annual report and accounts36
Strategic report
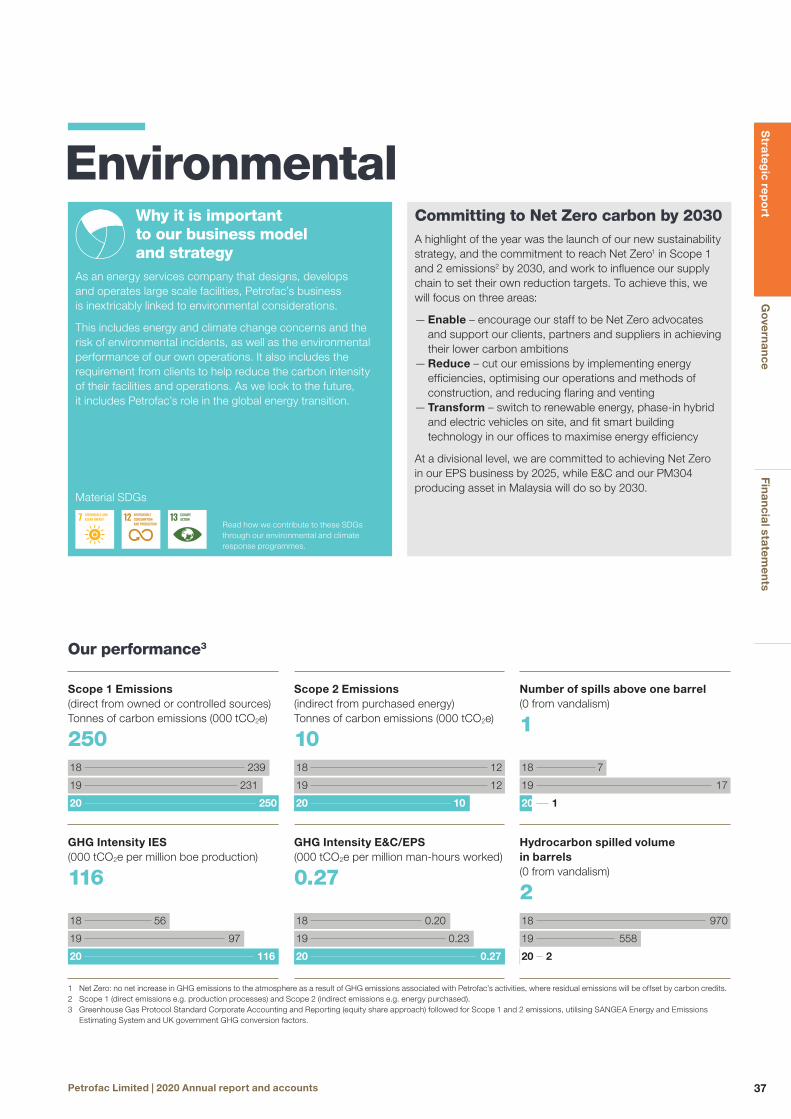
EnvironmentalCommitting to Net Zero carbon by 2030A highlight of the year was the launch of our new sustainability strategy, and the commitment to reach Net Zero1 in Scope 1 and 2 emissions2 by 2030, and work to influence our supply chain to set their own reduction targets. To achieve this, we will focus on three areas:
— Enable – encourage our staff to be Net Zero advocates and support our clients, partners and suppliers in achieving their lower carbon ambitions — Reduce – cut our emissions by implementing energy efficiencies, optimising our operations and methods of construction, and reducing flaring and venting — Transform – switch to renewable energy, phase-in hybrid and electric vehicles on site, and fit smart building technology in our offices to maximise energy efficiency
At a divisional level, we are committed to achieving Net Zero in our EPS business by 2025, while E&C and our PM304 producing asset in Malaysia will do so by 2030.
Our performance3
Scope 1 Emissions (direct from owned or controlled sources) Tonnes of carbon emissions (000 tCO2e)
250
Scope 2 Emissions (indirect from purchased energy) Tonnes of carbon emissions (000 tCO2e)
10
Number of spills above one barrel (0 from vandalism)
1
18 239
19 231
20 250
18 12
19 12
20 10
18 7
19 17
20 1
GHG Intensity IES (000 tCO2e per million boe production)
116
GHG Intensity E&C/EPS (000 tCO2e per million man-hours worked)
0.27
Hydrocarbon spilled volumein barrels (0 from vandalism)
218 56
19 97
20 116
18 0.20
19 0.23
20 0.27
18 970
19 558
20 2
1 Net Zero: no net increase in GHG emissions to the atmosphere as a result of GHG emissions associated with Petrofac’s activities, where residual emissions will be offset by carbon credits.2 Scope 1 (direct emissions e.g. production processes) and Scope 2 (indirect emissions e.g. energy purchased).3 Greenhouse Gas Protocol Standard Corporate Accounting and Reporting (equity share approach) followed for Scope 1 and 2 emissions, utilising SANGEA Energy and Emissions
Estimating System and UK government GHG conversion factors.
Why it is important to our business model and strategy
As an energy services company that designs, develops and operates large scale facilities, Petrofac’s business is inextricably linked to environmental considerations.
This includes energy and climate change concerns and the risk of environmental incidents, as well as the environmental performance of our own operations. It also includes the requirement from clients to help reduce the carbon intensity of their facilities and operations. As we look to the future, it includes Petrofac’s role in the global energy transition.
Material SDGs
Read how we contribute to these SDGs through our environmental and climate response programmes.
Strateg
ic repo
rtG
overn
ance
Finan
cial statemen
ts
37Petrofac Limited | 2020 Annual report and accounts

How we manage our environmental performanceOur goal is to manage the environmental risks of our projects and operations effectively, optimise our use of resources, and minimise our environmental impacts.
In terms of emissions, to support our long-term Net Zero target, we are committed to an interim target of a 3% year-on-year reduction in greenhouse gas (GHG) emission intensity from 2021 to 2023.
Each year, we participate in the Carbon Disclosure Project (CDP). In 2020 we continued to enhance our climate change programme and again achieved a CDP rating of ‘B’. This is at the top of the CDP ‘Management’ band for taking coordinated action on climate issues, and above both the European regional average of C, and the average for our direct competitors.
For 2020, we calculated our carbon footprint and energy consumption in accordance with the new UK Streamlined Energy and Carbon Reporting (SECR) regulations, and our data is assured and verified by an independent third party (Ricardo UK).
An important step forward in 2020 was the development and launch of an Environmental Toolkit – a digital tool to automate reporting and support more consistent and efficient monitoring.
Enhancing waste management through a circular economy Our Waste Management Standard governs our waste practices, with duty of care as a basic principle. We aim to reduce the amount of waste we generate and to maximise what we reuse or recycle through the introduction of circular economy ideas across the Group.
At our project sites, we are therefore challenging our teams to identify more sustainable, low-carbon, resource-efficient solutions for our clients. This a programme of work, currently in early development, and will focus on three levers for change:
— Designing out – engaging our project teams to ‘design-out’ waste. This will target single-use plastic packaging in particular, our single largest source of plastic waste. We will also look for opportunities to use more recycled and recyclable materials — Optimising use – exploring ways to use resources for longer, stretching the lifespan of materials and products — Recycling more – as we work to segregate more of our waste, we will create opportunities to improve what we recycle, reduce our landfill waste and put more of our ‘waste to work’
See the Ghazeer case study page 41 for examples of how we are working to introduce these ideas.
Reflecting on our overall 2020 performanceClearly, the COVID-19 pandemic had an impact on our performance. For example, several of our planned initiatives were delayed, and there was an increase in the volume of single-use plastics. Even so, the trend was generally positive for 2020.
In terms of GHG emissions, we are on target to meet our long-term commitment of a 20% reduction in GHG intensity. In our core E&C and EPS businesses, we reduced absolute emissions by 18%. However, delays to production optimisation at our offshore asset in Malaysia and the loss of gas reinjection due to an integrity incident, led to a 7% increase in absolute group emissions and intensity. Our energy usage decreased by 8% to 418 GWh (Scope 1: 399 GWh, Scope 2: 19 GWh) of which 2% was from our UK operations. This was due to a combination of energy efficiency initiatives, lower activity levels, and the introduction of remote working across many of our offices.
In terms of spill performance, we saw a continued improvement, with a significant reduction in our recordable spill volume down to just two barrels. This reduction was largely due to preventive initiatives implemented in Mexico over recent years to address our biggest cause of spills, namely the deliberate sabotage of pipelines and equipment. Measures included community engagement, technical solutions (such as drone monitoring) and changes to the law (which, in effect, de-incentivised the vandalism).
There was one operational hydrocarbon spill of more than one barrel, which took place at a project in Sharjah and was caused by a damaged hydraulic hose. A full investigation and clean-up operation was conducted by our spill response team, including the removal of all contaminated soil.
Environmental, Social and Governance continued
‘ As part of the World Bank’s Zero Flaring by 2030 initiative, we supported several clients to identify and implement flaring reduction opportunities.’
Petrofac Limited | 2020 Annual report and accounts38
Strategic report

Enabling our employees through the Future Think TankTo navigate the energy transition successfully, we recognise that a critical success factor will be our ability to work differently and to come together to collaborate and innovate. To this end, we established our Future Think Tank programme, which challenges young engineers and technologists from across the Group to develop low-carbon ideas that can be deployed across the business.
A team of leadership mentors give their time to guide the entrants and help them bring their ideas to life, with selected ideas presented to the Executive Management team for funding. Shortlisted ideas covering a range of innovative solutions from low-diesel construction ideas to a sustainable office will be selected for proof-of-concept funding in 2021.
Deploying digital solutions An important strategic theme for Petrofac is our use of disruptive digital technologies to help the Company work faster, smarter and safer. We are pursuing techniques that use operational environmental data to enhance the visibility of energy use and enable the real-time tracking of emissions performance.
Protecting biodiversityWe support the UN Convention on Biodiversity and work with our clients to promote a risk-based approach to protection. A mitigation hierarchy (avoid, minimise, restore, offset) has been adopted as a framework for good practice management.
At our Sakhalin island project site in Russia, where Petrofac is constructing an onshore processing facility, the project team put in place measures to protect a number of Stellar Sea Eagles nesting along the coast near the project’s temporary beach landing facility, used to offload cargo.
Habitat corridors and prohibited areas were created to ensure construction personnel and activities were kept away from the eagles’ nesting and feeding areas. Strict noise and speed controls were enforced for all vehicles; waste management and pollution prevention plans were implemented; and a programme of conservation awareness training was put in place for all workers.
Reducing flaring across our operations As part of the World Bank’s Zero Flaring by 2030 initiative, we supported several clients to identify and implement flaring reduction opportunities.
For a client in Oman, we developed initial concepts for the reduction of flared gas across three sites and developed a basic engineering package to take them to the next phase. Solutions included steam generation for enhanced oil recovery, power generation, compressed natural gas, gas to diesel, and LPG production.
Meanwhile, in Southern Libya, we investigated the feasibility of extracting LPG from the associated gas, producing packaged plant solutions for rapid deployment, and modular cylinder filling operations - to both support the local market and reduce flaring by an estimated six million standard cubic feet per day (MMscfd).
Strateg
ic repo
rtG
overn
ance
Finan
cial statemen
ts
39Petrofac Limited | 2020 Annual report and accounts

Environmental, Social and Governance continued
Task Force on Climate-related Financial DisclosuresAchieving compliance with the TCFD recommendationsTo better understand the potential impacts of climate change on the business, we continued to work towards full compliance with the recommendations of the Task force on Climate-related Financial Disclosures (TCFD). To do so, we formed a working group with representatives from the environmental, finance, risk and governance teams.
The working group looked at how Petrofac might be impacted by a changing climate, in order to provide the leadership team with future-looking insight on likely climate risks and opportunities. To this end, it explored the two main climate scenarios developed by the International Energy Agency (IEA):
— Low Carbon Future at under 1.5 °C (based on IEA Sustainable Development Scenario) – setting out how the global energy sector could evolve to align with the Paris Agreement and rapidly accelerate to a low-carbon economy
—High Carbon Future at more than 3 °C (based on IEA Stated Policies Scenario) – looking at how today’s policy frameworks, intentions and targets could impact the energy sector, which would make a significant difference but fall short of the Paris goals.
Working with various functions across the Group, the working group reviewed the arrangements for climate response with respect to our governance, strategy, risk management, and metrics and targets as required by the TCFD.
Read the full TCFD report at www.petrofac.com
GovernanceClimate change is seen as a material governance and strategic issue for Petrofac. It is periodically addressed by our Board through strategy and investment discussions, enterprise risk management, and performance reviews against our commitments.
Day-to-day governance is delegated to:
— The Group Sustainability Steering Committee – is chaired by the CFO and assists the Board in overseeing the Group’s response to climate change
— The Audit Committee (supported by the Sustainability SteerCo) – monitors and provides oversight to the Board on climate-related risk management
Strategy — Improve performance – through our Net Zero carbon strategy of ‘Enable, Reduce, Transform’, we have set targets to minimise the environmental impact of our own operations
— Mitigate risks – understand and address climate-related risks to our business and operations
— Pursue opportunities – help clients to achieve their low carbon ambitions and pursue adjacent opportunities through our New Energies business line
— Engage publicly – engage with government and other stakeholders to better understand and input into the developing public policy agenda on climate action
Climate risk management — Regulatory risk – respond positively to the evolving policy landscape that may impact the Company, such as carbon taxation or more restrictive emissions legislation
— Market-related risk – the Company is exposed to the shift towards a low carbon economy, and we have developed management strategies to advance our business as energy use transitions
— Reputational risk – evolve our sustainability strategy, strengthen our ESG reporting, and enhance our compliance culture
— Physical risk – enhance the climate resilience of our business by identifying and addressing the potential for extreme weather events to disrupt our operations, particularly with regards to our supply chain
Metrics and Targets — Become a Net Zero company – we have set a Paris-aligned target and goal for decarbonisation of our projects and operations
— Set granular climate-related targets across the business – accountability for climate change leadership has been embedded into executive performance measures and remuneration, and near-term targets are being developed across every team in the Company
— Support our supply chain – encourage the adoption of emissions targets among key suppliers, and support their lower-carbon ambitions through various collaborative partnering initiatives
Petrofac Limited | 2020 Annual report and accounts40
Strategic report
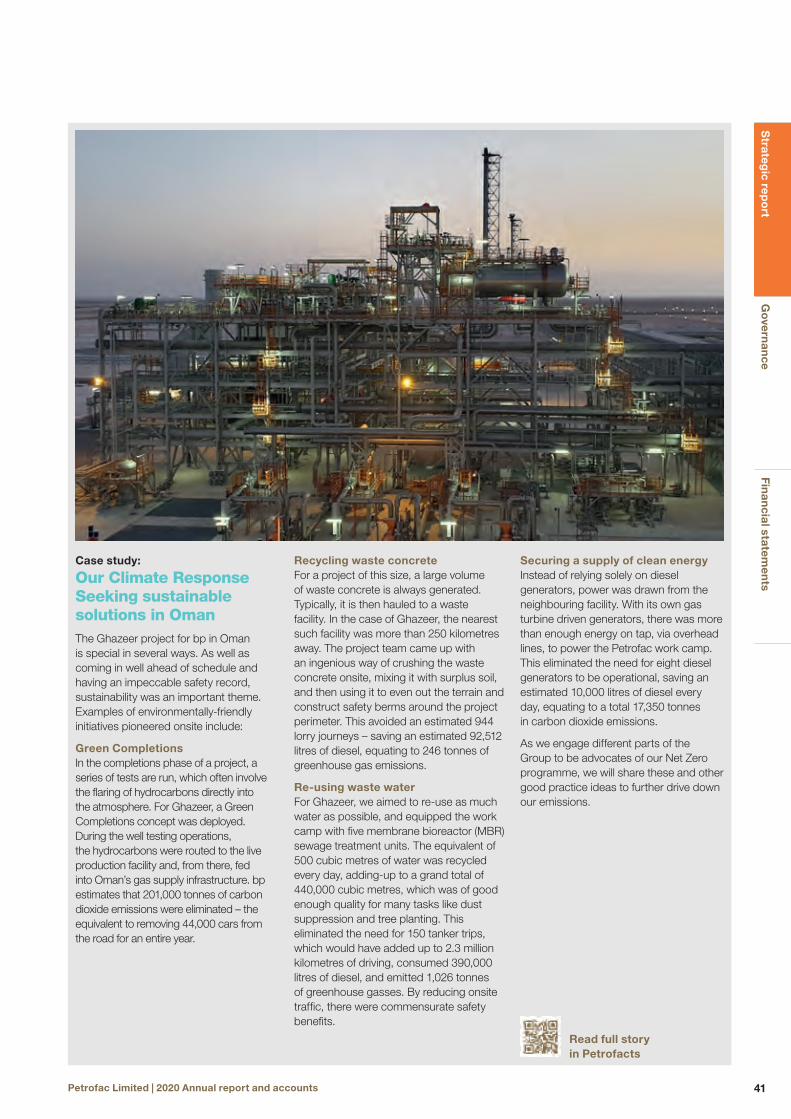
Case study:
Our Climate Response Seeking sustainable solutions in OmanThe Ghazeer project for bp in Oman is special in several ways. As well as coming in well ahead of schedule and having an impeccable safety record, sustainability was an important theme. Examples of environmentally-friendly initiatives pioneered onsite include:
Green CompletionsIn the completions phase of a project, a series of tests are run, which often involve the flaring of hydrocarbons directly into the atmosphere. For Ghazeer, a Green Completions concept was deployed. During the well testing operations, the hydrocarbons were routed to the live production facility and, from there, fed into Oman’s gas supply infrastructure. bp estimates that 201,000 tonnes of carbon dioxide emissions were eliminated – the equivalent to removing 44,000 cars from the road for an entire year.
Securing a supply of clean energyInstead of relying solely on diesel generators, power was drawn from the neighbouring facility. With its own gas turbine driven generators, there was more than enough energy on tap, via overhead lines, to power the Petrofac work camp. This eliminated the need for eight diesel generators to be operational, saving an estimated 10,000 litres of diesel every day, equating to a total 17,350 tonnes in carbon dioxide emissions.
As we engage different parts of the Group to be advocates of our Net Zero programme, we will share these and other good practice ideas to further drive down our emissions.
Recycling waste concreteFor a project of this size, a large volume of waste concrete is always generated. Typically, it is then hauled to a waste facility. In the case of Ghazeer, the nearest such facility was more than 250 kilometres away. The project team came up with an ingenious way of crushing the waste concrete onsite, mixing it with surplus soil, and then using it to even out the terrain and construct safety berms around the project perimeter. This avoided an estimated 944 lorry journeys – saving an estimated 92,512 litres of diesel, equating to 246 tonnes of greenhouse gas emissions.
Re-using waste waterFor Ghazeer, we aimed to re-use as much water as possible, and equipped the work camp with five membrane bioreactor (MBR) sewage treatment units. The equivalent of 500 cubic metres of water was recycled every day, adding-up to a grand total of 440,000 cubic metres, which was of good enough quality for many tasks like dust suppression and tree planting. This eliminated the need for 150 tanker trips, which would have added up to 2.3 million kilometres of driving, consumed 390,000 litres of diesel, and emitted 1,026 tonnes of greenhouse gasses. By reducing onsite traffic, there were commensurate safety benefits.
Read full storyin Petrofacts
Strateg
ic repo
rtG
overn
ance
Finan
cial statemen
ts
41Petrofac Limited | 2020 Annual report and accounts

Social
Environmental, Social and Governance continued
Why this is important to our business model and strategy
As a service business, it is our people, their attitude and skills who set us apart from our competitors. We are therefore committed to building a diverse workforce, which is representative of the communities in which we operate, while developing all of our people, keeping them safe, and looking out for their wellbeing.
Wherever the Company operates, we are committed to creating shared value, by engaging with local communities, investing in local supply chains, employing local people, and stimulating local economies. As well as being the right thing to do, we see the creation of in-country value (ICV) as a source of competitive advantage, helping us to operate globally and bid on challenging projects, while benefiting from the economies of delivering locally.
Because we operate in challenging environments, where the rights and welfare of workers can sometimes be at risk, we are committed to protecting human rights throughout our business operations and extended supply chain, ensuring that everyone who works with and for us are treated with respect, fairness and dignity.
Targeting 30% of women in senior roles by 2030A highlight of the year was our increased focus on diversity and inclusion, including the setting of new targets, and the appointment of our first Global Head of Diversity and Inclusion, as well as two Diversity Champions in the Leadership Team.
Petrofac comprises 80 nationalities. While we have 30% female representation on our Board, we recognise we need to do more to increase the number of women in management. During 2020, as part of our new sustainability strategy, we therefore set a target of 30% of women in senior roles4 by 2030 through a formal series of measures.
We are proud of our track record of developing young talent and building diversity from within. We have therefore committed to build on the 46% women in our 2019 graduate engineering intake by continuing to encourage more female graduates to join Petrofac as we develop our female leaders.
Our performance
Gender profile of our people (%)
Employees
Age profile of our people (%) Grade profile of our people (%)
M 87
F 13
US$0,000m
M 81
F 19
Leadership
<30 11
30–39 33
40–49 32
50–59 19
>60 5
Executive 1
Management 10
Supervisory 27
Professional 47
Support 15
Lost time injury frequency rate
0.013Recordable incident frequency rate
0.065% Spend on local goods andservices5 (%)
+53%18 0.018
19 0.013
20 0.013
18 0.06
19 0.06
20 0.065
18 31
19 41
20 53
4 Executive management and direct reports (as per Hampton-Alexander criteria)5 Non-JV projects
Material SDGs
Read how we contribute to these SDGs through our safety, diversity & inclusion, community and human rights programmes.
Petrofac Limited | 2020 Annual report and accounts42
Strategic report

Safety
Safe: of paramount importanceAcross Petrofac, our aim is for zero safety incidents, as reflected in the name of our Horizon Zero global safety campaign. We see this as an entirely realistic and achievable goal and are proud to say that, much of the time, we do live up to it.
To maintain our performance, we continue to enhance our programme of health, safety, security, environment and integrity assurance (HSSEIA) measures. We also continue to refine the way we measure our performance.
Reflecting on our 2020 safety performanceFrom a safety management perspective, 2020 was a challenging year.
In the face of the COVID-19 pandemic, our health and safety teams were focused on how best to continue our operations, whilst also protecting our people and partners from the virus. We therefore complied with local requirements and international guidelines, and implemented social distancing measures accordingly. In some locations, however, we did experience minor outbreaks which were managed through our pandemic response processes.
Regrettably, in some instances, this appears to have diverted attention away from more routine safety considerations, and the situation was compounded by the fact that many people were onsite for much longer than would normally be the case. As a consequence, we did see a regrettable deterioration in our safety performance, including two fatalities. In India, a man died during a hydrostatic pressure test and, in Oman, an offloading incident resulted in a second death. Both incidents were investigated in forensic detail and reviewed by senior management and, separately, by the Board. It was determined that both of the fatalities could have been prevented by one of our most basic Life Saving Rules, namely the Line of Fire rule. A priority for 2021, therefore, is the roll out of a Safety Back to Basics campaign, emphasising that safety is a shared responsibility, and looking at ways to ensure that everyone on our sites understands, embraces and follows the fundamentals of good safety.
In terms of broader indicators:
— Lost time injury (LTI) frequency rate – remained at 0.013 per 200,000 man-hours, compared to an industry average of 0.048 (International Association of Oil and Gas Producers 2019) — Recordable incident frequency rate –increased to 0.065 per 200,000 manhours, compared to an industry average of 0.184 (International Association of Oil and Gas Producers 2019).
Strengthening our safety cultureDespite the challenges of 2020, a number of new initiatives were implemented, including:
— HSSEIA Deep Dives – our global leadership teams met on eight occasions to conduct HSSEIA Deep Dive sessions, with a view to identifying and addressing potential barriers to safe and healthy working that may have previously been overlooked. In total, more than 240 people were involved in the sessions. — Life Saving Rules e-learning – we launched a mandatory e-learning course for all Petrofac employees, incorporating videos in English, Hindi, Russian and Arabic, which will also be shared with partners and subcontractors — Hazard Hunt process – we introduced a new Hazard Hunt process on our project sites, such as regular ‘cold eye’ reviews, whereby workers from one area perform a hazard hunt of another area, to identify hazards that others might miss after seeing them every day — Excavation hazard awareness programme – a set of flip cards was developed to raise awareness of the risks relating to excavation activities — Behavioural-based training – to assist onsite personnel, we revived a number of training programmes, including the HSSE Bootcamp for supervisors in our E&C business, and mental health awareness across the Group
Making better use of digital technologiesIn line with Petrofac’s wider digital transformation programmes, new technologies are playing an ever more prominent role in our HSSEIA activities, for example:
— Developing new digital platforms – significant preparatory work was completed on a range of digital tools and platforms, such as the creation of a full functional specification for a new HSSEIA data collection and reporting tool, and the development of a new digital enterprise risk management tool — Virtual site audits – due to travel restrictions, we were unable to conduct in-person site audits and therefore turned to Microsoft Teams to handle our usual annual schedule of Corporate HSSEIA audits and Petrofac Assurance Index (PAI) audits — Driving behaviours – to help improve driving safety, in-vehicle monitoring system (IVMS) technology is used to keep track of driving behaviours, and identify and address any issues — Virtual meetings – Instead of meeting face-to-face, Group Crisis Team and Business Support Teams are able to meet virtually irrespective of location
Stepping-up our health and wellbeing programmesIn the face of the COVID-19 pandemic, the disruption of the lockdown, and the longer-than-normal onsite postings, we chose to step-up our existing health and wellbeing programmes, with a particular emphasis on mental health. For example:
Strateg
ic repo
rtG
overn
ance
Finan
cial statemen
ts
43Petrofac Limited | 2020 Annual report and accounts
Environmental, Social and Governance continued
— Extending our Employee Assistance Programme – we extended our LifeWorks Employee Assistance Programme globally, giving all of our people and their family members easy 24/7 access to independent advice and counselling on a wide range of issues, whether from inside or outside work, that could adversely impact their health, wellbeing or work performance. To raise awareness and encourage use of this facility, while also demonstrating that the leadership team are acutely aware of the challenges being faced by employees, we conducted a number of internal townhall sessions for managers. In October 2020, we launched a #WellbeingWednesday initiative, with a weekly series of webinars drawing attention to health and wellbeing topics, such as mental health, healthy lifestyle and diet, breast cancer, and flu awareness — Raising awareness of mental health issues – to normalise discussions around mental health, we ran a number of initiatives throughout the year. We drew attention to Mental Health Awareness Week through a range of initiatives, such as seminars with mental health specialists. We also launched the RU OK? programme globally, to raise awareness of mental health issues and encourage employees to seek support — Enlisting the support of our future leaders – mental health awareness was a prominent topic at our virtual Graduates Conference
Protecting our people from COVID-19A Group-wide COVID-19 response and recovery programme, including guidance and a toolkit, was initiated to provide direction and support to all offices and project sites globally, with regular Group Crisis Team and Business Support Team meetings to oversee the situation. As lockdowns eased, a Return to Workplace Guide and toolkit were developed which outlined Petrofac precautions and protocols, as well as individual responsibilities. The approach was adapted locally to reflect in-country circumstances and regulations.
Throughout this programme, safety was prioritised, together with continuous engagement and communications. Measures implemented in all locations included temperature checks, deep cleaning, sanitation stations, PPE, signage, isolation rooms, and contact tracing procedures.
Asset integrity
Ensuring the integrity of our operating assetsWe are committed to designing, building and operating assets that are safe, reliable and meet or exceed their specified purpose.
Key to this is our Asset Integrity Framework, which enables us to take a structured and consistent approach to integrity across all Group operations. As we often operate ageing assets, it is particularly important for us to take a rigorous approach to asset integrity management. During 2020, the Group was responsible for managing and ensuring the integrity of 18 operating assets. To assist clients with their operations, we also sought to apply these asset integrity principles across the wider Group services.
Reflecting on our asset integrity performanceIn evaluating our asset integrity performance, our main area of focus is managing process safety hazards, reducing high potential incidents (HiPos) and those incidents that involve process safety procedures.
In 2020, only one HiPo was recorded on the assets we operate (down from three in 2019). We believe the improved performance was attributable to a first principles approach, whereby all work plans were subject to enhanced risk reviews.
Seeking continuous improvement in asset integrityWe continue to review and enhance our approach to asset integrity and assurance. Developments in 2020 were largely related to the COVID-19 pandemic. In our Asset Integrity Audit Programme we were able to increase engagement with operating teams, encouraging and enabling them to be more mindful of integrity issues, to take a more active role in site audits, and for more of the audit process to be managed virtually.
Priorities going forward relate largely to the digitalisation of the asset integrity processes and the full delivery of the related platforms. By integrating big data into the audit programmes, it should become easier to target assurance activities based on a more accurate understanding of asset condition.
Security and crisis management
Remaining responsive to a fast-changing security environmentPetrofac works in challenging environments with fast-changing security issues. Our aim is to protect our employees and assets in a responsible manner, and to prevent any security-related disruption.
Our security and crisis management team is closely integrated into the wider HSSEIA community. Our Security Policy sets out the responsibilities of our senior management team and our business units and, with regards to crisis management, we aim to operate to the same standard as ISO22301:2019.
Reflecting on the security environment in 2020The COVID-19 pandemic had an impact on the security environment in 2020. With less movement of people, the risks of crime and civil unrest was reduced commensurately. However, we are mindful that, as the economic impact of the pandemic unfolds, the potential for security incidents could escalate.
The only security-related incident to report for 2020 took place in Iraq at the start of the year, when much of the south of the country was experiencing protests relating to the economic environment. At one of our project sites, work was disrupted for several weeks by largely peaceful protesters who blockaded the entrance to the facility. The situation was resolved by the operator. Throughout, our teams focused on keeping employees safe, and ensuring that progress on the project was not completely impeded.
Petrofac Limited | 2020 Annual report and accounts44
Strategic report

Cyber-security and data protection Improving our capabilitiesIn response to rapidly evolving data security risks, and to support Petrofac’s wider digitalisation initiatives, cyber-security and data protection continued to be an area of focus. In the face of the COVID-19 pandemic, we ensured that all core IT services and applications could be delivered remotely and with the same level of security as onsite, enabling a seamless transition from office to working from home.
During 2020, we stepped-up our programme of related initiatives, while our alignment with the ISO27001 standard and other best practices continued.
Related initiatives included:
— Enhancing our threat detection capabilities and threat-hunting capabilities by leveraging machine learning-based detection systems — Improving our threat intelligence capabilities, with an emphasis on region- and industry-specific threats — Extending our cyber-security awareness programmes to cover vendors and third parties to create a culture of cyber risk awareness across our supply chain — Continuing our phishing simulation tests and awareness programme to ensure our employees remain aware of the latest phishing techniques and to create a strong and dynamic cyber- security culture — Continuing the assessment of cyber- security risks with regular vulnerability assessments, penetration tests and Red Team exercises
Meanwhile, cyber-security remained a key priority in all our digitalisation initiatives, and we ensure that appropriate security protection is embedded from the initial ideation and conceptual phases.
Enhancing the protection we provide to employees, partners and assetsTo reflect the fast-changing security environment, we continue to review and refine our security approach. The main development in 2020 related to the roll-out and adoption of Security Companion, an online tool which gives all employees easy access to security-related policies, procedures, standards, resources, training and messaging. Throughout the year, we ran a programme of webinars to draw attention to security issues and advise on the use of the tool.
We also replaced our security assurance visits to project sites with virtual equivalents.
Meanwhile, we reviewed our Crisis Management Framework with the aim of digitalising it and integrating it into a Microsoft Teams-based platform.
Strateg
ic repo
rtG
overn
ance
Finan
cial statemen
ts
45Petrofac Limited | 2020 Annual report and accounts
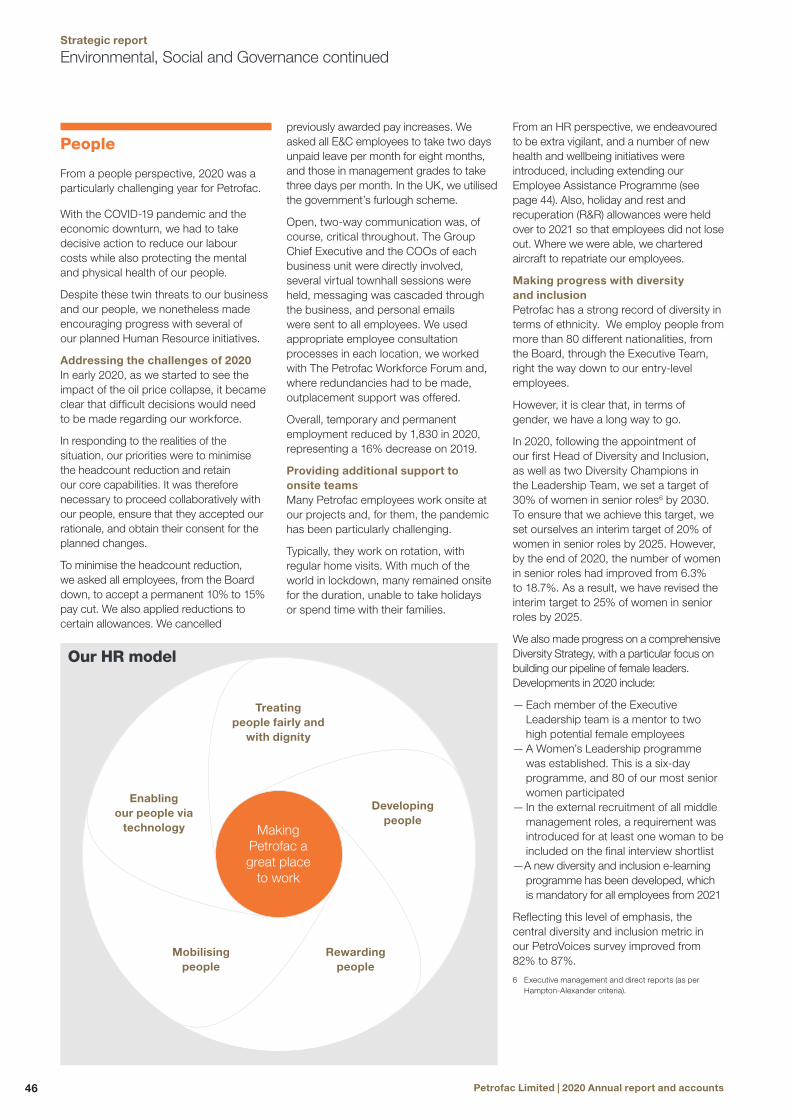
Environmental, Social and Governance continued
People
From a people perspective, 2020 was a particularly challenging year for Petrofac.
With the COVID-19 pandemic and the economic downturn, we had to take decisive action to reduce our labour costs while also protecting the mental and physical health of our people.
Despite these twin threats to our business and our people, we nonetheless made encouraging progress with several of our planned Human Resource initiatives.
Addressing the challenges of 2020In early 2020, as we started to see the impact of the oil price collapse, it became clear that difficult decisions would need to be made regarding our workforce.
In responding to the realities of the situation, our priorities were to minimise the headcount reduction and retain our core capabilities. It was therefore necessary to proceed collaboratively with our people, ensure that they accepted our rationale, and obtain their consent for the planned changes.
To minimise the headcount reduction, we asked all employees, from the Board down, to accept a permanent 10% to 15% pay cut. We also applied reductions to certain allowances. We cancelled
previously awarded pay increases. We asked all E&C employees to take two days unpaid leave per month for eight months, and those in management grades to take three days per month. In the UK, we utilised the government’s furlough scheme.
Open, two-way communication was, of course, critical throughout. The Group Chief Executive and the COOs of each business unit were directly involved, several virtual townhall sessions were held, messaging was cascaded through the business, and personal emails were sent to all employees. We used appropriate employee consultation processes in each location, we worked with The Petrofac Workforce Forum and, where redundancies had to be made, outplacement support was offered.
Overall, temporary and permanent employment reduced by 1,830 in 2020, representing a 16% decrease on 2019.
Providing additional support to onsite teamsMany Petrofac employees work onsite at our projects and, for them, the pandemic has been particularly challenging.
Typically, they work on rotation, with regular home visits. With much of the world in lockdown, many remained onsite for the duration, unable to take holidays or spend time with their families.
From an HR perspective, we endeavoured to be extra vigilant, and a number of new health and wellbeing initiatives were introduced, including extending our Employee Assistance Programme (see page 44). Also, holiday and rest and recuperation (R&R) allowances were held over to 2021 so that employees did not lose out. Where we were able, we chartered aircraft to repatriate our employees.
Making progress with diversity and inclusionPetrofac has a strong record of diversity in terms of ethnicity. We employ people from more than 80 different nationalities, from the Board, through the Executive Team, right the way down to our entry-level employees.
However, it is clear that, in terms of gender, we have a long way to go.
In 2020, following the appointment of our first Head of Diversity and Inclusion, as well as two Diversity Champions in the Leadership Team, we set a target of 30% of women in senior roles6 by 2030. To ensure that we achieve this target, we set ourselves an interim target of 20% of women in senior roles by 2025. However, by the end of 2020, the number of women in senior roles had improved from 6.3% to 18.7%. As a result, we have revised the interim target to 25% of women in senior roles by 2025.
We also made progress on a comprehensive Diversity Strategy, with a particular focus on building our pipeline of female leaders. Developments in 2020 include:
— Each member of the Executive Leadership team is a mentor to two high potential female employees — A Women’s Leadership programme was established. This is a six-day programme, and 80 of our most senior women participated — In the external recruitment of all middle management roles, a requirement was introduced for at least one woman to be included on the final interview shortlist —A new diversity and inclusion e-learning programme has been developed, which is mandatory for all employees from 2021
Reflecting this level of emphasis, the central diversity and inclusion metric in our PetroVoices survey improved from 82% to 87%.
6 Executive management and direct reports (as per Hampton-Alexander criteria).
Making Petrofac a great place
to work
Treating people fairly and
with dignity
Developing people
Rewarding people
Mobilising people
Enabling our people via
technology
Our HR model
Petrofac Limited | 2020 Annual report and accounts46
Strategic report
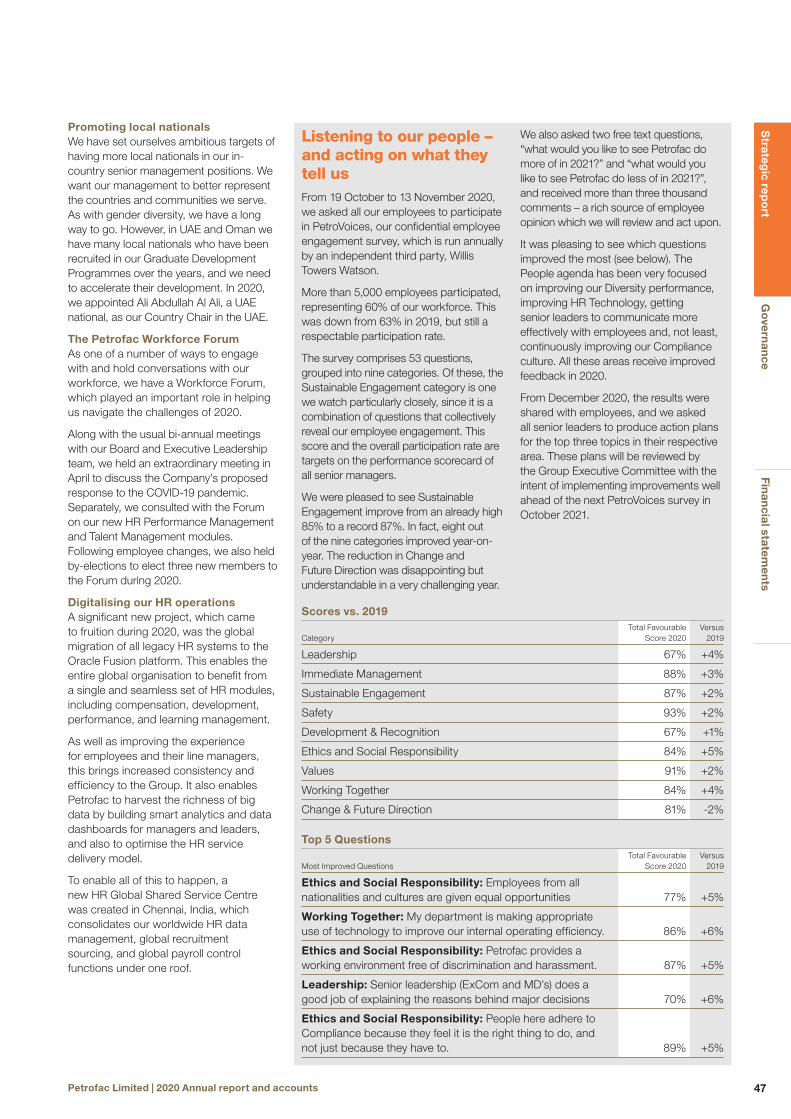
Promoting local nationalsWe have set ourselves ambitious targets of having more local nationals in our in-country senior management positions. We want our management to better represent the countries and communities we serve. As with gender diversity, we have a long way to go. However, in UAE and Oman we have many local nationals who have been recruited in our Graduate Development Programmes over the years, and we need to accelerate their development. In 2020, we appointed Ali Abdullah Al Ali, a UAE national, as our Country Chair in the UAE.
The Petrofac Workforce ForumAs one of a number of ways to engage with and hold conversations with our workforce, we have a Workforce Forum, which played an important role in helping us navigate the challenges of 2020.
Along with the usual bi-annual meetings with our Board and Executive Leadership team, we held an extraordinary meeting in April to discuss the Company’s proposed response to the COVID-19 pandemic. Separately, we consulted with the Forum on our new HR Performance Management and Talent Management modules. Following employee changes, we also held by-elections to elect three new members to the Forum during 2020.
Digitalising our HR operationsA significant new project, which came to fruition during 2020, was the global migration of all legacy HR systems to the Oracle Fusion platform. This enables the entire global organisation to benefit from a single and seamless set of HR modules, including compensation, development, performance, and learning management.
As well as improving the experience for employees and their line managers, this brings increased consistency and efficiency to the Group. It also enables Petrofac to harvest the richness of big data by building smart analytics and data dashboards for managers and leaders, and also to optimise the HR service delivery model.
To enable all of this to happen, a new HR Global Shared Service Centre was created in Chennai, India, which consolidates our worldwide HR data management, global recruitment sourcing, and global payroll control functions under one roof.
Listening to our people – and acting on what they tell usFrom 19 October to 13 November 2020, we asked all our employees to participate in PetroVoices, our confidential employee engagement survey, which is run annually by an independent third party, Willis Towers Watson.
More than 5,000 employees participated, representing 60% of our workforce. This was down from 63% in 2019, but still a respectable participation rate.
The survey comprises 53 questions, grouped into nine categories. Of these, the Sustainable Engagement category is one we watch particularly closely, since it is a combination of questions that collectively reveal our employee engagement. This score and the overall participation rate are targets on the performance scorecard of all senior managers.
We were pleased to see Sustainable Engagement improve from an already high 85% to a record 87%. In fact, eight out of the nine categories improved year-on-year. The reduction in Change and Future Direction was disappointing but understandable in a very challenging year.
We also asked two free text questions, “what would you like to see Petrofac do more of in 2021?” and “what would you like to see Petrofac do less of in 2021?”, and received more than three thousand comments – a rich source of employee opinion which we will review and act upon.
It was pleasing to see which questions improved the most (see below). The People agenda has been very focused on improving our Diversity performance, improving HR Technology, getting senior leaders to communicate more effectively with employees and, not least, continuously improving our Compliance culture. All these areas receive improved feedback in 2020.
From December 2020, the results were shared with employees, and we asked all senior leaders to produce action plans for the top three topics in their respective area. These plans will be reviewed by the Group Executive Committee with the intent of implementing improvements well ahead of the next PetroVoices survey in October 2021.
Scores vs. 2019
CategoryTotal Favourable
Score 2020Versus
2019
Leadership 67% +4%
Immediate Management 88% +3%
Sustainable Engagement 87% +2%
Safety 93% +2%
Development & Recognition 67% +1%
Ethics and Social Responsibility 84% +5%
Values 91% +2%
Working Together 84% +4%
Change & Future Direction 81% -2%
Top 5 Questions
Most Improved QuestionsTotal Favourable
Score 2020Versus
2019
Ethics and Social Responsibility: Employees from all nationalities and cultures are given equal opportunities 77% +5%
Working Together: My department is making appropriate use of technology to improve our internal operating efficiency. 86% +6%
Ethics and Social Responsibility: Petrofac provides a working environment free of discrimination and harassment. 87% +5%
Leadership: Senior leadership (ExCom and MD’s) does a good job of explaining the reasons behind major decisions 70% +6%
Ethics and Social Responsibility: People here adhere to Compliance because they feel it is the right thing to do, and not just because they have to. 89% +5%
Strateg
ic repo
rtG
overn
ance
Finan
cial statemen
ts
47Petrofac Limited | 2020 Annual report and accounts

Environmental, Social and Governance continued
Sponsoring a Masters Programme at the American University of Beirut Another of the ways in which we responded to the COVID-19 pandemic was to work with the American University of Beirut to sponsor a Masters Programme in Engineering Management.
With the downturn across the oil and gas industry and delays to several of our projects, we were facing the prospect of having to make a number of our talented engineers redundant. Instead, we offered them the opportunity to study for a Masters programme, on either a classroom or a distance learning basis, with Petrofac paying tuition fees and covering subsistence costs.
Some 65 of our employees took up the opportunity, and we hope to re-employ as many of them as possible when they complete their studies.
Taking our Leadership Excellence Programme onlineThrough our Petrofac Academy, we have run an extensive range of leadership training programmes, supported by a mobile Learning App.
In 2020, working with our longstanding partner, The London Business School, we evolved our Leadership Excellence Programme and delivered it online. We put 70 of our most senior managers worldwide through the four-day programme. We also ran programmes for our leadership on organisational resilience, as well as a suite of technical engineering modules.
The transition to virtual formats was highly successful, and we expect to follow a ‘digital first’ approach in future years.
Extending the success of the Petrofac Academy OnlineAs we digitalise our business, we are conscious that our employees are also changing how they prefer to learn. Many of our employees live and work in harsh environments, maybe offshore or in remote areas. They can be on rotations that keep them away from their home office for months at a time. We want to provide them with high-calibre training and development opportunities.
We therefore continued to develop Petrofac Academy Online, to include more than 1,300 e-books, audio books and Expert Talks covering a wide range of topics, as well as more than 75 e-learning courses. In 2020, more than 14,000 e-learning courses were completed, 60,000 learning hours were studied, and 18,000 books were downloaded from our e-library.
Priorities for 2021The new digital HR platform, as well as the Shared Service Centre in Chennai, will be an important enabler for the main HR priorities in 2021. These include:
— Developing a performance culture – drawing on the new digital tools, defining and encouraging the type of behaviours we value most highly, and enabling more of a coaching culture among our managers — Establishing a new Global Mobility Framework – bringing more consistency to our approach to mobility, in a way that aligns with our ambition to expand geographies beyond our traditional core markets — Creating a Global Recruitment Centre of Excellence – bringing more efficiency and consistency to our recruitment processes, while also improving the experience of candidates. Even in 2020, we still recruited more than 1,600 temporary and permanent employees
Petrofac Limited | 2020 Annual report and accounts48
Strategic report

Community engagement
Making a positive contribution to our local communities Wherever we work, we want local communities to benefit from our presence by helping them to be healthier, more prosperous and engaged with our work. In particular, we aim to engage with local stakeholders to understand and manage the social impacts of our business and address their concerns. Maximising the benefits we bring through community development, focused on local capacity building, and strategic corporate giving initiatives targeting improved access to education and the employability of people from marginalised groups.
The Petrofac Social Performance Framework governs the way we approach community engagement.
It consists of our Social Performance Standard and a set of guidelines that enable us to meet our regulatory commitments and support our contribution to the UN Sustainable Development Goals.
In 2020, we broadened our approach to help local communities respond to the COVID-19 pandemic.
Responding to the COVID-19 pandemicWhile our philosophy remained unchanged in 2020, our overall approach continued to be responsive to the changing needs of the local communities in which we work – hence the inclusion of a number of COVID-19 response initiatives, such as:
— Algeria – we purchased and donated around US$100,000 worth of medical equipment to a crisis fund and, subsequently, our Tinrhert Field Development Project team donated a range of medical equipment for the In Amenas Hospital in Southern Algeria — India – we supported several government agencies in their response to the pandemic, including the provision of some 1,000 COVID-19 test kits to a hospital local to our Raageshwari Deep Gas Field Development project — Iraq – we purchased and donated a range of PPE and medical equipment, including ventilators, worth US$32,000 to assist the Basra Oil Company in its response to the pandemic — Kuwait – we vacated the sizeable accommodation facilities at the Lower Fars heavy oil project, and made them available to the Ministry of Health to provide quarantine facilities — Mexico – we donated around US$70,000 to the Tabasco Secretary of Health for the purchase of PPE and other medical supplies — Oman – we donated around US$100,000 to the Special Economic Zone Authority at Duqm to help its response to the pandemic, which enabled a local school to be converted into a temporary hospital — UAE – to reflect our support for and appreciation of the UAE’s essential frontline workers, we supported and participated in the Abu Dhabi Police/SAEED Association campaign – a community initiative which recognised the efforts and dedication of the many key workers across the Emirates
— UK – our various offices coordinated a number of initiatives, such as volunteering, the delivery of food to local food banks, and donations of PPE to local care homes and charities
Initiatives in IndiaThere is a regulatory requirement for us to spend at least 2% of our revenues on social investments, equating to a Petrofac investment of more than US$330,000 per annum.
In 2020 the focus of our community engagement programmes continued to be the provision of training and employability skills for disadvantaged young people.
Through the PanIIT Alumni Reach for India Foundation (PARFI) initiative, we provided vocational skills training, such as welding, fitting and grinding to 150 young people, through full-time residential courses. By the close of the year, some 115 had secured work placements with local employers. Meanwhile, through the Collective Good Foundation (CGF), we initiated a programme to provide training for 240 young people in pipe fitting and as domestic appliance engineers.
To reflect our emphasis on diversity, we backed several programmes to support under-privileged young women. For example, through the Women’s Organization for Rural Development (WORD), we provided literacy and language training to more than 550 young people and, through the Ravanasamudram initiative, we provided sewing skills training to 50 unemployed women, around half of whom subsequently started working as seamstresses.
Strateg
ic repo
rtG
overn
ance
Finan
cial statemen
ts
49Petrofac Limited | 2020 Annual report and accounts

Environmental, Social and Governance continued
Our Indian teams also continued to contribute to social initiatives in the communities close to our projects. The Visakh Refinery Modernisation team support the local Nethra Vidyalaya School – a social programme for visually challenged and abandoned children near the project site.
Initiatives in MENADuring 2020, aside from our COVID-19 response initiatives, we continued with a number of well-established partnerships and initiatives across the Middle East and North Africa region. Examples include:
— Algeria – our Tinrhert Field Development Project team continued to support its local communities, including the donation of backpacks, books and stationery to more than 100 children at local schools, and the refurbishment and upgrade of the airstrip terminal building, which is one of the major transport links with the outside world —Sharjah – for many years, reflecting our education projects that encourage young people to study STEM subjects, we have supported the American University of Sharjah. Through a donation of around US$27,000 we supported a year-long programme of education-based events and initiatives
Initiatives in MexicoAs an asset owner and operator, we had traditionally run a wide-ranging programme of community engagement in Tabasco State. This included the provision of a field office for local people to drop-in, get assistance and raise and check on grievances, a set of community engagement rules for contractors, and support for several vocational development and agricultural skills initiatives.
In 2020, with the completion of the sale of our remaining stake in the operations, our emphasis was to manage the transfer of our pre-existing programmes and teams to the new owner, Perenco, in order to ensure consistency and resolve legacy issues.
In-country value
% Spend on Local Goods and Services*
53%(US$456M)
18 31
19 41
20 53
* Non-JV Projects
Key project jobs (’000)
41,00018 77.5
19 57.0
20 41.0
Generating economic value in-country Wherever Petrofac operates, we are committed to creating shared value, by supporting local supply chains, employing local people, developing local capabilities, and stimulating local economies.
As well as being the right thing to do, we see the creation of in-country value (ICV) as a source of competitive advantage, helping us to bid on challenging projects, keep costs down, improve the quality and availability of local suppliers, and build stronger relationships with local stakeholders.
Alongside shareholder and client value, we recognise ICV to be one of the core outcomes of our business model. We therefore aim to make a positive and measurable contribution to the economies in which we operate.
In 2020, we continued to enhance and formalise our related initiatives, and align our local employment, training and development, and procurement programmes with the ICV priorities of our clients and other national stakeholders.
Our approach to ICVWe continue to procure a large proportion of goods and services from local vendors and suppliers, support a significant number of local jobs, and work to enhance the capabilities of local people. While some governments require us to do this, we typically go beyond our contractual and regulatory obligations regarding local content.
Supporting local economiesIn 2020, just taking into account our major non-joint venture projects (as listed on page 72), where we have direct control over procurement and subcontracting, we purchased almost US$456 million worth of goods and services, and supported around 41,000 jobs at our project sites.
The proportion of locally-sourced goods and services, increased to 53% in 2020, up from 41% in 2019. This reflects our efforts to maximise our support of local supply chains, build and utilise capacity of small and medium-sized enterprises (SMEs) and stimulate local economies.
Indicative examples from across our core geographies include:
—Oman In Oman, where we have worked on many of the Sultanate’s most significant oil and gas assets and partnered with the Oman Oil Company on establishing the prestigious Takatuf Petrofac Oman (TPO) training centre, our formal ICV programmes have been running for many years. We have a dedicated ICV management team in place, and continue to increase and quantify our impact.
In selecting sub-contractors, we give priority to local providers and provide formal support to SMEs. In 2020, we placed orders worth around US$100 million with Omani vendors, and spent almost US$120 million with Omani SMEs. We also aim to provide high quality employment opportunities to Omanis. To support the Duqm refinery project, for example, we provided local and international scholarship programmes to 45 Omani students.
In 2020, although the COVID-19 pandemic brought significant disruption to our Omani operations, we nonetheless increased our ICV contribution over 2019. With projects such as Duqm and Ghazeer reaching the construction and commissioning phases, manpower levels increased, along with support and additional contracts for Omani sub-contractors and SMEs.
As a demonstration of our commitment to ICV, Petrofac was recognised with the Best Practice Award in the ‘Omani Products and Services’ category at the Oman Society for Petroleum Services (OPAL) Awards in November 2020.
Petrofac Limited | 2020 Annual report and accounts50
Strategic report

This award highlighted our collaboration with a Salalah-based company, Dhofar Structures and Iron Industries, as part of our Salalah LPG extraction project in southern Oman. As a result, the company was able to increase its capacity by 300%, hire an additional 30 Omani employees, strengthen its safety culture, and extend its operations outside of the Salalah region.
— Algeria Petrofac’s commitment to Algeria is indicated by the scale and nature of our in-country operations. A full-service engineering centre in Algiers is supplemented by a busy operations hub in Hassi Messaoud, plus project sites in Tinrhert and Ain Tsila. We also operate the Hassi Messaoud Construction Skills Training Centre, although this was closed for much of 2020 due to the COVID-19 pandemic.
For 2020, more than 85% of the total workforce were Algerian nationals, and around 60% of goods and services were sourced from locally-based subcontractors and suppliers.
— UAE Our UAE operational centres in Sharjah and Abu Dhabi are home to around 2,000 employees and a significant part of our heritage is closely associated with the Emirates. As well as working on a number of large local oil and gas projects, we also execute large-scale fabrication works in the UAE and export fabricated goods for clients based in other countries.
We have a significant, national five-year ICV programme in place, which covers the value of goods and services sourced from locally-based businesses, the number and quality of jobs held by UAE nationals, and the investment in-country. Our performance across these criteria are progressing well year-on-year and we foresee an improving ICV score.
—Russia Our Russian operations are concentrated on Sakhalin island, where we have an operations office and a technical training centre, as well as a site office for Sakhalin Energy’s onshore processing facility project. In 2020, almost 75% of goods and services were sourced from locally- based providers and around 35% of the total workforce were Russian nationals.
Making a significant contribution to public financesThrough the taxes we pay, Petrofac makes a significant contribution to the public finances of the local economies in which we operate.
The total amount paid to governments in 2020 was US$213 million, comprising corporate income tax, employment taxes, and other forms of tax and social security contributions.
Priorities for 2021We will continue to strengthen our ICV programmes in 2021, extending our collaboration with local communities, supply chains and governments to nurture and grow sustainable economies and create shared value.
Where there is not a mature local supply chain, we will continue to work to build capacity and connect SMEs with main project subcontractors and suppliers to facilitate successful partnerships.
We aim to extend the good practice model developed in Oman across other relevant geographies, targeting the recruitment of local country managers for country offices, maximising our sourcing of local goods and services, while focusing on developing and training our young local national employees with the leadership and technical skills for the future.
Meanwhile, within Petrofac, we aim to build teams that are more representative of the communities we serve. This includes further increasing the national diversity of our workforce and leadership to better reflect the countries in which we operate.
Ghazeer and the creation of in-country valueAlthough the principle of ICV applies everywhere, its implementation is probably at its most mature in Oman, where Petrofac agrees ICV targets with all its clients.
In the case of the Ghazeer Phase 2 project, bp had initially set a demanding ICV target of US$275 million, equating to around a third of the total project value. By the time we handed over the new facility in 2020, the true ICV had exceeded US$311 million – around 13% more than originally anticipated.
“The more we can work with local suppliers, the better it becomes,” explains Project Manager Alok Agarwal.
“We save on shipping, we increase control, we build local capacity and, in the case of large components, we can also get more prefabrication done offsite, which helps with the speed and safety of construction.”
For the future, it means that Petrofac can call on more local capacity and experience. As well as benefiting from significantly-sized contracts, several local firms have been able to add to their credentials and capabilities.
Read full storyin Petrofacts
Strateg
ic repo
rtG
overn
ance
Finan
cial statemen
ts
51Petrofac Limited | 2020 Annual report and accounts

Human rights
Respecting human rights across our supply chain We strive to protect and respect human rights throughout our business operations and extended supply chain. Our commitments are set out in our Code of Conduct, and we work in accordance with our Social Performance Framework, the UN Guiding Principles on Business and Human Rights, and the Fundamental Conventions of the International Labour Organization (ILO). We are also proud of our long-term commitment to the United Nations Global Compact and disclose annually our progress against its Ten Principles.
However, we acknowledge that the nature of our global operations and the type of geographies we work in at times present human rights risks. Our main exposure to these issues is in the extensive supply chains of our large EPC projects, particularly the labour practices of some of our subcontractors and the recruitment agents and brokers they use.
Each year, we assess our operations for human rights issues and take a risk-based approach to addressing any incidents of modern slavery related to forced and bonded labour, worker welfare infringements and other labour rights abuses. This review is detailed in our annual Modern Slavery Statement, published in accordance with the UK Modern Slavery Act 2015, which outlines the steps taken to enhance our corporate responsibility to respect human rights.
In 2020, there were no incidents of modern slavery or human rights violations reported through our auditing or internal incident reporting mechanisms.
Embedding human rights in our Code of ConductIn 2020, our priority was to raise awareness among our employees and supply chain of our updated Code of Conduct, which set out our expectations on human rights protections. This was particularly important given the COVID-19 pandemic which acted as a ‘stress-test’ for our social contract with many of the vulnerable stakeholder groups within our value chain.
Building capacity to ensure compliance We continued to innovate and improve, completing enhancements to the labour rights screening process within our vendor management system. This process is now fully automated, with 100% all vendors and suppliers screened against human rights criteria when pre-qualified, and required to read and commit to Petrofac’s Labour Rights and Worker Welfare Standards.
We also continued the process of screening those third parties already registered on the system and yet to be selected for prequalification, and completed 1167, equating to 40%, in 2020. As a result of the screening, a small number of vendors were red-flagged for enhanced due diligence. Where issues are found, we work with third parties to improve their understanding of our Standards, and support their efforts to comply fully.
Collaborating across the industryWe also continued to share good practice through our engagement with industry and other stakeholders, such as the Building Responsibly Group of engineering and construction companies.
However, our activities in this area were limited in 2020, as resources were diverted to address the immediate impacts of the COVID-19 pandemic. At a number of our sites, where demobilised subcontractor personnel found themselves unable to travel, our efforts were focused on providing accommodation, food and welfare, and helping the affected companies to get their people home safely.
Addressing security and human rights risksTo enable respectful relationships between our security providers, our workforce, and the local communities we work in, we operate in accordance with the Voluntary Principles on Security and Human Rights. Adherence to these Principles is a prerequisite in our selection of security providers. We provide awareness training to staff and third parties to help improve the way we work, and we review performance to assure compliance with the Principles and Petrofac’s Security Management Framework.
To broaden our oversight of labour rights and worker welfare performance, we are also integrating social performance into the Group HSSEIA compliance assurance programme.
Environmental, Social and Governance continued
Petrofac Limited | 2020 Annual report and accounts52
Strategic report

GovernanceWhy it is important to our business model and strategy
Responsible governance and ethical business practice are critical considerations for Petrofac.
As a key stakeholder and a significant part of the supply chain in the industries and countries in which we operate, we must uphold the highest standards of integrity, transparency and trust. We therefore recognise the responsibility and opportunity we have to enable and embody ethical behaviours. We take this commitment seriously and continue to invest in our people and processes to ensure that we live up to it.
Continuing to invest in our compliance functionOver recent years, we have invested considerably in our compliance function, and this process continued during 2020. At the start of the year, we launched our revised Code of Conduct which sets out our expectations of everyone who works for and with Petrofac. We also enhanced the compliance team, with new senior-level appointments; we made it easier for any employee to Speak Up about suspected breaches of the Code of Conduct; and we worked harder to embed a commitment to compliance across the business.
The aim is that everyone connected to our business lives up to the same high standards of ethical behaviour. If anyone has any concern that our Code of Conduct is not being followed, we want to make it easy for them to Speak Up, without any fear of reprisal or retaliation. And we want any such allegation to be effectively investigated and acted upon.
Our performance
Alleged breaches of the Code ofConduct reported via Speak Up
57
Proportion of employees, with line management responsibility, who completed mandatory Code of Conduct e-learning
99.3%
Number of substantiated allegations
12
18 81
19 61
20 57
19 97.9%
20 99.3%
18 N/A 18 27
19 24
20 12
Proportion of employees who completed mandatory eLearning
98.9%
Number of employees facing discipline or dismissal following substantiated allegations
8
Number of employees attending training conducted by the compliance team
88718 N/A
19 99.2%
20 98.9%
18 N/A
19 N/A
20 8
18 N/A
19 N/A
20 887
(Share Dealing Code, Standard for the Prevention of Bribery & Corruption, Code of Conduct)
(Code of Conduct, trade compliance, investigations)
Proportion of employees who completed an annual declaration confirming their compliance with the Petrofac Code of Conduct
100%18 100%
19 99.7%
20 100%
Material SDGs
Read how we contribute to these SDGs through our ethical and governance programmes.
Strateg
ic repo
rtG
overn
ance
Finan
cial statemen
ts
53Petrofac Limited | 2020 Annual report and accounts
Ethical behaviour and compliance
Enhancing the compliance functionIn 2020, we continued to enhance the Group compliance function, with a restructure of the team to reflect our areas of emphasis: communication and training, trade compliance, evaluation and monitoring, due diligence, investigations, systems and processes, and contracts compliance.
We also made a number of new appointments, including the recruitment of three seasoned, senior-level specialists: a new Investigations Director, a Trade Compliance Manager and a Due Diligence Manager.
As part of the functional restructure, we also selected a number of compliance focal points. These are senior compliance team members who, aside from their day-to-day operational responsibilities, have a remit to work closely with the leadership team of a given business unit, act as a champion for compliance, and provide support and problem-solving advice.
Relaunching the Code of ConductFollowing an extensive review process in 2019, our revised Code of Conduct was rolled out from the start of 2020. Available in electronic and printed formats, this has so far been produced in Arabic, English, French, Hindi, Malay, Russian, Spanish, Thai and Turkish.
To reflect its importance, this revised Code of Conduct was given a high-profile launch led by the Group Chief Executive, the Chairman, and key members of the global leadership team (see case study on page 55). From June 2020, to help embed the Code of Conduct further, we introduced a mandatory e-learning programme for everyone with line-management responsibility and achieved a 100% completion rate by September 2020. From February 2021, we rolled out a further e-learning programme for all other employees, available in English, Arabic and Russian.
Making it easier for Employees to Speak UpIt is vital that everyone working with or for us is able to raise any concerns which they might have without fearing retaliation, and have the option to do so anonymously.
Another significant development for 2020 were the improvements we made to our Speak Up tool, which is how employees, contractors, suppliers and customers and any other third parties can report any breach or suspected breach of our Code of Conduct, policies, standards, procedures or local laws. To make it easier to report any such concerns, the hosting of this service was transferred to another independent third party (Navex) which operates a more user-friendly platform and allows for more interaction with reporters. It is available in six languages: Arabic, English, French, Hindi, Russian, and Thai.
To launch the new Speak Up service, our newly appointed Investigations Director first presented it to the executive leadership team, who gave it their full support. It was then rolled out across the Group through an all-employee message from the Group Chief Executive, and training of key stakeholders, including members of the compliance and human resources teams.
Going forward, an additional training programme is planned for 2021, targeting mid-level managers to promote more of a Speak Up culture. This will be reinforced by a separate training programme for all other employees. To address any remaining reticence, we introduced a standalone Non-Retaliation Policy in 2021.
Enhancing communications and trainingWith a dedicated resource in place, the compliance team has been stepping-up its wider communications and training activities, with a number of new initiatives in place to supplement the mandatory training programmes.
While some limited face-to-face training was delivered as part of the launch of the revised Code of Conduct, the COVID-19 pandemic forced us to adapt our approach. We have since progressed our training plan virtually, using either Zoom or Microsoft Teams and, in some cases, over the telephone. In addition, a new Trade Compliance Procedure and associated training was delivered to more than 700 employees.
Continuing priorities for 2021For 2021, we will continue to enhance our approach. Plans include the launch of a new due diligence platform, increased emphasis on compliance evaluation and monitoring, greater alignment with the business through Compliance Review Boards, further development of a new compliance risk assessment tool, and an update to our standard for the prevention of bribery and corruption.
Tax transparency
Ensuring tax compliance and increasing tax transparency continue to be priorities for governments, regulators and businesses. We therefore continue to monitor regional and global best practice, maintain membership of industry groups, and follow and provide input into tax policy development.
Our tax strategy and tax policy explain how we approach the management of our tax affairs (these are available for download on www.petrofac.com).
The total amount that we pay in taxes is not limited to the corporate income tax disclosed within the financial statements. It also includes employee and employer taxes and social security payments, VAT and sales taxes, and other taxes such as withholding, property and other indirect taxes. The total amount paid by Petrofac to governments worldwide includes those taxes which are borne by Petrofac, as well as taxes collected by Petrofac, but which are recoverable from tax authorities or clients and supplies. VAT and sales taxes are shown on an accruals basis.
Environmental, Social and Governance continued
Petrofac Limited | 2020 Annual report and accounts54
Strategic report

Case study:
Code of Conduct: getting the message across, and making it stickA key moment for Petrofac in 2020 was the global launch of our revised Code of Conduct.
The Code of Conduct sets out our expectations of everyone who works for and with Petrofac. It was given an extensive review in 2019, with a view to making it simpler to understand, linking it to the full range of Petrofac policies, standards and processes, and using it as a tool to guide and inform the way that decisions are made across the business. It rests on three guiding principles:
1. Own – emphasising that our ethical integrity is the responsibility of every Petrofac employee and business partner
2. Discuss – encouraging open and frank discussion of any issues or uncertainties with, for example, colleagues, management, Human Resources, the Compliance Team, or Internal Audit
3. Record – insisting that the business keeps accurate and complete records of all its dealings, to demonstrate why and how decisions are made
In January 2020, the new Code of Conduct was introduced to the business via a live global webcast coinciding with the first Board meeting of the year, which provided the opportunity for all Board Directors to attend. The event was led by the Group Chief Executive, together with the Chairman, and Chief Operating Officers of both E&C and EPS. A recording was then made available to all employees.
A central message was that the Company expects behaviours and decision-making to be consistent. Irrespective of geography or circumstance, we always insist on identical high standards, with one Petrofac way of behaving. To ensure the message is understood and acted upon, mandatory training programmes have been developed and rolled out for all employees.
Strateg
ic repo
rtG
overn
ance
Finan
cial statemen
ts
55Petrofac Limited | 2020 Annual report and accounts

Environmental, social and governance Performance tables
Environmental
2020 Priorities 2020 Performance 2021 Priorities
Launch the new Environmental Toolkit across the Group and roll out an online environmental data collation tool
The Environmental Toolkit and online data collation tool were successfully launched
Embed the tools to enhance our waste reporting
Develop a methodology for assessing the potential for introducing renewables in future projects
Implement solar-diesel hybrid power generation system onto any new projects that meet the criteria
Group-wide initiatives for introducing renewable energy were progressed within each business unit
A suitable project to pilot hybrid power generation was reviewed
Develop a Group-wide standard to outline requirements for energy efficiency and renewable energy use
Raise awareness of UN SDG 14 (Life below water), promoting initiatives to prevent and significantly reduce marine pollution
Initiatives were progressed and publicised across the Group – such as the installation of the BorWin3 platform
Develop a Groupwide programme to reduce single-use plastics in our supply chain and reduce plastic waste
Work towards TCFD compliance, including the completion of climate scenario analyses
Climate risk and opportunity reviews were undertaken (including scenario analyses) and a TCFD disclosure completed
Develop a climate response report detailing the output of the TFCD programme
Fully integrate TCFD climate-related financial disclosure into risk and governance processes
Initiate our journey towards carbon neutrality, and create awareness of the subject across the Group
Build on our CDP ‘B’ rating and further improve our disclosure
We committed to achieving carbon neutrality by 2030, and built awareness across the Group
Our CDP ‘B’ rating was successfully consolidated
Develop and launch a Net Zero strategy, interim targets and implementation plan
Build on our CDP ‘B’ rating and further improve our disclosure
Develop sustainability plans for each of our main offices (including initiatives that support improvements in energy efficiency and the reduction in single-use plastics)
Promote circular economy initiatives in our projects and operations
Raise further awareness of the UN Sustainable Development Goals through a programme of monthly themed initiatives
Sustainability initiatives were launched across our offices. We drafted a guidance document and circulated to our offices, but further progress was delayed due to the Covid-19 pandemic and transition to remote working
Circular economy initiatives were progressed and work on a delivery strategy commenced on some projects and operations
The original plan was superseded by the launch of our new sustainability strategy (which includes reference to the UN SDG aligned initiatives)
Progress with the original goal of developing site-specific sustainability plans at each of our main offices
Develop a more formal Group-wide approach to circular economy projects
Continue to raise awareness of our sustainability strategy, including the alignment with the SDGs
Social – People2020 Priorities 2020 Performance 2021 Priorities
Continuous improvement on employee engagement, including through use of PetroVoices and the Petrofac Workforce Forum
Both PetroVoices and the Petrofac Workforce Forum helped us improve engagement – particularly in the face of the COVID-19 pandemic
Complete
Three further Leadership Excellence events are scheduled for early 2020
The Leadership Excellence programme was migrated online
Complete
Continue with the Graduate Development Programme in 2020, with the planned recruitment of around 130 graduates from key operation locations
Due to the challenges faced across the oil and gas sector, the graduate recruitment was paused
Complete
Bring more transparency for employees on how our processes work, career paths, succession planning, compensation and performance management
Good progress was made through the new digital platform and provides an enabler for future development
Draw on the new digital tools and platform to develop more of a performance culture across the Group
Petrofac Limited | 2020 Annual report and accounts56
Strategic report

Social – People continued2020 Priorities 2020 Performance 2021 Priorities
Make progress on gender diversity, including appointing more women to middle and senior management positions, and on delivering more diversity and inclusion training for our management
A comprehensive diversity and inclusion strategy was put in place
Complete
Improve HR efficiency through the establishment of a Shared Service Centre in Chennai, including greater use of technology, more employee- and manager-self-service of HR services
The Shared Service Centre was established and all HR systems migrated to a single consistent platform
Creating a Global Recruitment Centre of Excellence as part of the Shared Service Centre in Chennai
Establish a new Global Mobility Framework
Social – Safety and asset integrity
2020 Priorities 2020 Performance 2021 Priorities
Development and roll out of an HSSEIA data collection and reporting tool, and a new incident reporting system
The plans were delayed. However, a full functional specification was developed
To progress to the development and roll out of the tool
Full transition to Life Saving Rules (LSR) with roll-out of e-learning and embedding new requirements in the corporate assurance programme
The LSR e-learning is now mandatory for all Petrofac employees, with videos available in English, Hindi, Russian and Arabic
The LSR principles will be further embedded through hands-on training at project sites, and related videos developed in multiple languages will be shared with all key partners and subcontractors
Development and roll-out of a Safety Companion online tool
The online tool was successfully developed and introduced
This tool will be rolled-out more widely from the start of 2021, with webinars for all HSSE personnel
Extend the roll-out across the Group, embedding the discipline behind the last-minute risk assessment
The principles behind the last-minute risk assessments were reinforced via a Hazard Hunt (hazard identification) programme globally
The emphasis on conducting risk assessments prior to commencing and tasks will be extended through an intervention and behavioural check programme
Monitor the effectiveness of the Asset Integrity Audit Programme, and increase engagement among asset operating teams
There were good levels of engagement from operating teams, especially since several audits had to be conducted remotely
Delivery of the digital platform for audits, including links to big data
Extend the new asset integrity KPI dashboard across the Group
Progress was hampered by the COVID-19 pandemic
Continue to extend the new asset integrity KPI dashboard across the Group
Social – Security and crisis management performance
2020 Priorities 2020 Performance 2021 Priorities
Continue to enhance and promote the Security Companion as a one-stop-shop for all security related matters
The tool continued to be enhanced, and a programme of webinars was run to draw attention to security issues and advise on the use of the tool
Review the post-pandemic security environment and implement appropriate security measures and programmes
Social – Community engagement 2020 Priorities 2020 Performance 2021 Priorities
Place the remaining 46 enrolled PARFI candidates in paid apprenticeships
Initiate PARFI vocational training programmes for a further 200 young people
Undertake social performance reviews of programmes launched in 2019 to assess their effectiveness
Remaining PARFI candidates were placed in paid apprenticeships
Additional PARFI training programmes were commenced for an additional 150 young people
The social performance programmes were broadened to put more emphasis on gender diversity
Provide support for the Kaushal College in Jharkhand, to provide a one-year catering course for disadvantaged young women
Strateg
ic repo
rtG
overn
ance
Finan
cial statemen
ts
57Petrofac Limited | 2020 Annual report and accounts

Environmental, social and governance Performance tables continued
Social – Community engagement continued2020 Priorities 2020 Performance 2021 Priorities
Develop mechanisms in collaboration with stakeholders to address and resolve legacy social issues
By supporting legislative changes, legacy issues relating the vandalism were largely resolved
Complete
Effective handover of social programmes as part of the agreed sale of our Mexican assets
Social programmes, premises and personnel were handed over to Perenco
Complete
Finalise user acceptance tests and roll-out of social investment due diligence screening module
System configuration anomalies identified during testing have resulted in postponement of the module roll-out to 2021
Roll out the enhanced due diligence module
Social – In-country value
2020 Priorities 2020 Performance 2021 Priorities
ICV programmes in place in all main countries, including localisation plans to target the recruitment of country managers, local training and capacity building, and a progressive year-on-year increase in retained value
A national ICV programme is in place in UAE. In all other main countries, ICV disciplines are universally applied, and project-specific plans are in place
Enhance the Group ICV strategy, plan and process of assessment, promoting better alignment with evolving national objectives
Enhance consistent integration of ICV into business development, contract strategy/delivery and external communications
Establish a ‘community of practice’ to develop ICV good practice notes, implementation guidance, and tools
We plan to support further supply chain engagement events connecting SMEs with main project subcontractors/suppliers to facilitate successful partnerships, scope delivery and SME development
In various countries, we have trained sub-contractors in the use of e-tendering platforms, as well as engaging with local SMEs and exploring the opportunities where their provided services can be leveraged
Continue to support local SMEs and facilitate their engagement with main sub-contractors
Progress training and development of local Omani engineering SMEs in Petrofac systems, procedures and optimised engineering processes
Support routinely provided to Omani engineering SMEs, exposing them to best practices, and encouraging them to develop their own capabilities
Maintain focus on expanding our ICV in core countries
Social – Human rights
2020 Priorities 2020 Performance 2021 Priorities
Extend coverage of labour rights and worker welfare audits by integrating social performance into the Group HSSEIA compliance assurance programme
Integration of social performance into the Group assurance programme commenced, although operational disruptions and organisational changes prevented us from completing this work
Complete the implementation of the assurance programme, including auditor training
Continue to extend the awareness and training programme, completing sessions on all new E&C projects
Training and awareness sessions undertaken with project supply chain teams in the UAE
Extend training to Group HSSEIA compliance assurance teams
Join Business & Human Rights Resource Centre Modern Slavery Registry to allow benchmarking of practice and drive performance improvement
Modern slavery statement posted to BHRRC Modern Slavery Registry
Review BHRRC guidance and resources to benchmark current practice and enhance 2021 MSA reporting
Formalise our involvement with the Building Responsibly Initiative
Progress collaboration with industry peers and present progress at industry forum/stakeholder event
Collaboration with industry partners and the Building Responsibly Group continued, including sharing the lessons from our COVID-19 response
Foster peer-to-peer learning across industry and supply chain to support development of shared good practice
Petrofac Limited | 2020 Annual report and accounts58
Strategic report

Governance
2020 Priorities 2020 Performance 2021 Priorities
Launch and roll out the revised Code of Conduct, and seek to further embed it in the culture of the Group
Revised Code of Conduct launched and rolled out in January 2020
Mandatory e-learning module introduced for employees at Grade 18 and above, with a 100% completion rate by September 2020
Mandatory e-learning module developed for employees at Grade 17 and below
Face-to-face training curtailed due to Covid-19, but replaced by virtual training
Continue with training and communications programmes
Launch and roll out of mandatory e-learning module for employees at Grade 17 and below
Roll out a Code of Conduct e-learning refresher as an annual requirement
We will continue to invest in and enhance the Group compliance function
New and improved Speak Up service launched and rolled out
Three seasoned compliance professionals recruited (Trade Compliance Manager, Due Diligence Manager and Investigations Director)
Additional on-the-job training for the entire compliance team
Compliance focal points introduced for each Business Unit
Revamp the due diligence system and introduce a new platform
Enhance and optimise the gifts and entertainment and conflict of interest systems
Continue training and development of compliance resources
Focus on Trade Compliance management New Trade Compliance Manager recruited.
Trade Compliance Procedure and associated training delivered to 700 employees
Launch and roll out Trade Compliance procedures in relation to Hand Carry and the US recusal programme
Continue to enhance and optimise the due diligence process
New Due Diligence Compliance Manager recruited
System-level controls put in place to ensure transactions can only be conducted after valid due diligence
Process streamlined to reduce the time taken to conduct a due diligence review
Transition to a new due diligence platform
Migrate data from the compliance portal into the new due diligence platform
Deliver training on the new due diligence platform
Continue to focus on the quality of due diligence reports and the timeline for delivering them
Progress with training plans, including mandatory e-learning on the revised Code of Conduct, in addition to new training on the reporting of allegations
Training delivered to key stakeholders on the new and Speak Up platform
Mandatory e-learning on the revised Code of Conduct delivered to 100% of employees at Grade 18 and above
Launch and roll out mandatory e-learning on the revised Code of Conduct for employees at Grade 17 and below
Training and communications plan in place for 2021, with a focus on targeted training for agents, mid-management, and employees in high-risk countries
Compliance monitoring will continue to cover all new projects
The decision was taken to replace compliance monitoring with Compliance Review Boards
Implement Compliance Review Boards in collaboration with the business
Continue to extend cyber-security, with a focus on further protection for our cloud platform and data lakes, application security, and single sign-on authentication for all our legacy applications
All planned initiatives were implemented, including multi-factor authentication for legacy applications, and enhanced protection for our cloud platform, and data lakes
More attention will shift to the Company’s wider digitalisation programmes, with cyber-security support provided to ideation and development teams
Follow progress of digitalisation of tax administration and continue to monitor changes to international tax system
New enterprise planning system designed to digitalise and automate future tax reporting
OECD Base Erosion and Profit Shifting (BEPS) project activity and country specific legislative developments monitored
Enhance and optimise tax control framework to achieve strong tax risk management, internal controls and tax processes
Strateg
ic repo
rtG
overn
ance
Finan
cial statemen
ts
59Petrofac Limited | 2020 Annual report and accounts

Risk management
Our risk management framework provides us with a consistent approach to identify, manage and oversee the risks that may impact our business. Effective risk analysis and response underpin our ability to achieve our objectives and assess opportunities as our business evolves.
During 2020, we built on our earlier achievements, by embedding our revised framework in core business processes, enhanced ‘deep dives’ for each of our principal risks, and aligned risk management with our proposal and project management processes.
Risk governancePetrofac’s system of risk governance comprises several committees and management processes which bring together reports on the management of risk at various levels.
The Group Risk Committee (GRC) is responsible for the oversight of the Enterprise Risk Management framework agreed by the Board, including review of Group policies and the management of the Group’s Delegated Authorities. The diagram below sets out the risk governance framework, showing the interaction between the various risk review and management committees.
In addition to the Group’s regular risk review meetings, the Group Executive Committee meets regularly to discuss safety, compliance, operational, commercial and finance matters, with changes in risks and opportunities being identified and addressed as appropriate.
Risk Governance framework — Sets risk appetite — Approves principal risks — Reviews and approves significant opportunities
Board
— Reviews principal risks, emerging risks and risk appetite
— Provides assurance on risk management and internal controls framework
Audit Committee
— Oversight of the Enterprise Risk Management Framework, including the principal and emerging risks and risk appetite
— Reviews and recommends significant opportunities
Group Risk Committee
— Divisional management oversight and review of opportunities Divisional Risk Review Committees
— Risk management is embedded within each service line Service lines
— Assurance to management, Audit Committee and the Board Group functions Internal audit
Identifying and managing risks and opportunities is key to the successful delivery of our strategy. We operate in challenging environments and understand that risks are an inherent part of our business.
Our knowledge and insight, coupled with the right set of tools, help us understand the factors that lead to risk and allow us to manage them effectively.
Petrofac Limited | 2020 Annual report and accounts60
Strategic report
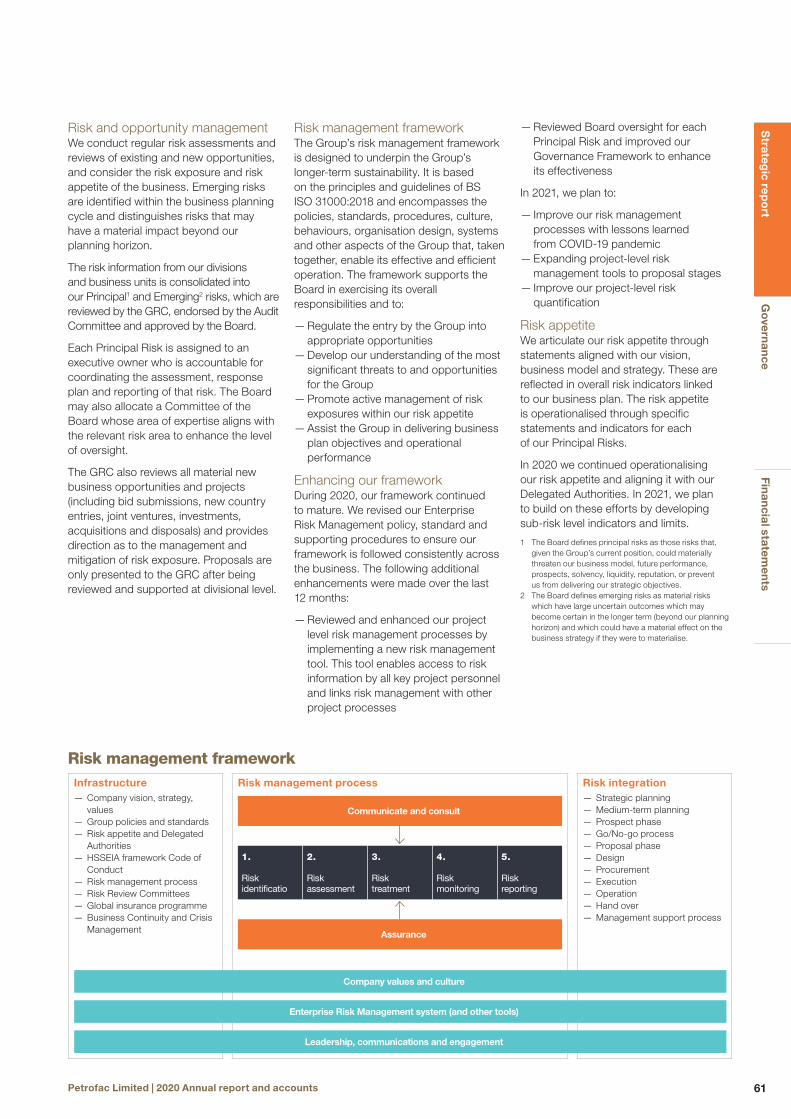
Risk management framework The Group’s risk management framework is designed to underpin the Group’s longer-term sustainability. It is based on the principles and guidelines of BS ISO 31000:2018 and encompasses the policies, standards, procedures, culture, behaviours, organisation design, systems and other aspects of the Group that, taken together, enable its effective and efficient operation. The framework supports the Board in exercising its overall responsibilities and to:
— Regulate the entry by the Group into appropriate opportunities — Develop our understanding of the most significant threats to and opportunities for the Group — Promote active management of risk exposures within our risk appetite — Assist the Group in delivering business plan objectives and operational performance
Enhancing our frameworkDuring 2020, our framework continued to mature. We revised our Enterprise Risk Management policy, standard and supporting procedures to ensure our framework is followed consistently across the business. The following additional enhancements were made over the last 12 months:
— Reviewed and enhanced our project level risk management processes by implementing a new risk management tool. This tool enables access to risk information by all key project personnel and links risk management with other project processes
— Reviewed Board oversight for each Principal Risk and improved our Governance Framework to enhance its effectiveness
In 2021, we plan to:
— Improve our risk management processes with lessons learned from COVID-19 pandemic — Expanding project-level risk management tools to proposal stages — Improve our project-level risk quantification
Risk appetiteWe articulate our risk appetite through statements aligned with our vision, business model and strategy. These are reflected in overall risk indicators linked to our business plan. The risk appetite is operationalised through specific statements and indicators for each of our Principal Risks.
In 2020 we continued operationalising our risk appetite and aligning it with our Delegated Authorities. In 2021, we plan to build on these efforts by developing sub-risk level indicators and limits.
1 The Board defines principal risks as those risks that, given the Group’s current position, could materially threaten our business model, future performance, prospects, solvency, liquidity, reputation, or prevent us from delivering our strategic objectives.
2 The Board defines emerging risks as material risks which have large uncertain outcomes which may become certain in the longer term (beyond our planning horizon) and which could have a material effect on the business strategy if they were to materialise.
Risk and opportunity management We conduct regular risk assessments and reviews of existing and new opportunities, and consider the risk exposure and risk appetite of the business. Emerging risks are identified within the business planning cycle and distinguishes risks that may have a material impact beyond our planning horizon.
The risk information from our divisions and business units is consolidated into our Principal1 and Emerging2 risks, which are reviewed by the GRC, endorsed by the Audit Committee and approved by the Board.
Each Principal Risk is assigned to an executive owner who is accountable for coordinating the assessment, response plan and reporting of that risk. The Board may also allocate a Committee of the Board whose area of expertise aligns with the relevant risk area to enhance the level of oversight.
The GRC also reviews all material new business opportunities and projects (including bid submissions, new country entries, joint ventures, investments, acquisitions and disposals) and provides direction as to the management and mitigation of risk exposure. Proposals are only presented to the GRC after being reviewed and supported at divisional level.
Risk management frameworkInfrastructure
— Company vision, strategy, values
— Group policies and standards — Risk appetite and Delegated Authorities
— HSSEIA framework Code of Conduct
— Risk management process — Risk Review Committees — Global insurance programme — Business Continuity and Crisis Management
Risk management process Risk integration — Strategic planning — Medium-term planning — Prospect phase — Go/No-go process — Proposal phase — Design — Procurement — Execution — Operation — Hand over — Management support process
Communicate and consult
1.
Risk identificatio
2.
Risk assessment
3.
Risk treatment
4.
Risk monitoring
5.
Risk reporting
Assurance
Company values and culture
Enterprise Risk Management system (and other tools)
Leadership, communications and engagement
Strateg
ic repo
rtG
overn
ance
Finan
cial statemen
ts
61Petrofac Limited | 2020 Annual report and accounts

Principal risks and uncertainties
The Group’s principal risks were reviewed and revised following the spread of the COVID-19 pandemic and at the end of 2020, drawing on feedback from the business, executive management and the Audit Committee. They were also benchmarked against our peers and good governance practice.
We have aligned our risk management processes and reported against our revised principal risks in 2020. Key changes made to our principal risks are described below.
No new emerging risks were identified in 2020. The Energy Transition emerging risk identified in 2019 has been embedded as a sub-risk under the principal risk ‘Failure to deliver strategic initiatives’.
Our systems of risk management and internal control are founded upon deployment of our Enterprise Risk Management Framework (based upon BS ISO 31000:2018), and our Internal Control Framework.
Details of these are included in the Audit Committee report on pages 96 and 99.
Key changes to our principal risks
Details
Reflecting the impact of the COVID-19 pandemic
COVID-19 pandemic continues to have a significant impact on our business. Following the review of our principal risks post the spread of the COVID-19 pandemic we have reworded the principal risk ‘Adverse geopolitical changes in key geographies’ to ‘Adverse geopolitical and macro-economic changes in key geographies’ to reflect the potential for a long-term global recession. The impact of the pandemic is captured through the following adjustments to our principal risk descriptions:
— ‘Low order intake’ to reflect the risk of COVID-19 outbreak and the subsequent impact on investments by our existing and potential clients — ‘Project and operational performance’ to reflect the risk to project delivery due to restrictions in manpower mobilisation, remote working practices, and delay/suspension in project execution due to supply chain issues — ‘HSSEAI incidents’ to reflect the COVID-19 related risks to health and safety of our employees, customers and service providers.
Rewording some principal risks to ensure consistency in our risk articulation
We have revised the wording of certain principal risks:
— ‘Poor operational and project performance’ to ‘Project and operational performance’ — ‘Non-compliance with laws, regulations and ethical standards’ to ‘Historic or future breaches of laws, regulations, and ethical standards’
The Group’s current principal risks are listed below:
Strategic risks Adverse geopolitical and macro-economic changes in key geographies
Low order intake Failure to deliver strategic initiatives
Operational risks Insufficient IT resilience Operational and project performance
HSSEIA Incidents
Financial risks Loss of financial capacity Misstatement of financial information
Legal and Compliance risks
Historic or future breaches of laws, regulations, and ethical standards
People risks Inadequate leadership and talent management
Petrofac Limited | 2020 Annual report and accounts62
Strategic report

Adverse geopolitical and macro-economic changes in key geographies Risk category: Strategic
The Group’s backlog is concentrated in the Middle East and North Africa, which may increase our vulnerability to adverse geopolitical events in the region. Recent global economic conditions have had an impact in countries whose economies are exposed to the downturn in commodities, placing greater pressure on governments to find alternative means of raising revenues and increasing the risk of social and labour unrest.
The impact of adverse geopolitical changes in our key geographies include risks to the successful delivery of our strategy, our operations and associated impact on margins, the safety of our people, security issues, material logistics, and travel restrictions.
Sub-risks — COVID-19 pandemic and subsequent reduced demand for hydrocarbons — Civil unrest — Recession and fiscal stress — Increased controls over trade and payments
Mitigation and managementThe Group Risk Committee and the Board actively monitor political developments and seeks to avoid or minimise our exposure to jurisdictions with risk levels beyond our appetite. A detailed risk analysis is conducted before entering any new country and while pursuing and executing projects in new geographies.
We have good experience in project execution and maintain positive relationships with key stakeholders. Careful consideration is given to contractual terms and security conditions through our detailed risk review process and we seek external advice on specialist issues as required.
The delivery model is modified to suit each project and we limit exposure to single sources of supply and service. We limit our fixed asset commitment within each contract and closely monitor and manage our cash flow and commitments.
Our Business Continuity Management System considers response to and recovery from geopolitical incidents. There is also continued focus on evacuation and emergency response and operations are assessed and executed in accordance with our security policy and security standards.
Risk appetite measures — Cash flow exposed to geopolitical risk
For more information see: pages 22-23; 44; 49-52 and 76
Assessment: No changeThe risk increased in 2020 as the risk has been broadened to cover the macro-economic impact of the global pandemic in our key geographies. More recently, it has reduced and is level with our last update as the shock caused by the pandemic gave way to a partial recovery with vaccines becoming more widely available.
Low order intake Risk category: Strategic
The risk is that our clients exercise capital discipline, which impacts the demand for our services through the cancellation or delay of planned investments. The potential impact is that the Group could fail to deliver its anticipated backlog and growth targets.
The Group wins most of its work through a competitive bidding process, and as competition increases, there is a risk that we could fail to maintain differentiated margins.
Sub-risks — Oil and gas industry downturn driven by lower oil price — Loss of key markets due to geopolitical/litigation/regulatory impact/SFO/ budgetary concerns — Increased competition in our core geographies/sectors — Reduced bidding competitiveness — COVID-19 pandemic and subsequent impact on investments
Mitigation and managementOur order intake is driven by our strategy, the development of which is overseen by the Board. Our service lines work together to identify, review and win opportunities. We regularly analyse our business development activities, bid-to-win ratios and our competition.
We responded to the reduced number of awards in all our key markets in 2020 by right-sizing our businesses and preparing Petrofac for a recovery by addressing client objectives such as increased in-country value and improving sustainability. Notwithstanding the challenging environment, we continued to secure new orders during 2020, including projects in Oman, the UK, and the Caspian region. We continue to focus on converting opportunities in target adjacent geographies and sectors. In the MENA region, our core market, we see a good pipeline of bidding opportunities for 2021. Tendering activity is picking up in response to a recovery in the oil price and increased capital investment by clients.
Risk appetite measures — Book-to-bill ratio
For more information see: pages 11 and 16-19
Assessment: IncreasedThe risk has increased since our last update as new awards in the industry have been delayed due to the COVID-19 pandemic and subsequent lower oil price and a weaker macro-economic environment. Developments in the SFO investigation has also impacted this risk.
Strateg
ic repo
rtG
overn
ance
Finan
cial statemen
ts
63Petrofac Limited | 2020 Annual report and accounts

Failure to deliver strategic initiatives Risk category: Strategic
Each of our strategic priorities is supported by various strategic initiatives that are overseen by senior management and the Board. To build enterprise value, we ensure each initiative is de-risked and respective success goals are met, assuring shareholders and opinion formers that we are pursuing an appropriate strategy capable of delivering shareholder value. The impact is reflected in the appetite for new investors to buy into the Group and consequently our valuation.
Sub-risks — Failure to right-size the business and achieve structural cost reductions — Failure to deliver transformation, digital and automation programmes — Failure to deliver new market access initiatives — Failure to deliver our Energy Transition Strategy — Failure to divest non-core assets
Mitigation and managementEach strategic initiative is governed by a stage-gate process and overseen by a formal Group level steering committee. The Board regularly assesses our strategic initiatives and overall strategic plan to satisfy itself that the right mix of risk, capability and reward is established. We conduct detailed sensitivity analysis to assess the robustness of our plans.
The GRC reviews all material new business opportunities and projects, new country entries, joint ventures, investments, acquisitions and disposals.
In a challenging environment, we continued to deliver our strategic initiatives in 2020. Specifically:
— Initiated a major programme to respond to the economic and industry downturn due to the COVID-19 pandemic and established a substantial business saving through these right-sizing initiatives — Enhanced our Energy Transition Strategy and established our ‘New Energy Services’ organisation to coordinate our efforts in this area —Continued to secure new orders in targeted ‘growth’ geographies such as the USA, Libya, and the Caspian region and new sectors that include wind, and well plugging and abandonment — Progressed our divestment plan, finalising the sale of our Mexican assets
Risk appetite measures — Initiative impact (cost, value) and schedule targets — Initiative specific success goals
For more information see: pages 7-9; 22-23; 31; 36-41 and 74
Assessment: No changeGood progress has been made in all our strategic initiatives.
Insufficient IT resilience Risk category: Operational
The Group’s performance is increasingly dependent on the ongoing capability and reliability of our IT platforms. We (as with all companies) continue to be exposed to external cyber-security threats.
Sub-risks — System breach due to malware attack — Unavailability/loss of data due to inadequate response/recovery — Cyber attacks — Network unavailability due to end-of-life devices — Compromise of user accounts through phishing and social engineering attacks — System unavailability due to legacy and unsupported applications and server infrastructure — Operational technology breach leading to operational disruption
Mitigation and managementWe operate a Group-wide information/cyber security programme and utilise a ‘cloud’ strategy to maintain a resilient IT platform. In 2020 we introduced a Global Security Operations Center, and focused on detecting and preventing exposures due to increased work from home arrangements.
Risk appetite measures — Number of significant cyber incidents — System resilience and access — Removal of legacy systems
For more information see: page 45
Assessment: No changeA number of initiatives were implemented during 2020 specifically to enhance our resilience in a ‘working from home’ environment.
Principal risks and uncertainties continued
Petrofac Limited | 2020 Annual report and accounts64
Strategic report
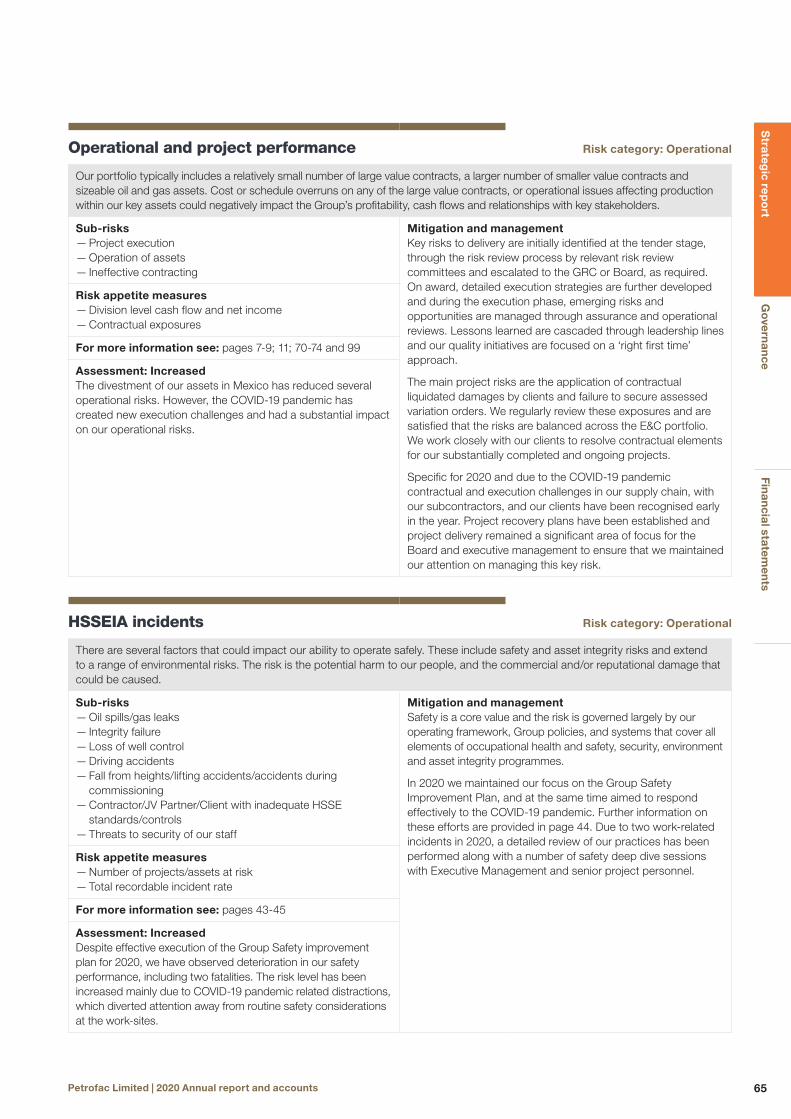
Operational and project performance Risk category: Operational
Our portfolio typically includes a relatively small number of large value contracts, a larger number of smaller value contracts and sizeable oil and gas assets. Cost or schedule overruns on any of the large value contracts, or operational issues affecting production within our key assets could negatively impact the Group’s profitability, cash flows and relationships with key stakeholders.
Sub-risks — Project execution — Operation of assets — Ineffective contracting
Mitigation and managementKey risks to delivery are initially identified at the tender stage, through the risk review process by relevant risk review committees and escalated to the GRC or Board, as required. On award, detailed execution strategies are further developed and during the execution phase, emerging risks and opportunities are managed through assurance and operational reviews. Lessons learned are cascaded through leadership lines and our quality initiatives are focused on a ‘right first time’ approach.
The main project risks are the application of contractual liquidated damages by clients and failure to secure assessed variation orders. We regularly review these exposures and are satisfied that the risks are balanced across the E&C portfolio. We work closely with our clients to resolve contractual elements for our substantially completed and ongoing projects.
Specific for 2020 and due to the COVID-19 pandemic contractual and execution challenges in our supply chain, with our subcontractors, and our clients have been recognised early in the year. Project recovery plans have been established and project delivery remained a significant area of focus for the Board and executive management to ensure that we maintained our attention on managing this key risk.
Risk appetite measures — Division level cash flow and net income — Contractual exposures
For more information see: pages 7-9; 11; 70-74 and 99
Assessment: IncreasedThe divestment of our assets in Mexico has reduced several operational risks. However, the COVID-19 pandemic has created new execution challenges and had a substantial impact on our operational risks.
HSSEIA incidents Risk category: Operational
There are several factors that could impact our ability to operate safely. These include safety and asset integrity risks and extend to a range of environmental risks. The risk is the potential harm to our people, and the commercial and/or reputational damage that could be caused.
Sub-risks — Oil spills/gas leaks — Integrity failure — Loss of well control — Driving accidents — Fall from heights/lifting accidents/accidents during commissioning — Contractor/JV Partner/Client with inadequate HSSE standards/controls — Threats to security of our staff
Mitigation and managementSafety is a core value and the risk is governed largely by our operating framework, Group policies, and systems that cover all elements of occupational health and safety, security, environment and asset integrity programmes.
In 2020 we maintained our focus on the Group Safety Improvement Plan, and at the same time aimed to respond effectively to the COVID-19 pandemic. Further information on these efforts are provided in page 44. Due to two work-related incidents in 2020, a detailed review of our practices has been performed along with a number of safety deep dive sessions with Executive Management and senior project personnel.
Risk appetite measures — Number of projects/assets at risk — Total recordable incident rate
For more information see: pages 43-45
Assessment: IncreasedDespite effective execution of the Group Safety improvement plan for 2020, we have observed deterioration in our safety performance, including two fatalities. The risk level has been increased mainly due to COVID-19 pandemic related distractions, which diverted attention away from routine safety considerations at the work-sites.
Strateg
ic repo
rtG
overn
ance
Finan
cial statemen
ts
65Petrofac Limited | 2020 Annual report and accounts
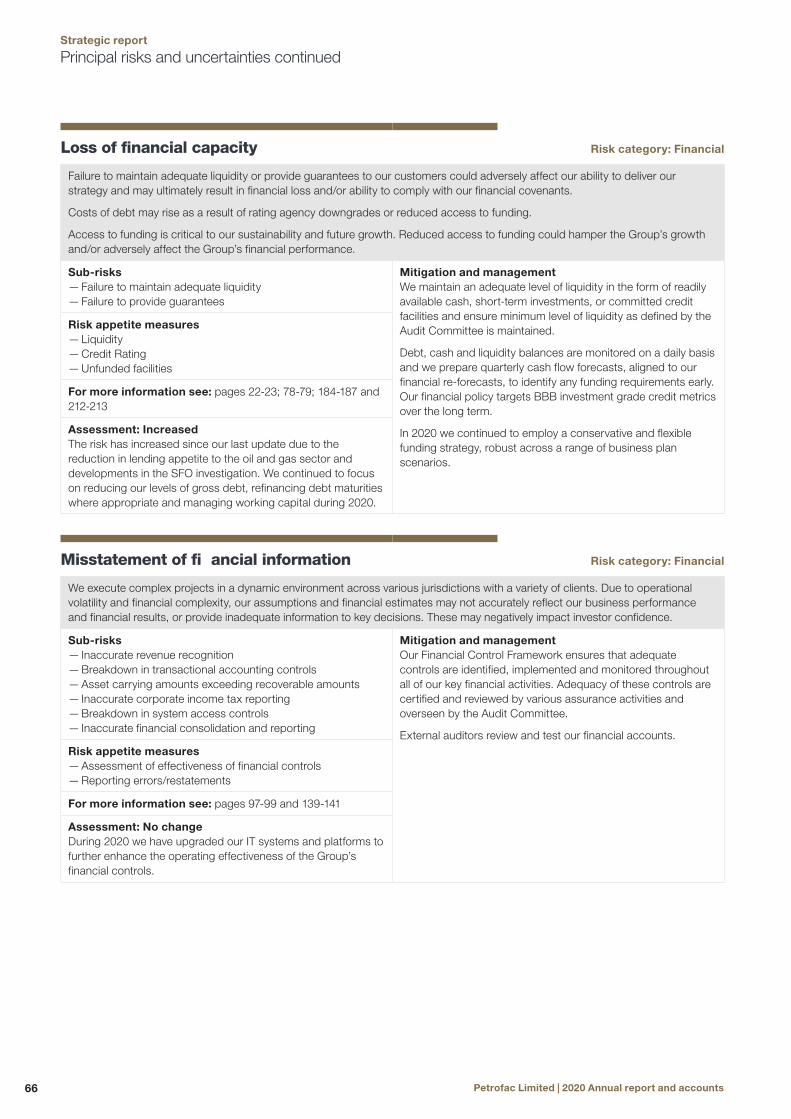
Loss of financial capacity Risk category: Financial
Failure to maintain adequate liquidity or provide guarantees to our customers could adversely affect our ability to deliver our strategy and may ultimately result in financial loss and/or ability to comply with our financial covenants.
Costs of debt may rise as a result of rating agency downgrades or reduced access to funding.
Access to funding is critical to our sustainability and future growth. Reduced access to funding could hamper the Group’s growth and/or adversely affect the Group’s financial performance.
Sub-risks — Failure to maintain adequate liquidity — Failure to provide guarantees
Mitigation and managementWe maintain an adequate level of liquidity in the form of readily available cash, short-term investments, or committed credit facilities and ensure minimum level of liquidity as defined by the Audit Committee is maintained.
Debt, cash and liquidity balances are monitored on a daily basis and we prepare quarterly cash flow forecasts, aligned to our financial re-forecasts, to identify any funding requirements early. Our financial policy targets BBB investment grade credit metrics over the long term.
In 2020 we continued to employ a conservative and flexible funding strategy, robust across a range of business plan scenarios.
Risk appetite measures — Liquidity — Credit Rating — Unfunded facilities
For more information see: pages 22-23; 78-79; 184-187 and 212-213
Assessment: IncreasedThe risk has increased since our last update due to the reduction in lending appetite to the oil and gas sector and developments in the SFO investigation. We continued to focus on reducing our levels of gross debt, refinancing debt maturities where appropriate and managing working capital during 2020.
Misstatement of fi ancial information Risk category: Financial
We execute complex projects in a dynamic environment across various jurisdictions with a variety of clients. Due to operational volatility and financial complexity, our assumptions and financial estimates may not accurately reflect our business performance and financial results, or provide inadequate information to key decisions. These may negatively impact investor confidence.
Sub-risks — Inaccurate revenue recognition — Breakdown in transactional accounting controls — Asset carrying amounts exceeding recoverable amounts — Inaccurate corporate income tax reporting — Breakdown in system access controls — Inaccurate financial consolidation and reporting
Mitigation and managementOur Financial Control Framework ensures that adequate controls are identified, implemented and monitored throughout all of our key financial activities. Adequacy of these controls are certified and reviewed by various assurance activities and overseen by the Audit Committee.
External auditors review and test our financial accounts.Risk appetite measures
— Assessment of effectiveness of financial controls — Reporting errors/restatements
For more information see: pages 97-99 and 139-141
Assessment: No change During 2020 we have upgraded our IT systems and platforms to further enhance the operating effectiveness of the Group’s financial controls.
Principal risks and uncertainties continued
Petrofac Limited | 2020 Annual report and accounts66
Strategic report

Historic or future breaches of laws, regulations and ethical standards Risk category: Legal and Compliance
Non-compliance with laws, regulations and ethical standards due to failures in our compliance controls or unethical behaviour, including but not limited to bribery, corruption, money laundering, trade sanctions and labour rights. These could result in fines and/or adverse impact on our reputation.
Sub-risks — Adverse impact of additional SFO action — Violation of laws and regulations, including: FCPA, UK Bribery Act; Whistleblower Protection; Trade Compliance; Modern Slavery Act; Anti-Money Laundering; Antitrust and Competition; and Data Protection (GDPR)
Mitigation and managementWe operate a Group level Compliance Programme overseen by the Compliance & Ethics Committee. We have continued to enhance this programme during 2020. Specifically, we have:
— Finalised establishment of a Groupwide compliance team with a highly qualified leadership team in Sharjah and dedicated engagement officers in each major operational centre — Invested in new technology integrated into our systems such as confidential reporting tool and due diligence screening tool — Conducted an independent review and subsequent regular audit process on the effectiveness of our compliance processes and culture — Enhanced our financial controls to ensure all third parties and vendors go through rigorous due diligence and approvals — Issued a Non-Retaliation Policy that details our commitment to fostering a safe Speak Up environment and protecting anybody who raises a concern in good faith
Risk appetite measures — Third-party due diligence — Employee completion of mandatory compliance training and annual declaration — Project compliance monitoring — Investigations of ‘Speak Up’ cases
For more information see: pages 4-6; 53-55; 94-101 and 105-106
Assessment: DecreasedRisk of a future breach is reduced due to improvements in our Compliance Programme.
The Company has reported in prior reports that in May 2017 the SFO had commenced an investigation into the activities of Petrofac, its subsidiaries and their officers for suspected bribery, corruption, and/or money laundering. This investigation remains ongoing. The existence, timing and amount of any future financial obligations (such as fines or penalties) or other consequences are unable to be determined at this time. Since the instigation of the investigation, shareholder confidence has been impacted resulting in a material fall in the market value.
Inadequate leadership and talent management Risk category: People
Our operations are heavily dependent on our ability to attract, retain and lead the right level of skilled and experienced personnel. Failure to do so could negatively impact our distinctive, delivery-focused culture, and prevent us from maintaining our operational capability and relationships with clients.
Sub-risks — Inability to attract and retain the capability necessary to deliver the business plan — Fragility in our succession planning for key roles as a result of retirements and other movements — Leadership fails to live our values and behaviours — Reduced performance of staff due to insufficient diversity and inclusion
Mitigation and managementThe Group’s organisational structure was revised in 2020, primarily relating to the organisation right-sizing initiatives as a result of reduced oil and gas industry activity. Diversity and Inclusion mandatory e-learning and Diversity and Inclusion week were launched in 2020 to increase awareness of the importance and benefits of a diverse and inclusive culture to the individual, the team and to Petrofac as a whole.
Based on our annual employee survey, we have seen improved scores in our key HR measures. The Workforce Forum meetings were conducted during 2020 to encourage employees to directly engage with Board Directors and senior management.
We remain confident that our policies to attract, retain, train, promote and reward our people are appropriate for the Group, and will enable us to meet our strategic goals.
Risk appetite measures — Results of employee surveys — Staff turnover — Diversity and Inclusion targets — Succession plans
For more information see: pages 42; 46-48 and 102-104
Assessment: No change Despite the impact of the COVID-19 pandemic on our people the overall risk level remains unchanged due to reduced uncertainty in our succession plans and improving diversity & inclusion practices.
Strateg
ic repo
rtG
overn
ance
Finan
cial statemen
ts
67Petrofac Limited | 2020 Annual report and accounts

Viability statement
In accordance with the requirements of the 2018 UK Corporate Governance Code (“the Code”), the Directors confirm that they have performed a robust assessment of the Group’s prospects and its ability to continue in operation and meet its liabilities as they fall due over the period of their assessment. In doing so, they have considered the Group’s current position and the principal risks and uncertainties that would threaten the viability of the business. The Group’s financial statements for 2020 are prepared on a going concern basis with no material uncertainties identified. Details of the Group’s risk governance and management framework and a description of its principal risks and uncertainties are included in the Strategic report on pages 60 to 67.
The key medium-to-long term factors affecting the Group’s prospects are:
— Oil price: the oil price environment impacts the timing, pricing and quantum of new awards, as well as cash generated from oil and gas production; — Economic and market environment: the appetite of clients to award contracts reflects the macro-economic environment, geo-political conditions and other macro events; — Continued access to markets: in both existing and new accessible markets, and any further developments related to the SFO investigation, which the Group is focused on bringing to closure as quickly as possible (see note 31 on page 182; — Cost competitiveness: the ability to maintain a sustainable, cost competitive position to win contracts and positive economic returns through operational excellence; — Energy transition: the nature and speed of the transition to new energies, and the Group’s ability to address these new market opportunities in the long-term. — Project execution: delivering large and complex projects on time, on budget and in an HSSE compliant manner; and, — Availability of funding: the capital markets’ appetite to finance the Global energy industry and Group.
The Group’s current position and outlook, which informs the Directors’ assessment of its medium-to-long term prospects, are:
— Addressable market: over the three year period ended December 2023, the Group’s addressable market, which currently excludes the UAE, Saudi Arabia and Iraq, is estimated to grow to US$90 billion – representing an 8% compound annual growth rate – driven by forecast capital expenditure in the sector and the Group’s strong position in some of the most resilient sectors of the market; — Energy transition: the Group is well positioned in the new energy services market, including a strong track record in offshore wind. It is also successfully adapting its established project management and engineering skillsets to secure awards in adjacent markets, notably carbon capture utilisation and storage (CCUS), Waste-to-Energy and hydrogen production; — Near term visibility: at 31 December 2020, the Group had backlog of US$5.0 billion – with secured revenue in 2021 of US$3.0 million (60%) – with a current tendering pipeline, excluding opportunities in UAE, Saudi Arabia and Iraq, of approximately US$54 billion of opportunities scheduled for award in 2021 and 2022; — Cost management: the Group focuses on continuous innovation, the application of technology and other measures to deliver cost savings and maintain its cost competitiveness; and, — Net debt and liquidity: at 31 December 2020, the Group had cash and cash equivalents of $639 million, net debt of $116 million, with liquidity of $1.1 billion and material headroom in liquidity and financial covenants.
The Group’s prospects are subject to inherent forecasting risks relating to the Group’s principal risks and uncertainties, which include, inter alia, low order intake, loss of financial capacity, macro-economic uncertainty, prevailing oil price environment, impact of energy transition, adverse developments on the SFO investigation, and the ability of the Group to deliver its strategic initiatives.
The Directors have determined that a three-year period to 31 December 2023 (the “Period”) is the most appropriate duration for its viability assessment period. This Period has been selected as it provides the Board sufficient visibility into the Group’s clients’ capital and operational expenditure plans, it covers the period over which existing backlog is executed, and it is consistent with the Group’s business plan duration.
These elements comprise the foundation for modelling the Group’s financial performance, including sensitivities and scenarios, which instructs the Directors on whether there is a reasonable expectation of viability over the Period. While periods greater than three-years could be used, there is an associated higher degree of uncertainty, which is further accentuated due to the COVID-19 pandemic.
The key assumptions within the Group’s business plan for the Period include:
— Oil price: $45 per barrel in 2021, increasing to $55 per barrel in 2023; — Accessible market: continued access to a diversified pipeline of opportunities throughout the Period; —New order intake: a book-to-bill of greater than 1x in each year of the plan in both E&C and EPS business units; — Margins: net profit margins in E&C and EPS reflecting an expected improvement in market conditions; and, — Liquidity and net debt: the Group will have access to finance to maintain target liquidity headroom with a forecast return to net cash during 2022, including the ability to refinance the existing revolving credit facility that matures in June 2022 and thereafter as required.
The operational and financial impact of the COVID-19 pandemic was considered in the business plan. The most pronounced impact was forecast in the E&C business unit in 2021, resulting in further schedule delays due to continued travel and working restrictions. This is subsequently offset by a catch up in activity. Alternative ways of working and increasing penetration of effective vaccines are expected to mitigate the negative operational impact during the remainder of the Period.
Petrofac Limited | 2020 Annual report and accounts68
Strategic report
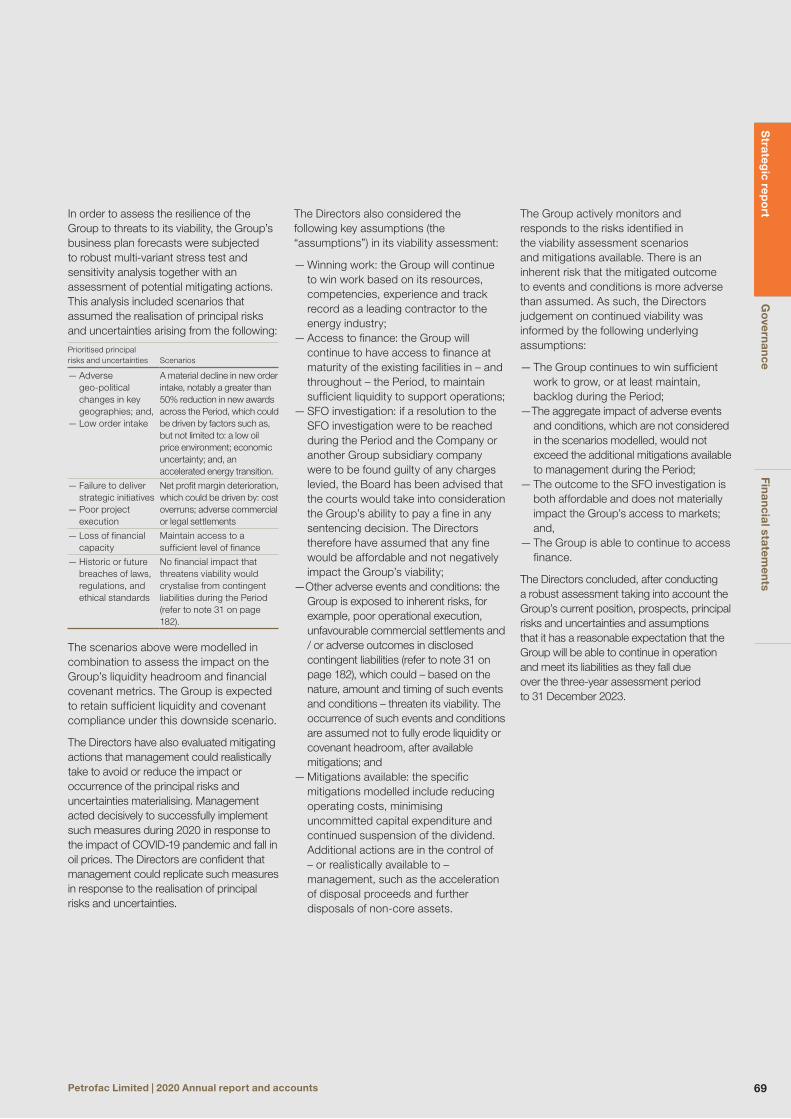
In order to assess the resilience of the Group to threats to its viability, the Group’s business plan forecasts were subjected to robust multi-variant stress test and sensitivity analysis together with an assessment of potential mitigating actions. This analysis included scenarios that assumed the realisation of principal risks and uncertainties arising from the following:
Prioritised principal risks and uncertainties Scenarios
— Adverse geo-political changes in key geographies; and, — Low order intake
A material decline in new order intake, notably a greater than 50% reduction in new awards across the Period, which could be driven by factors such as, but not limited to: a low oil price environment; economic uncertainty; and, an accelerated energy transition.
— Failure to deliver strategic initiatives — Poor project execution
Net profit margin deterioration, which could be driven by: cost overruns; adverse commercial or legal settlements
— Loss of financial capacity
Maintain access to a sufficient level of finance
— Historic or future breaches of laws, regulations, and ethical standards
No financial impact that threatens viability would crystalise from contingent liabilities during the Period (refer to note 31 on page 182).
The scenarios above were modelled in combination to assess the impact on the Group’s liquidity headroom and financial covenant metrics. The Group is expected to retain sufficient liquidity and covenant compliance under this downside scenario.
The Directors have also evaluated mitigating actions that management could realistically take to avoid or reduce the impact or occurrence of the principal risks and uncertainties materialising. Management acted decisively to successfully implement such measures during 2020 in response to the impact of COVID-19 pandemic and fall in oil prices. The Directors are confident that management could replicate such measures in response to the realisation of principal risks and uncertainties.
The Directors also considered the following key assumptions (the “assumptions”) in its viability assessment:
— Winning work: the Group will continue to win work based on its resources, competencies, experience and track record as a leading contractor to the energy industry; — Access to finance: the Group will continue to have access to finance at maturity of the existing facilities in – and throughout – the Period, to maintain sufficient liquidity to support operations; — SFO investigation: if a resolution to the SFO investigation were to be reached during the Period and the Company or another Group subsidiary company were to be found guilty of any charges levied, the Board has been advised that the courts would take into consideration the Group’s ability to pay a fine in any sentencing decision. The Directors therefore have assumed that any fine would be affordable and not negatively impact the Group’s viability; —Other adverse events and conditions: the Group is exposed to inherent risks, for example, poor operational execution, unfavourable commercial settlements and / or adverse outcomes in disclosed contingent liabilities (refer to note 31 on page 182), which could – based on the nature, amount and timing of such events and conditions – threaten its viability. The occurrence of such events and conditions are assumed not to fully erode liquidity or covenant headroom, after available mitigations; and — Mitigations available: the specific mitigations modelled include reducing operating costs, minimising uncommitted capital expenditure and continued suspension of the dividend. Additional actions are in the control of – or realistically available to – management, such as the acceleration of disposal proceeds and further disposals of non-core assets.
The Group actively monitors and responds to the risks identified in the viability assessment scenarios and mitigations available. There is an inherent risk that the mitigated outcome to events and conditions is more adverse than assumed. As such, the Directors judgement on continued viability was informed by the following underlying assumptions:
— The Group continues to win sufficient work to grow, or at least maintain, backlog during the Period; —The aggregate impact of adverse events and conditions, which are not considered in the scenarios modelled, would not exceed the additional mitigations available to management during the Period; — The outcome to the SFO investigation is both affordable and does not materially impact the Group’s access to markets; and, — The Group is able to continue to access finance.
The Directors concluded, after conducting a robust assessment taking into account the Group’s current position, prospects, principal risks and uncertainties and assumptions that it has a reasonable expectation that the Group will be able to continue in operation and meet its liabilities as they fall due over the three-year assessment period to 31 December 2023.
Strateg
ic repo
rtG
overn
ance
Finan
cial statemen
ts
69Petrofac Limited | 2020 Annual report and accounts

Segmental overview
Segmental overview
US$ million RevenueBusiness performance
net profit1 EBITDA
For the year ended 31 December 2020 2019 2020 2019 2020 2019
Engineering & Construction 3,090 4,475 62 278 113 412
Engineering & Production Services2 933 889 39 48 59 67
Integrated Energy Services2 110 195 (18) (4) 39 83
Corporate, others, consolidation adjustments & eliminations (52) (29) (35) (46) 0 (3)
Group 4,081 5,530 48 276 211 559
% Revenue growthBusiness performance
net margin EBITDA margin
For the year ended 31 December 2020 2019 2020 2019 2020 2019
Engineering & Construction (30.9) (5.0) 2.0 6.2 3.7 9.2
Engineering & Production Services2 4.9 4.2 4.2 5.4 6.3 7.5
Integrated Energy Services2 (43.6) (30.9) (16.4) (2.1) 35.5 42.6
Group (26.2) (5.1) 1.2 5.0 5.2 10.1
1 Attributable to Petrofac Limited shareholders2 On 1 January 2020, associate income from the Group’s investment in PetroFirst Infrastructure Limited entities was reclassified from IES to EPS. 2019 comparables have been restated
Engineering & ConstructionRevenue
18 US$4,713m
19 US$4,475m
20 US$3,090m
Business performance net margin
18 7.2%
19 6.2%
20 2.0%
Business performance net profit
18 US$338m
19 US$278m
20 US$62m
Group revenue contribution (FY20)
75%Headcount at 31 Dec 20
4,760
Engineering & Production ServicesRevenue
18 US$853m
19 US$889m
20 US$933m
Business performance net margin
18 5.0%
19 5.4%
20 4.2%
Business performance net profit
18 US$43m
19 US$48m
20 US$39m
Group revenue contribution (FY20)
22%Headcount at 31 Dec 20
4,135
Integrated Energy ServicesRevenue
18 US$282m
19 US$195m
20 US$110m
Business performance net margin
18
19
20
13.8%
(2.1)%
(16.4)%
Business performance net profit
18 US$39m
19 US$(4)m
20 US$(18)m
Group revenue contribution (FY20)
3%Headcount at 31 Dec 20
254
Petrofac Limited | 2020 Annual report and accounts70
Strategic report

Backlog at 31 Dec 20 by marketBacklog at 31 Dec 20 by geography
New energies 9% Refining 34% Upstream gas 40% Upstream oil 17%
US$3.2bn
Algeria 26% Thailand 24% Oman 15% Russia 11% Kuwait 6% United Kingdom 6% Other* 13%
US$3.2bn
Engineering & Construction
The Engineering & Construction (E&C) division delivers onshore and offshore engineering, procurement, construction, installation and commissioning services. Lump-sum turnkey is the predominant commercial model used, but we also offer our clients the flexibility of other models. The division has a 39-year track record in designing and building major oil, gas, refining, petrochemicals and new energies projects.
Operational performanceThe COVID-19 pandemic significantly impacted E&C’s operational performance in 2020, with stringent health protocols, travel restrictions, national lockdowns and supply chain disruption reducing productivity and extending project schedules.
Engineering and procurement progress recovered reasonably quickly from the initial impact of the pandemic, thanks to the rapid transition to remote working and the use of digital technologies to complete tasks, as well as the gradual reopening of equipment manufacturers in major supplier countries such as China and Italy. However, construction activity was significantly impeded for much of the year, resulting in material project delays and additional costs.
Nonetheless, despite the challenging environment, progress was made on all projects in 2020, with a number of major milestones successfully reached, such as the mechanical completion of bp’s
Elie LahoudE&C Chief Operating Officer
upstream gas Ghazeer project in Oman (see page 25 for more detail) and the start-up of the Crude Distillation Unit on KNPC’s Clean Fuels Project in Kuwait.
Financial performanceThe COVID-19 pandemic, as well as the decline in oil prices, significantly impacted E&C’s financial performance in 2020. Nonetheless, swift management action to reduce costs, and lower tax, has partly mitigated the decline in profitability.
Revenue for the year decreased 31% to US$3.1 billion, (2019: US$4.5 billion), driven by a decline in project activity, COVID-19 related project delays and lower variation orders. Business performance net profit decreased 78% to US$62 million (2019: US$278 million), with business performance net profit margin declining 4.2ppts to 2.0% (2019: 6.2%), largely reflecting COVID-19 related cost increases, changes in project mix and the recognition of losses on a small number of contracts.
New orders The decline in oil prices resulted in a contraction in capital spending by clients, resulting in delays to tender awards and the termination of our Dalma contracts in the UAE in April 2020. As a result, new order intake in the year declined to US$0.7 billion (2019: US$2.1 billion), comprising the EPC contract for the Seagreen offshore wind project and net variation orders.
Seagreen offshore wind project, United KingdomIn January 2020, we entered into a Preferred Supplier Agreement with SSE Renewables to design, supply and install the HVAC onshore and offshore substations for the Seagreen wind farm project. The contract was confirmed in June following the completion of the final investment decision. The Seagreen wind farm will be located 27 kilometres off the coast of Angus and once constructed will be the largest in Scotland, providing around one million homes with low carbon energy.
* Other includes geographies individually contributing <5% of total E&C backlog
Strateg
ic repo
rtG
overn
ance
Finan
cial statemen
ts
71Petrofac Limited | 2020 Annual report and accounts
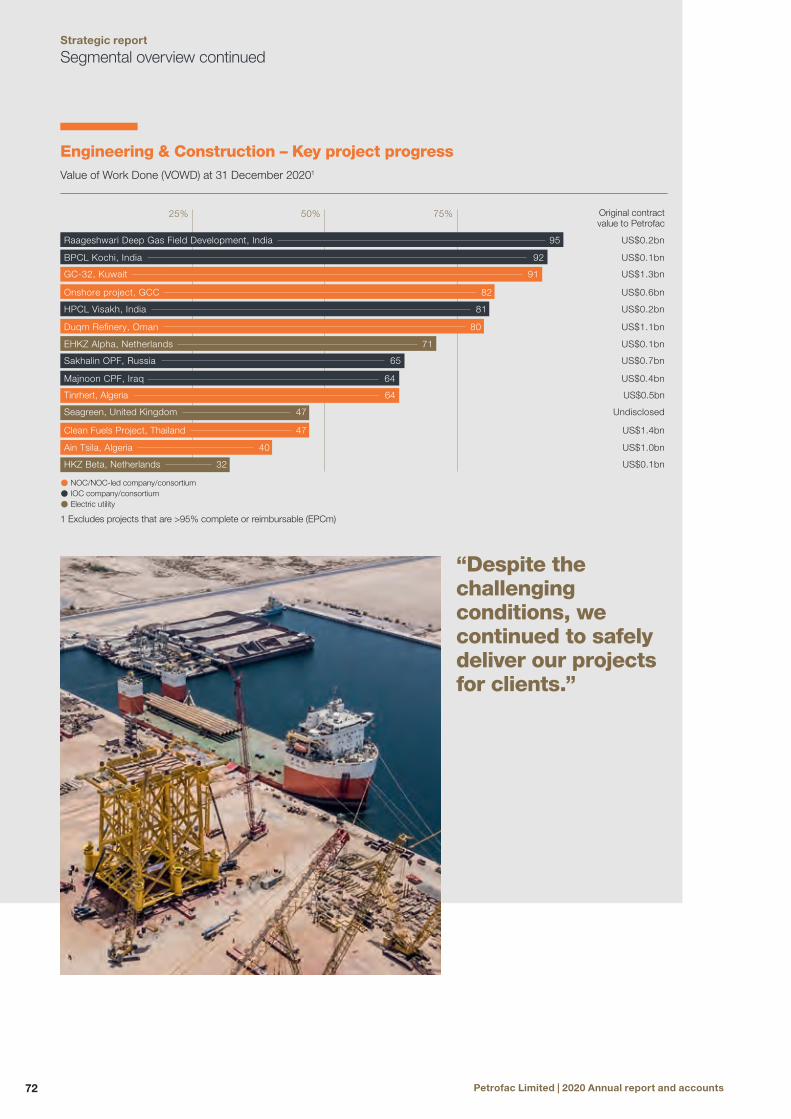
“Despite the challenging conditions, we continued to safely deliver our projects for clients.”
25% 50% 75%
Seagreen, United Kingdom
Majnoon CPF, Iraq
EHKZ Alpha, Netherlands
Clean Fuels Project, Thailand
Ain Tsila, Algeria
HKZ Beta, Netherlands
Tinrhert, Algeria
Sakhalin OPF, Russia
Duqm Refinery, Oman
HPCL Visakh, India
Onshore project, GCC
GC-32, Kuwait
BPCL Kochi, India
Raageshwari Deep Gas Field Development, India
Undisclosed
US$0.4bn
US$0.1bn
US$1.4bn
US$1.0bn
US$0.1bn 32
US$0.5bn
US$0.7bn
US$1.1bn
US$0.2bn
US$0.6bn
US$1.3bn
US$0.1bn
US$0.2bn
47
64
71
47
40
64
65
80
81
82
91
92
95
Original contract value to Petrofac
NOC/NOC-led company/consortium IOC company/consortium Electric utility
Segmental overview continued
1 Excludes projects that are >95% complete or reimbursable (EPCm)
Engineering & Construction – Key project progressValue of Work Done (VOWD) at 31 December 20201
Petrofac Limited | 2020 Annual report and accounts72
Strategic report

Backlog at 31 Dec 20 by service lineBacklog at 31 Dec 20 by geography
Projects 32% Operations 68%
US$1.7bn
UK 52% Azerbaijan 12% Bahrain 8% Iraq 7% Kuwait 6% Other* 15%US$1.7bn
Operational performanceEPS’ operational performance in 2020 was relatively resilient, despite the impact of the COVID-19 pandemic. Engineering, procurement and construction activity on our projects portfolio continued, with some notable milestones successfully reached, including the completion of Sharjah National Oil Corporation’s gas storage project, on time and on budget. Despite the obstacles of reduced manning and enforced travel restrictions, we maintained safe, round the clock delivery on our operations in the UK North Sea and the Middle East, helped by the innovative use of digital technologies, such as the PetrofacGo app (see page 30 for more details).
Financial performanceFinancial performance in the year benefited from solid order intake and lower overhead costs, which helped mitigate the impact of weaker market conditions caused by the COVID-19 pandemic and the decline in oil prices.
Revenue for the year increased 5% to US$0.9 billion (2019: US$0.9 billion) with growth in Projects largely offsetting lower activity from Operations. Business performance net profit decreased 19% to US$39 million (2019: US$48 million, restated1), with business performance net profit margin declining 1.2ppts to 4.2% (2019: 5.4%, restated1) reflecting the expected year-on-year decline in contract margins and contribution from associates, partly mitigated by overhead cost reductions and lower tax.
New orders EPS secured US$0.9 billion of awards and extensions in the year (2019: US$1.0 billion), marginally increasing backlog despite tightening market conditions:
— In Projects, we secured a number of EPCC contracts for new upstream oil and gas facilities in the UAE, Bahrain and Kazakhstan
— In Operations, we extended our contract to operate the Iraq Crude Oil Export Expansion Project (ICOEEP), as well as securing a number of contract renewals with major Independent Oil Companies, such as bp and Eni, in the UK North Sea — We secured two major Integrated Services Contracts in the UK North Sea with Ithaca and Petrogas NEO, which combine our operations, projects and well engineering services across the companies’ asset bases — In well engineering, we announced a number of well management and well operator support contracts in the UK North Sea, including with NEO Energy, which doubled our UK wells portfolio — We expanded our new energies track record by securing a contract to support the Acorn CCUS and blue hydrogen project in the UK and a Front End Engineering Design (FEED) contract for the Arrowsmith green hydrogen project in Australia
John PearsonEPS Chief Operating Officer
Engineering & Production Services
The Engineering & Production Services (EPS) division manages and maintains client operations, both onshore and offshore, delivers small to medium scale EPC projects and provides concept, feasibility and front-end engineering design (FEED) services. The division is also home to market-leading well engineering, decommissioning and training capabilities. The majority of EPS’ services are executed on a reimbursable basis.
* Other includes geographies individually contributing <5% of total EPS backlog
Strateg
ic repo
rtG
overn
ance
Finan
cial statemen
ts
73Petrofac Limited | 2020 Annual report and accounts

Portfolio optimisationOur priority continues to be to manage the IES portfolio to maximise value. Following the completion in November 2020 of the sale of our 51% interest in our Mexico operations, Block PM304 in Malaysia’s offshore Cendor field is our single remaining material IES asset.
Operational performanceNet production for the year from our equity interests declined by 10% to 1.9 million barrels of oil equivalent (mmboe) (2019: 2.1mmboe), driven by lower PM304 production from the deferral of the East Cendor development to 2021 and the decline in base production, offset by strong production from the Santuario field in Mexico. For our PEC in Mexico, Magallanes and Arenque, we earned tariff income on a total of 1.9 mmboe (2019: 2.2 mmboe), with the reduction largely due to completion in Q4 2020 of the sale of these assets.
Production was also impacted by an unplanned outage at Cendor in PM304 in December, which is ongoing.
Financial performance Revenue for the year decreased 43% to US$110 million (2019: US$195 million) reflecting a lower average realised price of US$39/boe (2019: US$67/boe), the decrease in net equity production and lower PEC tariff income and cost recovery.
EBITDA declined 54% to US$39 million (2019: US$83 million, restated1), reflecting the lower contribution from equity production in Malaysia and lower cost recovery from the Mexico PECs, mitigated by reduced operating and overhead costs.
IES generated a business performance net loss of US$18 million (2019: US$4 million loss, restated1), with lower EBITDA partly mitigated by lower interest, tax and depreciation.
“ Our priority continues to be to manage the IES portfolio to maximise value.”
Integrated Energy Services
Integrated Energy Services (IES) is Petrofac’s upstream oil and gas business, providing an integrated service for clients under flexible commercial models that are aligned with their requirements. These range from Production Enhancement Contracts (PECs) to traditional Production Sharing Contracts (PSCs).
Segmental overview continued
1 On 1 January 2020, associate income from the Group’s investment in PetroFirst Infrastructure Limited entities was reclassified from IES to EPS. 2019 comparables have been restated.
Petrofac Limited | 2020 Annual report and accounts74
Strategic report

Financial review
At a glance — Revenue down 26% to US$4.1 billion
— EBITDA down 62% to US$211 million1
— Business performance net profit down 83% to US$48 million1,2
— Reported net loss of US$180 million1
— Fully diluted EPS of 14.2 cents1,2
— Group backlog down 32% to US$5.0 billion
— Net debt of US$116 million
Financial ReviewThe Group’s financial performance in 2020 reflected the deterioration in market conditions triggered by the COVID-19 pandemic and subsequent decline in oil prices. Overall, revenue and profitability declined, as these unprecedented market conditions disrupted project schedules, increased project costs, delayed tender awards and impacted commercial settlement discussions. In response, management took swift and decisive action to structurally reduce costs and conserve cash, which partly mitigated the impact of challenging market conditions on profitability and cash flow.
Year ended 31 December 2020 Year ended 31 December 2019
Business performance2
US$m
Separately disclosed
itemsUS$m
ReportedUS$m
Business performance2
US$m
Separately disclosed
items US$m
Reported US$m
Revenue 4,081 – 4,081 5,530 – 5,530
EBITDA1 211 n/a n/a 559 n/a n/a
Net profit/(loss)1 48 (228) (180) 276 (203) 73
Strateg
ic repo
rtG
overn
ance
Finan
cial statemen
ts
75Petrofac Limited | 2020 Annual report and accounts

Oman 18% Thailand 14% Algeria 14% United Kingdom 13% Kuwait 8% United Arab Emirates 7% Iraq 6% Netherlands 6% Russia 5% Other 9%
US$4.1bn
Financial review continued
Revenue by Geography: FY20Income statementRevenueGroup revenue decreased 26% to US$4.1 billion (2019: US$5.5 billion). This was principally due to a decline in revenue in the Engineering & Construction (E&C) operating segment, which decreased 31% due to a decline in project activity, COVID-19 related project delays and lower variation orders. Engineering & Production Services (EPS) operating segment revenue grew 5%, with growth in Projects largely offsetting lower activity from Operations. Revenue in the Integrated Energy Services (IES) operating segment decreased 43%, reflecting the fall in average realised prices, lower equity production, and lower tariff income and cost recovery in Mexico.
The Group generated revenue from a broad range of geographic markets in 2020 with Oman, Thailand and Algeria generating 47% of Group revenue (2019: top three markets – Oman, Kuwait and the UAE – generated 50% of revenue).
Earnings Before Interest, Tax, Depreciation and Amortisation (EBITDA)1,2,3
Business performance EBITDA decreased 62% to US$211 million (2019: US$559 million), reflecting lower revenue and margins. The decline in E&C margins was driven by cost increases, a change in project mix and the recognition of losses on a small number of contracts. IES margins also contracted as revenues fell at a faster rate than operating and other costs. Consequently, Group EBITDA margin declined to 5.2% (2019: 10.1%). Overall, lower EBITDA was partly mitigated by management actions to reduce overhead and project support costs.
In unprecedented and challenging market conditions, swift management action has protected margins and conserved cash
Alastair CochranChief Financial Officer
“ Oman, Thailand and Algeria were the top three markets in 2020.”
Year ended 31 December 2020
Engineering & Construction
US$m
Engineering & Production
Services US$m
Integrated Energy
Services US$m
Corporate & othersUS$m
Consolidation adjustments &
eliminations US$m
Business performance
US$m
Total revenue 3,090 933 110 – (52) 4,081
EBITDA (1) 113 59 39 – 211
EBITDA margin 3.7% 6.3% 35.5% 5.2%
Year ended 31 December 2019
Engineering & Construction
US$m
Engineering & Production
Services US$m
Integrated Energy
Services US$m
Corporate & others US$m
Consolidation adjustments &
eliminations US$m
Business performance
US$m
Total revenue 4,475 889 195 – (29) 5,530
EBITDA (1) 412 67 83 (3) – 559
EBITDA margin 9.2% 7.5% 42.6% – 10.1%
Petrofac Limited | 2020 Annual report and accounts76
Strategic report

Finance income/(expense)4
Finance income decreased to US$9 million (2019: US$13 million), reflecting lower bank interest and a reduction in the unwinding of discounts on receivables. Finance expense decreased 36% to US$37 million (2019: US$58 million) as debt maturities reduced average gross debt for the year and reflecting lower interest on lease liabilities. In aggregate, net finance expense decreased by 38% to US$28 million (2019: US$45 million).
2020 US$m
2019 US$m
Finance income
Bank interest 3 5
Unwinding of discount on receivables (note 18 and note 21) 6 8
Total finance income 9 13
Finance expense
Group borrowings (27) (42)
Lease liabilities (9) (12)
Unwinding of discount on provisions (note 28) (1) (4)
Total finance expense (37) (58)
TaxationThe Group’s business performance effective tax rate (ETR) for the year was 32.8% (2019: 29.4%), reflecting the change in mix of profits in the jurisdictions in which the profits are earned.
Reported ETR was (10.5)% (2019: 65.6%) driven by the realisation of impairments without tax benefits and certain fair value re-measurements that are not subject to tax. As in prior years, the reported ETR is also driven by tax laws in jurisdictions where the Group operates and generates profits.
Net profit Business performance net profit attributable to Petrofac Limited shareholders for the year decreased 83% to US$48 million (2019: US$276 million) driven by lower EBITDA, partially offset by lower net finance expense, lower tax expense, and lower depreciation and amortisation. Business performance net margin decreased to 1.2% (2019: 5.0%).
A reported net loss of US$180 million(1) (2019: US$73 million net profit) was negatively impacted by separately disclosed items of US$228 million (2019: US$203 million), of which approximately US$209 million were non-cash items. These related to:
— A non-cash impairment of US$79 million and a fair value adjustment of US$42 million (both post-tax) as a result of the fair value of the consideration received for the sale of our remaining 51% interest in our Mexican operations in November 2020 being lower than expected
— A non-cash impairment charge of US$64 million (post-tax) following a review of the carrying amount of the investment in Block PM304 in Malaysia
— A loss of US$6 million (post-tax) recognised on early settlement of deferred consideration from Ithaca Energy in April 2020 and a non-cash impairment charge of contingent consideration of US$9 million (post-tax), both relating to the sale of the Greater Stella Area in the UK in December 2018
— A non-cash downward fair value remeasurement of US$8 million (post-tax) due to uncertainty concerning the timing and outcome of migration of the Pánuco PEC to a PSC and consequently whether contingent consideration pay out conditions will be achieved
— Other net separately disclosed items of US$20 million (post-tax), including Group reorganisation and redundancy costs, other fair value adjustments and legal fees
Earnings per shareBusiness performance diluted earnings per share decreased 82% to 14.2 cents per share (2019: 80.4 cents per share), broadly in line with the decrease in business performance net profit. Reported diluted loss per share decreased to (53.4) cents per share (2019: 21.3 cents earnings per share), reflecting lower business performance profit and an increase in separately disclosed items (refer to note 9 to the consolidated financial statements).
Cash FlowOperating cash flowOperating activities generated a net cash outflow of US$16 million (2019: US$238 million inflow), principally reflecting the decline in EBITDA and a working capital outflow during the year. Net income taxes paid decreased to US$74 million (2019: US$133 million).
Year ended 31 December
2020 US$m
Year ended 31 December
2019 US$m
EBITDA 211 559
Operating profit adjustments 26 18
Operating profit before changes in working capital and other items 237 577
Net working capital movement (160) (179)
Net other non-current items – 1
Restructuring, redundancy and other separately disclosed cash costs (19) (28)
Net income taxes paid (74) (133)
Net cash flows (used in)/generated from operating activities (16) 238
The net working capital outflow of US$160 million (2019: US$179 million outflow) was due to:
— An inflow of US$122 million reflecting a decrease in trade and other receivables
— An inflow of US$409 million reflecting a decrease in contract assets
— An outflow of US$309 million reflecting a decrease in trade and other payables and contract liabilities
— An outflow of US$369 million reflecting a decrease in accrued contract expenses, largely due to higher payment milestones relating to vendors and subcontractors achieved during the period in the Engineering & Construction operating segment
Strateg
ic repo
rtG
overn
ance
Finan
cial statemen
ts
77Petrofac Limited | 2020 Annual report and accounts

Financial review continued
Free cash flowThe free cash outflow for the year of US$73 million (2019: US$138 million inflow) reflects the net cash outflow generated from operating activities, partly mitigated by divestment proceeds and management actions to reduce capital expenditure. US$57 million was received from the Greater Stella Area (GSA) disposal in deferred consideration, of which US$13 million was recognised as divestment proceeds in IES and US$44 million was recognised as a reduction in contract assets in EPS. The divestment of our 51% interest in the Mexico operations increased free cash flow by US$18 million, with US$83 million in gross consideration being offset by the deconsolidation of US$65 million of cash. Group capital expenditure decreased by 38% to US$57 million (2019: US$92 million), reflecting a deferral of expenditure on Block PM304 in Malaysia and lower capex in E&C. Free cash flow also benefited from the decline in average gross debt and consequently interest paid.
Year ended 31 December
2020 US$m
Year ended 31 December
2019 US$m
Net cash flows generated from operating activities (16) 238
Capital expenditure (57) (92)
Acquisitions – (21)
Divestments 28 40
Dividends received from associates and JVs and other investing activities 8 14
Net cash flows (used in)/generated from investing activities (21) (59)
Interest paid (36) (51)
Amounts received from non-controlling interest – 10
Free cash flow (73) 138
Balance sheetIES carrying amountThe carrying amount5 of the IES portfolio stood at US$116 million at 31 December 2020 (2019: US$420 million), largely comprising the Group’s interests in its operations in Malaysia following the sale of the Group’s remaining 51% controlling interest in Mexican operations in November 2020.
31 December 2020
US$m
31 December 2019
US$m
Santuario, Magallanes, Arenque6 Mexico 0 242
PM304 Malaysia 116 150
Other (including investment in associates) 0 28
Total 116 420
Deferred and contingent consideration associated with the sale of non-core assets in prior years is excluded from the IES carrying amount disclosed above as it is included in other financial assets (see note 18 to the consolidated financial statements).
LeasesNet lease liabilities, calculated as gross lease liabilities minus 70% of leases in respect of right-of-use assets relating to Block PM304 in Malaysia, decreased 24% to US$136 million (31 December 2019: US$179 million) as a result of lease payments made in the period (see notes 2, 30 and A10 in Appendix A to the consolidated financial statements). Net lease liabilities attributable to PM304 amounted to US$76 million (31 December 2019: US$111 million).
Total equityTotal equity at 31 December 2020 decreased to US$440 million (2019: US$914 million), reflecting the reported loss for the year of US$189 million and the purchase of the Company’s shares by the Petrofac Employees Benefit Trust (which are held for the purpose of making awards under the Group’s share plans) of US$11 million. No dividends were paid in the period (2019: US$129 million) following the decision by the Board to suspend the 2019 final dividend payment in response to the COVID-19 pandemic.
Of the US$440 million total equity at 31 December 2020, US$433 million (2019: US$633 million) was attributable to Petrofac Limited shareholders and US$7 million (2019: US$281 million) was attributable to non-controlling interests.
Net debt and liquidity Net debtNet debt, excluding net finance leases, increased to US$116 million at 31 December 2020 (2019: US$15 million net cash), predominantly reflecting lower cash conversion (see A11 in Appendix A to the consolidated financial statements).
Total gross borrowings less associated debt acquisition costs were US$800 million at 31 December 2020 (2019: US$1,010 million). This consists of US$505 million drawn on a revolving credit facility, US$250 million of term loans and US$45 million of accessed overdraft facilities.
31 December 2020
US$m
31 December 2019
US$m
Cash and short-term deposits 684 1,025
Interest-bearing loans and borrowings (800) (1,010)
Net (debt)/cash (116) 15
LiquidityThe Group’s total available borrowing facilities, excluding bank overdrafts, were US$1,250 million at 31 December 2020 (2019: US$1,500 million), following the repayment of US$100 million of term loans, the retirement of US$200 million of undrawn facilities and the addition and extension of US$250 million of new liquidity secured during the year. Details of the Group’s borrowing facilities are contained in note 27 to the consolidated financial statements.
Of these facilities, US$495 million was undrawn at 31 December 2020 (2019: US$600 million). Combined with the Group’s cash and cash equivalents of US$639 million (2019: US$914 million), excluding US$45 million cash from bank overdrafts, the Group had US$1,133 million of liquidity available at 31 December 2020 (2019: US$1,514 million(7)).
Petrofac Limited | 2020 Annual report and accounts78
Strategic report

Borrowing facilities - 31 December 2020 Maturity date
Revolving credit facility – US$1,000 million June 2021
Term loan 1 – US$150 million August 2022
Term loan 2 – US$50 million February 2021
Term loan 3 – US$50 million October 2023
The revolving credit facility and the term loans are subject to two financial covenants relating to leverage (net debt to EBITDA) and interest cover (EBITDA to net interest). At 31 December 2020, both covenants were in compliance, each with significant headroom to covenant limits:
Leverage Interest cover
Covenant <3.0x >3.0x
Ratio at 31 December 2020 1.2x 7.6x
Post balance sheet event – COVID Corporate Finance FacilityOn 1 February 2020, the Group increased its short-term liquidity position through issuing £300 million in commercial paper with a maturity of 12 months under the UK Government’s Covid Corporate Financing Facility, the maximum amount it was eligible to issue under this facility. Accessing additional liquidity headroom was considered to be a prudent step in this uncertain market environment.
Post balance sheet event – extensions of facilitiesIn April 2021, the Company extended US$700 million of its banking facilities, at its request, with the unanimous support of lenders. These extensions comprised a US$610 million extension of its existing revolving credit facility to 2 June 2022, with an option to extend for a further six months(8), and a US$90 million extension of a bilateral term facility to 1 April 2022(9).
Return on capital employedThe Group’s return on capital employed for the year decreased to 7.0% (2019: 23.3%), due to the reduction in business performance earnings before interest, tax and amortisation (EBITA). Details of this alternative performance metric calculation are contained A8 in Appendix A to the consolidated financial statements.
DividendsIn April 2020, the Board suspended the payment of the final dividend in response to the COVID-19 pandemic. The Board recognises the importance of dividends to shareholders, but has decided to continue to suspend dividend payments and therefore will not recommend payment of a final dividend for 2020 (2019: 12.7 US cents per share) to conserve cash.
At 31 December 2020, Petrofac Limited had distributable reserves of US$241 million (2019: US$558 million).
Backlog The Group’s backlog decreased 32% to US$5.0 billion at 31 December 2020 (2019: US$7.4 billion), reflecting low new order intake in E&C as clients deferred awards in response to the COVID-19 pandemic and the fall in oil prices, as well as the termination of the Dalma contracts in the UAE.
Overall, Group order intake for the year was US$1.6 billion, representing a book-to-bill of 0.4x. The most significant new award in 2020 was for the Seagreen offshore wind project in Scotland with SSE for the EPC of the HVAC onshore and offshore substations. EPS’ order backlog remained stable in 2020 at US$1.7 billion, reflecting a robust order intake in challenging market conditions, with a book-to-bill of 1.0x.
31 December 2020
US$bn
31 December 2019
US$bn
Engineering & Construction 3.3 5.7
Engineering & Production Services 1.7 1.7
Group 5.0 7.4
Outlook Market conditions remain challenging despite a recovery in the oil price, an improvement in the near-term economic outlook and an increase in tendering activity in the first quarter of 2021. Clients are continuing to adopt tough commercial positions and delays in awards remain a risk. In this environment, and with the UAE market currently unavailable to us, our priorities are clear.
Firstly, we are focused on rebuilding our order book, which provides near-term revenue visibility. The Group has US$3.0 billion scheduled for execution in 2021, comprising US$2.2 billion in E&C and US$0.8 billion in EPS. We expect late 2021 to mark the start of a sustained recovery period for the industry, with a return to pre-2020 capex spend levels by 2023. We will seek to capitalise on this recovery in our core addressable markets, whilst also targeting growth in selective new geographies and accelerating our transition to new energies. To support this ambition, the Group has a diverse tendering pipeline of around US$20 billion of opportunities scheduled for award by the end of 2021 and US$34 billion of opportunities due for award in 2022. Notwithstanding this, we are prudently assuming that capital discipline by clients will continue to delay awards in the near term, with new orders likely to remain depressed in E&C in the current year.
Secondly, we are committed to exercising capital discipline, cutting costs and conserving cash. We are taking additional measures to reshape the business, which will reduce overhead and project support costs, whilst preserving core capability.
Finally, we are focused on delivering operational excellence, supported by investment in digitalisation, automation and process efficiency. This unrelenting focus on improving productivity and capability will help mitigate the impact of the challenging market conditions we continue to face, with both E&C and EPS net margins currently forecast to grow modestly in 2021.
Alastair CochranChief Financial Officer20 April 2021
Notes:1 Attributable to Petrofac Limited shareholders2 This measurement is shown by Petrofac as a means of measuring underlying business
performance, see note 4 to the consolidated financial statements3 See A3 in Appendix A to the consolidated financial statements4 See note 7 to the consolidated financial statements5 Share of net assets attributable to Petrofac Limited shareholders6 Included in assets held for sale (see note 15 to the consolidated financial statements)7 December 2019 liquidity restated from US$1,625 million to remove cash from overdrafts
as these amounts are repayable on demand and as such do not meet the definition to be included within liquidity
8 The option to extend the revolving credit facility to 2 December 2022 is subject to the approval of lenders and is up to a maximum of US$550 million
9 The term loan included a prepayment obligation on 31 March 2021
Strateg
ic repo
rtG
overn
ance
Finan
cial statemen
ts
79Petrofac Limited | 2020 Annual report and accounts

Chairman’s introduction
‘Good governance is central to our business.’
Dear shareholderOn behalf of the Board, I am very pleased to present the Group’s corporate governance report for 2020.
Maintaining governance standards The Board recognises the value and importance of good corporate governance, particularly in these unprecedented times caused by the global COVID-19 pandemic. Throughout 2020, the Board maintained its governance focus with Board and Committee meetings taking place as scheduled, albeit in a new virtual environment.
In responding to the COVID-19 pandemic, the Board has been guided by the Company’s purpose and values, with focus primarily on the health and wellbeing of our employees.
Our purpose is to enable our clients to meet the world’s evolving energy needs and the Company’s effective and considered response to the pandemic, as set out on pages 10 and 11, highlighted to the Board the many commendable qualities across our business.
Our strong client-focused and responsive culture, coupled with the commitment of our employees, have despite facing several challenges, consistently continued to help us achieve our goals. On behalf of the Board, I would like to express our sincere thanks to each of our employees and recognise their outstanding contribution.
Last year’s report explained the work that had already been undertaken by the Company to develop and enhance the corporate governance framework in light of the new requirements introduced by the revised UK Corporate Governance Code. This year we have continued to embed best practice governance across the Group, and it is our intention to continue to develop these practices to ensure we meet our duties and responsibilities.
Board changes and succession planningA significant change for the Board this year was the announcement that Ayman Asfari, Group Chief Executive would retire at the end of 2020. We are, however, pleased that Ayman will remain on the Board as a Non-executive Director, providing stability and continuity both as a member of the Board and a major shareholder. The Board had been planning for his retirement for some time, with succession planning a key focus of the Nominations Committee over the last few years.
Sami Iskander joined the Company in November 2020 and became Group Chief Executive and a member of the Board with effect from 1 January 2021. This appointment followed a comprehensive search process, with details set out in the Nominations Committee report on page 102. Sami has an excellent industry pedigree both in international oilfield services and upstream E&P, a deep and local understanding of our markets and client landscape, and a proven track record in business transformation. The Board is confident that this appointment will enable the leadership team to deliver growth and create value for our stakeholders over the coming years.
Succession planning and the composition and diversity of the Board and its Committees are an integral part of good governance and board effectiveness. We believe the varied skills and experience brought by each Director enables them to contribute fully to Board discussions and provide support and constructive challenge to management. Biographies of all Board members, setting out their key strengths and experience can be found on pages 82 to 84, with details of this year’s Board evaluation outcomes on pages 90 and 91.
Sustainability This year, significant progress has been made to articulate our sustainability ambitions, making clear diversity and Net Zero carbon commitments.
Our strategy and business model aim to deliver sustainable growth for all stakeholders including the communities we support. You can read more about how environmental, social and governance (ESG) factors are integral to our decision-making process and management of our business throughout the Strategic report on pages 34 to 59. Information on our journey towards our Net Zero greenhouse gas emissions can also be found on pages 37 and 38.
Looking aheadThe decisions to withdraw the final dividend recommendation for the 2019 final year and to not make dividend payments in respect of the 2020 financial year were not taken lightly. These were made with the intention of protecting our balance sheet and maximising liquidity at a time of unprecedented uncertainty both for the Company and the sector as a whole. We thank our shareholders for their continued support during this time. The Board understands the importance of dividends to our shareholders and will continue to assess the appropriate timing for the resumption of dividend payments, taking into consideration the Group’s financial performance, balance sheet strength and outlook.
Our focus over the year ahead will be to continue to develop our strategic response to the unprecedented challenges encountered over the last year. The Board, with the new management leadership, will strive to ensure that we make the right decisions to support the long-term sustainable success of our business and create long-term value for our stakeholders.
I would like to thank our shareholders for their continued support during these unprecedented and challenging times.
René MédoriChairman20 April 2021
Petrofac Limited | 2020 Annual report and accounts80
Corporate Governance
The UK Corporate Governance Code
Petrofac Limited (Petrofac) is subject to the principles and provisions of the UK Corporate Governance Code (UK Code), which underpins the corporate governance framework for premium listed companies. The UK Code sets out a number of principles and provisions of good governance, with compliance with the UK Code resting with the Board. A copy of the UK Code is available at www.frc.org.uk.
As a Jersey incorporated company listed in the UK, Petrofac is required to explain how the Company has complied with the UK Code and applied the principles and provisions set out therein. For the year ended 31 December 2020, the Board considers that the Company has been compliant in all material aspects with the UK Code and this governance report details how the principles of the UK Code have been applied.
It is acknowledged that the Chairman’s tenure as a Board member will reach nine years during 2021. The Board is however content that he remains independent and, in accordance with provision 19 of the UK Code, has agreed that in light of recent executive management changes he should remain in the role until May 2022 to facilitate effective succession planning. Details of this process are set out on page 103.
It is confirmed that the Company has also complied with the relevant requirements of the Disclosure and Transparency Rules, the UK Listing Rules and narrative reporting requirements.
The table opposite sets out where shareholders can find further information on how the Company has applied the principles of the UK Code within this Annual Report.
Section 1: Board leadership and Company purposeChairman’s statement Page 04Chairman’s introduction Page 80Director’s biographies Page 82 Board governance framework Page 86Purpose, values and culture Pages 2, 4 and 20Business model and strategy oversight Pages 20 to 23 and 91Stakeholder engagement Pages 12 and 92Workforce engagement Pages 13, 47 and 92
Section 2: Division of responsibilitiesCorporate structure Page 87Roles and responsibilities Pages 86 and 87Independence and time commitments Pages 82 to 84 and 86Board attendance Page 88Key activities of the Board Page 89Information and support Page 89
Section 3: Composition, succession and evaluationNomination Committee report, including:
— Chairman’s letter Page 102 — Board composition and tenure Page 82 — Board succession planning Pages 102 to 104 — Diversity and inclusion Pages 46 and 104 — Board evaluation Pages 90 and 91
Section 4: Audit, risk and internal controlAudit Committee report, including:
— Chairman’s letter Page 94 — Risk management Page 99 — Internal control framework Page 96 — Principal and emerging risks Page 62 to 67 — Fair, balanced and understandable Page 97 — External audit Page 100 — Viability statement Page 68 — Going concern Pages 118 and 136
Section 5: RemunerationDirectors’ remuneration report, including:
— Chairman’s annual statement Page 107 — Annual report on remuneration Page 109
Strateg
ic repo
rtG
overn
ance
Finan
cial statemen
ts
81Petrofac Limited | 2020 Annual report and accounts
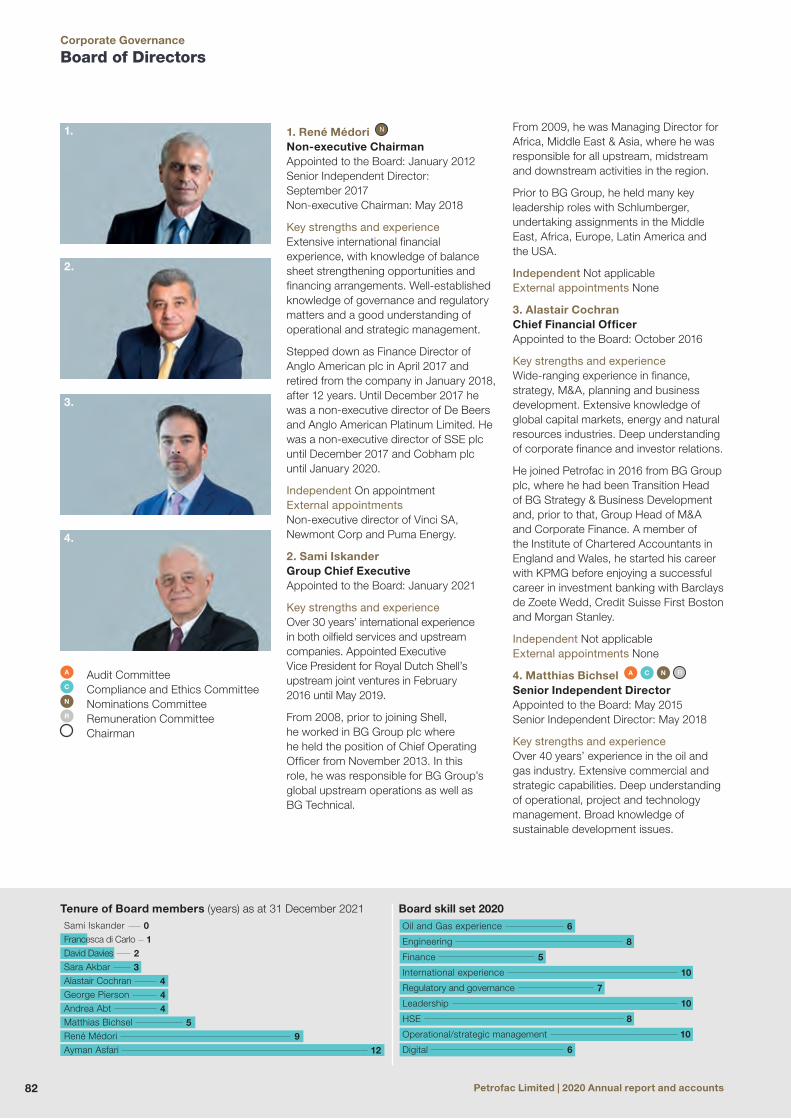
Tenure of Board members (years) as at 31 December 2021
George Pierson
44
5
Sara Akbar 3
Francesca di Carlo 1
Andrea Abt
Matthias Bichsel
René Médori
Ayman Asfari 9
12
Alastair Cochran 4
David Davies 2
Sami Iskander 0
Board skill set 2020
Leadership 10
International experience 10
Engineering 8
HSE
Operational/strategic management
Digital
8
10
6
Regulatory and governance 7
Finance 5
Oil and Gas experience 6
Board of Directors
A Audit CommitteeC Compliance and Ethics CommitteeN Nominations CommitteeR Remuneration Committee
Chairman
1. René Médori N
Non-executive ChairmanAppointed to the Board: January 2012 Senior Independent Director: September 2017 Non-executive Chairman: May 2018
Key strengths and experienceExtensive international financial experience, with knowledge of balance sheet strengthening opportunities and financing arrangements. Well-established knowledge of governance and regulatory matters and a good understanding of operational and strategic management.
Stepped down as Finance Director of Anglo American plc in April 2017 and retired from the company in January 2018, after 12 years. Until December 2017 he was a non-executive director of De Beers and Anglo American Platinum Limited. He was a non-executive director of SSE plc until December 2017 and Cobham plc until January 2020.
Independent On appointmentExternal appointmentsNon-executive director of Vinci SA, Newmont Corp and Puma Energy.
2. Sami Iskander Group Chief ExecutiveAppointed to the Board: January 2021
Key strengths and experienceOver 30 years’ international experience in both oilfield services and upstream companies. Appointed Executive Vice President for Royal Dutch Shell’s upstream joint ventures in February 2016 until May 2019.
From 2008, prior to joining Shell, he worked in BG Group plc where he held the position of Chief Operating Officer from November 2013. In this role, he was responsible for BG Group’s global upstream operations as well as BG Technical.
From 2009, he was Managing Director for Africa, Middle East & Asia, where he was responsible for all upstream, midstream and downstream activities in the region.
Prior to BG Group, he held many key leadership roles with Schlumberger, undertaking assignments in the Middle East, Africa, Europe, Latin America and the USA.
Independent Not applicableExternal appointments None
3. Alastair CochranChief Financial OfficerAppointed to the Board: October 2016
Key strengths and experienceWide-ranging experience in finance, strategy, M&A, planning and business development. Extensive knowledge of global capital markets, energy and natural resources industries. Deep understanding of corporate finance and investor relations.
He joined Petrofac in 2016 from BG Group plc, where he had been Transition Head of BG Strategy & Business Development and, prior to that, Group Head of M&A and Corporate Finance. A member of the Institute of Chartered Accountants in England and Wales, he started his career with KPMG before enjoying a successful career in investment banking with Barclays de Zoete Wedd, Credit Suisse First Boston and Morgan Stanley.
Independent Not applicableExternal appointments None
4. Matthias Bichsel A C N R
Senior Independent DirectorAppointed to the Board: May 2015 Senior Independent Director: May 2018
Key strengths and experience Over 40 years’ experience in the oil and gas industry. Extensive commercial and strategic capabilities. Deep understanding of operational, project and technology management. Broad knowledge of sustainable development issues.
1.
2.
3.
4.
Petrofac Limited | 2020 Annual report and accounts82
Corporate Governance
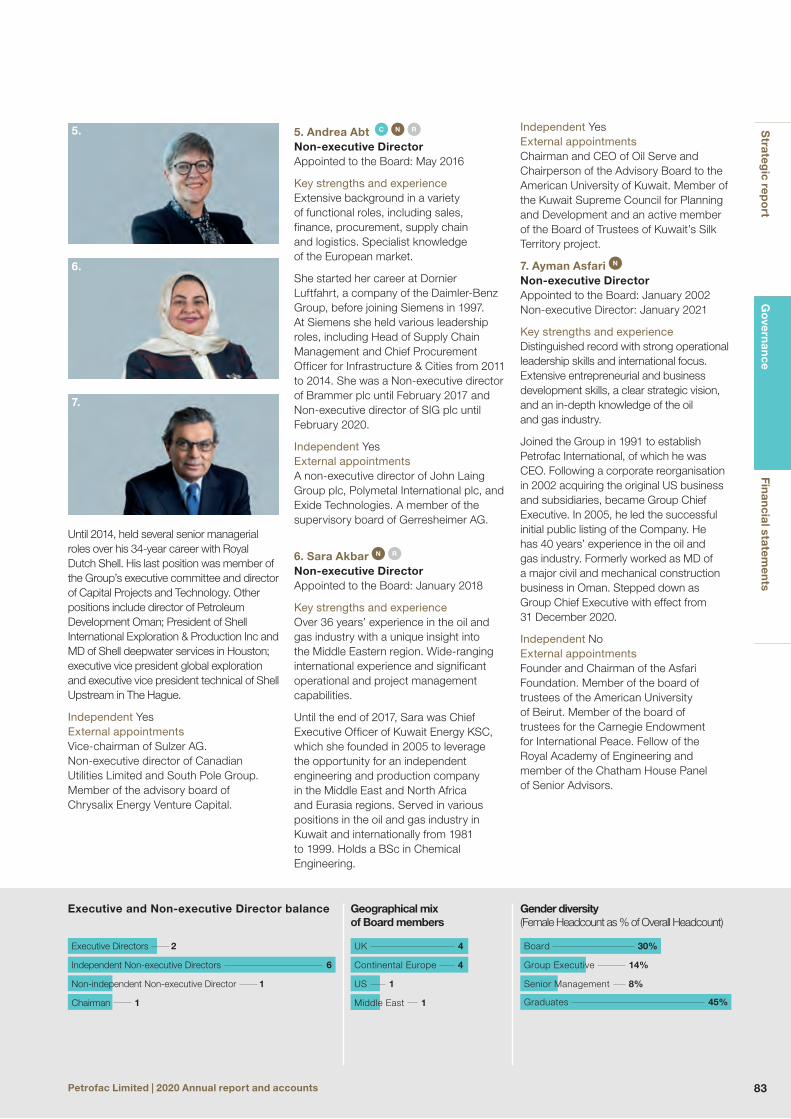
Geographical mix of Board members
Middle East 1
Continental Europe 4
US 1
UK 4
Gender diversity (Female Headcount as % of Overall Headcount)
Graduates 45%
Group Executive 14%
Senior Management 8%
Board 30%
Executive and Non-executive Director balance
Chairman 1
Independent Non-executive Directors 6
Non-independent Non-executive Director 1
Executive Directors 2
Until 2014, held several senior managerial roles over his 34-year career with Royal Dutch Shell. His last position was member of the Group’s executive committee and director of Capital Projects and Technology. Other positions include director of Petroleum Development Oman; President of Shell International Exploration & Production Inc and MD of Shell deepwater services in Houston; executive vice president global exploration and executive vice president technical of Shell Upstream in The Hague.
Independent YesExternal appointmentsVice-chairman of Sulzer AG. Non-executive director of Canadian Utilities Limited and South Pole Group. Member of the advisory board of Chrysalix Energy Venture Capital.
5. Andrea Abt C N R
Non-executive DirectorAppointed to the Board: May 2016
Key strengths and experienceExtensive background in a variety of functional roles, including sales, finance, procurement, supply chain and logistics. Specialist knowledge of the European market.
She started her career at Dornier Luftfahrt, a company of the Daimler-Benz Group, before joining Siemens in 1997. At Siemens she held various leadership roles, including Head of Supply Chain Management and Chief Procurement Officer for Infrastructure & Cities from 2011 to 2014. She was a Non-executive director of Brammer plc until February 2017 and Non-executive director of SIG plc until February 2020.
Independent YesExternal appointmentsA non-executive director of John Laing Group plc, Polymetal International plc, and Exide Technologies. A member of the supervisory board of Gerresheimer AG.
6. Sara Akbar N R
Non-executive DirectorAppointed to the Board: January 2018
Key strengths and experienceOver 36 years’ experience in the oil and gas industry with a unique insight into the Middle Eastern region. Wide-ranging international experience and significant operational and project management capabilities.
Until the end of 2017, Sara was Chief Executive Officer of Kuwait Energy KSC, which she founded in 2005 to leverage the opportunity for an independent engineering and production company in the Middle East and North Africa and Eurasia regions. Served in various positions in the oil and gas industry in Kuwait and internationally from 1981 to 1999. Holds a BSc in Chemical Engineering.
Independent YesExternal appointmentsChairman and CEO of Oil Serve and Chairperson of the Advisory Board to the American University of Kuwait. Member of the Kuwait Supreme Council for Planning and Development and an active member of the Board of Trustees of Kuwait’s Silk Territory project.
7. Ayman Asfari N Non-executive DirectorAppointed to the Board: January 2002 Non-executive Director: January 2021
Key strengths and experienceDistinguished record with strong operational leadership skills and international focus. Extensive entrepreneurial and business development skills, a clear strategic vision, and an in-depth knowledge of the oil and gas industry.
Joined the Group in 1991 to establish Petrofac International, of which he was CEO. Following a corporate reorganisation in 2002 acquiring the original US business and subsidiaries, became Group Chief Executive. In 2005, he led the successful initial public listing of the Company. He has 40 years’ experience in the oil and gas industry. Formerly worked as MD of a major civil and mechanical construction business in Oman. Stepped down as Group Chief Executive with effect from 31 December 2020.
Independent NoExternal appointmentsFounder and Chairman of the Asfari Foundation. Member of the board of trustees of the American University of Beirut. Member of the board of trustees for the Carnegie Endowment for International Peace. Fellow of the Royal Academy of Engineering and member of the Chatham House Panel of Senior Advisors.
5.
6.
7.
Strateg
ic repo
rtG
overn
ance
Finan
cial statemen
ts
83Petrofac Limited | 2020 Annual report and accounts

Board of Directors continued
8. David Davies A N Non-executive DirectorAppointed to the Board: May 2018
Key strengths and experienceExtensive international financial experience, including capital and debt raising as well as managing companies exposed to substantial and rapid change. Chartered Accountant with an MBA from the City University Business School. Served on the boards of listed companies in seven different countries.
Over 35 years’ experience as a financial professional with a successful career as Chief Financial Officer and Deputy Chairman of the executive board at OMV Aktiengesellschaft. Served as Group Finance Director for both Morgan Crucible Company plc and London International Group plc and was a Non-executive Director of Ophir Energy Plc until May 2019 and of Uniper SE until April 2020.
Independent YesExternal appointmentsSenior Advisory Board member at First Alpha Energy Capital LLP and a non-executive director of Wienerberger AG.
9. Francesca Di Carlo N R Non-executive DirectorAppointed to the Board: May 2019
Key strengths and experienceExtensive background in various senior positions, specialising in corporate finance operations, strategy, audit and human resources. Holds a BA in Economics from La Sapienza University in Rome.
Currently Head of Global Procurement at ENEL S.p.A, leading a significant reorganisation of the group with the aim of integrating ENEL’s largest subsidiary, as well as its wide Latin America portfolio, into a single group. Covered a wide range of roles at the Telecom Italia Group, including Head of Investor Relations, Head of Financial Planning and Head of Corporate Development and Mergers & Acquisitions. Former Chairperson of Stream and Telespazio, as well as a former director of Sky Italy.
Independent YesExternal appointmentsGroup Executive Vice President of Procurement at ENEL S.p.A and director of Open Fiber, Italy’s largest broadband operator.
10. George Pierson A C N Non-executive DirectorAppointed to the Board: May 2016
Key strengths and experienceA qualified lawyer and engineer. Extensive background in risk management, contracting, construction law, compliance and cost efficiency. Excellent understanding of operational and engineering management.
Appointed as President and Chief Executive Officer of Parson Brinckerhoff between 2010 and 2014 having been General Counsel and Secretary from 2006 and COO of its Americas operations from 2008. Previously Non-executive director of WSP Global Inc, Terracon Consultants, Inc. and Railworks LLC. Joined The Kleinfelder Group Inc. in August 2016 and served as President and Chief Executive Officer until becoming Executive Chairman in September 2019.
Independent YesExternal appointmentsExecutive Chairman of The Kleinfelder Group Inc. and Non-executive director of Citadel Systems Integration Holdings LLC.
11. Alison BroughtonHead of Company Secretariat and Secretary to the Board
Key strengths and experienceJoined Petrofac in August 2011, and is responsible for the Group’s regulatory, governance and listing rule compliance framework.
She is a Fellow of ICSA: The Chartered Governance Institute, with 24 years’ experience in a UK listed environment. She is Secretary to the Board and its Committees.
Prior to joining Petrofac, she spent eight years with Wolseley plc (now Ferguson plc) as Deputy Company Secretary. In 2002, she joined the company secretariat of Shell Exploration & Production Limited, part of the Royal Dutch Shell group, following the takeover of Enterprise Oil plc, where she started her company secretarial career in 1997.
8.
9.
10.
11.
A Audit CommitteeC Compliance and Ethics CommitteeN Nominations CommitteeR Remuneration Committee
Chairman
Petrofac Limited | 2020 Annual report and accounts84
Corporate Governance

Our leadership team
1.
2.
3.
4.
5.
1. Matthew BartonGroup General Counsel
ResponsibilityHas responsibility for all Legal, Compliance and Company Secretariat functions. Ensuring that all colleagues have access to relevant, timely and commercially valuable legal advice, he also ensures that the Group’s business is conducted in accordance with all applicable laws and regulations.
ExperienceJoined Petrofac in 2018 with more than 20 years’ experience, 15 of which in General Counsel roles, both in the UK and the Middle East. He began his legal career in private practice, working in London and Hong Kong before moving into the engineering and construction industry.
2. Alison Flynn Group Director of Communications and Sustainability
ResponsibilityHas responsibility for all internal and external communications and external affairs, including investor relations and sustainability.
ExperienceJoined Petrofac in 2013 from global mining company Xstrata plc, where she held a senior Corporate Affairs role. She has more than 20 years’ experience in communications and external affairs roles in multinational organisations operating in geo-politically challenging, regulated environments, following an earlier career in journalism.
3. Elie LahoudChief Operating Officer, Engineering & Construction
ResponsibilityAs Chief Operating Officer, he has overall accountability for strategy and delivery against our Engineering and Construction (E&C) business plan.
ExperienceJoined Petrofac in 1997. He has held several key operational roles, leading the delivery of large scale upstream and downstream oil and gas EPC projects and subsequently overseeing operations in the Middle East and CIS countries, as well as offshore power projects in Germany and the Netherlands. He was Group MD of E&C until December 2020. He is a member of the American University of Beirut Advisory Board for its faculty of engineering. He has over 25 years’ industry experience.
Sami Iskander Group Chief Executive
Alastair CochranChief Financial Officer
Sami and Alastair’s full biographies can be read on page 82.
4. John PearsonChief Operating Officer, Engineering & Production Services and Integrated Engineering Services, and Chief Corporate Development Officer
ResponsibilityAs Chief Operating Officer, he is accountable for the overall growth and delivery of its Operations, Projects, Engineering and Consultancy Services, Well Engineering and Training Services capabilities globally. In his Chief Corporate Development Officer role he is responsible for driving transformational activities in areas including Technology, Engineering and the Energy Transition, globally.
ExperienceJoined Petrofac in 2017, prior to which he spent 28 years with AMEC Foster Wheeler and five years with Chevron, in the UK and the US. His previous roles have included President of global oil, gas and chemicals businesses, and multi-market roles running the Americas, Northern Europe and CIS regions. He has also been a Co-Chair of Oil & Gas UK.
5. Des ThurlbyGroup Director of Human Resources
ResponsibilityHas overall responsibility for advising on all people aspects of the business. This includes developing a business-focused people strategy, including succession planning, talent management, leadership development, compensation, key hires, performance culture, diversity and inclusion, and employee engagement.
ExperienceJoined Petrofac in 2017. He started his career as a graduate trainee with Ford Motor Company and spent 25 years in the automotive sector, including six years as HR Director for Jaguar Land Rover. He was also interim President of IMI China and Senior Vice President HR for Seadrill, an offshore drilling contractor. He has a Bachelors degree in Politics and Economics from Newcastle University and an Executive MBA from the London Business School. He is also a Member of the Chartered Institute of Personnel & Development.
Strateg
ic repo
rtG
overn
ance
Finan
cial statemen
ts
85Petrofac Limited | 2020 Annual report and accounts

Board leadership and Company purpose
Board governance structure and frameworkThe Petrofac Board seeks to ensure there is a strong and effective governance framework in place across the Group and has the responsibility for leading the Group to ensure its long-term success, taking into consideration the views and interests of all stakeholders. The Board sets the tone of the Group with regards to the corporate governance framework and the application of corporate values and behaviours.
The Board also sets the Group’s strategy, with the aim of delivering on its purpose, within an agreed risk appetite. As a unitary Board, our Directors share equal responsibility for all decisions taken, with Directors collectively responsible for strategic direction. We believe our governance framework underpins good governance practices and enables the Board to provide effective stewardship of the Company. The Board is responsible for the Group’s overall conduct, for setting its strategic aims, and for providing leadership and guidance to enable management to achieve the Group’s long-term objectives. The Board’s role is integral to the Group’s values and culture and to the setting of the behaviours expected of all employees.
The Board is assisted by four committees – Audit, Compliance and Ethics, Nominations and Remuneration – and matters which the Board considers suitable for delegation are contained in the terms of reference of these individual committees. A comprehensive review of Board procedures, including the Schedule of Matters Reserved for the Board and the Terms of Reference for all Committees was carried out during the year. Copies of these documents are available at www.petrofac.com. In addition to these Board committees, there are several executive management committees in place, which are involved in the day-to-day operational management of Petrofac that have been established to consider various matters for recommendation to the Board and its committees.
Our corporate structure framework is set out on page 87. In determining the Group’s strategy, and the sustainability of the business model, the Board is conscious of its responsibilities, not just to shareholders but to all stakeholders. It seeks to ensure that the necessary corporate and management structures are in place for our strategy to be implemented effectively.
The UK Companies Act 2006 sets out a number of general duties to which all directors are expected to adhere to and while Petrofac Limited, as a Jersey-registered entity, is not required to comply with this legislation, our Directors are informed by UK practice and wish to act in good faith to promote the long-term success of the Group. Details on our stakeholder engagements are set out on pages 12 to 15 and 92.
Board composition and appointment The size, composition and effectiveness of the Board and its Committees is kept under review by the Nominations committee to ensure there is an appropriate balance of capabilities, knowledge and experience, independence and diversity to meet the Group’s business needs, while also taking into consideration the length tenure of each Director. All new Board appointments are subject to a formal and rigorous procedure led by this Committee. Further details on the work undertaken during 2020 are set out on pages 102 and 103.
In line with the requirements of the UK Code, the Board comprises a majority of independent Non-executive Directors. The independence of our Non-executive Directors is considered annually, having regard to the criteria set out in the UK Code. We believe the Board’s current composition gives us the necessary balance of diversity, experience, capabilities, independence and knowledge to ensure we are able to run the business effectively and deliver sustainable growth.
At the date of this report, the Board has ten Directors, comprising the Chairman, six independent Non-executive Directors, one non-independent Non-executive Director and two Executive Directors. Full biographies, setting out their career background, relevant skills and external appointments are detailed on pages 82 to 84.
In accordance with the UK Code, all Directors offer themselves for reappointment by shareholders at each AGM and each will stand for re-election at the 2021 AGM. Our two Executive Directors have rolling service contracts, containing a notice period provision of 12 months by either party. Our Non-executive Directors each have letters of appointment that contain a termination provision of three months’ notice by either party. The terms and conditions of appointment of all Directors are available for inspection at our registered office in Jersey and at our Corporate Services office in London.
Board rolesThe roles and responsibilities for our Directors, including the Chairman, Group Chief Executive and Senior Independent Director (SID) are set out on page 87. Each of our Directors has a varied career history and considerable effort has been taken to ensure that the Board retains the right balance of skills, capabilities, diversity and industry expertise (see pages 82 to 84). Our Non-executive Directors are encouraged to share their experience, and each is well-positioned to support management, whilst providing constructive challenge. Directors are encouraged to be open and forthright in their approach as we believe this helps to forge strong working relationships, allowing them to make their best possible contribution.
The Nominations committee also has the responsibility for monitoring the external commitments of Non-executive Directors, who, from appointment, are each made aware of the need to allocate sufficient time to the Company to discharge their responsibilities effectively. Any changes to a Director’s external commitments must be notified to the Board immediately in order that any potential conflict of interest, time commitment challenge or residency status issues can be considered.
Regular meetings between the Chairman and Group Chief Executive are held throughout the year, particularly before and after scheduled Board meetings. This allows general matters to be discussed and enables them to reach a mutual understanding of each other’s views, especially in matters where they may initially not be in agreement. The Chairman and SID maintain regular contact between scheduled Board meetings, with time also set aside at each meeting for the Chairman to meet with the Non-executive Directors without the presence of management. The relationships between these roles are of particular importance, as these individuals represent the views of both management and Directors, respectively. The combination of these meetings ensures that the Chairman is fully informed on the views of the Directors and management, which assists in the setting of meeting agendas and ensures all Directors can contribute effectively through their individual and collective experiences.
Petrofac Limited | 2020 Annual report and accounts86
Corporate Governance

SHAREHOLDERS
BOARD Provides leadership and direction for the Group. Sets overall strategy and oversees its implementation. Ensures appropriate systems and processes are in place to monitor and manage Group risk. Responsible for financial performance and corporate governance.
EXECUTIVE MANAGEMENTResponsible for day-to-day operational management, the communication and implementation of strategic decisions, and administrative matters. Identifies and reviews matters for recommendation to the Board and its Committees. Underpinned by a number of management committees, including:
Chairman
Leads the Board and ensures effective communication flows between Directors
Promotes an inclusive forum to facilitate effective contribution, challenge and debate
Builds a well-balanced Board, with consideration given to succession planning and Board composition
Responsible for ensuring effective Board governance and oversees the Board evaluation process
Ensures effective communication with stakeholders, which enables their interests to be represented at Board meetings
Group Chief Executive
Implements agreed strategy and objectives
Develops attainable goals and priorities
Provides leadership and day-to-day management of the Group
Has delegated authority from the Board to deliver the Company purpose
Develops proposals to present to the Board on all areas reserved for its judgement and ensures the Board is fully informed of all key matters
Develops Group policies for approval by the Board and ensures effective implementation
Maintains relationships with key external stakeholders, including investors, clients and governments
Supported by the leadership team, has responsibility for driving execution of the Group’s strategic aims
Chief Financial Officer
Manages the Group’s finances and responsible for financial planning and presenting and reporting accurate and timely historical financial information, both internally and externally
Ensures an effective financial control environment fully compliant with regulations
Develops and implements the Group’s finance strategy and funding
Manages the Group’s financial risk and responsible for mitigating key elements of the Group’s risk profile
Responsible for the delivery of IT, ESG and Communications strategies
Maintains relationships with key external stakeholders, including shareholders, lenders and credit rating agencies
Senior Independent Director
Acts as a sounding board and confidant to the Chairman
Available to meet shareholders to answer questions that cannot be addressed by the Chairman or Group Chief Executive
Meets with other Directors to appraise the Chairman’s performance annually, and on such other occasions as deemed appropriate
Acts as an intermediary for other independent Directors
Non-executive Directors
Support executive management, whilst providing constructive challenge and rigour
Monitor the delivery of strategy within the risk management framework as set by the Board
Bring sound judgement and objectivity to the Board’s decision-making process
Review the integrity of financial information, controls and risk management processes
Share skills, experience and knowledge from other industries and environments
Have prime roles in the Board composition and succession planning process
Secretary to the Board
Acts as Secretary to the Board and its Committees
Advises the Board on all governance, legislation and regulatory requirements
Puts in place processes designed to ensure compliance with Board procedures
Facilitates the Board evaluation, induction and development processes
Available to individual Directors in respect of Board procedures and provides general support and advice
Audit CommitteeChaired by: David Davies
Reviews and monitors the integrity of the Group’s financial statements; reporting processes; financial and regulatory compliance; the systems of internal control and risk management; and the external and internal audit processes.
Committee report on pages 94 to 101
Remuneration CommitteeChaired by: Matthias Bichsel
Sets remuneration policy for Executive Directors and determines individual compensation levels for Executive Directors, the Chairman and members of senior management. Oversight of the remuneration framework for the Group.
Committee report on pages 107 to 117
Nominations CommitteeChaired by: René Médori
Reviews the structure, size and composition of the Board and its Committees. Takes primary responsibility for succession planning and Director succession. Identifies and nominates suitable candidates for Board appointments.
Committee report on pages 102 to 104
Compliance & Ethics CommitteeChaired by: George Pierson
Supports the Board in fulfilling its oversight responsibilities in all respects of compliance and ethics. Provides assurance that the Group’s compliance and ethics policies remain effective.
Committee report on pages 105 to 106
Group Executive Committee
Third Party Risk Committee
Disclosure Committee
Group Risk Committee
Guarantee Committee
Elect the Directors Ongoing dialogue
Strateg
ic repo
rtG
overn
ance
Finan
cial statemen
ts
87Petrofac Limited | 2020 Annual report and accounts

Division of responsibilities
Meeting attendanceEach year the Board has a full programme of scheduled meetings, which are supplemented with ad hoc meetings to review any items of business that need to be addressed before the next scheduled meeting. Dedicated strategy days and site visits also form part of our usual programme of events.
Since the outbreak of the COVID-19 pandemic, the impact of which began to be seen in March 2020, all planned physical meetings were cancelled. However, Directors have been able to participate effectively in both scheduled and ad hoc meetings using secure virtual meeting technology, dealing with matters efficiently with the appropriate level of oversight and rigour. During 2020, in addition to the six scheduled meetings, nine ad hoc meetings were held to consider matters such as the appointment of our new Group Chief Executive and those issues requiring further review as a result of the pandemic.
All Directors are invited to attend Audit Committee meetings and the Chairman, Group Chief Executive and Chief Financial Officer, are also invited to attend Remuneration Committee meetings, where appropriate.
To enhance their knowledge of the business, and as part of the process of maintaining an awareness of the Group’s strategic activities and assessing the ability of the management team, members of operational and functional management, one and two tiers below director level, are invited to present at Board and Committee meetings. It is felt these presentations enable Directors to deepen their understanding of Petrofac at both a local and functional level, while
gaining an awareness of specific nuances that may not always be obvious within written reports. Attendance at these meetings also affords senior managers the opportunity to bring matters to the attention of the Board and allows the Board to consider key individuals identified through the succession planning process.
Board site visit The Board generally aims to visit at least one operational site each year. The purpose of these visits is primarily to allow Directors the opportunity to meet with local management, our project teams and graduates, while experiencing first-hand the project development, all with the aim of better understanding the scale and scope of our operations. It is felt that gaining this broader appreciation of our offering enables the Directors to apply relevant context to boardroom decision-making when considering future operational matters.
Unfortunately, plans for our 2020 site visit were cancelled because of the travel restrictions introduced as a result of the pandemic. This was the correct decision to protect the health and wellbeing of our employees and our other stakeholders. However, in January 2020, the Board and Committee meetings were held in our offices in Sharjah, our operational hub within the UAE. During this visit, the Board took the opportunity to meet with our latest cohort of graduates, receiving presentations and holding a Q&A session. The Directors also met with members of the senior leadership team, with the aim of gaining a better understanding of the implementation of strategy and hearing firsthand about key concerns impacting the business.
While in Sharjah, all Directors attended the global launch of our revised Code of Conduct, demonstrating how seriously the Board considers this subject and underpinning their endorsement of management’s training plans. In addition, our three female Non-executive Directors held a specific session with the 20 most senior women within the Group. There was no set agenda for this session, however it provided an ideal opportunity for participants to discuss topics relevant to women across the Group, as well as opportunities for women in industry generally, in an open forum.
Board training The Board believes that continuous training and development supports Board effectiveness. It is committed to offering relevant training opportunities, tailored to each individual, that provide Directors with the necessary resources to refresh, update and enhance their skills, knowledge and capabilities.
With the ever-evolving regulatory landscape in which the Group operates, it is critical that the Board remains aware of recent and upcoming developments in the wider legal and regulatory environment. Board members are therefore encouraged to attend seminars, conferences and training events as required and to proactively identify any areas where they would like additional information to ensure they are adequately informed about the Group. They receive regular updates on legal, regulatory and governance matters, and where relevant, briefings from external advisors on a variety of topics that are significant for the Group and its strategy.
The Secretary to the Board also provides regular updates on corporate governance, legislative and regulatory matters which
2020 Board and Committee meeting attendance
Director Role Appointment date
Board meeting
(scheduled)
Board meeting (ad hoc)
Nominations Committee
Audit Committee
Compliance and Ethics Committee
Remuneration Committee
René Médori Chairman January 2012 6 (6) 9 (9) 5 (5)
Andrea Abt Non-executive Director May 2016 6 (6) 9 (9) 5 (5) 3 (3) 5 (5)
Sara Akbar Non-executive Director January 2018 6 (6) 9 (9) 5 (5) 5 (5)
Matthias Bichsel Senior Independent Director May 2015 6 (6) 9 (9) 5 (5) 5 (5) 3 (3) 5 (5)
David Davies Non-executive Director May 2018 6 (6) 9 (9) 5 (5) 5 (5)
Francesca Di Carlo1 Non-executive Director May 2019 6 (6) 9 (9) 5 (5) 4 (5)
George Pierson Non-executive Director May 2016 6 (6) 9 (9) 5 (5) 5 (5) 3 (3)
Ayman Asfari2 Group Chief Executive January 2002 6 (6) 8 (9) 4 (5)
Alastair Cochran Chief Financial Officer October 2016 6 (6) 9 (9)
1 Ms Di Carlo was unable to attend one Remuneration Committee meeting due to a prior engagement. 2 Mr Asfari retired as Group Chief Executive on 31 December 2020, becoming a Non-executive Director with effect from 1 January 2021. He was absent for one Nominations
Committee meeting and one ad hoc Board meeting when matters relating to his own succession were under discussion.
Petrofac Limited | 2020 Annual report and accounts88
Corporate Governance

may impact the Group. During the year, she provided an overview to the Board on the evolving approaches to governance matters during the pandemic, following the COVID-19 response guidance issued by the UK Financial Reporting Council (FRC). Key focus areas for the Board also included engagement and communications, executive remuneration, financial reporting and financing.
All Directors are required to complete the Company’s e-learning training modules, which include the Code of Conduct, Share Dealing Code, Anti-Bribery and Corruption Standard, and Health and Safety. Training records for all Directors are maintained by the Company Secretariat and are reviewed during the annual Board evaluation process. Over the course of 2020, approximately 80 hours of training were recorded by Directors, with most training undertaken virtually, as formal training events and site visits were cancelled.
Board information and support A tailored approach to developing agendas is adopted for each Board meeting. During 2020, following feedback from the Board evaluation process, agenda formats were updated such that meetings were divided into two sections.
Formal and governance matters are now covered at the start of all meetings; with a significant element of the agenda devoted to strategic matters. This provides the Board sufficient time to review strategic matters and ensures focus is given to those items requiring greatest discussion. We believe the flexibility of this approach allows Directors to engage effectively and encourages scrutiny and constructive debate, with Non-executive Directors able to seek clarification from management where required.
Each scheduled Board meeting includes a report from the Group Chief Executive, which covers health and safety, operational and overall business performance and a report from the Chief Financial Officer including financial performance, cashflow
and net debt, analysts’ reviews and share price performance. Any actions arising from meetings are overseen by the Company Secretariat and updated action lists form the agenda for the next scheduled meeting.
All papers relating to meetings are provided electronically through a dedicated secure application, giving Directors instant access and ensuring information can be provided in a timely manner and in a format and quality appropriate to enable the Board to discharge its duties effectively.
Key focus areasThe main priorities of the Board are primarily: to provide leadership and guidance to support the Group’s strategic priorities, with consideration to the Group’s financial performance; to concentrate on compliance and risk management processes and procedures to ensure they are fully embedded across the Group; to focus on flawless execution, maintaining our bidding discipline in order to secure new orders; and to ensure succession plans are in place throughout the organisation.
Board
Financial matters 29%Governance, inc shareholderengagement 16%Leadership and people development 15%Project approvals 7% Risk management and internal controls 11%Strategic matters 22%
Audit Committee
Governance matters 14%Tax update 3%Risk management and internalcontrol systems 35%Financial reporting including significantjudgements and estimates 27%External Audit, including non-auditservices review 20%
Remuneration Committee
2019 remuneration arrangements, including grant of awards 53%Governance/Investor consultation and Review of external environment 34%Review of employee share plans and performance conditions 13%
Nominations Committee
Board composition 21% Succession planning 40% Diversity and inclusion 11% Governance/Other 10% Talent development 18%
Compliance & Ethics Committee
Whistleblowing 29% Compliance strategy 47% Compliance programme review 11% Governance/Other 11% Third Party Risk Committee 2%
How the Board and Committees spent their time
Strateg
ic repo
rtG
overn
ance
Finan
cial statemen
ts
89Petrofac Limited | 2020 Annual report and accounts

How the Board and the Committees spent their time during 2020 and the key matters considered are set out below.
Deeds of indemnityIn accordance with our Articles of Association, and to the maximum extent permitted by Jersey Law, all Directors and Officers of Petrofac Limited are provided with deeds of indemnity in respect of liabilities that may be incurred as a result of their office. In addition, the Group has appropriate insurance coverage in respect of legal action that may be brought against its Directors and Officers. Neither the Company’s indemnities nor insurance would provide any cover where a Director or Officer was found to have acted fraudulently or dishonestly.
Dealing with potential conflicts of interestIn the event a potential conflict of interest should arise during a term of appointment, processes and procedures are in place for Directors to identify and declare any such conflict, whether matter-specific or situational. The Company’s Articles of Association permit the Board to authorise any such conflicts, which can be limited in scope. Notifications are required to be made by the Director concerned prior to, or at a Board meeting, and all Directors have a duty to update the whole Board of any changes in personal circumstances. During 2020, all conflict management procedures were adhered to, managed and reported effectively.
Regulatory investigation The Company has reported in prior reports that in May 2017 the Serious Fraud Office (SFO) had commenced an investigation into the activities of Petrofac Limited, its subsidiaries and their officers for suspected bribery, corruption and/or money laundering. This investigation remains ongoing.
During the year, the Company continued to engage with the SFO, and the Board was provided with regular updates from the Group General Counsel. The existence, timing and amount of any future financial obligations (such as fines or penalties) or other consequences are unable to be determined at this time and no liability has been recognised in relation to this matter in the consolidated balance sheet at the end of the reporting period.
Division of responsibilities continued
Board evaluationThe Board understands the benefits of annual performance evaluations, both for Directors on an individual basis, as well as for the Board as a whole. It continually strives to improve its effectiveness and believes these evaluations can provide a valuable opportunity to highlight recognised strengths and identify any weaknesses, thereby driving continuous improvement.
Our annual Board evaluation provides the Board and its Committees with an opportunity to reflect on how it operates and consider the quality and effectiveness of its decision-making, the range and level of discussion, and for each member to consider their own contribution and performance.
The 2018 UK Code also requires the Board to undertake a formal and rigorous annual evaluation of its performance and that of its Committees, with a provision of the UK Code that this be externally facilitated every three years. The Board’s external evaluation, in accordance with our three-year cycle, took place in 2019 and the outcomes and actions arising from that review are set out on page 91.
2020 Board evaluation processIn accordance with the UK Code and our three-year cycle, this year’s review of the Board’s effectiveness was facilitated internally by the Chairman and the Secretary to the Board.
This was conducted via a confidential online self-evaluation tool, using the Thinking Board® platform created by Independent Audit, who had carried out the Board’s externally facilitated review during 2019.
Detailed questionnaires were created for the Board and each of the Board Committees, with all Directors and regular meeting attendees requested to respond to the anonymous questionnaires in December 2020. The questionnaires covered a broad range of issues and enabled participants to provide comments on all aspects of performance, including matters such as: Board and Committee composition; meeting conduct; strategy and culture; risk management and internal controls; measuring and monitoring performance; content and scope of topics covered at meetings; the nature and dynamics of Director contributions during meetings; and stakeholder engagement.
These topics aimed to address issues raised in previous evaluations, where participants were asked to score each statement and provide written comments, including areas for improvement. The responses were collated and provided, on an anonymous basis, to the Chairman.
This enabled him to discuss the outputs with Directors and to assess performance and contribution, identifying development areas for individuals and the Board as a whole. The Senior Independent Director also led the Non-executive Directors in a review of the Chairman’s performance, with feedback provided directly.
In consultation with the Secretary to the Board, a detailed report on the output of the effectiveness review was prepared and presented at the March 2021 Board meeting.
The Board performance evaluation cycle
2019 2020 2021
External evaluation
Facilitated by Independent Audit, an advisory firm who work with many FTSE companies in numerous areas of governance, including board evaluation and who have no other connection with the Company.
Final report presented to the Board in February 2020, with actions reviewed throughout 2020.
Internal evaluation
Facilitated by the Chairman and the Secretary to the Board, by way of confidential online self-evaluation questionnaires.
Results collated and presented to the Board in March 2021.
Action plan to be agreed and reviewed throughout 2021.
Internal evaluation
To be facilitated by the Chairman and the Secretary to the Board.
Further details will be provided in next year’s Annual Report.
Petrofac Limited | 2020 Annual report and accounts90
Corporate Governance

Progress against actions arising from the 2019 external effectiveness reviewThe outcome of last year’s external evaluation identified areas where the Board might improve and develop, with progress made throughout the year:
Theme Area for recommended improvement Outcome
Strategy and risk management
The establishment of strategic themes and the planning of deep dives into key areas to help define a more focused strategic risk agenda. Greater use of Non-executive experience with an increase in the extent to which the Directors could provide input and challenge.
Regular updates were provided throughout the year to the Board and its Committees on progress against strategic developments and plans. A risk framework was developed during the year to formalise risk appetite.
Succession and diversity
The continued focus on leadership and talent development initiatives was sought, with further development of succession plans for the Board and senior management. The progression of the diversity agenda was also requested.
Significant focus was given to succession planning throughout the year, not least as a result of the change in Group Chief Executive. Succession and talent management plans were put in place for senior management during the year, with the Nominations Committee maintaining strong oversight of this process. With regards to the progression of the diversity agenda, gender diversity targets were reviewed during the year and announced with the half-year results in August 2020.
Board information The rebalancing of Board and Committee agendas to allow the Directors more time for high-level strategic discussions and decision-making, with paper formats to be streamlined and standardised.
Board and Committee paper templates were developed by the Company Secretariat to help improve the format and length of papers and ultimately the overall length of packs. Board agendas were also reformatted to provide additional time for strategic matters to be presented and discussed by Directors and presenters.
Culture Increased focus on people and culture, both in the boardroom, on sites and at employee forums. Regular updates on culture to be provided to ensure the appropriate behaviours expected are driven through the business.
Our Code of Conduct, which defines the standards and behaviours expected of employees, is a fundamental part of our culture and supports our values, was relaunched at the start of the year. The Board’s oversight of the wider workforce was enhanced through attendance at our Workforce Forums, which met 3 times during the year.
The key themes highlighted from the individual Committee questionnaires were also shared with each Committee Chairman. The conclusions from each survey will form an action plan which will be discussed during Board and Committee meetings held throughout 2021.
2020 Board evaluation outcomeThe overall assessment from this year’s internal evaluation is that the Board and its Committees continue to operate effectively,
to a high standard, and that each has performed well during the year despite the challenges being faced by the Group and the industry. It was agreed that all Directors continued to demonstrate a collaborative and constructive attitude, ensuring an open environment within meetings for participation and challenge.
The Board considered that it had performed well and, in particular, the Directors believed that the Group Chief Executive succession
process was the area where the most value had been added during the year, together with a greater focus given to succession planning in general. There were no material issues identified although as always, there were areas identified for improvement. It was agreed that the key actions as defined by the Chairman would form part of the Board’s agenda for the coming year. These actions are set out in the table below.
The key recommendations arising from the 2020 internal effectiveness review:
Theme Area for recommended improvement
Strategy To provide greater focus on strategic developments in the industry, reviewing the threats and opportunities of an ever-changing market on the development of a longer-term strategy. Regularly review progress against long-term strategic priorities, with increased engagement between the Board and senior executives.
Risk management To calibrate further the Company’s appetite for risk to ensure it remains aligned with emerging longer-term strategy. Carry out deep-dives into projects, to create lesson learned documents for future initiatives, with increased focus on third-party contractor risks.
ESG To give greater focus to the development of the Group’s ESG strategy, and ensure it is fully embedded throughout the organisation and reflected in operating key performance indicators.
Strateg
ic repo
rtG
overn
ance
Finan
cial statemen
ts
91Petrofac Limited | 2020 Annual report and accounts

Stakeholder engagementThe Board has always placed significant importance on listening to stakeholders and establishing and maintaining good relationships. This stakeholder engagement not only allows the Board to understand the impact of any decisions taken by key stakeholders, but also ensures the Board is kept informed of any significant changes in the market, including the identification of emerging risks and trends, which in turn can be factored into strategy discussions. The relevance of each stakeholder group can increase or decrease by reference to the issue under consideration, so processes have been introduced to enable the Board to understand better the needs and priorities of each group during its deliberations. Board and committee papers are now required to include a section on stakeholders’ interests.
We believe that effective stakeholder engagement is central to how Petrofac does business to ensure the successful delivery of our strategy. This ongoing engagement has been particularly important during the COVID-19 pandemic, where stakeholder opinion has been a key consideration of Board discussion. The relationships established before the crisis enabled the business to continue to collaborate with key stakeholders in resolving emerging issues and reaching decisions and solutions.
Open and constructive engagement with major shareholders is also considered vital and enables us to understand their views on governance and explain our performance against strategy. This ensures that what we report on is correctly linked to our risks and opportunities. Such discussions not only focus on delivering increased shareholder value, but also assess the impacts of decisions on the Group’s wider stakeholders.
Engaging with our employees is valued highly by our Board. The introduction of the Workforce Forum in 2019 has been well received both by Directors and employees across the Group, with continued engagement and the sharing of views throughout this challenging year providing insight on the realities being faced by employees. The Board is also kept informed on the outcomes of employee engagement surveys.
Members of management are routinely invited to attend Board and Committee meetings to present on matters under consideration. This enables them to input into discussions, bring key matters to the attention of the Board, and highlight specific nuances that may not always be obvious from the written reports. This engagement provides the Board with the added opportunity of deepening their understanding of the business at both a local and functional level, while allowing them to also consider key individuals who have been identified through the succession planning process.
Section 172 arrangements Under Section 172 of the UK Companies Act 2006, boards have a duty to promote the success of their company for the benefit of their members as a whole, whilst having regard for the interests of employees, the success of their relationships with suppliers and customers, the impact of their operations on the community and environment, and maintaining a reputation for high standards of business conduct.
As a Jersey incorporated company, Petrofac is not required to comply with this legislation. Nevertheless, our Directors are informed by UK practice and, in any event, wish to act in good faith to promote the long-term success of the Group for the benefit of all stakeholders. When making any decisions, each Director is encouraged to act in the way they consider, in good faith, to most likely promote the Company’s success for the benefit of its members as a whole, while having due regard to the Section 172 requirements. As a result, stakeholder considerations are integral to all Board discussions and decisions.
An overview of how and why we engage with our key stakeholders and how we have considered their requirements relating to principal decisions taken during the year to ensure effective and continued engagement are set out on pages 12 to 15.
Investor Relations programme Our Investor Relations (IR) team acts as a focal point for contact with key investors and analysts throughout the year. They schedule an annual programme of meetings with both existing and potential shareholders, as well as analyst and investor meetings. This programme includes presentations to institutional investors and research analysts, as well as question and answer sessions with stakeholders following the publication of our full- and half-year financial results.
As a result of the travel restrictions imposed by the COVID-19 pandemic, face-to-face meetings were understandably curtailed. However, since March 2020, all investor meetings have been held virtually, with more than 140 such meetings held during the period. While not the preferred way to engage with stakeholders, adapting to this new environment ensured that the IR team, as well as the Group Chief Executive and Chief Financial Officer, could maintain their regular dialogue with institutional shareholders focusing on operational matters throughout the year in a more efficient way. Furthermore, it enabled meetings to take place with both European and North American investors on the same day.
Additional meetings were also held with our corporate brokers to better understand shareholder sentiment in light of the ongoing market pressures caused by the pandemic and the impact on both the share price and oil prices.
This engagement allowed the IR team to gain insights on governance matters from a shareholder perspective and included subjects such as succession planning, which held particular relevance following the announcement we made in October 2020 with regards to the change of our Group Chief Executive. Cognisant of the impact of this announcement, the Chairman, who is fully engaged in the IR programme, offered to speak directly with our major shareholders immediately after the announcement was released.
The Board plans to continue to develop its comprehensive programme of stakeholder engagement over the coming year. Analyst research notes are regularly circulated to all Directors and a formal broker’s report is issued to Directors in advance of each Board meeting.
Stakeholder engagement
Petrofac Limited | 2020 Annual report and accounts92
Corporate Governance
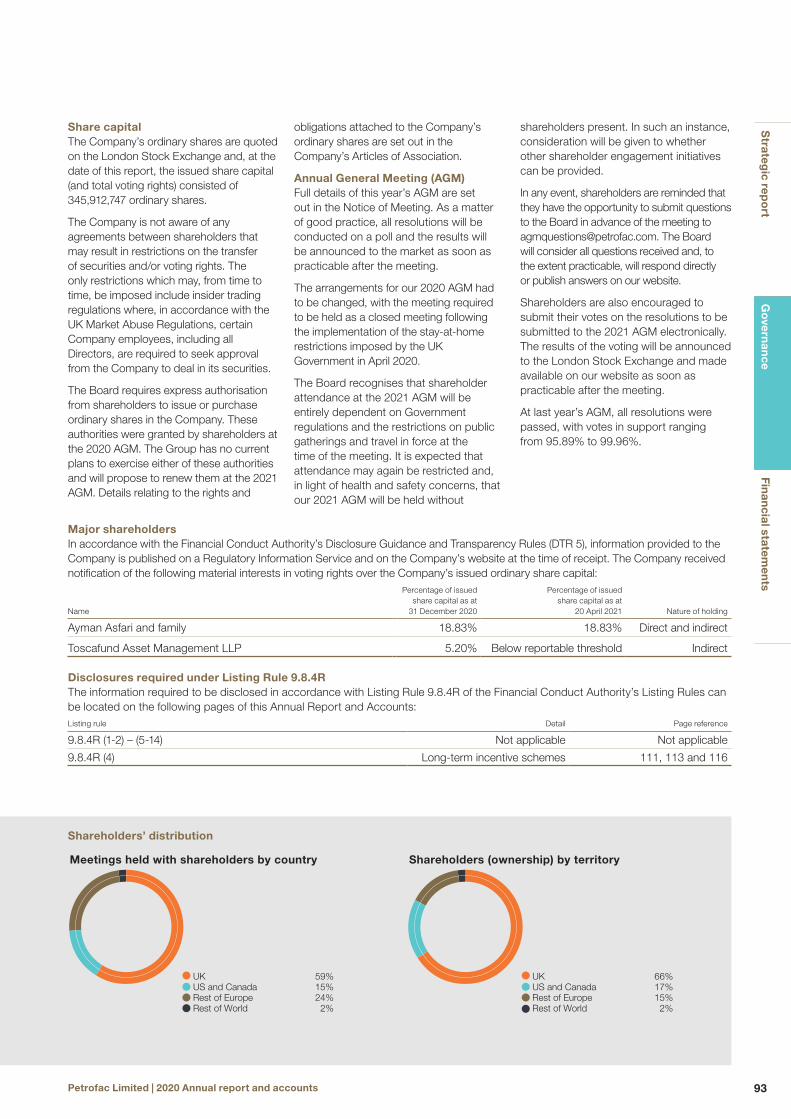
Share capitalThe Company’s ordinary shares are quoted on the London Stock Exchange and, at the date of this report, the issued share capital (and total voting rights) consisted of 345,912,747 ordinary shares.
The Company is not aware of any agreements between shareholders that may result in restrictions on the transfer of securities and/or voting rights. The only restrictions which may, from time to time, be imposed include insider trading regulations where, in accordance with the UK Market Abuse Regulations, certain Company employees, including all Directors, are required to seek approval from the Company to deal in its securities.
The Board requires express authorisation from shareholders to issue or purchase ordinary shares in the Company. These authorities were granted by shareholders at the 2020 AGM. The Group has no current plans to exercise either of these authorities and will propose to renew them at the 2021 AGM. Details relating to the rights and
obligations attached to the Company’s ordinary shares are set out in the Company’s Articles of Association.
Annual General Meeting (AGM) Full details of this year’s AGM are set out in the Notice of Meeting. As a matter of good practice, all resolutions will be conducted on a poll and the results will be announced to the market as soon as practicable after the meeting.
The arrangements for our 2020 AGM had to be changed, with the meeting required to be held as a closed meeting following the implementation of the stay-at-home restrictions imposed by the UK Government in April 2020.
The Board recognises that shareholder attendance at the 2021 AGM will be entirely dependent on Government regulations and the restrictions on public gatherings and travel in force at the time of the meeting. It is expected that attendance may again be restricted and, in light of health and safety concerns, that our 2021 AGM will be held without
shareholders present. In such an instance, consideration will be given to whether other shareholder engagement initiatives can be provided.
In any event, shareholders are reminded that they have the opportunity to submit questions to the Board in advance of the meeting to [email protected]. The Board will consider all questions received and, to the extent practicable, will respond directly or publish answers on our website.
Shareholders are also encouraged to submit their votes on the resolutions to be submitted to the 2021 AGM electronically. The results of the voting will be announced to the London Stock Exchange and made available on our website as soon as practicable after the meeting.
At last year’s AGM, all resolutions were passed, with votes in support ranging from 95.89% to 99.96%.
Major shareholders In accordance with the Financial Conduct Authority’s Disclosure Guidance and Transparency Rules (DTR 5), information provided to the Company is published on a Regulatory Information Service and on the Company’s website at the time of receipt. The Company received notification of the following material interests in voting rights over the Company’s issued ordinary share capital:
Name
Percentage of issued share capital as at
31 December 2020
Percentage of issued share capital as at
20 April 2021 Nature of holding
Ayman Asfari and family 18.83% 18.83% Direct and indirect
Toscafund Asset Management LLP 5.20% Below reportable threshold Indirect
Disclosures required under Listing Rule 9.8.4R The information required to be disclosed in accordance with Listing Rule 9.8.4R of the Financial Conduct Authority’s Listing Rules can be located on the following pages of this Annual Report and Accounts: Listing rule Detail Page reference
9.8.4R (1-2) – (5-14) Not applicable Not applicable
9.8.4R (4) Long-term incentive schemes 111, 113 and 116
Shareholders’ distribution
UK 59% US and Canada 15% Rest of Europe 24% Rest of World 2%
Meetings held with shareholders by country
UK 66% US and Canada 17% Rest of Europe 15% Rest of World 2%
Shareholders (ownership) by territory
Strateg
ic repo
rtG
overn
ance
Finan
cial statemen
ts
93Petrofac Limited | 2020 Annual report and accounts

Audit Committee report
Role and responsibilities of the Committee: — Monitors the integrity of the Group and Company’s financial statements — Reviews formal announcements relating to the Group’s financial performance, position and prospects — Evaluates the significant financial reporting judgements and estimates and related disclosures including going concern assessments and viability statements — Reviews the effectiveness of risk management and internal control systems, and provides reasonable assurance to the Board — Monitors and reviews the effectiveness of the Group’s internal audit function — Manages the appointment and oversees the independence, effectiveness and remuneration of the Group’s external auditor — Approves the remuneration and terms of engagement of the Group’s external auditor and makes recommendations to the Board regarding their re-appointment — Develops, implements and monitors compliance with the non-audit services policy —Advises the Board on how it has discharged its responsibilities and considers whether the Annual Report and Accounts, taken as a whole, is fair, balanced and understandable
David DaviesChairman of the Audit Committee
Dear shareholderThroughout 2020, the Committee monitored the impact of the Group’s strategy and operations of the Group’s risk management and internal controls frameworks. The COVID-19 pandemic presented some unexpected challenges, not least an increased exposure to financial and operational risks, coupled with enhanced regulatory financial reporting requirements to be considered as a result of the pandemic. The Committee responded to these matters by actively challenging the effectiveness of management’s risk assessment processes and the appropriateness of financial reporting judgements and estimates to ensure the long-term health of the business.
Committee focus during the yearThe Committee continued to review in detail the principal and emerging risks being faced by the Group in 2020. In response to the pandemic and subsequent decline in oil price, the Group’s principal risks were expanded to cover pandemics and other macro-economic changes, with some of the principal risks also adjusted to better capture the underlying risks and the priorities impacting the Group. This has allowed the Committee to focus on the evolving Group priorities and ensure that the appropriate risks are being considered and effectively managed.
The Committee also reviewed and concurred with the conclusion of an evaluation performed by the internal Enterprise Risk Management team that the quality and effectiveness of risk
As in previous years, the Committee benefited from the external auditor’s attendance at Committee meetings throughout 2020. During these meetings, EY was available to provide comment on senior management discussions regarding significant judgements and estimates and highlight any areas that required further consideration. Prior to submitting their final Auditors’ Report, EY provided its opinion to the Committee on the appropriateness of management’s significant judgements and estimates based on the audit procedures performed at the year-end.
The Audit Quality Review Team of the Financial Reporting Council (FRC) wrote to me in February 2021 as Chair of the Committee, setting out the scope of its review of EY’s audit of the Group and Company’s financial statements for the year ended 31 December 2019, the principal findings and the actions which EY proposed to take in response. The review raised one important matter regarding the going concern assessment period and in particular the clarity of the duration of the assessment period. The Committee considered this report and discussed the proposed actions with the external auditor, noting in particular the planned enhancement to audit documentation to make it clear what the period covered by the going concern assessment was. Petrofac has also enhanced its disclosure of the going concern assessment period (see page 136).
oversight, as measured by the level of reporting provided to the Board and its Committees was deemed to be effective.
During the year, both in their examination of the interim financial report as well as the preparation of the 2020 financial statements, the Committee placed a particular focus on management’s consideration of the appropriateness of adopting the going concern basis of financial reporting.
Uncertainties created by the COVID-19 pandemic, the impact on the level of projects undertaken by our customers as well as guidance on the matter provided by the FRC, have all contributed to the significance of going concern considerations being elevated. As a result, work was undertaken to review the going concern assurance process, with the Committee reviewing the financial reporting considerations of COVID-19 and the Group’s business action plan response.
The Committee monitored the risk assessment process and the actions taken to improve the Group’s cost competitiveness in order to protect the long-term health of the business. In preparing the 2020 financial statements, a robust approach was applied to assess whether material uncertainties existed relating to events or conditions that may cast significant doubt upon the Group’s ability to continue as a going concern. Reflecting the importance of the question, the Committee invested considerable time in concluding that the going concern basis of financial reporting remained appropriate.
Petrofac Limited | 2020 Annual report and accounts94
Corporate GovernanceCorporate Governance

Principal matters considered during the year by the Audit CommitteeThe Committee met five times during the year, coinciding with key points in the financial reporting cycle. The principal matters reviewed and considered were as follows:
2020
January — Group Finance update — Draft year-end accounting matters — Draft going concern assessment — Draft viability statement assessment — 2019 non-audit services and fees — Treasury Risk Management policy review — Annual tax update — Group external auditor‘s draft year-end audit observations
February — Internal Audit report — Principal risk report — Internal control framework assurances — CFO report — Final year-end accounting matters — Final going concern and viability statements — Draft year-end financial results press release — Group and Company’s 2019 financial statements — Directors’ Remuneration Report — Group external auditor’s year-end audit report — Year-end representation letters — Legal entity restructuring project review
May — Principal risk report — Internal Audit report — Insurance renewal update — Financial reporting considerations of COVID-19 and business action plan response
— Group external auditor’s audit engagement fee review — Update on audit and governance landscape
August — Principal risk report — Review of Board oversight of Principal Risks — Internal Audit report — CFO Report — Half-year tax update — Half-year financial results — Half-year accounting matters — Going concern review — Half-year non-audit services and fees — Update on audit and governance landscape
November — Principal risk report — Internal Audit report — Draft internal audit programme for 2021 — Group external auditor’s report including draft engagement letter — Audit planning report for the year ending 31 December 2020 — Committee Terms of Reference review — Update on non-audit services and fees — Legal entity restructuring project review
Looking aheadOver the coming year, it is likely that the Group will continue to face significant disruption and uncertainty due to COVID-19 and the market dynamics of the sector.
The Committee will maintain its focus on significant judgements and estimates impacting financial reporting as a result of the pandemic. Work will also continue on further enhancing the Group’s principal risks, including the articulation of overall risk appetite to ensure effective oversight of risk management and internal controls by the Committee. Following its identification as an emerging risk during 2019, energy transition was embedded as a sub-risk under the Group’s principal risks during 2020 in line with the Group’s strategy. During 2021, an emerging risks dashboard will be submitted to the Committee for their review. This will be monitored on an ongoing basis to ensure the risks have appropriately been identified, assessed, treated and reported.
Following the publication of the Brydon Report in December 2019, the Committee received regular updates during the year from the Group’s auditor on the development of the proposed reform of the audit industry and its overall governance. While further consultation on the Brydon Report recommendations were deferred, the long-awaited audit reform and corporate governance consultation paper was published by BEIS in March 2021. This government white paper sets out several recommendations and proposals for audit and governance reform, which if approved, are expected to be enacted into legislation over the coming year. The Committee will therefore continue to monitor the ongoing developments and the expected implications of this report on the Group, with general governance matters remaining on the agenda for Committee discussion throughout 2021.
David DaviesChairman of the Audit Committee20 April 2021
AccountabilityMembership, role and responsibilitiesThere have been no changes to the Committee’s membership during 2020. As required by the 2018 UK Corporate Governance Code (UK Code), the Committee is satisfied that all three of its members meet the expected independence and experience parameters. David Davies has significant, recent and relevant financial experience, while Matthias Bichsel and George Pierson have competence relevant to the Group’s sector. Furthermore, all members of the Committee have extensive general management and commercial expertise.
Their biographical details are set out on pages 82 to 84.
The Committee assists the Board in the effective discharge of its responsibilities for financial reporting, internal control and risk management and believes it remains well positioned to challenge and debate the performance and relevance of the Group’s financial reporting, risk management and internal controls to safeguard the interests of shareholders and other stakeholders.
To assist the Committee during its deliberations, all other Board members are invited to attend Committee meetings. In addition, the Head of Audit, Group Financial Controller, Group Treasurer and Head of Tax and Senior Enterprise Risk Manager are each invited to attend meetings when required. As set out in our Directors’ statements on page 118, the Directors are responsible for ensuring that the Group and Company’s financial statements are prepared in accordance with IFRS.
Strateg
ic repo
rtG
overn
ance
Finan
cial statemen
ts
95Petrofac Limited | 2020 Annual report and accounts

The Group has an internal control and risk management framework in place, which includes policies, standards and procedures to ensure that adequate accounting records are maintained, and transactions are accurately recorded.
Furthermore, the Committee has oversight of financial excellence initiatives, which remain under continuous review and which are designed to strengthen our control environment and improve financial reporting.
This process ensures that the Group’s financial reporting process and communications to the market, provide a fair, balanced and understandable assessment of the Group’s performance, position and prospects. In addition to the principal matters considered during the year, as set out above, the Committee also reviewed the 2020 Annual Report and Accounts in early 2021.
Internal Audit and internal controlsInternal Audit is an independent assurance function available to the Board, the Committee and all levels of management.
The role of Internal Audit is to provide independent and objective assurance and advice on the overall effectiveness of risk management, internal control systems, and governance processes across the Group. Internal Audit appropriately challenges and supports the Executive Management to improve the effectiveness of these processes and provides assurance that any corrective action required is taken in a timely manner.
The Head of Internal Audit attends all Committee meetings, during which his reports are considered and discussed in detail. The Committee also meets with him without executive management present, to discuss, among other matters, management’s responsiveness to any Internal Audit recommendations and the effectiveness of the internal audit process. The Head of Internal Audit also has direct access to the Committee Chairman and meets with the Group’s external auditor whenever required.
Each year, Internal Audit develops an annual risk-based audit programme for approval by the Committee. This is supported by regular reporting that enables the Committee to monitor delivery of the audit programme. The Group’s internal audit programme for 2020 was considered and approved by the Committee in November 2019. The 2020 programme was further developed during the course of the year to take into account
the Group’s principal risks, identifying where they primarily occur in the business; through discussions with the Committee and senior management; by recognising changes in the Group and the external environment; and with consideration to prior audit coverage.
In approving the 2020 audit programme, the Committee considered the coverage of the Group’s principal risks by the proposed audits. It was agreed that primary focus should be on the design and operating effectiveness of controls to manage risks associated with overarching management controls, such as Code of Conduct and compliance due diligence processes; controls designed to prevent non-compliance with laws and regulations, such as money laundering, trade sanctions, and remote office controls; project level controls such as third-party management, project management, and logistics management; HSSEIA; financial controls; master data management and access controls in the Group-wide ERP project.
One of the Committee’s key roles is to challenge this audit plan, and specifically to determine whether the key risk areas identified as part of our risk management process are being audited with appropriate frequency and depth. Following the completion of each planned audit, Internal Audit seeks feedback from management and agrees an implementation plan for required corrective actions.
Quarterly reports are provided to the Committee, detailing progress and including key findings of the audits undertaken during the period under review. Where any significant areas of concern are highlighted, the Committee challenges management and actions plans are agreed to address matters raised, detailing any action that may be required, with follow-up audits arranged. The Committee also considered and approved the 2021 internal audit programme in November 2020.
During 2020, 19 internal audit assignments were carried out, the results of which were included in Internal Audit’s annual assessment of the audited elements of the system of internal controls. In response to the COVID-19 restrictions, Internal Audit implemented an enhanced and agile audit methodology, consisting of weekly team reviews to inform audit testing and align risks, and leveraging technology where possible.
Where new audit findings were identified, management actions were agreed and all Group level findings and agreed management actions were reported to the Committee, thus enabling progress to be monitored and any trends to be identified.
Group level findings were carefully considered by the Committee, with management given direction to ensure the necessary steps were taken to mitigate any issues. In November 2020, the Committee reviewed and approved the Internal Audit Charter for 2021. To assist Group Compliance, Internal Audit continued to assist in the triaging of allegations raised from the confidential Speak Up line to the appropriate teams for investigation. Internal Audit continued to provide support to the relevant investigations based on specific requests from Group Compliance.
Petrofac also seeks to ensure that a sound system of internal controls, based on the Group’s policies, standards and procedures, remains in place for all material associate and joint arrangement entities. In the event any failings or weaknesses are identified in the course of a review of internal control systems, management puts in place robust actions to address these on a timely basis, with action closures reported to and monitored by the Committee.
As with all companies, an internal control system can provide only reasonable and not absolute assurance against material financial misstatement or fraud, as it is designed to manage rather than eliminate the risk of failure to achieve business objectives. However, the Committee is content that our ongoing reviews have established that management places a strong focus on closing audit actions and ensuring timely completion.
Treasury As part of its remit, the Committee supports the Board in monitoring performance against the Group’s funding plan, as well as reviewing the Group’s compliance with the Treasury Risk Management policy, a copy of which is available at www.petrofac.com. During the year, the Committee maintained significant focus on the Group’s funding and liquidity, including consideration of ongoing funding initiatives, in light of changing and challenging market conditions. The Committee closely monitored the economic impact of COVID-19 and its effect on financing and liquidity. The Committee were aware of the priorities for the Group during 2021, which included amongst other matters, the refinancing of the Group’s revolving credit facility.
Audit Committee report continued
Petrofac Limited | 2020 Annual report and accounts96
Corporate Governance
FAIR, BALANCED AND UNDERSTANDABLE
At the request of the Board, the Committee considered whether, in its opinion, the 2020 Annual Report and Accounts (the “Annual Report”) when taken as a whole, is fair, balanced and understandable, and whether it provides the information necessary to assess the Group’s position, performance, business model and strategy.
The process was led by an internal team, which consisted of members of the Group Finance, Company Secretariat, Group Communications and Investor Relations teams, who each own and prepare sections of the Annual Report. This team also performs procedures to provide assurance to the Committee that the Annual Report is balanced, complete and accurate.
Each Committee Chair participated in the preparation of their individual committee report, with the Board and management afforded the opportunity to submit their comments during the preparation process. The Committee was then presented with a full draft of the Annual Report for comment before it was presented to the Board for final approval. The Group’s external auditor, having reviewed the report at various stages of its development, provided confirmation that in their opinion the Annual Report is fair, balanced and understandable. The Group’s external auditors’ report can be found on pages 120 to 130.
The Committee formed its opinion by considering the information provided during Committee meetings and discussions held throughout the year. In particular, the Committee considered the following criteria to determine whether the Annual Report, taken as a whole, could be considered fair, balanced and understandable.
FAIR BALANCED UNDERSTANDABLE
Definition: not exhibiting bias, reasonable or impartial, done according to the rules
To determine whether the Report was fair, the Committee considered the following questions:
— Is the whole story being presented? Have any sensitive areas been omitted?
— Do the key messages clearly reflect the principal risks, including those which may threaten the Group’s strategy, business model, operation, future performance, solvency and liquidity?
— Are the narrative sections consistent with the financial statements?
— Are the descriptions of the business, principal risks and uncertainties, strategies and objectives in the Annual Report consistent with the Board’s understanding?
— Has sufficient time been given to the consideration of going concern and viability statements?
Definition: even-handed, taking account of all sides on their merits without prejudice or favouritism
To determine whether the Report was balanced, the Committee considered the following questions:
— Is this Annual Report a comprehensive document that would provide shareholders with a full overview of the Group?
— Are the key judgements referred to in the narrative reporting and the key financial and internal control matters reported in the Committee’s Report consistent with the disclosures of key estimation uncertainties and significant judgements set out in the financial statements?
— Are the key audit matters included in the Group external auditor’s report consistent with the significant judgements and estimates disclosed in the Annual Report?
Definition: having a meaning or nature that can be understood, able to be accepted as normal, reasonable or forgivable
To determine whether the Report was understandable, the Committee considered the following questions:
— Is the structure of the Annual Report clear and understandable, with important messages highlighted appropriately throughout?
— Is the layout clear, with good linkage throughout in a manner which reflects a cohesive story?
— Is the Annual Report written in a language that is accessible for all stakeholders?
— Are the disclosures presented within the Group and Company’s financial statements clear and complete?
CONCLUSION
The Committee assessed each of the points raised and following its review, concluded it was content to provide assurance to the Board that the 2020 Annual Report were representative of the year under review, presented a fair, balanced and understandable overview and provided shareholders with the necessary information to assess the Group’s position, performance, business model and strategy. Following receipt of this assessment, the Board approved the Committee’s recommendation that a fair, balanced and understandable statement reflecting this conclusion could be provided. This statement is set out on page 118.
Strateg
ic repo
rtG
overn
ance
Finan
cial statemen
ts
97Petrofac Limited | 2020 Annual report and accounts

Significant judgementsThe Committee’s role is to assess whether the judgements or estimates made by management in preparing the Group and Company’s financial statements are reasonable and appropriate. Set out below are what we consider to be the most significant accounting areas that required a high level of judgement or estimation during the year and how these were addressed:
Focus area Why this area is significant Role of the Committee Conclusion More information
Revenue and margin recognition on fixed-price EPC contracts
The quantification and timing of revenue and profit recognition from fixed-priced EPC contracts is a material driver of the Group’s financial performance and position, which is subject to significant management judgement and estimation. There is an inherent risk of bias or error in judgements and estimates concerning, for instance: variable consideration e.g. variation orders, liquidated damages; contract contingencies; and estimate to complete costs forecasts.
The Committee reviewed and challenged the reasonableness of evidence to support judgements and estimates regarding revenue and profit recognition, including non-recognition in certain instances, through regular discussions with executive management. The Committee focused on variable consideration; contract contingencies; and estimate to complete costs forecasts, particularly in light of the deterioration in market conditions triggered by the pandemic and the subsequent decline in oil prices. The Group’s external auditor also challenged management on the key drivers of revenue and profit recognition on fixed-price EPC contracts and reported their findings to the Committee.
The Committee concluded after thorough deliberation that the quantification and timing of revenue and profit recognition on fixed-price EPC contracts, as well as associated reporting, was in accordance with the relevant International Financial Reporting Standards and the Group’s accounting policies.
Financial Review on page 75 and Note 4 to the Financial Statements on page 150
Recoverability of PM304 oil and gas asset and accounting for asset disposals and contingent and deferred consideration
Several key judgements and estimates, under conditions of significant uncertainty, were required in relation to the recoverable amount of the operating segment’s assets. This also included determining the fair value of the assets and fair value of contingent consideration amounts receivable for disposed assets and deferred consideration for past disposals, in light of current adverse economic developments.
The Committee evaluated the reasonableness and appropriateness of internally generated data and other data points used in determining judgements and estimates through reviewing and challenging management papers presented. The Committee also examined the notes to the consolidated financial statements to ensure the risks associated with these judgements and estimates were clear and complete.
The Committee was satisfied that reasonable and appropriate judgements and estimates were applied by management on the financial recognition, measurement and disclosure of these focus areas.
Financial Review on page 78 and Note 6 to the Financial Statements on page 154
Taxation The global nature of the Group’s operations and the increasingly complex nature of local tax rules increases the risk of an income tax expense misstatement. Management is required to make several judgements and estimates around: uncertain tax treatments given the commercial structure of individual contracts; the increasing activity of the relevant tax authorities; and the valuation and recoverability of deferred tax assets.
The Group’s tax judgements and estimates were reviewed by the Committee to ensure that the recognition of income tax expense, uncertain tax treatments, and deferred tax assets were based on reasonable and appropriate assumptions. Reports outlining principal tax matters were reviewed and discussed with management and the Group’s external auditor, who also reported to the Committee on its procedures and findings in relation to the Group’s tax affairs.
The Committee was satisfied that taxation related judgements and estimates were reasonable and appropriate and that the Group’s tax affairs were being managed, accounted and reported in accordance with the relevant legislation, International Financial Reporting Standards and Group policies.
Financial Review on page 77 and Note 2 to the Financial Statements on page 148
Audit Committee report continued
Petrofac Limited | 2020 Annual report and accounts98
Corporate Governance

Focus area Why this area is significant Role of the Committee Conclusion More information
Going concern Management is required to make a decision whether to prepare the Group’s financial statements on a going concern basis.
The Committee performed a robust going concern assessment over the going concern assessment period to 30 April 2022 (the “Assessment Period”) and the period beyond the Assessment Period. This included reviewing and challenging the Group’s forecast cash flows, liquidity and borrowing requirements; evaluating downside scenarios considered to be severe but plausible based on the Group’s principal risks and uncertainties; appraising the mitigation strategies available to management. The Committee also evaluated the going concern disclosure to ensure that it was fair, balanced and understandable.
The Committee concluded, after rigorously evaluating relevant, available information, that there are no events or conditions that may cast significant doubt upon the Group’s ability to continue as a going concern over the Assessment Period and that the continued use of the going concern basis of preparing the Group’s financial statements remained appropriate.
The Committee concurred with management that there was a significant judgement in the period beyond the Assessment Period associated with the Group’s ability to secure – or extend existing facilities by – at least US$235 million by June 2022 when the current revolving credit facility matures.
The Committee recommended to the Board that the going concern basis of preparing the financial statements should be adopted together with management’s proposed going concern disclosure.
Notes 2.5 and 2.7 to the Financial Statements on pages 136 to 137 and 139
Provision recognition or contingent liability disclosure of Her Majesty’s Revenue and Custom’s (HMRC) challenge to the historical application of National Insurance Contributions to workers in the United Kingdom’s Continental Shelf
Several key judgements and estimates, under conditions of significant uncertainty, were required in relation to the determining whether recognition or disclosure of this matter was required. This included but was not limited to: assessing the applicability of tax legislation cited by HMRC to the facts of the enquiry; and critically evaluating advice from independent legal and tax specialists.
The Committee evaluated management’s assessment of developments during 2020. In particular, the Committee focused on ensuring that management was critically appraising advice provided by independent legal and tax specialists as well as ensuring that there was an awareness and prevention of inherent bias implicit in management’s position.
The Committee concluded, after reviewing and challenging management, that it remained appropriate for this matter to continue be disclosed as a contingent liability note in the consolidated financial statements as it is not probable that an outflow of resources embodying economic benefits will be required to settle the present obligation.
Note 31 to the Financial Statements on page 182
The SFO investigation
The ongoing SFO investigation into the Group has had and may continue to have an impact on the Group’s commercial position in key markets and, until the investigation is concluded, the possibility of future financial obligations (such as fines or penalties) will remain.
Updates on the ongoing investigation were provided by the Group General Counsel and external legal advisors, outlining the likelihood of potential financial obligations, and assessing the impact to going concern and viability, in the context of the developing situation during the year.
The Committee was satisfied with the treatment of such possible financial obligations as a contingent liability disclosed in the notes to the financial statements rather than the recognition of a provision in the consolidated balance sheet. The Committee was also satisfied that disclosures on this matter were fair, balanced and understandable.
Note 31 to the Financial Statements on page 182
The above description of the significant judgements should be read in conjunction with the Independent Auditor’s Report on pages 120 to 130 and the significant accounting policies disclosed in the notes to the consolidated financial statements. Further details on significant accounting judgements and estimates can be found in note 2 to the consolidated financial statements on pages 136 to 148.
Risk managementThe Board has overall responsibility for establishing the Group’s risk appetite, its enterprise risk arrangements and for ensuring that the Group has in place an effective risk management framework. In accordance with guidance set by the FRC, the Board has delegated to the Committee responsibility for monitoring and reviewing the integrity and effectiveness of the Group’s overall systems of risk management and internal controls.
The Board has established an organisational structure with clear operating procedures and defined delegated authorities. Regular reporting supports and develops the continuing robust assessments of the principal and
emerging risks facing the Group, including their impacts on the enterprise and its future sustainability.
The Group’s principal risk report captures and assesses the principal and emerging risks facing the Group, outlines how these risks are managed and monitors exposures against our risk appetite. This document is updated quarterly and is considered at both Committee and Board level throughout the year.
The Committee receives regular updates from the Head of Audit, the Senior Enterprise Risk Manager, Group Financial Controller, Group Treasurer and Head of Tax and other senior managers. Additional reports are also submitted by the external
auditor to assist the Committee, and ultimately the Board, in their annual assessment of the effectiveness of the Group’s risk management and system of internal controls. In reviewing each of the submitted reports, the Committee considers how effectively risks have been identified; how they have been mitigated and managed; whether actions are being taken promptly to remedy any failings or weaknesses; and whether the causes of the failing or weakness have indicated poor decision-making, a need for more extensive monitoring, or a reassessment of process effectiveness.
These help to provide the Committee with a balanced assessment of the Group’s principal risks and the effectiveness of
Strateg
ic repo
rtG
overn
ance
Finan
cial statemen
ts
99Petrofac Limited | 2020 Annual report and accounts

the systems of internal controls. Based on this assessment, our risk management framework and processes operated as expected during the year to identify and assess any possible responses to the principal risks and uncertainties faced by the Group.
During 2020, we continued to improve our risk management systems by expanding the risk review process to cover the macro-economic changes being faced by the Group, such as the risk impact of the COVID-19 pandemic in our key markets.
Additionally, we considered the internal risk impacts of the pandemic such as IT security and resilience arising from the new remote working conditions. We also carried out a comprehensive review of our principal and emerging risks in alignment with the Group’s business strategy and developed a more formal articulation of the Group’s risk appetite.
Throughout the year, the Group’s principal risks have been regularly reviewed by management to provide assurance on the robustness, integrity and effectiveness of the systems in place, including those that could threaten its business model, operations, future performance, solvency and liquidity. The Committee also maintained oversight of a Group entity restructuring project, which is being undertaken to ensure that the Company’s legal structure can adequately support and reflect how the business operates globally.
The rationale for the project is to simplify the corporate structure by separating core business streams, whilst maximising the efficiency of functional business activities. The project was delayed due to changing priorities in the wake of the COVID-19 pandemic but was revived towards the end of 2020. The project is being run by our Group Legal team, in conjunction with Group Finance and Group Tax and regular updates are presented to the Committee.
Further details of the Group’s risk management systems and controls, including an overview of the risk governance and management frameworks detailing the approach to risk management and key changes to the principal risks during 2020 are presented on pages 60 to 67.
Insurance programme Petrofac utilises the insurance market, as a risk transfer mechanism, to cover the types of insurable risks normally associated with an energy services provider, operating in similar challenging territories across the world. The cover procured is structured under a Group-wide insurance programme, designed to avoid potential coverage gaps and duplication across the Group, whilst also ensuring that the Group benefits from economies of scale. The effectiveness of the various global insurance policies is continually challenged against business activities, to ensure that the insurance cover will respond to our ever-changing risks exposures. This stress-testing also provides additional certainty that our cover remains as wide as commonly available across the insurance market, whilst continuing to represent a cost-effective risk transfer solution, considering various factors, including: policy limits, deductible levels and policy conditions.
During 2020, a structured and targeted marketing exercise concerning the main Group policies was undertaken. As reported in the 2019 Annual Report and Accounts, the insurance market has become increasingly challenging as underwriters reduce their appetite for certain risks, particularly risks associated with the oil and gas industry, which has resulted in a reduction in market capacity, blanket rate increases and more restricted cover. The impact of high claims and class actions in some areas, as well as the industry’s response to COVID-19, are expected to result in current market conditions continuing or worsening during 2021. The Group insurance policies fall for renewal in April 2021 and whilst the outcome has yet to be finalised, the 2021 premium is expected to represent an estimated 2% increase, compared with 2020.
AssuranceAt the year-end, and as required by the UK Code, formal assurance is provided to the Board that effective governance, risk management and internal control processes are in place and remain relevant, to ensure that the Group will continue to be viable for at least the next three years. This assurance covers all material controls, including strategic, financial, operational and compliance controls. Further details on the overall control processes are set out on pages 96 and 99.
Group external auditorEY continued as the Group and Company’s global external auditor throughout the year. Following completion of a formal tender process in 2016, EY was reappointed as the Group’s external auditor, having been in place since October 2005. In accordance with regulation, the lead audit partner responsible for the Group audit was rotated at the end of the 2017 audit, and will rotate again after the 2022 audit.
The Committee considers the effectiveness of the external auditor on an ongoing basis, considering its independence, expertise, performance and understanding of the Group, its resourcing capabilities, culture, and objectivity. The Committee remains satisfied, through its own observations and enquiries, as well as the interactions with executive management throughout the year, with the independence and objectivity of the external auditor and the effectiveness of the audit process. In making this assessment, the Committee gave due consideration to the information and content of reports and the advice provided, the execution of the audit plan, and the robustness of EY’s understanding and challenge to management on key accounting matters.
During the year, the Committee met with the lead audit partner on several occasions without management present, to discuss a range of customary financial reporting and internal control matters. The Committee Chairman also maintained regular contact with the lead audit partner during the year outside of the formal meeting schedule, discussing formal agenda items ahead of upcoming meetings and reviewing any other significant matters.
Each year, EY submit their proposed audit strategy and scope, thereby ensuring the audit can be aligned with the Committee’s expectations. This work is carried out with due regard to the identification and assessment of business and financial statement risks that could impact the audit as well as continuing developments within the Group.
Audit Committee report continued
Petrofac Limited | 2020 Annual report and accounts100
Corporate Governance

During 2020, the audit scope included management’s judgements and estimates concerning fixed-price engineering, procurement and construction contracts; robustness of managements going concern and viability statement assessments and disclosures; impairment assessments and fair value remeasurements; uncertain tax treatments and recoverability of deferred tax assets; consideration of the macro-economic challenges being faced by the Group as a result of the COVID-19 pandemic in key markets; HMRC’s challenge to the historical application of NIC; and accounting matters arising from the SFO investigation.
The Committee did not engage the Group’s external auditor to perform non-mandatory review procedures on the Group’s 2020 half-year financial statements. The Group’s management team held workshops with the Group auditor in attendance to discuss significant judgements and estimates made at the 2020 half-year reporting, which formed part of the auditor’s year-end audit planning process.
Non-audit servicesIn order to preserve the independence and objectivity of the external auditor, the Group has a non-audit services policy that restricts the nature of non-audit services which can be provided by the external auditor. This policy was reviewed during the year and amended to reflect the FRC’s latest Ethical Standards and the more restrictive list of services that are now permitted for an equivalent UK company with a premium listing.
The policy provides clear definitions of the services that our external auditor may and may not undertake. To ensure compliance, the Committee reviews the Group’s cumulative non-audit expenditure each year and, gives prior approval to the appointment of EY before any work is carried out should the nature or size of the proposed work require it.
The Committee is satisfied that EY’s objectivity and independence was not impaired during the year by any non-audit service agreements and confirms there were no breaches to the policy during 2020. In addition, EY has confirmed that it was compliant with APB Ethical Standards in relation to the audit engagement.
A summary of this policy is set out below, while a copy of the full policy can be found at www.petrofac.com. The non-audit spend for the year, as a percentage of the overall audit fee, was 4.2% (2019: 19.1%), with the majority of costs relating to audit related assurance services.
Non-audit services policy summary: — There is a general prohibition on the provision of non-audit services by the Group external auditor (and its network) which will apply to Petrofac Limited and its subsidiaries. A narrow list of permitted non-audit services will continue to be allowed — Certain non-audit services are subject to an absolute prohibition. — Permitted non-audit services (other than those required by national legislation) provided to Petrofac Limited and its subsidiaries are subject to a 70% cap (the Cap) — The Cap is defined as permitted non-audit fees (other than those required by national legislation) expected to be incurred in the current financial year not exceeding 70% of the average Group statutory audit fees for the previous three financial years — If the Cap is expected to be breached then the Audit Committee must be informed in advance to ensure that enhanced procedures are performed to obtain assurance on the Group external auditor’s independence and objectivity (as defined by reference to the FRC’s Revised Ethical Standard 2019)
— All permitted non-audit services are subject to the prior approval of the Committee in advance of work commencing, subject to limited exceptions — The Chief Financial Officer’s (the CFO) approval is required prior to engaging the Group auditor on any pre-approved permitted non-audit services — Committee pre-approval for permitted non-audit services is given where the estimated engagement fee in any one financial year is below US$50,000 — All services with estimated fee levels above the US$50,000 threshold must be sent to the Committee for approval prior to commencement of the engagement even if defined as permitted non-audit services — The CFO will ensure that a full list of permitted non-audit service engagement, associated fees and continued compliance with the Cap is presented to the Committee every six months unless the Cap is expected to be breached — The Audit Committee will seek assurance at least once a year from the Group auditor on its policy and safeguards to maintain independence and objectivity
Strateg
ic repo
rtG
overn
ance
Finan
cial statemen
ts
101Petrofac Limited | 2020 Annual report and accounts

Nominations Committee report
Role and responsibilities of the Committee: — Review the composition, size and structure of the Board and its committees, taking into consideration the skills, knowledge, experience, diversity of gender, social and ethnic backgrounds and cognitive and personal strengths of Directors — Identify and recommend for Board approval suitable candidates to be appointed to the Board, fully evaluating the balance of existing skills, knowledge and experience required to support the strategic objectives of the Group — Consider the effectiveness and rigour of the succession planning processes for the Group and maintain oversight of the development of a diverse pipeline for succession to both Board and senior management roles
René MédoriChairman
Dear shareholderI am pleased to present our Nominations Committee report for 2020, which provides an overview of the work of the Committee and its activities during the year.
The primary responsibilities of the Committee include reviewing the composition and structure of the Board and its Committees, identifying suitable candidates for the Board, fully evaluating the existing skills and experience of Directors, and overseeing succession planning processes. During 2020, our Board evaluation process was internally facilitated. Details of the outcome from the 2019 external process, along with actions arising from the 2020 review are set out on pages 90 and 91.
Board composition and successionThe Committee takes the lead on all Board and Committee appointments, including the process for identifying and nominating candidates for approval by the Board, to ensure orderly succession plans are in place for both Board and senior management positions. The Committee also oversees the development of a diverse pipeline of candidates. The Committee remains committed to ensuring the Board and its Committees have the right balance of skills and experience to help achieve our strategic objectives. Our approach when considering the recruitment of new Board members involves the adoption of a formal and transparent procedure, with due regard to the skills, knowledge, diversity and level of experience required.
Committee’s expectations, recognising that Petrofac remains committed to ensuring that all appointments are filled by the best available candidate, with complementary skills, capabilities, experience and background to address the Board’s needs, irrespective of any other consideration.
This list was reduced to a shortlist of candidates who were interviewed by the Chairman and all other Non-executive Directors. As a result of this formal and rigorous recruitment process, the Committee unanimously agreed to recommend the appointment of Sami Iskander.
Mr Iskander’s prior experience, knowledge and personal strengths were all taken into consideration during the interview process and it was agreed by the Committee that his appointment would strengthen the Board and provide leadership, especially considering the current challenges and opportunities facing the Group.
The Board confirmed the appointment of Sami Iskander as Deputy Chief Executive, with the intention that he would succeed Ayman Asfari as Group Chief Executive from 1 January 2021.
Other Board changesThe Committee recognises the importance of balancing the refreshment of the Board while also maintaining continuity. In this context and taking into consideration his 40 years’ experience in the oil and gas industry, the Committee was delighted that Ayman agreed to remain on the Board as a Non-executive Director following his
The Committee had been anticipating the retirement of the Group Chief Executive for the last couple of years and had worked with executive search firm, Korn Ferry, to agree the profile and requirements necessary to fill this role, taking into consideration the likely needs of the Group with reference to current and future strategy. In addition to key operational and commercial expertise, the Committee also included soft skills as part of their criteria, such as critical assessment, openness, cultural sensitivity, good judgement and the ability to develop trust and forge relationships.
Korn Ferry is a firm which the Company retains, along with others, for Board and senior management executive searches. The firm is also used by the Group for tasks relating to job evaluations, salary surveys and other HR consulting projects.
When Ayman Asfari indicated during 2020 that he wished to step down at the end of the year, the Committee accelerated the process to identify a new Group Chief Executive. This process considered both internal and external candidates, with the search focused on those candidates with the skills and experience necessary for an organisation of the scale, complexity and global nature of Petrofac.
Over the prior couple of years the Committee had kept under review a long list of potential candidates identified by Korn Ferry that contained a diverse range of individuals. This list included candidates that would meet the demands of the role as well as the
Petrofac Limited | 2020 Annual report and accounts102
Corporate Governance

retirement as Group Chief Executive. It was agreed that Ayman would be able to support Sami as he builds new relationships in our core geographies, while continuing to provide significant insight and experience in the boardroom. As a Non-executive Director, Ayman will remain as a member of this Committee. It should be noted that, given his recent executive role, for governance purposes, he will be considered as non-independent.
Chairman successionMy own succession was also a matter of consideration during 2020. The Committee recognised that my tenure on the Board would exceed nine years in 2021, having originally joined the Board in January 2012 as a Non-executive Director before becoming Chairman in May 2018. This would result in a breach of the UK Code. It is however acknowledged under the UK Code that companies are permitted to extend the chair’s time on the Board beyond nine years to facilitate effective succession planning, particularly where a chair was a non-executive director on appointment.
We have engaged with key shareholders on this matter. In light of the change in Group Chief Executive effected during 2020, shareholders were supportive and agreed with the Committee’s view that my independence, position with UK investors and knowledge of the Group would be valuable as the Group navigates through this significant directorship change, while also steering the business through the effects of the COVID-19 pandemic and other ongoing challenges being faced by the Group. Accordingly, it has been agreed that I will continue as Chairman until May 2022, providing continuity through this period of managed change for the Board, with a recruitment process to appoint my successor as Chairman commencing during 2021.
Director re-electionIn line with the findings of our internally facilitated Board effectiveness review, as set out on page 91, and supported by their biographies, we believe the Directors possess a broad range of skills and experience from a variety of industries and accordingly, the Board believes that the election and re-election of each Director is in the best interests of the Company. Accordingly, in accordance with the UK Code, all Directors will stand for election or re-election at the 2021 Annual General Meeting (AGM). Further details on the AGM can be found at www.petrofac.com.
CEO induction programme
“All new Directors receive a tailored induction, which ensures they gain a full understanding of the business as well as their duties and responsibilities.”
Sami Iskander’s induction programme started in late 2020, on joining as Deputy Chief Executive. Having considered his key strengths, the focus areas for his induction were determined and agreed to be to better understand the Group. An overview of this programme is set out below:
Strengths
— Over 30 years’ experience in the oil and gas industry — Distinct insight into the Middle Eastern environment — Broad commercial experience — Strong experience of operational and project management
Focus areas
— Increase knowledge of Petrofac — Meet with senior management teams across the Group — Increase understanding of the role and duties of a Jersey director of a UK-listed company
Induction programme
— Individual meetings with Non-executive Directors — Individual meetings with Group Executive Committee members and their direct reports — Detailed presentations from Group functional heads — Deep dives on all current projects — Visiting all key operational offices, including Sharjah, Aberdeen, Woking and Muscat — Meetings with key advisors, including corporate lawyers, brokers, PR consultants and remuneration consultants — Attendance at the Company’s Workforce Forum meeting in December 2020 — Client visits in the UAE, Oman and Algeria in early 2021
Succession planning Succession planning remained a key focus area for the Committee throughout the year, with discussions centred not just on the Group Chief Executive position, but also on succession planning for senior management.
The Committee takes great interest in the development of the Group’s senior leaders and, on a regular basis, reviews with our HR and management teams the high
potential talent from across the Group. The Committee considers the skills and experience of the Group’s senior executives, with the aim of developing and promoting a strong, resilient and diverse pipeline for the future, which is in line with Petrofac’s purpose and values.
This process is integral to the Group’s strategic plans, and effective succession planning and the development of a diverse
Strateg
ic repo
rtG
overn
ance
Finan
cial statemen
ts
103Petrofac Limited | 2020 Annual report and accounts
Nominations Committee report continued
talent pipeline have been key priorities for the Committee over the last few years.
Induction processOn appointment to the Board, all new Directors undertake a detailed, tailored, comprehensive induction programme. This programme is intended to provide a broad introduction to the Group and allows the Company to account for individuals’ differing requirements and to concentrate on key focus areas, thus ensuring each Director is fully prepared for their new role, taking their background and experience into consideration.
All Directors visit the Group’s main operating office as part of their induction and are encouraged to make at least one site visit each year throughout their tenure. These site visits are regarded as an important part of continuing education as well as an essential part of the induction process, as they help the Directors’ understanding of the Group’s activities through direct experience of seeing operations in action and by having discussions with a range of employees.
Details relating to Sami Iskander’s induction, which we recognise will be an ongoing process, are set out on page 103.
Inclusion and diversityDiversity in its widest sense has received much focus in recent years and the Committee is committed to supporting the Group’s growth as a diverse and inclusive organisation.
While the Committee is content that our stated objectives in terms of Board gender diversity have been met, we recognise that much work remains to be done in terms of diversity both within our senior leadership positions and across the organisation.
In terms of ethnicity, Petrofac is a very diverse organisation and has met the recommendation of the Parker review for FTSE 250 Boards to have at least one Director on the Board by 2021 who identifies as a person of colour.
The Committee considers diversity to be a key factor in the Group’s strategic success and remains committed to not only helping improve the levels of female representation throughout Petrofac, but to developing a diverse workforce and an inclusive working environment, irrespective
of gender, race, colour, religion, sexual orientation or marital status. We believe this will support the delivery of our strategic objectives, allowing us to attract a diverse talent base, reflective and representative of our core geographies. A good business is about good people and our employees are the driving force behind our Group.
Oversight has been provided by the Committee to ensure effective strategies are in place that will develop and strengthen our talent pipelines to deliver improvements and promote a culture that upholds the Group’s principles of inclusion, diversity and equality. While engineering continues to be a predominately male-dominated profession, Petrofac is committed to developing initiatives that will enhance our talent pipeline and we are committed to hiring more local nationals in the markets in which we operate, including at senior leadership and ultimately at country leader level. There are, of course, long-term challenges to overcome but we are determined that significant progress can be made in this area over the coming years.
Improvements in overall diversity awareness have been made throughout 2020, with a number of actions undertaken to drive the diversity agenda and develop a comprehensive diversity strategy. This continued promotion of diversity in its widest sense has led to greater engagement across the organisation.
Our Diversity and Inclusion policy has been in place across the Group since August 2016. Its purpose is to ensure equality of opportunity and fairness in all areas of employment. It is believed that our policy allows us to value the diversity of our employees, while promoting an inclusive culture across the Group.
The Committee will continue to monitor the Group’s progress as it continues to deliver improvements in workforce diversity over the coming year and will make recommendations to the Board on how to further promote diversity and inclusion across the Group. Further information on our approach to diversity and inclusion and the initiatives taken during 2020 are set out on page 46.
Employee engagement and cultureThe Committee remains committed to engaging with employees to understand their concerns and to ensure the appropriate culture is in place across the organisation. My fellow Non-executive Directors and I were pleased to be able to meet with Workforce Forum representatives twice during the year and we recognise that this forum has proved very beneficial for us to hear directly from the employee representatives. While the COVID-19 pandemic imposed significant travel restrictions, all Board members have also taken the opportunities offered to them to speak directly to employees and members of senior management, especially during the period of transition to our new Group Chief Executive.
Despite the difficult decisions taken by the Company during 2020 in terms of workforce reductions and compensation cuts, the Company was determined to proceed with its annual employee engagement survey, PetroVoices. The Committee was encouraged to see that the results from this year’s survey had improved when compared with the 2019 survey, particularly in the areas of sustainable engagement and compliance, fairness of treatment, and diversity. Further details on the PetroVoices survey can be found on page 47.
Focus for the year aheadDuring 2021, the Committee will continue to focus on succession planning and the talent pipeline. We will monitor the Company’s compliance with developments arising from evolving best practice and oversee the actions taken to meet our diversity targets.
René MédoriChairman20 April 2021
Petrofac Limited | 2020 Annual report and accounts104
Corporate Governance

Compliance & Ethics Committee report
Role and responsibilities of the Committee: — To maintain direct oversight over key compliance and ethical risks and monitor the adequacy and effectiveness of controls in place and any mitigation activities — To evaluate the compliance and ethical aspects of Group culture and make recommendations to the Board on steps to be taken to ensure a culture of integrity and honesty in the Group’s business dealings — To ensure that ethical policies and practices are subject to an appropriate level of independent internal scrutiny; overseeing the development of, and amendments to the Group Compliance Charter, its Code of Conduct and other compliance policies, procedures and standards, including the Standard for the Prevention of Bribery and Corruption and the Ethical, Social and Regulatory Risk Policy — To monitor the implementation and effectiveness of Group policies and practices and maintain oversight of the Compliance function — To support the Company in any engagement with regulatory bodies, industry groups, advisors and other stakeholders, as necessary and where permitted by law, regarding ethical issues and compliance matters — To oversee, review and approve, the adequacy and security of the Group’s whistleblowing line as a tool available for employees and third parties to raise concerns, in confidence, about possible wrongdoing — To receive reports and review findings of significant internal and external compliance- related investigations, audits and reviews and exercise oversight, where possible, over any such investigation impacting the Group — To review a list of all third parties which had been submitted to the attention of the Third-Party Risk Committee.
George PiersonChairman of the Compliance & Ethics Committee
Dear shareholderDuring the year, the Committee oversaw continued improvements to the compliance processes and procedures designed to enhance the internal controls and compliance culture across the Group. In January 2020, the Committee members, along with all other members of the Board, attended the global launch of our revised Code of Conduct, demonstrating how important this subject is viewed by the Directors and underpinning the Committee’s support of management’s plans. Following this launch, the key focus for the year has been to drive the compliance message forward and further embed compliance as a behaviour across the Group.
As a Committee we have continued to support and challenge the Leadership team to ensure the adequacy and effectiveness of the Group’s compliance activities. This oversight was maintained by direct engagement with management, along with the provision of regular updates from the Group Compliance function.
The Committee recognises that more can be done to automate the improved compliance processes and to close out actions quicker.
Compliance functionDuring 2020, the Group Compliance function was restructured to support the new elements added to the Group Compliance programme. A new Director of Investigations, a legal and compliance professional who brings a wealth of experience in compliance, governance, supply chain, and working with cross-functional teams, was appointed during the year, as well as the appointment of new Compliance managers responsible for trade compliance and due diligence. These new appointments provided an opportunity to improve the quality of the team and to set the cultural tone being permeated throughout the Group.
As part of the functional restructuring, a Compliance focal point programme was introduced to facilitate improved engagement between compliance managers and each business unit. It is intended that this will ensure an increased level of compliance oversight at an operational level, while providing the necessary support to the business on how to embed compliance in day-to-day decision-making.
This is being reviewed on an ongoing basis to ensure that an adequate IT infrastructure is in place before finalising automation.
Committee membership and responsibilitiesThere were no changes to the Committee’s membership during 2020. Biographical details of the Committee members are set out on pages 82 to 84.
The Committee’s purpose is to assist the Board in fulfilling its oversight responsibilities in all areas relating to compliance and ethics. It ensures, in the provision of assurance to the Group’s stakeholders, that the Group’s policies and approach to compliance and ethics remain adequate and effective.
To assist the Committee in its deliberations, the Chairman, other Board members, the Group General Counsel and Chief Compliance Officer are invited to attend all Committee meetings. In addition, the Group Heads of Legal, Internal Audit, and Investigations, along with external advisors are each invited to attend all or part of any meeting, as and when considered appropriate or necessary.
Strateg
ic repo
rtG
overn
ance
Finan
cial statemen
ts
105Petrofac Limited | 2020 Annual report and accounts
Corporate Governance
Code of ConductFollowing the formal launch of the revised Code of Conduct in January 2020, a mandatory e-learning training module was rolled out to the 2,600 most senior employees with 100% completion achieved.
The roll-out to all remaining employees, including new hires and promotions, was launched in February 2021. The aim of this training exercise was to entrench the key messages further and empower individuals to take ownership of compliance wherever they might work in the business.
As a result of the travel restrictions imposed because of the COVID-19 pandemic, it was not possible for the Chief Compliance Officer to visit our remote offices to deliver this training in person, however Group Compliance leveraged technology where possible to ensure that all employees, sub-contractors and Directors could complete the training, irrespective of location. Further information relating to the Code of Conduct can be found on pages 54 and 55.
The Company continues to aspire to demonstrate gold standards of ethical compliance and conduct in our industry. Accordingly, we work closely with our clients to ensure effective communication of our Code of Conduct to support these standards. Furthermore, we assess all new sub-contractors to ensure that they meet our requirements for compliance and ethical behaviour, with support given to sub-contractors where improvements are deemed necessary. More details on how we work with third parties on these matters is set out on page 54.
Speak Up programmeDuring the year it was brought to the Committee’s attention that the number of whistleblowing reports received through the Group’s ‘Speak Up’ programme had decreased since the previous year. It was therefore recognised that further work was needed to strengthen the ‘Speak Up’ facility across all levels. To that end, a new and improved ‘Speak Up’ service, on an improved digital platform, was launched.
The introduction of this new facility, in addition to improving response times and the reduction in time taken to close out investigations, has led to increased reporting.
Additionally, a Non-retaliation Policy has been introduced, which reinforces the Group’s commitment to promoting a work environment where employees, and others, feel safe in raising concerns at any time, without fear of retaliation or intimidation.
As part of the Company’s investigations protocol, the Group investigations ‘triage’ committee considers all alleged breaches of the Company’s Code of Conduct, Policies, Standards and applicable local laws to determine severity, and to decide on the most appropriate course of action. This has allowed for improved workflows and the appropriate allocation of resources. The Committee reviews the status of all investigations conducted as a result of any alleged breaches, and liaises, as required, with the Audit Committee, in the event any alleged breach is of a financial nature.
During the year, a total of 57 Speak Up reports were received. These were submitted to the Committee, categorised by country, by severity and by status, with all high severity cases, of which there were 16 in the year, considered in detail, with full granularity of the calls shared with the Committee. These high severity cases were fully investigated by the investigations team, with terms of reference established for each investigation and progress reports provided to the Committee throughout the year. It was recognised that, based on an improved substantiation rate, more serious concerns were being escalated and levels of awareness around compliance issues had increased. Further details of our whistleblowing programme, including the Speak Up facility, are provided on page 54.
Third Party Risk CommitteeAs required by the Committee’s terms of reference, minutes of the meetings held by the Third Party Risk Committee (TPRC) were reviewed during the year. Four new third parties were engaged by the Group that were within the TPRC’s remit during 2020.
Compliance AuditAn external review of our compliance programme practices was first conducted in 2019 with a follow up conducted during 2020. The outcome of this recent review recognised the significant progress that had been achieved and identified where further improvements could be made in order for the Group to become the best amongst our peers. The Committee was content with the positive outcome of this external review and looks forward to supporting the Leadership team in continuing this work and introducing further improvements throughout 2021.
Looking ForwardLooking forward to 2021, the Committee recognises that the appointment of a new Group Chief Executive, coupled with new leadership within Group Compliance provides an opportunity to further reinforce compliance and ethics across the Group. To strengthen the compliance message, a communication plan is scheduled to be issued in line with the updated Group Compliance programme that will endeavour to cultivate a culture of trust and openness.
The Group Compliance programme will remain under review throughout 2021 and an exercise will be conducted to ensure that the Committee can close any identified gaps. This process will be underpinned by the introduction of clear and consistent procedures across the Group, which are adequately supported by effective training and automated systems.
George PiersonChairman of the Compliance and Ethics Committee20 April 2021
Compliance & Ethics Committee report continued
Petrofac Limited | 2020 Annual report and accounts106
Corporate Governance

Directors’ remuneration report
Role and responsibilities of the Committee: — On behalf of the Board, determine, implement and review annually the framework and policy for the remuneration of the Company Chairman, the Executive Directors and other members of executive management. Review the ongoing appropriateness and relevance of the remuneration policy — Ensure that the objectives of the remuneration policies and practices are transparent and support the Company’s strategy and promote long-term sustainable success, while addressing the six principles set out in the UK Code of clarity, simplicity, risk, predictability, proportionality and alignment to culture — Review and oversee wider workforce remuneration and related policies and ensure that incentive schemes and rewards drive behaviours that are consistent with our purpose, values, and strategy, and take these into account when setting the policy for Executive Director remuneration — Approve the design of, and determine targets for, any performance-related pay schemes and review the total annual payments made under such schemes — Ensure that outcomes are only earned for achieving stretching, but fair, performance targets and that remuneration schemes and policies enable the use of Committee discretion and independent judgement to override — Maintain contact, and promote effective engagement, with principal stakeholders, as required, on matters relating to executive remuneration
Matthias BichselChairman of the Remuneration Committee
Dear shareholderOn behalf of the Board, I am pleased to present the Directors’ Remuneration Report for the year ended 31 December 2020.
As a Jersey-incorporated company, Petrofac is not subject to the remuneration reporting regulations that apply to UK-incorporated companies. Nevertheless, the Committee recognises the importance of effective corporate governance and we will therefore continue to operate in line with the UK remuneration reporting regulations.
Accordingly, we will be asking shareholders, at our 2021 AGM, to vote on this Report, which summarises the remuneration outcomes for 2020 and explains how we intend to apply the Remuneration Policy in 2021. Our Remuneration Policy and accompanying notes, which were approved at the 2020 AGM, can be found at www.petrofac.com.
2020 Group PerformanceThe Group has faced a very challenging year. The COVID-19 pandemic and collapse in oil price both had a material impact on our industry during 2020. The Group reported lower revenue of approximately US$4.1 billion (down 26%) and full-year business performance net profit was materially lower than in 2019, down 83% to US$48 million. Nevertheless, we continued to deliver high-quality projects and services for our clients, whilst doing everything within our control to protect the health and wellbeing of our people.
While never an easy decision to make, these steps will help to buffer the business from lower revenues and ongoing pressures on margins, and will also create a leaner, more competitive company going forward, allowing Petrofac to capitalise on new opportunities as they arise.
The remuneration outcomes for 2020On a formulaic basis, the annual bonus pool would have produced a modest bonus pay-out this year. However, the Committee reflected on the overall performance of the Group and the experience of stakeholders and decided to exercise downward discretion and not to pay any annual cash bonuses for 2020. Further details of the Annual Bonus Plan can be found on page 109.
The 2018 PSP vested at 16.1% of the maximum, based on overall performance over the period 2018-2020. This outcome reflected that the majority of the strategic measures were fully or partially met over the last three years (see page 110). The Committee considered that this level of vesting for our long-term incentive plan was commensurate with Petrofac’s performance over that period, and was satisfied that no adjustment was necessary. In taking this decision, the Committee noted that over the last seven years the PSP had paid out zero for the initial five years and 15.2% in 2019.
We have also taken decisive action to protect our balance sheet, liquidity and the long-term health of the business.
In April 2020, the Group cancelled the previously awarded annual pay increases and, in addition, implemented a 10% pay cut. This cut was applied to all levels of the Company, including the Executive Directors and the senior leadership team. These actions also included a 10% reduction in Board fees. The Company, will however, award a 5% pay increase worldwide in April 2021 to those employees who had taken a 10% pay cut in 2020. The Company feels this is due recognition for the hard work and loyalty of our employees in an exceptionally challenging year. This 5% increase will not apply to the Board, Executive Directors or the Group Executive Committee members, with Board fees and executive salaries remaining frozen for 2021.
Looking forward, it remains unclear how long business activity in our industry sector will be adversely impacted by global market conditions. Low order intake over recent years will result in a decline in revenue during the next year. However, the Group’s cost reduction actions, including, regrettably, a series of headcount reduction programmes, are targeted to contribute gross savings of US$250 million in 2021 relative to pre-pandemic levels.
Strateg
ic repo
rtG
overn
ance
Finan
cial statemen
ts
107Petrofac Limited | 2020 Annual report and accounts
Corporate Governance

Directors’ remuneration report continued
Board arrangements Ayman Asfari retired from the role of Group Chief Executive on 31 December 2020. He will, however, remain on the Board as a Non-executive Director, ensuring that Petrofac continues to benefit from his substantial experience and industry insight. His notice period commenced on 12 October 2020, and the balance of his notice period was paid in lieu on 31 December 2020.
He also received a grossed up amount of £40,000 to cover the loss of his healthcare benefits for himself and his family in 2021. Mr Asfari has agreed to receive no Board fees until 11 October 2021 and, as noted above, he will not receive an annual bonus in respect of 2020 and will not be eligible to receive a bonus for 2021. As a retiree, he will be treated as a good leaver for the purposes of his outstanding share awards and accordingly, his 2018, 2019 and 2020 PSP awards will remain capable of vesting at the normal time, subject to prorating for time and performance.
Sami Iskander was appointed Deputy Chief Executive Officer on 1 November 2020 and assumed the role of Group Chief Executive on 1 January 2021. In accordance with our policy, Mr Iskander’s pension benefits will be aligned to that of the rest of the UK workforce. As part of his negotiated recruitment arrangements, he was eligible to receive a payment for successful completion of his transition from Deputy Chief Executive to that of the Group Chief Executive, as well as a 2021 PSP award of 300% of salary. From 2022, Mr Iskander’s PSP opportunity will be subject to the normal maximum of 200% of salary. He will be subject to our within and post-employment shareholding requirements, as well as being required to defer 50% of any future cash bonus into shares. Further details of his remuneration can be found on pages 109 and 110.
Changes to be made in 2021Executive Director and Group Executive Committee salaries, and Board fees will remain frozen for 2021. There are also no changes proposed to the annual bonus. Mr Iskander will receive an exceptional PSP award in 2021 of 300% of base salary in line with the Remuneration Policy following his appointment to the Board. This will reduce to up to 200% of base salary for future years. Mr Cochran will receive a PSP award of 200% of base salary.
We are, however, taking the opportunity to bring better balance to our PSP measures and will move to a split of 50% TSR and
50% strategic measures (from the current 70/30 split). This will enable us to place greater focus on critical objectives for the business
over the next three years, including around our ESG agenda, such as employee engagement, diversity, greenhouse gas emissions and our move into energy transition solutions. All will be subject to the Committee setting robust and stretching targets that go well beyond business as usual.
Within the TSR element, we are also updating the comparator group to better reflect our current competitive environment. Details of the PSP proposals can be found on page 116.
In addition, to provide greater flexibility in how we are able to reward our employees in volatile times, we are submitting two new share plans for shareholder approval at the 2021 Annual General Meeting.
— Deferred Bonus Plan: The current Deferred Bonus Share Plan is the vehicle we use for making deferred share awards under the annual bonus. It has been in place since 2005 and is now in need of updating to bring it in line with best practice — Share Option Plan: As an aid for recruitment, retention, motivation and alignment, we wish to have the flexibility to use share options for our wider workforce in future years. We have no current intention to use this plan for Executive Directors and were we to do so, shareholders would be consulted
Details of these two new plans can be found in our 2021 Notice of AGM.
ConclusionDuring the course of 2020, the Committee has had to respond quickly and decisively to the challenges of COVID-19, the oil price collapse and the transition to a new Group Chief Executive. We have had to make some very difficult decisions over the course of the year, but at all times, we have sought to act in the best interests of Petrofac and all our stakeholders.
I hope you find the report clear and informative and that the Committee has your support for the Annual Report on Remuneration at the forthcoming AGM.
Matthias BichselChairman of the Remuneration Committee 20 April 2021
Petrofac Limited | 2020 Annual report and accounts108
Corporate Governance

Annual Report on RemunerationLooking backwardsThe information presented from this section, until the relevant note on page 113, represents the audited section of this report.
Single total figure of remunerationThe following table sets out the total remuneration for Executive Directors for the year ended 31 December 2020, with prior year figures also shown.
Base salary Taxable benefits
Cash in lieu of pension and
other benefitsAnnual cash
bonusLong-term incentives Total Remuneration
Total Fixed Remuneration
Total Variable Remuneration
(a) (b) (c) (d) (e) (f) (g)
Executive Director 1 US$000 US$000 US$000 US$000 US$000 US$000 US$000 US$000
2020 2019 2020 2019 2020 2019 2020 2019 2020 2019 2020 2019 2020 2019 2020 2019
Ayman Asfari 830 884 1 1 89 90 0 0 79 178 999 1,153 920 975 79 178
Alastair Cochran 524 554 1 1 89 90 0 584 52 109 666 1,338 614 645 52 693
Sami Iskander 2 144 0 4 0 10 0 383 0 0 0 541 0 158 0 383 0
Notes to the table:1 The Executive Directors are paid in sterling. All amounts have been translated to US dollars based on the prevailing rate at the date of payment or award. 2 The Companies (Directors’ Remuneration Policy and Directors’ Remuneration Report) Regulations 2019 applies to UK registered companies. The Company, which is Jersey-registered,
voluntarily provides information required by these regulations, which includes a requirement to disclose the remuneration for individuals identified as Deputy Chief Executive. Accordingly, the remuneration details for Sami Iskander for the period 1 November to 31 December 2020 are set out in the table above.
Further notes to the table – methodology(a) Salary and fees – the cash paid in respect of 2020.(b) Benefits – the taxable value of all benefits paid in respect of 2020, including private health insurance and appropriate life assurance.(c) Cash in lieu of pension and other benefits – our Executive Directors received a cash allowance in place of benefits including pension contributions and car allowances but without
an explicit allocation to each. This reflects the application of the Company’s remuneration policy. Directors do not receive specific pension contributions from the Company.(d) Annual cash bonus in respect of performance during 2020. (e) Long-term incentives – 16.1% of the 2018 awards under the Performance Share Plan are due to vest on 20 April 2021. The value shown represents an estimate of the market value of
the shares that are due to vest, based on a three-month average share price of 140.04 pence (1 October to 31 December 2020). £(167,192) of the above figure for Ayman Asfari and £(109,043) of the above figure for Alastair Cochran is attributed to a share price depreciation of 377.9 pence per share, based on an actual award price of 517.9 pence. The shares due to vest for Ayman Asfari have been pro-rated for time, based on his retirement date of 31 December 2020. The 2019 values in this column (relating to awards which vested in March 2020) have been revised from last year’s report, based on the actual share price of 271.75 pence at the date of vesting on 6 March 2020.
(f) Total Fixed Remuneration is the total of (a) base salary, (b) taxable benefits and (c) cash in lieu of pension and other benefits.(g) Total Variable Remuneration is the total of (d) annual cash bonus and (e) long-term incentives.
Additional disclosures in respect of the single figure tableAnnual bonusThe financial elements of our annual bonus comprise 60% of the overall weighting, while the remainder of the annual bonus (40%) is subject to a 15% metric covering HSE, compliance, CSR and employee-rated items, and 25% determined by the achievement of key strategic milestones. The table below sets out the outcomes for the Executive Directors against our financial targets:
Performance targets
Measure WeightingThreshold
US$mTarget US$m
Maximum US$m
Actual 2020 outcome
US$mPay-out as % of maximum
Group net profit1 20% 160 182 210 48 0%
Group order intake 20% 5500 6500 7500 1,632 0%
Group free cash flow2 20% (261) (111) 90 (73) 59.5%
As a % of maximum 19.8%
1 Measured as Group business performance before separately disclosed items. 2 The Group free cash flow measure flow measure for the purposes of the annual bonus performance target is a management reporting metric calculated as free cash flow generated from
operating activities and investing activities, less interest paid and amounts received from non-controlling interests (see note A6 in Appendix A to the consolidated financial statements).
As this table illustrates, our financial performance resulted in a formulaic pay-out against the financial measures of 19.8% of maximum.
This outcome reflected the weak performance of the E&C and EPS divisions. Group level performance was principally affected by cancellation of orders and delay in contract awards following the sharp decline in the oil price. This has resulted in a below threshold outturn for new orders intake. E&C and EPS under-performance more than offset out-performance in IES and corporate, resulting in a below threshold outturn for net profit. The decline in profitability and lower divestment proceeds was partially offset by improved working capital, lower tax and cash conservation measures, which resulted in a between target and maximum outturn for free cash flow.
The remainder of the annual bonus (40%) is subject to a 15% metric covering HSE, compliance, CSR and employee-rated items, with the remaining 25% determined by the achievement of key strategic milestones. This ensures that the Committee considers not only the financial performance measures achieved but also the wider health of the Group, safeguarding future years’ performance, and the manner and behaviours by which our performance has been delivered.
Strateg
ic repo
rtG
overn
ance
Finan
cial statemen
ts
109Petrofac Limited | 2020 Annual report and accounts

In evaluating performance against these measures, as well as reflecting further on the outcome under the financial measures, the Committee were mindful of the challenges that the business has faced during the year, and recognised that Petrofac’s share price performance during 2020 had been poor. As a result, the Committee exercised downward discretion and determined that Mr Asfari and Mr Cochran should receive no cash bonus for 2020.
Arrangements for Sami IskanderGiven Mr Iskander joined the Company towards the end of 2020, it was not appropriate for him to participate in the annual bonus plan on the basis of the same measures as the other Executive Directors. For the same reason, Mr Iskander did not receive a 2020 PSP award. Instead, Mr Iskander was eligible for a performance-related transition payment that was negotiated as part of his recruitment package and which would only be paid subject to achieving key objectives for the initial stages of his tenure and a successful transition of the Group Chief Executive role from Mr Asfari. As a result of Mr Iskander completing a successful transition into the business, the Committee determined that he should receive a payment of £300,000, which was made prior to him becoming a member of the Board.
Loss of officeMr Asfari retired from the role of Group Chief Executive on 31 December 2020. He will remain on the Board as a Non-executive Director, ensuring that Petrofac continues to benefit from his substantial experience and industry insight. His notice period commenced on 12 October 2020, and the balance of his notice period was paid in lieu on 31 December 2020. He also received a grossed up amount of £40,000 to cover the loss of healthcare benefits for himself and his family in 2021. He has agreed to receive no Board fees until 11 October 2021 and, as previously noted on page 110, he will not receive a bonus in respect of financial year 2020 and will not be eligible to receive a bonus for 2021.
As a retiree, Mr Asfari will be treated as a good leaver for the purposes of his outstanding PSP awards. Accordingly, his 2018, 2019 and 2020 awards will remain capable of vesting at the normal time, subject to prorating for time and performance. Mr Asfari is subject to the Company’s post-cessation shareholding requirements, which require him to retain shares to the value of 300% salary for the first year post-cessation as an Executive Director and 150% for the second year post-cessation. This equates to a shareholding of an equivalent of 912,628 shares for the first year and to 456,314 shares for the second year, based on an average share price of 210.26 pence. As Mr Asfari will remain on the Board as a Non-executive Director, he will continue to be subject to the Company’s share dealing code, such that any share dealing post his cessation will require permission to be sought from the Chairman in advance of any trade.
Performance Share Plan (PSP)The performance conditions for the 2018 award are set out below. As a result of the complete or partial achievement of three out of four of the strategic objectives, 16.1% of this award is due to vest on 20 April 2021.
TSR element1 (70% of award):Target range2 Outcome
Less than median performance 0%
Median performance 25%
Median to Upper Quartile performance 100%
Vesting0%
(Below median performance)
1 The comparator group for these awards is as set out on page 111. 2 Straight-line vesting operates between these points.
Strategic element (30% of award):
Performance measure Weighting Threshold On-target Maximum Out-turn
Vesting (as a % of
maximum)Vesting %
(actual)
Protecting our core E&C business E&C Net Income 7.5% US$913m US$1,052m US$1,190m US$750m 0% 0%
Growing our reimbursable services offering EPS Net Income 7.5% US$131m US$148m US$164m US$151m 71% 5.3%
Reducing capital intensity Divestments 7.5% US$475m US$713m US$950m US$1,055m 100% 7.5%
Delivering back to our core strategy Cash conversion 7.5% 73% 88% 103% 80% 44% 3.3%
Vesting 53.7% of maximum
Overall vesting 16.1% of maximum
Directors’ remuneration report continued
Petrofac Limited | 2020 Annual report and accounts110
Corporate Governance
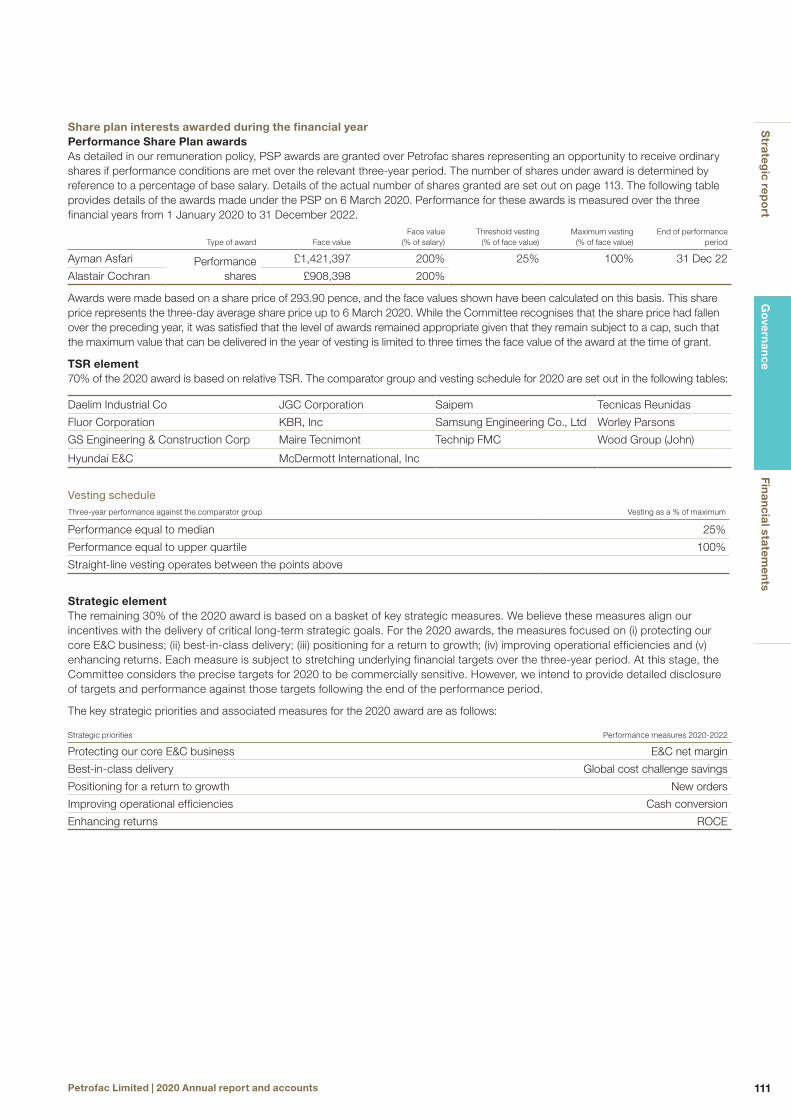
Share plan interests awarded during the financial yearPerformance Share Plan awardsAs detailed in our remuneration policy, PSP awards are granted over Petrofac shares representing an opportunity to receive ordinary shares if performance conditions are met over the relevant three-year period. The number of shares under award is determined by reference to a percentage of base salary. Details of the actual number of shares granted are set out on page 113. The following table provides details of the awards made under the PSP on 6 March 2020. Performance for these awards is measured over the three financial years from 1 January 2020 to 31 December 2022.
Type of award Face valueFace value
(% of salary)Threshold vesting
(% of face value)Maximum vesting
(% of face value)End of performance
period
Ayman Asfari Performance shares
£1,421,397 200% 25% 100% 31 Dec 22
Alastair Cochran £908,398 200%
Awards were made based on a share price of 293.90 pence, and the face values shown have been calculated on this basis. This share price represents the three-day average share price up to 6 March 2020. While the Committee recognises that the share price had fallen over the preceding year, it was satisfied that the level of awards remained appropriate given that they remain subject to a cap, such that the maximum value that can be delivered in the year of vesting is limited to three times the face value of the award at the time of grant.
TSR element70% of the 2020 award is based on relative TSR. The comparator group and vesting schedule for 2020 are set out in the following tables:
Daelim Industrial Co JGC Corporation Saipem Tecnicas Reunidas
Fluor Corporation KBR, Inc Samsung Engineering Co., Ltd Worley Parsons
GS Engineering & Construction Corp Maire Tecnimont Technip FMC Wood Group (John)
Hyundai E&C McDermott International, Inc
Vesting scheduleThree-year performance against the comparator group Vesting as a % of maximum
Performance equal to median 25%
Performance equal to upper quartile 100%
Straight-line vesting operates between the points above
Strategic elementThe remaining 30% of the 2020 award is based on a basket of key strategic measures. We believe these measures align our incentives with the delivery of critical long-term strategic goals. For the 2020 awards, the measures focused on (i) protecting our core E&C business; (ii) best-in-class delivery; (iii) positioning for a return to growth; (iv) improving operational efficiencies and (v) enhancing returns. Each measure is subject to stretching underlying financial targets over the three-year period. At this stage, the Committee considers the precise targets for 2020 to be commercially sensitive. However, we intend to provide detailed disclosure of targets and performance against those targets following the end of the performance period.
The key strategic priorities and associated measures for the 2020 award are as follows:
Strategic priorities Performance measures 2020-2022
Protecting our core E&C business E&C net margin
Best-in-class delivery Global cost challenge savings
Positioning for a return to growth New orders
Improving operational efficiencies Cash conversion
Enhancing returns ROCE
Strateg
ic repo
rtG
overn
ance
Finan
cial statemen
ts
111Petrofac Limited | 2020 Annual report and accounts
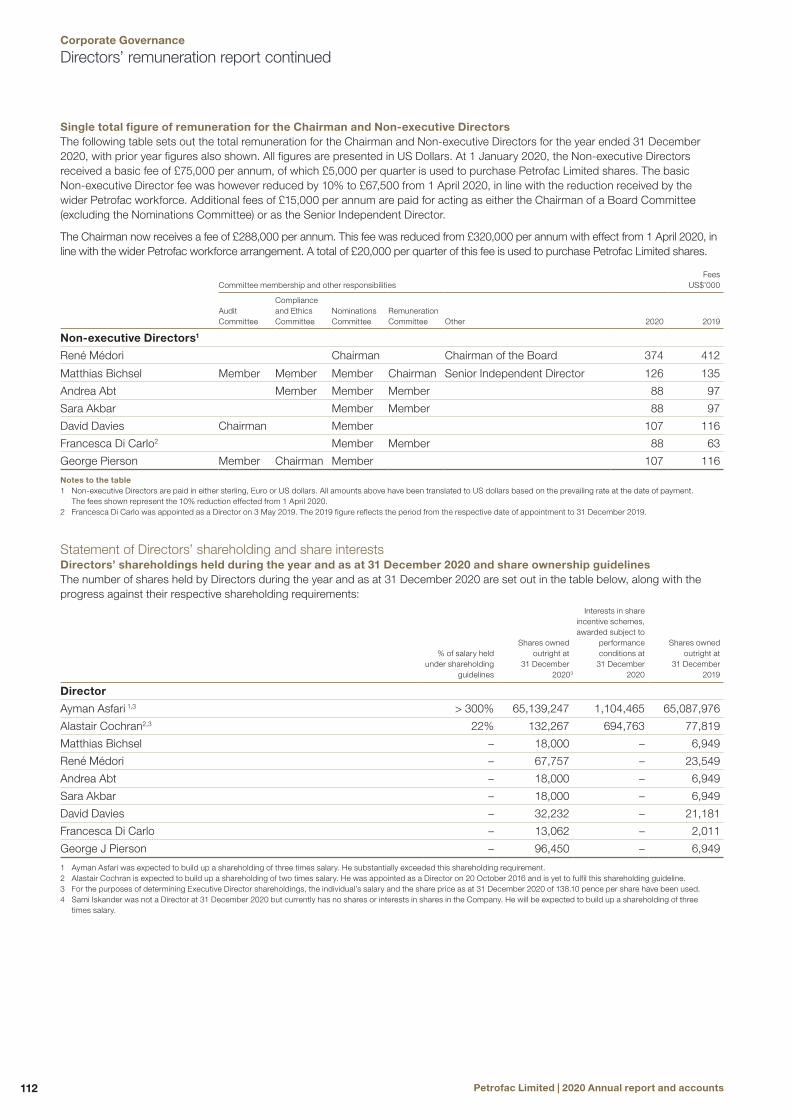
Single total figure of remuneration for the Chairman and Non-executive DirectorsThe following table sets out the total remuneration for the Chairman and Non-executive Directors for the year ended 31 December 2020, with prior year figures also shown. All figures are presented in US Dollars. At 1 January 2020, the Non-executive Directors received a basic fee of £75,000 per annum, of which £5,000 per quarter is used to purchase Petrofac Limited shares. The basic Non-executive Director fee was however reduced by 10% to £67,500 from 1 April 2020, in line with the reduction received by the wider Petrofac workforce. Additional fees of £15,000 per annum are paid for acting as either the Chairman of a Board Committee (excluding the Nominations Committee) or as the Senior Independent Director.
The Chairman now receives a fee of £288,000 per annum. This fee was reduced from £320,000 per annum with effect from 1 April 2020, in line with the wider Petrofac workforce arrangement. A total of £20,000 per quarter of this fee is used to purchase Petrofac Limited shares.
Committee membership and other responsibilitiesFees
US$’000
Audit Committee
Compliance and Ethics Committee
Nominations Committee
Remuneration Committee Other 2020 2019
Non-executive Directors1
René Médori Chairman Chairman of the Board 374 412
Matthias Bichsel Member Member Member Chairman Senior Independent Director 126 135
Andrea Abt Member Member Member 88 97
Sara Akbar Member Member 88 97
David Davies Chairman Member 107 116
Francesca Di Carlo2 Member Member 88 63
George Pierson Member Chairman Member 107 116
Notes to the table1 Non-executive Directors are paid in either sterling, Euro or US dollars. All amounts above have been translated to US dollars based on the prevailing rate at the date of payment.
The fees shown represent the 10% reduction effected from 1 April 2020.2 Francesca Di Carlo was appointed as a Director on 3 May 2019. The 2019 figure reflects the period from the respective date of appointment to 31 December 2019.
Statement of Directors’ shareholding and share interestsDirectors’ shareholdings held during the year and as at 31 December 2020 and share ownership guidelinesThe number of shares held by Directors during the year and as at 31 December 2020 are set out in the table below, along with the progress against their respective shareholding requirements:
% of salary held under shareholding
guidelines
Shares owned outright at
31 December 20203
Interests in share incentive schemes, awarded subject to
performance conditions at
31 December 2020
Shares owned outright at
31 December 2019
Director
Ayman Asfari 1,3 > 300% 65,139,247 1,104,465 65,087,976
Alastair Cochran2,3 22% 132,267 694,763 77,819
Matthias Bichsel – 18,000 – 6,949
René Médori – 67,757 – 23,549
Andrea Abt – 18,000 – 6,949
Sara Akbar – 18,000 – 6,949
David Davies – 32,232 – 21,181
Francesca Di Carlo – 13,062 – 2,011
George J Pierson – 96,450 – 6,949
1 Ayman Asfari was expected to build up a shareholding of three times salary. He substantially exceeded this shareholding requirement.2 Alastair Cochran is expected to build up a shareholding of two times salary. He was appointed as a Director on 20 October 2016 and is yet to fulfil this shareholding guideline.3 For the purposes of determining Executive Director shareholdings, the individual’s salary and the share price as at 31 December 2020 of 138.10 pence per share have been used.4 Sami Iskander was not a Director at 31 December 2020 but currently has no shares or interests in shares in the Company. He will be expected to build up a shareholding of three
times salary.
Directors’ remuneration report continued
Petrofac Limited | 2020 Annual report and accounts112
Corporate Governance

Share interests – share plan awards at 31 December 2020Share awards held at the year-end, including awards of shares made to Executive Directors during 2020, are shown in the table below:
Director and date of grant Plan
Number of shares under
award at 31 December
20191
Shares granted in year
Dividend shares
granted in year2
Shares lapsed in year
Shares vested in year
Total number of shares
under award at
31 December 2020
Dates from which shares ordinarily vest
Ayman Asfari
13 September 20173 PSP 337,310 – – 286,039 51,271 – 6 March 2020
27 March 20184 PSP 291,491 – – – – 291,491 6 March 2021
6 March 2019 PSP 329,341 – – – – 329,341 6 March 2022
6 March 2020 PSP – 483,633 – – – 483,633 6 March 2023
1,104,465
Alastair Cochran
13 September 20173 PSP 207,574 – – 176,023 31,551 – 6 March 2020
27 March 20184 PSP 179,245 – – – – 179,245 6 March 2021
6 March 2019 PSP 206,434 – – – – 206,434 6 March 2022
6 March 2020 PSP – 309,084 – – – 309,084 6 March 2023
694,763
1 The award amounts disclosed under the PSP are the maximum number that may vest if all performance conditions attached to the awards are satisfied in full.2 Dividends awarded on shares granted under the share plans are reinvested to purchase further shares.3 Following the end of the three-year performance period in respect of the September 2017 PSP award, the performance conditions were partially satisfied and therefore 15.2% of the
maximum award vested on 6 March 2020. 4 Shares awarded on 27 March 2018 partially satisfied the performance conditions and therefore 16.1% of the maximum award will vest on 20 April 2021. Based on a share price of
131.60 pence, which is the closing share price on 19 April 2021 (being the latest practicable date prior to the adoption of this Report by the Committee), the value of the awards made to Executive Directors would be as follows: Ayman Asfari: £58,229 and Alastair Cochran £37,977. The shares awarded to Ayman Asfari have also been pro-rated for time, based on his retirement date of 31 December 2020.
5 Sami Iskander was not a Director at 31 December 2020. He currently does not have any share interests in the Company.
This represents the end of the audited section of the report.
Historical TSR performance and Group Chief Executive remuneration outcomesThe chart below compares the TSR performance of the Company over the past ten years with the TSR of the FTSE 250 Index. This index has been chosen because it is a recognised equity market index of which Petrofac has been a member since December 2014. The table below the chart summarises the Group Chief Executive single figure for total remuneration, annual bonus pay-outs and LTIP vesting levels as a percentage of maximum opportunity over this period.
TSR chart – one-month average basis
Petrofac FTSE 250
01 Jan11
01 Jan12
01 Jan13
01 Jan14
01 Jan15
01 Jan16
01 Jan17
01 Jan18
01 Jan19
01 Jan20
01 Jan21
0
50
100
150
200
250
300
TSR
– r
ebas
ed to
1 J
anua
ry 2
011
Source: Datastream
Group Chief Executive 2011 2012 2013 2014 2015 2016 2017 2018 2019 2020
Group Chief Executive single figure of remuneration (US$’000) 6,088 4,663 2,658 1,245 1,162 1,817 1,946 2,250 1,153 999
Annual bonus payout (as a % of maximum opportunity) 75% 81% 59% 0% 0% 47.5% 60.4% 69.9% 0% 0%
PSP vesting out-turn (as a % of maximum opportunity) 100% 100% 13% 0% 0% 0% 0% 0% 15.2% 16.1%
Strateg
ic repo
rtG
overn
ance
Finan
cial statemen
ts
113Petrofac Limited | 2020 Annual report and accounts

Pay ratios of Group Chief Executive to UK employeesThe table below illustrates the pay ratio of the Group Chief Executive to the 25th, median and 75th percentile of the total remuneration of the full-time equivalent UK employees.
Financial Year ending Method
25th percentile pay ratio
(lower quartile)
50th percentile pay ratio (median)
75th percentile pay ratio
(upper quartile)
31 December 2020 Option A 1: 16 1: 12 1: 10
31 December 2019 Option A 1: 20 1: 14 1: 12
The Group Chief Executive’s total remuneration is calculated on the same basis as the single figure of remuneration table set out on page 109. The lower, median and upper quartile employee’s remuneration was calculated on full-time equivalent data as at 31 December 2020. Option A was chosen as it is considered to be the most accurate way of identifying the best equivalents of 25th, 50th and 75th percentile figures and is aligned with best practice and investor expectations.
In reviewing the employee pay data, the Committee is satisfied that the individuals identified within each category appropriately reflect the employee pay profile at those quartiles, and that the overall picture presented by the ratios is consistent with our pay, reward and progression policies for UK employees.
The following table provides further information on the total pay figures used for each quartile employee and the salary component within this:
Financial year endingElement
of payCEO
remuneration
25th percentile pay ratio
(lower quartile)
50th percentile pay ratio (median)
75th percentile pay ratio
(upper quartile)
31 December 2020 Salary £650,900 £46,017 £59,519 £71,538
Total remuneration £783,979 £50,485 £66,124 £77,207
In assessing our pay ratio against the wider market and against our industry peers, as expected, it is towards the lower end of the range. This is reflective of both the highly skilled and technically challenging nature of many of our roles in the UK. The cancellation of the annual pay increases and the further 10% pay reductions implemented for our employees, including the Group Chief Executive (excluding offshore employees) during 2020 together with no bonuses to be paid for the 2020 performance year is reflected in the pay ratio. The Group Chief Executive also did not take a bonus for the 2019 performance year.
The Committee would highlight that the ratio might be expected to increase in future years should normal payment of annual bonus take place and should the level of vesting under the PSP increase.
Annual percentage change in Directors’ remuneration compared to average employee remuneration In accordance with The Companies (Directors’ Remuneration Policy and Directors’ Remuneration Report) Regulations 2019, as applicable to an equivalent UK company, the table below illustrates the percentage change in each Executive and Non-executive Directors’ total remuneration, including salary, benefits (excluding cash allowance in lieu of pension) and annual bonus for executives and annual fees for non-executives, compared with a representative group of the Company’s employees. For these purposes, we have used all UK-based employees as the comparator group, as this represents the most appropriate comparator group for reward purposes.
% change in base salary 2020/2019
% change in benefits 2020/2019
% change in annual bonus 2020/2019
Ayman Asfari1 -5.7% 0% 0%
Alastair Cochran1 -5.0% 0% -100%
René Médori2 -7.5% – –
Matthias Bichsel2 -5.4% – –
Andrea Abt2 -7.5% – –
Sara Akbar2 -7.5% – –
David Davies2 -6.3% – –
Francesca Di Carlo2, 3 -7.5% – –
George Pierson2 -6.3% – –
All UK-based employees -3.2% 0% -100%
1 Base salary is paid in sterling but translated into US dollars based on the prevailing rate at the date of payment (as set out on page 109). Base salaries were reduced during 2020 through the cancellation of annual pay increases and further pay reductions. The percentage change differential in annual bonus reflects no bonuses to be paid for the 2020 performance year.
2 For the Non-executive Directors, fees are paid in US dollars, sterling or Euro as determined by each Director. The table sets out the change in total fees. Base fees were reduced by 10% during 2020. There were no changes to the additional fees of £15,000 per annum, which are paid for acting as either the Chairman of a Board Committee (excluding the Nominations Committee) or as the Senior Independent Director.
3 Francesca Di Carlo was appointed as a Non-executive Director on 3 May 2019. The 2019 fee figure reflects an annual figure for comparison purposes with 2020.
Directors’ remuneration report continued
Petrofac Limited | 2020 Annual report and accounts114
Corporate Governance

Relative importance of the spend on payThe chart below illustrates the change in total remuneration, dividends paid and net profit from 2019 to 2020.
The figures presented have been calculated on the following bases.
— Dividends – dividends paid in respect of the financial year. — Net profit – our reported net profit in respect of the financial year. This is a key performance indicator for the Company. The Committee therefore believes it is the most direct reflection of our underlying financial performance. —Total remuneration – represents total salaries paid to all Group employees in respect of the financial year (see page 152 of the report for an explanation as to how this value is calculated). Note that this includes social security costs, benefit and pension costs and share-based payment expenses.
276
48
Net profit
996
804
Total remuneration
2019
2020
132
0
Dividends
-80%
-19%
-100%
Spend in respect of the financial year (US$m)
Looking forward to 2021Implementation of remuneration policy in 2021This section provides an overview of how the Committee is proposing to implement our remuneration policy in 2021.
Base salaryThe table below shows the base salaries for 2021:
2021 basic salary
2020 basic salary (from 1 May 2020)
2020 basic salary (as reported in the
2019 annual report)
Sami Iskander £650,000 – –
Alastair Cochran1 £389,340 £389,340 £454,200
1. In May 2020, the annual pay increase implemented in early 2020 was cancelled and a further 10% salary reduction was implemented. The actual salary received by Mr Cochran during 2020 was £410,960.
Mr Iskander joined the Company as Deputy Chief Executive on 1 November 2020. He was appointed as Group Chief Executive with effect from 1 January 2021. The Executive Directors did not receive a salary increase in 2021.
BenefitsThere are no changes proposed to the benefit framework in 2021.
Cash allowance in lieu of pension and car allowance The table below shows cash allowances for 2021:
Cash allowances Cash allowances
2021 2020
Pension Car Pension Car
Sami Iskander 7% of salary aligned to
UK workforce
£20,000 7% of salary aligned to
UK workforce
£20,000
Alastair Cochran £70,000 £70,000
Mr Iskander received the above cash allowances pro-rata for November and December 2020 when he was Deputy Chief Executive.
Non-executive Chairman and Director remunerationThe fees payable to the Non-executive Chairman and Directors were increased in 2018 and at that time it was proposed that there will be no further increase to these fees for the next three years. During 2020, fees payable to the Chairman and Non-executive Directors were reduced by 10% in line with the wider workforce as a result of the impact of the COVID-19 pandemic.
The table below shows the Non-executive Chairman and Director fee structure effective from 1 April 2020:
2021 fees
Chairman of the Board fee £288,000
Basic Non-executive Director fee £67,500
Board Committee Chairman fee £15,000
Senior Independent Director fee £15,000
There are no fees paid for membership of Board Committees.
The Chairman and the Non-executive Directors use a portion of their fees, which are paid quarterly, to purchase Petrofac shares on the open market. Each quarter, the Non-executive Directors purchase at least £5,000 of shares and the Chairman at least £20,000 of shares. This arrangement further aligns Directors’ interests with those of shareholders and demonstrates the Directors confidence in the future of the Company. Mr Asfari will participate in this arrangement from 12 October 2021.
Strateg
ic repo
rtG
overn
ance
Finan
cial statemen
ts
115Petrofac Limited | 2020 Annual report and accounts

Annual bonus The maximum annual bonus opportunity for Executive Directors will remain at 200% of base salary for 2021.
The table below sets out the financial elements, which comprise 60% of the total annual bonus:
Financial measures Weighting in total bonus
Group Net Profit1 20%
Group Order Intake 20%
Group Free Cash Flow 20%
1 Measured as Group business performance before separately disclosed items.
The remaining 40% of the annual bonus will comprise robust metrics covering seven strategic areas: Health and Safety; Customer and Service Quality; Growth; People; Sustainability (ESG); Energy Transition; and strategic initiatives. This will provide the Committee with the ability to consider not only financial achievements, but also the wider health of the Company and the manner and behaviours by which our performance has been delivered. The Committee will set stretching 2021 targets and will provide disclosure at the end of the performance year.
Where any participant has not reached the agreed shareholding guideline target, they will be required to invest one-third of their post-tax bonus into Petrofac shares until the guideline is reached. For newly appointed Executive Directors, any bonus will be paid half in cash and half in deferred shares under the new Deferred Bonus Plan, which will vest in equal tranches over one, two and three years from the date of award. This arrangement will apply to Mr Iskander.
The annual bonus is subject to malus and clawback provisions as set out in more detail in our remuneration policy. The Committee also retains the option to apply an additional discretion as deemed appropriate, based on the performance of the Company or the relevant Director during the financial year under review.
Performance Share Plan For 2021, Mr Iskander will receive an exceptional award of 300% of base salary in line with the Remuneration Policy following his appointment to the Board. Mr Cochran will receive an award of 200% of base salary. In line with previous years, and recognising the recent reduction in share price, the Committee has retained the cap of three times face value that can be delivered from the 2021 PSP award. Other than in exceptional circumstances (for which the Committee would provide justification), it is intended that the maximum value that can be delivered in the year of vesting will be limited to three times face value of the award at grant. This three times face value cap will apply to all PSP awards made to the Company’s leadership team in 2021.
For 2021, the PSP framework will change to 50% relative TSR and 50% strategic element. This enables the addition of strategic measures, in addition to strategic financial metrics, around ESG and our move into Energy Transition solutions.
1) TSR element (50% of award)The tables below set out the TSR comparator group for the purposes of the 2021 awards and the vesting schedule used to determine the performance outcome. The TSR comparator group takes into account the current market environment and more closely aligned to our business activities:
Aker Solutions Saipem Technip FMC
Fluor Corporation SNC Lavalin Tecnicas Reunidas
Hunting Subsea7 Worley Parsons
KBR, Inc Samsung Engineering Co., Ltd
Wood Group
Maire Tecnimont
Vesting scheduleThree-year performance against the Comparator group of maximum
Performance equal to median 25%
Performance equal to upper quartile 100%
Straight-line vesting operates between the points above
2) Strategic element (50% of award) The remaining 50% of the 2021 PSP award will be subject to three-year strategic performance conditions. For the 2021 awards, the Committee will set stretching targets to five key strategic priorities. The key strategic priorities and associated measures for the 2021 award are as follows:
Strategic priorities Performance measure 2021-2023
Conserve cash Cash conversion
Maintain competitiveness Overhead ratio
Rebuild backlog Book-to-bill
Deliver operational excellence
Operational performance (on-schedule, on-budget)
Promote sustainability Energy transition (New Energy Services revenue) Diversity (Hampton-Alexander)Greenhouse gas emissionsSustainable engagement
Under each strategic priority, vesting for threshold performance will be 25% of maximum with straight-line vesting up to 100% of maximum. Each of the eight performance measures will have a weighting of 6.25%. The Committee considers that the precise targets for the 2021-23 period are commercially sensitive however, we intend to provide detailed disclosure of the targets and performance against those targets following the end of the performance period.
Any vested post-tax shares will be subject to an additional two-year holding period. In addition, where participants have not reached the shareholding guideline target, they will be required to continue to hold any shares after the holding period until the guideline is reached. PSP awards are subject to malus and clawback provisions as set out in more detail in our remuneration policy. The Committee also retains the option to apply an additional discretion as deemed appropriate, based on the performance of the Company or the relevant Director during the financial year under review.
Directors’ remuneration report continued
Petrofac Limited | 2020 Annual report and accounts116
Corporate Governance

Post-employment shareholding guideline (from 2019)Executive Directors are required to maintain a shareholding in the Company for a period of 24 months following departure. The post-employment shareholdings are as follows:
Executive Directors appointed pre-2019
For the first 12 months following departure
100% of their shareholding guideline1
For the second 12 months following departure
50% of their shareholding guideline1
Executive Directors appointed post-2019
For the first 24 months following departure
100% of their shareholding guideline1
1 Or actual shareholding at the point of departure, if lower.
Awards granted under any Company long-term incentive plan, which have vested but are subject to a holding period, will count towards the guideline (on a net of tax basis). The Company also intends to implement a suitable mechanism by which to enforce the application of these post-employment guidelines. This will be by way of a tripartite agreement between the Executive Directors, a nominee account, and the Company. As part of this arrangement, a restriction will be placed on shares held that will prevent their sale or transfer without prior authorisation by the Company until the guideline has been satisfied.
Consideration by the Directors of matters relating to Directors’ remunerationSupport for the CommitteeDuring the year, the Committee received independent advice on executive remuneration matters from Deloitte LLP (Deloitte), who were formally appointed as advisors by the Committee in October 2005. Deloitte is a member of the Remuneration Consultants Group and, as such, voluntarily operates under a code of conduct in relation to executive remuneration consulting in the UK.
The Committee has reviewed the advice provided by Deloitte during the year and is satisfied that it has been objective and independent. Total fees received by Deloitte in relation to the remuneration advice provided to the Committee during 2020 amounted to £103,500 based on the required time commitment. During 2020, Deloitte did not provide any other services to the Company.
The Secretary to the Board acts as Secretary to the Committee. During the year, the Chief Executive Officer, Chief Financial Officer and the Group Director of Human Resources attended meetings on an ad hoc basis at the invitation of the Committee and provided information and support as requested. However, no individual was present when their own remuneration was being discussed.
GovernanceThe Board and the Committee consider that, throughout 2020 and up to the date of this report, the Company has complied with the provisions set out in the UK Corporate Governance Code relating to Directors’ remuneration. In addition, relevant guidelines issued by prominent investor bodies and proxy voting agencies have been presented to and considered by the Committee during its discussions.
The Committee endeavours to consider executive remuneration matters in the context of alignment with risk management and, during the year, had oversight of any related factors to be taken into consideration. The Committee believes that the remuneration arrangements in place do not raise any health and safety, environmental, social or ethical issues, nor inadvertently motivate irresponsible behaviour.
External board appointmentsExecutive Directors are normally entitled to accept one non-executive appointment outside the Company with the consent of the Board. Any fees received may be retained by the Director. As at the date of this report, no Executive Director holds an externally paid non-executive appointment.
Shareholder votingThe table below outlines the result of the advisory vote of the 2019 Directors’ Remuneration Report at the 2020 AGM.
Annual Report on RemunerationNumber of votes cast excluding abstentions For Against Abstentions
234,044,043 229,285,647 4,758,396 133,655
97.97% 2.03%
The table below outlines the result of the advisory vote of the 2019 Policy Report received at the AGM held on 15 May 2020.
Remuneration Policy ReportNumber of votes cast (excluding abstentions) For Against Abstentions
234,052,554 224,428,003 9,624,551 125,143
95.89% 4.11%
Availability of documentationService contracts and letters of appointment for all Directors are available for inspection by any person at our registered office in Jersey and at our corporate services office in London. They will also be available for inspection during the 30 minutes prior to the start of our AGM to be held on 17 June 2021.
Annual General MeetingAs set out in my statement on page 107 and 108, our Annual Report on Remuneration will be subject to an advisory shareholder vote at the AGM to be held on 17 June 2021.
On behalf of the Board
Matthias BichselChairman of the Remuneration Committee 20 April 2021
Strateg
ic repo
rtG
overn
ance
Finan
cial statemen
ts
117Petrofac Limited | 2020 Annual report and accounts

Directors’ responsibilitiesThe Directors are responsible for preparing the Annual Report and Accounts and the financial statements in accordance with applicable law and regulations.
The Directors have chosen to prepare the financial statements in accordance with International Financial Reporting Standards (IFRS). The Directors are also responsible for the preparation of the Directors’ remuneration report, which they have chosen to prepare, being under no obligation to do so under Jersey law. The Directors are also responsible for the preparation of the corporate governance report under the UK Listing Rules and FRC regulations.
Jersey Company law (the ‘Law’) requires the Directors to prepare financial statements for each financial period in accordance with generally accepted accounting principles. The financial statements are required by law to give a true and fair view of the state of affairs of the Company at the period end and of the profit or loss of the Company for the period then ended. In preparing these financial statements, the Directors should:
— Select suitable accounting policies and then apply them consistently — Make judgements and estimates that are reasonable — Specify which generally accepted accounting principles have been adopted in their preparation — Prepare the financial statements on a going concern basis unless it is inappropriate to presume that the Company will continue in business
The Directors are responsible for keeping proper accounting records, which are sufficient to show and explain the Company’s transactions and to disclose with reasonable accuracy at any time the financial position of the Company and enable them to ensure that the financial statements prepared by the Company comply with the requirements of the Law. They are also responsible for safeguarding the assets of the Group and Company and hence for taking reasonable steps for the prevention and detection of fraud and other irregularities.
The Directors are responsible for the maintenance and integrity of the corporate and financial information included on the Company’s website. Legislation in Jersey governing the preparation and dissemination of financial statements may differ from legislation in other jurisdictions.
Directors’ approachThe Board’s objective is to present a fair, balanced and understandable assessment of the Company’s position and prospects, particularly in the Annual Report and Accounts, half-year results announcement and other published documents and reports to Regulators. The Board has established an Audit Committee to assist with this obligation.
Going concernThe Company’s business activities, together with the factors likely to affect its future development, performance and position, are set out in the Strategic report on pages 7 to 9 and 16 to 23. The financial position of the Company, its cash flows, liquidity position and borrowing facilities are described in the financial review on pages 75 to 79. In addition, note 2.5 to the financial statements includes the Company’s objectives, policies and processes for managing its capital; its financial risk management objectives; details of its financial instruments and hedging activities; and its exposures to credit and liquidity risk.
The Company has considerable financial resources together with long-term contracts with a number of clients and suppliers across different geographic areas and industries. Consequently, the Directors believe that the Company is well-placed to manage its business risks successfully.
The Directors have a reasonable expectation that the Company has adequate resources to continue in operational existence for the period of at least 12 months from the date of signing the Group financial statements to 30 April 2022. Thus they continue to adopt the going concern basis of accounting in preparing the annual financial statements.
Responsibility statement of the Directors in respect of the Annual ReportEach of the Directors listed on pages 82 to 84 confirms that, to the best of their knowledge:
— The Annual Report and Accounts, taken as a whole, is fair, balanced and understandable and provides the information necessary for shareholders to assess the Company’s position and performance, business model and strategy — The financial statements, prepared in accordance with IFRS, give a true and fair view of the assets, liabilities, financial position and profit of the Company and the undertakings included in the consolidation taken as a whole — The Strategic report contained on pages 2 to 79 includes a fair review of the development and performance of the business and the position of the Company and the undertakings included in the consolidation taken as a whole, together with a description of the principal risks and uncertainties that they face
By order of the Board
Alastair CochranChief Financial Officer20 April 2021
Directors’ statements
Petrofac Limited | 2020 Annual report and accounts118
Corporate Governance
Group financial statements
120 Independent auditor’s report to the members of Petrofac Limited131 Consolidated income statement132 Consolidated statement of other comprehensive income133 Consolidated balance sheet134 Consolidated statement of cash flows135 Consolidated statement of changes in equity191 Appendices
136 Notes to the consolidated financial statements136 Note 1 Corporate information136 Note 2 Summary of significant accounting policies149 Note 3 Revenue from contracts with customers150 Note 4 Segment information152 Note 5 Expenses and income154 Note 6 Separately disclosed items 156 Note 7 Finance income/(expense)156 Note 8 Income tax158 Note 9 Earnings per share159 Note 10 Dividends paid and proposed159 Note 11 Deferred consideration160 Note 12 Property, plant and equipment161 Note 13 Non-controlling interests162 Note 14 Goodwill163 Note 15 Assets and liabilities held for sale164 Note 16 Intangible assets165 Note 17 Investments in associates and joint ventures167 Note 18 Other financial assets and other financial liabilities171 Note 19 Inventories 171 Note 20 Trade and other receivables172 Note 21 Contract assets and contract liabilities173 Note 22 Cash and short-term deposits174 Note 23 Share capital174 Note 24 Employee Benefit Trust (“EBT”) shares175 Note 25 Share-based payment plans177 Note 26 Other reserves178 Note 27 Interest-bearing loans and borrowings179 Note 28 Provisions180 Note 29 Trade and other payables181 Note 30 Leases182 Note 31 Commitments and contingent liabilities183 Note 32 Related party transactions183 Note 33 Accrued contract expenses183 Note 34 Risk management and financial instruments188 Note 35 Subsidiaries, associates and joint arrangements
Strateg
ic repo
rtG
overn
ance
Finan
cial statemen
ts
119Petrofac Limited | 2020 Annual report and accounts

Independent auditor’s report to the members of Petrofac Limited
OpinionIn our opinion:
— Petrofac Limited’s group financial statements and parent company financial statements (the financial statements) give a true and fair view of the state of the group’s and of the parent company’s affairs as at 31 December 2020 and of the group’s loss and the parent company’s loss for the year then ended; — the financial statements have been properly prepared in accordance with International Financial Reporting Standards; and — the financial statements have been properly prepared in accordance with the requirements of the Companies (Jersey) Law 1991.
We have audited the financial statements of Petrofac Limited (the parent company) and its subsidiaries (the group) for the year ended 31 December 2020 which comprise:
Group Parent Company
Consolidated income statement for the year ended 31 December 2020
Company income statement for the year ended 31 December 2020
Consolidated statement of other comprehensive income for the year ended 31 December 2020
Company statement of other comprehensive income for the year ended 31 December 2020
Consolidated balance sheet at 31 December 2020
Company balance sheet at 31 December 2020
Consolidated statement of cash flows for the year ended 31 December 2020
Company statement of cash flows for the year ended 31 December 2020
Consolidated statement of changes in equity for the year ended 31 December 2020
Company statement of changes in equity for the year ended 31 December 2020
Related notes 1 to 35 to the financial statements, including a summary of significant accounting policies
Related notes 1 to 21 to the financial statements including a summary of significant accounting policies
The financial reporting framework that has been applied in the preparation of the financial statements is applicable law and International Financial Reporting Standards.
We have also audited the part of the Director’s Remuneration Report identified as being audited on pages 109 to 113.
Basis for opinionWe conducted our audit in accordance with International Standards on Auditing (UK) (ISAs (UK)) and applicable law. Our responsibilities under those standards are further described in the Auditor’s responsibilities for the audit of the financial statements section of our report. We are independent of the group and parent company in accordance with the ethical requirements that are relevant to our audit of the financial statements, including the UK FRC’s Ethical Standard as applied to listed entities, and we have fulfilled our other ethical responsibilities in accordance with these requirements.
We believe that the audit evidence we have obtained is sufficient and appropriate to provide a basis for our opinion.
Conclusions relating to going concernIn auditing the financial statements, we have concluded that the directors’ use of the going concern basis of accounting in the preparation of the financial statements is appropriate. Our evaluation of the directors’ assessment of the group and parent company’s ability to continue to adopt the going concern basis of accounting included:
— confirming our understanding of the directors’ going concern assessment process. — assessing the adequacy of the going concern assessment period to 30 April 2022 and considering the existence of any significant events or conditions beyond this period. — the lead audit partner increasing his time directing and supervising the audit procedures on going concern and utilising an EY specialist to assist in assessing the model and the assumptions employed. — verifying inputs against board-approved forecasts and debt facility terms. — reviewing borrowing facilities to confirm their availability to the group through the going concern period and to assess the completeness of covenants identified by management. — considering management’s historical forecasting accuracy and the consistency of the assessment with information obtained from other areas of the audit, such as accounting estimates. — testing the assessment, including forecast liquidity and covenant compliance under base and downside scenarios, for clerical accuracy. — assessing whether assumptions made were reasonable and in the case of downside scenarios, appropriately severe, in light of the group’s relevant principal risks and uncertainties. — challenging the amount and timing of identified mitigating actions available to respond to a ‘severe but plausible’ downside scenario, and whether those actions are feasible and within the group’s control. — performing independent sensitivity analysis on assumptions, including applying incremental adverse cashflow and covenant impacts, and a more conservative view on future mitigating actions. — considering the appropriateness of management’s ‘reverse stress test’ downside scenario, to understand how severe conditions would have to be to breach liquidity and/or covenant headroom, and whether the scenario has no more than a remote possibility of occurring. — considering the impact of a significant event beyond the going concern assessment period that was identified by the directors and the audit team, being the need to complete a refinancing of the group’s primary debt facility prior to its expiry on 2 June 2022. We challenged whether there was a realistic prospect that the group would be able to complete this refinancing. Our audit procedures included assessing the conclusions of the group’s external debt and equity advisors, and the involvement of an EY debt advisory specialist to help us form an independent view. —assessing the appropriateness of the going concern disclosures.
Petrofac Limited | 2020 Annual report and accounts120
Financial statements
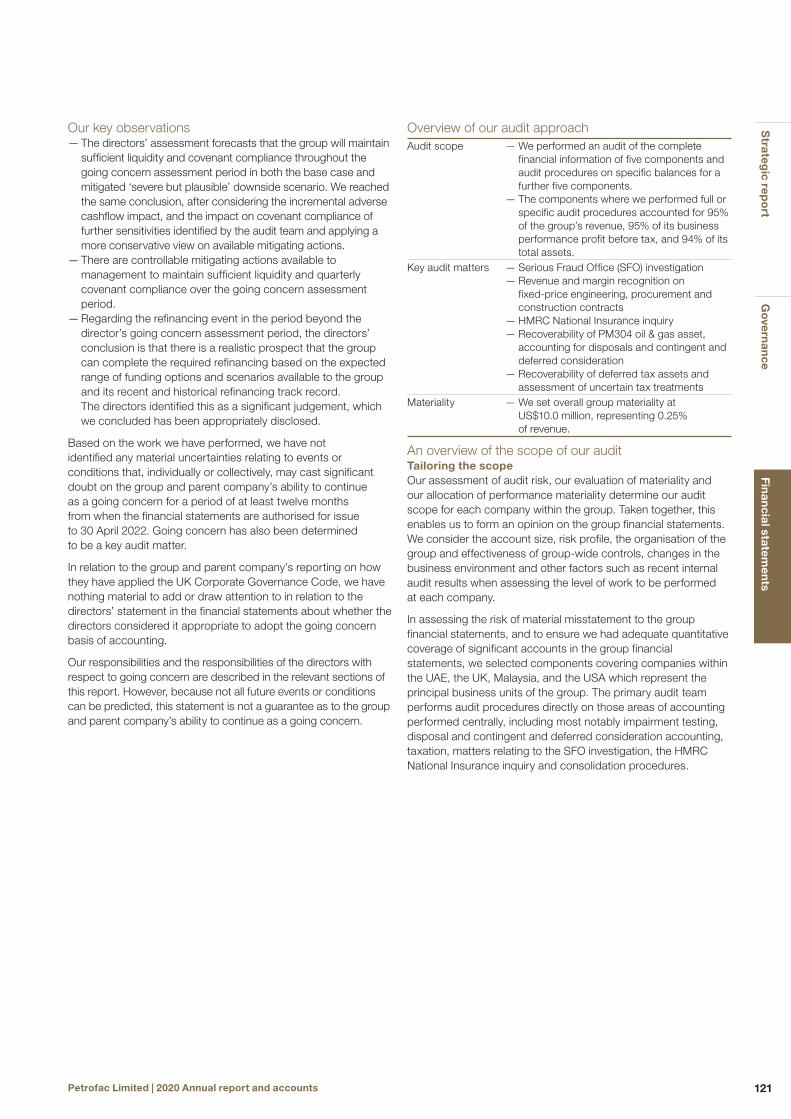
Our key observations — The directors’ assessment forecasts that the group will maintain sufficient liquidity and covenant compliance throughout the going concern assessment period in both the base case and mitigated ‘severe but plausible’ downside scenario. We reached the same conclusion, after considering the incremental adverse cashflow impact, and the impact on covenant compliance of further sensitivities identified by the audit team and applying a more conservative view on available mitigating actions. — There are controllable mitigating actions available to management to maintain sufficient liquidity and quarterly covenant compliance over the going concern assessment period. — Regarding the refinancing event in the period beyond the director’s going concern assessment period, the directors’ conclusion is that there is a realistic prospect that the group can complete the required refinancing based on the expected range of funding options and scenarios available to the group and its recent and historical refinancing track record. The directors identified this as a significant judgement, which we concluded has been appropriately disclosed.
Based on the work we have performed, we have not identified any material uncertainties relating to events or conditions that, individually or collectively, may cast significant doubt on the group and parent company’s ability to continue as a going concern for a period of at least twelve months from when the financial statements are authorised for issue to 30 April 2022. Going concern has also been determined to be a key audit matter.
In relation to the group and parent company’s reporting on how they have applied the UK Corporate Governance Code, we have nothing material to add or draw attention to in relation to the directors’ statement in the financial statements about whether the directors considered it appropriate to adopt the going concern basis of accounting.
Our responsibilities and the responsibilities of the directors with respect to going concern are described in the relevant sections of this report. However, because not all future events or conditions can be predicted, this statement is not a guarantee as to the group and parent company’s ability to continue as a going concern.
Overview of our audit approachAudit scope — We performed an audit of the complete
financial information of five components and audit procedures on specific balances for a further five components. — The components where we performed full or specific audit procedures accounted for 95% of the group’s revenue, 95% of its business performance profit before tax, and 94% of its total assets.
Key audit matters — Serious Fraud Office (SFO) investigation — Revenue and margin recognition on fixed-price engineering, procurement and construction contracts — HMRC National Insurance inquiry — Recoverability of PM304 oil & gas asset, accounting for disposals and contingent and deferred consideration — Recoverability of deferred tax assets and assessment of uncertain tax treatments
Materiality — We set overall group materiality at US$10.0 million, representing 0.25% of revenue.
An overview of the scope of our audit Tailoring the scopeOur assessment of audit risk, our evaluation of materiality and our allocation of performance materiality determine our audit scope for each company within the group. Taken together, this enables us to form an opinion on the group financial statements. We consider the account size, risk profile, the organisation of the group and effectiveness of group-wide controls, changes in the business environment and other factors such as recent internal audit results when assessing the level of work to be performed at each company.
In assessing the risk of material misstatement to the group financial statements, and to ensure we had adequate quantitative coverage of significant accounts in the group financial statements, we selected components covering companies within the UAE, the UK, Malaysia, and the USA which represent the principal business units of the group. The primary audit team performs audit procedures directly on those areas of accounting performed centrally, including most notably impairment testing, disposal and contingent and deferred consideration accounting, taxation, matters relating to the SFO investigation, the HMRC National Insurance inquiry and consolidation procedures.
Strateg
ic repo
rtG
overn
ance
Finan
cial statemen
ts
121Petrofac Limited | 2020 Annual report and accounts
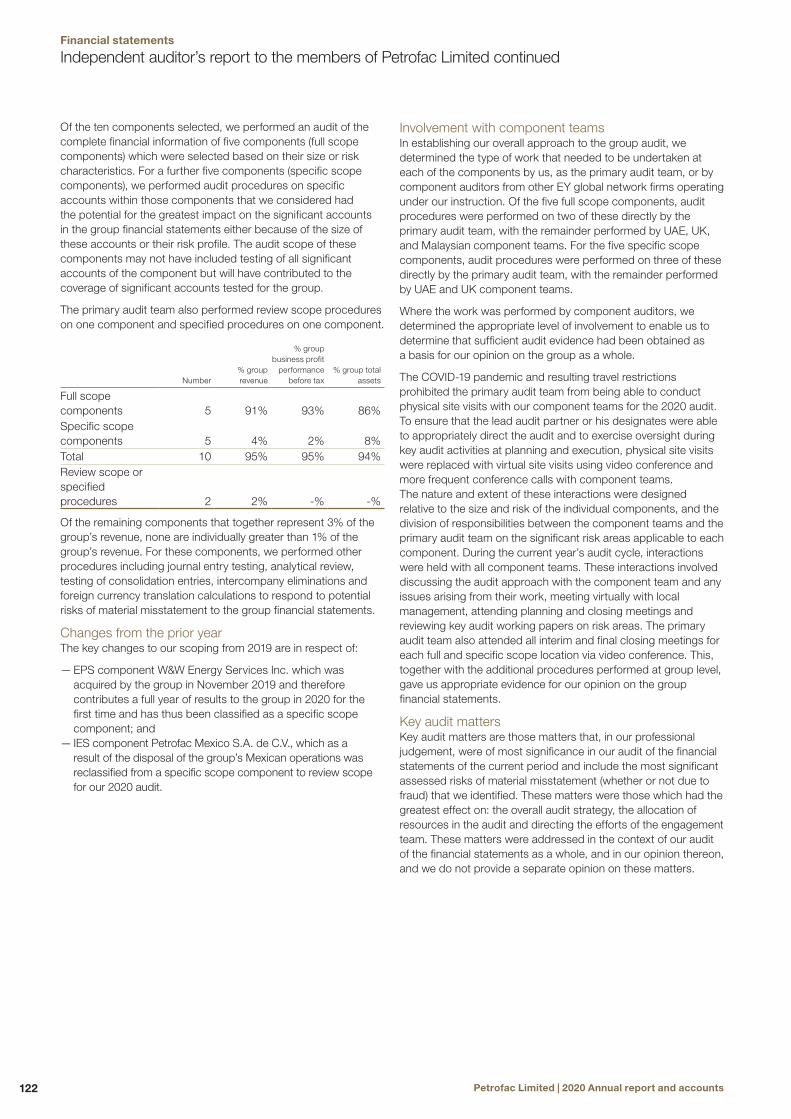
Independent auditor’s report to the members of Petrofac Limited continued
Of the ten components selected, we performed an audit of the complete financial information of five components (full scope components) which were selected based on their size or risk characteristics. For a further five components (specific scope components), we performed audit procedures on specific accounts within those components that we considered had the potential for the greatest impact on the significant accounts in the group financial statements either because of the size of these accounts or their risk profile. The audit scope of these components may not have included testing of all significant accounts of the component but will have contributed to the coverage of significant accounts tested for the group.
The primary audit team also performed review scope procedures on one component and specified procedures on one component.
Number% group revenue
% group business profit
performance before tax
% group total assets
Full scope components 5 91% 93% 86%Specific scope components 5 4% 2% 8%Total 10 95% 95% 94%Review scope or specified procedures 2 2% -% -%
Of the remaining components that together represent 3% of the group’s revenue, none are individually greater than 1% of the group’s revenue. For these components, we performed other procedures including journal entry testing, analytical review, testing of consolidation entries, intercompany eliminations and foreign currency translation calculations to respond to potential risks of material misstatement to the group financial statements.
Changes from the prior year The key changes to our scoping from 2019 are in respect of:
— EPS component W&W Energy Services Inc. which was acquired by the group in November 2019 and therefore contributes a full year of results to the group in 2020 for the first time and has thus been classified as a specific scope component; and — IES component Petrofac Mexico S.A. de C.V., which as a result of the disposal of the group’s Mexican operations was reclassified from a specific scope component to review scope for our 2020 audit.
Involvement with component teams In establishing our overall approach to the group audit, we determined the type of work that needed to be undertaken at each of the components by us, as the primary audit team, or by component auditors from other EY global network firms operating under our instruction. Of the five full scope components, audit procedures were performed on two of these directly by the primary audit team, with the remainder performed by UAE, UK, and Malaysian component teams. For the five specific scope components, audit procedures were performed on three of these directly by the primary audit team, with the remainder performed by UAE and UK component teams.
Where the work was performed by component auditors, we determined the appropriate level of involvement to enable us to determine that sufficient audit evidence had been obtained as a basis for our opinion on the group as a whole.
The COVID-19 pandemic and resulting travel restrictions prohibited the primary audit team from being able to conduct physical site visits with our component teams for the 2020 audit. To ensure that the lead audit partner or his designates were able to appropriately direct the audit and to exercise oversight during key audit activities at planning and execution, physical site visits were replaced with virtual site visits using video conference and more frequent conference calls with component teams. The nature and extent of these interactions were designed relative to the size and risk of the individual components, and the division of responsibilities between the component teams and the primary audit team on the significant risk areas applicable to each component. During the current year’s audit cycle, interactions were held with all component teams. These interactions involved discussing the audit approach with the component team and any issues arising from their work, meeting virtually with local management, attending planning and closing meetings and reviewing key audit working papers on risk areas. The primary audit team also attended all interim and final closing meetings for each full and specific scope location via video conference. This, together with the additional procedures performed at group level, gave us appropriate evidence for our opinion on the group financial statements.
Key audit matters Key audit matters are those matters that, in our professional judgement, were of most significance in our audit of the financial statements of the current period and include the most significant assessed risks of material misstatement (whether or not due to fraud) that we identified. These matters were those which had the greatest effect on: the overall audit strategy, the allocation of resources in the audit and directing the efforts of the engagement team. These matters were addressed in the context of our audit of the financial statements as a whole, and in our opinion thereon, and we do not provide a separate opinion on these matters.
Petrofac Limited | 2020 Annual report and accounts122
Financial statements

Risk Our response to the riskKey observations communicated to the Audit Committee
SFO investigationRefer to the Viability statement (pages 68 and 69); Audit Committee report (page 99); and Note 31 to the group financial statements (Page 182)
Direct impactOn 12 May 2017, the UK Serious Fraud Office (SFO) announced an investigation into the activities of Petrofac, its subsidiaries, and their officers, employees and agents for suspected bribery, corruption, and/or money laundering.
The SFO announced on 7 February 2019 that a former Petrofac employee had entered a guilty plea to 11 counts of bribery under the Bribery Act 2010 (the Act). In January 2021, the same former employee admitted further charges under the Act. No charges have been brought against any group company or any other officers or employees to date. Although not charged, a number of former Petrofac employees and entities are alleged to have acted together with the individual concerned. The SFO investigation is ongoing and the Board received regular updates from Group General Counsel throughout 2020.
The continuing investigation raises the possibility of financial sanctions which could have a material impact on the financial statements and forecasts in relation to going concern and viability. In addition, there is a risk of damage to the reputation of Petrofac which might mean that it is more difficult to win new business, refinance maturing facilities and maintain banking arrangements – all of which could have implications on viability.
Internal control environmentA large part of the group’s business is characterised by competition for individually significant contracts with customers, which are often directly or indirectly associated with governments, and the award of individually significant contracts to suppliers. The procurement processes associated with these activities are susceptible to the risk of corruption. In addition, the group operates in a number of territories where the use of commercial intermediaries continues to be normal practice.
We have considered whether the internal control environment supports the prevention, or detection and correction, of material misstatements relevant to financial reporting arising from non-compliance with laws and regulations, including instances of bribery and corruption.
Investigation work programmeOur work programme was based on enquiries of management and legal counsel and inspection of documentation relevant to the investigation and the group’s response. The development of our approach and the performance of our procedures was supported by EY Forensics & Integrity Specialists (EY FIS).
The audit team, together with a member of EY FIS, met with Group General Counsel and external legal counsel to understand the nature of engagement with the SFO during the year and inspected relevant correspondence.
We reviewed minutes of meetings of the Board sub-committee responsible for oversight of the group’s response to the investigation to further our understanding of the progress of the investigation during the year. We corroborated this review by making enquiries of members of the sub-committee.
Procedures in response to financial, commercial and viability impactWe made enquiries of:
— the Group Chief Executive, business unit Managing Directors and the Group Chief Financial Officer to understand the commercial impact of the ongoing investigation on customer relationships and future orders; — the Head of Treasury to understand the impact of the ongoing investigation on banking arrangements and the ability to refinance maturing facilities over the viability assessment period.
We considered the potential impact on going concern including liquidity, covenants, and downside scenarios, and re-performed key stress tests with a particular focus on reductions in new order intake and/or adverse legal or commercial settlements.
Internal control environmentWe made enquiries of the Chairman, the Audit Committee, the Group Chief Executive, the Group Chief Financial Officer, Group General Counsel and external legal counsel and inspected relevant documentation to understand whether there was any evidence that the former Petrofac employees named by the SFO may have committed an offence, thereby leading us to question our ability to place reliance on management.
We obtained an understanding of the elements of the entity level control framework that are designed to prevent non-compliance with laws and regulations, including bribery and corruption.
We performed a walkthrough of processes and controls over the identification and authorisation of higher-risk third parties, and the processes and controls in place to prevent payment to unauthorised third parties.
We looked for transactions with higher-risk counterparties during the year by using data analysis techniques, including searches for higher-risk terms associated with the SFO allegations. We tested whether the transactions identified had a legitimate business rationale and were appropriately approved.
DisclosureWe challenged whether developments during the year would require a provision to be recognised in the financial statements rather than continued disclosure as a contingent liability. We considered the adequacy of disclosure in the Chairman’s Statement, Principal Risks and Uncertainties section, Governance report and the Viability Statement.
In our view, the additional charges against a former employee and the ongoing nature of the investigation increase the possibility of a charging event that could lead to financial penalties for the group; however, on the basis of the evidence made available to us we concur with the group’s position that a possible but not probable obligation exists and that it remains appropriate to continue to disclose the matter as a contingent liability at this time.
The going concern and viability forecasts, including downside scenarios, are reasonable and consistent with the results of our audit procedures.
From the procedures performed, nothing came to our attention that caused us to question our continued ability to place reliance on management.
No specific matters were raised with the Audit Committee in relation to our assessment of the internal control environment.
We have reviewed the disclosures on this matter in the annual report and accounts are satisfied they appropriately represent the status of the SFO’s investigation and the group’s response.
We assessed the relevant disclosures in the annual report and accounts to be fair, balanced and understandable with respect to the knowledge we gained during the audit.
Strateg
ic repo
rtG
overn
ance
Finan
cial statemen
ts
123Petrofac Limited | 2020 Annual report and accounts
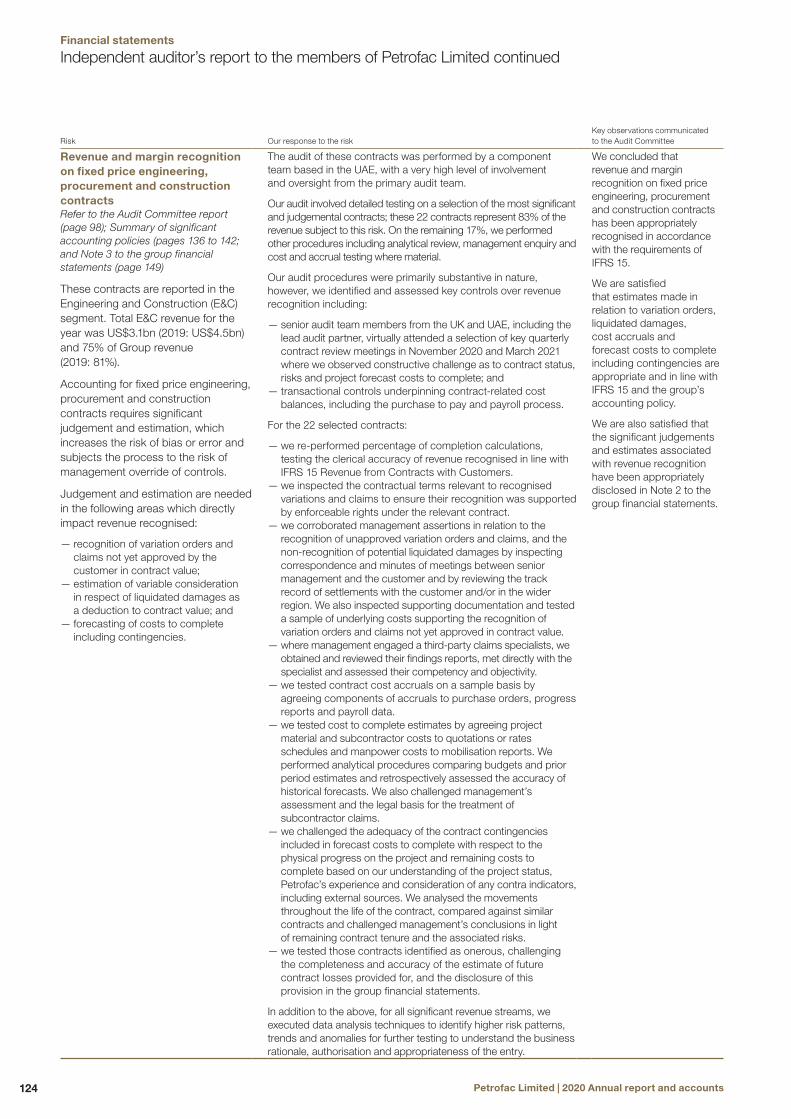
Risk Our response to the riskKey observations communicated to the Audit Committee
Revenue and margin recognition on fixed price engineering, procurement and construction contractsRefer to the Audit Committee report (page 98); Summary of significant accounting policies (pages 136 to 142; and Note 3 to the group financial statements (page 149)
These contracts are reported in the Engineering and Construction (E&C) segment. Total E&C revenue for the year was US$3.1bn (2019: US$4.5bn) and 75% of Group revenue (2019: 81%).
Accounting for fixed price engineering, procurement and construction contracts requires significant judgement and estimation, which increases the risk of bias or error and subjects the process to the risk of management override of controls.
Judgement and estimation are needed in the following areas which directly impact revenue recognised:
— recognition of variation orders and claims not yet approved by the customer in contract value; — estimation of variable consideration in respect of liquidated damages as a deduction to contract value; and — forecasting of costs to complete including contingencies.
The audit of these contracts was performed by a component team based in the UAE, with a very high level of involvement and oversight from the primary audit team.
Our audit involved detailed testing on a selection of the most significant and judgemental contracts; these 22 contracts represent 83% of the revenue subject to this risk. On the remaining 17%, we performed other procedures including analytical review, management enquiry and cost and accrual testing where material.
Our audit procedures were primarily substantive in nature, however, we identified and assessed key controls over revenue recognition including:
— senior audit team members from the UK and UAE, including the lead audit partner, virtually attended a selection of key quarterly contract review meetings in November 2020 and March 2021 where we observed constructive challenge as to contract status, risks and project forecast costs to complete; and — transactional controls underpinning contract-related cost balances, including the purchase to pay and payroll process.
For the 22 selected contracts:
— we re-performed percentage of completion calculations, testing the clerical accuracy of revenue recognised in line with IFRS 15 Revenue from Contracts with Customers. — we inspected the contractual terms relevant to recognised variations and claims to ensure their recognition was supported by enforceable rights under the relevant contract. — we corroborated management assertions in relation to the recognition of unapproved variation orders and claims, and the non-recognition of potential liquidated damages by inspecting correspondence and minutes of meetings between senior management and the customer and by reviewing the track record of settlements with the customer and/or in the wider region. We also inspected supporting documentation and tested a sample of underlying costs supporting the recognition of variation orders and claims not yet approved in contract value. — where management engaged a third-party claims specialists, we obtained and reviewed their findings reports, met directly with the specialist and assessed their competency and objectivity. — we tested contract cost accruals on a sample basis by agreeing components of accruals to purchase orders, progress reports and payroll data. — we tested cost to complete estimates by agreeing project material and subcontractor costs to quotations or rates schedules and manpower costs to mobilisation reports. We performed analytical procedures comparing budgets and prior period estimates and retrospectively assessed the accuracy of historical forecasts. We also challenged management’s assessment and the legal basis for the treatment of subcontractor claims. — we challenged the adequacy of the contract contingencies included in forecast costs to complete with respect to the physical progress on the project and remaining costs to complete based on our understanding of the project status, Petrofac’s experience and consideration of any contra indicators, including external sources. We analysed the movements throughout the life of the contract, compared against similar contracts and challenged management’s conclusions in light of remaining contract tenure and the associated risks. — we tested those contracts identified as onerous, challenging the completeness and accuracy of the estimate of future contract losses provided for, and the disclosure of this provision in the group financial statements.
In addition to the above, for all significant revenue streams, we executed data analysis techniques to identify higher risk patterns, trends and anomalies for further testing to understand the business rationale, authorisation and appropriateness of the entry.
We concluded that revenue and margin recognition on fixed price engineering, procurement and construction contracts has been appropriately recognised in accordance with the requirements of IFRS 15.
We are satisfied that estimates made in relation to variation orders, liquidated damages, cost accruals and forecast costs to complete including contingencies are appropriate and in line with IFRS 15 and the group’s accounting policy.
We are also satisfied that the significant judgements and estimates associated with revenue recognition have been appropriately disclosed in Note 2 to the group financial statements.
Independent auditor’s report to the members of Petrofac Limited continued
Petrofac Limited | 2020 Annual report and accounts124
Financial statements

Risk Our response to the riskKey observations communicated to the Audit Committee
HMRC National Insurance inquiryRefer to the Audit Committee report (page 99); and Note 31 to the group financial statements (page 182)
HM Revenue & Customs (HMRC) are seeking to establish whether a UK subsidiary of the group is a host employer for offshore employees and therefore liable for payment of secondary National Insurance Contributions between 1999 and 2014.
In 2020, HMRC provided a decision notice to the group, informing of its conclusion that the group is liable for unpaid contributions plus interest in the amount of US$160 million (£124 million).
The group strongly disagrees with the merit of the decision notice and have filed an appeal.
Judgement is required to assess whether, at this stage, the matter satisfies the recognition criteria for a provision, or should continue to be disclosed as a contingent liability.
We obtained an update from management on current year developments in the matter and inspected correspondence between the group and HMRC.
We engaged an EY taxation specialist familiar with the relevant National Insurance legislation and HMRC dispute resolution to assist us in forming an independent view on the likelihood of an adverse outcome for the group.
Together with our specialist we inspected the advice received from external legal counsel engaged on this matter and held a discussion with external counsel to understand and challenge the group’s current position. We also inspected advice provided by the external tax advisor engaged by the group on this matter.
We assessed the adequacy of the group’s updated disclosure of the matter in Note 31 to the group financial statements.
We have concluded that the facts and circumstances continue to support the position taken by the group at this time, that disclosure as a contingent liability remains appropriate as at 31 December 2020.
Strateg
ic repo
rtG
overn
ance
Finan
cial statemen
ts
125Petrofac Limited | 2020 Annual report and accounts
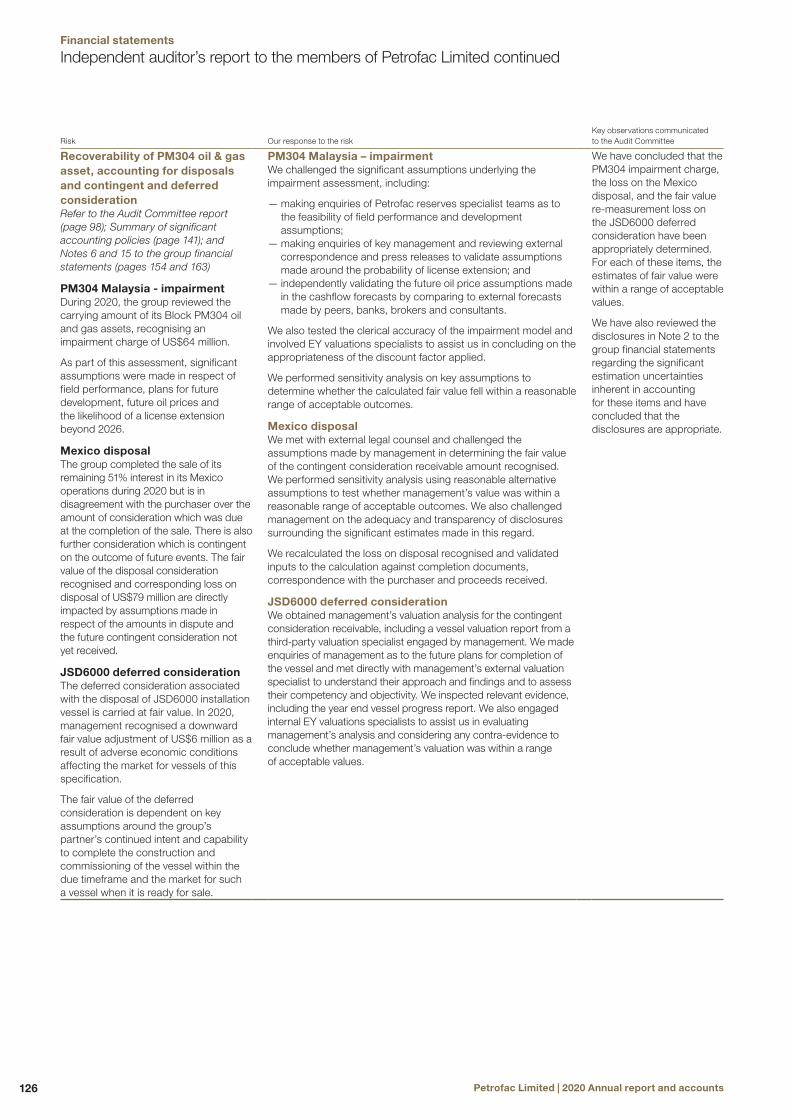
Risk Our response to the riskKey observations communicated to the Audit Committee
Recoverability of PM304 oil & gas asset, accounting for disposals and contingent and deferred considerationRefer to the Audit Committee report (page 98); Summary of significant accounting policies (page 141); and Notes 6 and 15 to the group financial statements (pages 154 and 163)
PM304 Malaysia - impairmentDuring 2020, the group reviewed the carrying amount of its Block PM304 oil and gas assets, recognising an impairment charge of US$64 million.
As part of this assessment, significant assumptions were made in respect of field performance, plans for future development, future oil prices and the likelihood of a license extension beyond 2026.
Mexico disposalThe group completed the sale of its remaining 51% interest in its Mexico operations during 2020 but is in disagreement with the purchaser over the amount of consideration which was due at the completion of the sale. There is also further consideration which is contingent on the outcome of future events. The fair value of the disposal consideration recognised and corresponding loss on disposal of US$79 million are directly impacted by assumptions made in respect of the amounts in dispute and the future contingent consideration not yet received.
JSD6000 deferred considerationThe deferred consideration associated with the disposal of JSD6000 installation vessel is carried at fair value. In 2020, management recognised a downward fair value adjustment of US$6 million as a result of adverse economic conditions affecting the market for vessels of this specification.
The fair value of the deferred consideration is dependent on key assumptions around the group’s partner’s continued intent and capability to complete the construction and commissioning of the vessel within the due timeframe and the market for such a vessel when it is ready for sale.
PM304 Malaysia – impairment We challenged the significant assumptions underlying the impairment assessment, including:
— making enquiries of Petrofac reserves specialist teams as to the feasibility of field performance and development assumptions; — making enquiries of key management and reviewing external correspondence and press releases to validate assumptions made around the probability of license extension; and — independently validating the future oil price assumptions made in the cashflow forecasts by comparing to external forecasts made by peers, banks, brokers and consultants.
We also tested the clerical accuracy of the impairment model and involved EY valuations specialists to assist us in concluding on the appropriateness of the discount factor applied.
We performed sensitivity analysis on key assumptions to determine whether the calculated fair value fell within a reasonable range of acceptable outcomes.
Mexico disposalWe met with external legal counsel and challenged the assumptions made by management in determining the fair value of the contingent consideration receivable amount recognised. We performed sensitivity analysis using reasonable alternative assumptions to test whether management’s value was within a reasonable range of acceptable outcomes. We also challenged management on the adequacy and transparency of disclosures surrounding the significant estimates made in this regard.
We recalculated the loss on disposal recognised and validated inputs to the calculation against completion documents, correspondence with the purchaser and proceeds received.
JSD6000 deferred considerationWe obtained management’s valuation analysis for the contingent consideration receivable, including a vessel valuation report from a third-party valuation specialist engaged by management. We made enquiries of management as to the future plans for completion of the vessel and met directly with management’s external valuation specialist to understand their approach and findings and to assess their competency and objectivity. We inspected relevant evidence, including the year end vessel progress report. We also engaged internal EY valuations specialists to assist us in evaluating management’s analysis and considering any contra-evidence to conclude whether management’s valuation was within a range of acceptable values.
We have concluded that the PM304 impairment charge, the loss on the Mexico disposal, and the fair value re-measurement loss on the JSD6000 deferred consideration have been appropriately determined. For each of these items, the estimates of fair value were within a range of acceptable values.
We have also reviewed the disclosures in Note 2 to the group financial statements regarding the significant estimation uncertainties inherent in accounting for these items and have concluded that the disclosures are appropriate.
Independent auditor’s report to the members of Petrofac Limited continued
Petrofac Limited | 2020 Annual report and accounts126
Financial statements

Risk Our response to the riskKey observations communicated to the Audit Committee
Recoverability of deferred tax assets and assessment of uncertain tax treatmentsRefer to the Audit Committee report (page 98); Summary of significant accounting policies (page 140); and note 8 to the group financial statements (pages 156 to 158)
The group recognises deferred tax assets in a number of jurisdictions, the most significant of which are in Malaysia (US$43 million) and the UK (US$15 million). The recognition of deferred tax assets requires a forecast of the profitability of the underlying businesses and judgement as to whether these future profits are probable.
The group also operates in multiple tax jurisdictions where uncertain tax treatments may be challenged at a later date by the relevant authorities. Liabilities of US$131 million (2019: US$139 million) are held principally in respect of tax deductions previously taken, transfer pricing arrangements and ongoing tax audits. This is an area which requires management to exercise significant judgement as to the likelihood of an adverse outcome for the group, and estimation as to the likely outflow in the event of such a finding.
Deferred tax assetsWe evaluated management’s assessment of the likelihood of realisation of deferred tax asset balances by obtaining profit forecasts for the relevant businesses and ensuring these were consistent with board-approved plans and appropriately reflected the increased uncertainty and forecasting risk arising from the COVID-19 pandemic. In the case of Malaysia, we also assessed the achievability of an internal refinancing arrangement which the group needs to implement to make these profits available.
We have challenged the reliability of management’s forecasting, the reasonableness of the assumptions applied and performed sensitivity analyses to test the likelihood of recovery.
Uncertain tax treatmentsOur primary tax audit team based in the UK coordinated our audit approach to uncertain tax treatments. Local tax experts in relevant jurisdictions were involved as needed to address specific local tax matters, including specialists in Saudi Arabia, Malaysia, Iraq, Russia, Thailand, and India.
We evaluated the risks associated with these exposures and any claims or assessments made by tax authorities to date. We also inspected documentation, considering whether developments in any ongoing tax audits during the year necessitated a change in estimate on any provision.
We also considered whether any interest or penalties should apply based on relevant legislation and historical experience with the authority in question.
We reported an immaterial audit difference for a jurisdiction where management’s assessment of the availability of future profits was judged to be too optimistic. Otherwise, we were satisfied that deferred tax assets are appropriately recognised on the basis that there are probable future taxable profits available and it is probable that the internal refinancing arrangements that management has committed to can be implemented. We were also satisfied that deferred tax assets are appropriately presented and disclosed in the financial statements.
Liabilities in respect of uncertain tax treatments, including penalties where appropriate, have been accounted for in accordance with the requirements of IFRIC 23 Uncertainty over Income Tax Treatments. We reported an immaterial audit difference for one exposure where we felt management’s provision to be overstated based on the available evidence at year-end. Otherwise we are satisfied that the amounts recognised represent management’s best estimate based on the group’s experience in the relevant jurisdictions and historical tax assessments concluded with the tax authorities.
We have also reviewed the disclosures in Note 2 to the group financial statements regarding the significant estimation uncertainties inherent in accounting for these items and have concluded that the disclosures are appropriate.
Strateg
ic repo
rtG
overn
ance
Finan
cial statemen
ts
127Petrofac Limited | 2020 Annual report and accounts

There have been no significant changes in our Key Audit Matters from our 2019 auditor’s report apart from the addition of the HMRC inquiry matter. As a result of the current year developments set out above, this matter required an increased allocation of resources and a higher proportion of the efforts of senior members of the engagement team in 2020, leading to classification as a Key Audit Matter this year.
Our application of materiality We apply the concept of materiality in planning and performing the audit, in evaluating the effect of identified misstatements on the audit and in forming our audit opinion.
MaterialityThe magnitude of an omission or misstatement that, individually or in the aggregate, could reasonably be expected to influence the economic decisions of the users of the financial statements. Materiality provides a basis for determining the nature and extent of our audit procedures.
We determined materiality for the group to be US$10.0 million (2019: US$19.3 million), which is 0.25% of revenue. In 2019, we set materiality at 5% of forecast business performance profit before tax. The significant impact of the COVID-19 pandemic and subsequent decline in oil prices on the group’s financial performance in 2020 caused us to consider alternative measures on which to base materiality for 2020. We considered the focus of stakeholders and users of the financial statements, noting an increased emphasis in the current environment on revenue and revenue-related metrics such as new order intake and backlog. Revenue has historically also been a leading indicator for the profitability and cash flow generating ability of the group. As a result, we concluded revenue would be a more appropriate basis on which to set materiality for 2020. We applied judgement to determine that 0.25% of forecast revenue would result in an appropriate materiality figure to apply in our audit.
We determined materiality for the Parent Company to be US$6.8 million (2019: US$14.9 million), based on 0.5% (2019: 0.5%) of total assets.
During the course of our audit, we reassessed our initial materiality assessment and concluded that no changes were necessary.
Performance materialityThe application of materiality at the individual account or balance level. It is set at an amount to reduce to an appropriately low level the probability that the aggregate of uncorrected and undetected misstatements exceeds materiality.
On the basis of our risk assessments, together with our assessment of the group’s overall control environment, our judgement was that performance materiality should be set at 50% (2019: 50%) of materiality, namely US$5.0 million (2019: US$9.7 million).
Audit work at component locations for the purpose of obtaining audit coverage over significant financial statement accounts is undertaken based on a percentage of total performance materiality. The performance materiality set for each component is based on the relative scale and risk of the component to the group as a whole and our assessment of the risk of misstatement at that component. In the current year, the range of performance materiality allocated to components was US$1.3 to US$4.3 million (2019: US$1.9 to US$8.7 million).
Reporting thresholdAn amount below which identified misstatements are considered as being clearly trivial.
We agreed with the Audit Committee that we would report to them all uncorrected audit differences in excess of US$0.5 million (2019: US$1.0 million), which is set at 5% of planning materiality, as well as differences below that threshold that, in our view, warranted reporting on qualitative grounds. We also agreed that we would report to the Audit Committee any uncorrected classification misstatements above 2% of the any primary financial statement line items to which the misstatement relates.
We evaluate any uncorrected misstatements against both the quantitative measures of materiality discussed above and in light of other relevant qualitative considerations in forming our opinion.
Other information The other information comprises the information included in the annual report and accounts, including the Strategic Report and Governance Report, set out on pages 1 to 118, other than the financial statements and our auditor’s report thereon. The directors are responsible for the other information contained within the annual report and accounts.
Our opinion on the financial statements does not cover the other information and, except to the extent otherwise explicitly stated in this report, we do not express any form of assurance conclusion thereon.
Our responsibility is to read the other information and, in doing so, consider whether the other information is materially inconsistent with the financial statements or our knowledge obtained in the course of the audit or otherwise appears to be materially misstated. If we identify such material inconsistencies or apparent material misstatements, we are required to determine whether there is a material misstatement in the financial statements themselves. If, based on the work we have performed, we conclude that there is a material misstatement of the other information, we are required to report that fact.
We have nothing to report in this regard.
Independent auditor’s report to the members of Petrofac Limited continued
Petrofac Limited | 2020 Annual report and accounts128
Financial statements

Opinion on other matters, as agreed in our Engagement LetterIn our opinion, based on the work undertaken in the course of the audit:
— the part of the Directors’ Remuneration Report to be audited has been properly prepared in accordance with the basis of preparation described therein; — the information given in the Strategic Report and Governance Report for the financial year for which the financial statements are prepared is consistent with the financial statements and those reports have been prepared in accordance with applicable legal requirements; — the information about internal control and risk management systems in relation to financial reporting processes and about share capital structures, given in compliance with rules 7.2.5 and 7.2.6 in the Disclosure Rules and Transparency Rules sourcebook made by the Financial Conduct Authority (the FCA Rules), is consistent with the financial statements and has been prepared in accordance with applicable legal requirements; and — the information about the Company’s corporate governance code and practices and about its administrative, management and supervisory bodies and their committees complies with rules 7.2.2, 7.2.3 and 7.2.7 of the FCA Rules.
In the light of the knowledge and understanding of the group and the parent company and its environment obtained in the course of the audit, we have not identified material misstatements in the Strategic Report or the Governance report.
Matters on which we are required to report by exceptionWe have nothing to report in respect of the following matters in relation to which the Companies (Jersey) Law 1991 requires us to report to you if, in our opinion:
— proper accounting records have not been kept by the parent company, or proper returns adequate for our audit have not been received from branches not visited by us; — the financial statements are not in agreement with the company’s accounting records and returns; or — we have not received all the information and explanations we require for our audit.
Corporate Governance StatementThe Listing Rules require us to review the directors’ statement in relation to going concern, longer-term viability and that part of the Corporate Governance Statement relating to the group and parent company’s compliance with the provisions of the UK Corporate Governance Code specified for our review.
Based on the work undertaken as part of our audit, we have concluded that each of the following elements of the Corporate Governance Statement is materially consistent with the financial statements or our knowledge obtained during the audit:
— directors’ statement with regards to the appropriateness of adopting the going concern basis of accounting and any material uncertainties identified set out on page 118; — directors’ explanation as to its assessment of the company’s prospects, the period this assessment covers and why the period is appropriate set out on page 68; — directors’ statement on fair, balanced and understandable set out on page 118; — Board’s confirmation that it has carried out a robust assessment of the emerging and principal risks set out on pages 62 to 67; — the section of the annual report and accounts that describes the review of effectiveness of risk management and internal control systems set out on pages 96 to 100; and — the section describing the work of the audit committee set out on pages 94 to 101.
Responsibilities of directorsAs explained more fully in the directors’ responsibilities statement set out on page 118, the directors are responsible for the preparation of the financial statements and for being satisfied that they give a true and fair view, and for such internal control as the directors determine is necessary to enable the preparation of financial statements that are free from material misstatement, whether due to fraud or error.
In preparing the financial statements, the directors are responsible for assessing the group and parent company’s ability to continue as a going concern, disclosing, as applicable, matters related to going concern and using the going concern basis of accounting unless the directors either intend to liquidate the group or the parent company or to cease operations, or have no realistic alternative but to do so.
Auditor’s responsibilities for the audit of the financial statements Our objectives are to obtain reasonable assurance about whether the financial statements as a whole are free from material misstatement, whether due to fraud or error, and to issue an auditor’s report that includes our opinion. Reasonable assurance is a high level of assurance but is not a guarantee that an audit conducted in accordance with ISAs (UK) will always detect a material misstatement when it exists. Misstatements can arise from fraud or error and are considered material if, individually or in the aggregate, they could reasonably be expected to influence the economic decisions of users taken on the basis of these financial statements.
Strateg
ic repo
rtG
overn
ance
Finan
cial statemen
ts
129Petrofac Limited | 2020 Annual report and accounts

Explanation as to what extent the audit was considered capable of detecting irregularities, including fraud Irregularities, including fraud, are instances of non-compliance with laws and regulations. We design procedures in line with our responsibilities, outlined above, to detect irregularities, including fraud. The risk of not detecting a material misstatement due to fraud is higher than the risk of not detecting one resulting from error, as fraud may involve deliberate concealment by, for example, forgery or intentional misrepresentations, or through collusion. The extent to which our procedures are capable of detecting irregularities, including fraud is detailed below. However, the primary responsibility for the prevention and detection of fraud rests with both those charged with governance of the company and management.
— We obtained an understanding of the legal and regulatory frameworks that are applicable to the group and determined that the most significant are International Financial Reporting Standards, Companies (Jersey) Law 1991, the UK Corporate Governance Code, the UK Bribery Act, employment law, environmental regulations, health and safety, and tax legislation in the jurisdictions where the group operates. — We understood how the group is complying with those frameworks by making enquiries of management, those charged with governance, internal audit, those responsible for legal and compliance procedures and the company secretary. We corroborated our enquiries through our review of board minutes and papers provided to the Audit Committee, as well as by considering the results of our audit procedures across the group. Our assessment considered the tone set from the top by senior management and the emphasis placed on a culture of honest and ethical behaviour. — We assessed the susceptibility of the financial statements to material misstatement, including how fraud might occur, by meeting with individuals from various parts of the business to gather their views. We considered the programmes and controls that the group has established to address the risks identified, or that otherwise prevent, deter or detect fraud, and how senior management monitors those programmes and controls. We engaged our forensics specialists to provide input on specific aspects of our audit approach to the risk of fraud and non-compliance with laws and regulations. —Based on this understanding we designed our audit procedures to identify non-compliance with laws and regulations that could give rise to a material misstatement in the financial statements; this included the provision of specific instructions to component teams. Our procedures focused on enquires of group management, those charged with governance, legal counsel, and internal audit; addressing the risk of management override through procedures on accounting estimates (as set out in the Key Audit Matters section of this report) and journal entry testing; as well as a specific work programme to address the risks of bribery and corruption.
A further description of our responsibilities for the audit of the financial statements is located on the Financial Reporting Council’s website at https://www.frc.org.uk/auditorsresponsibilities. This description forms part of our auditor’s report.
Use of our reportThis report is made solely to the company’s members, as a body, in accordance with Article 113A of the Companies (Jersey) Law 1991 and our engagement letter dated 5 January 2021. Our audit work has been undertaken so that we might state to the company’s members those matters we are required to state to them in an auditor’s report and for no other purpose. To the fullest extent permitted by law, we do not accept or assume responsibility to anyone other than the company and the company’s members as a body, for our audit work, for this report or for the opinions we have formed.
Colin Brownfor and on behalf of Ernst & Young LLP London
20 April 2021
Notes: 1. The maintenance and integrity of the Petrofac Limited web site is the responsibility of
the directors; the work carried out by the auditors does not involve consideration of these matters and, accordingly, the auditors accept no responsibility for any changes that may have occurred to the financial statements since they were initially presented on the web site.
2. Legislation in the Jersey governing the preparation and dissemination of financial statements may differ from legislation in other jurisdictions.
Independent auditor’s report to the members of Petrofac Limited continued
Petrofac Limited | 2020 Annual report and accounts130
Financial statements

Notes
Businessperformance(1)
US$m
Separately disclosed
items US$m
Reported2020
US$m
Businessperformance(1), (2)
US$m
Separately disclosed
itemsUS$m
Reported2019(2)
US$m
Revenue 3 4,081 – 4,081 5,530 – 5,530Cost of sales 5a (3,802) – (3,802) (4,909) – (4,909)Gross profit 279 – 279 621 – 621Selling, general and administration expenses 5b (167) – (167) (212) – (212)Separately disclosed items 6 – (229) (229) – (189) (189)Expected credit loss allowance 5e (9) – (9) (16) – (16)Other operating income 5f 21 – 21 27 – 27Other operating expenses 5g (43) – (43) (11) – (11)Operating profit/(loss) 81 (229) (148) 409 (189) 220Finance income 7 9 – 9 13 – 13Finance expense 7 (37) – (37) (58) – (58)Share of net profit of associates and joint ventures 17 5 – 5 17 – 17Profit/(loss) before tax 58 (229) (171) 381 (189) 192Income tax (expense)/credit 8a (19) 1 (18) (112) (14) (126)Net profit/(loss) 39 (228) (189) 269 (203) 66
Attributable to:Petrofac Limited shareholders 48 (228) (180) 276 (203) 73Non-controlling interests 13 (9) – (9) (7) – (7)
39 (228) (189) 269 (203) 66Earnings/(loss) per share (US cents)Basic 9 14.2 (67.6) (53.4) 82.1 (60.4) 21.7Diluted 9 14.2 (67.6) (53.4) 80.4 (59.1) 21.3
Notes:(1) This measurement is shown by the Group as a means of measuring underlying business performance; see note 2 and Appendix A on page 191.(2) Re-presented due to the reclassification of an item from selling, general and administration expenses to expected credit loss allowance line item of the consolidated income statement
as set out in note 5b ‘selling, general and administration expenses’.
Consolidated income statementFor the year ended 31 December 2020
Strateg
ic repo
rtG
overn
ance
Finan
cial statemen
ts
131Petrofac Limited | 2020 Annual report and accounts
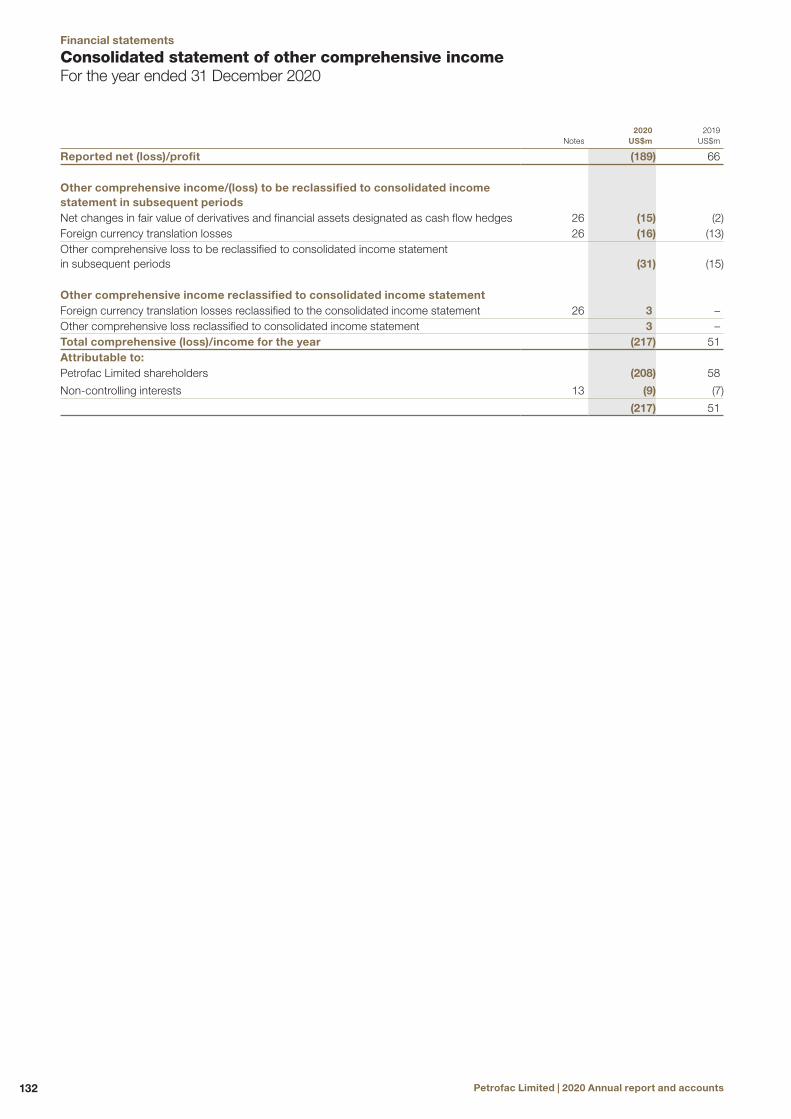
Notes2020
US$m2019
US$m
Reported net (loss)/profit (189) 66
Other comprehensive income/(loss) to be reclassified to consolidated income statement in subsequent periodsNet changes in fair value of derivatives and financial assets designated as cash flow hedges 26 (15) (2)Foreign currency translation losses 26 (16) (13)Other comprehensive loss to be reclassified to consolidated income statement in subsequent periods (31) (15)
Other comprehensive income reclassified to consolidated income statementForeign currency translation losses reclassified to the consolidated income statement 26 3 –Other comprehensive loss reclassified to consolidated income statement 3 –Total comprehensive (loss)/income for the year (217) 51Attributable to:Petrofac Limited shareholders (208) 58
Non-controlling interests 13 (9) (7)
(217) 51
Consolidated statement of other comprehensive incomeFor the year ended 31 December 2020
Petrofac Limited | 2020 Annual report and accounts132
Financial statements

Notes2020
US$m2019
US$m
AssetsNon-current assetsProperty, plant and equipment 12 288 398Goodwill 14 101 99Intangible assets 16 81 66Investments in associates and joint ventures 17 35 38Other financial assets 18 202 316Deferred consideration 11 55 61Deferred tax assets 8c 61 50
823 1,028Current assetsInventories 19 8 17Trade and other receivables 20 876 1,102Contract assets 21 1,652 2,064Related party receivables 32 1 1Other financial assets 18 148 135Income tax receivable 9 4Cash and short-term deposits 22 684 1,025
3,378 4,348Assets held for sale 15 – 600
3,378 4,948Total assets 4,201 5,976
Equity and liabilities EquityShare capital 23 7 7Share premium 23 4 4Capital redemption reserve 23 11 11Employee Benefit Trust shares 24 (88) (110)Other reserves 26 45 84Retained earnings 454 637Equity attributable to Petrofac Limited shareholders 433 633Non-controlling interests 13 7 281Total equity 440 914
Non-current liabilities Interest-bearing loans and borrowings 27 50 599Provisions 28 171 189Other financial liabilities 18 166 315Deferred tax liabilities 8c 38 37
425 1,140Current liabilitiesTrade and other payables 29 887 1,075Contract liabilities 21 120 273Interest-bearing loans and borrowings 27 750 411Other financial liabilities 18 179 166Income tax payable 191 231Accrued contract expenses 33 1,134 1,599Provisions 28 75 47
3,336 3,802Liabilities associated with assets held for sale 15 – 120
3,336 3,922Total liabilities 3,761 5,062Total equity and liabilities 4,201 5,976
The consolidated financial statements on pages 131 to 190 were approved by the Board of Directors on 20 April 2021 and signed on its behalf by Alastair Cochran – Chief Financial Officer.
Consolidated balance sheetAt 31 December 2020
Strateg
ic repo
rtG
overn
ance
Finan
cial statemen
ts
133Petrofac Limited | 2020 Annual report and accounts
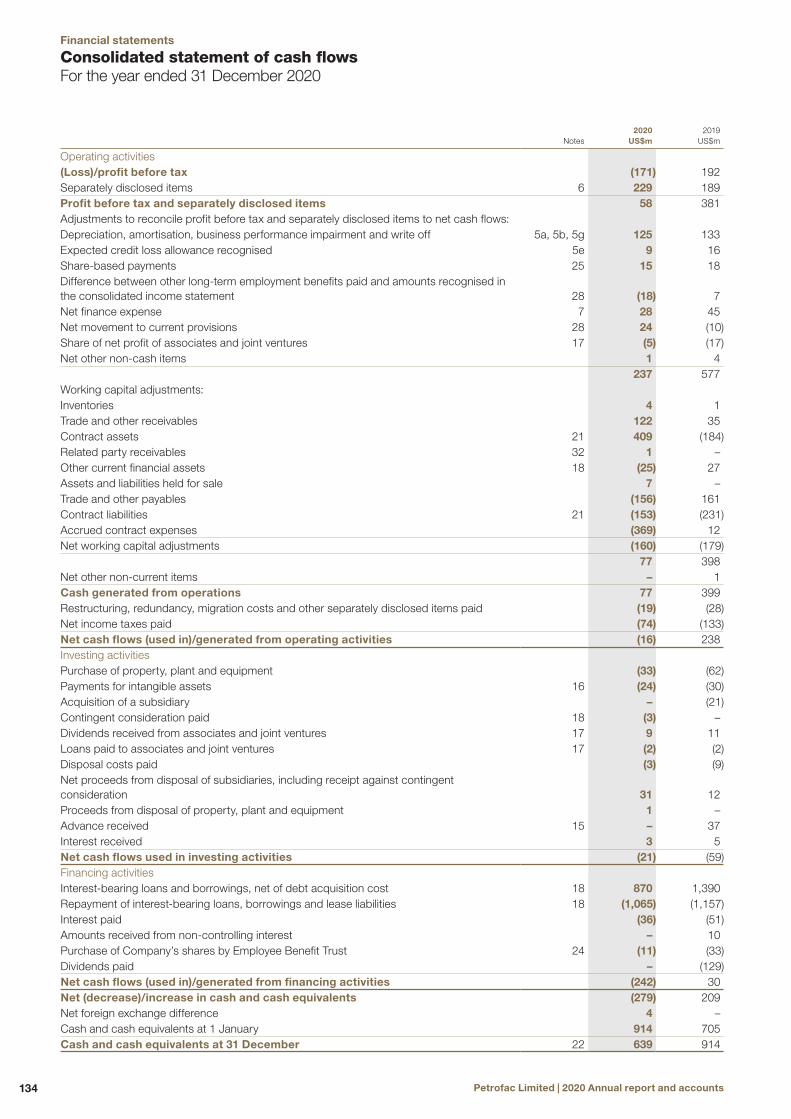
Notes2020
US$m2019
US$m
Operating activities (Loss)/profit before tax (171) 192Separately disclosed items 6 229 189Profit before tax and separately disclosed items 58 381Adjustments to reconcile profit before tax and separately disclosed items to net cash flows:Depreciation, amortisation, business performance impairment and write off 5a, 5b, 5g 125 133Expected credit loss allowance recognised 5e 9 16Share-based payments 25 15 18Difference between other long-term employment benefits paid and amounts recognised in the consolidated income statement 28 (18) 7Net finance expense 7 28 45Net movement to current provisions 28 24 (10)Share of net profit of associates and joint ventures 17 (5) (17)Net other non-cash items 1 4
237 577Working capital adjustments:Inventories 4 1Trade and other receivables 122 35Contract assets 21 409 (184)Related party receivables 32 1 –Other current financial assets 18 (25) 27Assets and liabilities held for sale 7 –Trade and other payables (156) 161Contract liabilities 21 (153) (231)Accrued contract expenses (369) 12Net working capital adjustments (160) (179)
77 398Net other non-current items – 1Cash generated from operations 77 399Restructuring, redundancy, migration costs and other separately disclosed items paid (19) (28)Net income taxes paid (74) (133)Net cash flows (used in)/generated from operating activities (16) 238Investing activitiesPurchase of property, plant and equipment (33) (62)Payments for intangible assets 16 (24) (30)Acquisition of a subsidiary – (21)Contingent consideration paid 18 (3) –Dividends received from associates and joint ventures 17 9 11Loans paid to associates and joint ventures 17 (2) (2)Disposal costs paid (3) (9)Net proceeds from disposal of subsidiaries, including receipt against contingent consideration 31 12Proceeds from disposal of property, plant and equipment 1 –Advance received 15 – 37Interest received 3 5Net cash flows used in investing activities (21) (59)Financing activitiesInterest-bearing loans and borrowings, net of debt acquisition cost 18 870 1,390Repayment of interest-bearing loans, borrowings and lease liabilities 18 (1,065) (1,157)Interest paid (36) (51)Amounts received from non-controlling interest – 10Purchase of Company’s shares by Employee Benefit Trust 24 (11) (33)Dividends paid – (129)Net cash flows (used in)/generated from financing activities (242) 30Net (decrease)/increase in cash and cash equivalents (279) 209Net foreign exchange difference 4 –Cash and cash equivalents at 1 January 914 705Cash and cash equivalents at 31 December 22 639 914
Consolidated statement of cash flowsFor the year ended 31 December 2020
Petrofac Limited | 2020 Annual report and accounts134
Financial statements

Attributable to Petrofac Limited shareholders
Issued share
capital US$m
Share premium
US$m
Capital redemption
reserve US$m
Employee Benefit Trust
shares (1)
US$m (note 24)
Other reserves
US$m (note 26)
Retained earnings
US$mTotal
US$m
Non- controlling
interests US$m
Total equityUS$m
Balance at 1 January 2020 7 4 11 (110) 84 637 633 281 914Reported net profit/(loss) – – – – – (180) (180) (9) (189)Other comprehensive loss – – – – (28) – (28) – (28)Total comprehensive loss/(income) – – – – (28) (180) (208) (9) (217)Purchase of Company’s shares by Employee Benefit Trust (note 24) – – – (11) – – (11) – (11)Issue of Company’s shares by Employee Benefit Trust (note 24) – – – 33 (30) (3) – – –Transfer to share-based payments reserve for Deferred Bonus Share Plan Invested Shares (note 25) – – – – 4 – 4 – 4Credit to equity for share-based payments charge (note 25) – – – – 15 – 15 – 15Disposal (note 15) – – – – – – – (265) (265)Balance at 31 December 2020 7 4 11 (88) 45 454 433 7 440
Attributable to Petrofac Limited shareholders
Issued share
capital US$m
Share premium
US$m
Capital redemption
reserve US$m
Employee Benefit Trust
shares (1)
US$m (note 24)
Other reserves
US$m (note 26)
Retained earnings
US$mTotal
US$m
Non- controlling
interests US$m
Total equity US$m
Balance at 1 January 2019 7 4 11 (107) 95 697 707 302 1,009Reported net profit/(loss) – – – – – 73 73 (7) 66Other comprehensive loss)/income – – – – (15) – (15) – (15)Total comprehensive (loss)/income – – – – (15) 73 58 (7) 51Purchase of Company’s shares by Employee Benefit Trust (note 24) – – – (33) – – (33) – (33)Issue of Company’s shares by Employee Benefit Trust (note 24) – – – 30 (26) (4) – – –Transfer to share-based payments reserve for Deferred Bonus Share Plan Invested Shares (note 25) – – – – 12 – 12 – 12Credit to equity for share-based payments charge (note 25) – – – – 18 – 18 – 18Dividends (note 10 and note 13) – – – – – (129) (129) (14) (143)Balance at 31 December 2019 7 4 11 (110) 84 637 633 281 914
Note: (1) Shares held by Petrofac Employee Benefit Trust.
Consolidated statement of changes in equityFor the year ended 31 December 2020
Strateg
ic repo
rtG
overn
ance
Finan
cial statemen
ts
135Petrofac Limited | 2020 Annual report and accounts

1 Corporate informationPetrofac Limited (the “Company”) is a limited liability company registered and domiciled in Jersey under the Companies (Jersey) Law 1991 and is the holding company for the international group of Petrofac subsidiaries. Petrofac Limited and its subsidiaries at 31 December 2020 comprised the Petrofac Group (the “Group”). Information on the Group’s subsidiaries, associates and joint arrangements is contained in note 35 to these consolidated financial statements. Information on the Group’s related party transactions is provided in note 32. The Group’s principal activity is the provision of services to the oil and gas production and processing industry.
The Company’s and the Group’s financial statements (the “consolidated financial statements”) for the year ended 31 December 2020 were authorised for issue in accordance with a resolution of the Board of Directors on 20 April 2021. The Company’s financial statements for the year ended 31 December 2020 are shown on pages 198 to 213.
2 Summary of significant accounting policies2.1 Basis of preparationThe consolidated financial statements have been prepared in accordance with International Financial Reporting Standards (“IFRS”) as issued by the International Accounting Standards Board (“IASB”) and applicable requirements of Jersey law.
The consolidated financial statements have been prepared on a historical cost basis, except for derivative financial instruments, financial assets measured at fair value through profit and loss, and deferred consideration that has been measured at fair value. The consolidated financial statements are presented in United States dollars and all values are rounded to the nearest million (“US$m”), unless otherwise stated.
2.2 Presentation of resultsThe Group uses Alternative Performance Measures (“APMs”) when assessing and discussing the Group’s financial performance, financial position and cash flows that are not defined or specified under IFRS. The Group uses these APMs, which are not considered to be a substitute for or superior to IFRS measures, to provide stakeholders with additional useful information by adjusting for separately disclosed items which impact upon IFRS measures or, by defining new measures, to aid the understanding of the Group’s financial performance, financial position and cash flows (refer to note 6 and Appendix A on page 191 for details).
2.3 Adoption of new financial reporting standards, amendments and interpretationsEffective new financial reporting standardsThe Group applied for the first-time certain amendments, which are effective for annual periods beginning on or after 1 January 2020. The Group has not early adopted any other standard, interpretation or amendment that has been issued but is not yet effective.
The following amendments apply for the first time in 2020, but do not have an impact on the consolidated financial statements of the Group:
— Amendments to IFRS 3: Definition of a Business — Amendments to IFRS 7, IFRS 9 and IAS 39: Interest Rate Benchmark Reform — Amendments to IAS 1 and IAS 8: Definition of Material
2.4 Financial reporting standards, amendments and interpretations issued but not yet effectiveCertain new financial reporting standards, amendments and interpretations have been published that are not mandatory for the 31 December 2020 reporting period and have not been early adopted by the Group. These new standards and interpretations are not expected to have a material impact on the Group in the current or future reporting periods and on foreseeable future transactions.
2.5 Going concernThe directors have performed a robust going concern assessment for the period to 30 April 2022. This included reviewing and challenging downside scenarios considered to be severe but plausible based on the principal risks and uncertainties, as set out on pages 62 to 67 of the Group’s annual report and accounts for the year ended 31 December 2020 to validate the continued application of the going concern basis of financial statements preparation.
The directors evaluated the Group’s funding position, liquidity and financial covenant profile to ensure it had ready access to liquidity and covenant headroom, sufficient for the Group to meet its obligations for at least 12 months from the date of signing the Group’s financial statements on 20 April 2021. The going concern assessment period is from 20 April 2021 to 30 April 2022 (the “Assessment Period”). Furthermore, and in accordance with the Financial Reporting Council’s guidance, the directors considered events or conditions that may cast significant doubt on the Group’s ability to continue as a going concern in the period beyond the Assessment Period. The directors concluded that the disclosures contained herein sufficiently address relevant events and conditions in both the Assessment Period and the period beyond. In evaluating whether the going concern assumption is appropriate, the directors performed the following procedures:
—reviewed the Group’s forecast cash flows, liquidity, covenant compliance and borrowing requirements over the Assessment Period. Cash flow and liquidity assumptions take into account the estimated potential impact of the COVID-19 pandemic and lower oil prices and are based on management’s best estimates, subject to estimation uncertainty, of future commodity prices, new order intake, project schedule, estimated cost to complete, commercial settlements, oil & gas production, capital expenditure and the Group’s borrowing facilities; — evaluated a range of severe but plausible downside scenarios to reflect uncertainties inherent in forecasting future operational and financial performance, including changes in geo-political or macro-economic environments. These include, but are not limited to, lower order intake, lower realised oil prices, cost overruns, adverse commercial settlements, and a deterioration in net working capital; — appraised the mitigation strategies available to management including, but not limited to, taking measures to: reduce costs, through further headcount, salary and third-party cost reductions; preserve cash, through working capital management and a reduction of uncommitted capital expenditure; and, generate cash through acceleration of disposal proceed receipts or additional non-core asset disposals. Under each scenario, mitigating actions are in the control of - or realistically available to – management; and, — performed a reverse stress test analysis to establish the impact on the Assessment Period of a remote downside scenario, which extended the severe but plausible downside scenario by assuming no new orders in the Assessment Period.
Notes to the consolidated financial statementsFor the year ended 31 December 2020
Petrofac Limited | 2020 Annual report and accounts136
Financial statements

The Group was able to maintain positive liquidity throughout the Assessment Period under the severe but plausible mitigated downside case. The risks that had the greatest aggregated negative impact on cash flow during the Assessment Period were:
— Lower new order intake: approximately 50% reduction in new order assumptions; — Contract cost overruns: approximately 60% reduction in Group net profit margin; — Commercial settlements: approximately 30% reduction of settlement proceeds; and, — Working capital: approximately 25% deterioration in cash flows generated from operations.
In addition, the directors also considered the impact of the UK Serious Fraud Office (the “SFO”) investigation in its going concern assessment. The Board has been advised by an independent specialist that a SFO fine could only become payable in the Assessment Period in the event that the Company was charged and entered a guilty plea. The Board would only consider doing so in circumstances where any such plea was supported by evidence, legal advice and any consequential financial penalty was affordable, did not constitute a material adverse change that triggered an event of default under its lending facilities, and did not threaten going concern. At the current time, no charges have been brought against any Group company, or any officers or current employees.
Lastly, the directors also considered the following factors in its going concern assessment:
— the Group retains sufficient liquidity to support operations, and settle debt as it matures, throughout the Assessment Period in the mitigated severe but plausible downside scenario. — the Group retains `covenant compliance throughout the Assessment Period in the mitigated severe but plausible downside scenario. — the Group remains liquid in the remote downside scenario of securing no new orders in the Assessment Period, as demonstrated in the unmitigated reverse stress test. — the Group has a proven track record of taking timely actions to effectively mitigate downside risks, including cutting costs, conserving cash and divesting assets. — the Group is well placed to benefit from the improved macro-economic outlook driven in part by the recovery in oil price driven by global vaccine roll out programmes which is expected to result in an increased demand by the global energy industry for the Group’s services. — at 31 December 2020, the Group had cash and short term deposits of US$684m and net debt of US$116m. Furthermore, following the downgrade and withdrawal of S&P’s rating in April 2021, the Group retains an investment grade credit rating of BBB- (negative outlook) from Fitch. A downgrade would not trigger an event of default under our existing loans.
The directors concluded, after rigorously evaluating relevant, available information, that there are no events or conditions that may cast significant doubt upon the Group’s ability to continue as a going concern during the Assessment Period that require disclosure in the Group’s financial statements for the period ended 31 December 2020.
The directors also evaluated potential events and conditions during the period beyond the Assessment Period that may cast significant doubt on the going concern assessment, specifically, the ability of the Group to secure – or extend existing facilities by – at least US$235m by June 2022, when the current revolving credit facility (the “RCF”) matures. This amount is based on current forecasts and is the minimum amount that will allow the Group to maintain positive liquidity in the mitigated severe but plausible downside case, and to meet its liabilities as they fall due. The actual amount raised may differ, reflecting the Group’s liquidity requirements at that time and a liquidity buffer to support operations. The ability to refinance was specifically considered against a backdrop of challenging but improving market conditions; the continued negative impact of the SFO investigation; and, the current bidding suspension from certain core markets. The directors received advice from independent specialists that confirmed their refinancing assumption, of at least US$235m, to be a realistic prospect. Given the inherent forecasting uncertainties, the ability to refinance as described is a significant judgement (see section 2.7 page 139) made by the directors which was informed by the following underlying assumptions:
— the expected range of funding options available to the Group in a range of different liquidity funding scenarios. — the Group’s financing track record, with over US$1.7 billion of committed facilities having been refinanced or extended in the last three years during challenging market conditions and the SFO Investigation. — the recent US$700m refinancing of its principal bank facilities evidences the continued support of its lenders. This refinancing was completed with the unanimous support of all its lenders in a short period of time. — The RCF facility includes a six-month extension option of up to US$550m, subject to consent by the lenders. Each lender’s consent is independent and not all lenders are required to extend. — Indications of support from existing capital providers. — The Group is expected to remain fully compliant with its covenant requirements throughout the period immediately beyond the Assessment Period.
Notwithstanding the uncertainties noted above, the directors do not believe that the refinancing is an event that casts significant doubt upon the Group’s ability to continue as a going concern. that would require additional disclosure, in accordance with the requirements of paragraph 25 of IAS 1 ‘Presentation of Financial Statements’.
Based on this comprehensive assessment, the directors concluded that the continued use of the going concern basis of accounting in preparing the Group’s financial statements for the period ended 31 December 2020 remained appropriate.
2.6 Basis of consolidationThe consolidated financial statements comprise the financial statements of Petrofac Limited (the “Company”) and entities controlled by the Company (its subsidiaries) as at 31 December 2020. Control is achieved when the Group is exposed, or has rights, to variable returns from its involvement with the investee and has the ability to affect those returns through its power over the investee.
Strateg
ic repo
rtG
overn
ance
Finan
cial statemen
ts
137Petrofac Limited | 2020 Annual report and accounts

Notes to the consolidated financial statements continuedFor the year ended 31 December 2020
2 Summary of significant accounting policies continuedGenerally, there is a presumption that a voting rights majority results in control. Net profit or loss and each component of other comprehensive income (“OCI”) are attributed to Petrofac Limited shareholders and to non-controlling interests, even if this results in the non-controlling interests having a deficit balance. When necessary, adjustments are made to the financial statements of subsidiaries to align their accounting policies with the Group’s accounting policies.
All intra-group transactions, balances, income and expenses are eliminated on consolidation.
A change in the ownership interest of a subsidiary, without a loss of control, is accounted for as an equity transaction.
If the Group ceases to control a subsidiary, it derecognises the related assets (including goodwill), liabilities, non-controlling interest and other components of equity while any resultant gain or loss is recognised in the consolidated income statement. Any investment retained is recognised at fair value.
Business combinations and goodwillBusiness combinations are accounted for using the acquisition method. The cost of an acquisition is measured as the aggregate of the consideration transferred, which is measured at acquisition date fair value, and the amount of any non-controlling interests in the acquiree. For each business combination, the Group elects whether to measure the non-controlling interests in the acquiree at fair value or at the proportionate share of the acquiree’s identifiable net assets. All transaction costs associated with business combinations are charged to the consolidated income statement in the reporting period of such combination.
Any contingent consideration to be transferred by the Group will be recognised at fair value at the acquisition date. Contingent consideration classified as equity is not remeasured and its subsequent settlement is accounted for within equity. Contingent consideration, classified as a liability that is a financial instrument and within the scope of IFRS 9 ‘Financial Instruments’, is measured at fair value with the changes in fair value recognised in the consolidated income statement in accordance with IFRS 9.
Goodwill is initially measured at cost, being the excess of the aggregate consideration transferred and the fair value of the net assets acquired together with the amount recognised for non-controlling interests, and any previous interest held.
Following initial recognition, goodwill is measured at cost less any accumulated impairment losses. Goodwill is reviewed for impairment annually or more frequently if events or changes in circumstances indicate that the carrying amount may be impaired.
For the purpose of impairment testing, goodwill is allocated to the cash-generating units that are expected to benefit from the synergies of the combination.
Impairment is determined by assessing the recoverable amount of the cash-generating units to which the goodwill relates.
Investment in associates and joint venturesAn associate is an entity over which the Group has significant influence. Significant influence is the power to participate in the financial and operating policy decisions of the investee but is not control or joint control over those policies.
The considerations made in determining significant influence or joint control are similar to those considerations applied to determine control over subsidiaries.
Associates and joint venturesThe Group’s investments in its associates and joint ventures are accounted for using the equity method.
The consolidated income statement reflects the Group’s share of the net profits of the associate or joint venture.
Any unrealised gains and losses resulting from transactions between the Group and associates and joint ventures are eliminated to the extent of the Group’s ownership interest in these associates and joint ventures.
The financial statements of the associates and joint ventures are prepared for the same reporting period as the Group. When necessary, adjustments are made to align the accounting policies with those of the Group.
At the end of each reporting period, the Group determines whether there is objective evidence that its investment in its associates or joint ventures are impaired. If there is such evidence, the Group estimates the amount of any impairment as the difference between the recoverable amount of the associate or joint venture and its carrying amount and recognises this impairment loss in the consolidated income statement.
Joint operationsThe Group’s interests in joint operations are recognised in relation to its interest in a joint operation’s:
— Assets, including its share of any assets held jointly — Liabilities, including its share of any liabilities incurred jointly — Revenue from the sale of its share of the output arising from the joint operation — Share of the revenue from the sale of the output by the joint operation — Expenses, including its share of any expenses incurred jointly
For joint operations, the Group’s share of revenue earned and expenses incurred are recognised in the consolidated income statement. Assets controlled and liabilities incurred by the Group are recognised in the consolidated balance sheet.
Foreign currency translationThe consolidated financial statements are presented in United States dollars (“US$m”), which is also the Company’s functional currency.
Each entity in the Group determines its own functional currency and items included in the financial statements of each entity are measured using that functional currency. Functional currency is defined as the currency of the primary economic environment in which the entity operates. The Group uses the direct method of consolidation and on disposal of a foreign operation, the gain or loss that is reclassified to net profit or loss reflects the amount that arises from using this method.
Transactions and balancesTransactions in foreign currencies are initially recorded by the Group’s entities at their respective functional currency spot rates at the date the transaction first qualifies for recognition.
Monetary assets and liabilities denominated in foreign currencies are translated at the functional currency spot rates of exchange at the reporting date.
Petrofac Limited | 2020 Annual report and accounts138
Financial statements

Differences arising on the settlement or translation of monetary items are recognised in other operating income or other operating expenses line items, as appropriate, of the consolidated income statement.
Non-monetary items that are measured at historical cost in a foreign currency are translated using the exchange rates at the dates of the initial transactions.
Group subsidiariesOn consolidation, the assets and liabilities of subsidiaries with non-United States dollars functional currencies are translated into United States dollars at the rate of exchange prevailing at the reporting date and their income statements are translated at monthly average rates. The exchange differences arising on translation for consolidation are recognised in the consolidated statement of other comprehensive income. On disposal of a subsidiary with non-United States dollars functional currency, the component of the consolidated statement of other comprehensive income relating to currency translation is recognised in the consolidated income statement.
2.7 Significant accounting judgements and estimatesThe preparation of the consolidated financial statements requires management to make judgements and estimates that affect the reported amounts of revenues, expenses, assets and liabilities, and the accompanying disclosures.
JudgementsIn the process of applying the Group’s accounting policies, management has made the following judgements, apart from those involving estimations (see below), which have the most significant effect on the amounts recognised in the consolidated financial statements:
Significant judgements associated with revenue recognition — Revenue recognition on fixed-price engineering, procurement and construction contracts: the Group measures progress and recognises revenue on fixed-price engineering, procurement and construction contracts using the input method, based on the actual cost of work performed at the end of the reporting period as a percentage of the estimated total contract costs at completion. The Group considers the input method to faithfully depict the Group’s performance in transferring control of goods and services to the customer and provides meaningful information in respect of progress towards the satisfaction of performance obligations on its contracts. — In the early stages of contract completion, the outcome of a contract generally cannot be estimated reliably. The Group has established a threshold where contract revenues are recognised only to the extent of costs incurred to reflect this uncertainty. This threshold has been applied by the Group using a rebuttable presumption that contracts below 15% completion cannot yet be estimated reliably, however judgement may be applied to deviate from this threshold dependent upon an objective evaluation of operational and contractual risks, e.g. taking into account contract value, duration, geography, complexities involved in the execution of the contract, past experience with the customer and risk mitigations — Management applies certain judgements associated with recognition and non-recognition of variable consideration, e.g. assessed variation orders and liquidated damages. The factors considered when determining whether to recognise variable consideration, together with the associated estimation uncertainty, are discussed below under section ‘Estimation uncertainty’
— Revenue recognition on joint arrangement contracts: the Group recognises its share of revenue and profit from contracts executed as part of a consortium in accordance with the agreed consortium contractual arrangement. In selecting the appropriate accounting treatment, the main consideration is the determination of whether the joint arrangement is a joint operation or joint venture (though not directly related to revenue recognition, this judgement has a material impact on presentation in the consolidated income statement) in accordance with IFRS 11 ‘Joint Arrangements’
Significant judgements associated with contingent liabilities and provisionsManagement applies significant judgements in determining whether it has a present or a possible obligation to disclose a contingent liability or a probable obligation to recognise a provision in the consolidated financial statements. Management, in certain instances, takes into consideration legal advice from its legal counsel and external legal advisors as well as independent specialist advice, to determine the probability of an outflow of resources embodying economic benefits that will be required to settle the obligation, if determined. Typically, the contingent liabilities include pending legal and tax cases with regulatory authorities and/or third parties, see note 31.
Significant judgements associated with classifying assets held for sale and presenting discontinued operationsNon-current assets or disposal groups are classified as held for sale when the management believes that it is highly probable that the carrying amount of the asset will be recovered principally through a sale transaction rather than through continuing use and the non-current assets or disposal group are available for immediate sale in their present condition. There is also judgement required to determine whether a disposal meets the criteria to be presented as a discontinued operation, in particular whether it represents a separate major line of business or geographic area of operation. On 19 September 2019, the Group signed a Sale and Purchase Agreement (“SPA”) with Perenco (Oil and Gas) International Limited (“Perenco”) to dispose of the remaining 51% ownership interest relating to the Group’s operations in Mexico and later on 3 November 2020 it completed the disposal transaction. The business performance net loss attributable to Petrofac Limited shareholders associated with the Group’s operations in Mexico of US$3m represented 5% of the Group’s business performance net profit attributable to Petrofac Limited shareholders. This was not considered material by management and accordingly the disposal was not presented as a discontinued operation.
Significant judgements associated with the preparation of the parent and consolidated financial statements on a going concern basisManagement is required to make a decision whether to prepare the parent and consolidated financial statements on a going concern basis, for details see note 2.5 on pages 136 and 137.
Strateg
ic repo
rtG
overn
ance
Finan
cial statemen
ts
139Petrofac Limited | 2020 Annual report and accounts

2 Summary of significant accounting policies continuedEstimation uncertainty, including impact of COVID-19 pandemic and sharp fall in oil pricesThe outbreak of the COVID-19 pandemic and the associated economic slowdown could have an impact on Group’s financial performance, financial position, cash flows and prospects as a result of a sharp fall in oil prices and lower demand for oil and gas services in the next twelve months. The key assumptions concerning the future and other key sources of estimation uncertainty at the end of the reporting period that have a significant risk of causing a material adjustment to the carrying amounts of assets and liabilities within the next reporting period are discussed below:
Fixed-price engineering, procurement and construction contracts
— Recognition of assessed variation orders pending customer approval (“AVOs”): an AVO is a management estimated right of payment due from the customer resulting for a customer instructed change in the contractual scope of work or for the reimbursement of costs not included in the contract price. The Group recognises revenues and profit from AVOs using the expected value approach to assess/re-assess AVOs at contract inception and at each reporting date where it is considered highly probable that a significant reversal in the amount of cumulative revenue recognised will not occur when the uncertainty associated with the AVO is subsequently resolved. In performing the assessment, management considers the likelihood of such settlement being made by reference to the contract, independent specialist advice, customer communications, past experience with the customer and other forms of documentary evidence. At 31 December 2020, AVOs of US$305m were recognised in the consolidated balance sheet, of which US$276m (2019: US$341m) was included within the contract assets; and US$29m (2019: US$nil) was included as an offset against contract liabilities, see note 21. To the extent assessed variation orders pending customer approval are reflected in the transaction price are not resolved in the Group’s favour, there could be reductions in, or reversals of, previously recognised revenue. The Group did not recognise any significant assessed variation order associated with additional costs resulting from the COVID-19 pandemic induced project delays, due to the uncertainty associated with the recoverability of such amounts. —Liquidated damages (“LDs”): LDs are contractual penalties applied by the customer, normally relating to failure of the contractor to meet agreed performance and progress outcomes. The Group estimates the application of LDs at contract inception using the expected value approach and recognises an associated amount as a reduction to contract revenue. The Group assesses/re-assesses its exposure to LD application at each reporting date, where the customer has the contractual right to apply LDs and where it is highly probable that a significant reversal in the amount of cumulative revenue recognised will not occur when the uncertainty associated with the LD is subsequently resolved. This requires a deterministic probability assessment of the monetary amount of LDs liable, which involves a number of management judgements and estimates (e.g. contractual position with the customer, negotiations with the customer specifically relating to extension of time (“EoT”), past experience with the customer, etc.), regarding the amounts to recognise in contract accounting. During 2020, liquidated damages amounting to US$8m were reversed as an increase to the estimate at completion revenue that resulted in an increase of US$7m to the Group’s revenue recognised during the year through the application of contract progress (2019: US$10m of liquidated damages were recognised
as a decrease to the estimate at completion revenue that resulted in a decrease of US$10m to the Group’s revenue). No liquidated damages, resulting from progress delays associated with the COVID-19 pandemic, for Group’s fixed-price EPC contracts, were recognised, since management judged these to be excusable delays in accordance with the terms and conditions of the contracts with customers. Any unfavourable outcome compared to management’s current expectation may affect the revenue to be recognised in future periods and consequently would impact the financial performance and cash flows for future periods. This estimate will impact revenues and contract assets or contract liabilities. — Estimate at completion contract costs: at the end of the reporting period the Group is required to estimate costs at completion on fixed-price EPC contracts, based on the work to be performed beyond the reporting period. This involves an objective evaluation of project progress against the delivery schedule, evaluation of work to be performed and the associated risks and costs to fully deliver the contract to the customer. Estimating contract cost at completion also involves recognising an onerous contract provision in accordance with IAS 37 ‘Provisions, Contingent Liabilities and Contingent Assets’ for future losses on contracts where it is considered probable that contract costs are likely to exceed revenues at contract completion. The COVID-19 pandemic resulted in lock down measures being applied by governments, in various jurisdictions in which the Group operates. These lock down measures predominantly impacted procurement and construction activities on the Group’s fixed-price EPC contracts, which resulted in lower than expected progress at the end of the reporting period. The continued prevalence of the COVID-19 pandemic presents an uncertainty that may involve additional costs to be incurred, and consequently would impact financial performance and cash flows for future periods. At 31 December 2020, the estimate at completion contract costs represented managements best estimate of contract costs, including where applicable costs associated with COVID-19 pandemic induced delays. In addition, cost reduction measures taken by the Group in response to COVID-19 pandemic were also included in the estimate at completion contract costs. The continued prevalence of COVID-19 pandemic may result in additional estimate at completion contract costs and consequently could negatively impact financial performance and cash flows for future periods. This estimate will impact revenues, cost of sales, contract assets and contract liabilities. The carrying amount of onerous contract provisions at 31 December 2020 was US$38m (2019: US$6m); see note 28
Income tax and deferred tax — Income tax: Group entities are routinely subject to tax audits and assessments, including processes whereby tax return filings are discussed and agreed with the relevant tax authorities. Whilst the ultimate outcome of such tax audits and discussions cannot be determined with certainty, management estimates the uncertain tax treatments for jurisdictions where there is a probable future outflow, based on the applicable law and regulations, historic outcomes of similar audits and discussions, independent specialist advice and consideration of the progress on, and nature of, current discussions with the tax authority concerned. Where management determines that a greater than 50% probability exists that the tax authorities would accept the position taken in the tax return, amounts are recognised in the consolidated financial statements on that basis. Where the amount of tax payable or recoverable is
Notes to the consolidated financial statements continuedFor the year ended 31 December 2020
Petrofac Limited | 2020 Annual report and accounts140
Financial statements
uncertain, the Group recognises a liability or asset based on either: management’s judgement of the most likely outcome; or, when there is a wide range of possible outcomes, a probability weighted average approach. The ultimate outcome following resolution of such audits and assessments may be materially higher or lower than the amounts recognised. The Group’s subsidiaries’ tax filings in different jurisdictions include deductions related to intercompany recharges and the taxation authorities may challenge those tax treatments. The Group determined, based on its tax compliance and transfer pricing studies, that it is probable that its tax treatments (including those for the subsidiaries) will be accepted by taxation authorities. The carrying amount of uncertain tax treatments (“UTTs”), recognised within income tax payable line item of the consolidated balance sheet at 31 December 2020, was US$131m (2019: US$139m) — Deferred tax assets: the Group recognises deferred tax assets on all applicable temporary differences where it is probable that the tax assets estimated are realised and future taxable profits will be available for utilisation. This requires management to make estimates concerning future taxable profits and the recoverability of recognised deferred tax asset balances. The carrying amount of deferred tax assets at 31 December 2020 was US$61m (2019: US$50m)
Contingent and deferred consideration measured at fair value through profit or loss
— Fair value of contingent consideration amounts receivable (“contingent consideration”) arising from the disposal of Group’s operations in Mexico (note 15) in November 2020: the Group completed the disposal of its remaining 51% ownership interest in Petrofac Netherlands Holdings B.V. which owned the Group’s operations in Mexico (“PNHBV”) to Perenco Energies International Limited (“Perenco”). This transaction completed the Integrated Energy Services operating segment’s disposal of its operations in Mexico. The carrying amount of contingent consideration receivable from Perenco associated with the 100% disposal of the Group’s ownership interest at 31 December 2020 was US$41m (2019: US$42m associated with initial 49% disposal). Management considers there to be significant estimation uncertainty inherent in determining the fair value of this contingent consideration recognised in the consolidated balance sheet. The sources of estimation uncertainty pertained to: (i) the final determination of the completion consideration amount; (ii) proceeds associated with a ruling by the Tax Administration Service in Mexico; and (iii) the achieving the contingent consideration criteria in the sales and purchase agreement (“SPA”) associated with the migration of the Magallanes and Arenque Production Enhancement Contracts to Production Sharing Contracts. Management applied risk factors (a Level 3 measurement of the ‘fair value hierarchy’ contained within IFRS 13 ‘Fair Value Measurement’) to the maximum contingent consideration amounts receivable to account for this uncertainty in determining the fair value of the contingent consideration. Determining these risk factors required significant judgements and assumptions concerning the outcome of future events and negotiations. These matters constituted a significant accounting estimate by management to determine the fair value of the contingent consideration at 31 December 2020. A fair value gain or loss will be recognised in the consolidated income statement, in the next reporting period or in the longer term, if the outcome of the uncertain future events are more or less favourable, respectively, than the current estimate (see note 15).
— Block PM304 oil and gas asset in Malaysia had a recoverable amount of US$116m (2019: US$150m). The recoverable amount, which was based on fair value less cost of disposal, was lower than the asset’s carrying amount, resulting in a post-tax impairment charge of US$64m (2019: US$86m) in the period (note 6). The Group’s fair value less cost of disposal estimate includes an assessment of future field performance, the likelihood of a license extension beyond 2026 and future oil price assumptions — Recoverable amount of deferred consideration relating to disposal of JSD6000 installation vessel (the “vessel”): the deferred consideration relating to disposal of the vessel, representing a contractual right to the Group, was recognised as a non-current asset in the consolidated balance sheet. The deferred consideration was initially measured and recognised at fair value and will be subsequently measured at fair value through profit or loss. The fair value of the deferred consideration, with management’s current involvement and recent discussions with the Group’s partner in the construction of the vessel, is based on the assumption that the Group’s partner has the continued intent and the required capabilities to complete the construction and commissioning of the vessel within the due timeframe. The recoverable amount is also subject to change based on changes in the market value of similar specification deep-water vessels. At the end of each reporting period, management reviews its estimate to assess the ability of the Group’s partner to complete the construction and commissioning of the vessel and under such circumstances that may impair the Group’s partner’s ability to complete these activities, a fair value loss would be recognised in the consolidated income statement, in the next reporting period or in the longer-term. Due to the forecast reduced demand for oil and gas services and sharp fall in oil and gas prices, that could be associated with the ongoing COVID-19 pandemic, management reviewed the carrying amount of the deferred consideration associated with the disposal of the vessel and consequently recognised a downward fair value adjustment of US$6m (post-tax US$6m) as a separately disclosed item in the Engineering & Construction operating segment (2019: US$nil). A further 10% decrease in the valuation of the vessel would result in an additional negative fair value change of US$6m. The continued impact of the COVID-19 pandemic on global demand for oil and gas could have an adverse impact on the fair valuation of the vessel, that may result in additional negative fair value changes recognised in the consolidated income statement in future periods.
2.8 Significant accounting policiesRevenue from contracts with customersThe Group’s principal activity is the provision of services to the oil and gas production and processing industry. Revenue from contracts with customers is recognised when control of the goods or services are transferred to the customer at an amount that reflects the consideration to which the Group expects to be entitled in exchange for those goods or services. The Group has generally concluded that it is the principal in its revenue arrangements, because it typically controls the goods or services before transferring them to the customer.
Strateg
ic repo
rtG
overn
ance
Finan
cial statemen
ts
141Petrofac Limited | 2020 Annual report and accounts

2 Summary of significant accounting policies continuedThe Group provides warranties to customers with assurance that the related product will function as the parties intended because it complies with agreed-upon specifications. The Group does not provide warranties as a service, in addition to the assurance that the product complies with agreed-upon specifications, in its contracts with customers. As such, the Group concluded that such warranties are assurance-type warranties which will continue to be accounted for under IAS 37 ‘Provisions, Contingent Liabilities and Contingent Assets’.
Engineering & Construction (E&C)The Group provides fixed-price engineering, procurement and construction project execution services and reimbursable engineering, procurement and construction management services to the onshore and offshore oil and gas industry. Revenue is measured based on the consideration specified in a contract with a customer. The Group recognises revenue when or as it transfers control over a good or service to a customer.
The services provided under the fixed-price engineering, procurement and construction contract are satisfied over time rather than at a point in time, since the customer controls the works covered by the contract at the point when it is being built; the construction activity creates an asset that does not presuppose an alternative use to what it was designed for and the Group is entitled to collect payment for services while construction is underway and the customer simultaneously receives and consumes the benefits provided by the Group.
For fixed-price engineering, procurement and construction contracts, the Group measures progress and recognises revenue using the input method. This method is based on the actual cost of work performed, as a percentage of the estimate at completion cost at the end of the reporting period, once the outcome of a contract can be estimated reliably.
Fixed-price engineering, procurement and construction contracts contain distinct goods and services, but these are not distinct in the context of the contract and are therefore combined into a single performance obligation. At contract inception the management generally considers the following factors to determine whether the contract contains a single performance obligation or multiple performance obligations:
— It provides a significant service of integrating the goods or services with other goods or services promised in the contract into a bundle of goods or services that represent the combined output or outputs for which the customer has contracted — One or more of the goods or services significantly modifies or customises, or are significantly modified or customised by, one or more of the other goods or services promised in the contract — The goods or services are highly interdependent or highly interrelated
Contract modifications are generally not distinct from the existing contracts due to the significant integration service provided in the context of the contract and are accounted for as a modification of the existing contract and performance obligation, with a cumulative catch-up adjustment to revenue.
Variable consideration, e.g. variation orders (including those pending customer approval), liquidated damages and incentive payments are assessed/re-assessed using:
— the expected value approach (i.e. the sum of probability-weighted amounts in a range of possible consideration amounts); or — most likely amount method (i.e. the single most likely outcome of the contract, the most likely amount may be an appropriate estimate of the amount of variable consideration if the contract has only two possible outcomes for example the Group either achieves a performance bonus or does not)
as appropriate, at contract inception and at the end of each reporting period where it is considered highly probable that a significant reversal in the amount of cumulative revenue recognised will not occur when the uncertainty associated with the variable consideration is subsequently resolved.
In performing the assessment, management considers the likelihood of such settlement being made by reference to the contract, anticipated performance on the contract, independent specialist opinions, customer communications, past experience with the customer and other forms of documentary evidence.
Revenues from cost-plus-fee contracts and reimbursable contracts are recognised using the input method for measuring progress towards complete satisfaction of the performance obligation.
An onerous contract provision is recognised where the unavoidable costs of meeting the obligations under the contract exceed the economic benefits expected to be received under it.
Advance payments received from customers for fixed-price engineering, procurement and construction contracts are structured primarily for reasons other than the provision of finance to the Group (e.g. mobilisation costs), and they do not provide customers with an alternative to pay in arrears. In addition, the length of time between when the customer settles the amount to which the Group has an unconditional right to payment and the Group transfers goods and services to the customer is relatively short. Therefore, the Group has concluded that there is not a significant financing component within such contracts. Currently, the Group does not have any contracts where payments by a customer are over several years after the Group has transferred goods and services to the customer.
Engineering & Production Services (EPS)The Group’s contracts with customers for the provision of reimbursable engineering and production services include distinct performance obligations based on the assessment that the service is capable of being distinct both individually and within the context of the contract. The services are satisfied over time given that the customer simultaneously receives and consumes the benefits provided by the Group, using the input method for measuring progress towards complete satisfaction of the performance obligation.
Notes to the consolidated financial statements continuedFor the year ended 31 December 2020
Petrofac Limited | 2020 Annual report and accounts142
Financial statements
Variable consideration, e.g. incentive payments and performance bonuses, will be estimated at contract inception and at the end of each reporting period using the most likely amount approach, where the outcome is expected to be binary and where it is considered highly probable that a significant reversal in the amount of cumulative revenue recognised will not occur when the uncertainty associated with the variable consideration is subsequently resolved.
Revenues from fixed-price contracts are recognised using the input method, measured by milestones completed or earned value once the outcome of a contract can be estimated reliably. In the early stages of contract completion, when the outcome of a contract cannot be estimated reliably, contract revenues are recognised only to the extent of costs incurred that are expected to be recoverable.
The Group does not generally receive advances from customers for its reimbursable engineering and production services contracts.
Integrated Energy Services (IES) Equity Upstream InvestmentsOil and gas revenues comprise the Group’s share of sales from the sale of hydrocarbons from the Group’s Equity Upstream Investments, when control has been passed to the buyer, i.e. the last outlet flange of the loading facility from where the goods are exported to the customer.
Property, plant and equipmentProperty, plant and equipment is measured at cost less accumulated depreciation and accumulated impairment charges. Cost comprises the purchase price or construction cost and any costs directly attributable to making that asset capable of operating as intended. The purchase price or construction cost is the aggregate amount paid and the fair value of any other consideration given to acquire the asset. Depreciation is provided on a straight-line basis, other than on oil and gas assets.
Oil and gas assets on a field-by-field basis (see below)Oil and gas facilities 8 to 10 years (or lease term if shorter)Plant and equipment
3 to 25 years (or lease term if shorter)
Buildings and leasehold improvements
3 to 20 years (or lease term if shorter)
Office furniture and equipment
2 to 4 years (or lease term if shorter)
Vehicles 3 to 5 years (or lease term if shorter)
Oil and gas assets are depreciated, on a field-by-field basis, using the unit-of-production method based on entitlement to proven and probable reserves, taking account of estimated future development expenditure relating to those reserves.
Each asset’s estimated useful life, residual value and method of depreciation are reviewed and adjusted if appropriate at the end of the reporting period. No depreciation is charged on land or assets under construction.
The carrying amount of an item of property, plant and equipment is derecognised on disposal or when no future economic benefits are expected from its use with any gain or loss included in the other operating income line item in the consolidated income statement when the asset is derecognised.
In accordance with IFRS 16 ‘Leases’, the Group has elected to present the right-of-use assets within the property, plant and equipment line item of the consolidated balance sheet, at the commencement date of the lease (i.e. the date at which the underlying asset is available for use). The right-of-use assets are presented within the same asset category as that within which the underlying assets would be presented if they were owned. The disaggregated information for right-of-use assets presented within property, plant and equipment line item of the consolidated balance sheet is disclosed in note 12.
LeasesThe Group assesses at contract inception whether a contract is, or contains, a lease. That is, if the contract conveys the right to control the use of an identified asset for a period of time in exchange for consideration.
Right-of-use assetsThe Group recognises right-of-use assets, within the property, plant and equipment line item of the consolidated balance sheet, at the commencement date of the lease (i.e. the date at which the underlying asset is available for use). Right-of-use assets are measured at cost, less any accumulated depreciation and impairment losses, and adjusted for any remeasurement of lease liabilities. The cost of right-of-use assets includes the amount of lease liabilities recognised, initial direct costs incurred, and lease payments made at or before the commencement date less any lease incentives received.
Right-of-use assets are depreciated on a straight-line basis over the shorter of the lease term and the estimated useful lives of the assets.
Right-of-use assets are subject to the same impairment requirements as those applicable to property, plant and equipment, see accounting policies associated with impairment of non-current assets on page 144.
Lease liabilitiesAt the commencement date of the lease, the Group recognises lease liabilities measured at the present value of lease payments to be made over the lease term. The lease payments include fixed payments less any lease incentives receivable, variable lease payments that depend on an index or a rate, and amounts expected to be paid under residual value guarantees. The lease payments also include the exercise price of a purchase option reasonably certain to be exercised by the Group and payments of penalties for terminating a lease, if the lease term reflects the Group exercising the option to terminate.
In calculating the present value of lease payments, if the interest rate implicit in the lease is not readily determinable, the Group uses the incremental borrowing rate, defined as the rate of interest that a lessee would have to pay to borrow over a similar term, and with a similar security, the funds necessary to obtain an asset of a similar value to the right-of-use asset in a similar economic environment, at the lease commencement date.
After the commencement date, the amount of lease liabilities is increased to reflect the accretion of interest and reduced for the lease payments made. In addition, the carrying amount of lease liabilities is remeasured if there is a modification, a change in the lease term, a change in the in-substance fixed lease payments or a change in the assessment to purchase the underlying asset.
The Group’s lease liabilities are included in other financial liabilities line items of the consolidated balance sheet, see note 18.
Strateg
ic repo
rtG
overn
ance
Finan
cial statemen
ts
143Petrofac Limited | 2020 Annual report and accounts

2 Summary of significant accounting policies continuedShort-term leases and leases of low-value assetsThe Group applies the short-term lease recognition exemption to its leases of property, plant and equipment (that have a lease term of 12 months or less). It also applies the lease of low-value assets recognition exemption to leases of property, plant and equipment that are considered of low value (i.e. below US$5,000). Lease payments on short-term leases and leases of low-value assets are recognised as an expense on a straight-line basis over the lease term in cost of sales or selling, general and administration expenses line items of the consolidated income statement.
If the lease contract is cancellable by both lessee and lessor with no or insignificant penalty then the lease contract is considered to be cancellable and recognised as a short-term lease; refer to note 30 for amounts recognised in the consolidated income statement associated with the short-term and low-value asset leases.
The Group makes certain judgements in determining the lease term for contracts that is or contains a lease:
— The Group determines the lease term as the non-cancellable term of the lease, together with any periods covered by an option to extend the lease if it is reasonably certain to be exercised, or any periods covered by an option to terminate the lease, if it is reasonably certain not to be exercised — The Group has the option to renew the lease term for some of its leases. The Group applies judgement in evaluating whether it is reasonably certain to exercise the option to renew. That is, it considers all relevant factors that create an economic incentive for it to exercise the renewal. After the commencement date, the Group reassesses the lease term if there is a significant event or change in circumstances that is within its control and affects its ability to exercise (or not to exercise) the option to renew (e.g. a change in business strategy) — The determination of whether an arrangement is or contains a lease is based on the substance of the arrangement at the inception date and whether the fulfilment of the arrangement is dependent on the use of a specific asset or assets or the arrangement conveys the right to use the asset
Oil and gas intangible assetsEvaluation expendituresExpenditure directly associated with evaluation (or appraisal) activities is capitalised as an intangible oil and gas asset. Such costs include the costs of acquiring an interest, appraisal well drilling costs, payments to contractors and an appropriate share of directly attributable overheads incurred during the evaluation phase. For such appraisal activity, which may require drilling of further wells, costs continue to be recognised as an asset whilst related hydrocarbons are considered capable of commercial development. Such costs are subject to technical, commercial and management review to confirm the continued intent to develop, or otherwise extract value. When this is no longer the case, an impairment of the costs capitalised as an intangible is recognised in the consolidated income statement. When such assets are declared part of a commercial development, related costs are transferred to property, plant and equipment. All intangible oil and gas assets are assessed for any impairment prior to transfer and any impairment charge is recognised in the consolidated income statement.
Non-oil and gas intangible assetsIntangible assets acquired in a business combination are initially measured at cost, being their fair values at the date of acquisition, and are recognised separately from goodwill where the asset is separable or arises from a contractual or other legal right and its fair value can be measured reliably. After initial recognition, intangible assets are carried at cost less accumulated amortisation and accumulated impairment charges.
Intangible assets with a finite life are amortised over their useful economic life using a straight-line method unless a better method reflecting the pattern in which the asset’s future economic benefits are expected to be consumed can be determined. The amortisation charge for intangible assets is included in the cost of sales or selling, general and administration expenses line items of the consolidated income statement. The expected useful lives of assets are reviewed on an annual basis. Intangible assets are tested for impairment whenever there is an indication that the asset may be impaired.
Enterprise Resource Planning (“ERP”) and digital system intangiblesDevelopment cost associated with ERP and digital system intangibles is carried at cost less any accumulated amortisation and accumulated impairment. Amortisation of the asset commences when the development is complete, and the asset is available for use. The useful life of the ERP system when it is available for use is estimated to be 4 to 7 years. Amortisation is included in the selling, general and administration expenses line item of the consolidated income statement.
Impairment of non-current assets (excluding goodwill)At each reporting date, the Group reviews the carrying amounts of its property, plant and equipment and intangible assets to assess whether there is an indication that those assets may be impaired. If any such indication exists, the Group makes an estimate of the asset’s recoverable amount. An asset’s recoverable amount is the higher of its fair value less costs of disposal and its value in use. In assessing value in use, the estimated future cash flows attributable to the asset are discounted to their present value using a pre-tax discount rate that reflects current market assessments of the time value of money and the risks specific to the asset. Fair value less costs of disposal is based on the risk-adjusted discounted cash flow models. A post-tax discount rate is used in such calculations.
If the recoverable amount of an asset is estimated to be less than its carrying amount an impairment charge is recognised immediately in the consolidated income statement.
Where an impairment loss subsequently reverses, the carrying amount of the asset is increased to the revised estimate of its recoverable amount, but not exceeding the carrying amount that would have been determined had no impairment loss been recognised for the asset in prior reporting periods. A reversal of an impairment loss is recognised immediately in the consolidated income statement.
Trade receivablesA trade receivable represents the Group’s right to an amount of consideration that is unconditional (i.e. only the passage of time is required before payment of the consideration is due). Refer to accounting policies for financial assets on pages 145 and 146.
Notes to the consolidated financial statements continuedFor the year ended 31 December 2020
Petrofac Limited | 2020 Annual report and accounts144
Financial statements

Contract assets and contract liabilitiesContract assetsA contract asset is the right to consideration in exchange for goods or services transferred to the customer. If the Group performs by transferring goods or services to a customer before the customer pays consideration or before payment is due, a contract asset is recognised for the earned consideration that is conditional.
Fixed-price engineering, procurement and construction contracts are presented in the consolidated balance sheet as follows:
—For each contract, the revenue recognised at the contract’s measure of progress using the input method, after deducting progress payments received or amounts receivable from the customers, is presented within the contract assets line item in the consolidated balance sheet as work in progress. The amounts recognised as work in progress are adjusted for any expected credit loss allowance considering the probability of default of the counter party. The probability of default data for the counter party is estimated with input from a third-party provider.
Contract liabilitiesA contract liability is the obligation to transfer goods or services to a customer for which the Group has received consideration (or an amount of consideration is due) from the customer. If a customer pays consideration before the Group transfers goods or services to the customer, a contract liability is recognised when the payment is made or the payment is due (whichever is earlier). Contract liabilities are recognised as revenue when the Group performs under the contract.
Fixed-price engineering, procurement and construction contracts are presented in the consolidated balance sheet as follows:
— Where the payments received or receivable for any contract exceed revenue recognised, the excess is presented within the contract liabilities line item in the consolidated balance sheet as billings in excess of cost and estimated earnings
Fair value measurementThe Group measures financial instruments, such as derivatives, and contingent consideration receivable at fair value at each reporting date. Fair value related disclosures for financial instruments are disclosed in note 18.
Fair value is the price that would be received to sell an asset or paid to transfer a liability in an orderly transaction between market participants at the measurement date. The fair value measurement is based on the presumption that the transaction to sell the asset or transfer the liability takes place either:
— In the principal market for the asset or liability; or — In the absence of a principal market, in the most advantageous market for the asset or liability
The principal or the most advantageous market must be accessible by the Group.
The fair value of an asset or a liability is measured using the assumptions that market participants would use when pricing the asset or liability, assuming that market participants act in their economic best interest.
A fair value measurement of a non-financial asset takes into account a market participant’s ability to generate economic benefits by using the asset in its highest and best use or by selling it to another market participant that would use the asset in its highest and best use.
The Group uses valuation techniques that are appropriate in the circumstances and for which sufficient data is available to measure fair value, maximising the use of relevant observable inputs and minimising the use of unobservable inputs.
All assets and liabilities for which fair value is measured or disclosed in the consolidated financial statements are categorised within the fair value hierarchy, described as follows, based on the lowest level input that is significant to the fair value measurement as a whole:
— Level 1 – Unadjusted quoted prices in active markets for identical financial assets or liabilities — Level 2 – Inputs other than quoted prices included within Level 1 that are observable for the asset or liability, either directly (i.e. as prices) or indirectly (i.e. derived from prices) — Level 3 – Inputs for the asset or liability that are not based on observable market data (unobservable inputs)
For assets and liabilities that are remeasured in the consolidated financial statements on a recurring basis, the Group determines whether transfers have occurred between levels in the hierarchy by re-assessing categorisation (based on the lowest level input that is significant to the fair value measurement as a whole) at the end of each reporting period.
For the purpose of fair value disclosures, the Group has determined classes of assets and liabilities on the basis of the nature, characteristics and risks of the asset or liability and the level of the fair value hierarchy as explained above.
Financial assets and financial liabilitiesA financial instrument is any contract that gives rise to a financial asset of one entity and a financial liability or equity instrument of another entity.
Financial assetsInitial recognition and measurementFinancial assets are classified at initial recognition as subsequently measured at amortised cost, fair value through profit or loss, or as derivatives designated as hedging instruments in an effective hedge, as appropriate.
The classification of financial assets at initial recognition depends on the financial asset’s contractual cash flow characteristics and the Group’s business model for managing them. With the exception of trade receivables that do not contain a significant financing component, the Group initially measures a financial asset at its fair value plus, in the case of a financial asset not at fair value through profit or loss, transaction costs. Trade receivables that do not contain a significant financing component are measured at the transaction price determined under IFRS 15 ‘Revenue from Contracts with Customers’.
The Group’s business model for managing financial assets refers to how it manages its financial assets in order to generate cash flows. The business model determines whether cash flows will result from collecting contractual cash flows, selling the financial assets, or both.
Subsequent measurementFor purposes of subsequent measurement, financial assets are generally classified in the following categories:
— Amortised cost — Financial assets at fair value through profit or loss
Strateg
ic repo
rtG
overn
ance
Finan
cial statemen
ts
145Petrofac Limited | 2020 Annual report and accounts

2 Summary of significant accounting policies continuedAmortised costThis category is the most relevant to the Group and generally applies to trade and other receivables, receivable from joint operation partners for leases, deferred consideration receivable and advances relating to provision for decommissioning liability. The Group measures financial assets at amortised cost if both of the following conditions are met:
— The financial asset is held within a business model with the objective to hold financial assets in order to collect contractual cash flows; and — The contractual terms of the financial asset give rise on specified dates to cash flows that are solely payments of principal and interest on the principal amount outstanding
Financial assets at amortised cost are subsequently measured using the effective interest rate (“EIR”) method and are subject to impairment. Gains and losses are recognised in the consolidated income statement when the asset is derecognised, modified or impaired.
Financial assets at fair value through profit or lossFinancial assets at fair value through profit or loss include financial assets held for trading and financial assets designated upon initial recognition at fair value through profit or loss, or financial assets mandatorily required to be measured at fair value. Financial assets are classified as held for trading if they are acquired for the purpose of selling or repurchasing in the near term. Derivatives, including separated embedded derivatives, are also classified as held for trading unless they are designated as effective hedging instruments. Financial assets at fair value through profit or loss are carried in the consolidated balance sheet at fair value with net changes in fair value recognised in the consolidated income statement.
Pánuco contingent consideration, contingent consideration arising from disposal of the Group’s operations in Mexico and contingent consideration receivable from Ithaca Energy UK Ltd, were recognised as financial assets at fair value through profit or loss within the other financial assets line items of the consolidated balance sheet. Any fair value change associated with such financial assets is recognised through profit or loss (note 18).
The fair value changes to undesignated forward currency contracts are reported within the other operating income and other operating expenses line item in the consolidated income statement.
Impairment of financial assetsThe Group recognises an allowance for expected credit losses (“ECLs”) for all financial assets not held at fair value through profit or loss. ECLs are based on the difference between the contractual cash flows due in accordance with the contract and all the cash flows that the Group expects to receive, discounted at an approximation of the original effective interest rate. The expected cash flows will include, if any, cash flows from the sale of collateral held or other credit enhancements that are integral to the contractual terms.
For other financial assets measured at amortised cost, ECLs are recognised in two stages. For credit exposures for which there has not been a significant increase in credit risk since initial recognition, ECLs are provided for credit losses that result from default events that are possible within the next 12 months (a 12-month ECL). For those credit exposures for which there has been a significant increase in credit risk since initial recognition, a loss allowance is required for credit losses expected over the remaining life of the exposure, irrespective of the timing of the default (a lifetime ECL). There was no significant increase in the credit risk for such financial assets since the initial recognition.
For trade receivables and contract assets, the Group applies a simplified approach in calculating ECLs (a lifetime ECL). Therefore, the Group does not track changes in credit risk, but instead recognises a loss allowance based on lifetime ECLs at each reporting date. An impairment analysis by each operating segment is performed at each reporting date subject to the Group’s established policies and procedures. Engineering & Construction and Integrated Energy Services operating segments that involve low populations of high-value receivables apply the probability of default data relating to each individual counterparty to calculate expected credit loss allowance at each reporting date. The probability of default data for the counterparty is sourced from a third-party provider.
Engineering & Production Services operating segment involves a high population of low-value receivables and applies a provision matrix to measure expected credit losses. The provision rates are based on days past due for groupings of various customer segments with similar loss patterns. The expected credit loss calculation reflects the probability-weighted outcome, the time value of money and reasonable and supportable information that is available at the reporting date about past events, current conditions and where possible, forecasts of future economic conditions. The amount of ECLs are sensitive to changes in circumstances and of forecast economic conditions. The Group’s historical credit loss experience and forecast of economic conditions may also not be representative of a customer’s actual default in the future.
The Group considers a financial asset to be in default when internal or external information indicates that the Group is unlikely to receive the outstanding contractual amounts in full. A financial asset is written off only when there is no reasonable expectation of recovering the contractual cash flows, based on the contractual position agreed with the customer, contract close-out negotiations and objective evidence of the customer’s inability to pay.
Financial liabilitiesInitial recognition and measurementFinancial liabilities are classified, at initial recognition, as financial liabilities at fair value through profit or loss, loans and borrowings, payables, or as derivatives designated as hedging instruments in an effective hedge, as appropriate.
All financial liabilities are recognised initially at fair value and, in the case of loans and borrowings and trade and other payables, net of directly attributable transaction costs.
The Group’s financial liabilities include trade and other payables, loans and borrowings including bank overdrafts, derivative financial instruments and lease liabilities.
Notes to the consolidated financial statements continuedFor the year ended 31 December 2020
Petrofac Limited | 2020 Annual report and accounts146
Financial statements

Subsequent measurementFor purposes of subsequent measurement, financial liabilities are classified in the following categories:
— Financial liabilities at fair value through profit or loss — Financial liabilities at amortised cost (loans and borrowings)
Financial liabilities at fair value through profit or lossFinancial liabilities at fair value through profit or loss include financial liabilities held for trading and financial liabilities designated upon initial recognition as at fair value through profit or loss.
Financial liabilities are classified as held for trading if they are incurred for the purpose of repurchasing in the near term. This category also includes derivative financial instruments entered by the Group that are not designated as hedging instruments in hedge relationships. Separated embedded derivatives are also classified as held for trading unless they are designated as effective hedging instruments.
Gains or losses on liabilities held for trading are recognised in the consolidated income statement.
Financial liabilities designated upon initial recognition at fair value through profit or loss are designated at the initial date of recognition, only if the criteria in IFRS 9 ‘Financial Instruments’ are satisfied. The contingent consideration payable related to the acquisition of W&W Energy Services was designated as a financial liability measured at fair value through profit or loss (see note 18).
Financial liabilities at amortised cost (loans and borrowings)This category generally applies to interest-bearing loans and borrowings (note 27) and lease liabilities (note 18). After initial recognition, interest-bearing loans and borrowings and lease liabilities are subsequently measured at amortised cost using the EIR method.
Amortised cost is calculated by considering any discount or premium on acquisition and fees or costs that are an integral part of the EIR. The EIR amortisation is included as finance expense in the consolidated income statement.
Derecognition of financial assets and liabilitiesFinancial assetsA financial asset (or, where applicable, a part of a financial asset) is derecognised where:
— The rights to receive cash flows from the asset have expired — The Group retains the right to receive cash flows from the asset, but has assumed an obligation to pay them in full without material delay to a third party under a ‘pass-through’ arrangement; or — The Group has transferred its rights to receive cash flows from the asset and either (a) has transferred substantially all the risks and rewards of the asset, or (b) has neither transferred nor retained substantially all the risks and rewards of the asset, but has transferred control of the asset
Financial liabilitiesA financial liability is derecognised when the obligation under the liability is discharged or cancelled or expires.
If an existing financial liability is replaced by another from the same lender, on substantially different terms, or the terms of an existing liability are substantially modified, such an exchange or modification is treated as a derecognition of the original liability and the recognition of a new liability such that the difference in the respective carrying amounts together with any costs or fees incurred are recognised in the consolidated income statement.
Derivative financial instruments and hedgingThe Group uses derivative financial instruments such as forward currency contracts to hedge its risks associated with foreign currency fluctuations. Such derivative financial instruments are initially recognised at fair value on the date on which a derivative contract is entered into and are subsequently re-measured at fair value. Derivatives are carried as assets when the fair value is positive and as liabilities when the fair value is negative.
Any gains or losses arising from changes in the fair value of derivatives that do not qualify for hedge accounting are taken to the consolidated income statement.
The fair value of forward currency contracts is calculated by reference to current forward exchange rates for contracts with similar maturity profiles.
For the purposes of hedge accounting, hedges are classified as:
— Fair value hedges when hedging the exposure to changes in the fair value of a recognised asset or liability; or — Cash flow hedges when hedging the exposure to variability in cash flows that is either attributable to a particular risk associated with a recognised asset or liability or a highly probable forecast transaction
The Group formally designates and documents the relationship between the hedging instrument and the hedged item at the inception of the transaction, as well as its risk management objectives and strategy for undertaking various hedge transactions. The documentation also includes identification of the hedging instrument, the hedged item or transaction, the nature of risk being hedged and how the Group will assess the hedging instrument’s effectiveness in offsetting the exposure to changes in the hedged item’s fair value or cash flows attributable to the hedged risk. The Group also documents its assessment, both at hedge inception and on an ongoing basis, of whether the derivatives that are used in the hedging transactions are highly effective in offsetting changes in fair values or cash flows of the hedged items.
The treatment of gains and losses arising from revaluing derivatives designated as hedging instruments depends on the nature of the hedging relationship, as follows:
Strateg
ic repo
rtG
overn
ance
Finan
cial statemen
ts
147Petrofac Limited | 2020 Annual report and accounts

2 Summary of significant accounting policies continuedCash flow hedgesFor cash flow hedges, the effective portion of the gain or loss on the hedging instrument is recognised directly in the consolidated statement of other comprehensive income in net unrealised gains/(losses) on derivatives, while the ineffective portion is recognised in the consolidated income statement. Amounts taken to other comprehensive income are transferred to the consolidated income statement when the hedged transaction affects the consolidated income statement.
If the hedging instrument expires or is sold, terminated or exercised without replacement or rollover, or if its designation as a hedge is revoked, any cumulative gain or loss previously recognised in other comprehensive income remains separately in equity until the forecast transaction occurs and affects the consolidated income statement. When a forecast transaction is no longer expected to occur, the cumulative gain or loss that was reported in other comprehensive income is immediately transferred to the consolidated income statement.
Share-based paymentsEmployees (including Executive Directors) of the Group receive remuneration in the form of share-based payment, whereby employees render services in exchange for shares or rights over shares (‘equity-settled transactions’).
Equity-settled transactionsThe cost of equity-settled transactions with employees is measured by reference to the fair value at the date on which they are granted.
The cost of equity-settled transactions is recognised in the cost of sales or selling, general and administration expenses line items in the consolidated income statement, together with a corresponding increase in other reserves line item in the consolidated balance sheet, over the period in which the relevant employees become entitled to the award (the ‘vesting period’). The cumulative expense recognised for equity-settled transactions at the end of the reporting period until the vesting date reflects the extent to which the vesting period has expired and the Group’s best estimate of the number of equity instruments that will ultimately vest. The charge or credit to the consolidated income statement for a period represents the movement in cumulative expense recognised from the beginning to the end of the reporting period.
No expense is recognised for awards that do not ultimately vest because non-market performance and/or service conditions have not been met. Where awards include a market or non-vesting condition, the transactions are treated as vested irrespective of whether the market or non-vesting condition is satisfied, provided that all other performance and/or service conditions are satisfied.
Equity awards cancelled, e.g. in case of good leavers, are treated as vested immediately on the date of cancellation, and any expense not recognised for the award at that date is immediately recognised in the consolidated income statement.
Income taxesIncome tax expense represents the sum of current income tax and deferred tax.
Current income tax assets and liabilities for the current and prior periods are measured at the amount expected to be recovered from or paid to the taxation authorities. Taxable profit differs from profit as reported in the consolidated income statement because it excludes items of income or expense that are taxable or deductible in other years and it further excludes items that are never taxable or deductible. The Group’s liability for current tax is calculated using tax rates that have been enacted or substantively enacted by the balance sheet date.
Deferred tax is recognised on all temporary differences at the balance sheet date between the carrying amounts of assets and liabilities in the financial statements and the corresponding tax bases used in the computation of taxable profit, with the following exceptions:
— Where the temporary difference arises from the initial recognition of goodwill or of an asset or liability in a transaction that is not a business combination that at the time of the transaction affects neither accounting nor taxable profit or loss — In respect of taxable temporary differences associated with investments in subsidiaries, associates and joint ventures, where the timing of reversal of the temporary differences can be controlled and it is probable that the temporary differences will not reverse in the foreseeable future; and — Deferred tax assets are recognised only to the extent that it is probable that a taxable profit will be available against which the deductible temporary differences and carried forward tax credits or tax losses can be utilised
The carrying amount of deferred tax assets is reviewed at each balance sheet date and reduced to the extent that it is no longer probable that sufficient taxable profit will be available to allow all or part of the deferred tax assets to be utilised. Unrecognised deferred tax assets are reassessed at each balance sheet date and are recognised to the extent that it has become probable that future taxable profit will allow the deferred tax asset to be recovered.
Deferred tax assets and liabilities are measured on an undiscounted basis at the tax rates that are expected to apply when the asset is realised or the liability is settled, based on tax rates and tax laws enacted or substantively enacted at the balance sheet date.
Current and deferred tax is charged or credited directly to other comprehensive income or equity if it relates to items that are credited or charged to, respectively, other comprehensive income or equity. Otherwise, income tax is recognised in the consolidated income statement.
Notes to the consolidated financial statements continuedFor the year ended 31 December 2020
Petrofac Limited | 2020 Annual report and accounts148
Financial statements
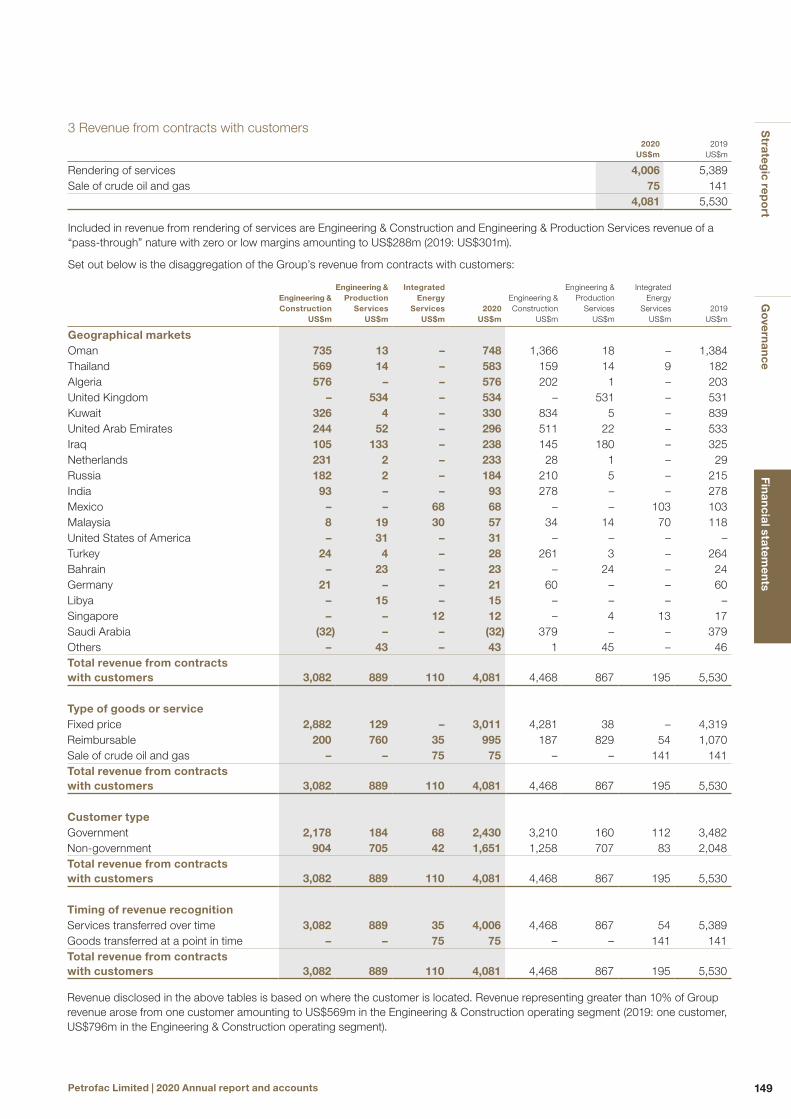
3 Revenue from contracts with customers2020
US$m2019
US$m
Rendering of services 4,006 5,389Sale of crude oil and gas 75 141
4,081 5,530
Included in revenue from rendering of services are Engineering & Construction and Engineering & Production Services revenue of a “pass-through” nature with zero or low margins amounting to US$288m (2019: US$301m).
Set out below is the disaggregation of the Group’s revenue from contracts with customers:
Engineering &Construction
US$m
Engineering & Production
Services US$m
Integrated Energy
Services US$m
2020US$m
Engineering &Construction
US$m
Engineering & Production
ServicesUS$m
Integrated Energy
Services US$m
2019US$m
Geographical marketsOman 735 13 – 748 1,366 18 – 1,384Thailand 569 14 – 583 159 14 9 182Algeria 576 – – 576 202 1 – 203United Kingdom – 534 – 534 – 531 – 531Kuwait 326 4 – 330 834 5 – 839United Arab Emirates 244 52 – 296 511 22 – 533Iraq 105 133 – 238 145 180 – 325Netherlands 231 2 – 233 28 1 – 29Russia 182 2 – 184 210 5 – 215India 93 – – 93 278 – – 278Mexico – – 68 68 – – 103 103Malaysia 8 19 30 57 34 14 70 118United States of America – 31 – 31 – – – –Turkey 24 4 – 28 261 3 – 264Bahrain – 23 – 23 – 24 – 24Germany 21 – – 21 60 – – 60Libya – 15 – 15 – – – –Singapore – – 12 12 – 4 13 17Saudi Arabia (32) – – (32) 379 – – 379Others – 43 – 43 1 45 – 46Total revenue from contracts with customers 3,082 889 110 4,081 4,468 867 195 5,530
Type of goods or serviceFixed price 2,882 129 – 3,011 4,281 38 – 4,319Reimbursable 200 760 35 995 187 829 54 1,070Sale of crude oil and gas – – 75 75 – – 141 141Total revenue from contracts with customers 3,082 889 110 4,081 4,468 867 195 5,530
Customer typeGovernment 2,178 184 68 2,430 3,210 160 112 3,482Non-government 904 705 42 1,651 1,258 707 83 2,048Total revenue from contracts with customers 3,082 889 110 4,081 4,468 867 195 5,530
Timing of revenue recognitionServices transferred over time 3,082 889 35 4,006 4,468 867 54 5,389Goods transferred at a point in time – – 75 75 – – 141 141Total revenue from contracts with customers 3,082 889 110 4,081 4,468 867 195 5,530
Revenue disclosed in the above tables is based on where the customer is located. Revenue representing greater than 10% of Group revenue arose from one customer amounting to US$569m in the Engineering & Construction operating segment (2019: one customer, US$796m in the Engineering & Construction operating segment).
Strateg
ic repo
rtG
overn
ance
Finan
cial statemen
ts
149Petrofac Limited | 2020 Annual report and accounts

3 Revenue from contracts with customers continuedThe transaction price allocated to the remaining performance obligations (unsatisfied or partially unsatisfied) as at the end of each reporting period is as follows:
Engineering &Construction
US$m
Engineering & Production
Services US$m
2020 US$m
Engineering & Construction
US$mRestated
Engineering & Production
Services US$m
Restated
2019US$m
Restated
Within one year 2,151 876 3,027 3,790 719 4,509More than one year 1,095 865 1,960 1,876 1,017 2,893
3,246 1,741 4,987 5,666 1,736 7,402
4 Segment informationThe Group organisational structure comprises the following three operating segments:
— Engineering & Construction (E&C), which provides fixed-price engineering, procurement and construction project execution services and reimbursable engineering, procurement and construction management services to the onshore and offshore oil and gas industry — Engineering & Production Services (EPS), which mainly includes reimbursable engineering and production services activities to the oil and gas industry — Integrated Energy Services (IES), which is focused on delivering value from the existing asset portfolio
The Chief Operating Decision Maker (CODM) regularly reviews the performance of the operating segments to make decisions about resource allocations and to assess financial performance. Finance expense and income arising from borrowings and cash balances, which are not directly attributable to individual operating segments, are allocated to Corporate. In addition, certain shareholder services related costs, intra-group financing and consolidation adjustments are managed at Corporate and are not allocated to operating segments.
The Group’s financial performance presented below also separately identifies the effect of separately disclosed items to provide users of the consolidated financial statements with a clear and consistent presentation of the underlying business performance of the Group; refer to note 6 and appendix A on page 191 for details.
The following tables represent revenue and profit/(loss) information relating to the Group’s operating segments for the year ended 31 December 2020 and the restated comparative information for the year ended 31 December 2019.
Year ended 31 December 2020
Engineering & Construction
US$m
Engineering & Production
Services US$m
Integrated Energy
Services US$m
Corporate & others US$m
Consolidation adjustments &
eliminations US$m
Business performance
US$m
Separatelydisclosed
items US$m
Reported US$m
RevenueExternal sales 3,082 889 110 – – 4,081 – 4,081Inter-segment sales 8 44 – – (52) – – –Total revenue 3,090 933 110 – (52) 4,081 – 4,081
Operating profit/(loss) 78 44 (30) (11) – 81 (229) (148)Finance income – 2 5 2 – 9 – 9Finance expense (1) (2) (7) (27) – (37) – (37)Share of net profit of associates and joint ventures – 5 – – – 5 – 5Profit/(loss) before tax 77 49 (32) (36) – 58 (229) (171)Income tax (expense)/credit (21) (10) 11 1 – (19) 1 (18)Net profit/(loss) 56 39 (21) (35) – 39 (228) (189)
Attributable to:Petrofac Limited shareholders 62 39 (18) (35) – 48 (228) (180)Non-controlling interests (6) – (3) – – (9) – (9)
56 39 (21) (35) – 39 (228) (189)
EBITDA 113 59 39 – – 211 – –
Notes to the consolidated financial statements continuedFor the year ended 31 December 2020
Petrofac Limited | 2020 Annual report and accounts150
Financial statements
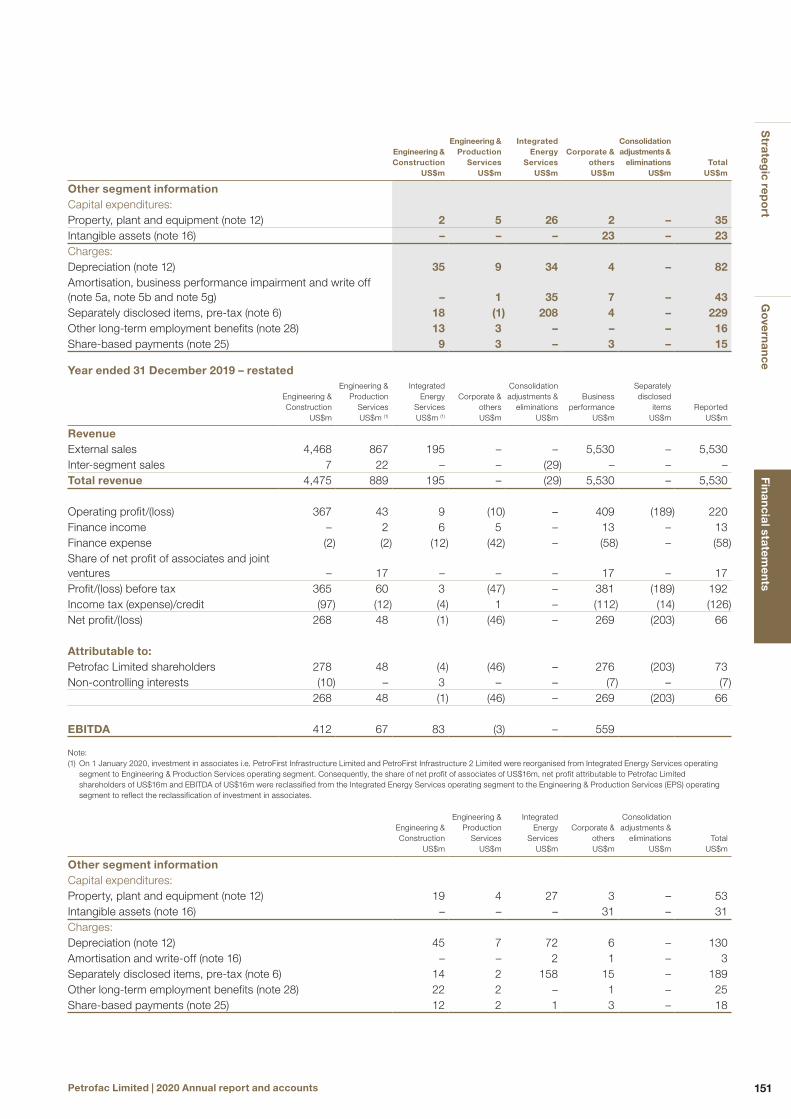
Engineering &Construction
US$m
Engineering &Production
Services US$m
Integrated Energy
Services US$m
Corporate & others US$m
Consolidation adjustments &
eliminations US$m
Total US$m
Other segment informationCapital expenditures:Property, plant and equipment (note 12) 2 5 26 2 – 35Intangible assets (note 16) – – – 23 – 23Charges:Depreciation (note 12) 35 9 34 4 – 82Amortisation, business performance impairment and write off (note 5a, note 5b and note 5g) – 1 35 7 – 43Separately disclosed items, pre-tax (note 6) 18 (1) 208 4 – 229Other long-term employment benefits (note 28) 13 3 – – – 16Share-based payments (note 25) 9 3 – 3 – 15
Year ended 31 December 2019 – restated
Engineering & Construction
US$m
Engineering & Production
Services US$m (1)
Integrated Energy
Services US$m (1)
Corporate & othersUS$m
Consolidation adjustments &
eliminations US$m
Business performance
US$m
Separatelydisclosed
items US$m
Reported US$m
RevenueExternal sales 4,468 867 195 – – 5,530 – 5,530Inter-segment sales 7 22 – – (29) – – –Total revenue 4,475 889 195 – (29) 5,530 – 5,530
Operating profit/(loss) 367 43 9 (10) – 409 (189) 220Finance income – 2 6 5 – 13 – 13Finance expense (2) (2) (12) (42) – (58) – (58)Share of net profit of associates and joint ventures – 17 – – – 17 – 17Profit/(loss) before tax 365 60 3 (47) – 381 (189) 192Income tax (expense)/credit (97) (12) (4) 1 – (112) (14) (126)Net profit/(loss) 268 48 (1) (46) – 269 (203) 66
Attributable to:Petrofac Limited shareholders 278 48 (4) (46) – 276 (203) 73Non-controlling interests (10) – 3 – – (7) – (7)
268 48 (1) (46) – 269 (203) 66
EBITDA 412 67 83 (3) – 559
Note:(1) On 1 January 2020, investment in associates i.e. PetroFirst Infrastructure Limited and PetroFirst Infrastructure 2 Limited were reorganised from Integrated Energy Services operating
segment to Engineering & Production Services operating segment. Consequently, the share of net profit of associates of US$16m, net profit attributable to Petrofac Limited shareholders of US$16m and EBITDA of US$16m were reclassified from the Integrated Energy Services operating segment to the Engineering & Production Services (EPS) operating segment to reflect the reclassification of investment in associates.
Engineering & Construction
US$m
Engineering & Production
Services US$m
Integrated Energy
Services US$m
Corporate & others US$m
Consolidation adjustments &
eliminations US$m
Total US$m
Other segment informationCapital expenditures:Property, plant and equipment (note 12) 19 4 27 3 – 53Intangible assets (note 16) – – – 31 – 31Charges:Depreciation (note 12) 45 7 72 6 – 130Amortisation and write-off (note 16) – – 2 1 – 3Separately disclosed items, pre-tax (note 6) 14 2 158 15 – 189Other long-term employment benefits (note 28) 22 2 – 1 – 25Share-based payments (note 25) 12 2 1 3 – 18
Strateg
ic repo
rtG
overn
ance
Finan
cial statemen
ts
151Petrofac Limited | 2020 Annual report and accounts

4 Segment information continuedGeographical segmentsThe following tables present selected non-current assets by geographical segments for the years ended 31 December 2020 and 2019.
As at 31 December 2020
MalaysiaUS$m
United Arab Emirates
US$m
United Kingdom
US$mIndia
US$mKuwait US$m
Oman US$m
Othercountries
US$mTotal
US$m
Non-current assets:Property, plant and equipment (note 12) 170 48 40 12 7 2 9 288Goodwill (note 14) 3 29 44 – – – 25 101Intangible oil and gas assets (note 16) 13 – – – – – – 13Other intangible assets (note 16) – – 63 – – – 5 68
As at 31 December 2019
Malaysia US$m
Mexico US$m
United Kingdom
US$m
United Arab Emirates
US$mKuwait US$m
Oman US$m
Other countries
US$mTotal
US$m
Non-current assets:Property, plant and equipment (note 12) 237 63 49 19 15 5 10 398Goodwill (note 14) 3 29 42 – – – 25 99Intangible oil and gas assets (note 16) 17 – – – – – – 17Other intangible assets (note 16) – – 43 – – – 6 49
5 Expenses and incomea. Cost of salesIncluded in cost of sales is depreciation charged on property, plant and equipment of US$75m (2019: US$118m), amortisation charge on intangible assets of US$1m (2019: US$ nil) and expense associated with ineffective portions on derivatives designated as cash flow hedges of US$5m (2019: US$11m).
b. Selling, general and administration expenses2020
US$m2019 (1)
US$m
Staff costs (2) 102 127Depreciation and amortisation (note 12 and note 16) 14 13Write-off property, plant and equipment (note 12) – 2Other general and administration expenses 51 70
167 212
Notes:(1) Re-presented due to a reclassification of the expected credit loss allowance of US$16m for the year ended 31 December 2019, previously reported within selling, general and
administration expenses to expected credit loss allowance line item of the consolidated income statement, due to materiality of the expected credit loss allowance in the current reporting period. Consequently, selling, general and administration expenses decreased by US$16m and expected credit loss allowance line item of the consolidated income statement increased by US$16m.
(2) The staff costs of US$102m included, US$4m and associated recovery claims from HMRC in the United Kingdom of US$3m for the Group employees on furlough relating to the COVID-19 pandemic. The recovery claims of US$3m were fully received by the Group during 2020.
Other general and administration expenses consist mainly of office related costs, travel, professional services fees and contracting staff costs.
The decrease in selling, general and administration expenses of US$45m was mainly due to a reduction in staff cost of US$25m and a reduction in other general and administration expenses of US$19m, primarily due to cost reduction measures taken by the Group in response to ongoing COVID-19 pandemic and sharp fall in oil prices.
c. Staff costs2020
US$m2019
US$m
Total staff costs: Wages and salaries 715 901Social security costs 33 32Defined contribution pension costs 25 21Other long-term employee benefit costs (note 28) 16 24Share-based payments costs (note 25) 15 18
804 996
Of the US$804m (2019: US$996m) of staff costs shown above, US$702m (2019: US$869m) is included in cost of sales, with US$102m (2019: US$127m) in selling, general and administration expenses.
The average number of staff employed by the Group during the year was 10,645 (2019: 11,519).
Notes to the consolidated financial statements continuedFor the year ended 31 December 2020
Petrofac Limited | 2020 Annual report and accounts152
Financial statements

d. Auditor’s remunerationThe Group paid the following amounts to its auditor in respect of the audit of the financial statements and for other non-prohibited services provided to the Group:
2020 US$m
2019 US$m
Group audit fee 3 2Audit of subsidiaries’ accounts 1 1Others – 1
4 4
Others include audit related assurance services of US$19,000 (2019: US$400,000) and other non-audit services of US$132,000 (2019: US$196,000).
e. Expected credit loss (“ECL”) allowanceThe ECL allowance recognised by the Group during 2020 and 2019 were as follows:
2020 US$m
2019 US$m
ECL on trade receivables (note 20) – 8ECL on contract assets (note 21) 5 2ECL on other financial assets (note 18) 2 –ECL on other receivables (note 20) 2 6
9 16
f. Other operating income2020
US$m2019
US$m
Foreign exchange gains 6 6Other income 15 21
21 27
Other income mainly comprised US$7m of aged trade payables reversed during the year relating to the Engineering & Construction operating segment (2019: US$9m of scrap sales mainly relating to three contracts in the Engineering & Construction operating segment); and US$1m (2019: US$5m) of forward points relating to undesignated forward currency contracts in the Corporate reporting segment.
g. Other operating expenses2020
US$m2019
US$m
Foreign exchange losses 7 6Other expenses 36 5
43 11
Other expenses mainly comprised an impairment charge of US$34m (note 15) within the Integrated Energy Services operating segment (2019: US$nil) relating to asset held for sale associated with Group’s operations in Mexico.
Strateg
ic repo
rtG
overn
ance
Finan
cial statemen
ts
153Petrofac Limited | 2020 Annual report and accounts

6 Separately disclosed items2020
US$m2019
US$m
Impairment of assets 146 119Fair value re-measurements 57 37Restructuring and redundancy costs 13 10Other separately disclosed items 13 23
229 189Foreign exchange translation gains on deferred tax balances (1) (1)Deferred tax impairment – 16Tax relief on separately disclosed items – (1)
(1) 14Consolidated income statement charge 228 203
See note 2 and appendix A on page 191 for further details on APMs
Impairment of assets Internal and external impairment indicators existed at 30 June 2020, predominantly arising from the COVID-19 pandemic and sharp fall in oil prices. Consequently, the Group performed an impairment review of the carrying amount of its Block PM304 oil and gas assets on a fair value less cost of disposal basis (Level 3 of the ‘fair value hierarchy’ contained within IFRS 13 ‘Fair Value Measurement’) using a post-tax discount rate of 9.5% (2019: 9.5%), which resulted in a pre-tax impairment charge of US$64m, post-tax US$64m (2019: US$70m, post-tax US$86m) in the Integrated Energy Services operating segment. At 31 December 2020, impairment indicators associated with the failure of gas lift riser were identified and consequently management performed an additional impairment review of the carrying amount of its Block PM304 oil and gas assets on a fair value less cost of disposal basis. No additional impairment was identified as a result of this review.
These reviews involved assessing the field operational performance; robustness of the future development plans; oil price and licence extension assumptions and the recoverability of deferred tax asset carrying amount. As a result of this review an impairment of US$64m was allocated proportionately to property, plant and equipment (US$60m; see note 12) and intangible oil and gas assets (US$4m; see note 16). The oil price assumptions used by management were US$45 per barrel for 2021, US$50 per barrel for 2022, US$55 per barrel for 2023, US$60 per barrel for 2024, and a 2.0% oil price escalation for the period 2025 and beyond (2019: US$60 per barrel for 2020, US$65 per barrel for 2021 and 2022 and a 3.0% oil price escalation was used for period 2023 and beyond). The oil price assumption and the likelihood of a license extension beyond 2026 were the most sensitive input in determining the fair value less cost of disposal, a further 10% decrease in oil prices would result in an additional pre-tax impairment charge of US$38m (post-tax US$38m) and a further 10% decrease in the likelihood of a license extension beyond 2026 would result in an additional pre-tax impairment charge of US$13m (post-tax US$13m).
Fair value less costs of disposal is determined by discounting the post-tax cash flows expected to be generated from oil and gas production net of disposal costs considering assumptions that market participants would typically use in estimating fair values. Post-tax cash flows are derived from projected production profiles for each asset considering forward market commodity prices over the relevant period and, where external forward prices are not available, the Group’s Board-approved business planning assumptions were used. As each field has different reservoir characteristics and contractual terms, the post-tax cash flows for each asset are calculated using individual economic models, which include assumptions around the amount of recoverable reserves, production costs, life of the field/licence period and the selling price of the commodities produced.
On 3 November 2020, the Group disposed of its remaining 51% ownership interest relating to the Group’s operations in Mexico. Consequently, an impairment loss of US$79m, post-tax US$79m (2019:US$49m, post-tax US$49m) was recognised as a separately disclosed item in the consolidated income statement attributable to the Integrated Energy Services operating segment, see note 15 for details.
At 31 December 2020, the Group reviewed the carrying amount of its remaining property, plant and equipment including its right-of-use assets using the value-in-use basis. The value-in-use was estimated for the period of the lease using the latest approved cash flow forecast for 2021 to 2023 and a 2.5% increase for the period 2024 and 2025. The review resulted in a pre-tax impairment charge of US$3m (post-tax US$3m) in the Engineering & Production Services operating segment (2019: US$nil) relating to the right-of-use asset associated with a facility in the United Kingdom having a carrying amount of US$7m and a recoverable amount of US$4m.
Notes to the consolidated financial statements continuedFor the year ended 31 December 2020
Petrofac Limited | 2020 Annual report and accounts154
Financial statements
Fair value re-measurementsDuring 2020, management reviewed the carrying amount of the contingent consideration arising from the disposal of 49% non-controlling interest of the Group’s operations in Mexico and as a result of this review recognised a downward fair value adjustment of US$42m (post-tax US$42m) in the Integrated Energy Services operating segment (2019: US$nil, post-tax US$nil). The downward fair value adjustment was recognised due to uncertainty surrounding the Mexican Energy Reform programme and the outcome of other contingent consideration elements, see note 15 for details.
During 2020, management reviewed the carrying amount of the Pánuco contingent consideration and as a result of this review recognised a downward fair value adjustment of US$8m (post-tax US$8m) in the Integrated Energy Services operating segment (2019: US$37m, post-tax US$37m). The downward fair value adjustment was recognised in response to a confirmation received from the acquirer during 2020 to relinquish the Pánuco Production Enhancement Contract (“PEC”) to its customer. The carrying amount of the Pánuco contingent consideration at 31 December 2020, after the downward fair value adjustment, was US$nil (2019: US$8m), note 18.
During 2020, management reviewed the carrying amount of the contingent consideration receivable from the GSA acquirer and as a result of this review recognised a downward fair value adjustment of US$9m (post-tax US$9m) in the Integrated Energy Services operating segment (2019: US$nil). At 31 December 2019, the contingent consideration receivable from the GSA acquirer was fair valued at US$9m based on the most recent information available, including production volumes reported from when the well was brought on stream. Since this assessment, an audited independent reserves report for 31 December 2019 was received on 28 May 2020 based on the latest drilling production and operational performance that has shown a greater decline in production than expected and consequently provided evidence that the contingent consideration performance targets were unlikely to be met. The carrying amount of contingent consideration receivable from the acquirer at 31 December 2020, after the downward fair value adjustment, was US$nil (2019: US$9m), note 18.
During 2020, management reviewed the carrying amount of the deferred consideration associated with the disposal of JSD6000 installation vessel (the “vessel”) that was recognised as a non-current asset in the consolidated balance sheet. The fair value of the deferred consideration took into consideration, amongst other factors, an independent broker’s valuation of the vessel (a Level 3 measurement of the ‘fair value hierarchy’ contained within IFRS 13 ‘Fair Value Measurement’). A downward fair value adjustment of US$6m (post-tax US$6m) was recognised as a separately disclosed item in the Engineering & Construction operating segment (2019: US$nil), which reduced the deferred consideration to US$56m at the end of the reporting period (2019: US$61m). A further 10% decrease in the valuation of the vessel would result in additional downward fair value adjustment of US$6m.
During 2020, management reviewed the carrying amount of the contingent consideration payable associated with the acquisition of W&W Energy Services Inc (“W&W”). At the end of the reporting period, the fair value of contingent consideration payable was calculated using the expected value pay-out approach applying a discount rate of 11.6% (Level 3 of the ‘fair value hierarchy’ contained within IFRS 13 ‘Fair Value Measurement’). The fair value represented management’s best estimate based on the expected financial performance targets that will be achieved by W&W, over the two-year evaluation period i.e. 2020 and 2021 starting from the acquisition date of 29 November 2019. The financial performance targets for the two-year evaluation period based on the latest approved forecast of W&W were expected to be negatively impacted, by the sharp fall in oil and gas prices and lower demand for oil and gas services, in part prompted by the COVID-19 induced economic slowdown. Consequently, a fair value gain of US$8m (post-tax US$8m) was recognised in the Engineering & Production Services operating segment (2019: US$nil).
Restructuring and redundancy costsIn accordance with the actions announced by management in response to COVID-19 on 6 April 2020 to reduce costs and right-size the organisation, a redundancy cost of US$8m (post-tax US$8m) was recognised in the Engineering & Construction operating segment and US$5m (post-tax US$5m) was recognised in the Engineering & Production Services operating segment.
Other separately disclosed itemsOther separately disclosed items comprised US$4m, post-tax US$4m (2019: US$11m, post-tax US$11m) of professional services fees relating to Corporate reporting segment; US$6m, post-tax US$6m loss (note 18) associated with an early settlement of deferred consideration receivable in the Integrated Energy Services operating segment (2019: US$nil, post-tax US$nil); US$1m, post-tax US$1m gain (note 21) associated with an early settlement of a contract asset in the Engineering & Production Services operating segment (2019: US$nil, post-tax US$nil); additional disposal costs associated with the disposal of JSD6000 installation vessel of US$1m, post-tax US$1m (2019: US$6m, post-tax US$6m) in the Engineering & Construction operating segment; and foreign currency translation losses of US$3m, post-tax US$3m (2019: US$nil, post-tax US$nil) that related to the closure of an engineering office in the Engineering & Construction operating segment.
Strateg
ic repo
rtG
overn
ance
Finan
cial statemen
ts
155Petrofac Limited | 2020 Annual report and accounts

7 Finance income/(expense)2020
US$m2019
US$m
Finance incomeBank interest 3 5Unwinding of discount on receivables (note 18 and note 21) 6 8Total finance income 9 13Finance expenseGroup borrowings (27) (42)Lease liabilities (9) (12)Unwinding of discount on provisions (note 28) (1) (4)Total finance expense (37) (58)
8 Income taxa. Tax on ordinary activities The major components of income tax expense/(credit) are as follows:
Businessperformance (1)
US$m
Separately disclosed
itemsUS$m
Reported 2020
US$m
Business performance (1)
US$m
Separatelydisclosed
items US$m
Reported2019
US$m
Current income taxCurrent income tax expense 51 – 51 131 (1) 130Adjustments in respect of previous years (18) – (18) (5) – (5)Deferred taxRelating to origination and reversal of temporary differences (20) – (20) (19) – (19)Derecognition of deferred tax previously recognised 3 (1) 2 2 15 17Adjustments in respect of previous years 3 – 3 3 – 3Income tax expense/(credit) reported in the consolidated income statement 19 (1) 18 112 14 126Income tax reported in equityDeferred tax related to items charged directly to equity 1 – 1 1 – 1Foreign exchange movements on translation (2) – (2) – – –Income tax expense reported in equity (1) – (1) 1 – 1
Note: (1) This measurement is shown by the Group as a means of measuring underlying business performance; see note 2 and appendix A on page 191.
The split of the Group’s income tax expense between current and deferred tax varies from year to year depending largely on:
— the variance between tax provided on the percentage of completion of contracts compared to that paid on accrued income for fixed-price engineering, procurement and construction contracts; and — the tax deductions available for expenditure on Production Sharing Contracts (“PSCs”) and Production Enhancement Contracts (“PECs”), which are partially offset by the creation of losses.
See note 8c below for the impact on the movements in the year.
Notes to the consolidated financial statements continuedFor the year ended 31 December 2020
Petrofac Limited | 2020 Annual report and accounts156
Financial statements

b. Reconciliation of income tax expenseA reconciliation between income tax expense and the product of accounting profit multiplied by the Company’s domestic tax rate is as follows:
Businessperformance (1)
US$m
Separately disclosed
itemsUS$m
Reported 2020
US$m
Business performance (1)
US$m
Separatelydisclosed
items US$m
Reported 2019
US$m
Profit before tax 58 (229) (171) 381 (189) 192Applicable tax charge at standard statutory tax rates (2) 2 (61) (59) 78 (51) 27Expenditure not allowable for income tax purposes 7 37 44 30 49 79Income not subject to tax (2) (2) (4) (6) – (6)Adjustments in respect of previous years (15) – (15) (2) – (2)Adjustments in respect of deferred tax previously recognised/unrecognised 3 – 3 2 13 15Unrecognised deferred tax 27 26 53 9 4 13Other permanent differences (1) (1) (2) 1 (1) –Effect of change in tax rates (2) – (2) – – –At the effective income tax rate of negative 10.5% on reported profit before tax (2019: positive 65.6%) 19 (1) 18 112 14 126
Notes:(1) This measurement is shown by the Group as a means of measuring underlying business performance; see note 2 and appendix A on page 191.(2) The weighted average statutory tax rate was 34.5% in 2020 (2019: 14.1%). Compared with 2019, the rate in 2020 was mainly due to losses incurred in jurisdictions with a higher
weighted average statutory tax rate than jurisdictions in which the profits were made.
The Group’s reported effective tax rate on reported profit before tax for the year ended 31 December 2020 was negative 10.5% (2019: positive 65.6%). The Group’s business performance effective tax rate for the year ended 31 December 2020 was 32.8% (2019: 29.4%).
A number of factors have impacted the reported effective tax rate, with key drivers being: expenditure which is not allowable for tax purposes, tax in higher rate jurisdictions, impairment and fair value re-measurements of assets as well as the impact of losses created during the year for which the realisation against future taxable profits is not probable.
In line with prior years, the reported effective tax rate is also driven by the tax laws in the jurisdictions where the Group operates and generates profits.
c. Deferred taxDeferred tax relates to the following:
Consolidated balance sheet Movement
2020 US$m
2019 US$m
2020US$m
2019US$m
Deferred tax liabilities Accelerated depreciation for tax purposes 22 15 7 (4)Profit recognition 32 30 2 (5)Overseas earnings 6 4 2 (6)Other temporary differences 2 1 1 (1)Gross deferred tax liabilities 62 50Deferred tax assetsLosses available for offset 62 44 (18) 9Decelerated depreciation for tax purposes 7 6 (1) (1)Share-based payment plans 1 1 – 1Decommissioning 4 6 2 2Other temporary differences 11 6 (5) 6Gross deferred tax assets 85 63Net deferred tax asset and income tax expense/(credit) 23 13 (10) 1Of which: Deferred tax assets 61 50Deferred tax liabilities 38 37
Included within the deferred tax asset are tax losses of US$179m (2019: US$150m). This represents the losses which are expected to be utilised based on management’s projection of future taxable profits in the jurisdictions in which the losses reside.
Deferred tax liabilities of US$3m (2019: US$9m) were not recognised on temporary differences that related to unremitted earnings of the overseas subsidiaries, associates and joint ventures as the Group is able to control the timing of the reversal of these temporary differences and it is probable that they will not reverse in the foreseeable future. Unrecognised taxable temporary differences associated with undistributed retained earnings of investments in subsidiaries, associates and joint ventures amounted to US$11m (2019: US$29m).
Strateg
ic repo
rtG
overn
ance
Finan
cial statemen
ts
157Petrofac Limited | 2020 Annual report and accounts

8 Income tax continuedd. Unrecognised tax losses and tax creditsDeferred tax assets are recognised for tax loss carry forwards and tax credits to the extent that the realisation of the related tax benefit through offset against future taxable profits is probable. The Group did not recognise deferred income tax assets on tax losses of US$1,327m (2019: US$1,171m).
2020 US$m
2019US$m
Expiration dates for tax losses No later than 2025 3 –No expiration date 1,313 1,161
1,316 1,161Tax credits (no expiration date) 11 10
1,327 1,171
During 2020, no previously unrecognised losses were utilised by the Group (2019: US$nil).
9 Earnings per shareBasic earnings per share is calculated by dividing the net profit for the year attributable to Petrofac Limited shareholders by the weighted average number of ordinary shares outstanding during the year.
Diluted earnings per share is calculated by dividing the net profit attributable for the year to Petrofac Limited shareholders, after adjusting for any dilutive effect, by the weighted average number of ordinary shares outstanding during the year, adjusted for the effects of ordinary shares granted under the share-based payment plans which are held in the Employee Benefit Trust.
The following reflects the net profit and share data used in calculating basic and diluted earnings per share:
2020 US$m
2019 US$m
Business performance net profit attributable to Petrofac Limited shareholders for basic and diluted earnings per share 48 276Reported net profit attributable to Petrofac Limited shareholders for basic and diluted earnings per share (180) 73
2020 Shares million
2019 Shares million
Weighted average number of ordinary shares for basic earnings per share (1) 337 336Effect of dilutive potential ordinary shares granted under share-based payment plans (2) – 7Adjusted weighted average number of ordinary shares for diluted earnings per share 337 343
2020 US cents
2019US cents
Basic earnings per share Business performance 14.2 82.1Reported (53.4) 21.7Diluted earnings per share (2)
Business performance 14.2 80.4Reported (53.4) 21.3
Notes:(1) The weighted number of ordinary shares in issue during the year, excludes those held by the Employee Benefit Trust.(2) For the year ended 31 December 2020, potentially issuable ordinary shares under the share-based payment plans are excluded from the diluted earnings per ordinary share calculation,
as their inclusion would decrease the loss per ordinary share.
Notes to the consolidated financial statements continuedFor the year ended 31 December 2020
Petrofac Limited | 2020 Annual report and accounts158
Financial statements

10 Dividends paid and proposed2020
US$m2019
US$m
Declared and paid during the year Equity dividends on ordinary shares:Final dividend for 2018 (US$0.253 per share) – 86Interim dividend for 2019 (US$0.127 per share) – 43
– 129
2020 US$m
2019 US$m
Proposed for approval at the Annual General Meeting (“AGM”)(not recognised as a liability as at 31 December)Equity dividends on ordinary shares:Final dividend for 2019 US$0.253 per share – 88
In April 2020, the Board agreed to suspend the final 2019 ordinary share dividend payments, which had previously been announced as part of the year-end results for 2019, to preserve balance sheet strength in response to the challenges presented by the COVID-19 pandemic. The Board therefore decided to suspend both, the 2020 interim dividend (2019 interim dividend: US$0.127 per share) and final dividend (2019 final dividend: US$0.253 per share) to prudently conserve cash in this unprecedented market environment. However, the Board recognises the importance of dividends to our shareholders and will seek to reinstate them as soon as it is appropriate to do so. This will be contingent on both a market recovery and confidence that the dividend can be paid sustainably whilst retaining a strong balance sheet and liquidity.
11 Deferred consideration The deferred consideration associated with the disposal of the JSD6000 installation vessel (the “vessel”), was recognised as a non-current asset in the consolidated balance sheet. The deferred consideration is measured at fair value with any fair value gain and loss recognised in the consolidated income statement. The fair value of the deferred consideration took into consideration, amongst other factors, an independent broker’s valuation of the vessel (a Level 3 measurement of the ‘fair value hierarchy’ contained within IFRS 13 ‘Fair Value Measurement’). A negative fair value movement of US$6m (2019: US$nil) was recognised as a separately disclosed item in the consolidated income statement at the end of the reporting period (note 6) which reduced the deferred consideration to US$55m at 31 December 2020. A 10% decrease in the valuation of the vessel would result in a negative fair value change of US$6m.
Strateg
ic repo
rtG
overn
ance
Finan
cial statemen
ts
159Petrofac Limited | 2020 Annual report and accounts

12 Property, plant and equipment
Oil and gas assets US$m
Oil and gas facilities US$m
Land, buildings and
leasehold improvements
US$m
Plant and equipment
US$mVehicles
US$m
Office furniture and
equipment US$m
Assets under
construction US$m
Total US$m
Cost At 1 January 2019 1,049 313 412 38 29 178 1 2,020Additions 25 – 25 2 2 15 – 69Addition on acquisition – – 1 2 3 – – 6Change in decommissioning estimates (note 28) 1 – – – – – – 1Disposals – – – (3) – (5) – (8)Transfer to intangible assets (note 16) – – – – – (8) – (8)Transfer to assets held for sale (559) – (3) (2) (1) (5) – (570)Write-off (note 5) – (133) (3) – – – – (136)Translation difference – – 2 1 – 1 – 4At 1 January 2020 516 180 434 38 33 176 1 1,378Additions 26 – 7 2 1 4 – 40Disposals – – (3) (3) – (13) – (19)Transfer to intangible assets (note 16) – – – – – (2) – (2)Write-off (4) – (1) – – – – (5)Translation difference – – 1 – – (2) – (1)At 31 December 2020 538 180 438 37 34 163 1 1,391Depreciation & impairmentAt 1 January 2019 (628) (183) (264) (32) (22) (159) – (1,288)Depreciation charge (note 5a and 5b) (49) (19) (42) (1) (4) (15) – (130)Impairment charge (note 6) (76) (17) – – – – – (93)Disposals – – – 3 – 5 – 8Transfer to intangible assets (note 16) – – – – – 4 – 4Transfer to assets held for sale (note 15) 380 – 1 – – 4 – 385Write-off (note 5) – 133 1 – – – – 134At 1 January 2020 (373) (86) (304) (30) (26) (161) – (980)Depreciation charge (note 5a and 5b) (19) (12) (35) (2) (4) (10) – (82)Impairment charge (note 6) (37) (22) (3) (1) – – – (63)Disposals – – 3 3 – 13 – 19Write-off 3 – 1 – – – – 4Translation difference – – (1) – – – – (1)
At 31 December 2020 (426) (120) (339) (30) (30) (158) – (1,103)Net carrying amountAt 31 December 2020 112 60 99 7 4 5 1 288At 31 December 2019 143 94 130 8 7 15 1 398
Notes to the consolidated financial statements continuedFor the year ended 31 December 2020
Petrofac Limited | 2020 Annual report and accounts160
Financial statements
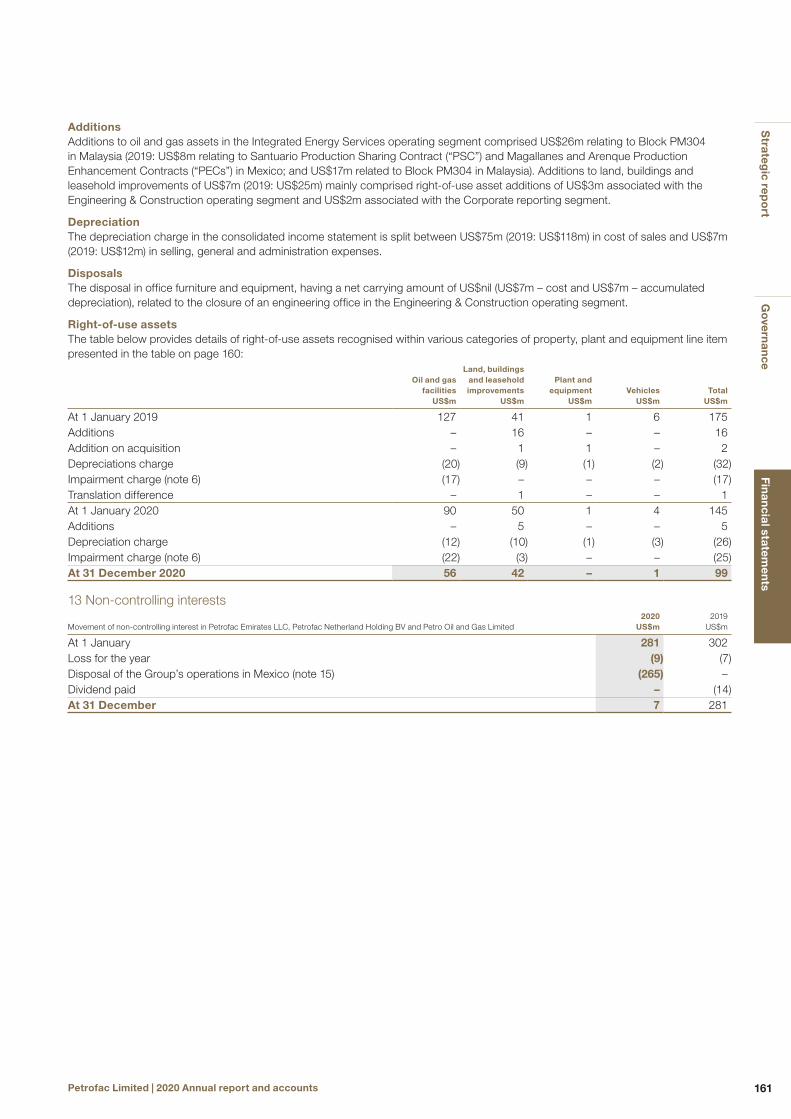
AdditionsAdditions to oil and gas assets in the Integrated Energy Services operating segment comprised US$26m relating to Block PM304 in Malaysia (2019: US$8m relating to Santuario Production Sharing Contract (“PSC”) and Magallanes and Arenque Production Enhancement Contracts (“PECs”) in Mexico; and US$17m related to Block PM304 in Malaysia). Additions to land, buildings and leasehold improvements of US$7m (2019: US$25m) mainly comprised right-of-use asset additions of US$3m associated with the Engineering & Construction operating segment and US$2m associated with the Corporate reporting segment.
DepreciationThe depreciation charge in the consolidated income statement is split between US$75m (2019: US$118m) in cost of sales and US$7m (2019: US$12m) in selling, general and administration expenses.
DisposalsThe disposal in office furniture and equipment, having a net carrying amount of US$nil (US$7m – cost and US$7m – accumulated depreciation), related to the closure of an engineering office in the Engineering & Construction operating segment.
Right-of-use assets The table below provides details of right-of-use assets recognised within various categories of property, plant and equipment line item presented in the table on page 160:
Oil and gas facilities
US$m
Land, buildings and leasehold improvements
US$m
Plant and equipment
US$mVehicles
US$mTotal
US$m
At 1 January 2019 127 41 1 6 175Additions – 16 – – 16Addition on acquisition – 1 1 – 2Depreciations charge (20) (9) (1) (2) (32)Impairment charge (note 6) (17) – – – (17)Translation difference – 1 – – 1At 1 January 2020 90 50 1 4 145Additions – 5 – – 5Depreciation charge (12) (10) (1) (3) (26)Impairment charge (note 6) (22) (3) – – (25)At 31 December 2020 56 42 – 1 99
13 Non-controlling interests
Movement of non-controlling interest in Petrofac Emirates LLC, Petrofac Netherland Holding BV and Petro Oil and Gas Limited2020
US$m2019
US$m
At 1 January 281 302Loss for the year (9) (7)Disposal of the Group’s operations in Mexico (note 15) (265) –Dividend paid – (14)At 31 December 7 281
Strateg
ic repo
rtG
overn
ance
Finan
cial statemen
ts
161Petrofac Limited | 2020 Annual report and accounts
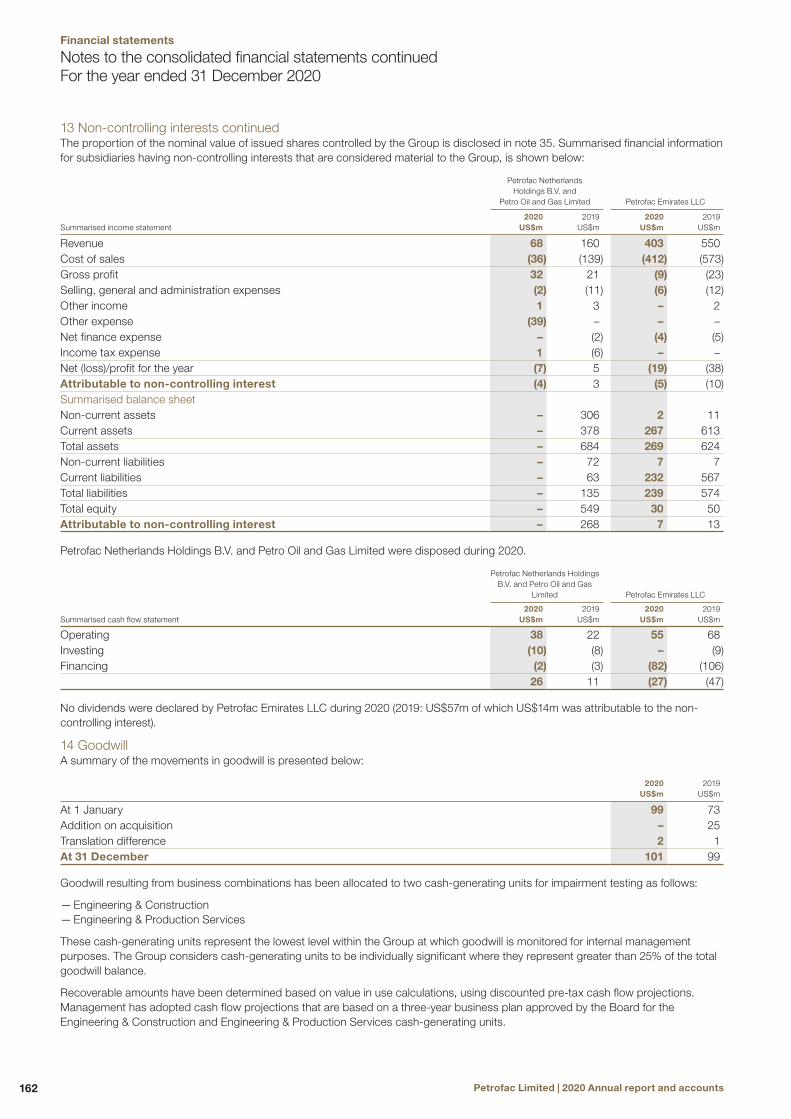
13 Non-controlling interests continuedThe proportion of the nominal value of issued shares controlled by the Group is disclosed in note 35. Summarised financial information for subsidiaries having non-controlling interests that are considered material to the Group, is shown below:
Petrofac Netherlands Holdings B.V. and
Petro Oil and Gas Limited Petrofac Emirates LLC
Summarised income statement2020
US$m2019
US$m2020
US$m2019
US$m
Revenue 68 160 403 550Cost of sales (36) (139) (412) (573)Gross profit 32 21 (9) (23)Selling, general and administration expenses (2) (11) (6) (12)Other income 1 3 – 2Other expense (39) – – –Net finance expense – (2) (4) (5)Income tax expense 1 (6) – –Net (loss)/profit for the year (7) 5 (19) (38)Attributable to non-controlling interest (4) 3 (5) (10)Summarised balance sheet Non-current assets – 306 2 11Current assets – 378 267 613Total assets – 684 269 624Non-current liabilities – 72 7 7Current liabilities – 63 232 567Total liabilities – 135 239 574Total equity – 549 30 50Attributable to non-controlling interest – 268 7 13
Petrofac Netherlands Holdings B.V. and Petro Oil and Gas Limited were disposed during 2020.
Petrofac Netherlands Holdings B.V. and Petro Oil and Gas
Limited Petrofac Emirates LLC
Summarised cash flow statement2020
US$m2019
US$m2020
US$m2019
US$m
Operating 38 22 55 68Investing (10) (8) – (9)Financing (2) (3) (82) (106)
26 11 (27) (47)
No dividends were declared by Petrofac Emirates LLC during 2020 (2019: US$57m of which US$14m was attributable to the non-controlling interest).
14 GoodwillA summary of the movements in goodwill is presented below:
2020 US$m
2019 US$m
At 1 January 99 73Addition on acquisition – 25Translation difference 2 1At 31 December 101 99
Goodwill resulting from business combinations has been allocated to two cash-generating units for impairment testing as follows:
— Engineering & Construction — Engineering & Production Services
These cash-generating units represent the lowest level within the Group at which goodwill is monitored for internal management purposes. The Group considers cash-generating units to be individually significant where they represent greater than 25% of the total goodwill balance.
Recoverable amounts have been determined based on value in use calculations, using discounted pre-tax cash flow projections. Management has adopted cash flow projections that are based on a three-year business plan approved by the Board for the Engineering & Construction and Engineering & Production Services cash-generating units.
Notes to the consolidated financial statements continuedFor the year ended 31 December 2020
Petrofac Limited | 2020 Annual report and accounts162
Financial statements

Carrying amount of goodwill allocated to each group of cash-generating units2020
US$m2019
US$m
Engineering & Construction 41 41Engineering & Production Services 60 58
101 99
Key assumptions used in value in use calculationsMarket share: The key management assumptions relate to maintaining existing levels of business and growing organically in international markets.
Discount rate: Management used a pre-tax discount rate of 14.0% (2019: 11.6%) derived from the estimated weighted average cost of capital of the Group.
15 Assets and liabilities held for saleDisposal of 49% interest Petrofac Netherlands Holdings B.V. which owned the Group’s operations in Mexico (“PNHBV”) during 2018On 30 July 2018, the Group signed an SPA with Perenco to dispose of a 49% non-controlling interest in PNHBV. During 2018, a pre-tax impairment charge of US$156m (post-tax US$111m), which included disposal costs of US$6m, was recognised as a separately disclosed item in the consolidated income statement attributable to the Integrated Energy Services operating segment. The disposal was completed on 18 October 2018 and represented a transaction between the equity holders under IFRS 10 ‘Consolidated Financial Statements’. The fair value of consideration received was recognised within equity as a non-controlling interest of US$266m.
The fair value of consideration comprised cash consideration of US$224m which was received by the Group on the date of completion and contingent consideration of US$42m, which was recognised as a non-current financial asset in the consolidated balance sheet (note 18). The contingent consideration was initially measured and recognised at fair value and was subsequently also measured at fair value with any fair value gain or loss recognised in the consolidated income statement. The fair value of the contingent consideration reflected management’s expectation of future field development programme and migration terms relating to achieving the contingent consideration criteria in the SPA associated with the migration of Magallanes and Arenque Production Enhancement Contracts to Production Sharing Contracts. A risk factor (a Level 3 input in the ‘fair value hierarchy’ contained within IFRS 13 ‘Fair Value Measurement’) was applied to the maximum contingent consideration receivable.
During 2020, a downward fair value adjustment of US$42m (2019: US$nil) was recognised as a separately disclosed item in the consolidated income statement (note 6) as a result of the increased uncertainty surrounding achieving the contingent consideration criteria in the SPA, i.e. the successful migration of the Magallanes and Arenque Production Enhancement Contracts to Production Sharing Contracts.
SPA signed in 2019 to dispose of the remaining 51% interest in PNHBV On 19 September 2019, the Group signed an SPA with Perenco to dispose of the remaining 51% ownership interest in PNHBV. During 2019, a pre-tax impairment charge of US$49m (post-tax US$49m) was recognised as a separately disclosed item in the consolidated income statement attributable to the Integrated Energy Services operating segment (note 6). At 31 December 2019, the Group’s assets in Mexico were classified as an asset held for sale, since the asset’s carrying amount was expected to be recovered through a disposal transaction rather than through its continuing use.
Disposal of the remaining 51% ownership interest in PNHBV during 2020On 3 November 2020, the Group completed the sale of its remaining 51% ownership interest in PNHBV to Perenco. At completion Perenco disagreed with the amount of the completion consideration payable under the terms of the SPA. The disagreement coincided with an immediate risk of expiry of time-bound Mexican regulatory approvals.
Management engaged independent legal specialists and based upon advice received completed the transaction within the regulatory approval validity period, while retaining all rights to subsequently seek recovery of the full completion consideration amount.
At the date of disposal, the fair value of the consideration for the Group’s remaining 51% ownership interest in PNHBV was US$159m, comprised of cash consideration of US$120m and contingent consideration of US$41m, offset by estimated disposal costs of US$2m. Of the total cash consideration of US$120m, US$83m was received by the Group on the date of completion and US$37m had already been received as a deposit on 19 September 2019 (the SPA signing date). The contingent consideration of US$41m was recognised as a non-current financial asset in the consolidated balance sheet (note 18). Consequently, an impairment loss of US$79m (post-tax US$79m) associated with the disposal of Group’s assets held for sale was recognised as a separately disclosed item in the consolidated income statement (note 6) attributable to the Integrated Energy Services operating segment.
The contingent consideration was initially measured and recognised at fair value and is subsequently to be measured at fair value with any fair value gain or loss recognised in the consolidated income statement. The estimation of the fair value of the contingent consideration reflected management’s expectations of (i) the final determination of the completion consideration amount; (ii) proceeds associated with a ruling by the Tax Administration Service in Mexico; and (iii) achieving the contingent consideration criteria in the SPA associated with the migration of Magallanes and Arenque Production Enhancement Contracts to Production Sharing Contracts. Management applied a risk factor (a Level 3 measurement of the ‘fair value hierarchy’ contained within IFRS 13 ‘Fair Value Measurement’) to the maximum contingent consideration receivable.
Strateg
ic repo
rtG
overn
ance
Finan
cial statemen
ts
163Petrofac Limited | 2020 Annual report and accounts

15 Assets and liabilities held for sale continuedThe table below explains the sensitivity analysis of possible changes to the risk factor (a Level 3 input in the ‘fair value hierarchy’ contained within IFRS 13 ‘Fair Value Measurement’) on the fair value of the contingent consideration:
10% increase in risk-factor
US$m
20% increase in risk-factor
US$m
Risk factor associated with the final determination of the completion consideration amount (6) (12)Risk factor relating to proceeds associated with a ruling by the Tax Administration Service in Mexico (4) (8)Risk factor associated with achieving the contingent consideration criteria in the SPA associated with the migration of Magallanes and Arenque Production Enhancement Contracts to Production Sharing Contracts – –Total (10) (20)
At completion the cash and short-term deposit balance of US$65m was offset against the cash consideration received by the Group and was presented net of cash forgone associated with the disposal of PNHBV within investing activities in the Group’s consolidated statement of cash flows.
A further impairment charge of US$34m was recognised within other operating expenses line item of the consolidated income statement for the year ended 31 December 2020 (2019: US$nil) such that the carrying amount of the net assets held for sale did not exceed the fair value less cost of disposal. Since the Group’s operations in Mexico were classified as held for sale, the property, plant and equipment and intangible assets were not depreciated and amortised respectively in accordance with IFRS 5 ‘Non-current Assets Held for Sale and Discontinued Operation’.
16 Intangible assets2020
US$m2019
US$m
Intangible oil and gas assets Cost: At 1 January 17 43Impairment charge (note 6) (4) (26)At 31 December 13 17Other intangible assets Cost: At 1 January 65 33Addition on acquisition – 6Additions 23 31Transfer from property, plant and equipment (note 12) 2 8Transferred to assets held for sale (note 15) – (12)Write-off – (1)Translation difference 2 –At 31 December 92 65Accumulated amortisation: At 1 January (16) (20)Amortisation (note 5a and 5b) (7) (1)Transfer from property, plant and equipment (note 12) – (4)Write-off – 1Transferred to assets held for sale (note 15) – 8Translation difference (1) –At 31 December (24) (16)Carrying amount of other intangible assets at 31 December 68 49Total intangible assets 81 66
Intangible oil and gas assetsIntangible oil and gas assets represent expenditure directly associated with evaluation or appraisal activities related to Block PM304 in Malaysia.
Notes to the consolidated financial statements continuedFor the year ended 31 December 2020
Petrofac Limited | 2020 Annual report and accounts164
Financial statements

Other intangible assetsOther intangible assets mainly comprised customer contracts and Enterprise Resource Planning (“ERP”) and digital systems intangibles. Such intangible assets are amortised over their estimated economic useful life on a straight-line basis and the related amortisation charges included in cost of sales and selling, general and administration expense line items of the consolidated income statement (note 5a and 5b). The additions of US$23m (2019: US$31m) related to investment in the development and implementation of Group-wide cloud-based ERP and digital systems.
17 Investments in associates and joint ventures
Associates US$m
Joint ventures
US$mTotal
US$m
As at 1 January 2019 20 10 30Loans made to joint ventures – 2 2Share of net profit 16 1 17Dividends received (11) – (11)As at 1 January 2020 25 13 38Loans made to joint ventures – 2 2Share of net profit/(loss) 6 (1) 5Dividends received (10) – (10)As at 31 December 2020 21 14 35
Dividends received during the year include US$8m received from PetroFirst Infrastructure Limited and US$2m received from PetroFirst Infrastructure 2 Limited (2019: US$10m received from PetroFirst Infrastructure Limited and US$1m received from PetroFirst Infrastructure 2 Limited).
Investment in associates2020
US$m2019
US$m
PetroFirst Infrastructure Limited 18 21PetroFirst Infrastructure 2 Limited 3 4
21 25
Interest in associatesSummarised financial information of associates, based on their IFRS financial statements, and a reconciliation with the carrying amount of the investment in associates in the consolidated balance sheet, are set out below:
2020 US$m
2019 US$m
Revenue 75 128Cost of sales (35) (33)Gross profit 40 95Net finance expense (5) (10)Net profit 35 85Group’s share of net profit for the year 6 16
Non-current assets 157 215Current assets 13 19Total assets 170 234Non-current liabilities 29 41Current liabilities 21 51Total liabilities 50 92Net assets 120 142Group’s share of net assets 21 25Carrying amount of the investment in associates 21 25
A list of all associates is disclosed in note 35.
No associates had contingent liabilities or capital commitments as at 31 December 2020 and 2019.
Strateg
ic repo
rtG
overn
ance
Finan
cial statemen
ts
165Petrofac Limited | 2020 Annual report and accounts
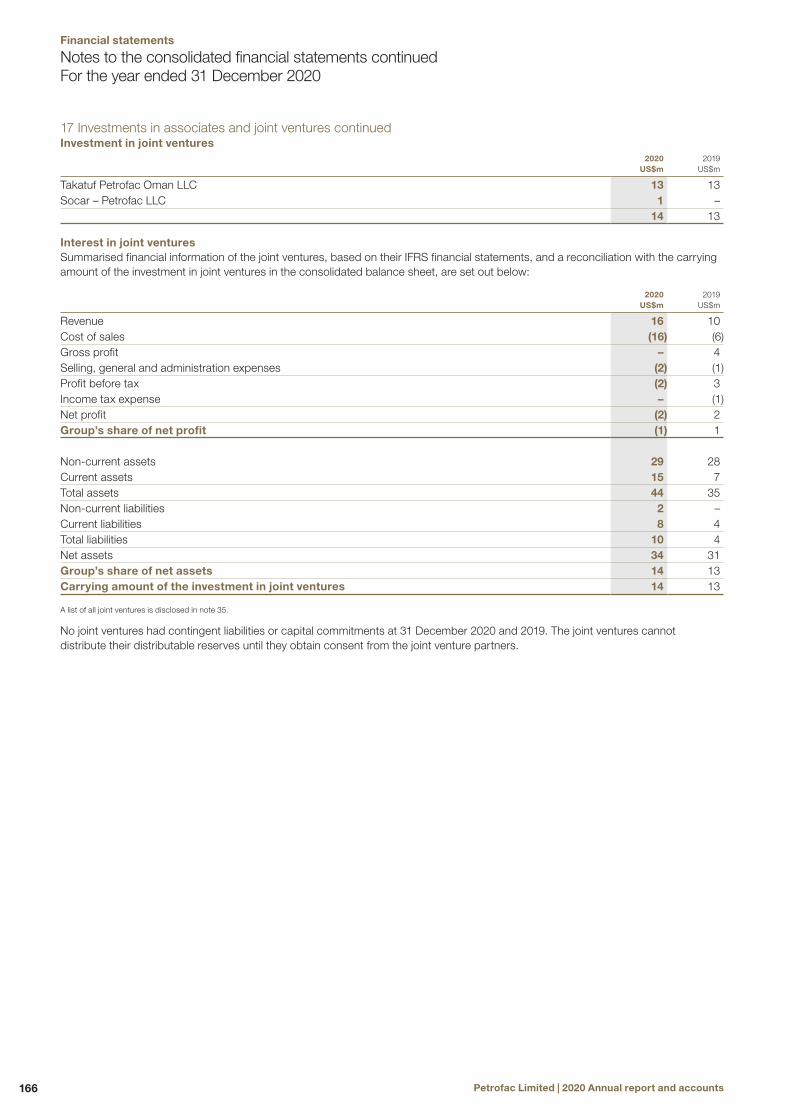
17 Investments in associates and joint ventures continuedInvestment in joint ventures
2020 US$m
2019 US$m
Takatuf Petrofac Oman LLC 13 13Socar – Petrofac LLC 1 –
14 13
Interest in joint venturesSummarised financial information of the joint ventures, based on their IFRS financial statements, and a reconciliation with the carrying amount of the investment in joint ventures in the consolidated balance sheet, are set out below:
2020 US$m
2019 US$m
Revenue 16 10Cost of sales (16) (6)Gross profit – 4Selling, general and administration expenses (2) (1)Profit before tax (2) 3Income tax expense – (1)Net profit (2) 2Group’s share of net profit (1) 1
Non-current assets 29 28Current assets 15 7Total assets 44 35Non-current liabilities 2 –Current liabilities 8 4Total liabilities 10 4Net assets 34 31Group’s share of net assets 14 13Carrying amount of the investment in joint ventures 14 13
A list of all joint ventures is disclosed in note 35.
No joint ventures had contingent liabilities or capital commitments at 31 December 2020 and 2019. The joint ventures cannot distribute their distributable reserves until they obtain consent from the joint venture partners.
Notes to the consolidated financial statements continuedFor the year ended 31 December 2020
Petrofac Limited | 2020 Annual report and accounts166
Financial statements

18 Other financial assets and other financial liabilities
Other financial assets Classification2020
US$m2019
US$m
Non-currentReceivable from joint operation partners for leases Amortised cost 80 170Deferred consideration receivable from Ithaca Energy UK Ltd Amortised cost 48 45Advances relating to decommissioning provision Amortised cost 28 23Bank guarantee receivable Amortised cost – 22Receivable from Shanghai Zhenhua Heavy Industries Co Ltd Amortised cost 5 5Contingent consideration arising from the disposal of Group’s operations in Mexico (note 15)
Fair value through profit and loss41 42
Pánuco contingent consideration Fair value through profit and loss – 8Forward currency contracts designated as cash flow hedges (note 34) Designated as cash flow hedges – 1
202 316CurrentReceivable from joint operation partners for leases Amortised cost 97 89Deferred consideration receivable from Ithaca Energy UK Ltd (note 11b) Amortised cost – 19Restricted cash Amortised cost 44 8Contingent consideration receivable from Ithaca Energy UK Ltd (note 11b) Fair value through profit and loss – 9Forward currency contracts not designated as hedges (note 34) Fair value through profit and loss 3 5Forward currency contracts designated as cash flow hedges (note 34) Designated as cash flow hedges 4 5
148 135Other financial liabilities
Non-currentLease liabilities (note 30) Loans and borrowings 163 298Contingent consideration payable arising from acquisition of W&W Energy Services Inc
Fair value through profit and loss3 15
Others Amortised cost – 2166 315
CurrentLease liabilities (note 30) Loans and borrowings 150 140Contingent consideration payable arising from acquisition of W&W Energy Services Inc Fair value through profit and loss 1 –Interest payable Loans and borrowings 2 5Forward currency contracts not designated as hedges (note 34) Fair value through profit and loss 17 13Forward currency contracts designated as cash flow hedges (note 34) Designated as cash flow hedges 9 6Interest rate swap Designated as cash flow hedges – 2
179 166
Receivable from joint operation partners for leasesThe current and non-current receivable from joint operation partners represented 70% of the lease liability in respect of oil and gas facilities, office building, vehicles and transport vessels in Malaysia that are recognised 100% in the consolidated balance sheet. This treatment is necessary to reflect the legal position of the Group as the contracting counterparty for such leases. The Group’s 30% share of this liability at 31 December 2020 was US$76m (2019: US$111m). At 31 December 2020, management concluded that no expected credit loss allowance against the receivable from joint operation partners for leases was necessary, since under the joint operating agreement any default by the joint arrangement partners is fully recoverable through a recourse available to the non-defaulting partner through a transfer or an assignment of the defaulting partner’s equity interest.
Strateg
ic repo
rtG
overn
ance
Finan
cial statemen
ts
167Petrofac Limited | 2020 Annual report and accounts
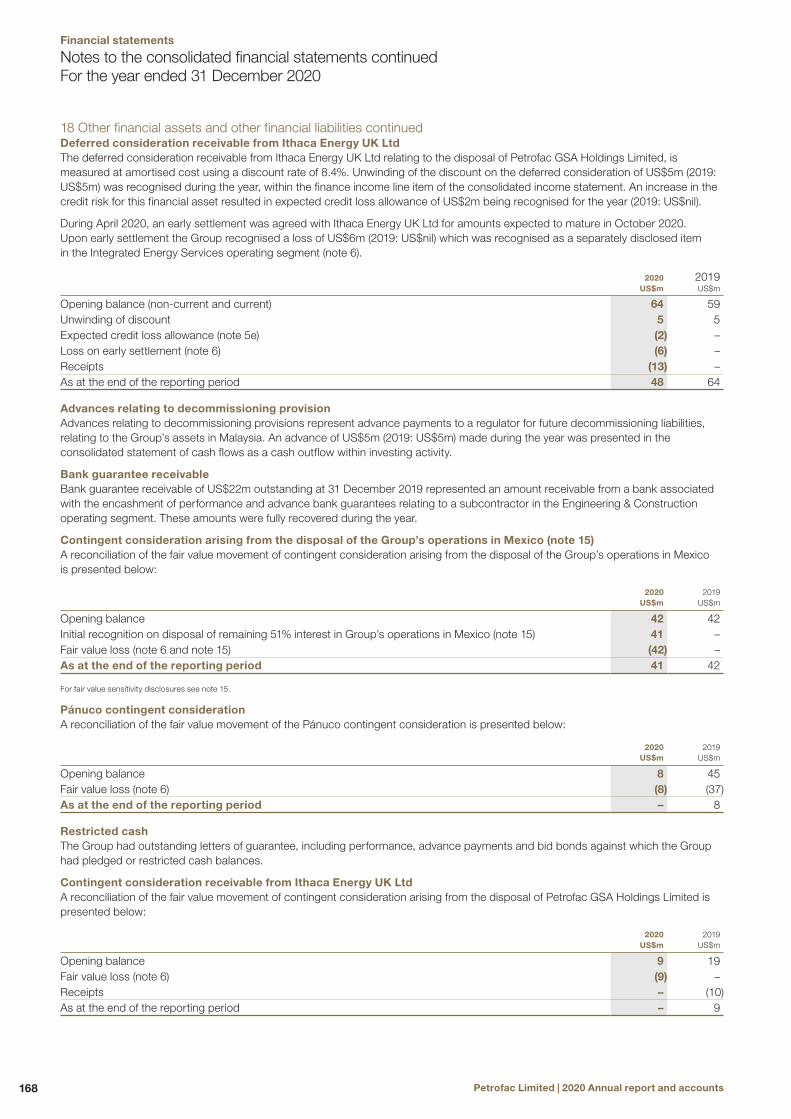
18 Other financial assets and other financial liabilities continuedDeferred consideration receivable from Ithaca Energy UK LtdThe deferred consideration receivable from Ithaca Energy UK Ltd relating to the disposal of Petrofac GSA Holdings Limited, is measured at amortised cost using a discount rate of 8.4%. Unwinding of the discount on the deferred consideration of US$5m (2019: US$5m) was recognised during the year, within the finance income line item of the consolidated income statement. An increase in the credit risk for this financial asset resulted in expected credit loss allowance of US$2m being recognised for the year (2019: US$nil).
During April 2020, an early settlement was agreed with Ithaca Energy UK Ltd for amounts expected to mature in October 2020. Upon early settlement the Group recognised a loss of US$6m (2019: US$nil) which was recognised as a separately disclosed item in the Integrated Energy Services operating segment (note 6).
2020 US$m
2019 US$m
Opening balance (non-current and current) 64 59Unwinding of discount 5 5Expected credit loss allowance (note 5e) (2) –Loss on early settlement (note 6) (6) –Receipts (13) –As at the end of the reporting period 48 64
Advances relating to decommissioning provision Advances relating to decommissioning provisions represent advance payments to a regulator for future decommissioning liabilities, relating to the Group’s assets in Malaysia. An advance of US$5m (2019: US$5m) made during the year was presented in the consolidated statement of cash flows as a cash outflow within investing activity.
Bank guarantee receivable Bank guarantee receivable of US$22m outstanding at 31 December 2019 represented an amount receivable from a bank associated with the encashment of performance and advance bank guarantees relating to a subcontractor in the Engineering & Construction operating segment. These amounts were fully recovered during the year.
Contingent consideration arising from the disposal of the Group’s operations in Mexico (note 15)A reconciliation of the fair value movement of contingent consideration arising from the disposal of the Group’s operations in Mexico is presented below:
2020 US$m
2019 US$m
Opening balance 42 42Initial recognition on disposal of remaining 51% interest in Group’s operations in Mexico (note 15) 41 –Fair value loss (note 6 and note 15) (42) –As at the end of the reporting period 41 42
For fair value sensitivity disclosures see note 15.
Pánuco contingent consideration A reconciliation of the fair value movement of the Pánuco contingent consideration is presented below:
2020 US$m
2019 US$m
Opening balance 8 45Fair value loss (note 6) (8) (37)As at the end of the reporting period – 8
Restricted cashThe Group had outstanding letters of guarantee, including performance, advance payments and bid bonds against which the Group had pledged or restricted cash balances.
Contingent consideration receivable from Ithaca Energy UK LtdA reconciliation of the fair value movement of contingent consideration arising from the disposal of Petrofac GSA Holdings Limited is presented below:
2020 US$m
2019 US$m
Opening balance 9 19Fair value loss (note 6) (9) –Receipts – (10)As at the end of the reporting period – 9
Notes to the consolidated financial statements continuedFor the year ended 31 December 2020
Petrofac Limited | 2020 Annual report and accounts168
Financial statements
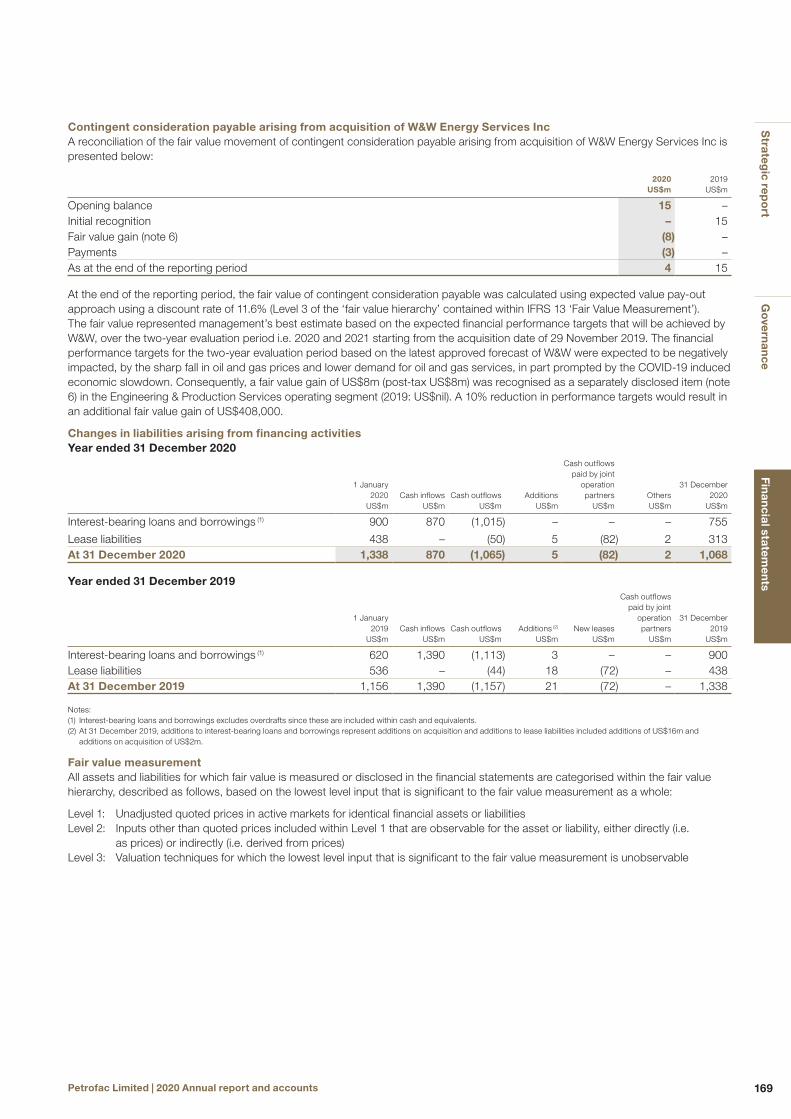
Contingent consideration payable arising from acquisition of W&W Energy Services IncA reconciliation of the fair value movement of contingent consideration payable arising from acquisition of W&W Energy Services Inc is presented below:
2020 US$m
2019 US$m
Opening balance 15 –Initial recognition – 15Fair value gain (note 6) (8) –Payments (3) –As at the end of the reporting period 4 15
At the end of the reporting period, the fair value of contingent consideration payable was calculated using expected value pay-out approach using a discount rate of 11.6% (Level 3 of the ‘fair value hierarchy’ contained within IFRS 13 ‘Fair Value Measurement’). The fair value represented management’s best estimate based on the expected financial performance targets that will be achieved by W&W, over the two-year evaluation period i.e. 2020 and 2021 starting from the acquisition date of 29 November 2019. The financial performance targets for the two-year evaluation period based on the latest approved forecast of W&W were expected to be negatively impacted, by the sharp fall in oil and gas prices and lower demand for oil and gas services, in part prompted by the COVID-19 induced economic slowdown. Consequently, a fair value gain of US$8m (post-tax US$8m) was recognised as a separately disclosed item (note 6) in the Engineering & Production Services operating segment (2019: US$nil). A 10% reduction in performance targets would result in an additional fair value gain of US$408,000.
Changes in liabilities arising from financing activitiesYear ended 31 December 2020
1 January 2020
US$mCash inflows
US$mCash outflows
US$mAdditions
US$m
Cash outflows paid by joint
operation partners
US$mOthersUS$m
31 December 2020
US$m
Interest-bearing loans and borrowings (1) 900 870 (1,015) – – – 755
Lease liabilities 438 – (50) 5 (82) 2 313At 31 December 2020 1,338 870 (1,065) 5 (82) 2 1,068
Year ended 31 December 2019
1 January 2019
US$mCash inflows
US$mCash outflows
US$mAdditions (2)
US$mNew leases
US$m
Cash outflows paid by joint
operation partners
US$m
31 December 2019
US$m
Interest-bearing loans and borrowings (1) 620 1,390 (1,113) 3 – – 900Lease liabilities 536 – (44) 18 (72) – 438At 31 December 2019 1,156 1,390 (1,157) 21 (72) – 1,338
Notes:(1) Interest-bearing loans and borrowings excludes overdrafts since these are included within cash and equivalents.(2) At 31 December 2019, additions to interest-bearing loans and borrowings represent additions on acquisition and additions to lease liabilities included additions of US$16m and
additions on acquisition of US$2m.
Fair value measurementAll assets and liabilities for which fair value is measured or disclosed in the financial statements are categorised within the fair value hierarchy, described as follows, based on the lowest level input that is significant to the fair value measurement as a whole:
Level 1: Unadjusted quoted prices in active markets for identical financial assets or liabilitiesLevel 2: Inputs other than quoted prices included within Level 1 that are observable for the asset or liability, either directly (i.e.
as prices) or indirectly (i.e. derived from prices)Level 3: Valuation techniques for which the lowest level input that is significant to the fair value measurement is unobservable
Strateg
ic repo
rtG
overn
ance
Finan
cial statemen
ts
169Petrofac Limited | 2020 Annual report and accounts

18 Other financial assets and other financial liabilities continuedSet out below is a comparison of the carrying amounts and fair values of financial instruments as at 31 December:
Level Carrying amount Fair value
2020US$m
2019 US$m
2020 US$m
2019US$m
Financial assetsMeasured at amortised costRestricted cash Level 2 44 8 44 8Receivable from joint operation partners for leases Level 2 177 259 177 259Deferred consideration receivable from Ithaca Energy UK Ltd Level 2 48 64 48 64Bank guarantee receivable Level 2 – 22 – 22Receivable from Shanghai Zhenhua Heavy Industries Co Ltd Level 2 5 5 5 5Advances relating to provision for decommissioning liability Level 2 28 23 28 23Measured at fair value through profit and lossPánuco contingent consideration Level 3 – 8 – 8Contingent consideration arising from the disposal of the Group’s operations in Mexico (note 15) Level 3 41 42 41 42Contingent consideration receivable from Ithaca Energy UK Ltd Level 3 – 9 – 9Forward currency contracts – undesignated Level 2 3 5 3 5Designated as cash flow hedgesForward currency contracts Level 2 4 6 4 6Financial liabilitiesMeasured at amortised costTerm loans Level 2 250 300 250 300Revolving credit facility Level 2 505 599 505 600Bank overdrafts Level 2 45 111 45 111Lease liabilities Level 2 313 438 313 438Interest payable Level 2 2 5 2 5Others Level 2 – 2 – 2Measured at fair value through profit and lossContingent consideration payable Level 3 4 15 4 15Forward currency contracts – undesignated Level 2 17 13 17 13Designated as cash flow hedgesForward currency contracts Level 2 9 6 9 6Interest rate swap Level 2 – 2 – 2
When the fair values of financial assets and financial liabilities recognised in the consolidated balance sheet cannot be measured based on quoted prices in active markets, their fair value is measured using valuation techniques, including discounted cash flow (“DCF”) models. The inputs to these models are taken from observable sources where possible, but where such information is not available, a degree of judgement is required in establishing fair values. Judgements include considerations of inputs such as liquidity risk, credit risk and volatility. Changes in assumptions relating to these factors could affect the recognised fair value of financial instruments and are discussed further below.
— The fair value of the contingent consideration arising from the disposal of the Group’s operations in Mexico at 31 December 2020 amounted to US$41m. The estimation of the fair value of the contingent consideration reflected management’s expectation of (i) the final determination of the completion consideration amount; (ii) proceeds associated with a ruling by the Tax Administration Service in Mexico; and (iii) achieving the contingent consideration criteria in the SPA associated with the migration of Magallanes and Arenque Production Enhancement Contracts to Production Sharing Contracts. Management applied risk factors (a Level 3 measurement of the ‘fair value hierarchy’ contained within IFRS 13 ‘Fair Value Measurement’) to the maximum contingent consideration amounts receivable to estimate the fair value of the contingent consideration, see note 15.
Notes to the consolidated financial statements continuedFor the year ended 31 December 2020
Petrofac Limited | 2020 Annual report and accounts170
Financial statements

The following methods and assumptions were used to estimate the fair values for material level 3 financial instruments:
— The fair value of deferred consideration receivable from Ithaca Energy UK Ltd is equivalent to its amortised cost determined as the present value of discounted future cash flows using the discount rate of 8.4%. — The fair value of long-term interest-bearing loans and borrowings, lease liabilities and receivable from joint operation partners for leases are equivalent to their amortised costs determined as the present value of discounted future cash flows using the effective interest rate. — The contingent consideration payable of US$4m arising from acquisition of W&W Energy Services Inc, calculated using expected value pay-out approach using a discount rate of 11.6% (Level 3 of the ‘fair value hierarchy’ contained within IFRS 13 ‘Fair Value Measurement’), represented management’s best estimate based on the expected financial performance targets that will be achieved by W&W, over the two-year evaluation period starting from the acquisition date of 29 November 2019.
19 Inventories2020
US$m2019
US$m
Project materials 4 15Crude oil 3 1Stores and raw materials 1 1
8 17
Project materials of US$5m (2019: US$nil) were written-off during the year relating to the Engineering & Construction operating segment within cost of sales in the consolidated income statement. Inventories expensed of US$47m (2018: US$77m) were included within cost of sales in the consolidated income statement.
20 Trade and other receivables2020
US$m2019
US$m
Trade receivables 550 615Advances to vendors and subcontractors 197 325Prepayments and deposits 32 37Receivables from joint operation partners 44 52Other receivables 53 73
876 1,102
The decrease in trade receivables is mainly due to a receipt of US$115m from three customers in the Engineering & Construction operating segment. This decrease was partially offset by a net increase in trade receivables of US$49m from one customer in the Engineering & Construction operating segment. At 31 December 2020, the Group had an expected credit loss (“ECL”) allowance of US$24m (2019: US$26m) against an outstanding trade receivable balance of US$574m (2019: US$641m).
Trade receivables are non-interest bearing and credit terms are generally granted to customers on 30 to 60 days basis. Trade receivables are reported net of ECL allowance in accordance with IFRS 9 ‘Financial Instruments’.
The movement in the ECL allowance during 2020 and 2019 against trade receivables was as follows:
2020 US$m
2019US$m
At 1 January 26 21Transfer to assets held for sale (note 15) – (1)Write-off (2) (2)ECL charge (note 5e) – 8At 31 December 24 26
At 31 December 2020, the analysis of trade receivables is as follows:
Number of days past due
< 30 days US$m
31–60 days US$m
61–90 days US$m
91–120 days US$m
121–360 days US$m
> 360 days US$m
Total US$m
ECL rate 0.1% 0.2% 0.1% 1.4% 13.8% 92.1%Gross trade receivables 372 92 48 15 26 21 574Less: ECL allowance – – – – (4) (20) (24)Net trade receivables at 31 December 2020 372 92 48 15 22 1 550
Strateg
ic repo
rtG
overn
ance
Finan
cial statemen
ts
171Petrofac Limited | 2020 Annual report and accounts

20 Trade and other receivables continuedAt 31 December 2019, the analysis of trade receivables is as follows:
Number of days past due
< 30 days US$m
31–60 days US$m
61–90 days US$m
91–120 days US$m
121–360 days US$m
> 360 days US$m
Total US$m
ECL rate 0.5% 0.6% 2.6% 10.9% 34.2% 68.0%Gross trade receivables 476 98 21 7 14 25 641Less: ECL allowance (2) (1) (1) (1) (4) (17) (26)Net trade receivables at 31 December 2019 474 97 20 6 10 8 615
Advances provided to vendors and subcontractors represent payments made to certain vendors and subcontractors for projects in progress, that will be adjusted against the future progress billings by the vendors and subcontractors. The decrease in advances provided to vendors and subcontractors of US$128m was mainly due to settlement of advances and accrued contract expenses in the ordinary course of business with a subcontractor in the Engineering & Construction operating segment.
Receivables from joint operation partners are recoverable amounts from partners on Block PM304 and on consortium contracts in the Engineering & Construction operating segment.
Other receivables mainly consist of Value Added Tax recoverable of US$35m (2019: US$44m).
An ECL allowance of US$2m (note 5e) was recognised against other receivables (2019: US$6m against amounts receivable from joint operation partners)
All trade and other receivables except ‘advances provided to vendors and subcontractors’ are expected to be settled in cash. Certain trade and other receivables will be settled in cash using currencies other than the reporting currency of the Group, and will be largely paid in sterling, euros and Kuwaiti dinars.
21 Contract assets and contract liabilitiesa. Contract assets
2020 US$m
2019 US$m
Work in progress 1,414 1,754Retention receivables 215 228Accrued income 23 82
1,652 2,064
At 31 December 2020, work in progress included assessed variation orders pending customer approval of US$276m (2019: US$341m).
b. Contract liabilities2020
US$m2019
US$m
Billings in excess of costs and estimated earnings 74 147Advances received from customers 46 126
120 273
At 31 December 2020, billings in excess of costs and estimated earnings included an offset for assessed variation orders pending customer approval of US$29m (2019: US$nil).
Revenue of US$202m (2019: US$492m) was recognised during the year from amounts included in contract liabilities at the beginning of the year.
c. Expected credit loss (“ECL”) allowance on contract assetsThe below table provides information on ECL allowance for each contract asset category at the end of reporting periods:
As at 31 December 2020
Work in progress
US$m
Retention receivables
US$m
Accrued income US$m
Total current contract
assets US$m
ECL rate 0.6% 14.1% 12.3%Gross carrying amount 1,423 250 26 1,699Less: ECL allowance (9) (35) (3) (47)Net contract assets at 31 December 2020 1,414 215 23 1,652
Notes to the consolidated financial statements continuedFor the year ended 31 December 2020
Petrofac Limited | 2020 Annual report and accounts172
Financial statements

As at 31 December 2019
Non-current contract
assetsUS$m
Work in progress
US$m
Retention receivables
US$m
Accrued income US$m
Total current contract
assets US$m
ECL rate 0.3% 12.6% 5.6%Estimated total gross carrying amount – 1,760 261 87 2,108Less: ECL allowance – (6) (33) (5) (44)Net contract assets at 31 December 2019 – 1,754 228 82 2,064
The movement in ECL allowance during 2020 and 2019 against each contract asset category is as follows:
Year ended 31 December 2020
Non-current contract
assetsUS$m
Work in progress
US$m
Retention receivables
US$m
Accrued incomeUS$m
Totalcurrent
contract assetsUS$m
At 1 January 2019 4 5 34 2 41Transferred to current (4) – – 4 4Transferred to assets held for sale – – – (3) (3)Charge/(reversal) for the year (note 5e) – 1 (1) 2 2At 1 January 2020 – 6 33 5 44Charge for the year (note 5e) – 3 2 – 5Write-off – – – (2) (2)At 31 December 2020 – 9 35 3 47
d. Contract balances arising from contracts with customersThe Group’s contract balances at the end of 31 December 2020 are as follows:
2020 US$m
2019 US$m
Trade receivables (note 20) 550 615Contract assets 1,652 2,064Contract liabilities 120 273
Trade receivables are non-interest bearing and credit terms are generally between 30 to 60 days. Trade receivables represent the Group’s right to consideration that is unconditional (i.e. only the passage of time is required before payment of the consideration is due).
During April 2020, an early settlement relating to a contract asset was agreed with Ithaca Energy UK Ltd for amounts expected to mature in October 2020. Upon early settlement the Group recognised a gain of US$1m (2019: US$nil) which was recognised as a separately disclosed item in the Engineering & Production Services operating segment (note 6).
The Group recognised an ECL allowance on trade receivables and contract assets arising from contracts with customers, included within expected credit loss allowance line item of the consolidated income statement, amounting to US$5m for the year ended 31 December 2020 (2019: US$10m).
Revenue recognised during the year from performance obligations satisfied in previous years, resulting from a change in transaction price, amounted to US$118m (2019: US$358m).
22 Cash and short-term deposits2020
US$m2019
US$m
Cash at bank and in hand 556 712Short-term deposits 129 314ECL allowance (1) (1)Cash and short-term deposits 684 1,025
Short-term deposits are made for varying periods of between one day and three months depending on the immediate cash requirements of the Group and earn interest at respective short-term deposit rates. The fair value of cash and bank balances is US$684m (2019: US$1,025m).
Strateg
ic repo
rtG
overn
ance
Finan
cial statemen
ts
173Petrofac Limited | 2020 Annual report and accounts
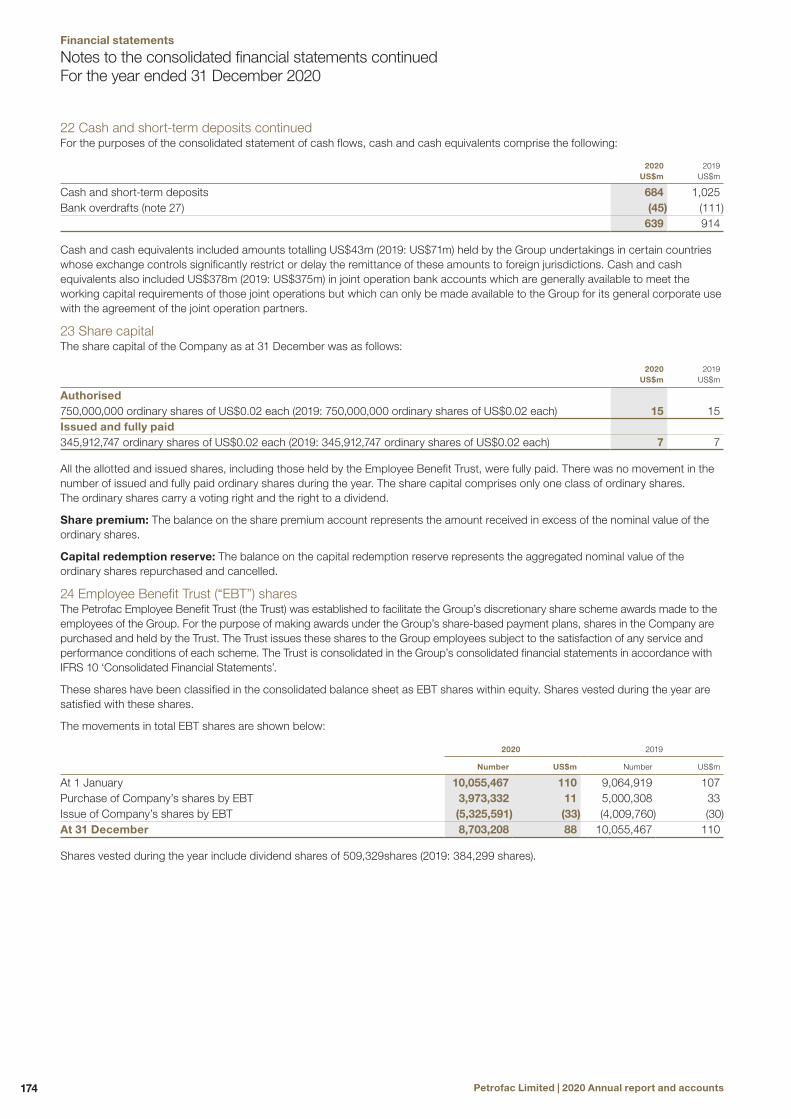
22 Cash and short-term deposits continuedFor the purposes of the consolidated statement of cash flows, cash and cash equivalents comprise the following:
2020 US$m
2019 US$m
Cash and short-term deposits 684 1,025Bank overdrafts (note 27) (45) (111)
639 914
Cash and cash equivalents included amounts totalling US$43m (2019: US$71m) held by the Group undertakings in certain countries whose exchange controls significantly restrict or delay the remittance of these amounts to foreign jurisdictions. Cash and cash equivalents also included US$378m (2019: US$375m) in joint operation bank accounts which are generally available to meet the working capital requirements of those joint operations but which can only be made available to the Group for its general corporate use with the agreement of the joint operation partners.
23 Share capitalThe share capital of the Company as at 31 December was as follows:
2020 US$m
2019 US$m
Authorised750,000,000 ordinary shares of US$0.02 each (2019: 750,000,000 ordinary shares of US$0.02 each) 15 15Issued and fully paid345,912,747 ordinary shares of US$0.02 each (2019: 345,912,747 ordinary shares of US$0.02 each) 7 7
All the allotted and issued shares, including those held by the Employee Benefit Trust, were fully paid. There was no movement in the number of issued and fully paid ordinary shares during the year. The share capital comprises only one class of ordinary shares. The ordinary shares carry a voting right and the right to a dividend.
Share premium: The balance on the share premium account represents the amount received in excess of the nominal value of the ordinary shares.
Capital redemption reserve: The balance on the capital redemption reserve represents the aggregated nominal value of the ordinary shares repurchased and cancelled.
24 Employee Benefit Trust (“EBT”) sharesThe Petrofac Employee Benefit Trust (the Trust) was established to facilitate the Group’s discretionary share scheme awards made to the employees of the Group. For the purpose of making awards under the Group’s share-based payment plans, shares in the Company are purchased and held by the Trust. The Trust issues these shares to the Group employees subject to the satisfaction of any service and performance conditions of each scheme. The Trust is consolidated in the Group’s consolidated financial statements in accordance with IFRS 10 ‘Consolidated Financial Statements’.
These shares have been classified in the consolidated balance sheet as EBT shares within equity. Shares vested during the year are satisfied with these shares.
The movements in total EBT shares are shown below:
2020 2019
Number US$m Number US$m
At 1 January 10,055,467 110 9,064,919 107Purchase of Company’s shares by EBT 3,973,332 11 5,000,308 33Issue of Company’s shares by EBT (5,325,591) (33) (4,009,760) (30)At 31 December 8,703,208 88 10,055,467 110
Shares vested during the year include dividend shares of 509,329shares (2019: 384,299 shares).
Notes to the consolidated financial statements continuedFor the year ended 31 December 2020
Petrofac Limited | 2020 Annual report and accounts174
Financial statements

25 Share-based payment plansPerformance Share Plan (“PSP”)Under the PSP, share awards are granted to Executive Directors and a restricted number of other senior executives of the Group. The shares vest at the end of three years, subject to continued employment and the achievement of certain pre-defined and independent market and non-market-based performance conditions. The market performance-based element of PSP awards is 70% dependent on the total shareholder return (TSR) of the Group compared with an index composed of selected relevant companies. The fair value of the shares vesting under this portion of the award is determined by an independent valuer using a Monte Carlo simulation model taking into account the terms and conditions of the plan rules and using the following assumptions at the date of grant:
Executive Directors
2020 awards
Other participants 2020 awards
Executive Directors
2019 awards
Other participants
2019 awardsAll participants
2018 awardsAll participants
2017 awards
Expected share price volatility (based on median of comparator group’s three-year volatilities) 51.4% 51.4% 36.2% 36.2% 37.7% 39.1%Share price correlation with comparator group 13.5% 13.5% 15.8% 15.8% 22.3% 26.6%Risk-free interest rate 0.2% 0.2% 0.9% 0.9% 0.9% 0.2%Expected life of share award 3 years 3 years 3 years 3 years 3 years 3 yearsFair value of TSR portion 145p 168p 211p 264p 356p 223p
The non-market-based condition governing the vesting of the remaining 30% of the PSP awards is subject to achieving certain strategic targets, including Engineering & Construction operating segment net margin, new order intake, return on capital employed, cash conversion, etc. over a three-year period. The fair value of the equity-settled award relating to the non-market-based condition is estimated, based on the quoted closing market price of the Company’s ordinary shares at the date of grant with an assumed annual vesting rate built into the calculation over the three-year vesting period of the plan and the estimated vesting rate for the achievement of strategic targets.
Deferred Bonus Share Plan (“DBSP”)Under the DBSP, selected employees are required to defer a proportion of their annual cash bonus into Company shares (“Invested Shares”). Following such an award, the Company will generally grant the participant an additional award of shares (“Matching Shares”) bearing a specified ratio to the number of Invested Shares, typically a 1:1 ratio. Subject to a participant’s continued employment, Invested and Matching Share awards vest one-third on the first anniversary of the grant, one-third on the second anniversary and the final proportion on the third anniversary of the grant date.
At the end of the reporting period, the value of bonuses to be settled by shares cannot be determined until the Remuneration Committee has approved the portion of the employee bonuses to be settled in shares. Once the portion of the bonus to be settled in shares is determined, the final bonus liability to be settled in shares is transferred to the share-based payments reserve. The costs relating to Matching Shares are recognised over the corresponding vesting period and the fair values of the equity-settled Matching Shares granted to employees is based on the quoted closing market price at the date of grant with the charge to the consolidated income statement adjusted to reflect the expected vesting rate of the plan.
Share Incentive Plan (“SIP”)All UK employees, including UK Executive Directors, are eligible to participate in the SIP. Employees may invest up to £1,800 per tax year of gross salary (or, if lower, 10% of salary) to purchase ordinary shares in the Company. There is no holding period for these shares.
Restricted Share Plan (“RSP”)Selected employees are allocated grants of shares on an ad hoc basis. The RSP is primarily, but not exclusively, used to make awards to individuals who join the Group part way through the year, having left accrued benefits with a previous employer. The fair values of the awards granted under the RSP at various grant dates during the year are based on the quoted market price at the date of grant adjusted for an assumed vesting rate over the relevant vesting period.
Share-based payment plans informationThe details of the fair values and assumed vesting rates of the share-based payment plans are below:
PSP (non-market based condition) DBSP RSP
Executive Directors Other participants
Fair value per share
Assumed vesting rate
Fair value per share
Assumed vesting rate
Fair value per share
Assumed vesting rate
Fair value per share
Assumed vesting rate
2020 awards 250p 31.5% 271p 31.5% 271p 95.0% 126p 95.0%2019 awards 364p 20.0% 455p 20.0% 455p 90.3% 394p 90.3%2018 awards 412p 50.0% 515p 50.0% 466p 85.7% 560p 85.7%2017 awards 353p 50.7% 441p 50.7% 839p 88.1% 572p 100.0%
Strateg
ic repo
rtG
overn
ance
Finan
cial statemen
ts
175Petrofac Limited | 2020 Annual report and accounts

25 Share-based payment plans continuedThe following table shows the movements in the number of shares held under the share-based payment plans outstanding but not exercisable:
PSP DBSP RSP Total
2020 Number
2019 Number
2020Number(1)
2019 Number (1)
2020 Number
2019 Number
2020 Number
2019 Number
Outstanding at 1 January 3,906,880 2,882,006 7,289,952 6,888,262 1,725,387 873,051 12,922,219 10,643,319Granted during the year 2,656,318 1,725,782 2,292,388 4,280,064 1,588,645 1,250,845 6,537,351 7,256,691Vested during the year (160,305) – (3,994,631) (3,303,791) (661,331) (365,516) (4,816,267) (3,669,307)Forfeited during the year (1,762,730) (700,908) (620,057) (574,583) (173,151) (32,993) (2,555,938) (1,308,484)Outstanding at 31 December 4,640,163 3,906,880 4,967,652 7,289,952 2,479,550 1,725,387 12,087,365 12,922,219
Note: (1) Includes Invested and Matching Shares.
The number of shares still outstanding but not exercisable at 31 December for each award is as follows:
PSP DBSP RSP Total
2020 Number
2019 Number
2020Number(1)
2019 Number (1)
2020 Number
2019Number
2020Number
2019 Number
2020 awards 2,087,754 – 1,974,586 – 1,588,645 – 5,650,985 –2019 awards 1,445,556 1,719,489 1,990,416 3,880,740 707,821 1,247,488 4,143,793 6,847,7172018 awards 1,106,853 1,137,589 1,002,650 2,625,711 183,084 446,381 2,292,587 4,209,6812017 awards – 1,049,802 – 783,501 – 31,518 – 1,864,821Total awards 4,640,163 3,906,880 4,967,652 7,289,952 2,479,550 1,725,387 12,087,365 12,922,219
Note: (1) Includes Invested and Matching Shares.
The average share price of the Company’s shares during 2020 was US$2.54, sterling equivalent of £1.99 (2019: US$5.55, sterling equivalent of £4.34).
The number of outstanding shares excludes the dividend shares shown below:
PSP DBSP RSP Total
2020 Number
2019 Number
2020Number(1)
2019 Number (1)
2020 Number
2019 Number
2020 Number
2019 Number
Dividend shares outstanding at 31 December 186,316 756,250 261,178 411,462 22,792 57,525 470,286 1,225,237
Note: (1) Includes Invested and Matching Shares.
The charge in respect of share-based payment plans recognised in the consolidated income statement is as follows:
PSP DBSP1 RSP Total
2020 US$m
2019 US$m
2020 US$m
2019 US$m
2020 US$m
2019 US$m
2020 US$m
2019 US$m
Share-based payment charge (2) 4 3 7 12 4 3 15 18
Note: (2) Represents the charge on Matching Shares only.
The Group recognised a share-based payment charge of US$15m (2019: US$18m) in the consolidated income statement relating to the above employee share-based payment plans (note 5c) which was transferred to the share-based payments reserve together with US$4m of the accrued bonus liability for the year ended 31 December 2019 (2019: 2018 bonus of US$12m).
For further details on the above employee share-based payment plans, refer to pages 110, 111, 113, and 116 of the Directors’ remuneration report.
Notes to the consolidated financial statements continuedFor the year ended 31 December 2020
Petrofac Limited | 2020 Annual report and accounts176
Financial statements

26 Other reservesNet unrealised gains/(losses) on derivatives
US$m
Foreign currency
translation US$m
Share-based payments
reserve US$m
Total US$m
Balance at 1 January 2019 13 (1) 83 95Net changes in fair value of derivatives and financial assets designated as cash flow hedges (2) – – (2)Foreign currency translation – (13) – (13)Issue of Company’s shares by Employee Benefit Trust – – (26) (26)Transfer to share-based payments reserve for Deferred Bonus Share Plan Invested Shares (note 25) – – 12 12Credit to equity for share-based payments charge (note 25) – – 18 18Balance at 31 December 2019 11 (14) 87 84Attributable to:Petrofac Limited shareholders 11 (14) 87 84Non-controlling interests – – – –Balance at 31 December 2019 11 (14) 87 84
Balance at 1 January 2020 11 (14) 87 84Net changes in fair value of derivatives and financial assets designated as cash flow hedges (15) – – (15)Foreign currency translation – (16) – (16)Foreign currency translation losses reclassified to the consolidated income statement – 3 – 3Issue of Company’s shares by Employee Benefit Trust – – (30) (30)Transfer to share-based payments reserve for Deferred Bonus Share Plan Invested Shares (note 25) – – 4 4Credit to equity for share-based payments charge (note 25) – – 15 15Balance at 31 December 2020 (4) (27) 76 45Attributable to:Petrofac Limited shareholders (4) (27) 76 45Non-controlling interests – – – –Balance at 31 December 2020 (4) (27) 76 45
Net unrealised gains/(losses) on derivativesThe portion of gains or losses on cash flow hedging instruments that are determined to be effective hedges is included within this reserve net of related deferred tax effects. During 2020 a fair value loss of US$15m (2019: US$2m fair value loss) was recognised within equity. When the hedged transaction occurs or is no longer forecast to occur, the gain or loss is transferred from equity to the consolidated income statement. Net losses of US$130,000 (2019: US$128,000 net losses) relating to foreign currency forward contracts and financial instruments designated as cash flow hedges were recognised in cost of sales line item in the consolidated income statement.
The forward currency points element and ineffective portion of derivative financial instruments relating to forward currency contracts designated as cash flow hedges amounting to US$5m (2019: US$11m) were recognised in cost of sales line item in the consolidated income statement.
Foreign currency translation reserveThe assets and liabilities of entities which have a non-United States dollar functional currency are translated into the Group’s reporting currency, United States dollar, at the exchange rate prevailing at the end of the reporting period. The foreign currency differences arising on the translation are recognised in other reserves in equity.
Share-based payments reserveThe share-based payments reserve is used to recognise the value of equity-settled share-based payments awarded to employees and transfers out of this reserve are made upon vesting of the original share awards.
The transfer of US$4m (2019: US$12m) into the share-based payments reserve reflected the transfer from accrued bonus liability within trade and other payables in the consolidated balance sheet which has been voluntarily elected or mandatorily obliged to be settled in shares as part of the Deferred Bonus Share Plan (note 25).
Strateg
ic repo
rtG
overn
ance
Finan
cial statemen
ts
177Petrofac Limited | 2020 Annual report and accounts
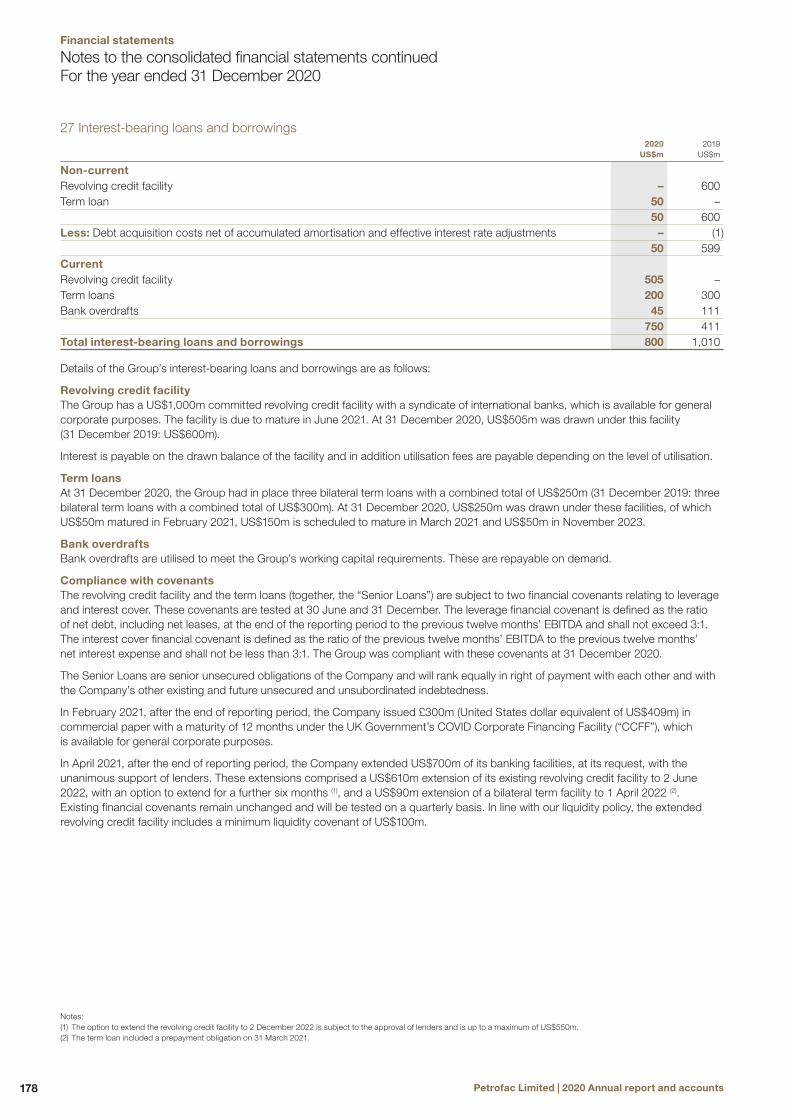
27 Interest-bearing loans and borrowings 2020
US$m2019
US$m
Non-currentRevolving credit facility – 600Term loan 50 –
50 600Less: Debt acquisition costs net of accumulated amortisation and effective interest rate adjustments – (1)
50 599CurrentRevolving credit facility 505 –Term loans 200 300Bank overdrafts 45 111
750 411Total interest-bearing loans and borrowings 800 1,010
Details of the Group’s interest-bearing loans and borrowings are as follows:
Revolving credit facilityThe Group has a US$1,000m committed revolving credit facility with a syndicate of international banks, which is available for general corporate purposes. The facility is due to mature in June 2021. At 31 December 2020, US$505m was drawn under this facility (31 December 2019: US$600m).
Interest is payable on the drawn balance of the facility and in addition utilisation fees are payable depending on the level of utilisation.
Term loansAt 31 December 2020, the Group had in place three bilateral term loans with a combined total of US$250m (31 December 2019: three bilateral term loans with a combined total of US$300m). At 31 December 2020, US$250m was drawn under these facilities, of which US$50m matured in February 2021, US$150m is scheduled to mature in March 2021 and US$50m in November 2023.
Bank overdraftsBank overdrafts are utilised to meet the Group’s working capital requirements. These are repayable on demand.
Compliance with covenantsThe revolving credit facility and the term loans (together, the “Senior Loans”) are subject to two financial covenants relating to leverage and interest cover. These covenants are tested at 30 June and 31 December. The leverage financial covenant is defined as the ratio of net debt, including net leases, at the end of the reporting period to the previous twelve months’ EBITDA and shall not exceed 3:1. The interest cover financial covenant is defined as the ratio of the previous twelve months’ EBITDA to the previous twelve months’ net interest expense and shall not be less than 3:1. The Group was compliant with these covenants at 31 December 2020.
The Senior Loans are senior unsecured obligations of the Company and will rank equally in right of payment with each other and with the Company’s other existing and future unsecured and unsubordinated indebtedness.
In February 2021, after the end of reporting period, the Company issued £300m (United States dollar equivalent of US$409m) in commercial paper with a maturity of 12 months under the UK Government’s COVID Corporate Financing Facility (“CCFF”), which is available for general corporate purposes.
In April 2021, after the end of reporting period, the Company extended US$700m of its banking facilities, at its request, with the unanimous support of lenders. These extensions comprised a US$610m extension of its existing revolving credit facility to 2 June 2022, with an option to extend for a further six months (1), and a US$90m extension of a bilateral term facility to 1 April 2022 (2). Existing financial covenants remain unchanged and will be tested on a quarterly basis. In line with our liquidity policy, the extended revolving credit facility includes a minimum liquidity covenant of US$100m.
Notes:(1) The option to extend the revolving credit facility to 2 December 2022 is subject to the approval of lenders and is up to a maximum of US$550m.(2) The term loan included a prepayment obligation on 31 March 2021.
Notes to the consolidated financial statements continuedFor the year ended 31 December 2020
Petrofac Limited | 2020 Annual report and accounts178
Financial statements

28 ProvisionsNon-current provisions
Other long-term employment
benefits provision US$m
Provision for decommissioning
US$mOther provisions
US$mTotal
US$m
At 1 January 2019 119 95 20 234Additions during the year 25 1 3 29Reclassified to liabilities associated with assets held for sale – (60) – (60)Paid during the year (18) – (6) (24)Transfer from accrued contract expenses 5 – 4 9Transfer to current provisions – – (4) (4)Unwinding of discount – 4 – 4Exchange difference – – 1 1At 1 January 2020 131 40 18 189Additions during the year 16 – 4 20Paid during the year (34) – (3) (37)Transfer to current provisions – – (3) (3)Unwinding of discount – 1 – 1Exchange difference – – 1 1At 31 December 2020 113 41 17 171
Other long-term employment benefits provisionLabour laws in the Middle East require employers to provide for other long-term employment benefits. These benefits are payable to employees on being transferred to another jurisdiction or on cessation of employment based on their final salary and number of years’ service. All amounts are unfunded. The long-term employment benefits provision is based on an independent specialist’s valuation model with the key underlying assumptions being as follows:
Senior employees Other employees
Average annual % salary increases 2% 2%Discount factor 1% 1%
Discount factor used represents the yield on US high-quality corporate bonds, with a duration corresponding to that of the liability at the end of the reporting period.
Provision for decommissioningThe decommissioning provision at the end of the reporting period relates to the Group’s obligation for the removal of facilities and restoration of Block PM304 in Malaysia.
The liability is discounted at a rate of 3.7% on Block PM304 (2019: 3.7%).
The unwinding of the discount is recognised in the finance expense (note 7) line item of the consolidated income statement. The Group estimates that the cash outflows associated with this provision will take place in 2026.
Other provisionsThe other provisions carrying amount at 31 December 2020 mainly represent claim amounts of US$8m (2019: US$7m) against the Group, which will be settled through its captive insurance company, Jermyn Insurance Company Limited, and US$2m (2019: US$4m) of disposal costs associated with the disposal of the JSD6000 installation vessel.
Strateg
ic repo
rtG
overn
ance
Finan
cial statemen
ts
179Petrofac Limited | 2020 Annual report and accounts
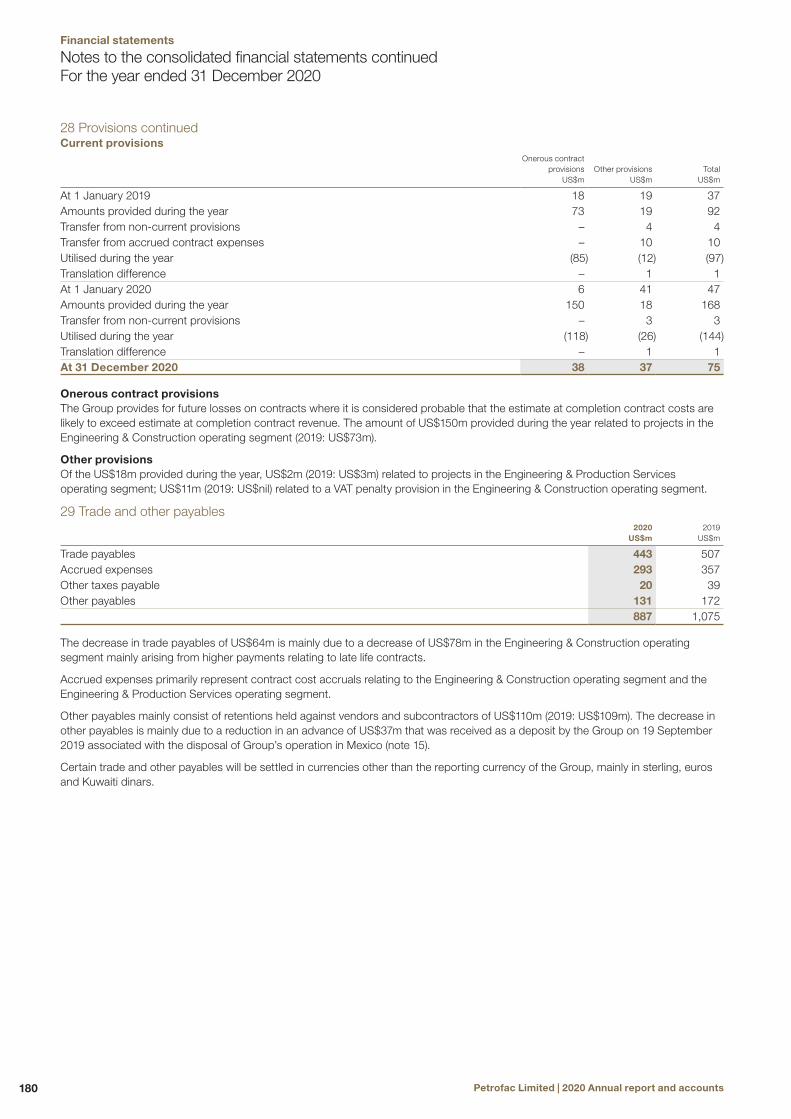
28 Provisions continuedCurrent provisions
Onerous contract provisions
US$mOther provisions
US$mTotal
US$m
At 1 January 2019 18 19 37Amounts provided during the year 73 19 92Transfer from non-current provisions – 4 4Transfer from accrued contract expenses – 10 10Utilised during the year (85) (12) (97)Translation difference – 1 1At 1 January 2020 6 41 47Amounts provided during the year 150 18 168Transfer from non-current provisions – 3 3Utilised during the year (118) (26) (144)Translation difference – 1 1At 31 December 2020 38 37 75
Onerous contract provisionsThe Group provides for future losses on contracts where it is considered probable that the estimate at completion contract costs are likely to exceed estimate at completion contract revenue. The amount of US$150m provided during the year related to projects in the Engineering & Construction operating segment (2019: US$73m).
Other provisionsOf the US$18m provided during the year, US$2m (2019: US$3m) related to projects in the Engineering & Production Services operating segment; US$11m (2019: US$nil) related to a VAT penalty provision in the Engineering & Construction operating segment.
29 Trade and other payables2020
US$m2019
US$m
Trade payables 443 507Accrued expenses 293 357Other taxes payable 20 39Other payables 131 172
887 1,075
The decrease in trade payables of US$64m is mainly due to a decrease of US$78m in the Engineering & Construction operating segment mainly arising from higher payments relating to late life contracts.
Accrued expenses primarily represent contract cost accruals relating to the Engineering & Construction operating segment and the Engineering & Production Services operating segment.
Other payables mainly consist of retentions held against vendors and subcontractors of US$110m (2019: US$109m). The decrease in other payables is mainly due to a reduction in an advance of US$37m that was received as a deposit by the Group on 19 September 2019 associated with the disposal of Group’s operation in Mexico (note 15).
Certain trade and other payables will be settled in currencies other than the reporting currency of the Group, mainly in sterling, euros and Kuwaiti dinars.
Notes to the consolidated financial statements continuedFor the year ended 31 December 2020
Petrofac Limited | 2020 Annual report and accounts180
Financial statements

30 LeasesThe Group has lease contracts for various items of property, plant and equipment. The Group’s obligations under its leases are secured by the lessor’s title to the leased assets. Generally, the Group is restricted from assigning and subleasing the leased assets.
The Group also has certain leases of office buildings with lease terms of 12 months or less and leases of office equipment with low value. The Group applies the ‘short-term lease’ and ‘lease of low-value assets’ recognition exemptions for these leases.
a. Right-of-use assetsThe Group recognises right-of-use assets, within property, plant and equipment line item of the consolidated balance sheet, at the commencement date of the lease (i.e. the date at which the underlying asset is available for use). The carrying amounts of right-of-use assets recognised and the movements during the period are disclosed in note 12.
b. Lease liabilitiesThe table below provides details of lease liabilities recognised within other financial liabilities line item of the consolidated balance sheet:
2020 US$m
2019 US$m
Lease liabilities at 1 January 438 536Additions 5 16Addition on acquisition – 2Interest 9 12Transfer to liabilities associated with assets held for sale – (2)Principal payments made by the Group (50) (44)Interest paid by the Group (9) (12)Principal payments made by joint operation partners (82) (72)Derecognised (1) –Translation difference 3 2At 31 December 313 438
The above lease liabilities included US$253m (2019: US$370m) of right-of-use assets relating to Block PM304 in Malaysia that are presented at 100%, which is necessary to reflect the legal position of the Group as the contracting entity for these leases. The leases relating to Block PM304 in Malaysia associated with oil and gas facilities include a renewal option of up to two years and a purchase option at the end of the lease term.
c. Amounts recognised in the consolidated income statement in respect of leases2020
US$m2019
US$m
Depreciation charge in respect of right-of-use assets (note 12) 26 32Finance expense recognised associated with lease liabilities (note 7) 9 12Lease expense recognised for short-term leases and leases for low-value assets 8 6
d. Future lease paymentsSet out below are the future lease payments in respect of leases for property, plant and equipment. These have remaining non-cancellable lease terms of between one and eight years. The discounted and undiscounted future minimum lease commitments as at 31 December 2020 are as follows:
Present value
US$m
Finance expense
US$m
Future minimum
lease payments
US$m
The commitments are as follows:Within one year 150 14 164After one year but not more than five years 142 21 163More than five years 21 3 24
313 38 351
Strateg
ic repo
rtG
overn
ance
Finan
cial statemen
ts
181Petrofac Limited | 2020 Annual report and accounts

30 Leases continuedThe discounted and undiscounted future minimum lease commitments as at 31 December 2019 are as follows:
Present valueUS$m
Finance expense
US$m
Future minimum
lease payments
US$m
The commitments are as follows:Within one year 140 23 163After one year but not more than five years 253 32 285More than five years 45 4 49
438 59 497
In April 2021, after the end of the reporting period, a lease in respect of a mobile offshore production unit (“MOPU“) that was due to expire on 30 April 2021 relating to Block PM304 in Malaysia was extended to 30 September 2026.
31 Commitments and contingent liabilitiesCommitmentsIn the normal course of business, the Group obtains surety bonds, letters of credit and guarantees, which are contractually required to secure performance, advance payment or in lieu of retentions being withheld. Some of these facilities are secured by issue of corporate guarantees by the Company and its subsidiaries in favour of the issuing banks.
At 31 December 2020, the Group had outstanding letters of credit, letters of guarantee, including performance, advance payments and bid bonds of US$3,543m (2019: US$4,581m) against which the Group had pledged or restricted cash balances of US$44m (2019: US$8m).
At 31 December 2020, the Group had outstanding forward exchange contracts amounting to US$1,910m (2019: US$2,307m). These commitments consist of future gross obligations either to acquire or to sell designated amounts of foreign currency at agreed rates and value dates (note 34).
Capital commitmentsAt 31 December 2020, the Group had capital commitments of US$15m (2019: US$53m) excluding lease commitments (note 30):
2020 US$m
2019 US$m
Production Enhancement Contracts (PECs) in Mexico – 19Block PM304 in Malaysia 3 22Commitments in respect of development of the Group’s cloud-based Enterprise Resource Planning (“ERP”), digital systems and other information technology equipment 12 12
Contingent liabilitiesAs described in pages 9, 67, 69, 90 and 99 of the 2020 Annual Report and Accounts, on 12 May 2017, the UK Serious Fraud Office (“SFO”) announced an investigation into the activities of Petrofac, its subsidiaries, and their officers, employees and agents for suspected bribery, corruption, and/or money laundering. In February 2019 and January 2021, a former employee of a Petrofac subsidiary admitted offences contrary to the UK Bribery Act 2010 (“the Act”). These charges relate to historic contract awards in Saudi Arabia, Iraq and the UAE in the period 2012 to 2015. No charges have been brought against any Group company or any other officers or employees. Although not charged, a small number of former Petrofac employees are alleged to have acted together with the individual concerned. The SFO investigation is ongoing and the Group continues to engage with the SFO and will respond to any further developments as appropriate. The Group is focused on bringing this matter to closure as quickly as possible and believe this is in the best interests of all stakeholders. The existence of any possible future financial obligations (such as fines or penalties), or other consequences, is unable to be determined at this time.
A Group subsidiary is subject to challenges by HM Revenue and Customs (“HMRC”) on the historical application of National Insurance Contributions (“NICs”) to workers in the UK Continental Shelf. In October 2020, a decision was issued by HMRC against Petrofac Facilities Management Limited (“PFML”) in respect of the historic application of NICs. PFML has appealed against the decision and no payment has been made to HMRC pending the outcome of the first level appeal which is expected in the second half of 2021. Management, taking into consideration advice from independent legal and tax specialists, believes that it is not probable that an outflow of resources embodying economic benefits will be required to settle the obligation, and accordingly, no provision has been recognised. The maximum potential exposure to PFML in relation to NICs and interest should it be unsuccessful in defending its position is approximately US$160m.
The Group also has a recourse available, in accordance with the contractual indemnity contained in some customer contracts, where it can possibly recover a portion of NICs and interest from its customers in the event the Group is unsuccessful in its appeal. The possible recoverability of the amounts receivable from the customers, should the Group be unsuccessful in defending its position, may be subject to further negotiations with the customers. The Group is in the process of estimating the possible recoverable amount if it is unsuccessful in defending its position.
Notes to the consolidated financial statements continuedFor the year ended 31 December 2020
Petrofac Limited | 2020 Annual report and accounts182
Financial statements

32 Related party transactionsThe consolidated financial statements include the financial statements of Petrofac Limited and the subsidiaries listed in note 35. Petrofac Limited is the ultimate parent entity of the Group.
The following table provides the total amount of transactions entered with related parties:
Related party receivables2020
US$m2019
US$m
Joint ventures – 1Associates 1 –
1 1
All sales to and purchases from related parties are conducted on an arm’s length basis and are approved by the operating segment’s management. All related party balances will be settled in cash.
Other Directors’ interests include market-rate services of US$420,000 (2019: US$262,000), incurred in the ordinary course of business by the Engineering & Production Services operating segment.
The Group Chief Executive is a beneficiary of a trust which had invested in a fund that has an equity interest in the company which provided the services. In May 2017, the board of directors approved a donation of up to US$5m over the course of 5 years to the American University of Beirut (“AUB”) to establish the Petrofac Fund for Engineers endowment fund, which will provide scholarships and internships to engineering students in memory of Mr Maroun Semaan, Petrofac’s co-founder. However, in response to COVID-19 pandemic and the change in economic circumstances, it has been agreed that Petrofac will pay for up to 100 Group employees to attend a AUB full-time course instead of making future donations for engineering scholarships. As part of its new commitment, Petrofac will pay the cost of the course to AUB and an educational stipend to all attendees. For the year ended 31 December 2020, no amounts were paid to the AUB (2019: US$1m). The Group Chief Executive is a trustee of the AUB.
Compensation of key management personnelThe following details remuneration of key management personnel of the Group, comprising Executive and Non-executive Directors of the Company and other senior personnel. Further information relating to individual Directors of the Company is provided in the Directors’ remuneration report on pages 107 to 117.
2020 US$m
2019US$m
Short-term employee benefits 8 11Share-based payments charge 5 4Fees paid to Non-executive Directors 1 1
14 16
33 Accrued contract expensesAccrued contract expenses represent contract cost accruals associated with the Group’s fixed-price engineering, procurement and construction contracts. The decrease in accrued contract expenses of US$465m was mainly due to higher payment milestones relating to vendors and subcontractors achieved during the year in the Engineering & Construction operating segment.
34 Risk management and financial instrumentsRisk management objectives and policiesThe Group’s principal financial assets and liabilities, other than derivatives, comprise trade and other receivables, other financial assets, cash and short-term deposits, interest-bearing loans and borrowings, trade and other payables and other financial liabilities.
The Group’s activities expose it to various financial risks particularly associated with interest rate risk on its variable rate cash and short-term deposits, interest-bearing loans and borrowings and foreign currency risk on conducting business in currencies other than the functional currency, as well as translation of the assets and liabilities of foreign operations to the reporting currency. These risks are managed from time to time by using a combination of various derivative instruments, principally forward currency contracts in accordance with the Group’s hedging policies. The Group has a policy not to enter into speculative trading of financial derivatives.
The Board of Directors of the Company has established an Audit Committee which performs, amongst other roles, reviews on the effectiveness of the risk management and internal control systems to mitigate a range of risks, including financial risks, faced by the Group, which is discussed in detail on pages 94 to 101.
The other main risks besides interest rate and foreign currency risk arising from the Group’s financial instruments are credit risk, liquidity risk and commodity price risk; the policies relating to these risks are discussed in detail below:
Strateg
ic repo
rtG
overn
ance
Finan
cial statemen
ts
183Petrofac Limited | 2020 Annual report and accounts

34 Risk management and financial instruments continuedInterest rate riskInterest rate risk arises from the possibility that changes in interest rates will affect the value of the Group’s interest-bearing financial liabilities and assets.
The Group’s exposure to market risk arising from changes in interest rates relates primarily to the Group’s long-term variable rate debt obligations and its cash and shot-term deposits. The Group’s policy is to manage its interest cost using a mix of fixed and variable rate debt. The Group’s cash and bank balances are at floating rates of interest. During 2020 a fair value gain of US$2m associated with the interest rate swap was recognised through other comprehensive income.
The Group’s interest-bearing loans and borrowings is primarily in United States dollars, linked to United States dollar LIBOR (London Interbank Offered Rate). The Group uses derivatives to swap between fixed and floating rates. At 31 December 2020, the proportion of floating rate debt was 100% of the total financial debt outstanding (2019: 85%).
Interest rate sensitivity analysisThe impact on the Group’s profit before tax and equity due to a reasonably possible change in interest rates on interest-bearing loans and borrowings at the reporting date is demonstrated in the table below. The analysis assumes that all other variables remain constant.
Profit before tax Equity
100 basis point increase
US$m
100 basis point decrease
US$m
100 basis point increase
US$m
100 basis point decrease
US$m
31 December 2020 (5) 5 – –31 December 2019 (8) 8 – –
The following table reflects the maturity profile of the financial liabilities and assets that are subject to interest rate risk:
Year ended 31 December 2020
Within 1 year US$m
1–2 years US$m
2–3 years US$m
3–4 years US$m
4–5 years US$m
More than 5 years
US$mTotal
US$m
Financial liabilitiesFloating ratesBank overdrafts (note 27) 45 – – – – – 45Interest-bearing loans and borrowings (note 27) 705 50 – – – – 755
750 50 – – – – 800Financial assetsFloating ratesCash and short-term deposits (note 22) 684 – – – – – 684Restricted cash balances (note 18) 44 – – – – – 44
728 – – – – – 728
Year ended 31 December 2019
Within 1 year US$m
1–2 years US$m
2–3 years US$m
3–4 years US$m
4–5 years US$m
More than 5 years
US$m Total
US$m
Financial liabilitiesFloating ratesBank overdrafts (note 27) 111 – – – – – 111Interest-bearing loans and borrowings(1) (note 27) 150 600 – – – – 750
261 600 – – – – 861Financial assetsFloating ratesCash and short-term deposits (note 22) 1,025 – – – – – 1,025Restricted cash balances (note 18) 8 – – – – – 8
1,033 – – – – – 1,033
Note (1) During 2019, a term loan of US$150m was converted using an interest rate swap.
Financial liabilities in the above table are disclosed gross of debt acquisition costs and effective interest rate adjustments of US$nil (2019: US$1m).
Interest on financial instruments classified as floating rate is re-priced at intervals of less than one year. The other financial instruments of the Group that are not included in the above tables are non-interest bearing and are therefore not subject to interest rate risk.
Notes to the consolidated financial statements continuedFor the year ended 31 December 2020
Petrofac Limited | 2020 Annual report and accounts184
Financial statements
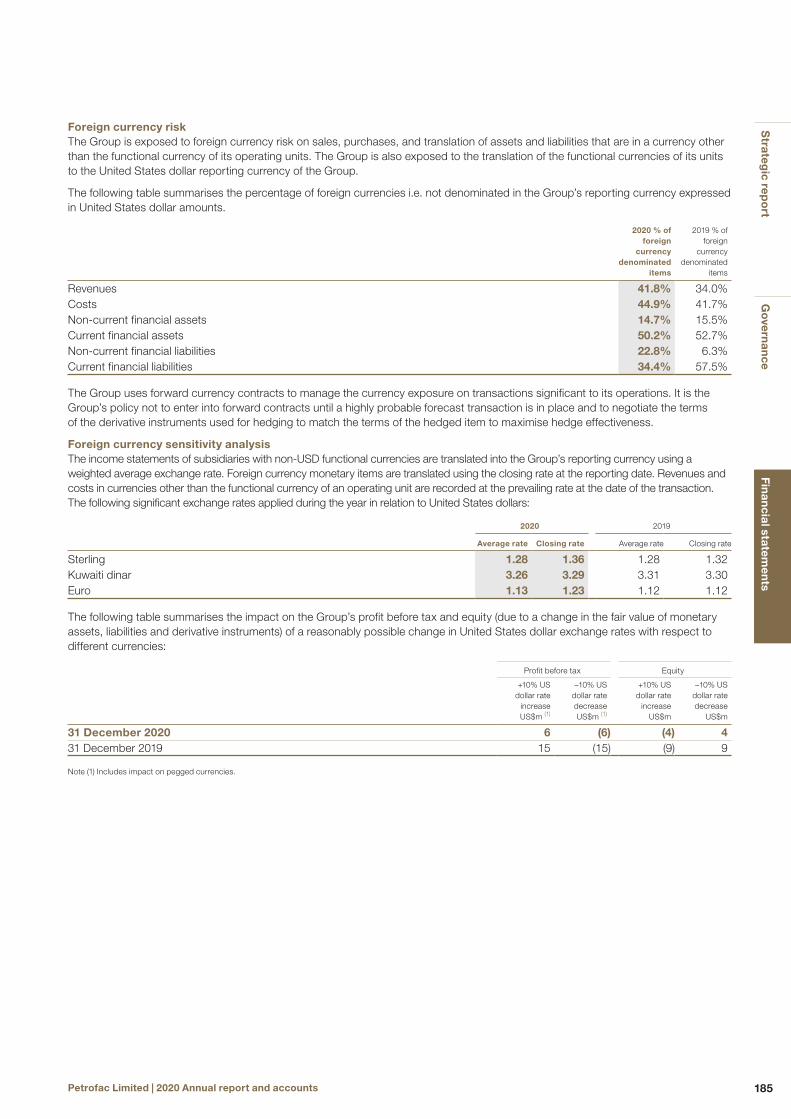
Foreign currency riskThe Group is exposed to foreign currency risk on sales, purchases, and translation of assets and liabilities that are in a currency other than the functional currency of its operating units. The Group is also exposed to the translation of the functional currencies of its units to the United States dollar reporting currency of the Group.
The following table summarises the percentage of foreign currencies i.e. not denominated in the Group’s reporting currency expressed in United States dollar amounts.
2020 % of foreign
currency denominated
items
2019 % of foreign
currency denominated
items
Revenues 41.8% 34.0%Costs 44.9% 41.7%Non-current financial assets 14.7% 15.5%Current financial assets 50.2% 52.7%Non-current financial liabilities 22.8% 6.3%Current financial liabilities 34.4% 57.5%
The Group uses forward currency contracts to manage the currency exposure on transactions significant to its operations. It is the Group’s policy not to enter into forward contracts until a highly probable forecast transaction is in place and to negotiate the terms of the derivative instruments used for hedging to match the terms of the hedged item to maximise hedge effectiveness.
Foreign currency sensitivity analysisThe income statements of subsidiaries with non-USD functional currencies are translated into the Group’s reporting currency using a weighted average exchange rate. Foreign currency monetary items are translated using the closing rate at the reporting date. Revenues and costs in currencies other than the functional currency of an operating unit are recorded at the prevailing rate at the date of the transaction. The following significant exchange rates applied during the year in relation to United States dollars:
2020 2019
Average rate Closing rate Average rate Closing rate
Sterling 1.28 1.36 1.28 1.32Kuwaiti dinar 3.26 3.29 3.31 3.30Euro 1.13 1.23 1.12 1.12
The following table summarises the impact on the Group’s profit before tax and equity (due to a change in the fair value of monetary assets, liabilities and derivative instruments) of a reasonably possible change in United States dollar exchange rates with respect to different currencies:
Profit before tax Equity
+10% US dollar rate
increase US$m (1)
−10% US dollar rate decrease US$m (1)
+10% US dollar rate
increase US$m
−10% US dollar rate decrease
US$m
31 December 2020 6 (6) (4) 431 December 2019 15 (15) (9) 9
Note (1) Includes impact on pegged currencies.
Strateg
ic repo
rtG
overn
ance
Finan
cial statemen
ts
185Petrofac Limited | 2020 Annual report and accounts
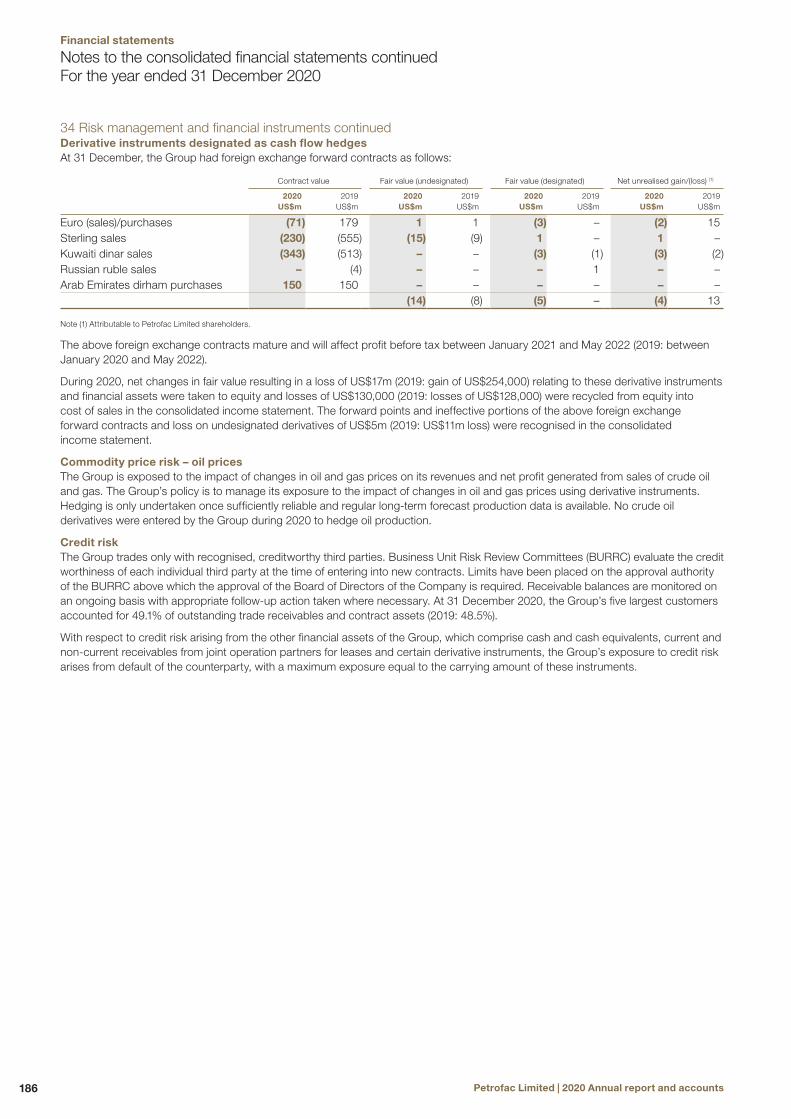
34 Risk management and financial instruments continuedDerivative instruments designated as cash flow hedgesAt 31 December, the Group had foreign exchange forward contracts as follows:
Contract value Fair value (undesignated) Fair value (designated) Net unrealised gain/(loss) (1)
2020 US$m
2019 US$m
2020US$m
2019 US$m
2020 US$m
2019 US$m
2020 US$m
2019 US$m
Euro (sales)/purchases (71) 179 1 1 (3) – (2) 15Sterling sales (230) (555) (15) (9) 1 – 1 –Kuwaiti dinar sales (343) (513) – – (3) (1) (3) (2)Russian ruble sales – (4) – – – 1 – –Arab Emirates dirham purchases 150 150 – – – – – –
(14) (8) (5) – (4) 13
Note (1) Attributable to Petrofac Limited shareholders.
The above foreign exchange contracts mature and will affect profit before tax between January 2021 and May 2022 (2019: between January 2020 and May 2022).
During 2020, net changes in fair value resulting in a loss of US$17m (2019: gain of US$254,000) relating to these derivative instruments and financial assets were taken to equity and losses of US$130,000 (2019: losses of US$128,000) were recycled from equity into cost of sales in the consolidated income statement. The forward points and ineffective portions of the above foreign exchange forward contracts and loss on undesignated derivatives of US$5m (2019: US$11m loss) were recognised in the consolidated income statement.
Commodity price risk – oil pricesThe Group is exposed to the impact of changes in oil and gas prices on its revenues and net profit generated from sales of crude oil and gas. The Group’s policy is to manage its exposure to the impact of changes in oil and gas prices using derivative instruments. Hedging is only undertaken once sufficiently reliable and regular long-term forecast production data is available. No crude oil derivatives were entered by the Group during 2020 to hedge oil production.
Credit riskThe Group trades only with recognised, creditworthy third parties. Business Unit Risk Review Committees (BURRC) evaluate the credit worthiness of each individual third party at the time of entering into new contracts. Limits have been placed on the approval authority of the BURRC above which the approval of the Board of Directors of the Company is required. Receivable balances are monitored on an ongoing basis with appropriate follow-up action taken where necessary. At 31 December 2020, the Group’s five largest customers accounted for 49.1% of outstanding trade receivables and contract assets (2019: 48.5%).
With respect to credit risk arising from the other financial assets of the Group, which comprise cash and cash equivalents, current and non-current receivables from joint operation partners for leases and certain derivative instruments, the Group’s exposure to credit risk arises from default of the counterparty, with a maximum exposure equal to the carrying amount of these instruments.
Notes to the consolidated financial statements continuedFor the year ended 31 December 2020
Petrofac Limited | 2020 Annual report and accounts186
Financial statements

Liquidity riskThe Group’s objective is to ensure sufficient liquidity to support operations and future growth is available. The provision of financial capital and the potential impact on the Group’s capital structure is reviewed regularly. The maturity profiles of the Group’s financial liabilities at 31 December are as follows:
Year ended 31 December 2020
6 months or less US$m
6–12 months US$m
1–2 years US$m
2–5 years US$m
More than 5 years
US$m
Contractual undiscounted
cash flows US$m
Carrying amount
US$m
Financial liabilitiesInterest-bearing loans and borrowings 750 – – 50 – 800 800Lease liabilities 129 35 51 112 24 351 313Trade and other payables (excluding other taxes payable and retention payable) 672 85 – – – 757 757Derivative instruments 23 3 – – – 26 26Interest payments 9 1 2 2 – 14 –
1,583 124 53 164 24 1,948 1,896
Year ended 31 December 2019
6 months or less US$m
6–12 months US$m
1–2 years US$m
2–5 years US$m
More than 5 years US$m
Contractual undiscounted
cash flows US$m
Carrying amount US$m
Financial liabilitiesInterest-bearing loans and borrowings 186 225 600 – – 1,011 1,010Lease liabilities 88 75 153 132 49 497 438Trade and other payables (excluding other taxes payable and retention payable) 842 85 – – – 927 927Derivative instruments 19 2 – – – 21 21Interest payments 13 16 23 – – 52 –
1,148 403 776 132 49 2,508 2,396
The Group uses various committed facilities provided by banks and its own financial assets to fund the above-mentioned financial liabilities.
Capital managementThe Group’s policy is to maintain a robust capital base to support future operations, growth and maximise shareholder value.
The Group seeks to optimise shareholder returns by maintaining a balance between debt and equity attributable to Petrofac Limited shareholders and monitors the efficiency of its capital structure on a regular basis. The gearing ratio and return on shareholders’ equity is as follows:
2020 US$m
2019 US$m
Cash and short-term deposits 684 1,025Interest-bearing loans and borrowings (A) (800) (1,010)Net (debt)/cash (B) (116) 15Equity attributable to Petrofac Limited shareholders (C) 433 633Reported net (loss)/profit for the year attributable to Petrofac Limited shareholders (D) (180) 73Gross gearing ratio (A/C) 184.8% 159.6%Net gearing ratio (B/C) 26.8% Net cashShareholders’ return on investment (D/C) (41.6%) 11.5%
Strateg
ic repo
rtG
overn
ance
Finan
cial statemen
ts
187Petrofac Limited | 2020 Annual report and accounts

35 Subsidiaries, associates and joint arrangementsAt 31 December 2020, the Group had investments in the following active subsidiaries, associates and joint arrangements:
Proportion of nominal value of issued shares controlled by
the Group
Name of entity Country of incorporation 2020 2019
Active subsidiariesPetrofac Algeria EURL Algeria 100 100Petrofac International (Bahrain) W.L.L Bahrain 100 100Petrofac South East Asia (B) Sdn. Bhd. Brunei 100 100Petrofac (Cyprus) Limited Cyprus 100 100Caltec Limited England 100 100Eclipse Petroleum Technology Limited England – 100K W Limited England 100 100Oilennium Limited England 100 100Petrofac (Malaysia-PM304) Limited England 100 100Petrofac Contracting Limited England 100 100Petrofac Engineering Limited England 100 100Petrofac Services Limited England 1001 1001
Petrofac Treasury UK Limited England 1001 1001
Petrofac UK Holdings Limited England 1001 1001
PetroHealth Limited England 100 100Petrofac Deutschland GmbH Germany 100 100Jermyn Insurance Company Limited Guernsey 1001 1001
Petrofac Engineering India Private Limited India 100 100Petrofac Engineering Services India Private Limited India 100 100Petrofac Projects and Services Private Limited (formerly Petrofac Information Services Private Limited) India 100 100Petrofac (JSD 6000) Limited Jersey 100 100Petrofac Energy Developments International Limited Jersey 1001 1001
Petrofac Facilities Management International Limited Jersey 1001 1001
Petrofac Integrated Energy Services Limited Jersey 1001 1001
Petrofac International Ltd. Jersey 1001 1001
Petrofac Offshore Management Limited Jersey 100 100Petrofac Platform Management Services Limited Jersey 100 100Petrofac Training International Limited Jersey 1001 1001
Petro Oil & Gas Limited (note 13) Jersey – 512
Petroleum Facilities E & C Limited Jersey 1001 1001
Petrofac E&C Sdn. Bhd. Malaysia 100 100Petrofac Energy Developments Sdn. Bhd. Malaysia 100 100Petrofac Engineering Services (Malaysia) Sdn. Bhd. Malaysia 70 70
Notes to the consolidated financial statements continuedFor the year ended 31 December 2020
Petrofac Limited | 2020 Annual report and accounts188
Financial statements

Proportion of nominal value of issued shares controlled by
the Group
Name of entity Country of incorporation 2020 2019
PFMAP Sdn. Bhd. Malaysia 100 100Petrofac EPS Sdn. Bhd. Malaysia 492 492
H&L/SPD Americas S. de R.L. Mexico – 100Petrofac Mexico SA de CV Mexico – 100Petrofac Mexico Servicios SA de CV Mexico – 100Petrofac International (Mozambique), Lda Mozambique 100 –Petrofac Kazakhstan B.V. Netherlands 100 100Petrofac Netherlands Coöperatief U.A. Netherlands 100 100Petrofac Netherlands Holdings B.V. (note 13) Netherlands – 512
Petrofac Nigeria B.V. Netherlands 100 100Petrofac Norge B.V. Netherlands 100 100PTS B.V. Netherlands 100 100Petrofac Energy Services Nigeria Limited Nigeria 100 100Petrofac International (Nigeria) Limited Nigeria 100 100Petrofac Norge AS Norway 100 100Petrofac E&C Oman LLC Oman 100 100PKT Training Services Limited Russia 100 100Sakhalin Technical Training Centre Russia 100 100Petrofac Saudi Arabia Company Limited Saudi Arabia 100 100Atlantic Resourcing Limited Scotland 100 100Petrofac Facilities Management Group Limited Scotland 100 100Petrofac Facilities Management Limited Scotland 100 100Petrofac Training Group Limited Scotland 100 100Petrofac Training Holdings Limited Scotland 100 100Petrofac Training Limited Scotland 100 100Scotvalve Services Limited Scotland 100 100SPD Limited Scotland 100 100Petrofac South East Asia Pte Ltd Singapore 1001 1001
Petrofac E&C International Limited United Arab Emirates 100 100Petrofac Emirates LLC (note 13) United Arab Emirates 75 75Petrofac FZE United Arab Emirates 100 100Petrofac International (UAE) LLC United Arab Emirates 100 100Petrofac Inc. United States 100 100Petrofac Training Inc. United States 100 100Petrofac US Holdings Limited United States 100 –W&W Energy Services Inc. United States 100 100SPD Group Limited British Virgin Islands 100 100
Strateg
ic repo
rtG
overn
ance
Finan
cial statemen
ts
189Petrofac Limited | 2020 Annual report and accounts

35 Subsidiaries, associates and joint arrangements continued
Associates
Proportion of nominal value of issued shares controlled by
the Group
Name of associate Principal activities Country of incorporation 2020 2019
PetroFirst Infrastructure Limited Leasing of floating platforms to oil and gas industry Jersey 20 20PetroFirst Infrastructure 2 Limited Leasing of floating platforms to oil and gas industry Jersey 10 10
Joint arrangementsJoint venturesSocar – Petrofac LLC Training services Azerbaijan 49 49Petrofac – ISKER LLP Engineering and construction services Kazakhstan 50 50China Petroleum Petrofac Engineering Services Cooperatief U.A.
Consultancy for petroleum and chemical engineering
Netherlands 49 49
Petrofac Kazakhstan Engineering Services LLP
Engineering services Kazakhstan 50 –
Takatuf Petrofac Oman LLC Construction, operation and management of a training centre
Oman 40 40
Joint operationsPetroAlfa Servicios Integrados de Energia SAPI de CV
Services to oil and gas industry Mexico – 503
Petrofac – CPECC JV Operations and maintenance contract in Iraq Iraq 655 655
PSS Netherlands B.V. Engineering, procurement, supply of equipment and materials and related services to execute the Company’s scope of work for a project in Thailand
Netherlands 364 364
Bechtel Petrofac JV Engineering, procurement and construction management of a project in UAE
Unincorporated 355 355
NGL 4 JV EPC for a project in UAE Unincorporated – 455
Petrofac/Bonatti JV EPC for a project in Algeria Unincorporated 705 705
Petrofac/Daelim JV EPC for a project in Oman Unincorporated 505 505
PM304 JV Oil and gas exploration and production in Malaysia Unincorporated 305 305
Petrofac/Samsung/CB&I CFP EPC for a project in Kuwait Unincorporated 475 475
Petrofac/Samsung EPC for a project in Oman Unincorporated 505 505
Petrofac/Saipem/Samsung Offshore works for a project in Thailand Unincorporated 365 365
Santuario Production Sharing Contract Oil and gas exploration and production in Mexico Unincorporated – 365
Please note that only active entities are shown in the above tables. All dormant entities have been omitted.1 Directly held by Petrofac Limited.2 Entities consolidated as subsidiaries on the basis of control.3 Joint arrangement classified as joint operation on the basis of contractual arrangement, whereby the activities of the arrangement are primarily designed for the provision of output
to the venturers; this indicates that the venturers have rights to substantially all the economic benefits of the assets of the arrangement.4 The joint arrangement is classified as a joint operation as, contractually, the joint operation partners have rights to the joint operation’s assets and obligation for the joint
operation’s liabilities.5 The unincorporated arrangement between the venturers is a joint arrangement as, contractually, all the decisions about the relevant activities require unanimous consent
by the venturers. Unincorporated joint arrangements are recognised in the Group’s financial statements as joint operations.
The Group’s ownership interest in associates and joint ventures is disclosed on page 165 and page 166.
Notes to the consolidated financial statements continuedFor the year ended 31 December 2020
Petrofac Limited | 2020 Annual report and accounts190
Financial statements

Appendix AThe Group references Alternative Performance Measures (“APMs”) when evaluating the Group’s reported financial performance, financial position and cash flows that are not defined or specified under International Financial Reporting Standards (“IFRS”). The Group considers that these APMs, which are not a substitute for or superior to IFRS measures, provide stakeholders with additional useful information by adjusting for certain reported items which impact upon IFRS measures or, by defining new measures, to aid the understanding of the Group’s financial performance, financial position and cash flows.
APM DescriptionClosest equivalent IFRS measure Adjustments to reconcile to primary statements Rationale for adjustments
Group’s business performance net profit attributable to Petrofac Limited shareholders (note A1)
Measures net profitability
Group’s net profit/(loss) Petrofac presents business performance APM in the consolidated income statement as a means of measuring underlying business performance. The business performance net profit measure excludes the contribution of impairments of assets, fair value re-measurements, losses on disposal, restructuring and redundancy costs, certain Corporate reporting segment professional services fee, loss on accelerated receipt of deferred consideration and material deferred tax movements arising due to foreign exchange differences in jurisdictions where tax is computed based on the functional currency of the country
The intention of this measure is to provide users of the consolidated financial statements with a clear and consistent presentation of underlying business performance and it excludes the impact of certain items to aid comparability
Business performance basic and diluted earnings per share attributable to Petrofac Limited shareholders (note A2)
Measures net profitability
Basic and diluted earnings per share
Business performance earnings before interest, tax, depreciation and amortisation (“EBITDA”) (note A3)
Measures operating profitability
Operating profit/(loss) Excludes separately disclosed items, depreciation and amortisation and includes share of net profits from associates and joint ventures
The intention of this measure is to provide users of the consolidated financial statements with a clear and consistent presentation of underlying operating performance
Business performance effective tax rate (“ETR”) (note A4)
Measures tax charge
Income tax expense Excludes income tax credit related to separately disclosed items
The intention of this measure is to provide users of the consolidated financial statements with a clear and consistent presentation of underlying business performance ETR
Capital expenditure (note A5)
Measures net cash cost of capital investment
Net cash flows generated from/(used in) investing activities
Excludes dividends received from associates and joint ventures, net loans repaid by/(paid to) associates and joint ventures, proceeds from disposal of property, plant and equipment, proceeds from disposal of subsidiaries and interest received
Excludes items not considered relevant to capital investment
Free cash flow (note A6)
Measures net cash generated after operating and investing activities to finance returns to shareholders
Net cash flows generated from/(used in) operating activities plus net cash flows (used in)/generated from investing activities minus interest paid plus amounts received from non-controlling interest
n/a n/a
Appendices
Strateg
ic repo
rtG
overn
ance
Finan
cial statemen
ts
191Petrofac Limited | 2020 Annual report and accounts

APM DescriptionClosest equivalent IFRS measure Adjustments to reconcile to primary statements Rationale for adjustments
Working capital, balance sheet measure (note A7)
Measures the investment in working capital
No direct equivalent. Calculated as inventories plus trade and other receivables plus contract assets minus trade and other payables minus contract liabilities minus accrued contract expenses
n/a n/a
Return on capital employed (“ROCE”) (note A8)
Measures the efficiency of generating operating profits from capital employed
No direct equivalent. Calculated as business performance earnings before interest, tax and amortisation (EBITA) divided by capital employed (average total assets minus average current liabilities after adjusting for certain leases)
n/a n/a
Cash conversion (note A9)
Measures the conversion of EBITDA into cash
No direct equivalent. Calculated as cash generated from operations divided by business performance EBITDA
n/a n/a
Net lease liabilities (note A10)
Measures net lease liabilities
No direct equivalent. Calculated as gross lease liabilities minus 70% of leases in respect of right-of-use assets relating to Block PM304 in Malaysia
n/a n/a
Net debt/net cash (note A11)
Measures indebtedness
No direct equivalent. Calculated as interest-bearing loans and borrowings minus cash and short-term deposits
n/a n/a
Net debt/EBITDA (note A12)
Measures leverage (excluding net lease liabilities)
No direct equivalent. Calculated as net debt divided by EBITDA
n/a n/a
Net debt (including net lease liabilities)/EBITDA (note A13)
Measures leverage (including net lease liabilities)
No direct equivalent. Calculated as net debt (including net lease liabilities) divided by EBITDA
n/a n/a
New order intake (note A14)
Provides visibility of future revenue
No direct equivalent. Calculated as net awards and net variation orders
n/a n/a
Appendices continued
Appendix A continued
Petrofac Limited | 2020 Annual report and accounts192
Financial statements

A1. Business performance net profit attributable to Petrofac Limited shareholders2020
US$m2019
US$m
Reported net (loss)/profit (A) (189) 66Adjustments – separately disclosed items (note 6):Impairment of assets 146 119Fair value re-measurements 57 37Group reorganisation and redundancy costs 13 10Other separately disclosed items 13 23Pre-tax separately disclosed items (B) 229 189Foreign exchange translation gains on deferred tax balances (1) (1)Deferred tax impairment – 16Tax relief on separately disclosed items – (1)Tax credit on separately disclosed items (C) (1) 14Post-tax separately disclosed items (D = B + C) 228 203Group’s business performance net profit (A + D) 39 269Loss attributable to non-controlling interest 9 7Business performance net profit attributable to Petrofac Limited shareholders 48 276
A2. Business performance basic earnings per share attributable to Petrofac Limited shareholders2020
US$m2019
US$m
Reported net profit attributable to Petrofac Limited shareholders (E) (180) 73Add: post-tax separately disclosed items (appendix A, note A1) 228 203Business performance net profit attributable to Petrofac Limited shareholders (E1) 48 276
2020 Shares million
2019 Shares million
Weighted average number of ordinary shares for basic earnings per share (1) (F) (note 9) 337 336Weighted average number of ordinary shares for diluted earnings per share (2) (F1) (note 9) 337 343
2020 US cents
2019US cents
Basic earnings per shareBusiness performance (E1/F x 100) 14.2 82.1Reported (E/F x 100) (53.4) 21.7Diluted earnings per shareBusiness performance (E1/F1 x 100) 14.2 80.4Reported (E/F1 x 100) (53.4) 21.3
Notes:(1) The weighted number of ordinary shares in issue during the year, excludes those held by the Employee Benefit trust.(2) For the year ended 31 December 2020, potentially issuable ordinary shares under the share-based payment plans are excluded from the diluted earnings per ordinary share calculation,
as their inclusion would decrease the loss per ordinary share.
A3. Business performance EBITDA2020
US$m2019
US$m
Reported operating (loss)/profit (148) 220Adjustments:Pre-tax separately disclosed items (appendix A, note A1) 229 189Share of net profits from associates and joint ventures (note 17) 5 17Depreciation (note 12) 82 130Amortisation, business performance impairment and write off (note 5a, note 5b and 5g) 43 3Business performance EBITDA 211 559
Strateg
ic repo
rtG
overn
ance
Finan
cial statemen
ts
193Petrofac Limited | 2020 Annual report and accounts

Appendix A continued
A4. Business performance ETR2020
US$m2019
US$m
Reported income tax expense 18 126Add: Tax charge/(credit) on separately disclosed items (appendix A, note A1) 1 (14)Business performance income tax expense (G) 19 112Group’s business performance net profit (appendix A, note A1) 39 269Group’s business performance net profit before tax (H) 58 381Business performance ETR (G/H x 100) 32.8% 29.4%
A5. Capital expenditure2020
US$m2019
US$m
Net cash flows used in investing activities 21 59Adjustments:Acquisition of subsidiary – (21)Contingent consideration paid (3) –Dividends received from associates and joint ventures 9 11Loans paid to associates and joint ventures (2) (2)Disposal costs paid (3) (9)Net proceeds from disposal of subsidiaries, including receipt against contingent consideration 31 12Proceeds from disposal of property, plant and equipment 1 –Advance received – 37Interest received 3 5Capital expenditure 57 92
A6. Free cash flow2020
US$m2019
US$m
Net cash flows (used in)/generated from operating activities (16) 238Net cash flows used in investing activities (21) (59)Interest paid (36) (51)Amounts received from non-controlling interest – 10Free cash flow (73) 138
A7. Working capital2020
US$m2019
US$m
Inventories (note 19) 8 17Trade and other receivables (note 20) 876 1,102Contract assets (note 21) 1,652 2,064Current Assets (I) 2,536 3,183Trade and other payables (note 29) 887 1,075Contract liabilities (note 21) 120 273Accrued contract expenses 1,134 1,599Current Liabilities (J) 2,141 2,947Working capital (I – J) 395 236
Appendices continued
Petrofac Limited | 2020 Annual report and accounts194
Financial statements

A8. Return on capital employed2020
US$m2019
US$m
Reported operating (loss)/profit (148) 220Adjustments:Pre-tax separately disclosed items (appendix A, note A1) 229 189Share of profits from associates and joint ventures (note 17) 5 17Amortisation (note 5a and 5b) 7 1Business performance EBITA (K) 93 427Total assets opening balance 5,976 5,806Less: 70% on leases in respect of right-of-use assets relating to Block PM304 in Malaysia (259) (313)Adjusted total assets opening balance (L) 5,717 5,493Total assets closing balance 4,201 5,976Less: 70% on leases in respect of right-of-use assets relating to Block PM304 in Malaysia (note A10) (177) (259)Adjusted total assets closing balance (M) 4,024 5,717Average total assets (N = (L + M)/2) 4,871 5,605Current liabilities opening balance 3,922 3,794Less: 70% on leases in respect of right-of-use assets relating to Block PM304 in Malaysia (note A10) (89) (76)Adjusted current liabilities opening balance (O) 3,833 3,718Current liabilities closing balance 3,336 3,922Less: 70% on leases in respect of right-of-use assets relating to Block PM304 in Malaysia (note A10) (97) (89)Adjusted current liabilities closing balance (P) 3,239 3,833Average current liabilities (Q = (O + P)/2) 3,536 3,776Capital employed (R = N – Q) 1,335 1,829Return on capital employed (K/R x 100) 7.0% 23.3%
A9. Cash conversion2020
US$m2019
US$m
Cash generated from operations (S) 77 399Business performance EBITDA (T) 211 559Cash conversion (S/T x 100) 36.5% 71.4%
A10. Net lease liabilities2020
US$m2019
US$m
Non-current liability for lease liabilities (note 18) 163 298Current liability for lease liabilities (note 18) 150 140Total gross liability for lease liabilities 313 43870% gross up on non-current liability for leases in respect of right-of-use assets relating to Block PM304 in Malaysia (note 18) 80 17070% gross up on current liability for leases in respect of right-of-use assets relating to Block PM304 in Malaysia (note 18) 97 89Total 70% on leases in respect of right-of-use assets relating to Block PM304 in Malaysia 177 259Net non-current liability for leases 83 128Net current liability for leases 53 51Net lease liabilities 136 179
Strateg
ic repo
rtG
overn
ance
Finan
cial statemen
ts
195Petrofac Limited | 2020 Annual report and accounts

Appendix A continued
A11. Net (cash)/debt2020
US$m2019
US$m
Interest-bearing loans and borrowings (U) (note 27) 800 1,010Less: Cash and short-term deposits (V) (note 22) (684) (1,025)Net (cash)/debt (U – V) 116 (15)
A12. Net debt/EBITDA2020
US$m2019
US$m
Net debt (W) (appendix A, note A11) 116 n/aBusiness performance EBITDA (X) (note A3) 211 n/aNet Debt/EBITDA (W/X) 0.5 n/a
A13. Net debt (including net lease liabilities)/EBITDA2020
US$m2019
US$m
Net debt/(cash) (appendix A, note A11) 116 (15)Net lease liabilities (appendix A, note A10) 136 179Net debt, including net lease liabilities (Y) 252 164Business performance EBITDA (Z) (note A3) 211 559Net debt (including net lease liabilities)/EBITDA (Y/Z) 1.2 0.3
A14. New order intake2020
US$m2019
US$m
Engineering & Construction operating segmentNet awards 314 1,252Net variation orders 396 882
710 2,134Engineering & Production Services operating segmentNet awards 1,177 912Net variation orders (255) 115
922 1,027New order intake 1,632 3,161
Appendices continued
Petrofac Limited | 2020 Annual report and accounts196
Financial statements
Company financial statements
198 Company income statement198 Company statement of other comprehensive income199 Company balance sheet200 Company statement of cash flows201 Company statement of changes in equity
202 Notes to the Company financial statements202 Note 1 Corporate information202 Note 2 Summary of significant accounting policies204 Note 3 Income204 Note 4 General and administration expenses204 Note 5 Expected credit loss allowance (“ECL”)204 Note 6 Impairment of investments in subsidiaries204 Note 7 Other operating income204 Note 8 Other operating expenses204 Note 9 Finance income/(expense)205 Note 10 Dividends paid and proposed205 Note 11 Investments in subsidiaries205 Note12 Amounts due from/due to Group entities206 Note 13 Cash and short-term deposits206 Note 14 Employee Benefit Trust (“EBT”) shares207 Note 15 Share-based payments reserve207 Note 16 Interest-bearing loans and borrowings208 Note 17 Other financial assets and other financial liabilities210 Note 18 Commitments and contingent liabilities210 Note 19 Risk management and financial instruments 213 Note 20 Related party transactions213 Note 21 Share capital214 Glossary216 Shareholder information
Strateg
ic repo
rtG
overn
ance
Finan
cial statemen
ts
197Petrofac Limited | 2020 Annual report and accounts

Notes2020
US$m 2019
US$m
Income 3 239 331General and administration expenses 4 (14) (18)Expected credit loss allowance 5 (200) (126)Impairment of investments in subsidiaries 6 (348) (2)Other operating income 7 9 8Other operating expenses 8 (26) (25)Operating (loss)/profit (340) 168Finance income 9 60 76Finance expense 9 (34) (65)(Loss)/profit before tax (314) 179Income tax expense – –Net (loss)/profit (314) 179
Company statement of other comprehensive incomeFor the year ended 31 December 2020
2020 US$m
2019 US$m
Net (loss)/profit (314) 179Fair value gain/(loss) on derivatives 2 (2)Total comprehensive (loss)/income (312) 177
Company income statementFor the year ended 31 December 2020
Petrofac Limited | 2020 Annual report and accounts198
Financial statements

Notes2020
US$m2019
US$m
Assets Non-current assetsInvestments in subsidiaries 11 218 218Investments in associates 7 7Other financial assets 17 48 46
273 271Current assetsTrade and other receivables 1 1Amounts due from Group entities 12 1,027 2,588Other financial assets 17 7 38Cash and short-term deposits 13 87 74
1,122 2,701Total assets 1,395 2,972Equity and liabilities Equity attributable to Petrofac Limited shareholdersShare capital 21 7 7Share premium 21 4 4Capital redemption reserve 21 11 11Employee Benefit Trust shares 14 (88) (110)Share-based payments reserve 15 72 83Unrealised losses on derivatives – (2)Retained earnings 237 554Total equity 243 547Non-current liabilities Interest-bearing loans and borrowings 16 50 599Other financial liabilities 17 – –
50 599Current liabilitiesTrade and other payables 1 2Amounts due to Group entities 12 369 1,401Interest-bearing loans and borrowings 16 705 401Other financial liabilities 17 27 22
1,102 1,826Total liabilities 1,152 2,425Total equity and liabilities 1,395 2,972
The financial statements on pages 198 to 213 were approved by the Board of Directors on 20 April 2021 and signed on its behalf by Alastair Cochran – Chief Financial Officer.
Company balance sheetAt 31 December 2020
Strateg
ic repo
rtG
overn
ance
Finan
cial statemen
ts
199Petrofac Limited | 2020 Annual report and accounts
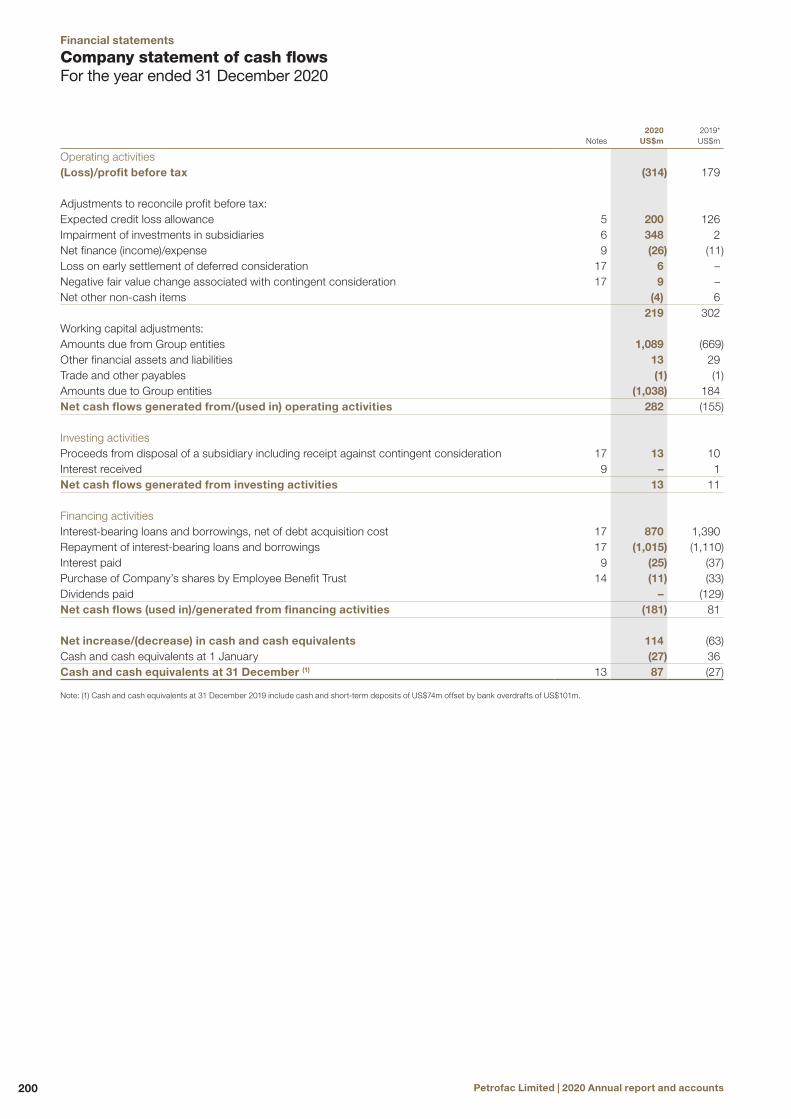
Notes2020
US$m2019* US$m
Operating activities (Loss)/profit before tax (314) 179
Adjustments to reconcile profit before tax:Expected credit loss allowance 5 200 126Impairment of investments in subsidiaries 6 348 2Net finance (income)/expense 9 (26) (11)Loss on early settlement of deferred consideration 17 6 –Negative fair value change associated with contingent consideration 17 9 –Net other non-cash items (4) 6
219 302Working capital adjustments:Amounts due from Group entities 1,089 (669)Other financial assets and liabilities 13 29Trade and other payables (1) (1)Amounts due to Group entities (1,038) 184Net cash flows generated from/(used in) operating activities 282 (155)
Investing activities Proceeds from disposal of a subsidiary including receipt against contingent consideration 17 13 10Interest received 9 – 1Net cash flows generated from investing activities 13 11
Financing activitiesInterest-bearing loans and borrowings, net of debt acquisition cost 17 870 1,390Repayment of interest-bearing loans and borrowings 17 (1,015) (1,110)Interest paid 9 (25) (37)Purchase of Company’s shares by Employee Benefit Trust 14 (11) (33)Dividends paid – (129)Net cash flows (used in)/generated from financing activities (181) 81
Net increase/(decrease) in cash and cash equivalents 114 (63)Cash and cash equivalents at 1 January (27) 36Cash and cash equivalents at 31 December (1) 13 87 (27)
Note: (1) Cash and cash equivalents at 31 December 2019 include cash and short-term deposits of US$74m offset by bank overdrafts of US$101m.
Company statement of cash flowsFor the year ended 31 December 2020
Petrofac Limited | 2020 Annual report and accounts200
Financial statements

Issued share capital US$m
(note 21)
Share premium
US$m
Capital redemption
reserve US$m
Employee Benefit Trust
shares (1) US$m
(note 14)
Share-based payments
reserve US$m
(note 15)
Unrealised losses on
derivativesUS$m
Retained earnings
US$mTotal equity
US$m
Balance at 1 January 2019 7 4 11 (107) 79 – 508 502Net profit – – – – – – 179 179Other comprehensive loss – – – – – (2) – (2)Total comprehensive income – – – – – (2) 179 177Purchase of Company’s shares by Employee Benefit Trust – – – (33) – – – (33)Issue of Company’s shares by Employee Benefit Trust – – – 30 (26) – (4) –Credit to equity for share-based payments charge invoiced to Group entities – – – – 30 – – 30Dividends (note 10) – – – – – – (129) (129)Balance at 1 January 2020 7 4 11 (110) 83 (2) 554 547Net loss – – – – – – (314) (314)Other comprehensive income – – – – – 2 – 2Total comprehensive loss – – – – – 2 (314) (312)Purchase of Company’s shares by Employee Benefit Trust – – – (11) – – – (11)Issue of Company’s shares by Employee Benefit Trust – – – 33 (30) – (3) –Credit to equity for share-based payments charge invoiced to Group entities – – – – 19 – – 19Balance at 31 December 2020 7 4 11 (88) 72 – 237 243
Note: (1) Shares held by Petrofac Employee Benefit Trust.
Company statement of changes in equityFor the year ended 31 December 2020
Strateg
ic repo
rtG
overn
ance
Finan
cial statemen
ts
201Petrofac Limited | 2020 Annual report and accounts

Notes to the Company financial statementsFor the year ended 31 December 2020
1 Corporate informationPetrofac Limited (the “Company”) is a limited liability company registered and domiciled in Jersey under the Companies (Jersey) Law 1991 and is the holding company for the international group of Petrofac subsidiaries. Petrofac Limited and its subsidiaries at 31 December 2020 comprise the Petrofac Group (the “Group”). The Group’s principal activity is the provision of services to the oil and gas production and processing industry.
The financial statements of the Company for the year ended 31 December 2020 were authorised for issue in accordance with a resolution of the Board of Directors on 20 April 2021.
2 Summary of significant accounting policiesBasis of preparationThe separate financial statements have been prepared in accordance with International Financial Reporting Standards (IFRS) as issued by the International Accounting Standards Board (IASB) and applicable requirements of Jersey law.
The separate financial statements of the Company have been prepared on a historical cost basis, except for derivative financial instruments and contingent consideration that have been measured at fair value. The functional and presentation currency of these separate financial statements is United States dollars and all values in the separate financial statements are rounded to the nearest million (US$m) unless otherwise stated.
Adoption of new financial reporting standards, amendments and interpretationsEffective new financial reporting amendmentsThe Company applied for the first-time certain amendments, which are effective for annual periods beginning on or after 1 January 2020. The Company has not early adopted any other standard, interpretation or amendment that has been issued but is not yet effective.
The following amendments apply for the first time in 2020, but do not have an impact on the financial statements of the Company:
— Amendments to IFRS 3: Definition of a Business — Amendments to IFRS 7, IFRS 9 and IAS 39: Interest Rate Benchmark Reform
— Amendments to IAS 1 and IAS 8: Definition of Material
Significant accounting policiesInvestments in subsidiariesInvestment in subsidiaries are stated at cost less any accumulated impairment.
Investments in associatesInvestment in associates are stated at cost less any accumulated impairment.
Financial assetsInitial recognition and measurementFinancial assets are classified at initial recognition, as subsequently measured at amortised cost, fair value through other comprehensive income, and fair value through profit or loss.
The Company initially measures a financial asset at its fair value plus, in the case of a financial asset not at fair value through profit or loss, transaction costs.
Subsequent measurementFor purposes of subsequent measurement, financial assets are classified in to the following categories:
— Amortised cost — Fair value through profit or loss
Amortised costThe Company generally applies this category to trade and other receivables, amounts due from Group entities and deferred consideration receivable. The Company measures financial assets at amortised cost if both of the following conditions are met:
— The financial asset is held within a business model with the objective to hold financial assets in order to collect contractual cash flows; and — The contractual terms of the financial asset give rise on specified dates to cash flows that are solely payments of principal and interest on the principal amount outstanding
Financial assets at amortised cost are subsequently measured using the effective interest rate (“EIR”) method and are subject to impairment. Gains and losses are recognised in the Company’s income statement when the asset is derecognised, modified or impaired.
Financial assets at fair value through profit or lossFinancial assets at fair value through profit or loss include financial assets held for trading and financial assets designated upon initial recognition at fair value through profit or loss, or financial assets mandatorily required to be measured at fair value. Derivatives are classified as held for trading unless they are designated as effective hedging instruments. Financial assets at fair value through profit or loss are carried in the Company’s balance sheet at fair value with net changes in fair value recognised in the income statement.
Contingent consideration relating to a disposal of the Company’s shareholding in a wholly owned subsidiary, Petrofac GSA Holdings Limited, was recognised as a financial asset at fair value through profit or loss within the other financial assets line item of the balance sheet. A negative fair value change of US$9m (2019: US$nil) was recognised during the year.
The fair value changes to undesignated forward currency contracts are recognised within the other operating income or expenses line item in the Company’s income statement.
Impairment of financial assetsThe Company recognises an allowance for expected credit losses (“ECLs”) for all financial assets not held at fair value through profit or loss. ECLs are based on the difference between the contractual cash flows due in accordance with the contract and all the cash flows that the Company expects to receive, discounted at an approximation of the original effective interest rate. The expected cash flows will include, if any, cash flows from the sale of collateral held or other credit enhancements that are integral to the contractual terms.
For financial assets measured at amortised cost, ECLs are recognised in two stages. For credit exposures for which there has not been a significant increase in credit risk since initial recognition, ECLs are provided for credit losses that result from default events that are possible within the next 12 months (a 12-month ECL). For those credit exposures for which there has been a significant increase in credit risk since initial recognition, a loss allowance is required for credit losses expected over the remaining life of the exposure, irrespective of the timing of the default (a lifetime ECL). During the year, there was a significant increase in the credit risk for such financial assets since the initial recognition. This resulted in a lifetime ECL being recognised for these financial assets.
Petrofac Limited | 2020 Annual report and accounts202
Financial statements
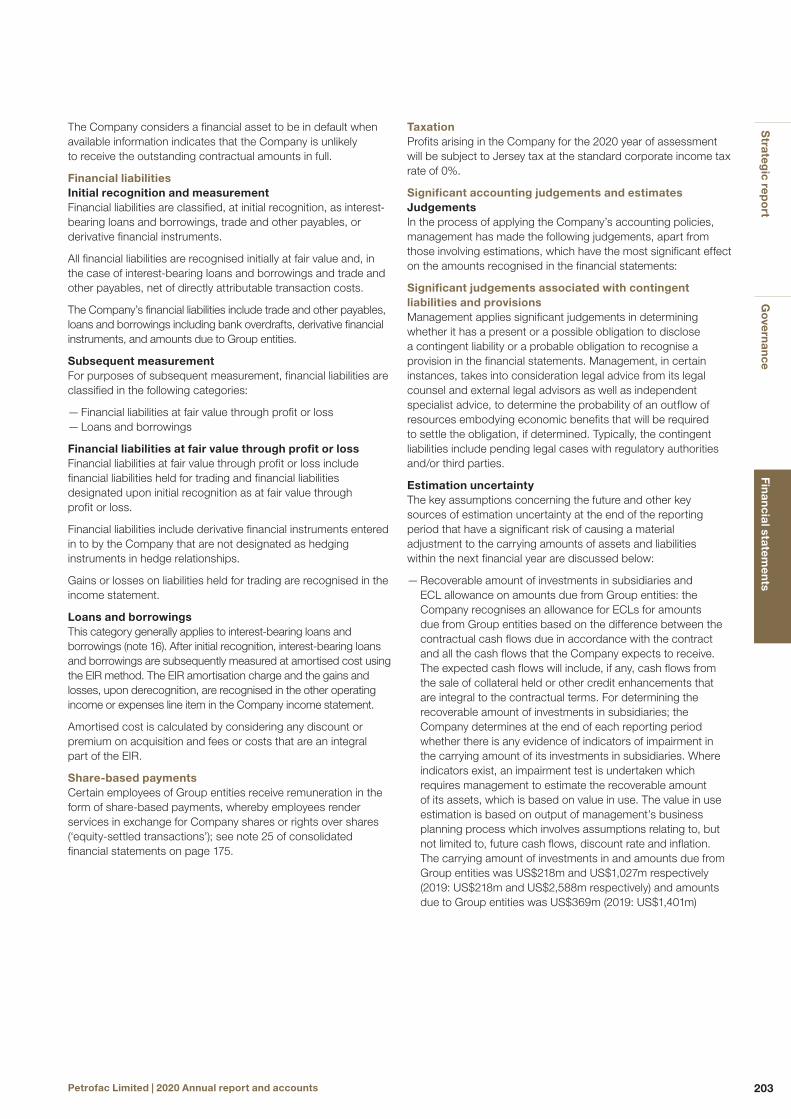
The Company considers a financial asset to be in default when available information indicates that the Company is unlikely to receive the outstanding contractual amounts in full.
Financial liabilitiesInitial recognition and measurementFinancial liabilities are classified, at initial recognition, as interest-bearing loans and borrowings, trade and other payables, or derivative financial instruments.
All financial liabilities are recognised initially at fair value and, in the case of interest-bearing loans and borrowings and trade and other payables, net of directly attributable transaction costs.
The Company’s financial liabilities include trade and other payables, loans and borrowings including bank overdrafts, derivative financial instruments, and amounts due to Group entities.
Subsequent measurementFor purposes of subsequent measurement, financial liabilities are classified in the following categories:
— Financial liabilities at fair value through profit or loss — Loans and borrowings
Financial liabilities at fair value through profit or lossFinancial liabilities at fair value through profit or loss include financial liabilities held for trading and financial liabilities designated upon initial recognition as at fair value through profit or loss.
Financial liabilities include derivative financial instruments entered in to by the Company that are not designated as hedging instruments in hedge relationships.
Gains or losses on liabilities held for trading are recognised in the income statement.
Loans and borrowingsThis category generally applies to interest-bearing loans and borrowings (note 16). After initial recognition, interest-bearing loans and borrowings are subsequently measured at amortised cost using the EIR method. The EIR amortisation charge and the gains and losses, upon derecognition, are recognised in the other operating income or expenses line item in the Company income statement.
Amortised cost is calculated by considering any discount or premium on acquisition and fees or costs that are an integral part of the EIR.
Share-based paymentsCertain employees of Group entities receive remuneration in the form of share-based payments, whereby employees render services in exchange for Company shares or rights over shares (‘equity-settled transactions’); see note 25 of consolidated financial statements on page 175.
TaxationProfits arising in the Company for the 2020 year of assessment will be subject to Jersey tax at the standard corporate income tax rate of 0%.
Significant accounting judgements and estimatesJudgementsIn the process of applying the Company’s accounting policies, management has made the following judgements, apart from those involving estimations, which have the most significant effect on the amounts recognised in the financial statements:
Significant judgements associated with contingent liabilities and provisionsManagement applies significant judgements in determining whether it has a present or a possible obligation to disclose a contingent liability or a probable obligation to recognise a provision in the financial statements. Management, in certain instances, takes into consideration legal advice from its legal counsel and external legal advisors as well as independent specialist advice, to determine the probability of an outflow of resources embodying economic benefits that will be required to settle the obligation, if determined. Typically, the contingent liabilities include pending legal cases with regulatory authorities and/or third parties.
Estimation uncertaintyThe key assumptions concerning the future and other key sources of estimation uncertainty at the end of the reporting period that have a significant risk of causing a material adjustment to the carrying amounts of assets and liabilities within the next financial year are discussed below:
— Recoverable amount of investments in subsidiaries and ECL allowance on amounts due from Group entities: the Company recognises an allowance for ECLs for amounts due from Group entities based on the difference between the contractual cash flows due in accordance with the contract and all the cash flows that the Company expects to receive. The expected cash flows will include, if any, cash flows from the sale of collateral held or other credit enhancements that are integral to the contractual terms. For determining the recoverable amount of investments in subsidiaries; the Company determines at the end of each reporting period whether there is any evidence of indicators of impairment in the carrying amount of its investments in subsidiaries. Where indicators exist, an impairment test is undertaken which requires management to estimate the recoverable amount of its assets, which is based on value in use. The value in use estimation is based on output of management’s business planning process which involves assumptions relating to, but not limited to, future cash flows, discount rate and inflation. The carrying amount of investments in and amounts due from Group entities was US$218m and US$1,027m respectively (2019: US$218m and US$2,588m respectively) and amounts due to Group entities was US$369m (2019: US$1,401m)
Strateg
ic repo
rtG
overn
ance
Finan
cial statemen
ts
203Petrofac Limited | 2020 Annual report and accounts
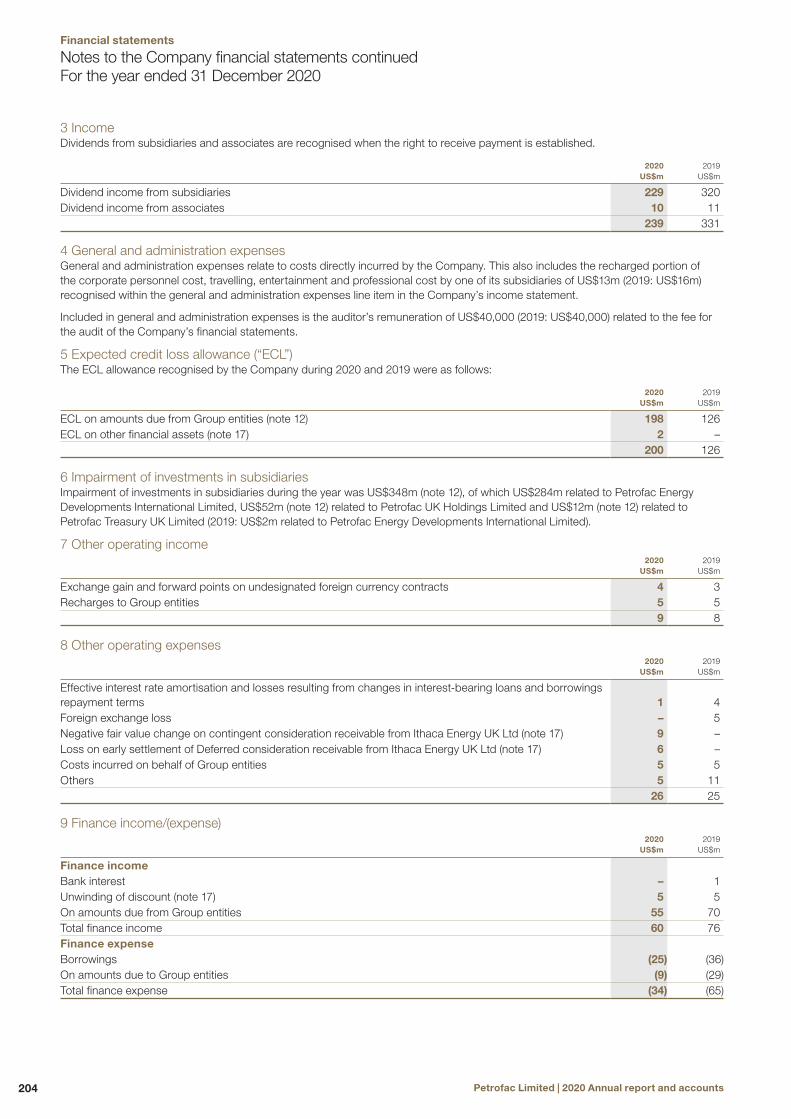
3 IncomeDividends from subsidiaries and associates are recognised when the right to receive payment is established.
2020 US$m
2019 US$m
Dividend income from subsidiaries 229 320Dividend income from associates 10 11
239 331
4 General and administration expensesGeneral and administration expenses relate to costs directly incurred by the Company. This also includes the recharged portion of the corporate personnel cost, travelling, entertainment and professional cost by one of its subsidiaries of US$13m (2019: US$16m) recognised within the general and administration expenses line item in the Company’s income statement.
Included in general and administration expenses is the auditor’s remuneration of US$40,000 (2019: US$40,000) related to the fee for the audit of the Company’s financial statements.
5 Expected credit loss allowance (“ECL”)The ECL allowance recognised by the Company during 2020 and 2019 were as follows:
2020 US$m
2019 US$m
ECL on amounts due from Group entities (note 12) 198 126ECL on other financial assets (note 17) 2 –
200 126
6 Impairment of investments in subsidiariesImpairment of investments in subsidiaries during the year was US$348m (note 12), of which US$284m related to Petrofac Energy Developments International Limited, US$52m (note 12) related to Petrofac UK Holdings Limited and US$12m (note 12) related to Petrofac Treasury UK Limited (2019: US$2m related to Petrofac Energy Developments International Limited).
7 Other operating income2020
US$m2019
US$m
Exchange gain and forward points on undesignated foreign currency contracts 4 3Recharges to Group entities 5 5
9 8
8 Other operating expenses2020
US$m2019
US$m
Effective interest rate amortisation and losses resulting from changes in interest-bearing loans and borrowings repayment terms 1 4Foreign exchange loss – 5Negative fair value change on contingent consideration receivable from Ithaca Energy UK Ltd (note 17) 9 –Loss on early settlement of Deferred consideration receivable from Ithaca Energy UK Ltd (note 17) 6 –Costs incurred on behalf of Group entities 5 5Others 5 11
26 25
9 Finance income/(expense)2020
US$m2019
US$m
Finance incomeBank interest – 1Unwinding of discount (note 17) 5 5On amounts due from Group entities 55 70Total finance income 60 76Finance expenseBorrowings (25) (36)On amounts due to Group entities (9) (29)Total finance expense (34) (65)
Notes to the Company financial statements continuedFor the year ended 31 December 2020
Petrofac Limited | 2020 Annual report and accounts204
Financial statements

10 Dividends paid and proposed2020
US$m2019
US$m
Declared and paid during the yearEquity dividends on ordinary shares:Final dividend for 2018 (US$0.253 per share) – 86Interim dividend for 2019 (US$0.127 per share) – 43
– 129
In April 2020, the Board agreed to suspend the final 2019 ordinary share dividend payments, which had previously been announced as part of the year-end results for 2019, to preserve balance sheet strength in response to the challenges presented by the COVID-19 pandemic. The Board therefore decided to suspend both, the 2020 interim dividend (2019 interim dividend: US$0.127 per share) and final dividend (2019 final dividend: US$0.253 per share) to prudently conserve cash in this unprecedented market environment. However, the Board recognises the importance of dividends to our shareholders and will seek to reinstate them as soon as it is appropriate to do so. This will be contingent on both a market recovery and confidence that the dividend can be paid sustainably whilst retaining a strong balance sheet and liquidity.
11 Investments in subsidiariesAt 31 December, the Company had investments in the following active subsidiaries:
Proportion of nominal value of issued shares controlled
by the Company
Name of company Country of incorporation 2020 2019
Trading subsidiariesPetrofac Services Limited England 100 100Petrofac UK Holdings Limited England 100 100Jermyn Insurance Company Limited Guernsey 100 100Petrofac International Limited Jersey 100 100Petrofac Energy Developments International Limited Jersey 100 100Petrofac Facilities Management International Limited Jersey 100 100Petrofac Integrated Energy Services Limited Jersey 100 100Petrofac Training International Limited Jersey 100 100Petroleum Facilities E & C Limited Jersey 100 100Petrofac South East Asia Pte Limited Singapore 99 99Petrofac Treasury UK Limited UK 100 100Petrofac Inc. USA – 100
12 Amounts due from/due to Group entitiesAmounts due from/due to Group entities comprise both interest and non-interest-bearing short-term loans provided to/received from Group entities listed in note 35 of the Group’s consolidated financial statements.
The decrease in amounts due from Group entities of US$1,561m to US$1,027m and decrease in amounts due to Group entities of US$1,032m to US$369m was mainly due to reorganisation of loan amounts relating to certain Group entities from the Company to Petrofac Treasury UK Limited at 1 January 2020.
At the end of each reporting period, the amounts due from Group entities were reported net of expected credit loss (ECL) allowance in accordance with IFRS 9 ‘Financial Instruments’.
The movement in ECL allowance against amounts due from Group entities at the end of each reporting period was as follows:
2020US$m
2019US$m
At 1 January 137 11ECL allowance (note 5) 198 126Write-off arising from loan waivers (273) –At 31 December 62 137
The outbreak of the COVID-19 pandemic and the associated economic slowdown had an impact on the ability of a subsidiary of the Company to provide financial guarantees in respect of the amounts owed by other Group entities to the Company. At 31 December 2020, no financial guarantee was provided by a subsidiary of the Company to Petrofac Facilities Management Limited (“PFML”) and Petrofac Energy Developments International Limited (“PEDIL”); and a partial guarantee of US$100m was provided to Petrofac UK Holdings Limited (“PUKH”) in respect of the amounts owed by these entities to the Company (2019: a financial guarantee of US$142m was provided to PFML; US$298m was provided to PEDIL; and US$152m was provided to PUKH).
Strateg
ic repo
rtG
overn
ance
Finan
cial statemen
ts
205Petrofac Limited | 2020 Annual report and accounts

12 Amounts due from/due to Group entities continuedIn absence of these financial guarantees:
— The Directors of PFML requested the Directors of the Company to waive the amounts due from PFML of US$273m to the Company. During December 2020, these amounts were waived and consequently an ECL allowance of US$273m (2019: US$nil) was recognised within expected credit loss allowance line item of the income statement and subsequently written off given the amounts due from Group entities no longer existed at 31 December 2020. — The Directors of PUKH requested the Directors of the Company to partially waive the amounts due from PUKH of US$52m to the Company. During December 2020, these amounts were waived, and resulted in an increase in the Company’s investment in PUKH of US$52m. The recoverable amount of investment in PUKH at 31 December 2020 was US$167m, consequently an impairment charge associated with investment in subsidiaries of US$52m (2019: US$nil) was recognised within impairment of investment in subsidiaries line item of the income statement. — The Directors of PEDIL requested the Directors of the Company to waive the amounts due from PEDIL of US$284m to the Company. During December 2020, these amounts were waived that resulted in a reversal of an ECL allowance of US$87m and an increase in the Company’s investment in PEDIL of US$284m. The recoverable amount of investment in PEDIL at 31 December 2020 was US$nil, consequently an impairment charge associated with investment in subsidiaries of US$284m (2019: US$2m) was recognised within impairment of investment in subsidiaries line item of the income statement. — The Directors of Petrofac Treasury UK Limited (“PTUK”) requested the Directors of the Company to waive the amounts due from PTUK of US$12m to the Company. During December 2020, these amounts were waived that resulted in a reversal of an ECL allowance of US$12m and an increase in the Company’s investment in PTUK of US$12m, consequently an impairment charge associated with investment in subsidiaries of US$12m (2019: US$nil) was recognised within impairment of investment in subsidiaries line item of the income statement. Further, an additional ECL allowance of US$12m (2019: US$32m) was recognised within expected credit loss allowance line item of the income statement.
Additionally, the Company recognised further ECL allowance on amounts due from other Group entities of US$12m (2019: US$7m).
At 31 December 2020 the analysis of amounts due from Group entities is as follows:
2020US$m
2019US$m
ECL rate 5.7% 5.0%Gross carrying amount 1,089 2,725Less: ECL allowance (62) (137)ECL adjusted amounts due from Group entities at 31 December 1,027 2,588
13 Cash and short-term deposits2020
US$m2019
US$m
Cash at bank and in hand 87 64Short-term deposits – 10
87 74
The fair value of cash and bank short-term deposit balances was US$87m (2019: US$74m).
For the purposes of the Company statement of cash flows, cash and cash equivalents comprise the following:
2020US$m
2019 US$m
Cash at bank and in hand 87 64Short-term deposits – 10Bank overdrafts (note 16) – (101)
87 (27)
14 Employee Benefit Trust (“EBT”) sharesThe Petrofac Employee Benefit Trust (the “Trust”) has been established to administer the Group’s discretionary share scheme awards made to the employees of the Group. The Trust issues Company shares to the Group’s employees on their respective vesting dates subject to satisfying any service and performance conditions of each scheme. The Trust continues to be included in the Company’s financial statements in accordance with IFRS 10 ‘Consolidated Financial Statements’.
For the purpose of making awards under the Group’s share-based payment plans, shares in the Company are purchased and held by the Trust. These shares have been classified in the balance sheet as EBT shares within equity. Shares vested during the year are satisfied with these shares.
Notes to the Company financial statements continuedFor the year ended 31 December 2020
Petrofac Limited | 2020 Annual report and accounts206
Financial statements
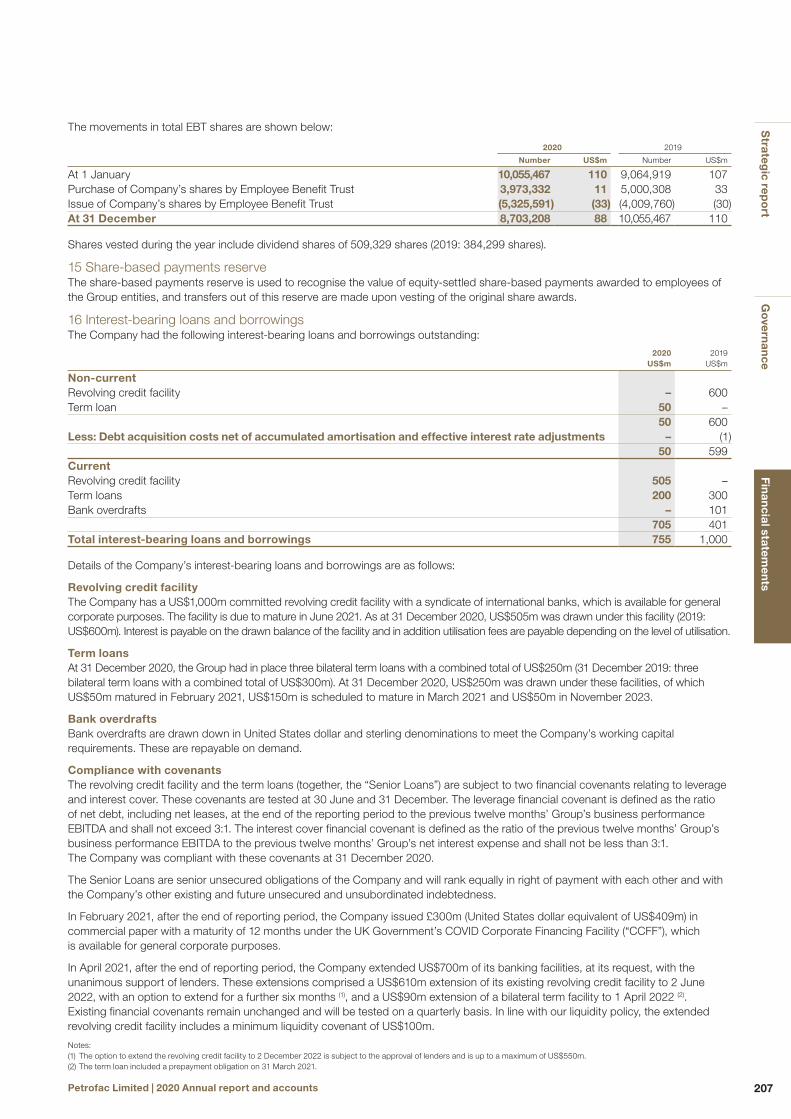
The movements in total EBT shares are shown below:
2020 2019
Number US$m Number US$m
At 1 January 10,055,467 110 9,064,919 107Purchase of Company’s shares by Employee Benefit Trust 3,973,332 11 5,000,308 33Issue of Company’s shares by Employee Benefit Trust (5,325,591) (33) (4,009,760) (30)At 31 December 8,703,208 88 10,055,467 110
Shares vested during the year include dividend shares of 509,329 shares (2019: 384,299 shares).
15 Share-based payments reserveThe share-based payments reserve is used to recognise the value of equity-settled share-based payments awarded to employees of the Group entities, and transfers out of this reserve are made upon vesting of the original share awards.
16 Interest-bearing loans and borrowings The Company had the following interest-bearing loans and borrowings outstanding:
2020 US$m
2019 US$m
Non-currentRevolving credit facility – 600Term loan 50 –
50 600Less: Debt acquisition costs net of accumulated amortisation and effective interest rate adjustments – (1)
50 599Current Revolving credit facility 505 –Term loans 200 300Bank overdrafts – 101
705 401Total interest-bearing loans and borrowings 755 1,000
Details of the Company’s interest-bearing loans and borrowings are as follows:
Revolving credit facilityThe Company has a US$1,000m committed revolving credit facility with a syndicate of international banks, which is available for general corporate purposes. The facility is due to mature in June 2021. As at 31 December 2020, US$505m was drawn under this facility (2019: US$600m). Interest is payable on the drawn balance of the facility and in addition utilisation fees are payable depending on the level of utilisation.
Term loansAt 31 December 2020, the Group had in place three bilateral term loans with a combined total of US$250m (31 December 2019: three bilateral term loans with a combined total of US$300m). At 31 December 2020, US$250m was drawn under these facilities, of which US$50m matured in February 2021, US$150m is scheduled to mature in March 2021 and US$50m in November 2023.
Bank overdraftsBank overdrafts are drawn down in United States dollar and sterling denominations to meet the Company’s working capital requirements. These are repayable on demand.
Compliance with covenantsThe revolving credit facility and the term loans (together, the “Senior Loans”) are subject to two financial covenants relating to leverage and interest cover. These covenants are tested at 30 June and 31 December. The leverage financial covenant is defined as the ratio of net debt, including net leases, at the end of the reporting period to the previous twelve months’ Group’s business performance EBITDA and shall not exceed 3:1. The interest cover financial covenant is defined as the ratio of the previous twelve months’ Group’s business performance EBITDA to the previous twelve months’ Group’s net interest expense and shall not be less than 3:1. The Company was compliant with these covenants at 31 December 2020.
The Senior Loans are senior unsecured obligations of the Company and will rank equally in right of payment with each other and with the Company’s other existing and future unsecured and unsubordinated indebtedness.
In February 2021, after the end of reporting period, the Company issued £300m (United States dollar equivalent of US$409m) in commercial paper with a maturity of 12 months under the UK Government’s COVID Corporate Financing Facility (“CCFF”), which is available for general corporate purposes.
In April 2021, after the end of reporting period, the Company extended US$700m of its banking facilities, at its request, with the unanimous support of lenders. These extensions comprised a US$610m extension of its existing revolving credit facility to 2 June 2022, with an option to extend for a further six months (1), and a US$90m extension of a bilateral term facility to 1 April 2022 (2). Existing financial covenants remain unchanged and will be tested on a quarterly basis. In line with our liquidity policy, the extended revolving credit facility includes a minimum liquidity covenant of US$100m.
Notes:(1) The option to extend the revolving credit facility to 2 December 2022 is subject to the approval of lenders and is up to a maximum of US$550m.(2) The term loan included a prepayment obligation on 31 March 2021.
Strateg
ic repo
rtG
overn
ance
Finan
cial statemen
ts
207Petrofac Limited | 2020 Annual report and accounts
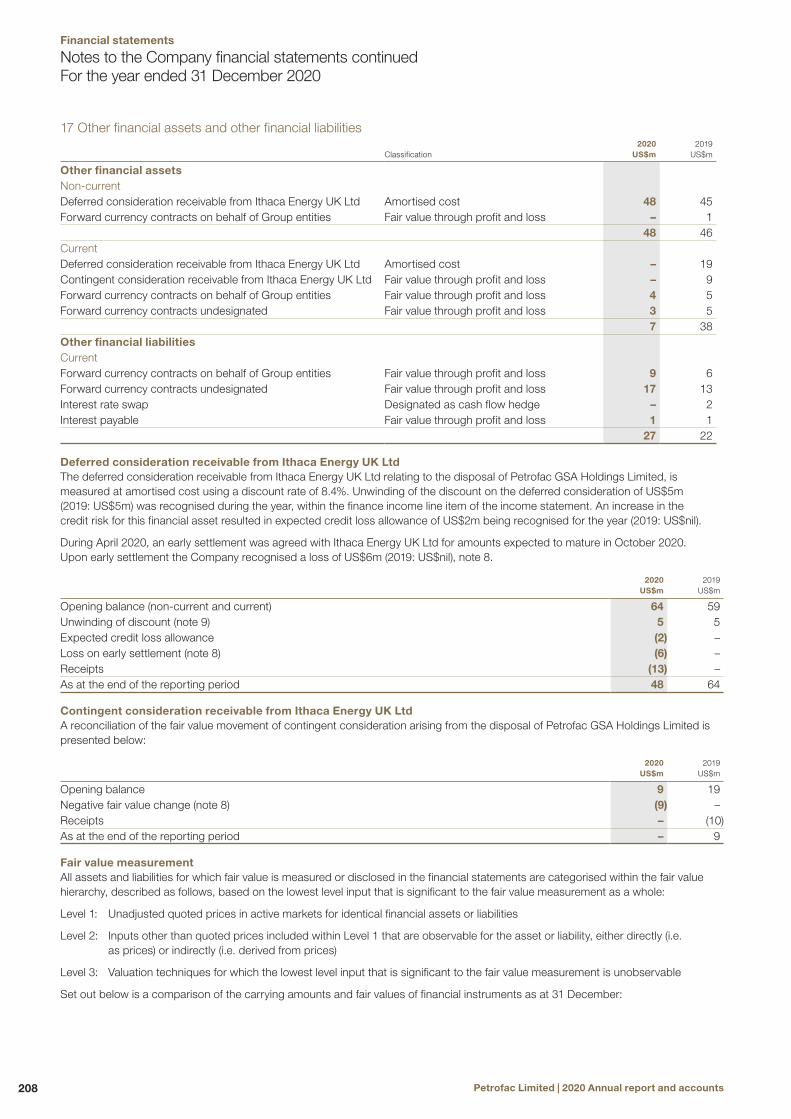
17 Other financial assets and other financial liabilities
Classification2020
US$m2019
US$m
Other financial assetsNon-currentDeferred consideration receivable from Ithaca Energy UK Ltd Amortised cost 48 45Forward currency contracts on behalf of Group entities Fair value through profit and loss – 1
48 46CurrentDeferred consideration receivable from Ithaca Energy UK Ltd Amortised cost – 19Contingent consideration receivable from Ithaca Energy UK Ltd Fair value through profit and loss – 9Forward currency contracts on behalf of Group entities Fair value through profit and loss 4 5Forward currency contracts undesignated Fair value through profit and loss 3 5
7 38Other financial liabilitiesCurrentForward currency contracts on behalf of Group entities Fair value through profit and loss 9 6Forward currency contracts undesignated Fair value through profit and loss 17 13Interest rate swap Designated as cash flow hedge – 2Interest payable Fair value through profit and loss 1 1
27 22
Deferred consideration receivable from Ithaca Energy UK LtdThe deferred consideration receivable from Ithaca Energy UK Ltd relating to the disposal of Petrofac GSA Holdings Limited, is measured at amortised cost using a discount rate of 8.4%. Unwinding of the discount on the deferred consideration of US$5m (2019: US$5m) was recognised during the year, within the finance income line item of the income statement. An increase in the credit risk for this financial asset resulted in expected credit loss allowance of US$2m being recognised for the year (2019: US$nil).
During April 2020, an early settlement was agreed with Ithaca Energy UK Ltd for amounts expected to mature in October 2020. Upon early settlement the Company recognised a loss of US$6m (2019: US$nil), note 8.
2020 US$m
2019 US$m
Opening balance (non-current and current) 64 59Unwinding of discount (note 9) 5 5Expected credit loss allowance (2) –Loss on early settlement (note 8) (6) –Receipts (13) –As at the end of the reporting period 48 64
Contingent consideration receivable from Ithaca Energy UK LtdA reconciliation of the fair value movement of contingent consideration arising from the disposal of Petrofac GSA Holdings Limited is presented below:
2020 US$m
2019 US$m
Opening balance 9 19Negative fair value change (note 8) (9) –Receipts – (10)As at the end of the reporting period – 9
Fair value measurementAll assets and liabilities for which fair value is measured or disclosed in the financial statements are categorised within the fair value hierarchy, described as follows, based on the lowest level input that is significant to the fair value measurement as a whole:
Level 1: Unadjusted quoted prices in active markets for identical financial assets or liabilities
Level 2: Inputs other than quoted prices included within Level 1 that are observable for the asset or liability, either directly (i.e. as prices) or indirectly (i.e. derived from prices)
Level 3: Valuation techniques for which the lowest level input that is significant to the fair value measurement is unobservable
Set out below is a comparison of the carrying amounts and fair values of financial instruments as at 31 December:
Notes to the Company financial statements continuedFor the year ended 31 December 2020
Petrofac Limited | 2020 Annual report and accounts208
Financial statements

Carrying amount Fair value
Level 2020
US$m2019
US$m2020
US$m2019
US$m
Financial assetsMeasured at amortised costCash and short-term deposits (note 13) Level 2 87 74 87 74Deferred consideration receivable from Ithaca Energy UK Ltd Level 2 48 64 48 64Measured at fair value through profit and lossContingent consideration receivable from Ithaca Energy UK Ltd Level 3 – 9 – 9Forward currency contracts on behalf of Group entities Level 2 4 6 4 6Forward currency contracts undesignated Level 2 3 5 3 5
Financial liabilitiesMeasured at amortised costInterest-bearing loans and borrowingsRevolving credit facility Level 2 505 599 505 600Term loans Level 2 250 300 250 300Bank overdrafts Level 2 – 101 – 101Interest payable Level 2 1 1 1 1Measured at fair value through profit and lossForward currency contracts on behalf of Group entities Level 2 9 6 9 6Forward currency contracts undesignated Level 2 17 13 17 13Interest rate swap Level 2 – 2 – 2
Management assessed the carrying amounts of trade and other receivables, amounts due from/due to Group entities and trade and other payables to approximate their fair values and are therefore excluded from the above table.
When the fair values of financial assets and financial liabilities recognised in the Company balance sheet cannot be measured based on quoted prices in active markets, their fair value is measured using valuation techniques including discounted cash flow (“DCF”) model. The inputs to these models are taken from observable markets where possible, but where such information is not available, a degree of judgement is required in establishing fair values. Judgements include considerations of inputs such as liquidity risk, credit risk and volatility. Changes in assumptions relating to these factors could affect the recognised fair value of financial instruments and are discussed further below.
The following methods and assumptions were used to estimate the fair values for material financial instruments:
— The Company enters into derivative financial instruments with various counterparties, principally financial institutions with investment grade credit ratings. Foreign exchange forward contracts are valued using valuation techniques, which employ the use of market observable inputs. The most frequently applied valuation techniques include forward pricing using present value calculations. The models incorporate various inputs including the credit quality of counterparties, foreign exchange spot and forward rates, yield curves of the respective currencies, currency basis spreads between the respective currencies, interest rate curves and forward rate curves of the underlying commodity. — The fair value of deferred consideration receivable from Ithaca Energy UK Ltd is equivalent to its amortised cost determined as the present value of discounted future cash flows using the discount rate of 8.4%. — The fair values of long-term interest-bearing loans and borrowings are equivalent to their amortised costs determined as the present value of discounted future cash flows using the effective interest rate.
Changes in liabilities arising from financing activities1 January
2020 US$m
Cash inflows US$m
Cash outflows
US$m
31 December 2020
US$m
Interest-bearing loans and borrowings (1)
At 31 December 2020 900 870 (1,015) 755At 31 December 2019 620 1,390 (1,110) 900
Note: (1) Interest-bearing loans and borrowings excludes overdrafts, since these are included within cash and equivalents. At 31 December 2020 there were no overdrafts (2019: US$101m).
Strateg
ic repo
rtG
overn
ance
Finan
cial statemen
ts
209Petrofac Limited | 2020 Annual report and accounts

18 Commitments and contingent liabilitiesCommitmentsIn the normal course of business, the Company will obtain surety bonds, letters of credit and guarantees, which are contractually required to secure performance, advance payment or in lieu of retentions being withheld. Some of these facilities are secured by issue of corporate guarantees on behalf of Group entities by the Company in favour of the issuing banks.
At 31 December 2020, the Company had outstanding letters of guarantee, including performance and advance payments of US$702m (2019: US$1,030m).
At 31 December 2020, the Company had outstanding forward exchange contracts amounting to US$1,910m (2019: US$2,300m). These commitments consist of future obligations either to acquire or to sell designated amounts of foreign currency at agreed rates and value dates.
Capital commitmentsIn 2014, the Company entered into a sale and purchase agreement (“SPA”) with the buyer to dispose 80% of the shares in PetroFirst Infrastructure Limited (formerly Petrofac FPSO Holdings Limited) that owned the floating platform assets. In accordance with the terms of the SPA the buyer had an option to put the floating platform assets i.e. Jasmine floating, production and storage unit (“FPSO“) and West Desaru mobile offshore production unit (“MOPU“) to the Company, the put options terminate at the end of 31 December 2030.
In April 2021, after the end of the reporting period, a lease in respect of the MOPU that was due to expire on 30 April 2021 relating to Block PM304 in Malaysia was extended to 30 September 2026. Management expects that the put option associated with the MOPU of US$20m will be payable on the lease expiry i.e. 30 September 2026.
A lease in respect of the FPSO is due to expire on 31 December 2023, management expects that the put option associated with the FPSO of US$10m will be payable on the lease expiry i.e. 31 December 2023.
Other matterAs described in pages 9, 67, 69, 90 and 99 of the 2020 Annual Report and Accounts, on 12 May 2017, the UK Serious Fraud Office (“SFO”) announced an investigation into the activities of Petrofac, its subsidiaries, and their officers, employees and agents for suspected bribery, corruption, and/or money laundering. In February 2019 and January 2021, a former employee of a Petrofac subsidiary admitted offences contrary to the UK Bribery Act 2010 (“the Act”). These charges relate to historic contract awards in Saudi Arabia, Iraq and the UAE in the period 2012 to 2015. No charges have been brought against any Group company or any other officers or employees. Although not charged, a small number of former Petrofac employees are alleged to have acted together with the individual concerned. The SFO investigation is ongoing and the Group continues to engage with the SFO and will respond to any further developments as appropriate. The Group is focused on bringing this matter to closure as quickly as possible and believe this is in the best interests of all stakeholders. The existence of any possible future financial obligations (such as fines or penalties), or other consequences, is unable to be determined at this time.
19 Risk management and financial instrumentsRisk management objectives and policiesThe Company’s principal financial assets and liabilities are amounts due from and due to Group entities, forward currency contracts, cash and short-term deposits and interest-bearing loans and borrowings.
The Company’s activities expose it to various financial risks particularly associated with interest rate risks on its external variable rate loans and borrowings. The Company has a policy not to enter speculative trading of financial derivatives.
The other main risks besides interest rate are foreign currency risk, credit risk and liquidity risk; the policies relating to these risks are discussed in detail below:
Interest rate riskInterest rate risk arises from the possibility that changes in interest rates will affect the value of the Company’s interest-bearing financial liabilities and assets. The Company does not hedge its exposure on its interest-bearing funding to/from Group entities.
Interest rate sensitivity analysisThe impact on the Company’s before tax profit and equity due to a reasonably possible change in interest rates is demonstrated in the table below.
The analysis assumes that all other variables remain constant.
Before tax profit Equity
100 basis point increase
US$m
100 basis point decrease
US$m
100 basis point increase
US$m
100 basis point decrease
US$m
31 December 2020 1 (1) – –31 December 2019 4 (4) – –
Notes to the Company financial statements continuedFor the year ended 31 December 2020
Petrofac Limited | 2020 Annual report and accounts210
Financial statements

The following table reflects the maturity profile of interest-bearing financial assets and liabilities that are subject to interest rate risk:
Year ended 31 December 2020
Within 1 year US$m
1–2 years US$m
2–3 years US$m
3–4 years US$m
4–5 years US$m
More than 5 years
US$mTotal
US$m
Financial liabilities – floating ratesRevolving credit facility 505 – – – – – 505Term loans 200 50 – – – – 250Amount due to Group entities (interest-bearing) 355 – – – – – 355
1,060 50 – – – – 1,110Financial assets – floating ratesCash and short-term deposits (note 13) 87 – – – – – 87Amount due from Group entities (interest-bearing) 897 – – – – – 897
984 – – – – – 984
Year ended 31 December 2019
Within 1 year US$m
1–2 years US$m
2–3 years US$m
3–4 years US$m
4–5 years US$m
More than 5 years US$m
Total US$m
Financial liabilities – floating ratesBank overdrafts 101 – – – – – 101Revolving credit facility – 600 – – – – 600Term loans 150 – – – – – 150Amount due to Group entities (interest-bearing) 1,394 – – – – – 1,394
1,645 600 – – – – 2,245Financial assets – floating rates Cash and short-term deposits (note 13) 74 – – – – – 74Amount due from Group entities (interest-bearing) 1,890 – – – – – 1,890
1,964 – – – – – 1.964
Interest on financial instruments classified as floating rate is repriced at intervals of less than one year.
Foreign currency riskThe Company is exposed to foreign currency risk on translation of assets and liabilities that are in a currency other than the United States dollar reporting currency of the Company.
The Company uses forward currency contracts to manage the foreign currency exposure on all amounts due from and due to Group entities.
The Company is only exposed to foreign currency exposure relating to cash and bank balances and an amount of sterling £13m (2019: £5m) payable to a subsidiary at the end of the reporting period.
The following table summarises the impact on the Company’s profit before tax and equity (due to change in the fair value of monetary assets and liabilities) of a reasonably possible change in US dollar exchange rates with respect to different currencies:
Before tax profit Equity
+10% US dollar rate
increase US$m (1)
–10% US dollar rate decrease US$m (1)
+10% US dollar rate
increase US$m
–10% US dollar rate decrease
US$m
31 December 2020 (11) 11 – –31 December 2019 (23) 23 – –
Note: (1) Includes impact on pegged currencies mainly relating to interest-bearing loans and borrowings denominated in Arab Emirates dirham.
Strateg
ic repo
rtG
overn
ance
Finan
cial statemen
ts
211Petrofac Limited | 2020 Annual report and accounts

19 Risk management and financial instruments continuedAt 31 December 2020, the Company had foreign exchange forward contracts as follows:
Contract value Fair value
2020 US$m
2019 US$m
2020 US$m
2019 US$m
Euro (sales)/purchases (71) 179 (2) 1Sterling sales (230) (555) (14) (9)Kuwaiti dinar sales (343) (513) (3) (1)Russian ruble purchases – (4) – 1Arab Emirates dirham purchases 150 150 – –
(19) 8
The above foreign exchange contracts mature and will affect income between January 2020 and May 2022 (2019: between January 2020 and May 2022).
Credit riskThe Company’s principal financial assets are cash and short-term deposits and amounts due from Group entities.
The Company manages its credit risk in relation to cash and short-term deposits by only depositing cash with financial institutions that have high credit ratings provided by international credit rating agencies.
Liquidity riskThe Company’s objective is to maintain a balance between continuity of funding and flexibility through the use of revolving credit facility and term loans, to reduce its exposure to liquidity risk.
The maturity profiles of the Company’s financial liabilities at 31 December 2020 are as follows:
Year ended 31 December 2020
6 months or less US$m
6–12 months US$m
1–2 years US$m
2–5 years US$m
More than 5 years
US$m
Contractual undiscounted
cash flows US$m
Carrying amount
US$m
Financial liabilitiesInterest-bearing loans and borrowings 705 – – 50 – 755 755Trade and other payables 2 – – – – 2 2Amounts due to Group entities – 369 – – – 369 369Derivative instruments 23 3 – – – 26 26Interest payments 9 1 2 2 – 14 –
739 373 2 52 – 1,166 1,152
Year ended 31 December 2019
6 months or less US$m
6–12 months US$m
1–2 years US$m
2–5 years US$m
More than 5 years US$m
Contractual undiscounted
cash flows US$m
Carrying amount
US$m
Financial liabilitiesInterest-bearing loans and borrowings 176 225 600 – – 1,001 1,000Trade and other payables 2 – – – – 2 2Amounts due to Group entities – 1,401 – – – 1,401 1,401Derivative instruments 19 2 – – – 21 21Interest payments 13 16 23 – – 52 –
210 1,644 623 – – 2,477 2,424
The Company uses various funded facilities provided by banks and its own financial assets to fund the above-mentioned financial liabilities.
Notes to the Company financial statements continuedFor the year ended 31 December 2020
Petrofac Limited | 2020 Annual report and accounts212
Financial statements

Capital managementThe Company’s policy is to maintain a robust capital base using a combination of external and internal financing to support its activities as the holding company for the Group.
The Company’s gearing ratio is as follows:
2020 US$m
2019 US$m
Cash and short-term deposits (note 13) 87 74Interest-bearing loans and borrowings (A) (note 16) (755) (1,000)Net debt (B) (668) (926)Total equity (C) 243 547Gross gearing ratio (A/C) 310.7% 182.8%Net gearing ratio (B/C) 274.9% 169.3%
20 Related party transactionsThe Company’s related parties consist of the Group entities, and the transactions and amounts due to/due from them are either of funding or investing nature. The Company recharged share-based payment costs of US$19m (2019: US$30m) to the Group entities in relation to the Group’s share-based payment plans for the Group’s employees. In addition, the Company also obtained letters of guarantees on behalf of the Group entities and the cost of US$5m (2019: US$5m) incurred on such guarantees was recharged by the Company to the Group entities. The Company also received dividends from its subsidiaries and associates of US$239m (2019: US$331m), note 3.
The remuneration paid by the Company to its non-executive directors was US$1m (2019: US$1m). The Company was also recharged a portion of the key management personnel cost by one of its subsidiaries. The amount recharged during the year was US$13m (2019: US$16m), of which key management personnel cost was US$2m (2019: US$2m). For further details of the full amount of key management personnel costs, refer to note 32 of the consolidated financial statements.
21 Share capitalThere was no movement in the number of issued and fully paid ordinary shares during the year.
The share capital comprises only one class of ordinary shares. The ordinary shares carry a voting right and the right to a dividend.
Share premium: The balance on the share premium account represents the amount received in excess of the nominal value of the ordinary shares.
Capital redemption reserve: The balance on the capital redemption reserve represents the aggregated nominal value of the ordinary shares repurchased and cancelled.
Strateg
ic repo
rtG
overn
ance
Finan
cial statemen
ts
213Petrofac Limited | 2020 Annual report and accounts

Glossary
AAGMAnnual General Meeting
AIRBAsset Integrity Review Board
Appraisal WellA well drilled into a discovered accumulation to provide data necessary to define a Field Development Plan for the accumulation
BBacklogBacklog consists of the estimated revenue attributable to the uncompleted portion of fixed-price engineering, procurement and construction contracts and variation orders plus, with regard to engineering, operations, maintenance and Integrated Energy Services contracts, the estimated revenue attributable to the lesser of the remaining term of the contract and five years. Backlog will not be booked on Integrated Energy Services contracts where the Group has entitlement to reserves. The Group uses this key performance indicator as a measure of the visibility of future earnings. Backlog is not an audited measure
BarrelA unit of volume measurement used for petroleum
bblOne barrel of oil
BlockA subdivision of an underground petroleum reservoir, by a resource owner, for the purposes of licensing and administering exploration, appraisal and production of resources, by oil and gas companies
boeBarrel of oil equivalent
bpdBarrel per day
Brownfield DevelopmentFurther investment in a mature field, to enhance its production capacity, thereby increasing recovery and extending field life
CCapexCapital expenditure
Carbon capture The process of capturing waste carbon dioxide
CCUSCarbon capture, utilisation and storage
CISCommonwealth of Independent States
CondensateThe liquid produced by the condensation of steam or any other gas
Cost plus KPIsA reimbursable contract which includes an incentive income linked to the successful delivery of key performance indicators (KPIs)
DDBSPDeferred bonus share plan
DECCDepartment of Energy and Climate Change (UK)
DecommissioningThe re-use, recycling and disposal of redundant oil and gas facilities
DownstreamThe downstream sector commonly refers to the refining of petroleum crude oil and the processing and purifying of raw natural gas, as well as the marketing and distribution of products derived from crude oil and natural gas
Duty HolderA contracting model under which Petrofac provides a complete managed service, covering production and maintenance work, both offshore and onshore, to reduce the costs of operating and to extend the life of the facilities
EEBITDACalculated as profit before tax and net finance costs and income, but after our share of profits/losses from associates and joint ventures (as per the consolidated income statement), adjusted to add back charges for depreciation and amortisation (as per note 3 to the financial statements)
EBTEmployee Benefit Trust
E&CEngineering & Construction
EPCEngineering, Procurement and Construction
EPCCEngineering, Procurement, Construction and Commissioning
EPCICEngineering, Procurement, Construction, Installation and Commissioning
EPCIEngineering, Procurement, Construction and Installation
EPCmEngineering, Procurement and Construction management
EPSEarnings per share
EPS EastEngineering & Production Services East
EPS WestEngineering & Production Services West
ESGEnvironmental, Social, Governance
ETREffective Tax Rate
FFCAFinancial Conduct Authority
FCPAForeign Corrupt Practices Act
FEEDFront-End Engineering and Design
Field Development Plan (FDP)A document setting out the manner in which a hydrocarbon discovery is to be developed and operated
Fixed-price turnkey projectAn agreement in which a contractor designs, constructs, and manages a project until it is ready to be handed over to the customer and operation can begin immediately
FPSOFloating Production, Storage and Offloading vessel
FPFFloating Production Facility
FRCFinancial Reporting Council
GGas fieldA field containing natural gas but no oil
GHG Greenhouse Gas
Greenfield developmentDevelopment of a new field
Petrofac Limited | 2020 Annual report and accounts214
Financial statements
H
HSEHealth & Safety Executive (UK)
HSSIHealth, safety, security, and integrity assurance
HVACHigh-voltage alternating current
HVDCHigh-voltage direct current
HydrocarbonA compound containing only the elements hydrogen and carbon – can be solid, liquid or gas
IIASInternational Accounting Standards
ICVIn-country Value
IEAInternational Energy Agency
IESIntegrated Energy Services. The IES division harnesses Petrofac’s existing service capabilities and delivers them on an integrated basis to resource holders with the aim of supporting the development of their oil and gas resources, enhancing production from their mature reservoirs and helping them to build national capability
IFRSInternational Financial Reporting Standards
IKTVAIn Kingdom Total Value Add is Saudi Aramco’s measure of local content
IOCInternational oil company
KKPIKey performance indicator
LLNGLiquefied natural gas
LPGLiquefied petroleum gas
LTILost time injury
MmboeMillion barrels of oil equivalents
MENAMiddle East and North Africa region
MMscfdMillion standard cubic feet per day
MOUMemorandum of understanding
NNew EnergiesArea focusing on opportunities presented by the energy transition
NOCNational oil company
OOECDOrganisation for Economic Co-operation and Development
Oil fieldA geographic area under which an oil reservoir lies
OPECOrganisation of Petroleum Exporting Countries
PPARIS agreement A legal binding international treaty on climate change, which was adopted by 196 parties at COP 21 in Paris on 12 December 2015. Its goal is to limit global warming to below 2, preferably to 1.5 degrees celsius, compared to pre-industrial levels.
PECProduction Enhancement Contract is where Petrofac is paid a tariff per barrel for oil and gas production and therefore has no commodity price exposure. PECs are appropriate for mature fields which have a long production history
PMCProject Management Contractor – managing an external construction contractor to manage construction of a facility
PSCProduction Sharing Contract
PSPPerformance share plan
RReimbursable servicesWhere the cost of Petrofac’s services are reimbursed by the customer plus an agreed margin
RIRecordable injury
ROCEReturn on capital employed
RSPRestricted share plan
SSIPShare incentive plan
SMEsSmall and medium-sized enterprises
TTCFDTask Force on Climate-related Financial Disclosures
TSRTotal shareholder return
UUKCSUnited Kingdom Continental Shelf
UNGCUnited Nations Global Compact
UpstreamThe segment of the petroleum industry relating to exploration, development and production of oil and gas resources
Strateg
ic repo
rtG
overn
ance
Finan
cial statemen
ts
215Petrofac Limited | 2020 Annual report and accounts

Shareholder informationas at December 2020
RegistrarEquiniti (Jersey) Limited26 New StreetSt HelierJersey JE2 3RA
Auditors Ernst & Young LLP1 More London PlaceLondon SE1 2AF
Corporate Brokers Goldman SachsPeterborough Court133 Fleet StreetLondon EC4A 2BB
JP Morgan Cazenove25 Bank StreetCanary WharfLondon E14 5JP
Legal Advisers to the Company Linklaters LLPOne Silk StreetLondon EC2Y 8HQ
Corporate and Financial PRTulchan Communications Group85 Fleet StreetLondon EC4Y 1AE
Company Secretary and Registered OfficeIntertrust Corporate Services (Jersey) Limited44 EsplanadeSt HelierJersey JE4 9WG
Stock Exchange Listing Petrofac shares are listed on the London Stock Exchange using code ‘PFC.L’.
Annual General Meeting17 June 2021
AnnouncementsCopies of all announcements are available on the Company’s website at www.petrofac.com following release.
Shareholder warningShareholders should be very wary of any unsolicited advice, offers to buy shares at a discount or offers of free company reports on the Company. Fraudsters use persuasive and high-pressure tactics to lure investors into scams and they may offer to sell shares that often turn out to be worthless, overpriced or even non-existent. Whilst high returns are promised, those who invest usually end up losing their money.
Please keep in mind that firms authorised by the Financial Conduct Authority (‘FCA’) are unlikely to contact you out of the blue. If you receive any unsolicited investment advice:
— make sure you get the correct name of the person and organisation and make a record of any other information they give you, eg telephone number, address, ask for their “firm reference number” (FRN) — Check that they are properly authorised by FCA before getting involved. You can check the FCA register at https://register.fca.org.uk/ or call +44 (0)800 111 6768 — Report approaches to the FCA – a list of unauthorised overseas firms who are targeting, or have targeted, UK investors is maintained. Reporting such organisations means the list can be kept up to date and appropriate action be considered — Inform Link Market Services (Jersey) Limited, our Registrars. They are not able to investigate such incidents themselves, but will record the details and pass them on to the Company and liaise with the FCA on your behalf — Consider that if you deal with an unauthorised firm, you would not be eligible to receive payment under the Financial Services Compensation Scheme
If you suspect you have been approached by fraudsters please contact the FCA using the share fraud reporting form atfca.org.uk/scams.
You can also call the FCA Helpline on:0800 111 6768 (UK freephone) or 0300 500 8082 (UK), or+44 207 066 1000 (outside UK)
If you have already paid money to share fraudsters, you should contact Action Fraud on 0300 123 2040 or online atwww.actionfraud.police.uk.
Petrofac Limited | 2020 Annual report and accounts216
Financial statements

Consultancy, design and productionwww.luminous.co.uk
Design and productionwww.luminous.co.uk
Printed by PUSH www.push-print.com
This is report printed on FSC certified papers that have been carbon balanced. The paper is made at a mill with EMAS and ISO 14001 environmental management system accreditation.
This report has been printed using inks made from non-hazardous vegetable oil derived from renewable sources.
Over 90% of solvents are recycled for further use and recycling initiatives are in place for all other waste associated with this production. The printer is FSC and ISO 14001 certified, the internationally recognised standard for best practice on the environment. The energy used in the production has been carbon offset.

Petrofac Services Limited 117 Jermyn Street London SW1Y 6HH United Kingdom Tel: +44 20 7811 4900
www.petrofac.com