enabling customer driven innovations using business architecture
TRANSCRIPT
Enabling Customer-Driven Innovations Using Business Architecture
Daniel Lambert, M Sc.
VP – Business ArchitectureBenchmark Consulting USA LLC
Email: [email protected] number:
(855) 798-2042 x2010Benchmark Consulting USA LLC Copyright 2017 – All Rights Reserved
BBC 2017 Orlando
November 8, 2017
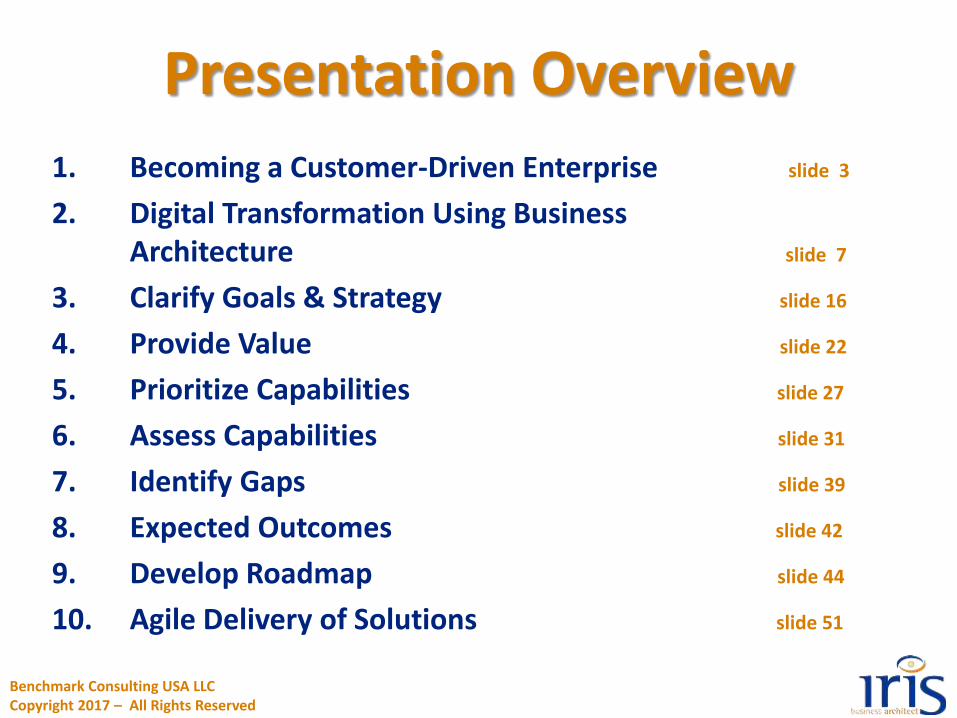
1. Becoming a Customer-Driven Enterprise slide 3
2. Digital Transformation Using Business Architecture slide 7
3. Clarify Goals & Strategy slide 16
4. Provide Value slide 22
5. Prioritize Capabilities slide 27
6. Assess Capabilities slide 31
7. Identify Gaps slide 39
8. Expected Outcomes slide 42
9. Develop Roadmap slide 44
10. Agile Delivery of Solutions slide 51
Presentation Overview
Benchmark Consulting USA LLCCopyright 2017 – All Rights Reserved
Section 1Becoming a Customer
Driven Enterprise
Benchmark Consulting USA LLCCopyright 2017 – All Rights Reserved
Benchmark Consulting USA LLC Copyright 2017 – All Rights Reserved
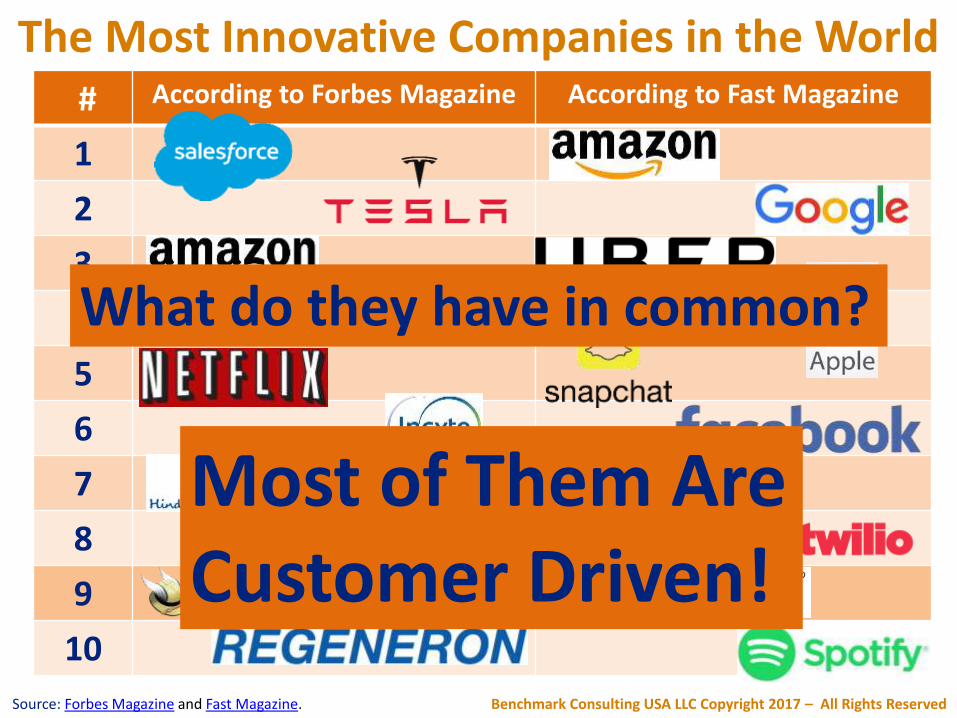
The Most Innovative Companies in the World
Source: Forbes Magazine and Fast Magazine.
# According to Forbes Magazine According to Fast Magazine
1
2
3
4
5
6
7
8
9
10
What do they have in common?
Most of Them AreCustomer Driven!
Benchmark Consulting USA LLCCopyright 2017 – All Rights Reserved
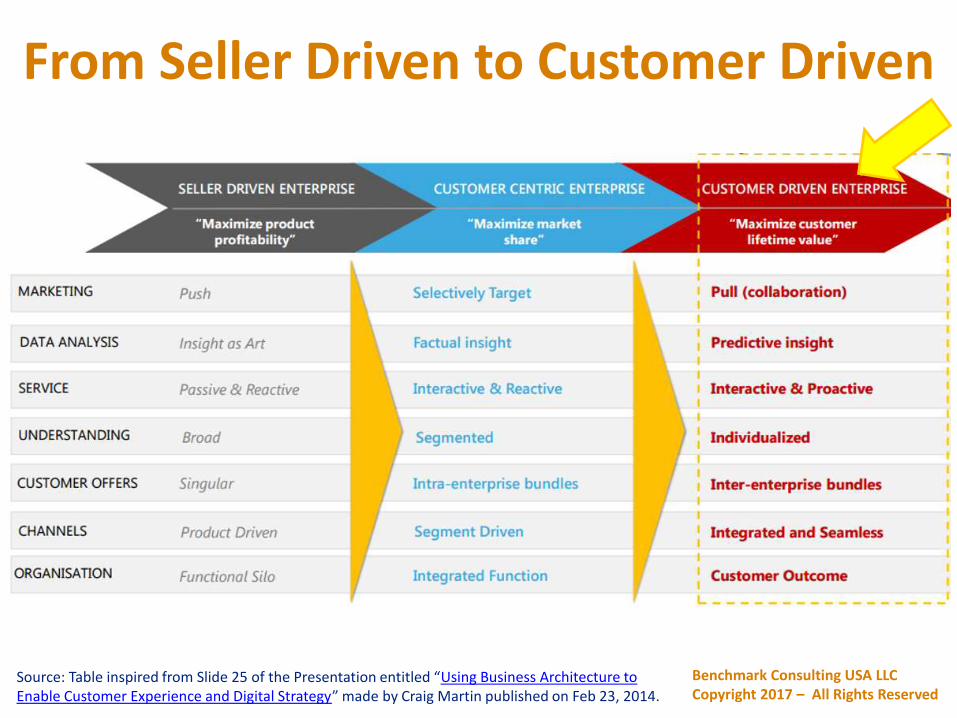
From Seller Driven to Customer Driven
Source: Table inspired from Slide 25 of the Presentation entitled “Using Business Architecture to Enable Customer Experience and Digital Strategy” made by Craig Martin published on Feb 23, 2014.
Benchmark Consulting USA LLCCopyright 2017 – All Rights Reserved
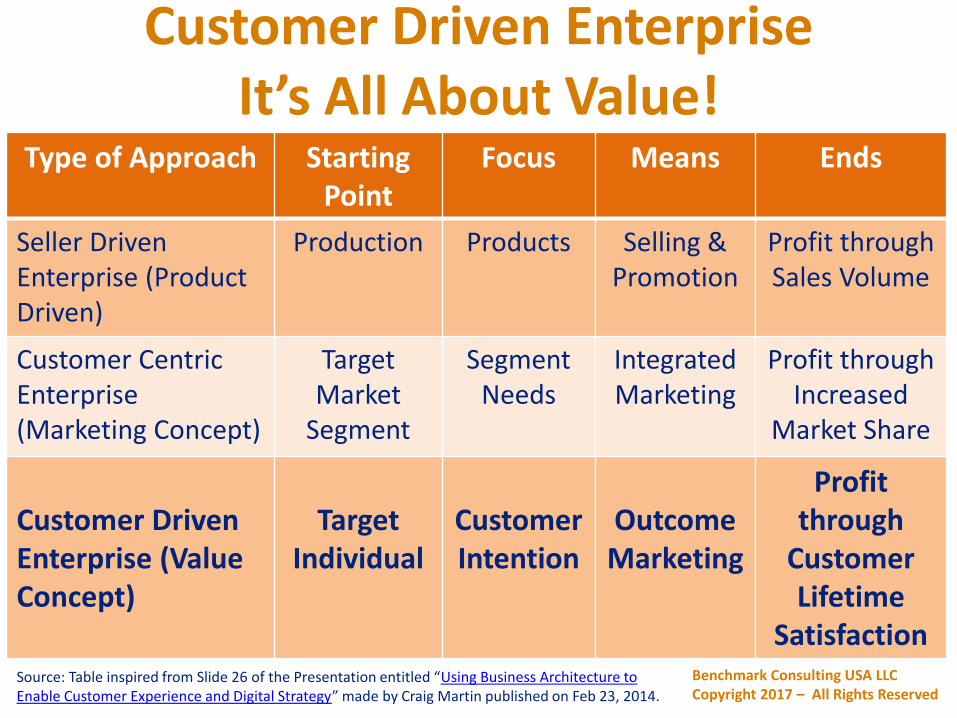
Customer Driven EnterpriseIt’s All About Value!
Source: Table inspired from Slide 26 of the Presentation entitled “Using Business Architecture to Enable Customer Experience and Digital Strategy” made by Craig Martin published on Feb 23, 2014.
Type of Approach Starting Point
Focus Means Ends
Seller Driven Enterprise (Product Driven)
Production Products Selling & Promotion
Profit through Sales Volume
Customer Centric Enterprise (Marketing Concept)
Target Market
Segment
Segment Needs
Integrated Marketing
Profit through Increased
Market Share
Customer Driven Enterprise (Value Concept)
Target Individual
Customer Intention
Outcome Marketing
Profit through
Customer Lifetime
Satisfaction
Section 2Digital Transformation
Using Business Architecturein Large Organizations
Benchmark Consulting USA LLCCopyright 2017 – All Rights Reserved
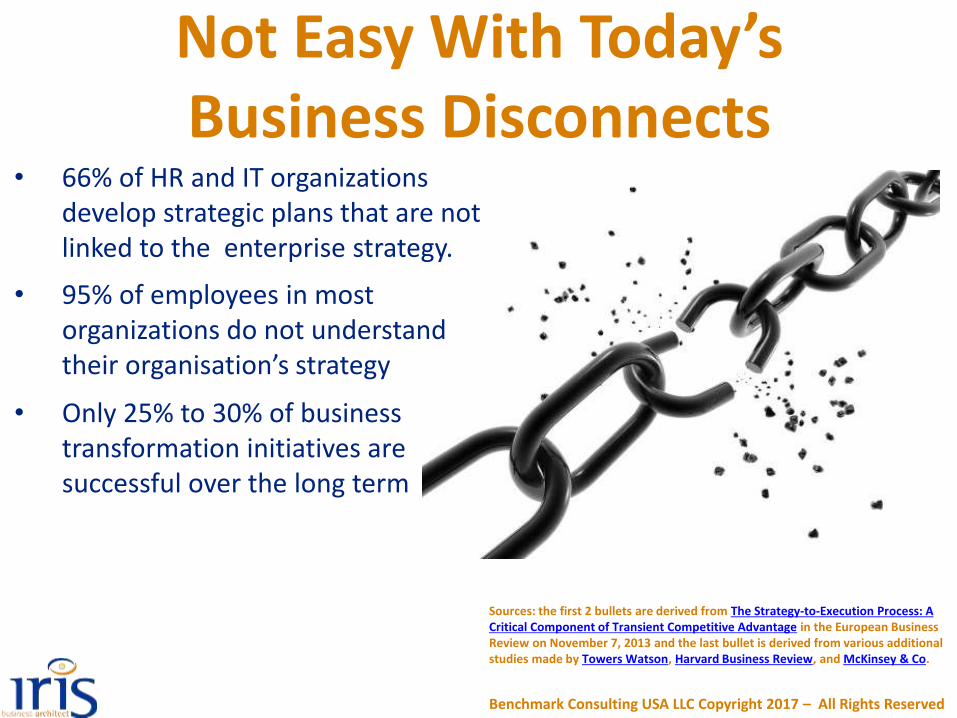
• 66% of HR and IT organizations develop strategic plans that are not linked to the enterprise strategy.
Sources: the first 2 bullets are derived from The Strategy-to-Execution Process: A Critical Component of Transient Competitive Advantage in the European Business Review on November 7, 2013 and the last bullet is derived from various additional studies made by Towers Watson, Harvard Business Review, and McKinsey & Co.
Not Easy With Today’s Business Disconnects
Benchmark Consulting USA LLC Copyright 2017 – All Rights Reserved
• 95% of employees in most organizations do not understand their organisation’s strategy
• Only 25% to 30% of business transformation initiatives are successful over the long term
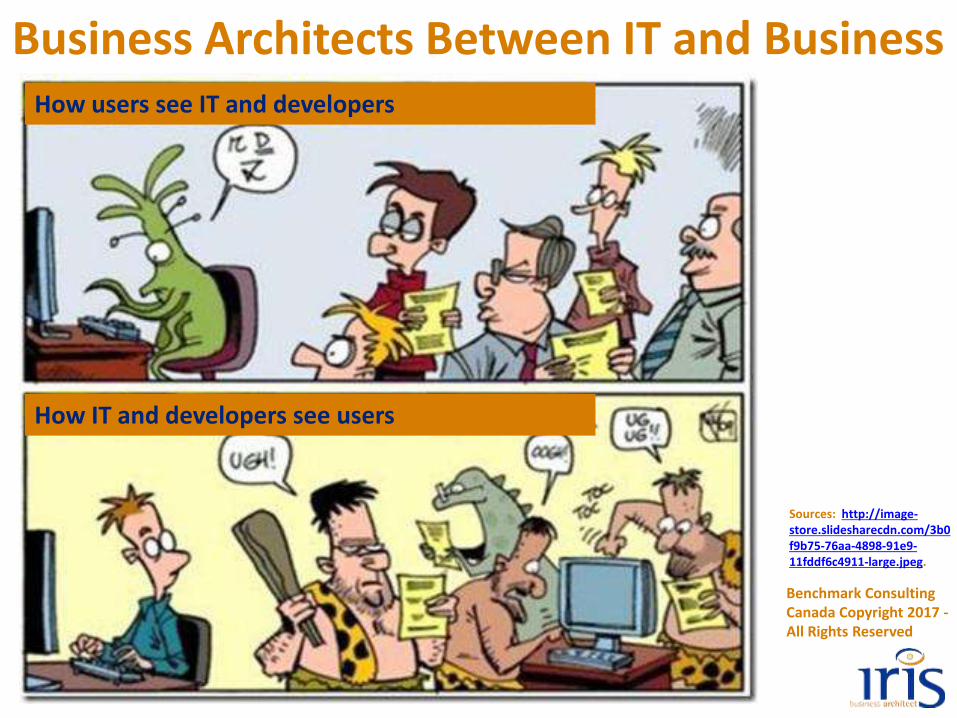
Business Architects Between IT and Business
Benchmark Consulting Canada Copyright 2017 -All Rights Reserved
Sources: http://image-store.slidesharecdn.com/3b0f9b75-76aa-4898-91e9-11fddf6c4911-large.jpeg.
How users see IT and developers
How IT and developers see users
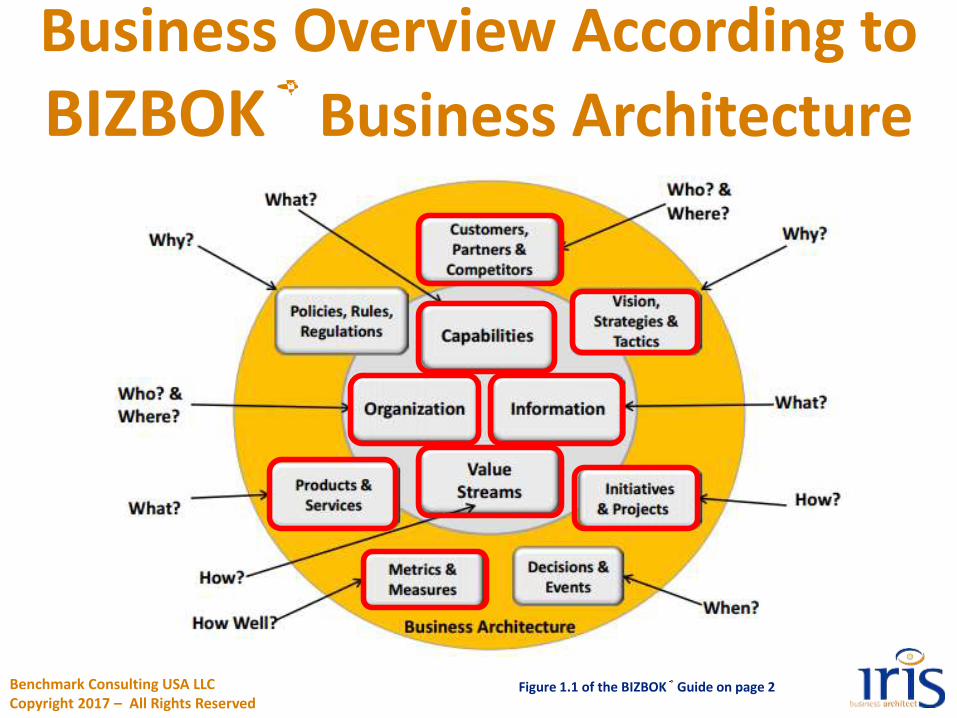
Business Overview According to
BIZBOK® Business Architecture
Figure 1.1 of the BIZBOK® Guide on page 2Benchmark Consulting USA LLCCopyright 2017 – All Rights Reserved
Benchmark Consulting USA LLCCopyright 2017 – All Rights Reserved
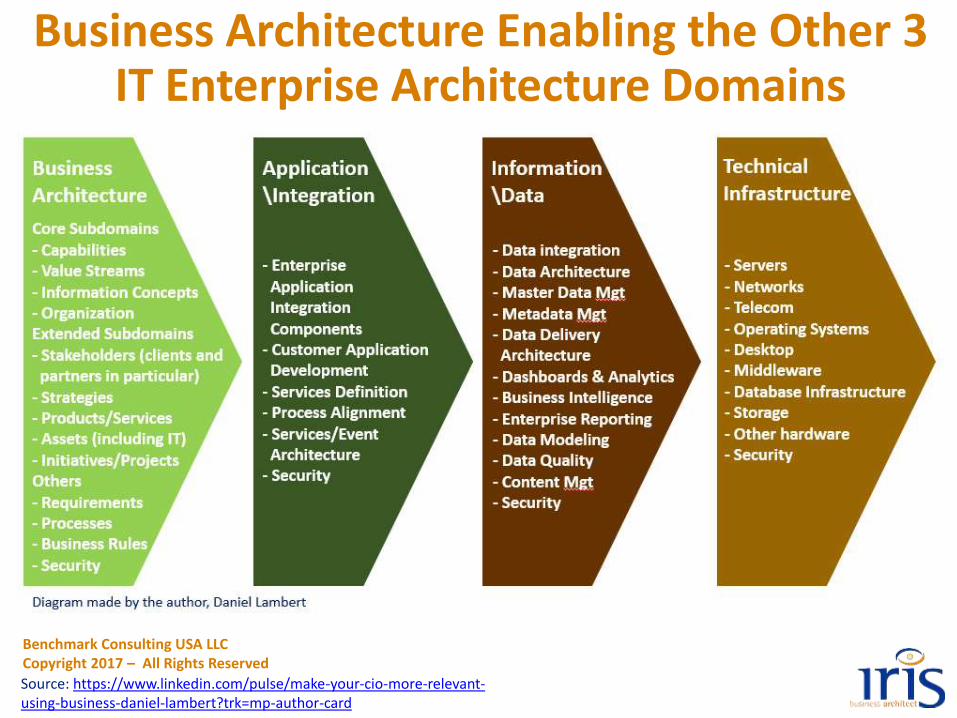
Business Architecture Enabling the Other 3 IT Enterprise Architecture Domains
Source: https://www.linkedin.com/pulse/make-your-cio-more-relevant-using-business-daniel-lambert?trk=mp-author-card
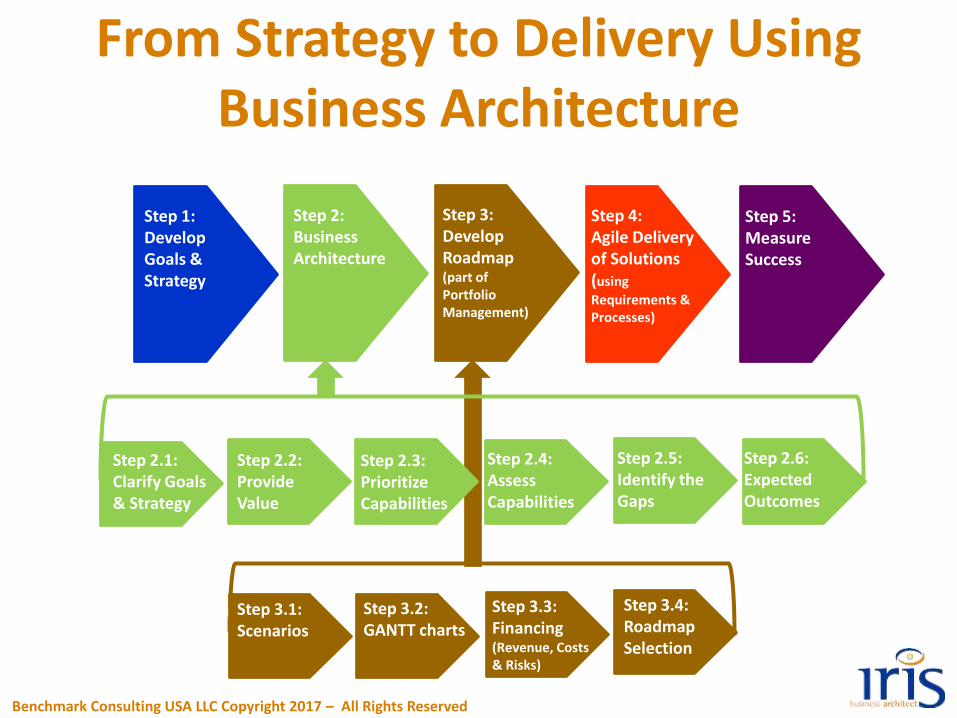
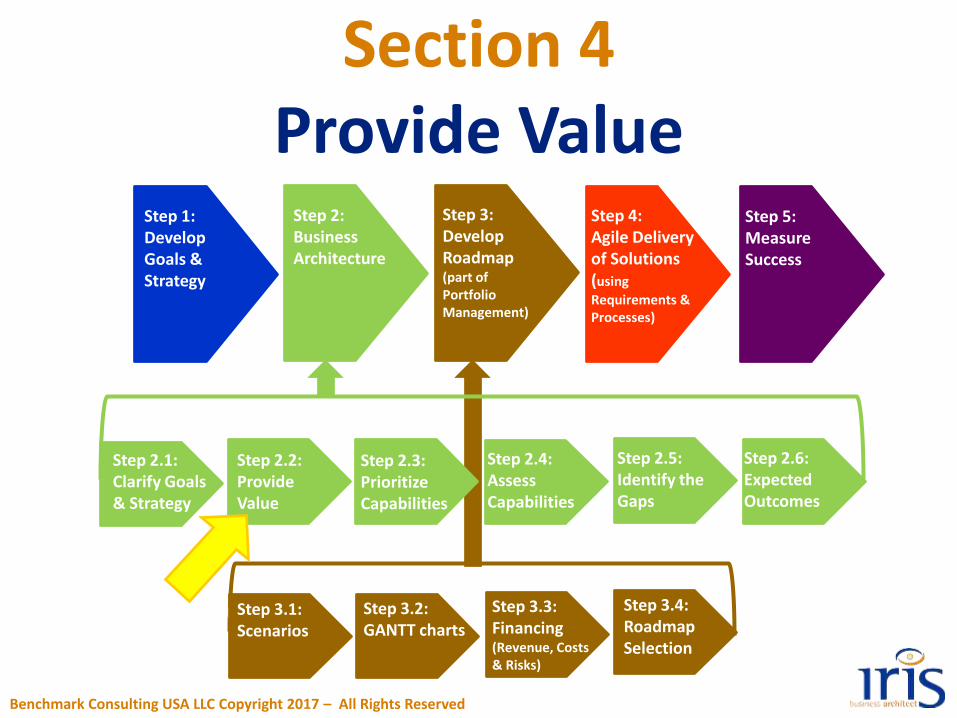
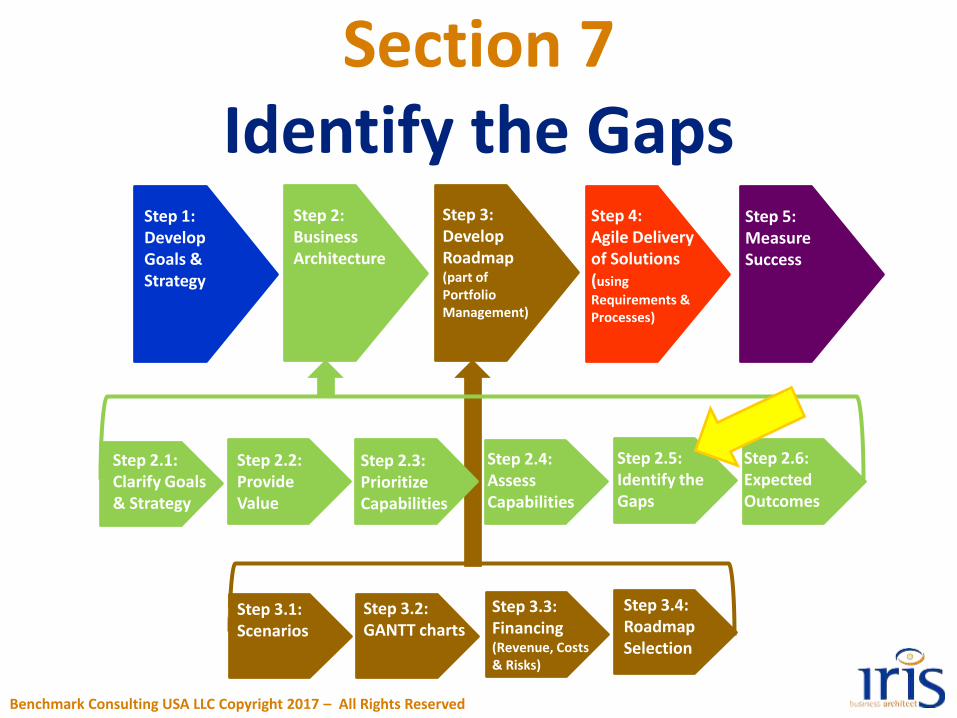
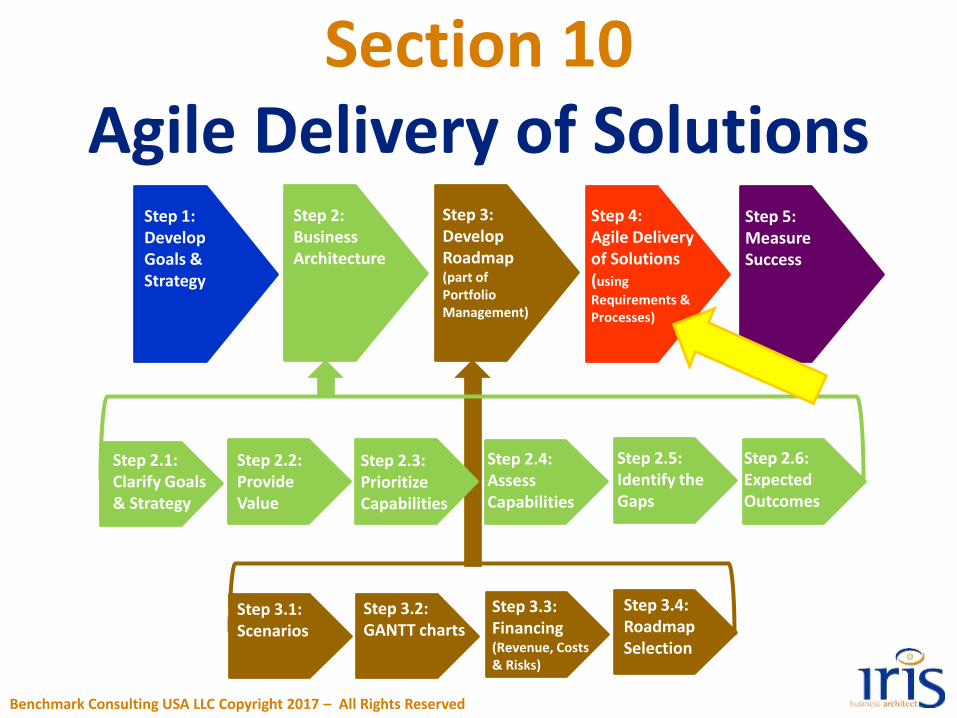
Step 1: Develop Goals & Strategy
Step 2:Business Architecture
Step 3:Develop Roadmap (part of Portfolio Management)
Step 4: Agile Delivery of Solutions (using
Requirements & Processes)
Step 5: Measure Success
Step 2.2: Provide Value
Step 2.4: Assess Capabilities
Step 2.1: Clarify Goals & Strategy
Step 2.5: Identify the Gaps
Step 2.6: Expected Outcomes
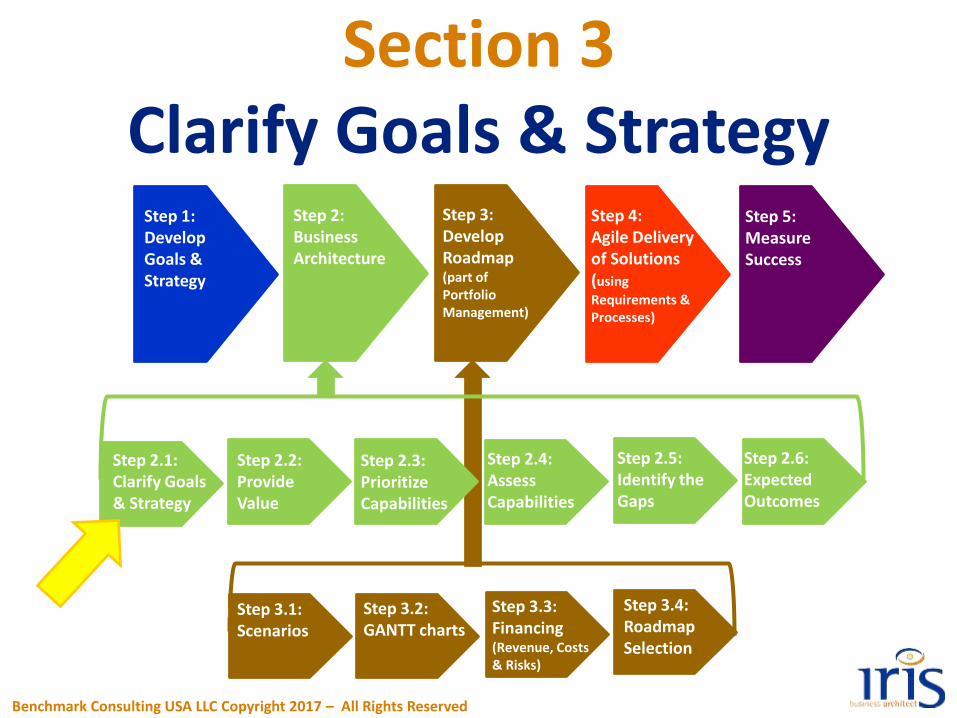
From Strategy to Delivery Using Business Architecture
Step 2.2: Provide Value
Step 2.3: Prioritize Capabilities
Step 2.4: Assess Capabilities
Step 2.1: Clarify Goals & Strategy
Step 2.5: Identify the Gaps
Step 2.6: Expected Outcomes
Step 3.1: Scenarios
Step 3.2: GANTT charts
Step 3.4: Roadmap Selection
Step 3.1: Scenarios
Step 3.2: GANTT charts
Step 3.3: Financing (Revenue, Costs & Risks)
Step 3.4: Roadmap Selection
Benchmark Consulting USA LLC Copyright 2017 – All Rights Reserved
Benchmark Consulting USA LLCCopyright 2017 – All Rights Reserved
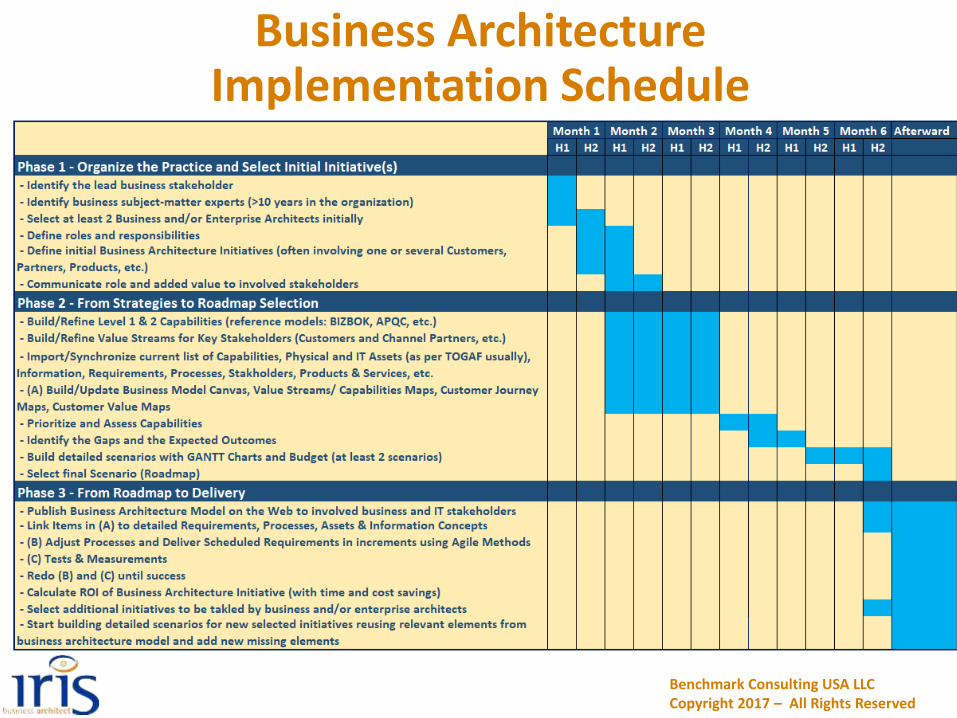
Business Architecture Implementation Schedule
Step 1: Develop Goals & Strategy
Step 2:Business Architecture
Step 3:Develop Roadmap (part of Portfolio Management)
Step 4: Agile Delivery of Solutions (using
Requirements & Processes)
Step 5: Measure Success
Step 2.2: Provide Value
Step 2.4: Assess Capabilities
Step 2.1: Clarify Goals & Strategy
Step 2.5: Identify the Gaps
Step 2.6: Expected Outcomes
Step 2.2: Provide Value
Step 2.3: Prioritize Capabilities
Step 2.4: Assess Capabilities
Step 2.1: Clarify Goals & Strategy
Step 2.5: Identify the Gaps
Step 2.6: Expected Outcomes
Step 3.1: Scenarios
Step 3.2: GANTT charts
Step 3.4: Roadmap Selection
Step 3.1: Scenarios
Step 3.2: GANTT charts
Step 3.3: Financing (Revenue, Costs & Risks)
Step 3.4: Roadmap Selection
Section 3Clarify Goals & Strategy
Benchmark Consulting USA LLC Copyright 2017 – All Rights Reserved
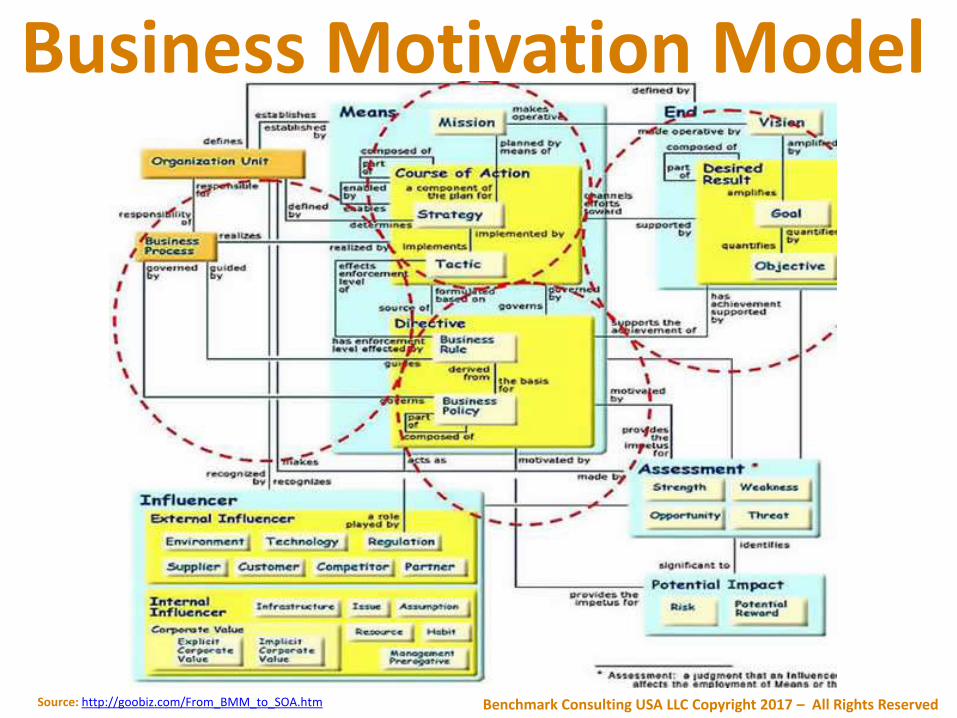
Business Motivation Model
Source: http://goobiz.com/From_BMM_to_SOA.htm Benchmark Consulting USA LLC Copyright 2017 – All Rights Reserved
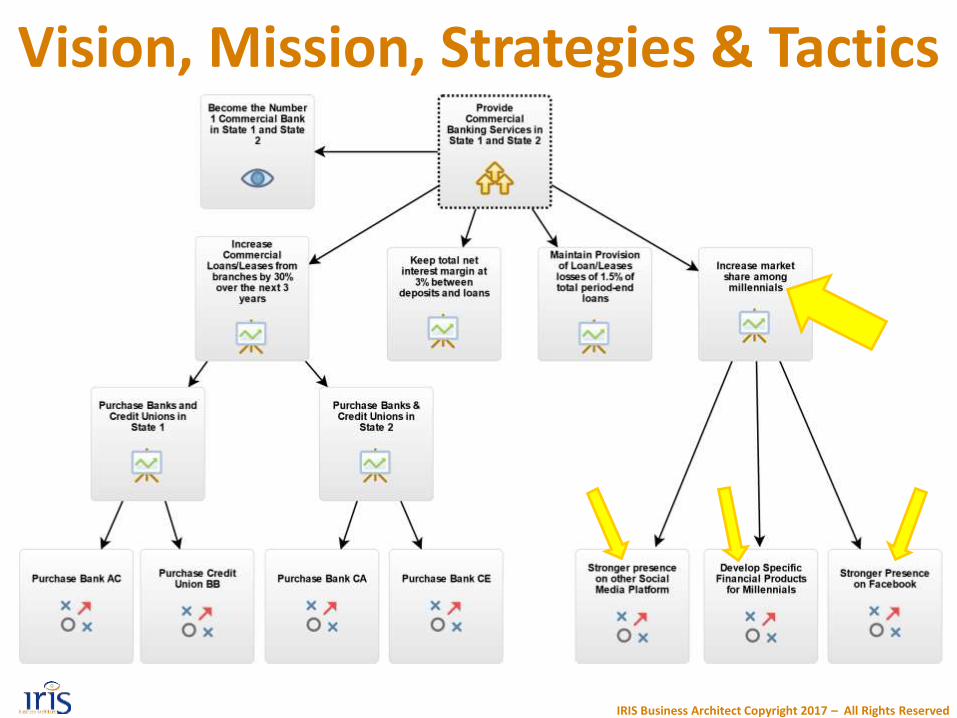
Vision, Mission, Strategies & Tactics
IRIS Business Architect Copyright 2017 – All Rights Reserved
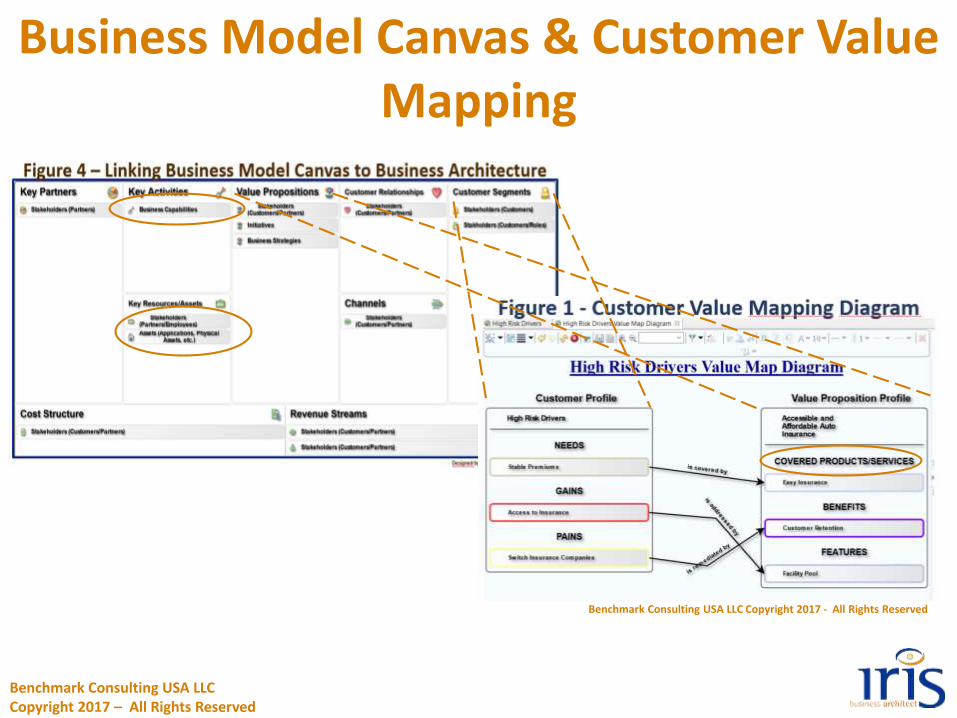
Business Model Canvas & Customer Value Mapping
Benchmark Consulting USA LLC Copyright 2017 - All Rights Reserved
Benchmark Consulting USA LLCCopyright 2017 – All Rights Reserved
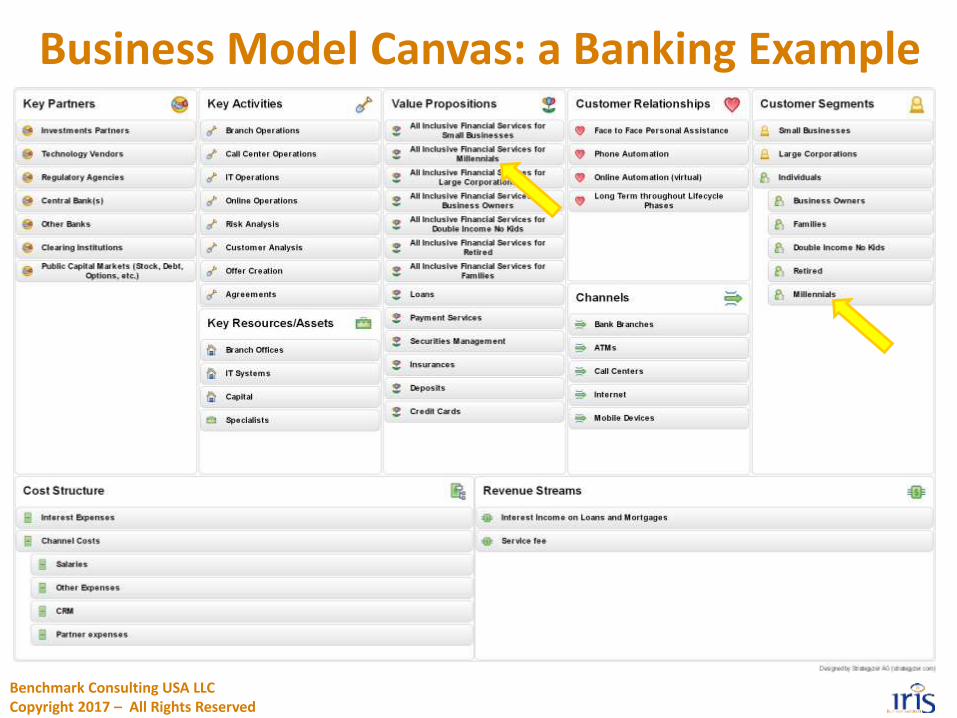
Business Model Canvas: a Banking Example
Benchmark Consulting USA LLCCopyright 2017 – All Rights Reserved
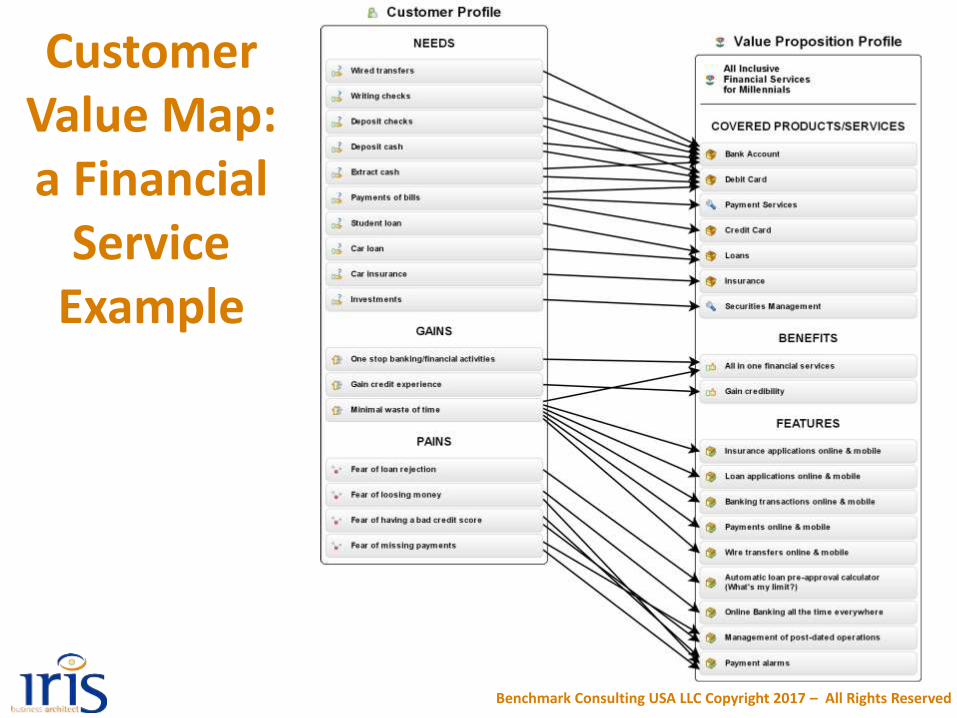
Customer Value Map: a Financial
Service Example
Benchmark Consulting USA LLC Copyright 2017 – All Rights Reserved
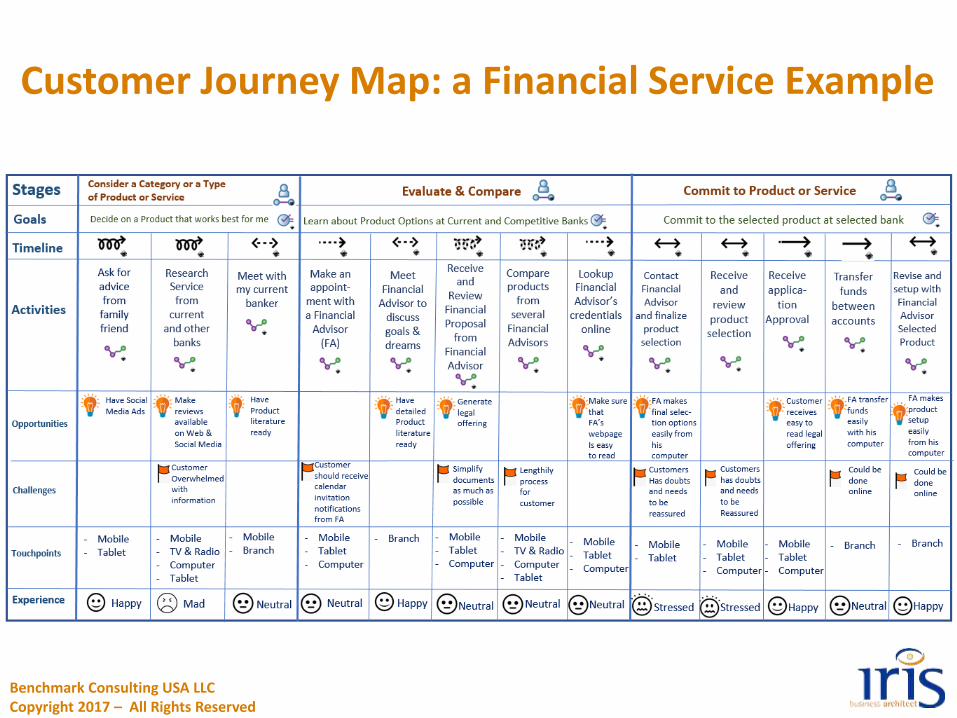
Customer Journey Map: a Financial Service Example
Benchmark Consulting USA LLCCopyright 2017 – All Rights Reserved
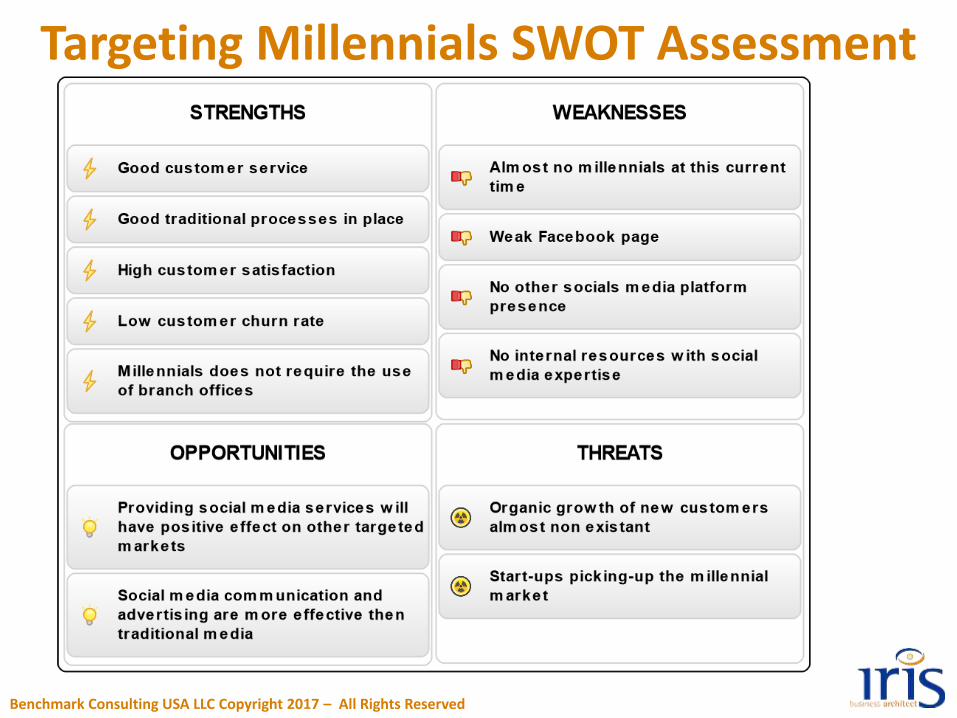
Targeting Millennials SWOT Assessment
Benchmark Consulting USA LLC Copyright 2017 – All Rights Reserved
Step 1: Develop Goals & Strategy
Step 2:Business Architecture
Step 3:Develop Roadmap (part of Portfolio Management)
Step 4: Agile Delivery of Solutions (using
Requirements & Processes)
Step 5: Measure Success
Step 2.2: Provide Value
Step 2.4: Assess Capabilities
Step 2.1: Clarify Goals & Strategy
Step 2.5: Identify the Gaps
Step 2.6: Expected Outcomes
Step 2.2: Provide Value
Step 2.3: Prioritize Capabilities
Step 2.4: Assess Capabilities
Step 2.1: Clarify Goals & Strategy
Step 2.5: Identify the Gaps
Step 2.6: Expected Outcomes
Step 3.1: Scenarios
Step 3.2: GANTT charts
Step 3.4: Roadmap Selection
Step 3.1: Scenarios
Step 3.2: GANTT charts
Step 3.3: Financing (Revenue, Costs & Risks)
Step 3.4: Roadmap Selection
Section 4Provide Value
Benchmark Consulting USA LLC Copyright 2017 – All Rights Reserved
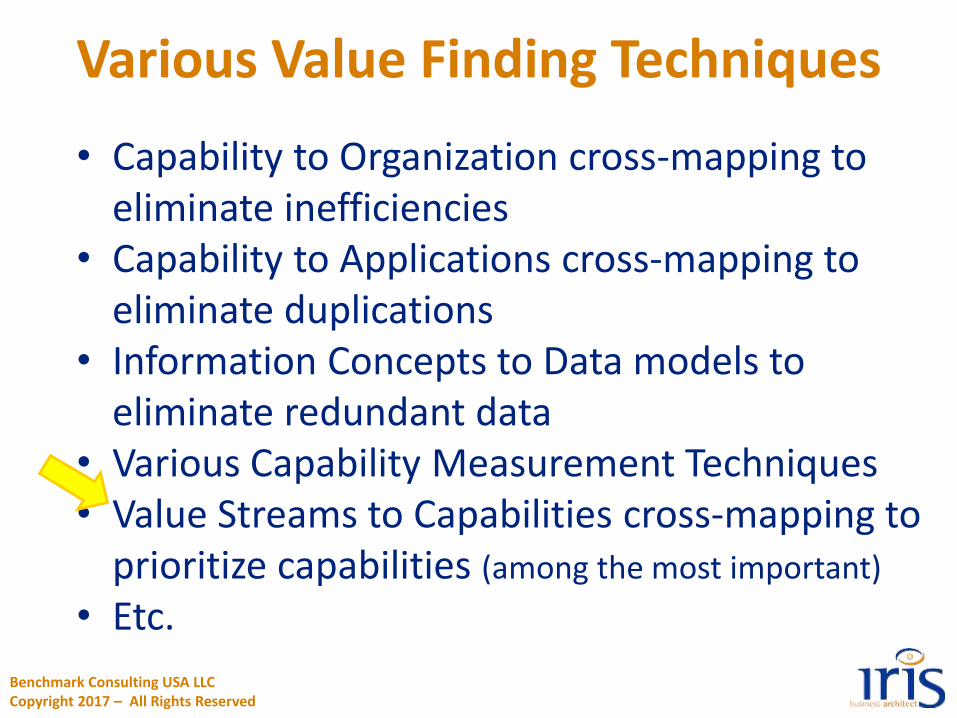
Various Value Finding Techniques
• Capability to Organization cross-mapping to eliminate inefficiencies
• Capability to Applications cross-mapping to eliminate duplications
• Information Concepts to Data models to eliminate redundant data
• Various Capability Measurement Techniques• Value Streams to Capabilities cross-mapping to
prioritize capabilities (among the most important)
• Etc.
Benchmark Consulting USA LLC Copyright 2017 – All Rights Reserved
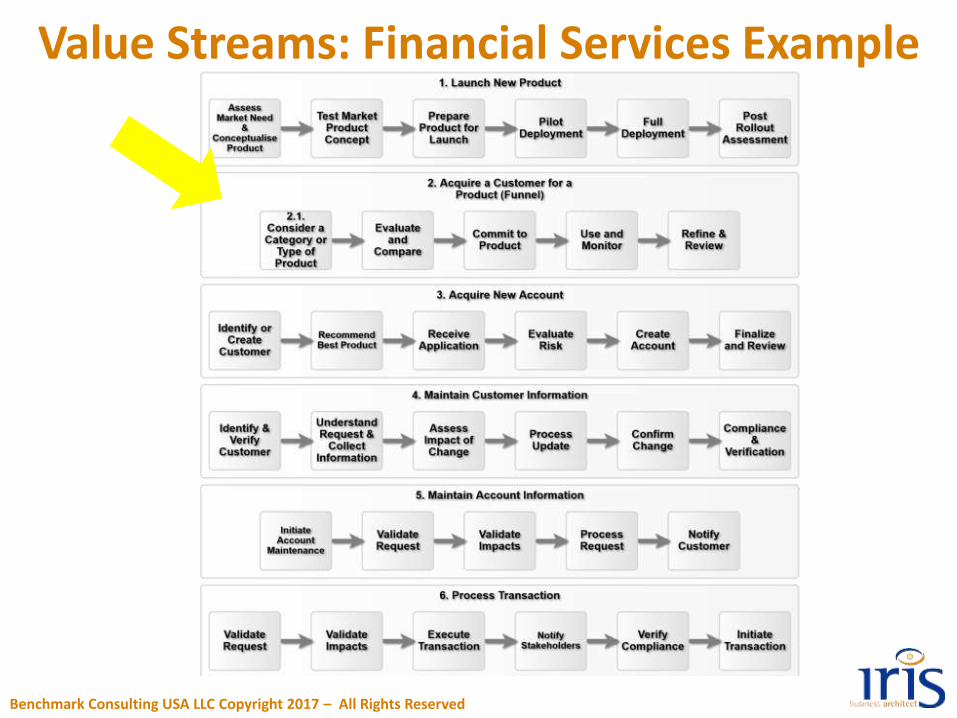
Value Streams: Financial Services Example
Benchmark Consulting USA LLC Copyright 2017 – All Rights Reserved
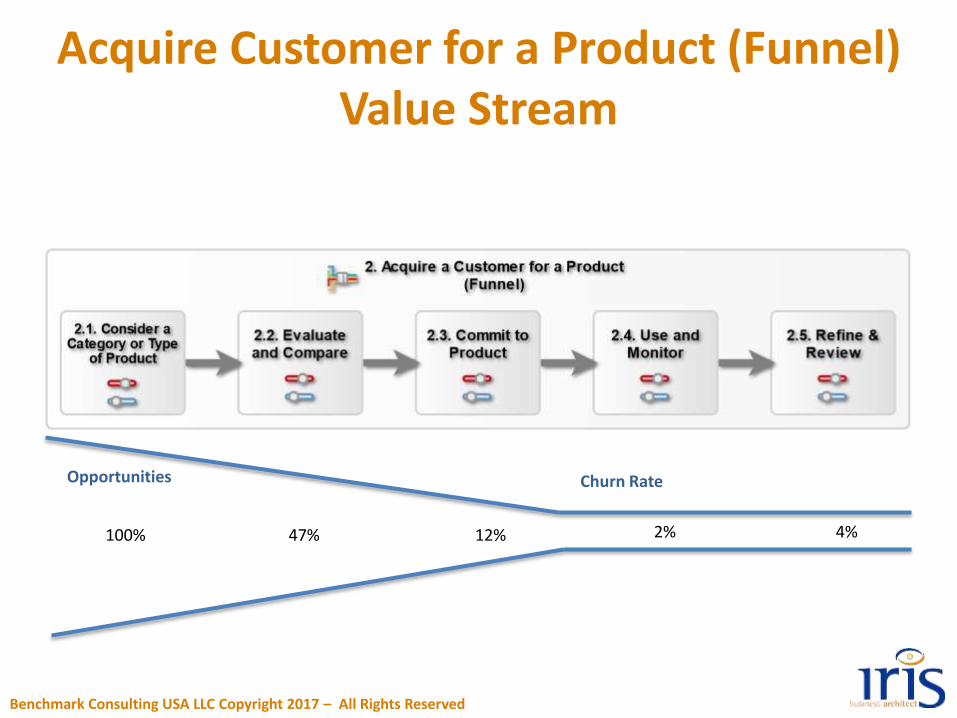
100% 47% 12%
Opportunities Churn Rate
2% 4%
Acquire Customer for a Product (Funnel) Value Stream
Benchmark Consulting USA LLC Copyright 2017 – All Rights Reserved
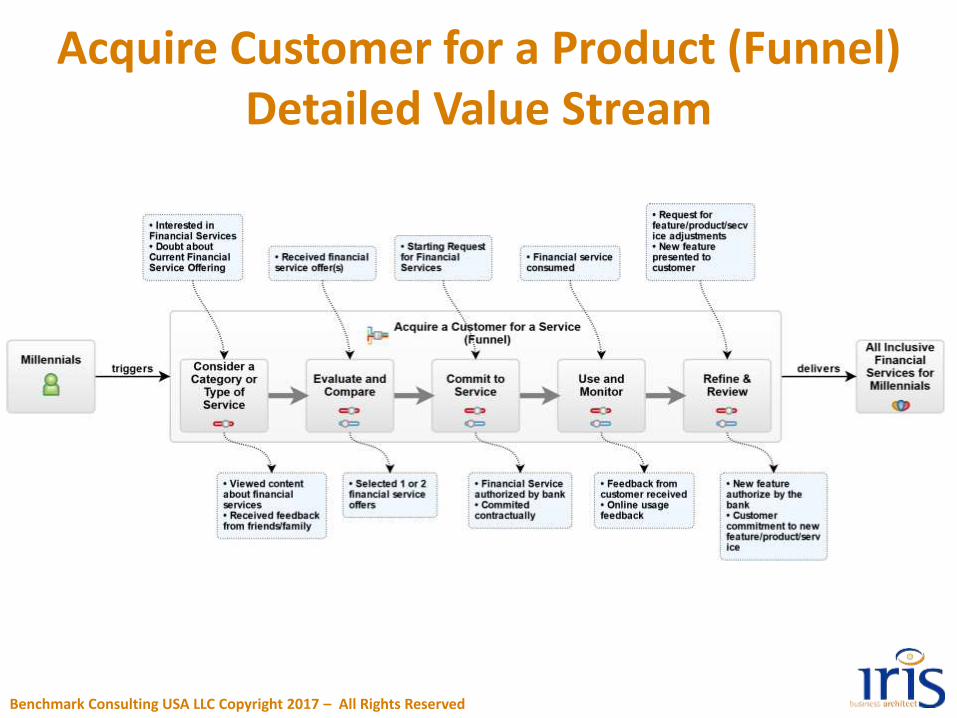
Acquire Customer for a Product (Funnel) Detailed Value Stream
Benchmark Consulting USA LLC Copyright 2017 – All Rights Reserved
Step 1: Develop Goals & Strategy
Step 2:Business Architecture
Step 3:Develop Roadmap (part of Portfolio Management)
Step 4: Agile Delivery of Solutions (using
Requirements & Processes)
Step 5: Measure Success
Step 2.2: Provide Value
Step 2.4: Assess Capabilities
Step 2.1: Clarify Goals & Strategy
Step 2.5: Identify the Gaps
Step 2.6: Expected Outcomes
Step 2.2: Provide Value
Step 2.3: Prioritize Capabilities
Step 2.4: Assess Capabilities
Step 2.1: Clarify Goals & Strategy
Step 2.5: Identify the Gaps
Step 2.6: Expected Outcomes
Step 3.1: Scenarios
Step 3.2: GANTT charts
Step 3.4: Roadmap Selection
Step 3.1: Scenarios
Step 3.2: GANTT charts
Step 3.3: Financing (Revenue, Costs & Risks)
Step 3.4: Roadmap Selection
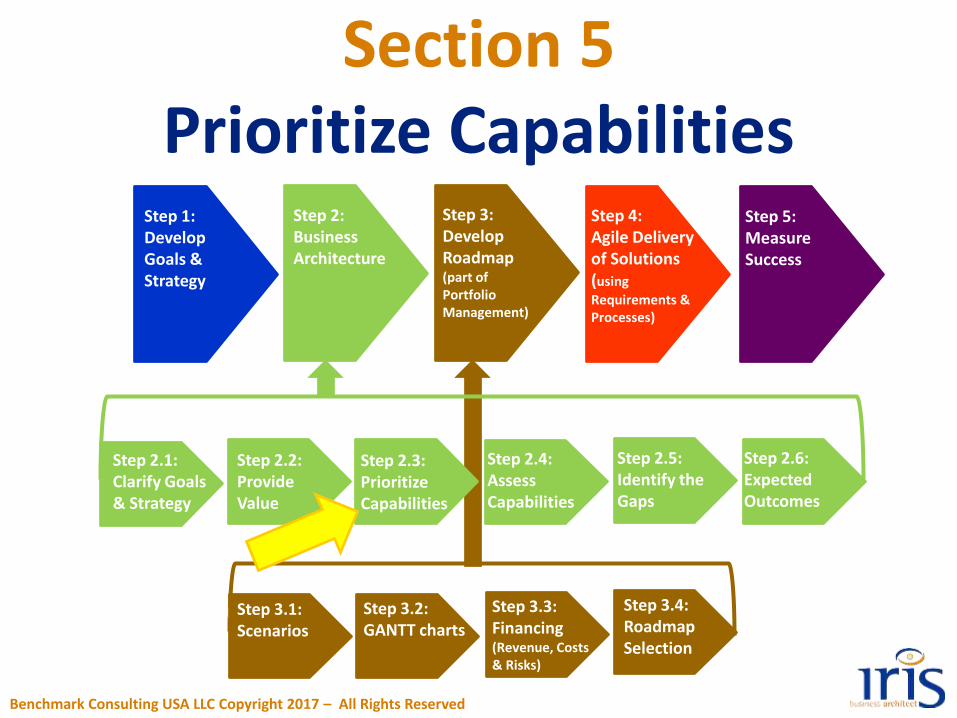
Section 5Prioritize Capabilities
Benchmark Consulting USA LLC Copyright 2017 – All Rights Reserved
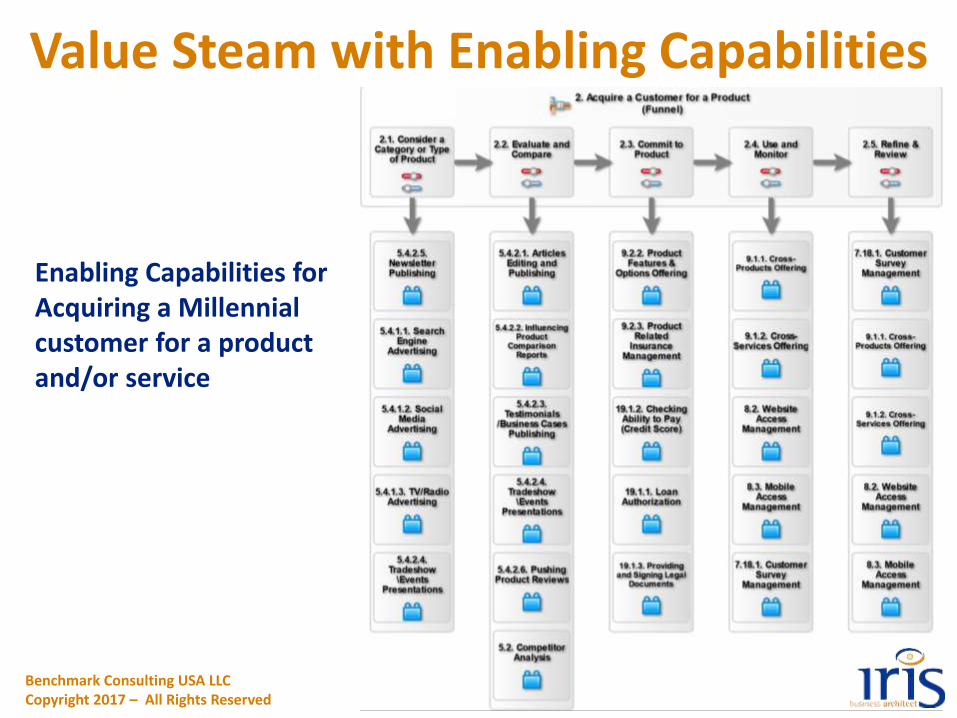
Value Steam with Enabling Capabilities
Benchmark Consulting USA LLCCopyright 2017 – All Rights Reserved
Enabling Capabilities for Acquiring a Millennial customer for a product and/or service
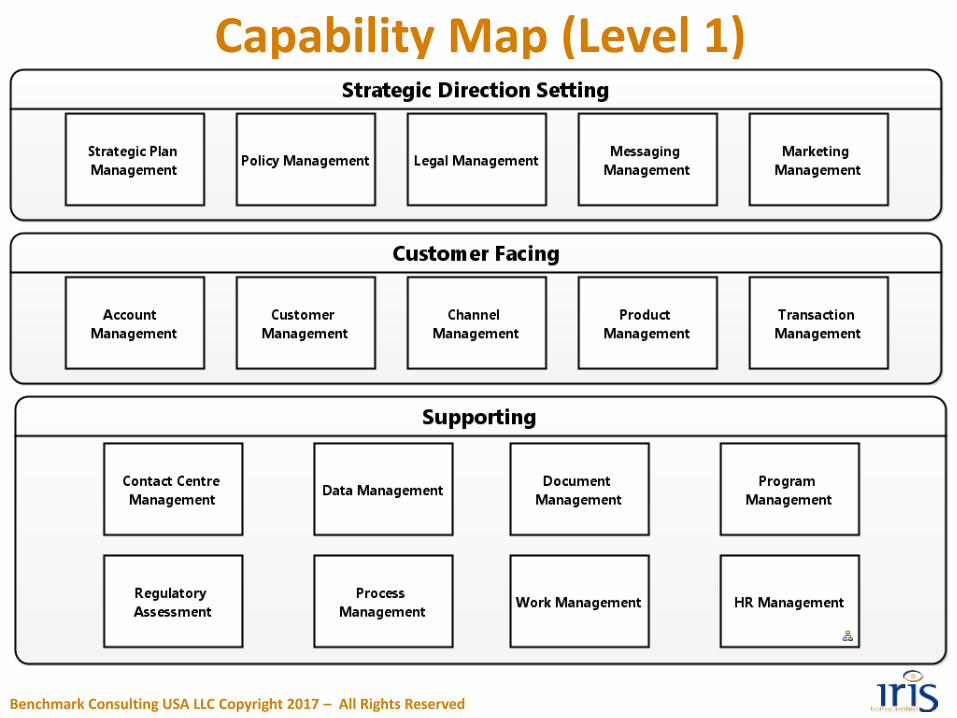
Capability Map (Level 1)
Benchmark Consulting USA LLC Copyright 2017 – All Rights Reserved
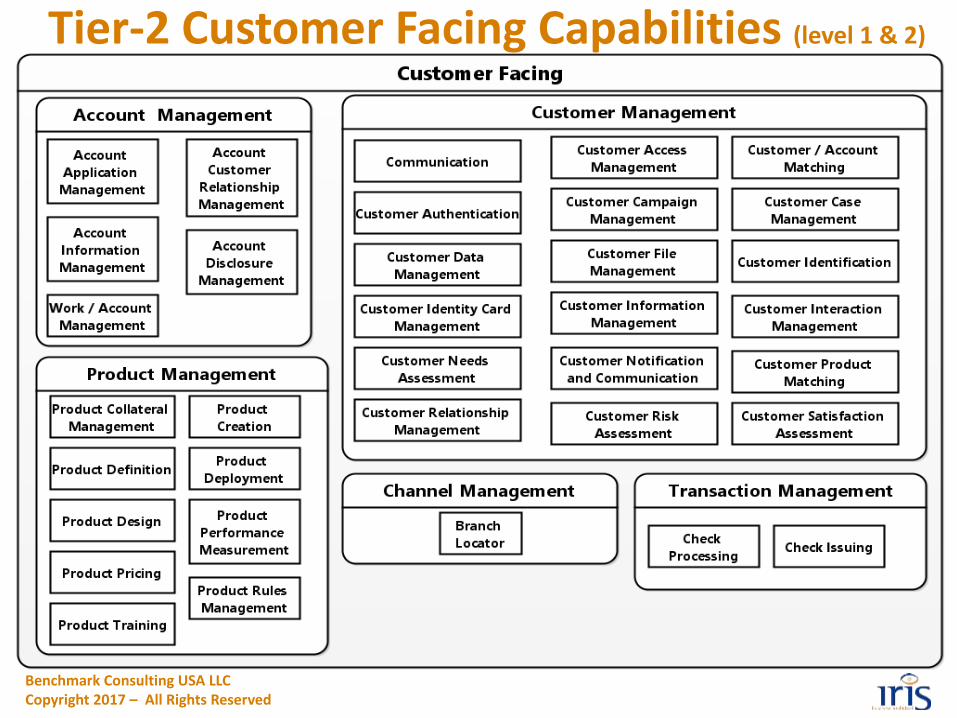
Tier-2 Customer Facing Capabilities (level 1 & 2)
Benchmark Consulting USA LLCCopyright 2017 – All Rights Reserved

Step 1: Develop Goals & Strategy
Step 2:Business Architecture
Step 3:Develop Roadmap (part of Portfolio Management)
Step 4: Agile Delivery of Solutions (using
Requirements & Processes)
Step 5: Measure Success
Step 2.2: Provide Value
Step 2.4: Assess Capabilities
Step 2.1: Clarify Goals & Strategy
Step 2.5: Identify the Gaps
Step 2.6: Expected Outcomes
Step 2.2: Provide Value
Step 2.3: Prioritize Capabilities
Step 2.4: Assess Capabilities
Step 2.1: Clarify Goals & Strategy
Step 2.5: Identify the Gaps
Step 2.6: Expected Outcomes
Step 3.1: Scenarios
Step 3.2: GANTT charts
Step 3.4: Roadmap Selection
Step 3.1: Scenarios
Step 3.2: GANTT charts
Step 3.3: Financing (Revenue, Costs & Risks)
Step 3.4: Roadmap Selection
Section 6Assess Capabilities
Benchmark Consulting USA LLC Copyright 2017 – All Rights Reserved
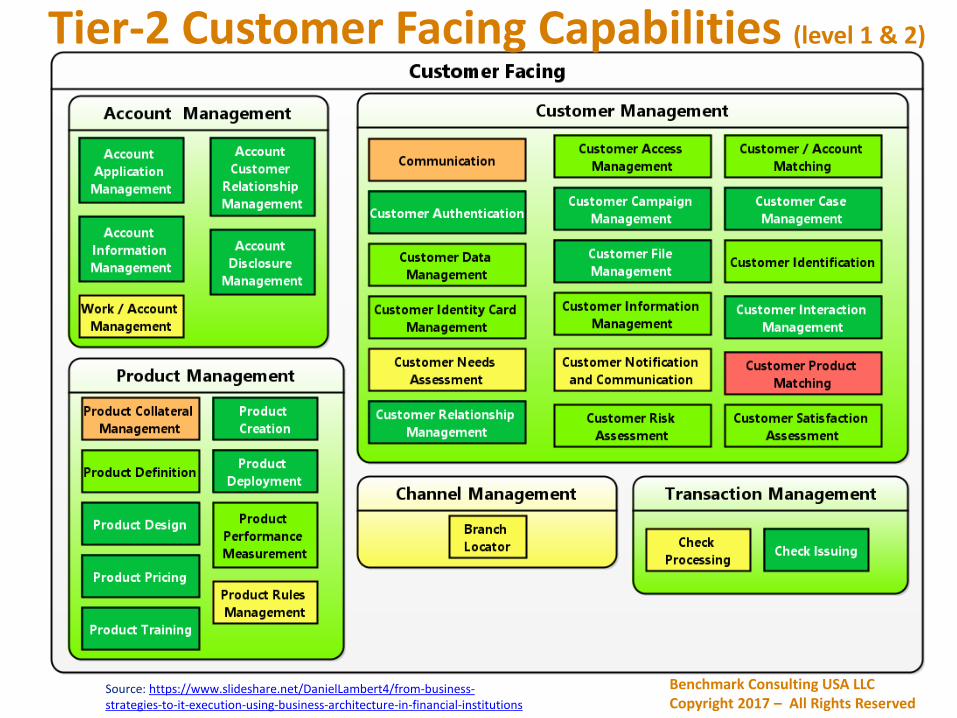
Tier-2 Customer Facing Capabilities (level 1 & 2)
Benchmark Consulting USA LLCCopyright 2017 – All Rights Reserved
Source: https://www.slideshare.net/DanielLambert4/from-business-strategies-to-it-execution-using-business-architecture-in-financial-institutions
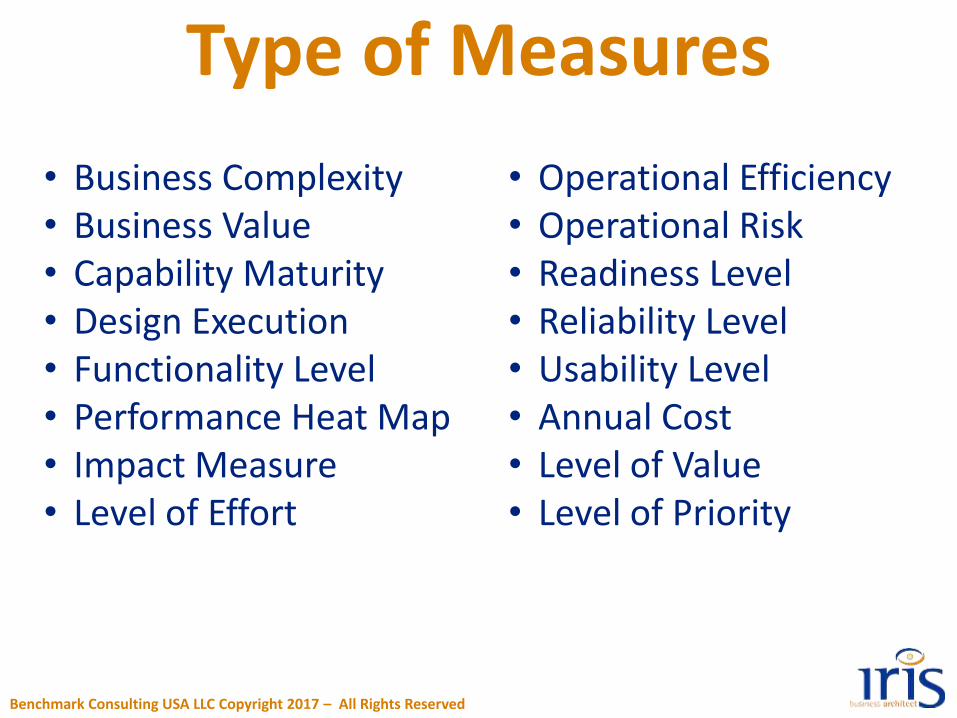
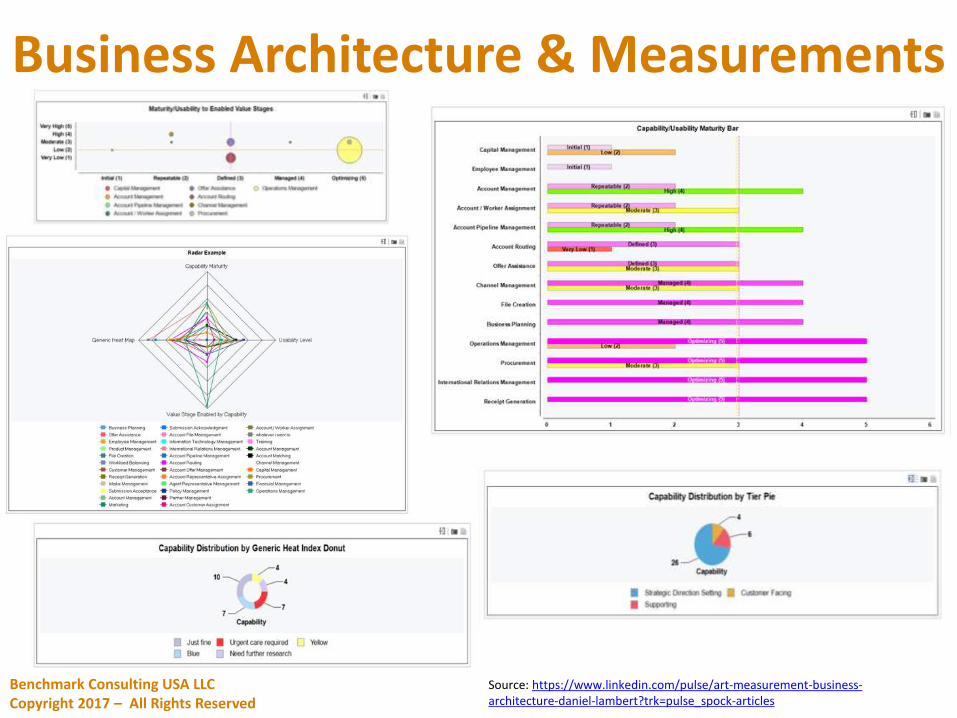
Type of Measures
• Business Complexity• Business Value• Capability Maturity• Design Execution• Functionality Level• Performance Heat Map• Impact Measure• Level of Effort
• Operational Efficiency• Operational Risk• Readiness Level• Reliability Level• Usability Level• Annual Cost• Level of Value• Level of Priority
Benchmark Consulting USA LLC Copyright 2017 – All Rights Reserved
Benchmark Consulting USA LLCCopyright 2017 – All Rights Reserved
Business Architecture & Measurements
Source: https://www.linkedin.com/pulse/art-measurement-business-architecture-daniel-lambert?trk=pulse_spock-articles
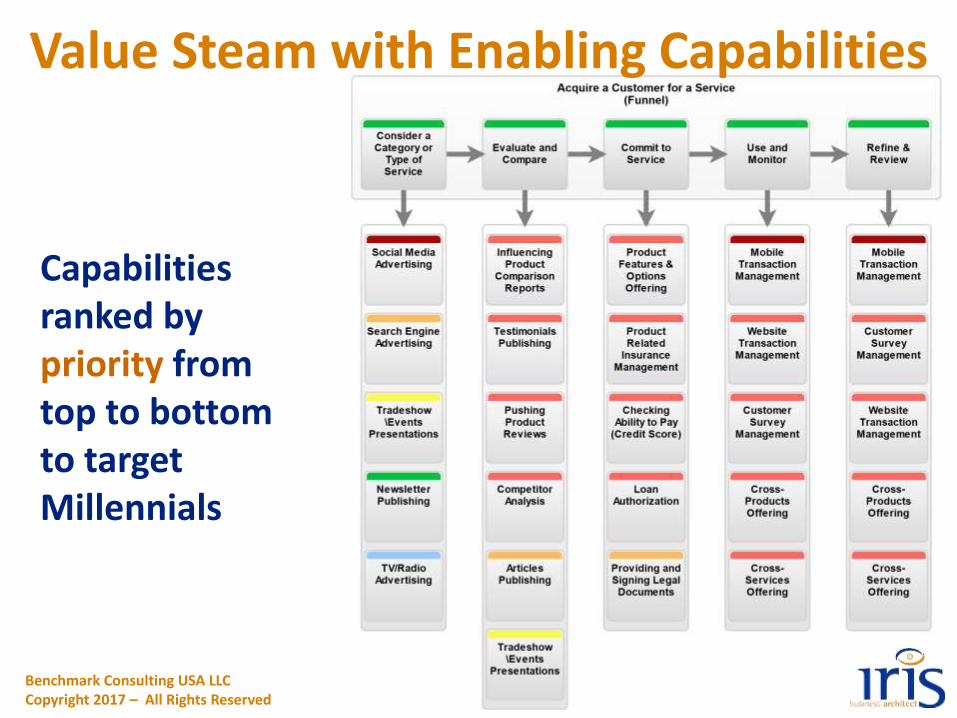
Value Steam with Enabling Capabilities
Benchmark Consulting USA LLCCopyright 2017 – All Rights Reserved
Capabilities ranked by priority from top to bottom to target Millennials
Benchmark Consulting USA LLCCopyright 2017 – All Rights Reserved
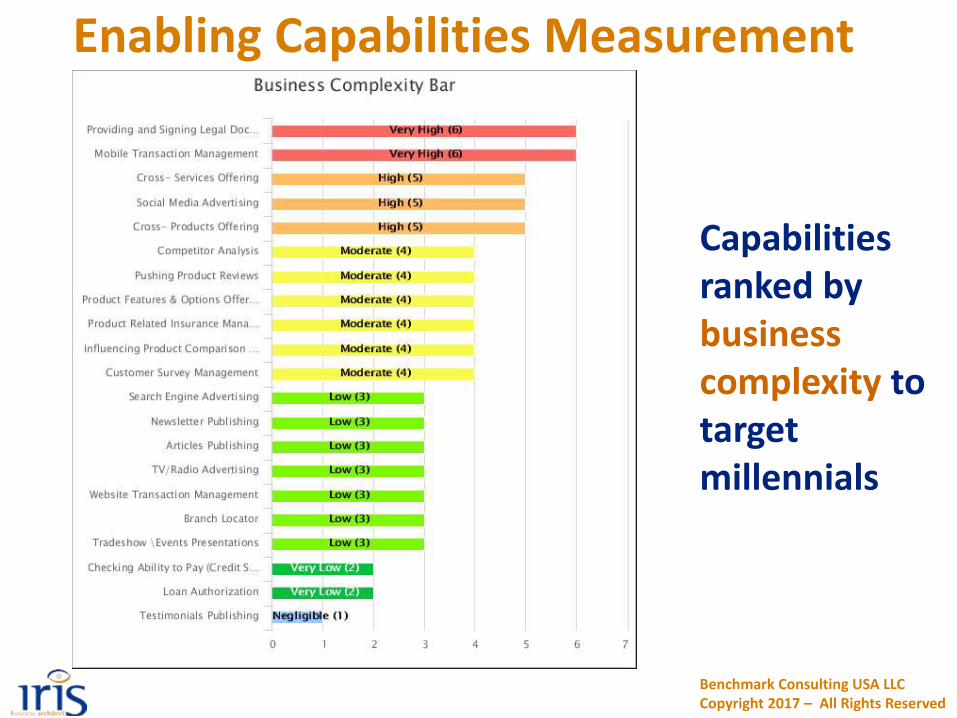
Enabling Capabilities Measurement
Capabilities ranked by business complexity to target millennials
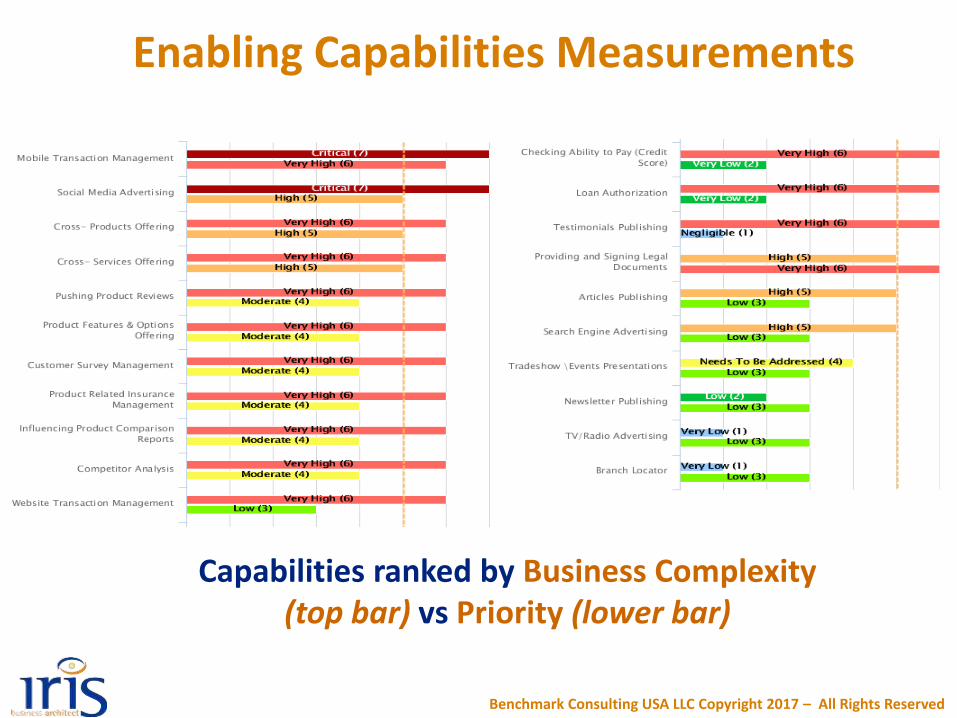
Enabling Capabilities Measurements
Benchmark Consulting USA LLC Copyright 2017 – All Rights Reserved
Capabilities ranked by Business Complexity (top bar) vs Priority (lower bar)
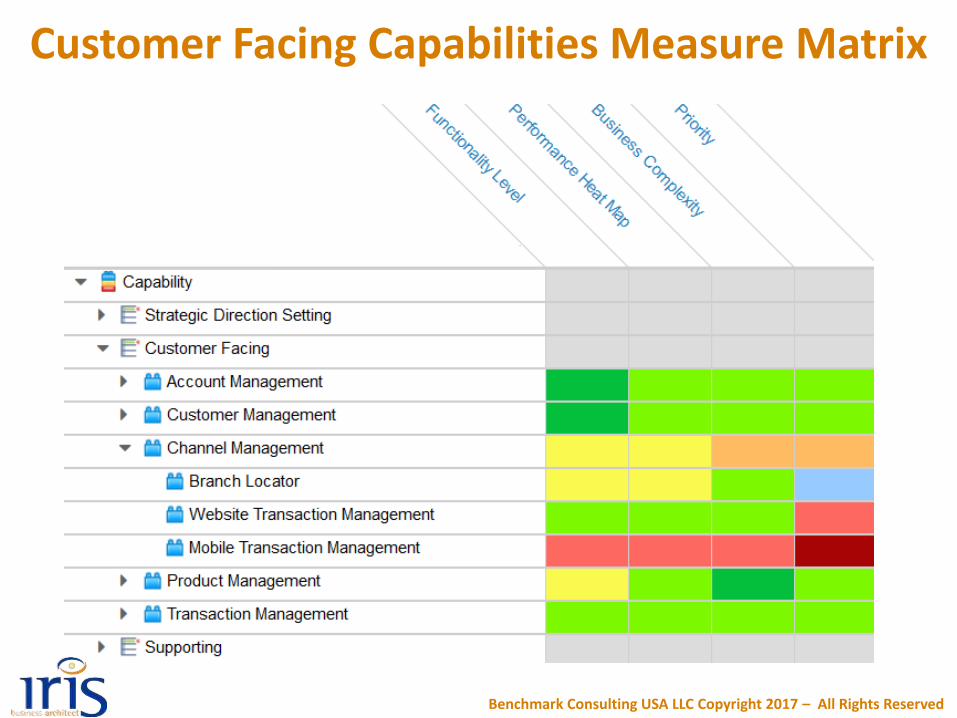
Customer Facing Capabilities Measure Matrix
Benchmark Consulting USA LLC Copyright 2017 – All Rights Reserved
Step 1: Develop Goals & Strategy
Step 2:Business Architecture
Step 3:Develop Roadmap (part of Portfolio Management)
Step 4: Agile Delivery of Solutions (using
Requirements & Processes)
Step 5: Measure Success
Step 2.2: Provide Value
Step 2.4: Assess Capabilities
Step 2.1: Clarify Goals & Strategy
Step 2.5: Identify the Gaps
Step 2.6: Expected Outcomes
Step 2.2: Provide Value
Step 2.3: Prioritize Capabilities
Step 2.4: Assess Capabilities
Step 2.1: Clarify Goals & Strategy
Step 2.5: Identify the Gaps
Step 2.6: Expected Outcomes
Step 3.1: Scenarios
Step 3.2: GANTT charts
Step 3.4: Roadmap Selection
Step 3.1: Scenarios
Step 3.2: GANTT charts
Step 3.3: Financing (Revenue, Costs & Risks)
Step 3.4: Roadmap Selection
Section 7Identify the Gaps
Benchmark Consulting USA LLC Copyright 2017 – All Rights Reserved
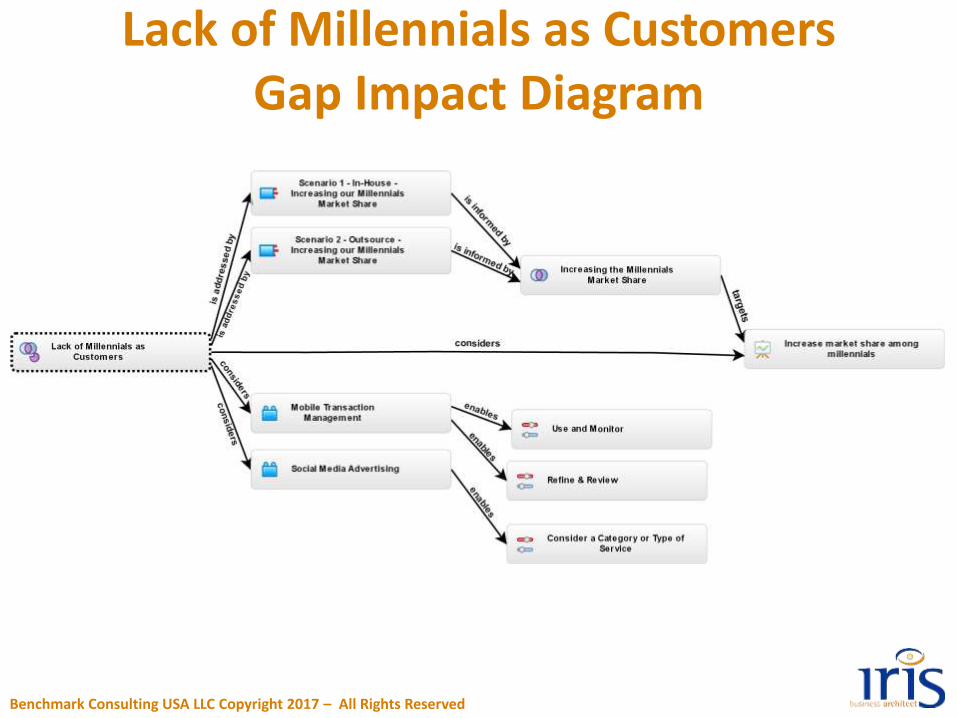
Lack of Millennials as CustomersGap Impact Diagram
Benchmark Consulting USA LLC Copyright 2017 – All Rights Reserved
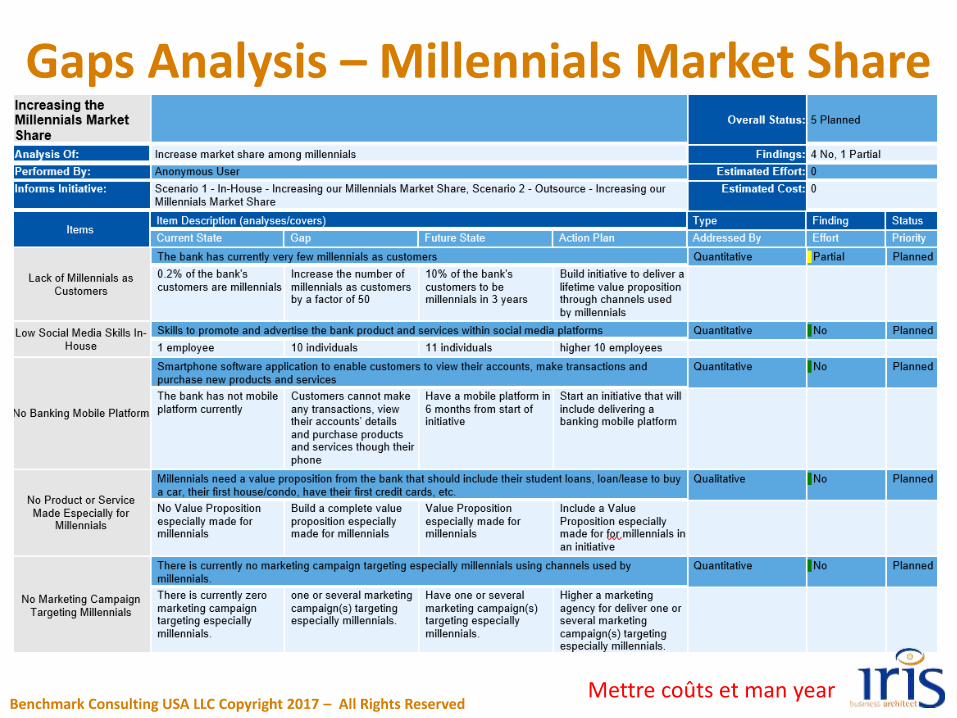
Gaps Analysis – Millennials Market Share
Benchmark Consulting USA LLC Copyright 2017 – All Rights ReservedMettre coûts et man year
Step 1: Develop Goals & Strategy
Step 2:Business Architecture
Step 3:Develop Roadmap (part of Portfolio Management)
Step 4: Agile Delivery of Solutions (using
Requirements & Processes)
Step 5: Measure Success
Step 2.2: Provide Value
Step 2.4: Assess Capabilities
Step 2.1: Clarify Goals & Strategy
Step 2.5: Identify the Gaps
Step 2.6: Expected Outcomes
Step 2.2: Provide Value
Step 2.3: Prioritize Capabilities
Step 2.4: Assess Capabilities
Step 2.1: Clarify Goals & Strategy
Step 2.5: Identify the Gaps
Step 2.6: Expected Outcomes
Step 3.1: Scenarios
Step 3.2: GANTT charts
Step 3.4: Roadmap Selection
Step 3.1: Scenarios
Step 3.2: GANTT charts
Step 3.3: Financing (Revenue, Costs & Risks)
Step 3.4: Roadmap Selection
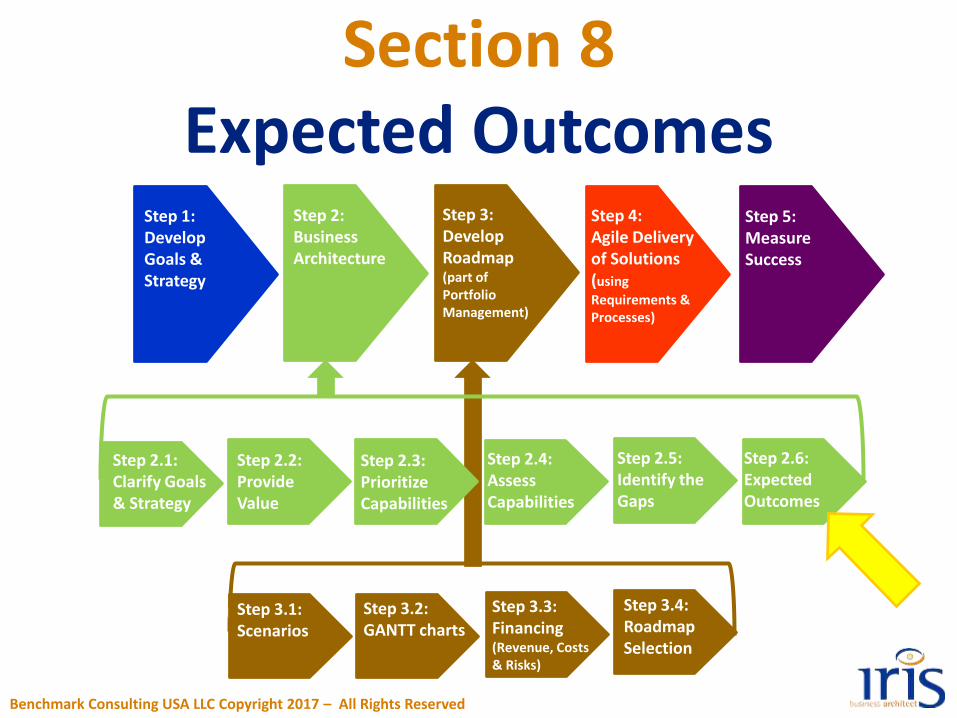
Section 8Expected Outcomes
Benchmark Consulting USA LLC Copyright 2017 – All Rights Reserved
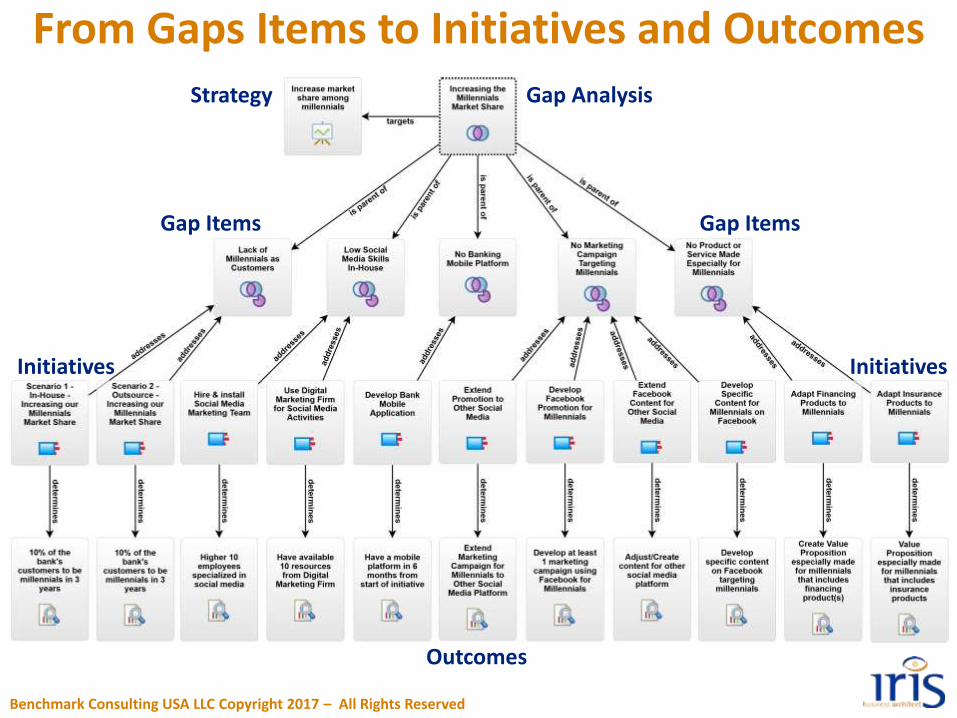
From Gaps Items to Initiatives and Outcomes
Benchmark Consulting USA LLC Copyright 2017 – All Rights Reserved
Gap AnalysisStrategy
Gap ItemsGap Items
InitiativesInitiatives
Outcomes
Step 1: Develop Goals & Strategy
Step 2:Business Architecture
Step 3:Develop Roadmap (part of Portfolio Management)
Step 4: Agile Delivery of Solutions (using
Requirements & Processes)
Step 5: Measure Success
Step 2.2: Provide Value
Step 2.4: Assess Capabilities
Step 2.1: Clarify Goals & Strategy
Step 2.5: Identify the Gaps
Step 2.6: Expected Outcomes
Step 2.2: Provide Value
Step 2.3: Prioritize Capabilities
Step 2.4: Assess Capabilities
Step 2.1: Clarify Goals & Strategy
Step 2.5: Identify the Gaps
Step 2.6: Expected Outcomes
Step 3.1: Scenarios
Step 3.2: GANTT charts
Step 3.4: Roadmap Selection
Step 3.1: Scenarios
Step 3.2: GANTT charts
Step 3.3: Financing (Revenue, Costs & Risks)
Step 3.4: Roadmap Selection
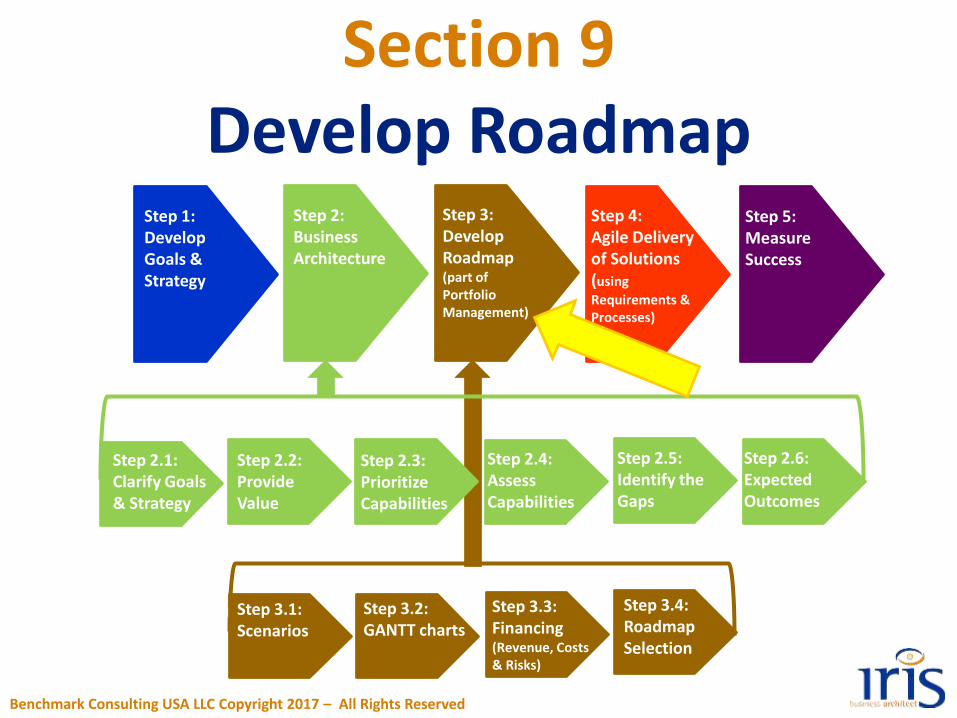
Section 9Develop Roadmap
Benchmark Consulting USA LLC Copyright 2017 – All Rights Reserved
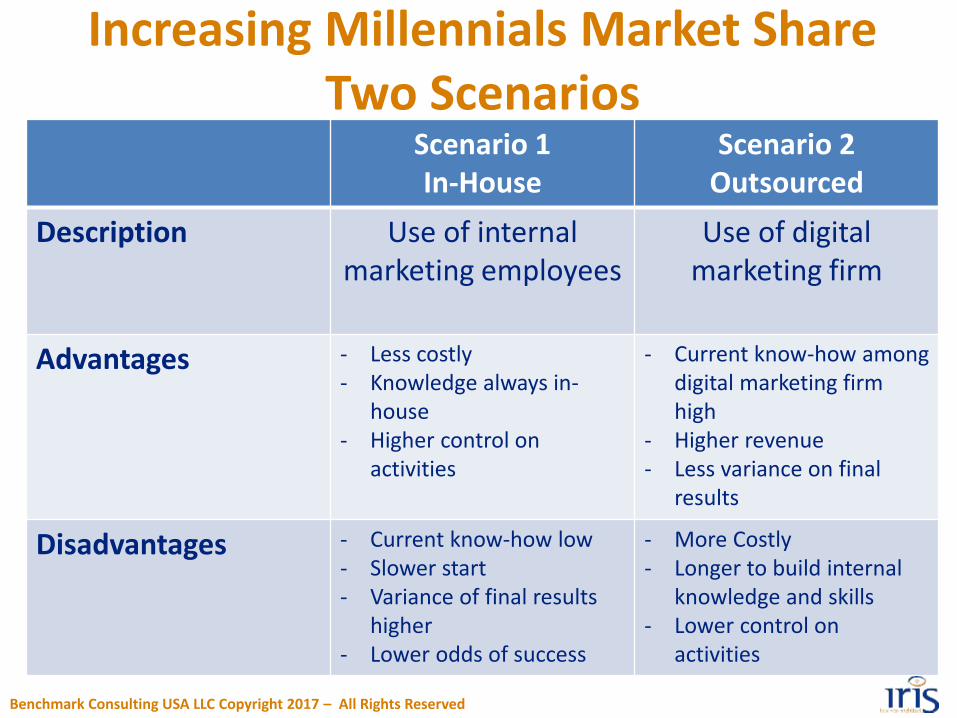
Increasing Millennials Market ShareTwo Scenarios
Benchmark Consulting USA LLC Copyright 2017 – All Rights Reserved
Scenario 1In-House
Scenario 2Outsourced
Description Use of internal marketing employees
Use of digital marketing firm
Advantages - Less costly- Knowledge always in-
house- Higher control on
activities
- Current know-how among digital marketing firm high
- Higher revenue- Less variance on final
results
Disadvantages - Current know-how low- Slower start- Variance of final results
higher- Lower odds of success
- More Costly- Longer to build internal
knowledge and skills- Lower control on
activities
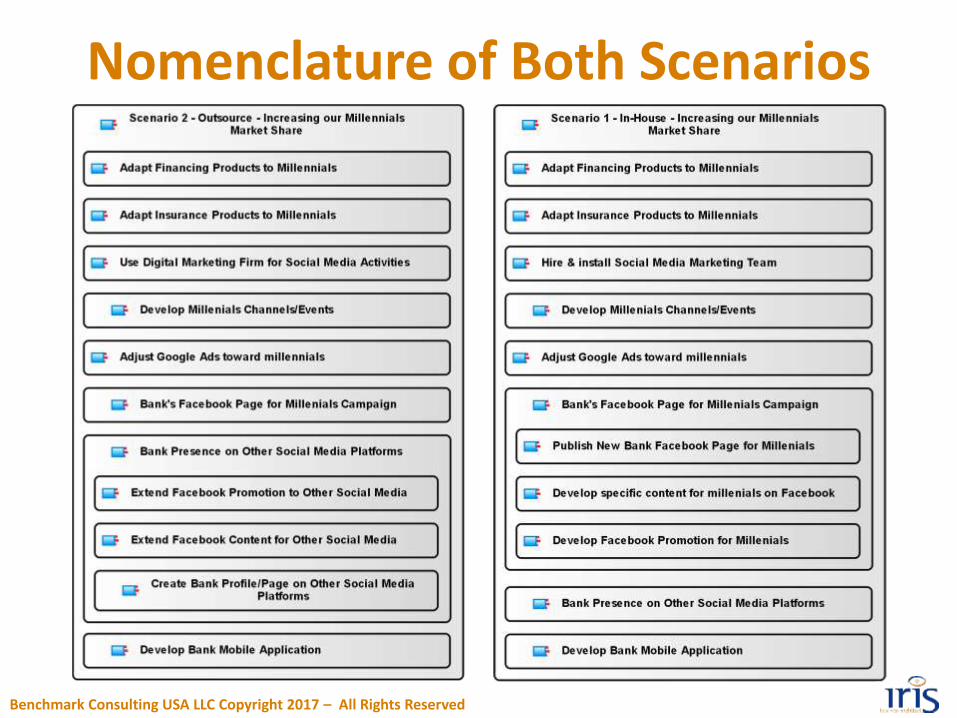
Nomenclature of Both Scenarios
Benchmark Consulting USA LLC Copyright 2017 – All Rights Reserved
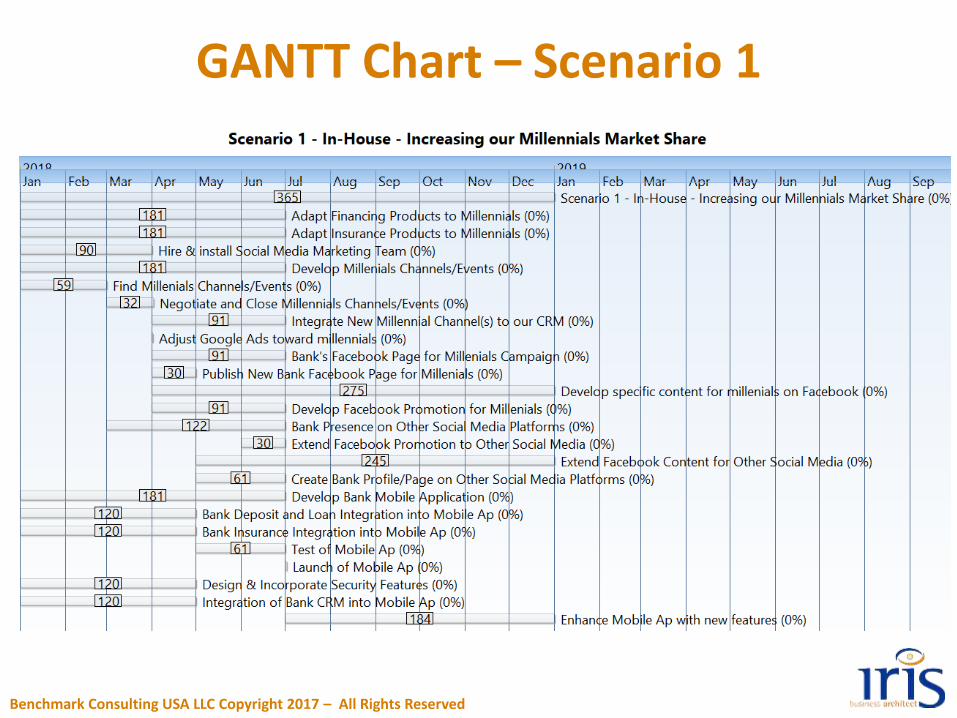
GANTT Chart – Scenario 1
Benchmark Consulting USA LLC Copyright 2017 – All Rights Reserved
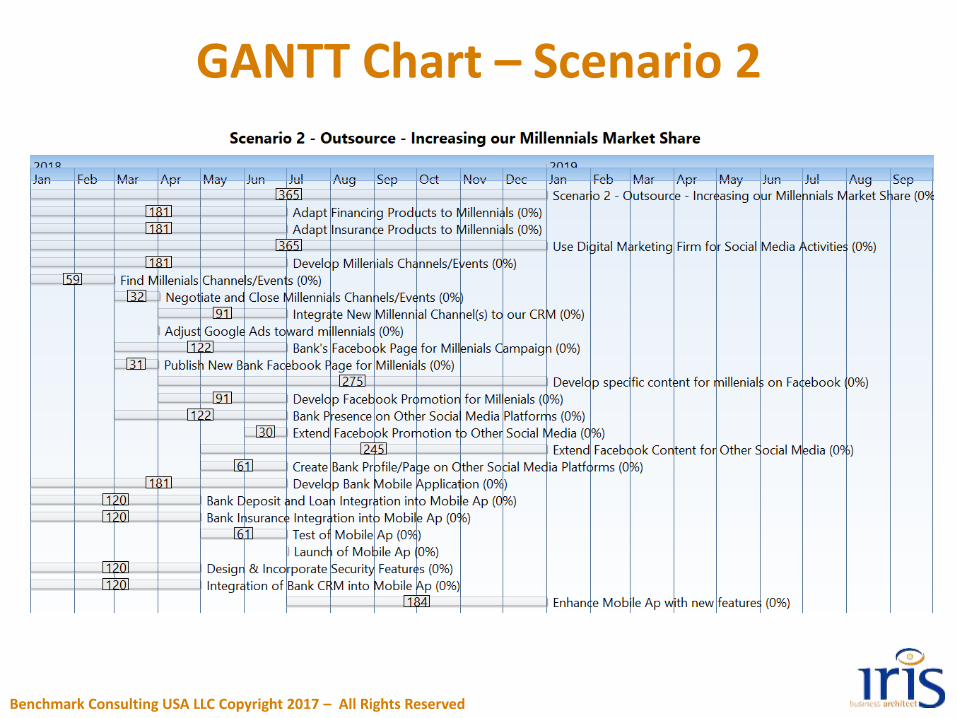
GANTT Chart – Scenario 2
Benchmark Consulting USA LLC Copyright 2017 – All Rights Reserved
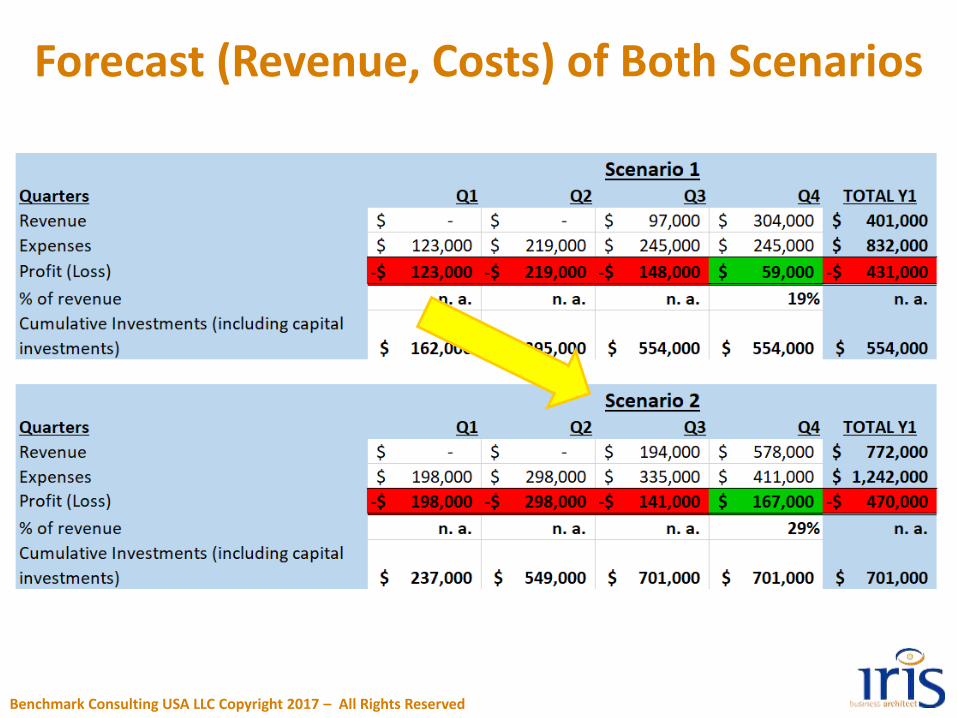
Forecast (Revenue, Costs) of Both Scenarios
Benchmark Consulting USA LLC Copyright 2017 – All Rights Reserved
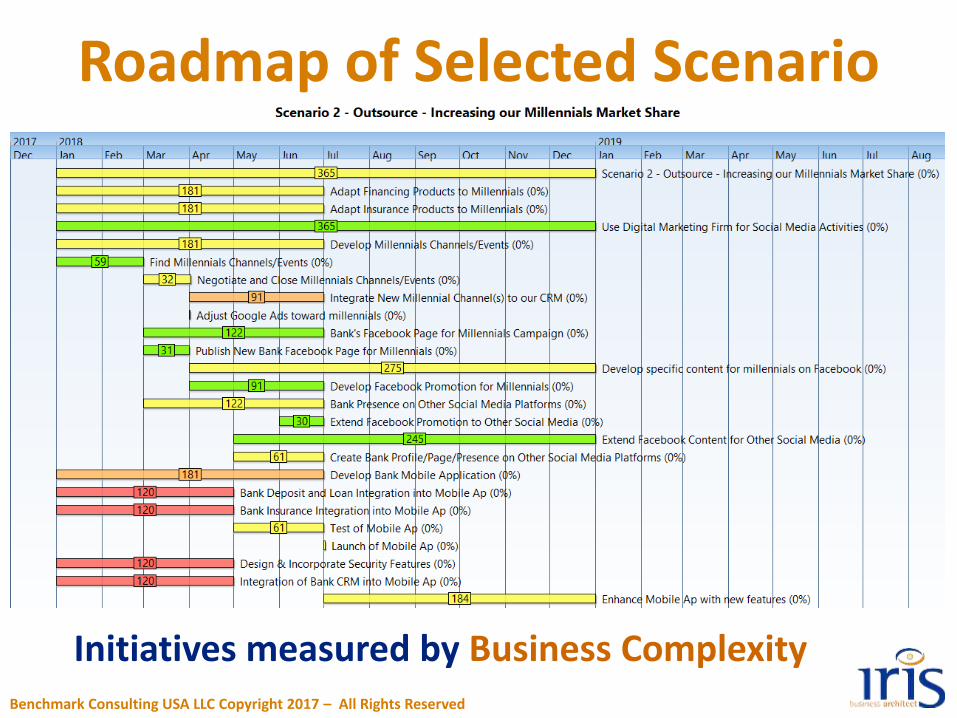
Roadmap of Selected Scenario
Benchmark Consulting USA LLC Copyright 2017 – All Rights Reserved
Initiatives measured by Business Complexity
Step 1: Develop Goals & Strategy
Step 2:Business Architecture
Step 3:Develop Roadmap (part of Portfolio Management)
Step 4: Agile Delivery of Solutions (using
Requirements & Processes)
Step 5: Measure Success
Step 2.2: Provide Value
Step 2.4: Assess Capabilities
Step 2.1: Clarify Goals & Strategy
Step 2.5: Identify the Gaps
Step 2.6: Expected Outcomes
Step 2.2: Provide Value
Step 2.3: Prioritize Capabilities
Step 2.4: Assess Capabilities
Step 2.1: Clarify Goals & Strategy
Step 2.5: Identify the Gaps
Step 2.6: Expected Outcomes
Step 3.1: Scenarios
Step 3.2: GANTT charts
Step 3.4: Roadmap Selection
Step 3.1: Scenarios
Step 3.2: GANTT charts
Step 3.3: Financing (Revenue, Costs & Risks)
Step 3.4: Roadmap Selection
Section 10Agile Delivery of Solutions
Benchmark Consulting USA LLC Copyright 2017 – All Rights Reserved
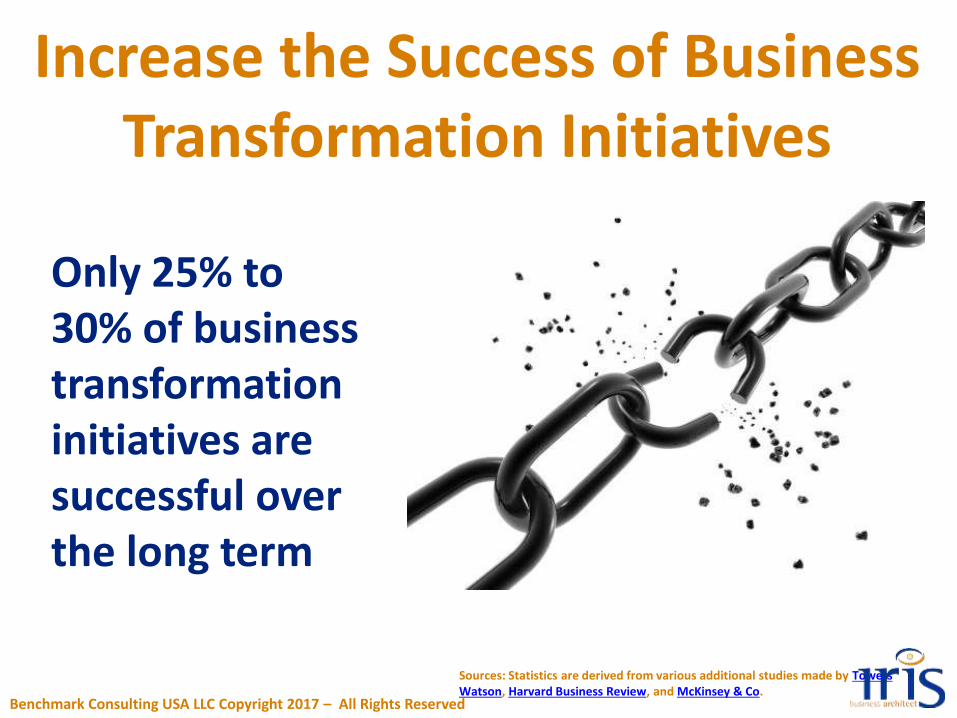
Sources: Statistics are derived from various additional studies made by Towers Watson, Harvard Business Review, and McKinsey & Co.
Increase the Success of Business Transformation Initiatives
Only 25% to 30% of business transformation initiatives are successful over the long term
Benchmark Consulting USA LLC Copyright 2017 – All Rights Reserved
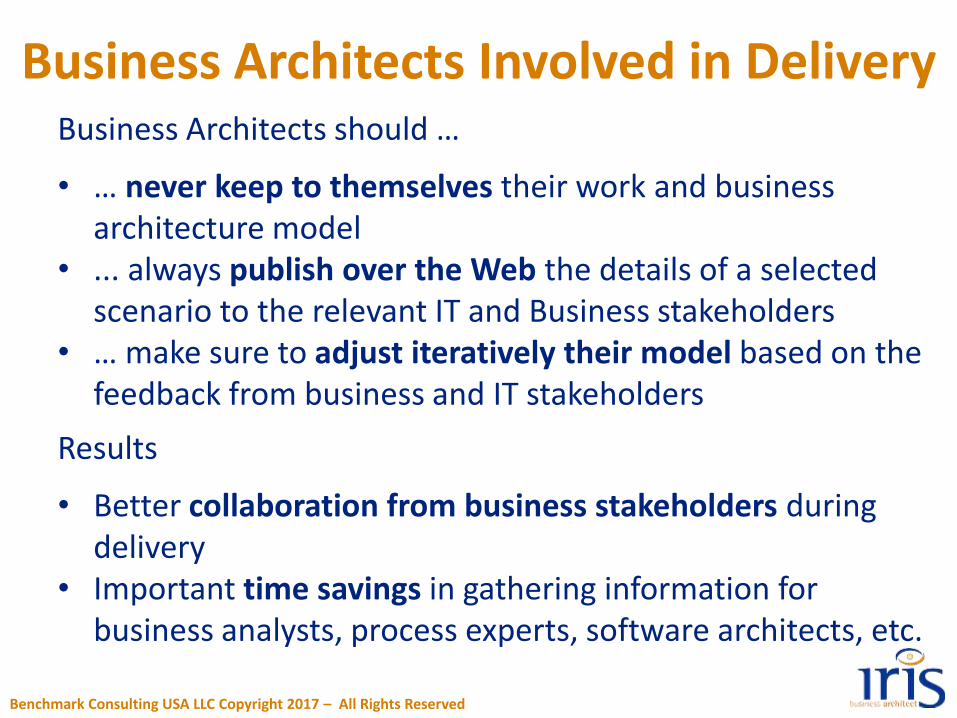
Business Architects Involved in DeliveryBusiness Architects should …
• … never keep to themselves their work and business architecture model
• ... always publish over the Web the details of a selected scenario to the relevant IT and Business stakeholders
• … make sure to adjust iteratively their model based on the feedback from business and IT stakeholders
Results
• Better collaboration from business stakeholders during delivery
• Important time savings in gathering information for business analysts, process experts, software architects, etc.
Benchmark Consulting USA LLC Copyright 2017 – All Rights Reserved
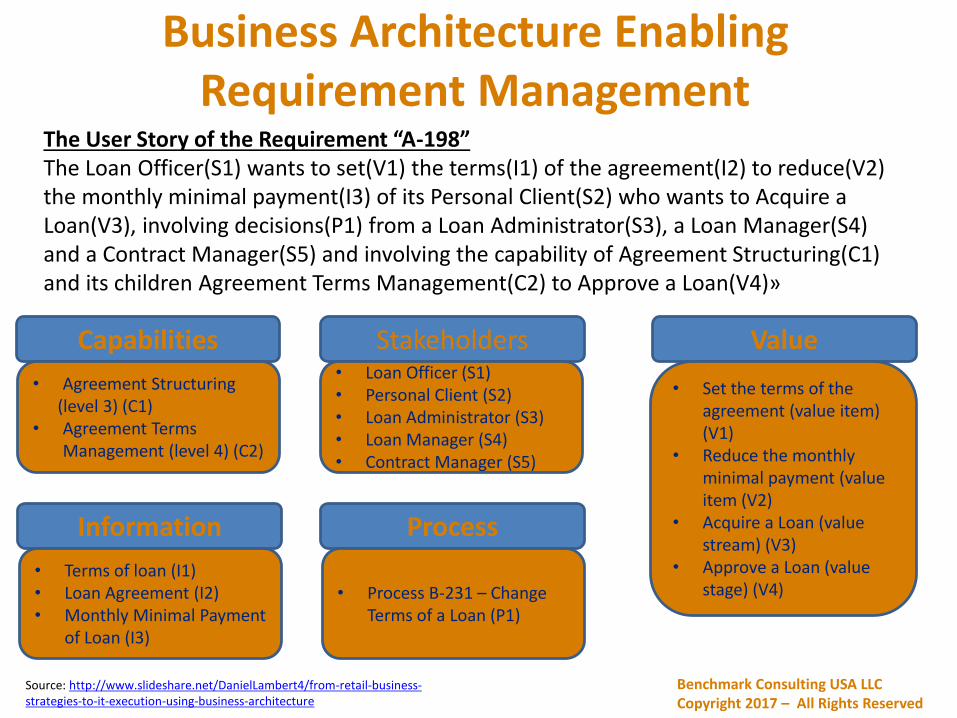
Business Architecture Enabling Requirement Management
Benchmark Consulting USA LLCCopyright 2017 – All Rights Reserved
Capabilities Stakeholders Value
The User Story of the Requirement “A-198”The Loan Officer(S1) wants to set(V1) the terms(I1) of the agreement(I2) to reduce(V2) the monthly minimal payment(I3) of its Personal Client(S2) who wants to Acquire a Loan(V3), involving decisions(P1) from a Loan Administrator(S3), a Loan Manager(S4) and a Contract Manager(S5) and involving the capability of Agreement Structuring(C1) and its children Agreement Terms Management(C2) to Approve a Loan(V4)»
• Agreement Structuring(level 3) (C1)
• Agreement Terms Management (level 4) (C2)
• Loan Officer (S1)• Personal Client (S2)• Loan Administrator (S3)• Loan Manager (S4)• Contract Manager (S5)
• Set the terms of the agreement (value item) (V1)
• Reduce the monthly minimal payment (value item (V2)
• Acquire a Loan (value stream) (V3)
• Approve a Loan (value stage) (V4)
Information
• Terms of loan (I1)• Loan Agreement (I2)• Monthly Minimal Payment
of Loan (I3)
Process
• Process B-231 – Change Terms of a Loan (P1)
Source: http://www.slideshare.net/DanielLambert4/from-retail-business-strategies-to-it-execution-using-business-architecture
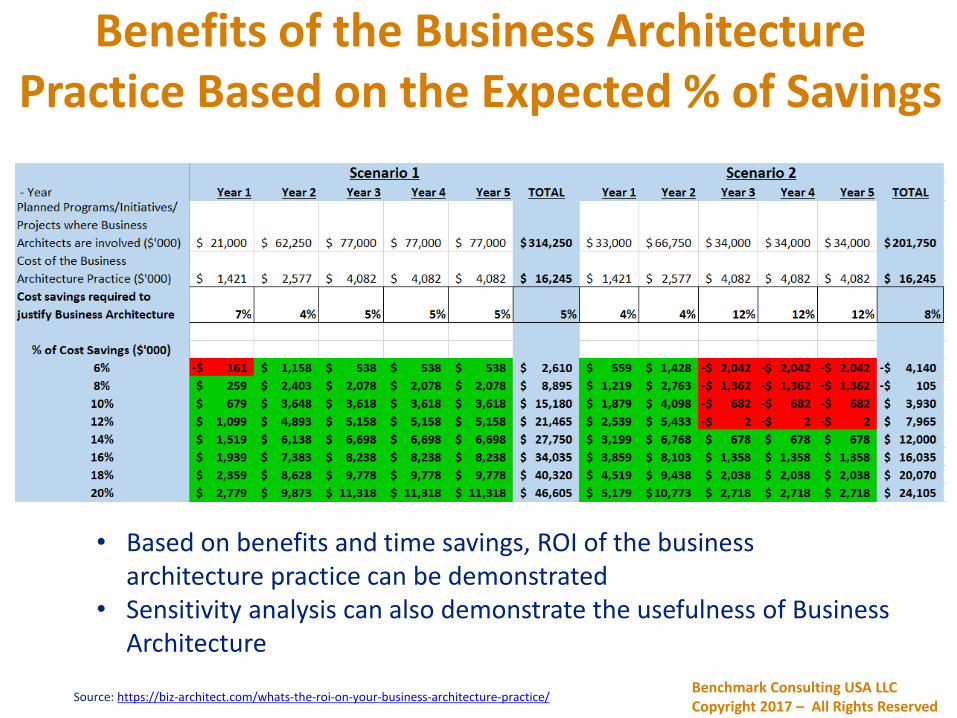
Benefits of the Business Architecture Practice Based on the Expected % of Savings
Benchmark Consulting USA LLC Copyright 2017 – All Rights Reserved
Source: https://biz-architect.com/whats-the-roi-on-your-business-architecture-practice/
• Based on benefits and time savings, ROI of the business architecture practice can be demonstrated
• Sensitivity analysis can also demonstrate the usefulness of Business Architecture
Thanks!
Daniel LambertEmail: [email protected]
Phone number: (855) 798-2042 x2010
Benchmark Consulting USA LLC Copyright 2017 – All Rights Reserved