enabling advanced visualization tools in a web-based simulation
TRANSCRIPT

Enabling Advanced Visualization Tools in aWeb-Based Simulation Monitoring System
Emanuele Santos, Julien Tierny, Ayla Khan, Brad Grimm, Lauro Lins, Juliana Freire, Valerio Pascucci, Claudio T. SilvaScientific Computing and Imaging (SCI) Institute
University of UtahSalt Lake City, UT, USA
{emanuele, jtierny, ayla, bgrimm, lauro, juliana, pascucci, csilva}@sci.utah.edu
Scott Klasky, Roselyne Barreto, Norbert PodhorszkiOak Ridge National Laboratory
P.O. Box 2008, Oak Ridge, TN 37831, USA{klasky, barreto, pnorbert}@ornl.gov
Abstract—Simulations that require massive amounts ofcomputing power and generate tens of terabytes of dataare now part of the daily lives of scientists. Analyzingand visualizing the results of these simulations as they arecomputed can lead not only to early insights but also touseful knowledge that can be provided as feedback to thesimulation, avoiding unnecessary use of computing power.Our work is aimed at making advanced visualization toolsavailable to scientists in a user-friendly, web-based environ-ment where they can be accessed anytime from anywhere.
In the context of turbulent combustion for example,visualization is used to understand the coupling betweenturbulence and the turbulent mixing of scalars. Althoughisosurface generation is a useful technique in this scenario,computing and rendering isosurfaces one at a time is ex-pensive and not particularly well-suited for such a web-based framework. In this paper we propose the use of asummary structure, called contour tree, that captures thetopological structure of a scalar field and guides the userin identifying useful isosurfaces. We have also designedan interface which has been integrated with a web-basedsimulation monitoring system, that allows users to interactwith and explore multiple isosurfaces.
I. INTRODUCTION
In many scientific disciplines, the use of simulationsis commonplace. As computing power and storage be-come more abundant, these simulations become morecomplex and data intensive. Simulations of turbulent liftedflames [1] for example, can take millions of CPU-hoursand result in multiple terabytes of data. Running thesesimulations on resources such as the TeraGrid is verycostly, and due to the high demand, cycles are scarce.Thus it is important that scientists be given the ability toanalyze these results as they are computed, which can notonly lead to early insights, but also to useful knowledgethat can help them steer the simulation, to remedy potentialerrors and avoid wasting cycles, or zoom into areas ofpotential interest.
But doing so poses important challenges. First andforemost, it is not feasible to move the simulation resultsaround since the I/O costs are prohibitive. It is thusimportant to push as much of the analysis and visualization
as possible to the high-performance computing (HPC)environment. This requires a tighter integration betweenthe simulations and analysis, and the creation of workflowsthat support both tasks in an HPC environment. Anotherchallenge comes from the complexity of the requiredanalysis. Because complex simulations deal with largenumbers of parameters, a potentially infinite number ofsummaries can be generated to help users explore differentaspects of the results. Because computing these summariesis itself an expensive task, both due to the size of the rawdata and complexity of summarization techniques, there isan increasing need for efficient techniques that help usersquickly identify useful regions of the data and specificsummaries to explore.
In this paper, we explore a web-based analysis andvisualization solution to this problem in the context ofturbulent combustion simulations. To understand the cou-pling between turbulence and the turbulent mixing ofscalars, such as temperature and species concentrations,it is important to generate isosurfaces that represent thoseinteractions. Isosurfaces are one of the most widely-usedvisualization techniques and efficient to compute: thecomplexity of standard marching cubes, the most popularisosurface algorithm, is linear [2]. Although it is possibleto efficiently generate an isosurface for a given isovalue,computing and rendering a large number of isosurfaces,as required in this scenario, is expensive and incurs ahigh network overhead for transferring the results to aweb browser. This makes such a solution impractical fora web-based analysis tool. To address this problem, wepropose the use of a summary structure, called contourtree, that captures the topological structure of a scalarfield and guides the user at identifying useful (important)isosurfaces, see Section III. We have also designed a userinterface that allows users to interact with and effectivelyexplore multiple isosurfaces (see Section IV). By applyingthe contour tree algorithm to find isosurface values in situwith the computation (Section III), it is possible to selec-tively browse through multiple visualizations and quicklyunderstand the complex data being generated during the
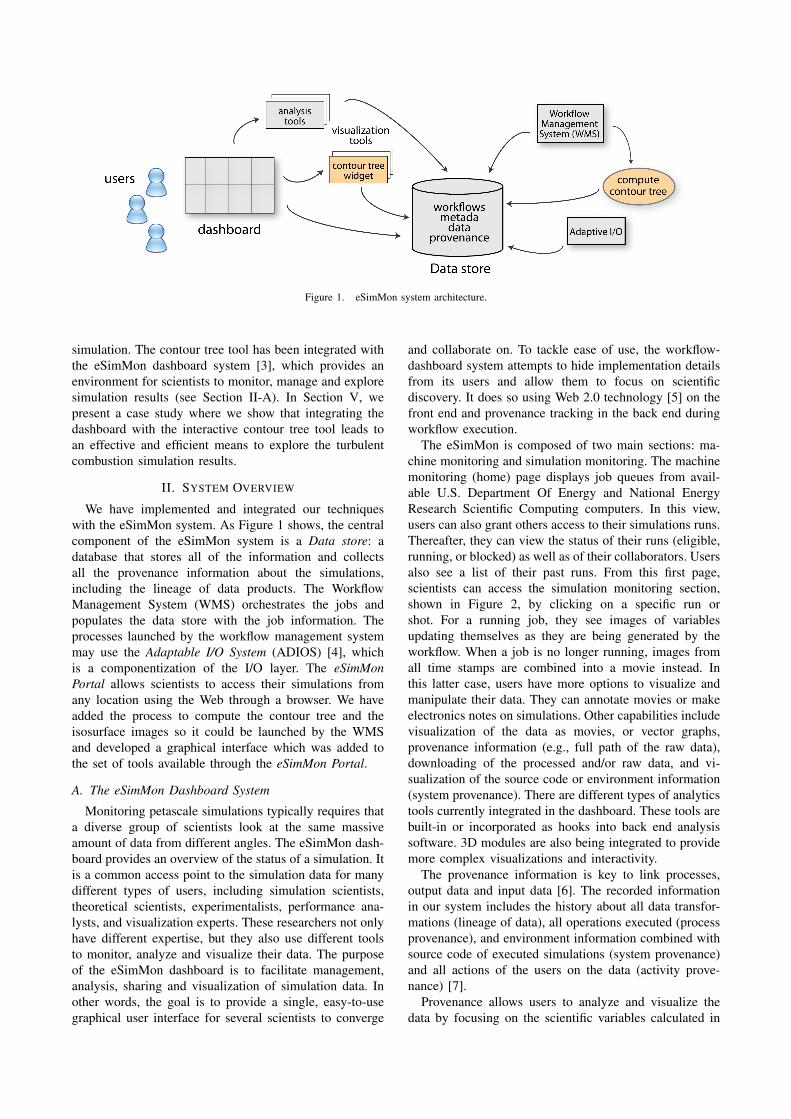
Figure 1. eSimMon system architecture.
simulation. The contour tree tool has been integrated withthe eSimMon dashboard system [3], which provides anenvironment for scientists to monitor, manage and exploresimulation results (see Section II-A). In Section V, wepresent a case study where we show that integrating thedashboard with the interactive contour tree tool leads toan effective and efficient means to explore the turbulentcombustion simulation results.
II. SYSTEM OVERVIEW
We have implemented and integrated our techniqueswith the eSimMon system. As Figure 1 shows, the centralcomponent of the eSimMon system is a Data store: adatabase that stores all of the information and collectsall the provenance information about the simulations,including the lineage of data products. The WorkflowManagement System (WMS) orchestrates the jobs andpopulates the data store with the job information. Theprocesses launched by the workflow management systemmay use the Adaptable I/O System (ADIOS) [4], whichis a componentization of the I/O layer. The eSimMonPortal allows scientists to access their simulations fromany location using the Web through a browser. We haveadded the process to compute the contour tree and theisosurface images so it could be launched by the WMSand developed a graphical interface which was added tothe set of tools available through the eSimMon Portal.
A. The eSimMon Dashboard System
Monitoring petascale simulations typically requires thata diverse group of scientists look at the same massiveamount of data from different angles. The eSimMon dash-board provides an overview of the status of a simulation. Itis a common access point to the simulation data for manydifferent types of users, including simulation scientists,theoretical scientists, experimentalists, performance ana-lysts, and visualization experts. These researchers not onlyhave different expertise, but they also use different toolsto monitor, analyze and visualize their data. The purposeof the eSimMon dashboard is to facilitate management,analysis, sharing and visualization of simulation data. Inother words, the goal is to provide a single, easy-to-usegraphical user interface for several scientists to converge
and collaborate on. To tackle ease of use, the workflow-dashboard system attempts to hide implementation detailsfrom its users and allow them to focus on scientificdiscovery. It does so using Web 2.0 technology [5] on thefront end and provenance tracking in the back end duringworkflow execution.
The eSimMon is composed of two main sections: ma-chine monitoring and simulation monitoring. The machinemonitoring (home) page displays job queues from avail-able U.S. Department Of Energy and National EnergyResearch Scientific Computing computers. In this view,users can also grant others access to their simulations runs.Thereafter, they can view the status of their runs (eligible,running, or blocked) as well as of their collaborators. Usersalso see a list of their past runs. From this first page,scientists can access the simulation monitoring section,shown in Figure 2, by clicking on a specific run orshot. For a running job, they see images of variablesupdating themselves as they are being generated by theworkflow. When a job is no longer running, images fromall time stamps are combined into a movie instead. Inthis latter case, users have more options to visualize andmanipulate their data. They can annotate movies or makeelectronics notes on simulations. Other capabilities includevisualization of the data as movies, or vector graphs,provenance information (e.g., full path of the raw data),downloading of the processed and/or raw data, and vi-sualization of the source code or environment information(system provenance). There are different types of analyticstools currently integrated in the dashboard. These tools arebuilt-in or incorporated as hooks into back end analysissoftware. 3D modules are also being integrated to providemore complex visualizations and interactivity.
The provenance information is key to link processes,output data and input data [6]. The recorded informationin our system includes the history about all data transfor-mations (lineage of data), all operations executed (processprovenance), and environment information combined withsource code of executed simulations (system provenance)and all actions of the users on the data (activity prove-nance) [7].
Provenance allows users to analyze and visualize thedata by focusing on the scientific variables calculated in
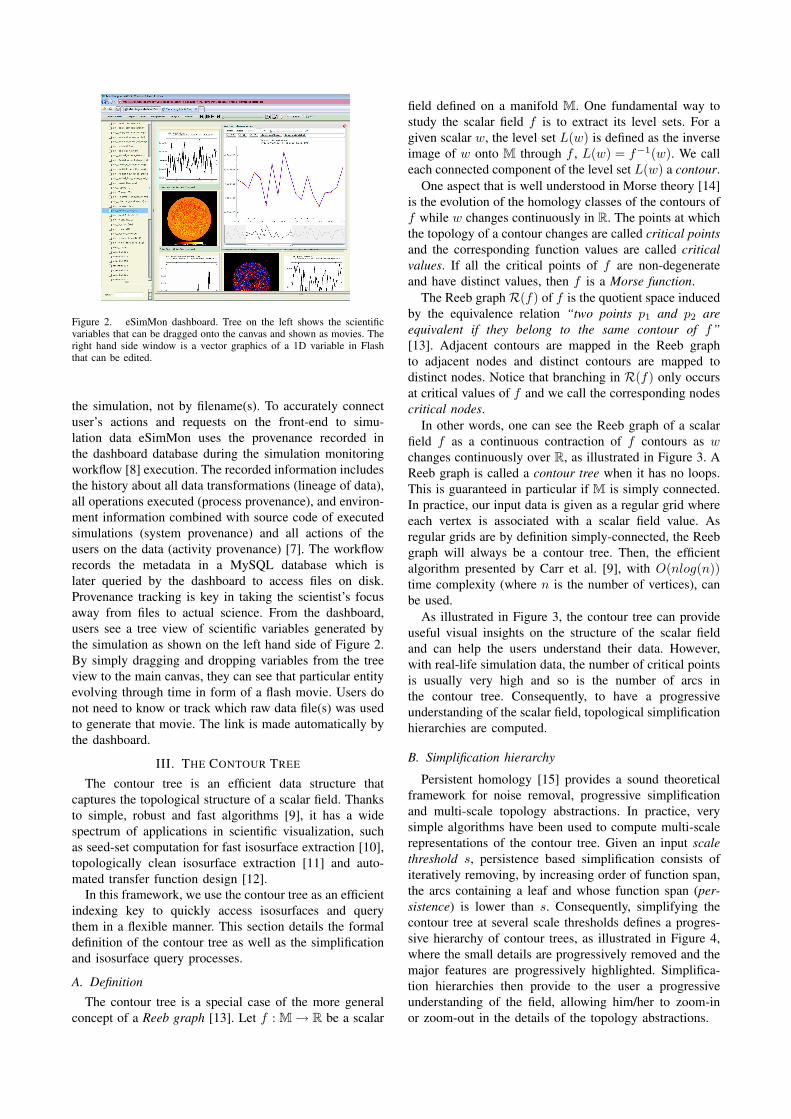
Figure 2. eSimMon dashboard. Tree on the left shows the scientificvariables that can be dragged onto the canvas and shown as movies. Theright hand side window is a vector graphics of a 1D variable in Flashthat can be edited.
the simulation, not by filename(s). To accurately connectuser’s actions and requests on the front-end to simu-lation data eSimMon uses the provenance recorded inthe dashboard database during the simulation monitoringworkflow [8] execution. The recorded information includesthe history about all data transformations (lineage of data),all operations executed (process provenance), and environ-ment information combined with source code of executedsimulations (system provenance) and all actions of theusers on the data (activity provenance) [7]. The workflowrecords the metadata in a MySQL database which islater queried by the dashboard to access files on disk.Provenance tracking is key in taking the scientist’s focusaway from files to actual science. From the dashboard,users see a tree view of scientific variables generated bythe simulation as shown on the left hand side of Figure 2.By simply dragging and dropping variables from the treeview to the main canvas, they can see that particular entityevolving through time in form of a flash movie. Users donot need to know or track which raw data file(s) was usedto generate that movie. The link is made automatically bythe dashboard.
III. THE CONTOUR TREE
The contour tree is an efficient data structure thatcaptures the topological structure of a scalar field. Thanksto simple, robust and fast algorithms [9], it has a widespectrum of applications in scientific visualization, suchas seed-set computation for fast isosurface extraction [10],topologically clean isosurface extraction [11] and auto-mated transfer function design [12].
In this framework, we use the contour tree as an efficientindexing key to quickly access isosurfaces and querythem in a flexible manner. This section details the formaldefinition of the contour tree as well as the simplificationand isosurface query processes.
A. Definition
The contour tree is a special case of the more generalconcept of a Reeb graph [13]. Let f : M → R be a scalar
field defined on a manifold M. One fundamental way tostudy the scalar field f is to extract its level sets. For agiven scalar w, the level set L(w) is defined as the inverseimage of w onto M through f , L(w) = f−1(w). We calleach connected component of the level set L(w) a contour.
One aspect that is well understood in Morse theory [14]is the evolution of the homology classes of the contours off while w changes continuously in R. The points at whichthe topology of a contour changes are called critical pointsand the corresponding function values are called criticalvalues. If all the critical points of f are non-degenerateand have distinct values, then f is a Morse function.
The Reeb graph R(f) of f is the quotient space inducedby the equivalence relation “two points p1 and p2 areequivalent if they belong to the same contour of f”[13]. Adjacent contours are mapped in the Reeb graphto adjacent nodes and distinct contours are mapped todistinct nodes. Notice that branching in R(f) only occursat critical values of f and we call the corresponding nodescritical nodes.
In other words, one can see the Reeb graph of a scalarfield f as a continuous contraction of f contours as wchanges continuously over R, as illustrated in Figure 3. AReeb graph is called a contour tree when it has no loops.This is guaranteed in particular if M is simply connected.In practice, our input data is given as a regular grid whereeach vertex is associated with a scalar field value. Asregular grids are by definition simply-connected, the Reebgraph will always be a contour tree. Then, the efficientalgorithm presented by Carr et al. [9], with O(nlog(n))time complexity (where n is the number of vertices), canbe used.
As illustrated in Figure 3, the contour tree can provideuseful visual insights on the structure of the scalar fieldand can help the users understand their data. However,with real-life simulation data, the number of critical pointsis usually very high and so is the number of arcs inthe contour tree. Consequently, to have a progressiveunderstanding of the scalar field, topological simplificationhierarchies are computed.
B. Simplification hierarchy
Persistent homology [15] provides a sound theoreticalframework for noise removal, progressive simplificationand multi-scale topology abstractions. In practice, verysimple algorithms have been used to compute multi-scalerepresentations of the contour tree. Given an input scalethreshold s, persistence based simplification consists ofiteratively removing, by increasing order of function span,the arcs containing a leaf and whose function span (per-sistence) is lower than s. Consequently, simplifying thecontour tree at several scale thresholds defines a progres-sive hierarchy of contour trees, as illustrated in Figure 4,where the small details are progressively removed and themajor features are progressively highlighted. Simplifica-tion hierarchies then provide to the user a progressiveunderstanding of the field, allowing him/her to zoom-inor zoom-out in the details of the topology abstractions.

Figure 3. Height function on a manifold volume. From left to right: the contours of f are continuously contracted to nodes in the contour tree asw increases. Right: final contour tree.
Figure 4. Progressive persistence based simplification of a contour tree(from top left to bottom right): the arcs corresponding to the fingers ofthe hand are progressively removed according to their size (persistence).
Notice that sophisticated geometry-aware simplificationcriteria have been proposed [11], in order to providethe user full flexibility for noise definition (integrating,instead of the persistence criterion, the actual size of theisosurfaces for example).
C. Flexible isosurface queries
Since they capture in a concise manner the full structureof the input scalar field, contour trees can be employed asan efficient indexing key to access isosurfaces. Given anisovalue w, an isosurface extraction consists in: (i) identifyall the arcs crossing w, (ii) for those arcs, extract the seedvertex with the function value closest to w and finally(iii) start standard isosurface traversal at the extractedseed vertices. In particular, when queried from simplifiedcontour trees, isosurfaces benefit from the simplificationscheme, as illustrated in Figure 5, where the componentscorresponding to small arcs are not extracted.
As a result, the user also benefits from a progres-sive understanding of the isosurfaces, where noise canbe progressively removed and where the most importantfeatures are progressively highlighted. Finally, the user canalso directly interact with the contour tree by explicitly
Figure 5. Flexible isosurface extraction. Top: Seed sets are extractedfrom the contour tree and isosurfaces are computed by standard traversaltechniques. Bottom: Isosurface extraction on a simplified contour treeleads to the removal of the small components of the isosurface.
highlighting arcs from where to extract an isosurfacecomponent, providing him/her with fully interactive ex-ploration of the data.
IV. CONTOUR TREE WIDGET
We developed a web interface called Contour TreeWidget, whose purpose is to provide scientists with betterways of exploring simulation results. In particular, it usescontour trees to facilitate the interaction with isosurfacesof these simulation results. The interface design of thiswidget is illustrated in Figure 6. It consists of threemain interactive components: the 3D View on the left; theContour Tree View on the top right and the ComplexitySlider on the bottom right.
The Contour Tree View displays the contour tree of thecurrent dataset. Usually the displayed tree is a simplifiedversion of the complete contour tree where only the“largest” features are represented. The contour tree is laidout satisfying the following constraints: the y coordinate
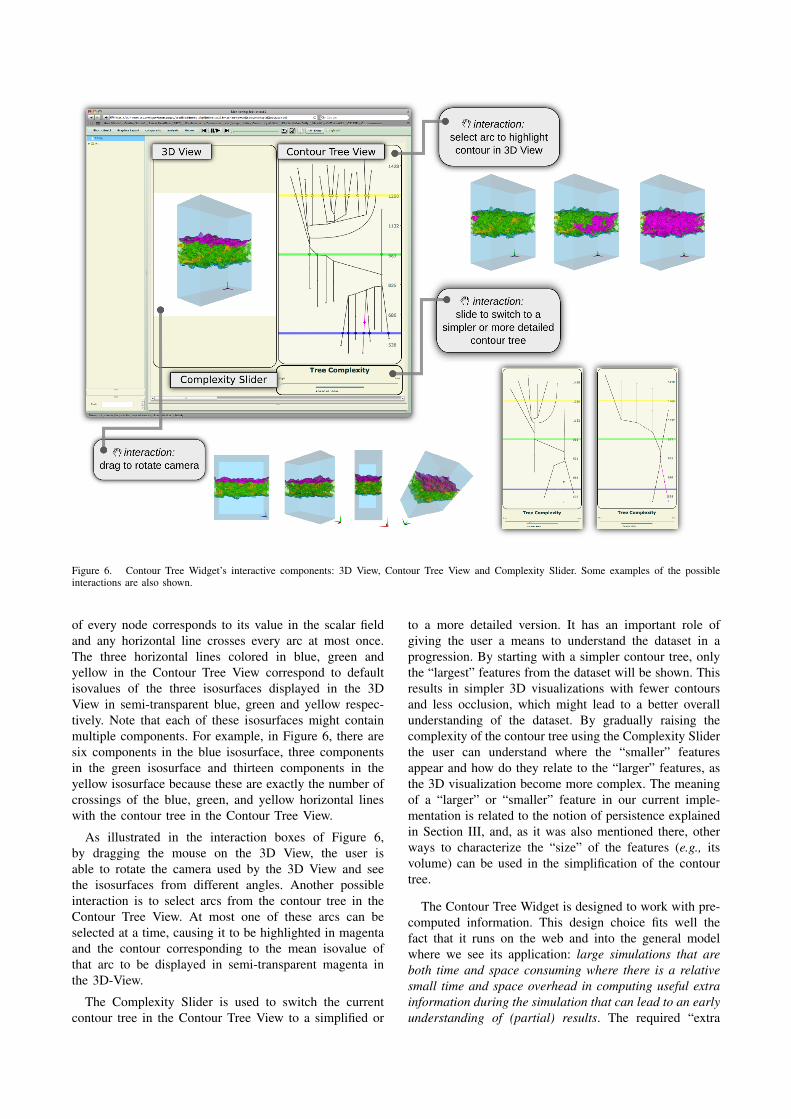
Figure 6. Contour Tree Widget’s interactive components: 3D View, Contour Tree View and Complexity Slider. Some examples of the possibleinteractions are also shown.
of every node corresponds to its value in the scalar fieldand any horizontal line crosses every arc at most once.The three horizontal lines colored in blue, green andyellow in the Contour Tree View correspond to defaultisovalues of the three isosurfaces displayed in the 3DView in semi-transparent blue, green and yellow respec-tively. Note that each of these isosurfaces might containmultiple components. For example, in Figure 6, there aresix components in the blue isosurface, three componentsin the green isosurface and thirteen components in theyellow isosurface because these are exactly the number ofcrossings of the blue, green, and yellow horizontal lineswith the contour tree in the Contour Tree View.
As illustrated in the interaction boxes of Figure 6,by dragging the mouse on the 3D View, the user isable to rotate the camera used by the 3D View and seethe isosurfaces from different angles. Another possibleinteraction is to select arcs from the contour tree in theContour Tree View. At most one of these arcs can beselected at a time, causing it to be highlighted in magentaand the contour corresponding to the mean isovalue ofthat arc to be displayed in semi-transparent magenta inthe 3D-View.
The Complexity Slider is used to switch the currentcontour tree in the Contour Tree View to a simplified or
to a more detailed version. It has an important role ofgiving the user a means to understand the dataset in aprogression. By starting with a simpler contour tree, onlythe “largest” features from the dataset will be shown. Thisresults in simpler 3D visualizations with fewer contoursand less occlusion, which might lead to a better overallunderstanding of the dataset. By gradually raising thecomplexity of the contour tree using the Complexity Sliderthe user can understand where the “smaller” featuresappear and how do they relate to the “larger” features, asthe 3D visualization become more complex. The meaningof a “larger” or “smaller” feature in our current imple-mentation is related to the notion of persistence explainedin Section III, and, as it was also mentioned there, otherways to characterize the “size” of the features (e.g., itsvolume) can be used in the simplification of the contourtree.
The Contour Tree Widget is designed to work with pre-computed information. This design choice fits well thefact that it runs on the web and into the general modelwhere we see its application: large simulations that areboth time and space consuming where there is a relativesmall time and space overhead in computing useful extrainformation during the simulation that can lead to an earlyunderstanding of (partial) results. The required “extra

Figure 7. The Contour Tree Web Widget integrated with the eSimMondashboard.
information” necessary to be able to use the Contour TreeWidget is obtained by computing the contour tree of adataset, selecting a set of simplified versions of it andcomposing a set of associated isosurfaces visualizations.
Figure 7 shows the Contour Tree Widget integrated withthe web interface of the eSimMon dashboard. Note thepresence of other widgets exposing different aspects ofthe dataset being used in combination with the ContourTree Widget.
V. CASE STUDY: VISUALIZING TURBULENTCOMBUSTION
Combustion scientists in collaboration with computerscientists are interested in understanding the underly-ing processes in internal combustion engines. Comparedto current engines, next-generation combustion engineswill function in non-conventional, mixed-mode, turbulentcombustion regimes and are likely to be characterizedby higher pressures, lower temperatures, higher levelsof dilution, and utilization of alternative fuels that ex-hibit a wide range of chemical and physical properties.Combustion processes in these environments result incomplicated interactions that are poorly understood at afundamental level, and are demanding for high-fidelitydirect numerical simulation (DNS) approaches that capturethese turbulence-chemistry interactions. These simulationsare costly, requiring several million CPU hours on aterascale computer, up to several billion grid points, andgenerating tens of terabytes of data [1].
To solve the complex equations governing these sim-ulations, the scientists use S3D [16], a massively par-allel DNS solver based on a high-order, non-dissipativenumerical scheme that was developed at Sandia NationalLaboratories. The tens of terabytes of raw data producedby S3D need to be analyzed and visualized to obtainphysical insight and/or to validate models.
Figure 8. S3D Kepler Workflow.
Among the generated data are NetCDF/HDF5 analysisfiles, containing both 2D slices and 1D slices from the3D dataset. Each variable in the NetCDF file is eitherprocessed using a plot library (for xy plots only) orAVS/Express [17] (for generating the images of colormapsand contours). The scientists use the Kepler workflowsystem [18] to manage the S3D workflow (shown inFigure 8), including movement and provenance of thegenerated data, and the eSimMon dashboard system de-scribed in Section II-A to monitor and visualize the resultsduring the execution of S3D. The types of visualizationcurrently available are displayed in Figure 2. Althoughthe dashboard provides useful tools for interacting withplots, 3D visualization is not explored. The scientists arelimited to visualizing 2D slices of a 3D volume overtime. As the datasets are very large, the scientists arenot able to visualize all the space of isosurfaces and theyhave to carefully select which isosurfaces they want to becomputed in high resolution. Our strategy is to use a lowresolution version of the dataset and apply the conceptof contour trees (see Section III) to not only display anoverview of the dataset but also to guide them in findinginteresting features in the visualization.
To achieve that, we extended the S3D workflow byadding a process to compute contour trees, simplifycontour trees, extract isosurfaces, and generate multipleimages of 3D visualizations necessary to feed the ContourTree Widget explained in Section IV. This new processon the S3D workflow is launched in batch mode after theNetCDF processing pipeline displayed in Figure 8 is done.
A. Performance Analysis
The dataset used in this case study consisted of a regulargrid of dimensions 45 by 112 by 96. In this case, thecode written in C we used to compute the contour treetook 4.99s to finish in a desktop computer with an Intel
Core2 2.83 Ghz architecture and 8 Gb RAM. It is worthmentioning that this C code was optimized for tetrahedralmeshes and not for the regular grids we used as input, sothere is still margin for improvements. As mentioned inSection III the contour tree algorithm runs in O(n log(n))where n is the number of vertices of the mesh. In practicethis means that it is feasible to extract contour trees formuch larger datasets than the one from this case study,depending on the desired application. The running timeto simplify the full contour tree into simpler versions isusually just a small fraction of the time to compute thefull contour tree. In our dataset it took 0.06s to simplifythe full contour tree into the simpler versions we used,this is less than 2% of the time it took to compute thecomplete contour tree.
As explained in Section III, we can use the contourtree to speed up the isosurface extraction. We used thisapproach in the dataset of this case study. The time tofind the seeds for the isosurface extraction was alwaysless than 0.00001s and the time to propagate the seeds toactually extract the largest isosurface in our dataset took0.38s and resulted in an isosurface with 277098 triangles.
The total time to compute all the extra informationneeded to run the Contour Tree Widget in this case studytook less two minutes. In the end, the dataset was ready tobe explored on the Web through four simplified versionsof the contour tree indexing visualizations for almostone hundred potentially relevant isosurfaces and contoursavailable in 26 different angles each. The space requiredfor this extra data was 140Mb with images in a 1024 by1024 resolution.
VI. CONCLUSIONS
The use of remote high-performance computing fa-cilities is becoming ubiquitous. Using these resources,scientists are able to generate unprecedented volumes ofdata, most of which simply can not be moved back to theirsites. Advanced remote data analysis and visualizationtools are thus essential in this scenario. In this work, wefocus on describing a tool for exploring and identifyinguseful regions of large datasets. We used a summarizationstructure called contour tree, that captures the topologicalstructure of a scalar field and helps the user identifyuseful (important) isosurfaces. We designed a specific userinterface that allows users to interact with and exploremultiple isosurfaces. In order to optimize interactivity,we used caching of the results (in particular images andmovies) wherever possible. We implemented our work inthe eSimMon dashboard system, and applied it in thecontext of simulation of combustion processes.
There is substantial future work to be pursued. Firstof all, we need to further improve the usability of thecontour tree widget by doing expert studies. Also, we needto explore alternative ways to optimize the computationand rendering of the isosurfaces. Right now, everything iscached and transferred as precomputed images or movies,but as browsers support more flexible 3-D rendering func-tionality, we might consider other rendering techniques.
We would also like to explore the use of state-of-the-artlevel of detail and streaming techniques.
ACKNOWLEDGMENTS
We would like to thank Jacqueline Chen at theCombustion Research Facility, Sandia National Laboratoryfor providing the dataset used in the case study. Ourresearch has been funded by the Department of EnergySciDAC (VACET and SDM centers), the NationalScience Foundation (grants IIS-0905385, IIS-0746500,ATM-0835821, IIS-0844546, CNS-0751152, IIS-0713637,OCE-0424602, IIS-0534628, CNS-0514485, IIS-0513692,CNS-0524096, CCF-0401498, OISE-0405402, CCF-0528201, CNS-0551724), and IBM Faculty Awards. E.Santos and J. Tierny are partially supported by Fulbrightscholarships.
REFERENCES
[1] J. H. Chen, A. Choudhary, B. de Supinski, M. DeVries,E. R. Hawkes, S. Klasky, W. K. Liao, K. L. Ma, J. Mellor-Crummey, N. Podhorszki, R. Sankaran, S. Shende, andC. S. Yoo, “Terascale direct numerical simulations ofturbulent combustion using S3D,” Computational Science& Discovery, vol. 2, no. 1, p. 015001 (31pp), 2009.
[2] W. E. Lorensen and H. E. Cline, “Marching cubes: Ahigh resolution 3d surface construction algorithm,” ACMSIGGRAPH 1987, vol. 21, no. 4, pp. 163–169, 1987.
[3] S. Klasky, M. Vouk, M. Parashar, A. Khan, N. Podhorszki,R. Barreto, D. Silver, and S. Parker, “Collaborative visual-ization spaces for petascale simulations,” in Proceedings of2008 International Symposium on Collaborative Technolo-gies and Systems (CTS 2008), 2008.
[4] J. Lofstead, F. Zheng, S. Klasky, and K. Schwan, “Adapt-able, metadata rich io methods for portable high perfor-mance io,” in In Proceedings of IPDPS’09, 2009.
[5] T. Oreilly, “What is Web 2.0: Design Patterns and BusinessModels for the Next Generation of Software,” O’ReilyMedia. Communications & Strategies, no. 1, p. 17, FirstQuarter 2007.
[6] J. Freire, D. Koop, E. Santos, and C. T. Silva, “Provenancefor computational tasks: A survey,” Computing in Science& Engineering, vol. 10, no. 3, pp. 11–21, May-June 2008.
[7] P. Mouallem, M. Vouk, S. Klasky, N. Podhorszki, andR. Barreto, “Tracking Files Using the Kepler ProvenanceFramework,” in Proceedings of the 21st International Con-ference on Scientific and Statistical Database Management(SSDBM’09), ser. LNCS 5566, 2009, pp. 273–282.
[8] B. Ludascher, I. Altintas, S. Bowers, J. Cummings,T. Critchlow, E. Deelman, D. D. Roure, J. Freire, C. Goble,M. Jones, S. Klasky, T. McPhillips, N. Podhorszki, C. Silva,I. Taylor, and M. Vouk, “Scientific process automation andworkflow management,” in Scientific Data Management:Challenges, Existing Technology, and Deployment, ser.Computational Science Series, A. Shoshani and D. Rotem,Eds. Chapman & Hall/CRC, 2009, ch. 13.
[9] H. Carr, J. Snoeying, and U. Axen, “Computing contourtrees in all dimensions,” in ACM Symposium on DiscreteAlgorithms, 2000, pp. 918–926.
[10] M. van Kreveld, R. van Oostrum, L. Bajaj, C, V. Pascucci,and R. Shcikore, D, “Contour trees and small seed sets forisosurface traversal,” in ACM Symposium on ComputationalGeometry, 1997, pp. 212–220.
[11] H. Carr, J. Snoeyink, and M. van de Panne, “SimplifyingFlexible Isosurfaces Using Local Geometric Measures,” inIEEE Visualization ’04, 2004, pp. 497–504.
[12] G. H. Weber, S. E. Dillard, H. Carr, V. Pascucci, andB. Hamann, “Topology-controlled volume rendering,” IEEEVisualization, vol. 13, pp. 330–341, 2007.
[13] G. Reeb, “Sur les points singuliers d’une forme de Pfaffcompletement integrable ou d’une fonction numerique,”Comptes-rendus de l’Academie des Sciences, vol. 222, pp.847–849, 1946.
[14] J. Milnor, Morse Theory. Princeton University Press, 1963.
[15] H. Edelsbrunner, D. Letscher, and A. Zomorodian, “Topo-logical persistence and simplification,” Discrete Computa-tional Geometry, vol. 28, pp. 511–533, 2002.
[16] E. Hawkes, R. Sankaran, J. Sutherland, and J. Chen, “Directnumerical simulation of turbulent combustion: fundamentalinsights towards predictive models,” in Journal of Physics:Conference Series, vol. 16, no. 1, 2005, pp. 65–79.
[17] C. Upson, J. Thomas Faulhaber, D. Kamins, D. H. Laidlaw,D. Schlegel, J. Vroom, R. Gurwitz, and A. van Dam,“The Application Visualization System: A ComputationalEnvironment for Scientific Visualization,” IEEE ComputerGraphics and Applications, vol. 9, no. 4, pp. 30–42, 1989.
[18] B. Ludascher, I. Altintas, C. Berkley, D. Higgins, E. Jaeger-Frank, M. Jones, E. Lee, J. Tao, and Y. Zhao, “ScientificWorkflow Management and the Kepler System,” Concur-rency and Computation: Practice & Experience, 2005.