en route - tripack.com.pk
TRANSCRIPT

A N N U A L R E P O R T 2 0 1 3
EN ROUTET O N E W H E I G H T S


We have come a long way in the journey which started in 1993; reaching one milestone after another. Taking inspiration from migrating birds, in this journey we will continue to discover new horizons and destinations, only to
make the journey all over again in pursuit of new heights of success.

Contents
04 06 38Stakeholders’ Information Corporate Governance
04 Vision
05 Mission Statement and
Corporate Strategy
09 Company Information
10 Business Overview
— Key Facts
— Geographical Presence
— Product
14 Our Business Strengths
15 Organizational Structure
16 Stakeholders Engagement
18 Key Operational Highlights
19 Health, Safety, Environment &
Quality Policy
20 Human Resource Development and
Management
24 Major Events
25 Key Financial Information
26 Financial Statistical Summary
28 Analytical Review
32 Horizontal and Vertical Analysis
36 Sources and Application of Funds
37 Value Added and its Distribution
40 Governance Framework
— Governance Framework
— Internal Control Framework
— Risk management
42 Profile of Board of Directors
44 Principal Board Committees
48 Chief Executive’s Review
50 Statement of Compliance with
the Code of Corporate Governance

52 70Directors’ Report Financial Statements Notice of AGM and Proxy
Form
55 Market Overview
55 Financial Highlights
56 Projects
56 Dividend
56 Future Outlook
57 Change of Director
57 Human Resource
57 Corporate Social Responsibility
57 Health, Safety and Environment
58 Quality Management
58 Contribution to the National
Exchequer
58 Related Parties
58 Code of Corporate Governance
59 Board of Directors
59 External Auditors
59 Audit Committee
60 Corporate and Financial Reporting
Framework
60 Acknowledgement
61 Balance Sheet Composition
62 Review Report to the Members
63 Shareholders’ Information
66 Shareholding Pattern
69 Auditors’ Report to the Members
72 Balance Sheet
74 Profit and Loss Accounts
75 Statement of Changes in Equity
76 Cash Flow Statement
77 Notes to and Forming Part of the
Financial Statements
114 Notice of AGM
Proxy Form
114

VisionTo enhance stakeholders’ value by being a supplier of first choice whilst maintaining leadership position in domestic market and profitably expanding footprint in the International market.
04 ANNUAL REPORT 2013

Mission Statement & CorporateStrategy
We will:
Satisfy our customers with timely supplies of products and services at economic prices, conforming to quality standards.
Achieve sustained growth to meet the demands of our customers’ and stakeholders’ expectations.
Continue developing new markets, products, applications and solutions in concert with our customers and suppliers.
Employ cost-effective technology to retain our competitive edge.
Nurture and inculcate a culture based on high ethical standards to meet our obligations towards the communities we operate in.
Attract, develop and retain talent through motivation, training, performance reward and providing growth opportunities.
Care for health and safety of our employees and stakeholders and play our due role towards the environmental requirements.
05

EN ROUTET O P R O G R E S S

Stakeholders’ Information


BOARD OF DIRECTORS Syed Babar Ali (Chairman)* Syed Hyder Ali Kimihide Ando Shahid Hussain (Chief Executive) Yasumasa Kondo Asif Qadir Khalid Yacob
AUDIT COMMITTEE Asif Qadir (Chairman) * Kimihide Ando Yasumasa Kondo Khalid Yacob
EXECUTIVE COMMITTEE Kimihide Ando (Chairman)* Syed Hyder Ali Shahid Hussain Khalid Yacob
HUMAN RESOURCE AND REMUNERATION COMMITTEE
Mr. Asif Qadir (Chairman)* Mr. Shahid Hussain Mr. Khalid Yacob
CHIEF FINANCIAL OFFICERNasir Jamal
COMPANY SECRETARYAdi J. Cawasji
AUDITORS AND TAX ADVISORA. F. Ferguson & Co.Chartered Accountants
LEGAL ADVISORSattar & Sattar Khan & Paracha
* In alphabetical order
SHARES REGISTRAR FAMCO Associates (Pvt.) Ltd8-F, Next to Hotel FaranNursery, Block 6, P.E.C.H.S.,Shahrah-e-FaisalKarachi - 75400Tel : (021) 34380101-2Fax : (021) 34380106
WEBSITEwww.tripack.com.pk
REGISTERED OFFICE4th Floor, The Forum,Suite No. 416-422,G-20, Block No. 9, Clifton,Khayaban-e-Jami,Karachi - 75600, Pakistan.Tel: (021) 35874047-49 (021) 35831618Fax: (021) 35860251
BANKERSAllied Bank LimitedAskari Bank LimitedBank Alfalah LimitedBank Al-Habib LimitedBank Islami Pakistan LimitedBarclays Bank PLC, PakistanCitibank N.A. Deutsche Bank A.G.Faysal Bank LimitedHabib Bank LimitedHSBC Bank Middle East LimitedMCB Bank LimitedMeezan Bank LimitedNIB Bank LimitedStandard Chartered Bank Ltd.The Bank of KhyberThe Bank of Tokyo-Mitsubishi UFJ, Ltd.
WORKSPlot No. G-1 to G-4,North Western Industrial Zone,Port Qasim Authority,Karachi.Tel : (021) 34720247-48 Fax : (021) 34720245
WORKS & REGIONAL SALES OFFICEPlot No. 78/1, Phase IV,Hattar Industrial Estate,Hattar, Khyber Pakhtunkhwa,(Formerly N.W.F.P.).Tel: (0995) 617406-7Fax: (0995) 617054
REGIONAL SALES OFFICEPlot No. 5 FC. C,Maratib Ali Road,Gulberg II,Lahore.Tel: (042) 35716068-70Fax: (042) 35716071
REGIONAL SALES & HEAD OFFICEHouse No. 18, Sir Abdullah Haroon Road, Adjacent Marriott Hotel, Karachi.Tel: (021) 35224336-37Fax: (021) 35224338
Company Information
09

Business Overview
Tri-Pack Films Limited (Tri-Pack) – a joint venture between Mitsubishi Corporation of Japan and Packages Limited of Pakistan was incorporated as a Public Limited Company on April 29, 1993 to produce Biaxially Orientated Polypropylene (BOPP) Films in Pakistan. Its head office is based in Karachi and regional offices are located in Karachi, Lahore and Hattar where focus is to provide customers with dependable, economical and quality films backed by strong customer services. Tri-Pack is indeed proud of making distinctive contributions to the packaging industry in Pakistan.
The Company is continuously growing since inception and has touched the country’s ever highest production of BOPP films in the year 2013 through the commissioning of BOPP Line-4 in March 2013 at a cost ofRs 5.4 billion.
The project of Cast Polypropylene (CPP) Line-2 with a capacity of 9,000 MT per annum was completed and commissioned in March 2014 within the budgeted cost of Rs 1.3 billion. This shall increase the combined CPP production capacity of the company from the present 7,200 MT per annum to 16,200 MT per annum.
KEY FACTS
THE COMPANY
LargestBOPP & CPP Films
Manufacturer in Pakistan
More than 450 Employees
10 ANNUAL REPORT 2013

EXPANDING FOOTPRINT IN
INTERNATIONAL MARKET
GEOGRAPHICAL PRESENCE
Oman
UAE
Srilanka
Nigeria
Netherland
Export Markets
South Africa
Bahrain
Chile
Kenya
Bangladesh
11

Keeping in view the needs of our customers, Transparent, Pearlized and Metallized films are produced in different varieties and thickness ranging from 12 to 60 micron. We also make specialized films having unique characteristics to suit specialized applications while creating a niche market. The most valuable property of our film is its versatility as a packaging material. We carefully craft our films to ensure good barrier properties against moisture, gas and odours. Excellent optical properties distinguish our films from the rest. Trouble free printing and sealability makes our products, the first choice of converters.
PRODUCT
Awarded by Management Associationof Pakistan (MAP)Corporate Excellence Awardin General Industrial Sector
“We are in your life; everywhere in everything”
12 ANNUAL REPORT 2013

“My experience at Tri-Pack has been particularly intriguing and unique. Joining as a Management Trainee in the Exports Department I was given the responsibility of marketing and sales for the Middle East region. Handling major export customer accounts across Middle East, operating in a completely different business culture, travelling the Middle East markets exploring business development opportunities and working against targets in a rapidly growing and evolving company has been a very learning and challenging experience with support and guidance from senior managers. I was able to learn fast, refine my ideas and take the challenge head-on”.
Muhammad Hamza Alvi Export Sales Executive – Middle East LUMS Graduate

Our Business StrengthsMARKET LEADERSHIP
Tri-Pack is currently considered as market leader, capturing almost 70 percent of the BOPP market in Pakistan. We have successfully increased our sales level in 2013 despite volatile law and order situation and challenging market conditions. In 2013, with additional capacity we also expanded our footprint successfully in the international market.
CUSTOMER SUPPORT
Tri-Pack besides producing high quality film also helps the customers in further processing and shares professional knowledge to achieve economic and sustainable solutions. We also manufacture the products in accordance with the customer requirement whilst meeting the international quality standards. In order to produce high quality films, we are using top of the line fully automated machines procured from world top suppliers such as Mitsubishi Corporation - Japan, Windmöller & Hölscher - Germany, General Vacuum and Galileo Vacuum - England, Bruckner – Germany and Bonfanti - Italy.
ADVANCE RESEARCH AND DEVELOPMENT FACILITIES
Our in-house R&D department is equipped with contemporary and sophisticated accessories. Not only the equipment but also the R&D team is highly professional who work round the clock 24 hours to ensure the production of high quality film. Product demand and development process is used to ensure that the product meets customer requirements by giving better run-ability and cost effective solutions while adding to our bottom line. With the core competency for developing any kind of BOPP and CPP films the target products are those which are rare in the market and difficult to produce like Plain 10, High Barrier Metallized films etc.
Smooth seas do not make skilful sailors” - African Proverb “My experience as Marketing & Sales Executive at Tri-Pack has remained a diverse one, with each day a new challenge to broaden my horizon and to look beyond the obvious. Such an experience goes a long way and I am grateful to have been provided the opportunity to navigate through rough seas”.
Sufyan Javed LUMS GraduateMarketing & Sales Executive
14 ANNUAL REPORT 2013

Organizational Structure
Board of Directors
Managing Director
Executive Committee
MarketingManager - North
& Centre
MarketingManager -
South & Export
ManagerOperations
HRManager
Chief Financial Officer
Human Resource and Remuneration Committee
Audit Committee
Internal AuditManager
15
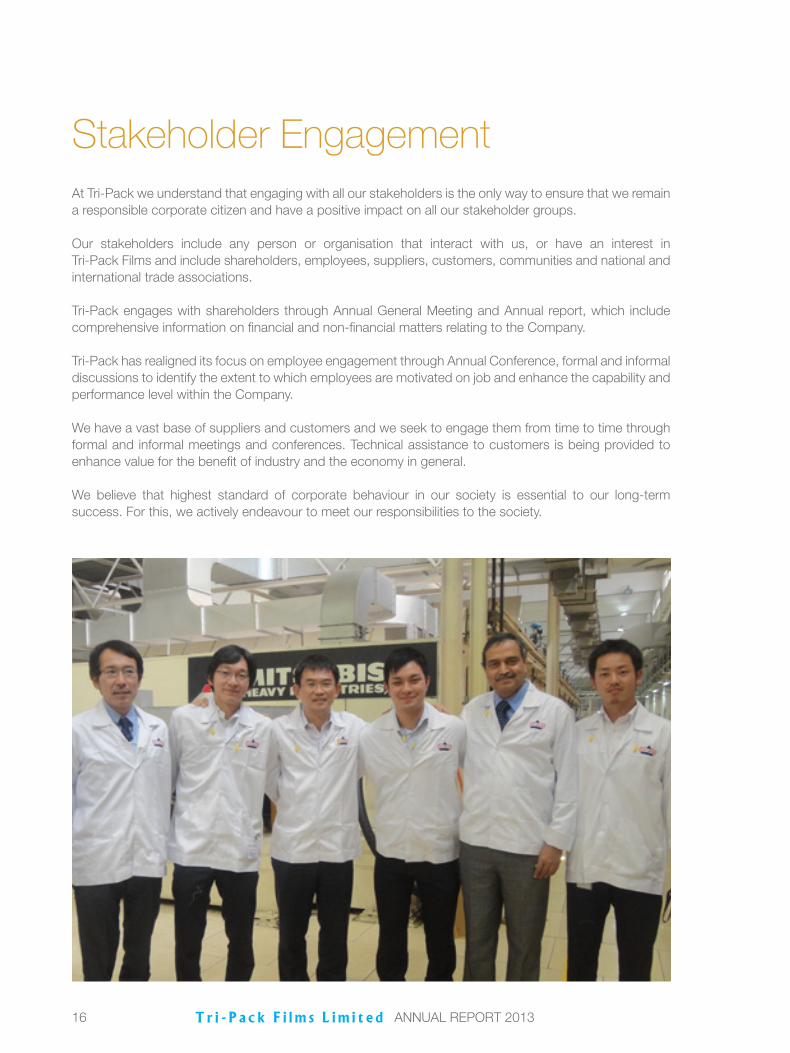
Stakeholder EngagementAt Tri-Pack we understand that engaging with all our stakeholders is the only way to ensure that we remain a responsible corporate citizen and have a positive impact on all our stakeholder groups.
Our stakeholders include any person or organisation that interact with us, or have an interest inTri-Pack Films and include shareholders, employees, suppliers, customers, communities and national and international trade associations.
Tri-Pack engages with shareholders through Annual General Meeting and Annual report, which include comprehensive information on financial and non-financial matters relating to the Company.
Tri-Pack has realigned its focus on employee engagement through Annual Conference, formal and informal discussions to identify the extent to which employees are motivated on job and enhance the capability and performance level within the Company.
We have a vast base of suppliers and customers and we seek to engage them from time to time through formal and informal meetings and conferences. Technical assistance to customers is being provided to enhance value for the benefit of industry and the economy in general.
We believe that highest standard of corporate behaviour in our society is essential to our long-term success. For this, we actively endeavour to meet our responsibilities to the society.
16 ANNUAL REPORT 2013


Key Operational Highlights Highest ever sale volumes of 43,468 tons in any year.
Highest Export of around 3,355 tons of BOPP and CPP Films in any year.
BOPP Line-4 was commissioned enhancing the capacity by 40,000 tons. Tri-Pack is now capable of producing 68,800 tons of BOPP Films annually.
Ground Breaking Ceremony of CPP Line-2 on 9th June to increase the capacity of production. (Production commenced in March 2014).
Commissioning of fourth Metallizer in January.
Commissioning of tenth Secondary Slitting Machine in January.
“I recently joined Tri-Pack as a Finance Trainee Officer. Tri-Pack is a growing company bordered by massive opportunities therefore I believe that this company will be able to provide me with such training where not only will I be able to enhance my skills through learning and development but also explore more of my potential, competence and capability”
Sana AslamACCA AffiliateFinance Trainee Officer
18 ANNUAL REPORT 2013

Health, Safety, Environment &Quality PolicyThe Health, Safety, Environment & Quality Policy of Tri-Pack Films Limited is to:
Ensure customer satisfaction through product of best quality, developments, modern technologies & by acquiring knowledge and skills.
Establish, implement and review objectives & targets to ensure continuous improvement in our HSEQ System.
Comply with all regulatory requirements on Health, Safety and Environment.
Protect employees and community from health & safety hazards and to prevent environmental pollution.
Use raw materials efficiently, manage waste effectively and economically and to conserve resources.
Communicate to all stakeholders about our occupational health, safety, environment and quality policy & performance.
Ensure that any new plant, equipment and processes installed will minimize hazards and impact to the environment.
Ensure sustainable use of energy and water resources.
“We are committed towards making workers’
lives better not only at the workplace but
also outside.”
19

Human Rescource Developmentand ManagementOUR PEOPLE
Over the course of 2013, Human Resource Department has achieved progress in the areas of strategic workforce planning, talent attraction and management, recruitment, learning and development, work environment, staff relations and overall improved work environment.
At Tri-Pack, our people have proven to be the most significant asset and an integral part of our existence as an enterprise and the key pillar of success of our business. We strive to keep our employees engaged and focused through our extensive reward and recognition programs. At the same time we also try to enhance skill development over a period of time through which our people evolve both personally and professionally. As an organization we have not only expanded in terms of our manufacturing capacity but have also taken the overall skill level of our employees to the next level via initiatives of continuous learning and development.
Various initiatives which contributed to key strategic areas, including, succession, learning and development, recruitment and retention, have been launched across the organization. This strategic trend is likely to continue as being a true business partner, the HR department endeavours to consult on the key challenges ahead including managing, retaining and aggressively attracting talent from the newly available pools of external candidates, continuous change management, developing transparent and clear communication channels at all levels of the organization and getting a deeper understanding of the real issues affecting our long term strategy.
20 ANNUAL REPORT 2013

TALENT INDUCTION
The year 2013 was an exceptional year as far as talent induction was concerned. We initiated an extensive recruitment drive to fulfil the resource requirements for the plant expansion at our Port QasimFacility – Karachi.
As part of our hiring philosophy, we are an equal opportunity employer ensuring that right candidates are hired through a transparent and efficient process aimed at facilitating the right skill-set for the organization.
We strongly believe in hiring and retaining the best, that is why we are in continuous pursuit of driving performance through improved employee engagement. Our aim is to further build upon our internal talent pool by attracting and retaining the best talent available.
LEARNING AND DEVELOPMENT
The Tri-Pack learning strategy is aligned to address current and emerging organizational needs and core learning at all levels. Our training strategy keeps in view the emerging requirements of every area and endeavours to train and develop employees by improving their skills, knowledge, abilities necessary for their professional and personal development. Our programs have helped improve the overall organizational efficiency and productivity levels. Overall a total of 2,894 training hours were achieved via on the job trainings, internal and external trainings both at local and international levels.
21

EMPLOYEE COMMUNICATION
We believe in a culture of openness and freedom of expression. We do this by providing several forums for employees to bring their valuable suggestions and feedback to the management. Suggestion boxes are installed at different locations for employees to send in their feedback, concerns and recommendations.
EMPLOYEE ENGAGEMENT
At Tri-Pack we want an open and supportive culture that blends together with diversity and innovation.
We value the level of dedication with which our employees contribute to the organization as it is essential to our success. Our aim is to offer an employee proposition which enables our employees to deliver the best each day. Our engaged workforce is better able to communicate effectively with clients and candidates, and are committed to finding solutions and improving business results on a sustainable basis.
Our aspiration is to make the engagement of our employees a leading indicator towards our journey of being an employer of choice.
We engage our people with various ways by participating in internal and external community
activities. In fact engagement activities keep aliveTri-Pack employees. Fun at work is our motto towards more sustained team building, higher emotional quotients and overall a healthy work environment, which is both open and inclusive.
During 2013, a number of such activities were organized including team building and health awareness sessions, annual / iftar dinners and sports events.
WORK-LIFE BALANCE
At Tri-Pack work-life balance is an effective component of our talent management strategy that fosters strong performance for both employees and the Company over the long-term by promoting a conducive work environment that is capable of responding to changes in current and future business needs while providing employees the control they need to work smarter, address their non-work priorities and be consistent and effective at work.
PERFORMANCE APPRAISAL SYSTEM
Performance appraisal is an ongoing critical business and people management process. AtTri-Pack appraisals are conducted twice a year and we endeavour to:-
22 ANNUAL REPORT 2013

Clearly connect individual’s work objectives to company objectives.
Provide clear performance expectations.
Provide timely, objective and behavioural feedback.
Foster a culture for continuous performance improvement and personal development.
Foster commitment to collaboration.
Strengthen organizational capability to live our values.
REWARD AND RECOGNITION
Providing constructive feedback to our employees and recognizing their achievements is an important part of our culture and business practice. Our reward philosophy is to promote sustainable performance which is aligned with the overall business strategy.
The intention is to link the reward & recognition structure directly to the employees’ performance and behaviour and the performance of the business. Individual and team achievements are also recognized through a number of internal and external awards, which include certificates of appreciation, length of service awards and awards for achievement of strategic objectives.
CORPORATE SOCIAL RESPONSIBILITY
Tri-Pack strongly believes in playing a proactive role in supporting the community and social development of Pakistan. Our Corporate Social Responsibility recognizes that an educated and healthy society is Pakistan’s key to ensuring sustainable development.
SUSTAINABILITY
Sustainability has emerged as a result of significant concerns about the profit, people, planet and the society. At Tri-Pack, sustainability is the cornerstone of our values. Our sustainability principles are strictly based on to create and maintain the atmosphere under which nature and humans can co-exist in a constructive manner that will lead to gratifying the social, economic and other requirements of present and future generations.
“My professional experience with Tri-Pack as an HR Executive has been truly amazing. The opportunities and challenges provided by the Company are constantly pushing me to be the best that I possibly can be. I have learned more, worked harder and enjoyed myself beyond my expectations. Proudly moving forward in the company knowing that this is where my future lies”.
Alina RizviHR ExecutiveMBA SZABIST
23

Q2Annual General Meeting – April 17th
Audit Committee Meeting – April 22nd
Visit of Mr. Joseph Mueller (Ex Managing Director Nestle
Pakistan) – May 06th
Visit of GM Plastic from Mitsubishi Corporation – June 06th
Q3Half Yearly Sales Conference – July 08th
Audit Committee Meeting – July 30th
Board Meeting for Half Yearly Accounts – 20th August
South African Delegation – September 21st
Visit of Mitsubishi Corporation – September 23rd
Q4Board and Audit Committee meeting – October 26th
Visit of Chairman- Syed Babar Ali – October 28th
Directors Visit – November 05th
Board Meeting – November 20th
Visit of Mitsubishi Corporation – December 16th
Major Events
Q1Approval of Annual Budget – January 22nd
Sustainability Conference – January 22nd
Annual Sales Conference – February 06th
Directors Visit – February 28th
Audit Committee Meeting – 11th March
24 ANNUAL REPORT 2013

Key Financial Information
Sales Revenue(Rs in Million)
17%2013
11,950
2012(Restated)
10,241
EBITDA(Rs in Million)
17%2013
1,697
2012(Restated)
1,455
Sales Volume(In Metric Tons)
8%2013
43,468
2012
40,145
Total Assets(Rs in Million)
21%2013
13,736
2012(Restated)
11,383
Operating Cash Flow(Rs in Million)
780%2013
1,628
2012(Restated)
209
Price Earning Ratio(In Times)
173%2013
28.4
2012(Restated)
10.4
Production(In Metric Tons)
25%2013
44,590
2012(Restated)
35,770
Number of Employees
25%2013
478
2012
383
Earning Per Share (EPS)(In Rupees)
-64%2013
6.97
2012(Restated)
19.42
Profit After Taxation*(Rs in Million)
-64%2013
209
2012(Restated)
583
* Includes Financial Charges of Rs. 614 million (2012: Rs. 171 million)
25

Financial Statistical Summary
Year toDecember31, 2013
Year toDecember31, 2012Restated
Year toDecember31, 2011
Year toDecember31, 2010
Year toDecember31, 2009
Year toDecember31, 2008
Year toDecember31, 2007
Year toDecember31, 2006
Year toDecember31, 2005
Year toDecember31, 2004
Balance Sheet Summary
Paid-up-capital 300,000 300,000 300,000 300,000 300,000 300,000 300,000 300,000 300,000 300,000 Reserves 1,575,468 1,371,000 1,136,467 995,000 831,000 772,000 632,000 614,000 604,500 534,500 Unappropriated profit/(loss) 199,717 530,890 784,730 496,125 465,280 240,205 320,219 168,064 84,682 115,736 Share holders' funds 2,075,185 2,201,890 2,221,197 1,791,125 1,596,280 1,312,205 1,252,608 1,082,064 989,182 950,236 Long term financing facilities 4,576,924 4,101,924 250,000 375,000 608,000 824,000 540,000 756,000 972,000 1,000,000 Fixed capital expenditure 7,546,207 6,569,376 2,449,481 1,871,819 2,095,567 2,111,285 1,608,744 1,703,966 1,879,300 1,890,571 Long term deposits 2,999 2,303 2,195 1,763 1,178 1,218 1,104 858 1,048 1,183 Deferred asset / (liability) - net (333,500) (239,758) (177,554) (232,524) (277,352) (304,735) (192,731) (104,426) (43,895) (24,865)Net current assets/(liabilities) (563,597) (28,107) 197,075 525,067 384,887 328,437 375,491 237,666 124,729 83,347
Profit & Loss Summary
Sales (net of sales tax) 11,950,081 10,240,532 10,009,875 7,620,571 5,685,687 5,865,487 4,555,172 3,825,643 2,998,386 1,754,302 Cost of sales 10,516,592 8,725,781 8,252,920 6,400,820 4,695,035 4,855,356 3,627,470 3,316,875 2,648,729 1,472,810 Gross profit 1,433,489 1,514,751 1,756,955 1,219,751 990,652 1,010,131 927,702 508,768 349,657 281,492 Administration and selling expenses 525,665 455,332 397,505 263,681 211,723 163,890 135,913 127,804 117,910 94,618 Operating profit 907,824 1,059,419 1,359,450 956,070 778,929 846,241 791,789 380,964 231,747 186,874 Other income 47,956 32,816 52,298 27,282 43,046 29,570 25,729 11,989 12,114 7,611 Financial charges 614,150 171,374 122,429 205,346 221,723 108,844 93,167 130,595 117,064 20,349 Other charges 23,573 57,341 90,289 55,012 41,418 43,310 49,981 18,103 6,340 8,405 Profit/(loss) before taxation 318,057 863,520 1,199,030 722,994 558,834 723,657 674,370 244,255 120,457 165,731 Provision for taxation 108,901 280,788 416,425 228,149 94,759 243,671 234,215 76,373 36,511 50,293 Profit/(loss) after taxation 209,156 582,732 782,605 494,845 464,075 479,986 440,155 167,882 83,946 115,438 Dividend - 300,000 600,000 300,000 300,000 420,000 300,000 150,000 75,000 45,000 Transfer to reserves 234,000 182,000 194,000 164,000 59,000 140,000 18,000 9,500 70,000 110,000
Key Financial Ratios
Gross profit / sales 12.00% 14.79% 17.55% 16.01% 17.42% 17.22% 20.37% 13.30% 11.66% 16.05%Profit before tax / sales 2.66% 8.43% 11.98% 9.49% 9.83% 12.34% 14.80% 6.38% 4.02% 9.45%Return on capital employed 13.68% 16.69% 53.30% 41.00% 33.12% 35.88% 41.18% 20.23% 12.16% 9.85%Interest coverage (times) 1.6 6.4 11.5 4.8 3.7 8.0 8.8 3.0 2.1 9.6 Inventory turnover (times) 3.72 3.30 4.43 4.96 3.91 4.30 4.63 8.18 6.46 2.81 Fixed assets turnover (times) 1.58 1.56 4.09 4.07 2.7 2.8 2.7 2.2 1.6 0.9 Debt : equity ratio 69:31 65:35 10:90 17:83 28:72 39:61 30:70 41:59 50:50 51:49 Current ratio 0.9 1.0 1.1 1.3 1.2 1.2 1.3 1.3 1.2 1.1
Shares & Earning
Break-up value (Rs per share) 69.2 73.4 74.0 59.7 53.2 43.7 41.7 36.1 33.0 31.7 Price earning ratio (times) 28.4 10.4 6.9 6.8 6.6 7.8 14.7 9.7 16.1 20.3 Earnings per share (Rupees) 6.97 19.42 26.09 16.49 15.47 16.00 14.67 5.60 2.80 3.85 Dividend - 100% 200% 100% 100% 140% 100% 50% 25% 15%Market value per share 198 202 180 112 102 125 215 54 52 78 Taxes, duties and levies 2,870,109 2,787,579 3,166,097 2,311,352 1,715,277 1,727,355 1,161,337 713,209 523,813 572,110
26 ANNUAL REPORT 2013

Year toDecember31, 2013
Year toDecember31, 2012Restated
Year toDecember31, 2011
Year toDecember31, 2010
Year toDecember31, 2009
Year toDecember31, 2008
Year toDecember31, 2007
Year toDecember31, 2006
Year toDecember31, 2005
Year toDecember31, 2004
Balance Sheet Summary
Paid-up-capital 300,000 300,000 300,000 300,000 300,000 300,000 300,000 300,000 300,000 300,000 Reserves 1,575,468 1,371,000 1,136,467 995,000 831,000 772,000 632,000 614,000 604,500 534,500 Unappropriated profit/(loss) 199,717 530,890 784,730 496,125 465,280 240,205 320,219 168,064 84,682 115,736 Share holders' funds 2,075,185 2,201,890 2,221,197 1,791,125 1,596,280 1,312,205 1,252,608 1,082,064 989,182 950,236 Long term financing facilities 4,576,924 4,101,924 250,000 375,000 608,000 824,000 540,000 756,000 972,000 1,000,000 Fixed capital expenditure 7,546,207 6,569,376 2,449,481 1,871,819 2,095,567 2,111,285 1,608,744 1,703,966 1,879,300 1,890,571 Long term deposits 2,999 2,303 2,195 1,763 1,178 1,218 1,104 858 1,048 1,183 Deferred asset / (liability) - net (333,500) (239,758) (177,554) (232,524) (277,352) (304,735) (192,731) (104,426) (43,895) (24,865)Net current assets/(liabilities) (563,597) (28,107) 197,075 525,067 384,887 328,437 375,491 237,666 124,729 83,347
Profit & Loss Summary
Sales (net of sales tax) 11,950,081 10,240,532 10,009,875 7,620,571 5,685,687 5,865,487 4,555,172 3,825,643 2,998,386 1,754,302 Cost of sales 10,516,592 8,725,781 8,252,920 6,400,820 4,695,035 4,855,356 3,627,470 3,316,875 2,648,729 1,472,810 Gross profit 1,433,489 1,514,751 1,756,955 1,219,751 990,652 1,010,131 927,702 508,768 349,657 281,492 Administration and selling expenses 525,665 455,332 397,505 263,681 211,723 163,890 135,913 127,804 117,910 94,618 Operating profit 907,824 1,059,419 1,359,450 956,070 778,929 846,241 791,789 380,964 231,747 186,874 Other income 47,956 32,816 52,298 27,282 43,046 29,570 25,729 11,989 12,114 7,611 Financial charges 614,150 171,374 122,429 205,346 221,723 108,844 93,167 130,595 117,064 20,349 Other charges 23,573 57,341 90,289 55,012 41,418 43,310 49,981 18,103 6,340 8,405 Profit/(loss) before taxation 318,057 863,520 1,199,030 722,994 558,834 723,657 674,370 244,255 120,457 165,731 Provision for taxation 108,901 280,788 416,425 228,149 94,759 243,671 234,215 76,373 36,511 50,293 Profit/(loss) after taxation 209,156 582,732 782,605 494,845 464,075 479,986 440,155 167,882 83,946 115,438 Dividend - 300,000 600,000 300,000 300,000 420,000 300,000 150,000 75,000 45,000 Transfer to reserves 234,000 182,000 194,000 164,000 59,000 140,000 18,000 9,500 70,000 110,000
Key Financial Ratios
Gross profit / sales 12.00% 14.79% 17.55% 16.01% 17.42% 17.22% 20.37% 13.30% 11.66% 16.05%Profit before tax / sales 2.66% 8.43% 11.98% 9.49% 9.83% 12.34% 14.80% 6.38% 4.02% 9.45%Return on capital employed 13.68% 16.69% 53.30% 41.00% 33.12% 35.88% 41.18% 20.23% 12.16% 9.85%Interest coverage (times) 1.6 6.4 11.5 4.8 3.7 8.0 8.8 3.0 2.1 9.6 Inventory turnover (times) 3.72 3.30 4.43 4.96 3.91 4.30 4.63 8.18 6.46 2.81 Fixed assets turnover (times) 1.58 1.56 4.09 4.07 2.7 2.8 2.7 2.2 1.6 0.9 Debt : equity ratio 69:31 65:35 10:90 17:83 28:72 39:61 30:70 41:59 50:50 51:49 Current ratio 0.9 1.0 1.1 1.3 1.2 1.2 1.3 1.3 1.2 1.1
Shares & Earning
Break-up value (Rs per share) 69.2 73.4 74.0 59.7 53.2 43.7 41.7 36.1 33.0 31.7 Price earning ratio (times) 28.4 10.4 6.9 6.8 6.6 7.8 14.7 9.7 16.1 20.3 Earnings per share (Rupees) 6.97 19.42 26.09 16.49 15.47 16.00 14.67 5.60 2.80 3.85 Dividend - 100% 200% 100% 100% 140% 100% 50% 25% 15%Market value per share 198 202 180 112 102 125 215 54 52 78 Taxes, duties and levies 2,870,109 2,787,579 3,166,097 2,311,352 1,715,277 1,727,355 1,161,337 713,209 523,813 572,110
27

201320122011201020092008
6,18
6,42
8
4,81
1,81
7
3,74
1,82
4
2,52
6,16
3
2,42
0,08
2
2,20
0,69
3
7,54
6,20
7
6,56
9,37
6
2,44
9,48
1
1,87
1,81
9
2,09
5,56
7
2,11
1,28
5
2,87
0,10
9
2,78
7,57
9
3,16
6,09
7
2,31
1,35
2
1,71
5,27
7
1,72
7,35
5
4,57
6,92
4
4,10
1,92
4
250,
000
375,
000
608,
000
824,
000
201320122011201020092008
201320122011201020092008 201320122011201020092008
201320122011201020092008 201320122011201020092008
201320122011201020092008 201320122011201020092008
201320122011201020092008 201320122011201020092008
201320122011201020092008
Current Assets(Rs in thousand)
Fixed Assets(Rs in thousand)
Net Sales(Rs in thousand)
Cost of Sales(Rs in thousand)
Current Liabilities(Rs in thousand)
Long-Term Liabilities(Rs in thousand)
Gross Pro�t(Rs in thousand)
Operating Pro�t(Rs in thousand)
Reserves(Rs in thousand)
Contribution to National Exchequer(Rs in thousand)
Net Pro�t(Rs in thousand)
6,75
0,02
5
4,83
9,92
4
3,54
4,74
9
2,00
1,09
6
2,03
5,19
5
1,87
2,25
6
1,57
5,46
8
1,37
1,00
0
1,13
6,46
7
995,
000
831,
000
772,
000
209,
156
582,
73278
2,60
5
494,
845
464,
075
479,
986
1,43
3,48
9
1,51
4,75
1
1,75
6,95
5
1,21
9,75
1
990,
652
1,01
0,13
1
11,9
50,0
81
10,2
40,5
32
10,0
09,8
75
7,62
0,57
1
5,68
5,68
7
5,86
5,48
7
10,5
16,5
92
8,72
5,78
1
8,25
2,92
0
6,40
0,82
0
4,69
5,03
5
4,85
5,35
6
907,
824
1,05
9,41
9
1,35
9,45
0
956,
070
778,
929
846,
241
201320122011201020092008
EBITDA(Rs in thousand)
1,69
7,35
9
1,45
4,90
0
1,77
6,76
2
1,34
6,97
7
1,15
0,04
9
1,14
1,58
0
Analytical Review
Note: FY 2012 has been restated.
28 ANNUAL REPORT 2013

201320122011201020092008
6,18
6,42
8
4,81
1,81
7
3,74
1,82
4
2,52
6,16
3
2,42
0,08
2
2,20
0,69
3
7,54
6,20
7
6,56
9,37
6
2,44
9,48
1
1,87
1,81
9
2,09
5,56
7
2,11
1,28
5
2,87
0,10
9
2,78
7,57
9
3,16
6,09
7
2,31
1,35
2
1,71
5,27
7
1,72
7,35
5
4,57
6,92
4
4,10
1,92
4
250,
000
375,
000
608,
000
824,
000
201320122011201020092008
201320122011201020092008 201320122011201020092008
201320122011201020092008 201320122011201020092008
201320122011201020092008 201320122011201020092008
201320122011201020092008 201320122011201020092008
201320122011201020092008
Current Assets(Rs in thousand)
Fixed Assets(Rs in thousand)
Net Sales(Rs in thousand)
Cost of Sales(Rs in thousand)
Current Liabilities(Rs in thousand)
Long-Term Liabilities(Rs in thousand)
Gross Pro�t(Rs in thousand)
Operating Pro�t(Rs in thousand)
Reserves(Rs in thousand)
Contribution to National Exchequer(Rs in thousand)
Net Pro�t(Rs in thousand)
6,75
0,02
5
4,83
9,92
4
3,54
4,74
9
2,00
1,09
6
2,03
5,19
5
1,87
2,25
6
1,57
5,46
8
1,37
1,00
0
1,13
6,46
7
995,
000
831,
000
772,
000
209,
156
582,
73278
2,60
5
494,
845
464,
075
479,
986
1,43
3,48
9
1,51
4,75
1
1,75
6,95
5
1,21
9,75
1
990,
652
1,01
0,13
1
11,9
50,0
81
10,2
40,5
32
10,0
09,8
75
7,62
0,57
1
5,68
5,68
7
5,86
5,48
7
10,5
16,5
92
8,72
5,78
1
8,25
2,92
0
6,40
0,82
0
4,69
5,03
5
4,85
5,35
6
907,
824
1,05
9,41
9
1,35
9,45
0
956,
070
778,
929
846,
241
201320122011201020092008
EBITDA(Rs in thousand)
1,69
7,35
9
1,45
4,90
0
1,77
6,76
2
1,34
6,97
7
1,15
0,04
9
1,14
1,58
0
29

201320122011201020092008
28.40
10.40
6.906.796.597.81
201320122011201020092008
201320122011201020092008
201320122011201020092008
201320122011201020092008
201320122011201020092008
201320122011201020092008
201320122011201020092008
201320122011201020092008
201320122011201020092008
Price Earning Ratio(In Times)
Earning Per Share(Rupees)
EBITDA Margin to Sales(In Percentage)
Breakup Value Per Share(Rupees)
Return on Capital Employed(In Percentage)
Net Pro�t Margin(In Percentage)
Return on Equity(In Percentage)
Cash Flows from Investing Activities(Rs in Thousands)
Gross Pro�t Margin(In Percentage)
Cash Flows from Financing Activities(Rs in Thousands)
14.2014.21
17.7517.68
20.2319.46
1.75
5.69
7.82
6.49
8.168.18
12.00
14.79
17.55
16.01
17.4217.22
6.97
19.42
26.09
16.4915.4716.00
69.20
73.4074.00
59.70
53.20
43.7010.08
26.47
35.23
27.6329.07
36.58
13.6816.69
53.65
41.00
33.1235.88
(1,575,766)
(3,966,463)
(1,155,706)
(137,141) (291,802)
(714,432)
305,812
3,630,359
Market Value Per ShareHigh / Low (Rupees)
201320122011201020092008
230218
188
126141
264
159160
120
8792
125
(680,647) (741,723) (623,298) (207,224)
Cash Flows from Operating Activities (Net)(Rs in Thousands)
1,094,403
(157,517)
1,028,692
1,309,747
891,315
243,600
201320122011201020092008
Analytical Review
Note: FY 2012 has been restated.
30 ANNUAL REPORT 2013

201320122011201020092008
28.40
10.40
6.906.796.597.81
201320122011201020092008
201320122011201020092008
201320122011201020092008
201320122011201020092008
201320122011201020092008
201320122011201020092008
201320122011201020092008
201320122011201020092008
201320122011201020092008
Price Earning Ratio(In Times)
Earning Per Share(Rupees)
EBITDA Margin to Sales(In Percentage)
Breakup Value Per Share(Rupees)
Return on Capital Employed(In Percentage)
Net Pro�t Margin(In Percentage)
Return on Equity(In Percentage)
Cash Flows from Investing Activities(Rs in Thousands)
Gross Pro�t Margin(In Percentage)
Cash Flows from Financing Activities(Rs in Thousands)
14.2014.21
17.7517.68
20.2319.46
1.75
5.69
7.82
6.49
8.168.18
12.00
14.79
17.55
16.01
17.4217.22
6.97
19.42
26.09
16.4915.4716.00
69.20
73.4074.00
59.70
53.20
43.7010.08
26.47
35.23
27.6329.07
36.58
13.6816.69
53.65
41.00
33.1235.88
(1,575,766)
(3,966,463)
(1,155,706)
(137,141) (291,802)
(714,432)
305,812
3,630,359
Market Value Per ShareHigh / Low (Rupees)
201320122011201020092008
230218
188
126141
264
159160
120
8792
125
(680,647) (741,723) (623,298) (207,224)
Cash Flows from Operating Activities (Net)(Rs in Thousands)
1,094,403
(157,517)
1,028,692
1,309,747
891,315
243,600
201320122011201020092008
31
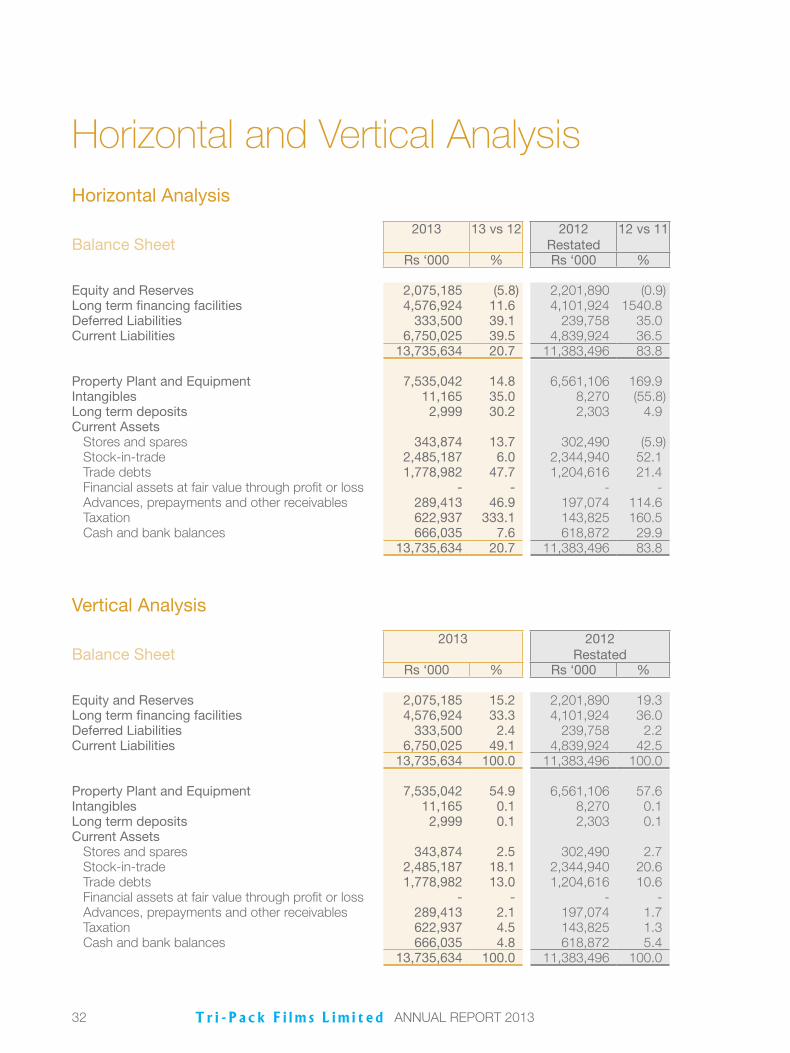
Horizontal and Vertical Analysis
Balance Sheet2013 13 vs 12 2012
Restated12 vs 11 2011 11 vs 10 2010 10 vs 09 2009 09 vs 08 2008
Rs ‘000 % Rs ‘000 % Rs ‘000 % Rs ‘000 % Rs ‘000 % Rs ‘000
Equity and Reserves 2,075,185 (5.8) 2,201,890 (0.9) 2,221,197 24.0 1,791,125 12.2 1,596,280 21.6 1,312,205 Long term financing facilities 4,576,924 11.6 4,101,924 1540.8 250,000 (33.3) 375,000 (38.3) 608,000 (26.2) 824,000 Deferred Liabilities 333,500 39.1 239,758 35.0 177,554 (23.6) 232,524 (16.2) 277,352 (9.0) 304,735 Current Liabilities 6,750,025 39.5 4,839,924 36.5 3,544,749 77.1 2,001,096 (1.7) 2,035,195 8.7 1,872,256
13,735,634 20.7 11,383,496 83.8 6,193,500 40.8 4,399,745 (2.6) 4,516,827 4.7 4,313,196
Property Plant and Equipment 7,535,042 14.8 6,561,106 169.9 2,430,754 31.1 1,853,983 (10.7) 2,075,859 (1.7) 2,111,285 Intangibles 11,165 35.0 8,270 (55.8) 18,727 5.0 17,836 (9.5) 19,708 100.0 - Long term deposits 2,999 30.2 2,303 4.9 2,195 24.5 1,763 49.7 1,178 (3.3) 1,218 Current Assets
Stores and spares 343,874 13.7 302,490 (5.9) 321,433 35.6 237,119 19.3 198,796 11.6 178,069 Stock-in-trade 2,485,187 6.0 2,344,940 52.1 1,542,125 46.5 1,052,338 5.0 1,002,595 5.5 950,426 Trade debts 1,778,982 47.7 1,204,616 21.4 991,922 29.3 767,252 (13.6) 887,659 30.2 681,822 Financial assets at fair value through profit or loss - - - - 262,884 - - - - - - Advances, prepayments and other receivables 289,413 46.9 197,074 114.6 91,824 133.6 39,313 5.1 37,393 (59.9) 93,259 Taxation 622,937 333.1 143,825 160.5 55,202 (30.9) 79,931 25.1 63,873 100.0 - Cash and bank balances 666,035 7.6 618,872 29.9 476,434 36.0 350,210 52.4 229,766 (22.7) 297,117
13,735,634 20.7 11,383,496 83.8 6,193,500 40.8 4,399,745 (2.6) 4,516,827 4.7 4,313,196
Balance Sheet2013 2012
Restated2011 2010 2009 2008
Rs ‘000 % Rs ‘000 % Rs ‘000 % Rs ‘000 % Rs ‘000 % Rs ‘000 %
Equity and Reserves 2,075,185 15.2 2,201,890 19.3 2,221,197 35.9 1,791,125 40.7 1,596,280 35.3 1,312,205 30.4Long term financing facilities 4,576,924 33.3 4,101,924 36.0 250,000 4.0 375,000 8.5 608,000 13.5 824,000 19.1Deferred Liabilities 333,500 2.4 239,758 2.2 177,554 2.9 232,524 5.3 277,352 6.1 304,735 7.1Current Liabilities 6,750,025 49.1 4,839,924 42.5 3,544,749 57.2 2,001,096 45.5 2,035,195 45.1 1,872,256 43.4
13,735,634 100.0 11,383,496 100.0 6,193,500 100.0 4,399,745 100.0 4,516,827 100.0 4,313,196 100.0
Property Plant and Equipment 7,535,042 54.9 6,561,106 57.6 2,430,754 39.2 1,853,983 42.1 2,075,859 46.0 2,111,285 48.9Intangibles 11,165 0.1 8,270 0.1 18,727 0.3 17,836 0.4 19,708 0.4 - Long term deposits 2,999 0.1 2,303 0.1 2,195 0.1 1,763 0.1 1,178 0.0 1,218 0.1Current Assets
Stores and spares 343,874 2.5 302,490 2.7 321,433 5.2 237,119 5.4 198,796 4.4 178,069 4.1Stock-in-trade 2,485,187 18.1 2,344,940 20.6 1,542,125 24.9 1,052,338 23.9 1,002,595 22.2 950,426 22.0Trade debts 1,778,982 13.0 1,204,616 10.6 991,922 16.0 767,252 17.4 887,659 19.7 681,822 15.8Financial assets at fair value through profit or loss - - - - 262,884 4.2 - - - - - -Advances, prepayments and other receivables 289,413 2.1 197,074 1.7 91,824 1.5 39,313 0.9 37,393 0.8 93,259 2.2Taxation 622,937 4.5 143,825 1.3 55,202 0.9 79,931 1.8 63,873 1.4 - -Cash and bank balances 666,035 4.8 618,872 5.4 476,434 7.7 350,210 8.0 229,766 5.1 297,117 6.9
13,735,634 100.0 11,383,496 100.0 6,193,500 100.0 4,399,745 100.0 4,516,827 100.0 4,313,196 100.0
Horizontal Analysis
Vertical Analysis
32 ANNUAL REPORT 2013

Balance Sheet2013 13 vs 12 2012
Restated12 vs 11 2011 11 vs 10 2010 10 vs 09 2009 09 vs 08 2008
Rs ‘000 % Rs ‘000 % Rs ‘000 % Rs ‘000 % Rs ‘000 % Rs ‘000
Equity and Reserves 2,075,185 (5.8) 2,201,890 (0.9) 2,221,197 24.0 1,791,125 12.2 1,596,280 21.6 1,312,205 Long term financing facilities 4,576,924 11.6 4,101,924 1540.8 250,000 (33.3) 375,000 (38.3) 608,000 (26.2) 824,000 Deferred Liabilities 333,500 39.1 239,758 35.0 177,554 (23.6) 232,524 (16.2) 277,352 (9.0) 304,735 Current Liabilities 6,750,025 39.5 4,839,924 36.5 3,544,749 77.1 2,001,096 (1.7) 2,035,195 8.7 1,872,256
13,735,634 20.7 11,383,496 83.8 6,193,500 40.8 4,399,745 (2.6) 4,516,827 4.7 4,313,196
Property Plant and Equipment 7,535,042 14.8 6,561,106 169.9 2,430,754 31.1 1,853,983 (10.7) 2,075,859 (1.7) 2,111,285 Intangibles 11,165 35.0 8,270 (55.8) 18,727 5.0 17,836 (9.5) 19,708 100.0 - Long term deposits 2,999 30.2 2,303 4.9 2,195 24.5 1,763 49.7 1,178 (3.3) 1,218 Current Assets
Stores and spares 343,874 13.7 302,490 (5.9) 321,433 35.6 237,119 19.3 198,796 11.6 178,069 Stock-in-trade 2,485,187 6.0 2,344,940 52.1 1,542,125 46.5 1,052,338 5.0 1,002,595 5.5 950,426 Trade debts 1,778,982 47.7 1,204,616 21.4 991,922 29.3 767,252 (13.6) 887,659 30.2 681,822 Financial assets at fair value through profit or loss - - - - 262,884 - - - - - - Advances, prepayments and other receivables 289,413 46.9 197,074 114.6 91,824 133.6 39,313 5.1 37,393 (59.9) 93,259 Taxation 622,937 333.1 143,825 160.5 55,202 (30.9) 79,931 25.1 63,873 100.0 - Cash and bank balances 666,035 7.6 618,872 29.9 476,434 36.0 350,210 52.4 229,766 (22.7) 297,117
13,735,634 20.7 11,383,496 83.8 6,193,500 40.8 4,399,745 (2.6) 4,516,827 4.7 4,313,196
Balance Sheet2013 2012
Restated2011 2010 2009 2008
Rs ‘000 % Rs ‘000 % Rs ‘000 % Rs ‘000 % Rs ‘000 % Rs ‘000 %
Equity and Reserves 2,075,185 15.2 2,201,890 19.3 2,221,197 35.9 1,791,125 40.7 1,596,280 35.3 1,312,205 30.4Long term financing facilities 4,576,924 33.3 4,101,924 36.0 250,000 4.0 375,000 8.5 608,000 13.5 824,000 19.1Deferred Liabilities 333,500 2.4 239,758 2.2 177,554 2.9 232,524 5.3 277,352 6.1 304,735 7.1Current Liabilities 6,750,025 49.1 4,839,924 42.5 3,544,749 57.2 2,001,096 45.5 2,035,195 45.1 1,872,256 43.4
13,735,634 100.0 11,383,496 100.0 6,193,500 100.0 4,399,745 100.0 4,516,827 100.0 4,313,196 100.0
Property Plant and Equipment 7,535,042 54.9 6,561,106 57.6 2,430,754 39.2 1,853,983 42.1 2,075,859 46.0 2,111,285 48.9Intangibles 11,165 0.1 8,270 0.1 18,727 0.3 17,836 0.4 19,708 0.4 - Long term deposits 2,999 0.1 2,303 0.1 2,195 0.1 1,763 0.1 1,178 0.0 1,218 0.1Current Assets
Stores and spares 343,874 2.5 302,490 2.7 321,433 5.2 237,119 5.4 198,796 4.4 178,069 4.1Stock-in-trade 2,485,187 18.1 2,344,940 20.6 1,542,125 24.9 1,052,338 23.9 1,002,595 22.2 950,426 22.0Trade debts 1,778,982 13.0 1,204,616 10.6 991,922 16.0 767,252 17.4 887,659 19.7 681,822 15.8Financial assets at fair value through profit or loss - - - - 262,884 4.2 - - - - - -Advances, prepayments and other receivables 289,413 2.1 197,074 1.7 91,824 1.5 39,313 0.9 37,393 0.8 93,259 2.2Taxation 622,937 4.5 143,825 1.3 55,202 0.9 79,931 1.8 63,873 1.4 - -Cash and bank balances 666,035 4.8 618,872 5.4 476,434 7.7 350,210 8.0 229,766 5.1 297,117 6.9
13,735,634 100.0 11,383,496 100.0 6,193,500 100.0 4,399,745 100.0 4,516,827 100.0 4,313,196 100.0
33

Horizontal and Vertical Analysis
Profit & Loss2013 13 vs 12 2012
Restated12 vs 11 2011 11 vs 10 2010 10 vs 09 2009 09 vs 08 2008
Rs ‘000 % Rs ‘000 % Rs ‘000 % Rs ‘000 % Rs ‘000 % Rs ‘000
Net Sales 11,950,081 16.7 10,240,532 2.3 10,009,875 31.4 7,620,571 34.0 5,685,687 (3.1) 5,865,487
Cost of sales 10,516,592 20.5 8,725,781 5.7 8,252,920 28.9 6,400,820 36.3 4,695,035 (3.3) 4,855,356
Gross profit 1,433,489 (5.4) 1,514,751 (13.8) 1,756,955 44.0 1,219,751 23.1 990,652 (1.9) 1,010,131
Administration and selling expenses 525,665 15.4 455,332 14.5 397,505 50.8 263,681 24.5 211,723 29.2 163,890
Operating profit 907,824 (14.3) 1,059,419 (22.1) 1,359,450 42.2 956,070 22.7 778,929 (8.0) 846,241
Other income 47,956 46.1 32,816 (37.3) 52,298 91.7 27,282 (36.6) 43,046 45.6 29,570
Financial charges 614,150 258.4 171,374 40.0 122,429 (40.4) 205,346 (7.4) 221,723 103.7 108,844
Other charges 23,573 (58.9) 57,341 (36.5) 90,289 64.1 55,012 32.8 41,418 (4.4) 43,310
Profit before taxation 318,057 (63.2) 863,520 (28.0) 1,199,030 65.8 722,994 29.4 558,834 (22.8) 723,657
Provision for taxation 108,901 (61.2) 280,788 (32.6) 416,425 82.5 228,149 140.8 94,759 (61.1) 243,671
Profit after taxation 209,156 (64.1) 582,732 (25.5) 782,605 58.2 494,845 6.6 464,075 (3.3) 479,986
Profit & Loss2013 2012
Restated2011 2010 2009 2008
Rs ‘000 % Rs ‘000 % Rs ‘000 % Rs ‘000 % Rs ‘000 % Rs ‘000 %
Net Sales 11,950,081 100.0 10,240,532 100.0 10,009,875 100.0 7,620,571 100.0 5,685,687 100.0 5,865,487 100.0
Cost of sales 10,516,592 88.0 8,725,781 85.2 8,252,920 82.4 6,400,820 84.0 4,695,035 82.6 4,855,356 82.8
Gross profit 1,433,489 12.0 1,514,751 14.8 1,756,955 17.6 1,219,751 16.0 990,652 17.4 1,010,131 17.2
Administration and selling expenses 525,665 4.4 455,332 4.4 397,505 4.0 263,681 3.5 211,723 3.7 163,890 2.8
Operating profit 907,824 7.6 1,059,419 10.3 1,359,450 13.6 956,070 12.5 778,929 13.7 846,241 14.4
Other income 47,956 0.4 32,816 0.3 52,298 0.5 27,282 0.4 43,046 0.8 29,570 0.5
Financial charges 614,150 5.1 171,374 1.7 122,429 1.2 205,346 2.7 221,723 3.9 108,844 1.9
Other charges 23,573 0.2 57,341 0.6 90,289 0.9 55,012 0.7 41,418 0.7 43,310 0.7
Profit before taxation 318,057 2.7 863,520 8.4 1,199,030 12.0 722,994 9.5 558,834 9.8 723,657 12.3
Provision for taxation 108,901 0.9 280,788 2.7 416,425 4.2 228,149 3.0 94,759 1.7 243,671 4.2
Profit after taxation 209,156 1.8 582,732 5.7 782,605 7.8 494,845 6.5 464,075 8.2 479,986 8.2
Horizontal Analysis
Vertical Analysis
34 ANNUAL REPORT 2013

Profit & Loss2013 13 vs 12 2012
Restated12 vs 11 2011 11 vs 10 2010 10 vs 09 2009 09 vs 08 2008
Rs ‘000 % Rs ‘000 % Rs ‘000 % Rs ‘000 % Rs ‘000 % Rs ‘000
Net Sales 11,950,081 16.7 10,240,532 2.3 10,009,875 31.4 7,620,571 34.0 5,685,687 (3.1) 5,865,487
Cost of sales 10,516,592 20.5 8,725,781 5.7 8,252,920 28.9 6,400,820 36.3 4,695,035 (3.3) 4,855,356
Gross profit 1,433,489 (5.4) 1,514,751 (13.8) 1,756,955 44.0 1,219,751 23.1 990,652 (1.9) 1,010,131
Administration and selling expenses 525,665 15.4 455,332 14.5 397,505 50.8 263,681 24.5 211,723 29.2 163,890
Operating profit 907,824 (14.3) 1,059,419 (22.1) 1,359,450 42.2 956,070 22.7 778,929 (8.0) 846,241
Other income 47,956 46.1 32,816 (37.3) 52,298 91.7 27,282 (36.6) 43,046 45.6 29,570
Financial charges 614,150 258.4 171,374 40.0 122,429 (40.4) 205,346 (7.4) 221,723 103.7 108,844
Other charges 23,573 (58.9) 57,341 (36.5) 90,289 64.1 55,012 32.8 41,418 (4.4) 43,310
Profit before taxation 318,057 (63.2) 863,520 (28.0) 1,199,030 65.8 722,994 29.4 558,834 (22.8) 723,657
Provision for taxation 108,901 (61.2) 280,788 (32.6) 416,425 82.5 228,149 140.8 94,759 (61.1) 243,671
Profit after taxation 209,156 (64.1) 582,732 (25.5) 782,605 58.2 494,845 6.6 464,075 (3.3) 479,986
Profit & Loss2013 2012
Restated2011 2010 2009 2008
Rs ‘000 % Rs ‘000 % Rs ‘000 % Rs ‘000 % Rs ‘000 % Rs ‘000 %
Net Sales 11,950,081 100.0 10,240,532 100.0 10,009,875 100.0 7,620,571 100.0 5,685,687 100.0 5,865,487 100.0
Cost of sales 10,516,592 88.0 8,725,781 85.2 8,252,920 82.4 6,400,820 84.0 4,695,035 82.6 4,855,356 82.8
Gross profit 1,433,489 12.0 1,514,751 14.8 1,756,955 17.6 1,219,751 16.0 990,652 17.4 1,010,131 17.2
Administration and selling expenses 525,665 4.4 455,332 4.4 397,505 4.0 263,681 3.5 211,723 3.7 163,890 2.8
Operating profit 907,824 7.6 1,059,419 10.3 1,359,450 13.6 956,070 12.5 778,929 13.7 846,241 14.4
Other income 47,956 0.4 32,816 0.3 52,298 0.5 27,282 0.4 43,046 0.8 29,570 0.5
Financial charges 614,150 5.1 171,374 1.7 122,429 1.2 205,346 2.7 221,723 3.9 108,844 1.9
Other charges 23,573 0.2 57,341 0.6 90,289 0.9 55,012 0.7 41,418 0.7 43,310 0.7
Profit before taxation 318,057 2.7 863,520 8.4 1,199,030 12.0 722,994 9.5 558,834 9.8 723,657 12.3
Provision for taxation 108,901 0.9 280,788 2.7 416,425 4.2 228,149 3.0 94,759 1.7 243,671 4.2
Profit after taxation 209,156 1.8 582,732 5.7 782,605 7.8 494,845 6.5 464,075 8.2 479,986 8.2
35

Sources and Application of Funds2013 2012
(Restated)2011 2010 2009 2008
(Rupees in thousand)
CASH FLOWS FROM OPERATINGACTIVITIESCash generated from operations 1,627,523 208,715 1,495,885 1,627,161 1,119,745 481,868Payment on account of accumulated
compensated absences (9,192) (9,244) (8,801) (3,307) (3,999) (4,734)Long-term deposits (696) (108) (432) (585) 40 (114)Staff retirement benefits paid (42,684) (41,519) (32,113) (21,762) (15,343) (12,426)Income taxes paid (480,548) (315,361) (425,847) (291,760) (209,128) (220,994)Net cash flow from operating activities 1,094,403 (157,517) 1,028,692 1,309,747 891,315 243,600
CASH FLOWS FROM INVESTING ACTIVITIESFixed capital expenditure (1,570,759) (4,083,926) (903,945) (141,155) (307,267) (771,784)Acquisition of intangible (10,182) - (9,237) (2,433) (6,443) -Profit on bank balances received 345 222 407 708 565 807Payment made for settlement of derivative - (158,925) - - - -Purchase of held-for-trading financial assets - - (450,000) - - (120,000)Redemption of held-for-trading financial assets - 268,783 200,000 - 18,650 171,991Sale proceeds on disposal of fixed assets 4,830 7,383 7,069 5,739 2,693 4,554Net cash flow from investing activities (1,575,766) (3,966,463) (1,155,706) (137,141) (291,802) (714,432)
CASH FLOWS FROM FINANCINGACTIVITIESLong-term finances paid (125,000) (125,000) (233,000) (216,000) (216,000) (216,000)Long-term finances acquired 1,000,000 3,976,924 - - - 500,000Short term financing - net 475,000 700,000 - - - - Finance cost paid (744,506) (323,914) (148,676) (226,519) (227,765) (73,416)Dividends paid (299,682) (597,651) (298,971) (299,204) (179,533) (417,808)Net cash flow from financing activities 305,812 3,630,359 (680,647) (741,723) (623,298) (207,224)Net cash inflow / (outflow) (175,551) (493,621) (807,661) 430,883 (23,785) (678,056)
36 ANNUAL REPORT 2013

Value Added and its DistributionThe statement below shows value added by the operations of the company and its distribution to the stakeholders.
2013 2012 (Restated)Wealth Generated (Rs ‘000) % (Rs ‘000) %
Sales 13,851,686 12,092,584 Other Income 47,956 32,816 Bought-in-material & services (8,903,824) (7,819,751)
4,995,818 100.0 4,305,649 100.0
Wealth Distributed
To EmployeesRemuneration, benefits and facilities 585,453 11.7 454,578 10.5
To Government Income Tax, Sales Tax, Custom & ExciseDuties, WPPF, WWF, EOBI, Social Security,Professional & Local Taxes 2,870,109 57.5 2,787,579 64.7
To Providers of CapitalCash dividend - - 300,000 7.0
To LendersMark up & finance cost 614,150 12.3 171,374 4.0
To SocietyDonations 11,232 0.2 20,550 0.5
Retained for Reinvestment & Future GrowthUnappropriated profit, Depreciation and Amortization 914,874 18.3 571,568 13.3
4,995,818 100.0 4,305,649 100.0
Wealth Generated& Distributed
20122013
Bought-in-material & services 64%To Employees 4%To Government 21%To Shareholder 0%To Lenders 4%To Society 0%Retained for Reinvestment & Future Growth 7%
Bought-in-material & services 65%To Employees 4%To Government 23%To Shareholder 2%To Lenders 1%To Society 0%Retained for Reinvestment & Future Growth 5%
37

EN ROUTETO HIGHER STANDARDS

Corporate Governance
Governance FrameworkSTATEMENT OF ETHICS & BUSINESS PRACTICES
A. Tri-Pack Films Limited shall endeavour to promote fair business practices and conduct the business with the principles of integrity, objectivity and financial prudence.
B. It is the policy of the Company to comply with all applicable laws, rules and regulations. Violations may result in disciplinary actions.
C. All employees are expected to adhere to all internal corporate rules and policies in the performance of their jobs.
D. Employees must avoid conflicts of interest between their private financial activities and conduct of Company business.
E. All managers and supervisors shall be responsible to see that there is no violation of law within their area of responsibility and take proper measures within corporate policy framework and financial ethics standards.
CORPORATE GOVERNANCE FRAMEWORK
Tri-Pack has been guided by a value system that emphasizes on high standards of integrity and trust at all levels of the organization. Our policies and practices are to ensure that the Company is managed with integrity in the best interest of shareholders. In addition, we are committed to upholding sound principles of corporate governance and to meeting the requirements of all statutory laws and regulations and the rules of all Stock Exchanges of the Country. The Board of Directors has adopted Code of Corporate Governance, which along with the charters of the Board Committees, the Company’s Code of Conduct for employees and operational policies and procedures, provide the framework for the governance of the Company.
INTERNAL CONTROL FRAMEWORK
The purpose of internal control framework, whilst ensuring conduct of business in smooth, orderly and efficient manner is to:
Protect and safeguard the Company’s assets; Prevent and detect fraud and error; Ensure the completeness and accuracy of the financial records; and, Comply with management policies and procedures.
The Board of Directors through the Senior Management is responsible to ensure the adequacy of the system of internal control covering both business and financial aspects.
The internal control system and compliance with the requirements are monitored through well documented Standard Operating Procedures (SOPs) and combination of audit reviews and periodic performance monitoring. The results of these processes are communicated to the Board of Directors through its Audit Committee which has the ultimate responsibility for the effectiveness of internal control.
While developing controls, the extent and cost of control procedures are assessed with a view to reduce risk to an acceptable and cost effective level.
40 ANNUAL REPORT 2013
DIRECTORS
The Board is comprised of one executive director, one non-executive independent director and fivenon-executive directors. The Board has the collective responsibility for ensuring that the affairs of the company are managed competently and with integrity.
All Board members are given appropriate documentation in advance of each Board meeting. This normally includes a detailed analysis on businesses and full papers on matters where the Board requires to make a decision or give its approval.
THE BOARD AUDIT COMMITTEE
The Committee meets at least once every quarter and assists the Board in fulfilling its oversight responsibilities, primarily in reviewing and reporting financial and non-financial information to shareholders, systems of internal control and risk management and the audit process. It has the power to call for information from management and to consult directly with the external auditors and other advisors as considered appropriate. The Chief Financial Officer regularly attends the Board Audit Committee meetings by invitation to present the accounts. After each meeting, the Chairman of the Committee reports to the Board.
AUDIT
The company has an effective Internal Audit function which has been outsourced to KPMG. The Board Audit Committee periodically reviews the appropriateness of this function. The Head of Internal Audit functionally reports to the Audit Committee. The Board Audit Committee approves the audit plan. The Internal Audit function carries out reviews on the financial, operational and compliance controls and reports on findings to the Board Audit Committee, Chief Executive and the management.
RISK MANAGEMENT
The purpose of this framework is to define and identify risks which may compromise the achievement of business objectives and to implement controls against such risks.
To assess and manage credit, investment, business, operational and risks arising from change, appropriate steps are defined in their respective policies and operational SOPs.
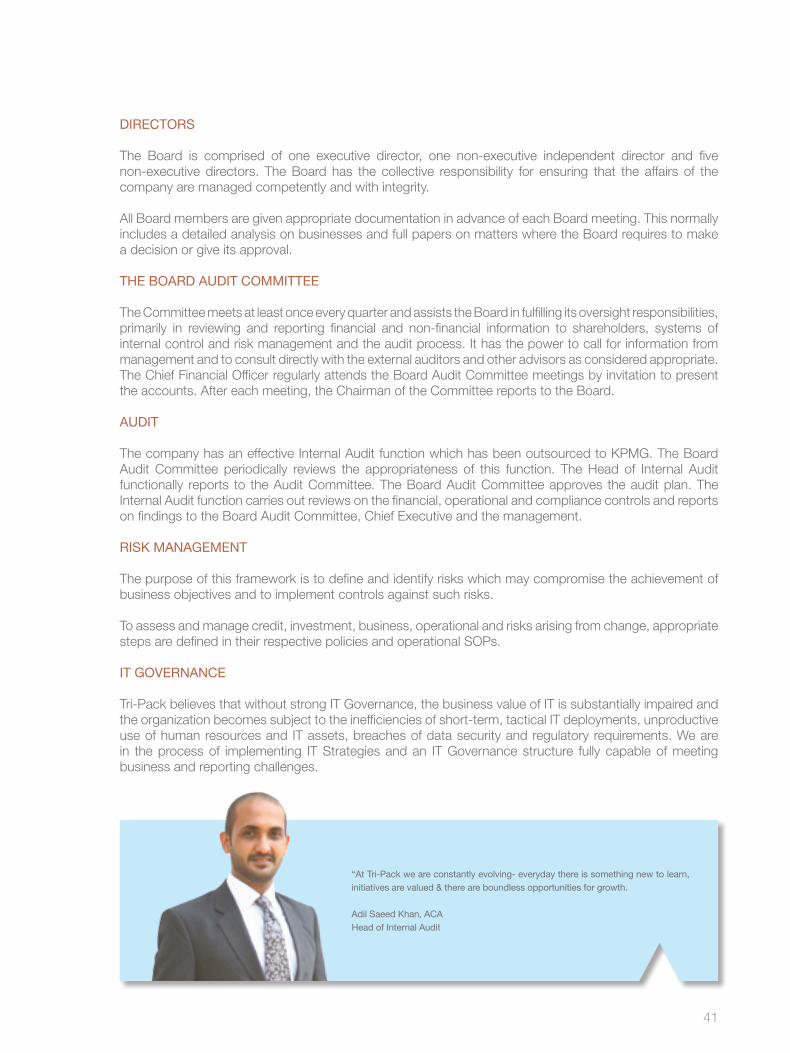
IT GOVERNANCE
Tri-Pack believes that without strong IT Governance, the business value of IT is substantially impaired and the organization becomes subject to the inefficiencies of short-term, tactical IT deployments, unproductive use of human resources and IT assets, breaches of data security and regulatory requirements. We are in the process of implementing IT Strategies and an IT Governance structure fully capable of meeting business and reporting challenges.
“At Tri-Pack we are constantly evolving- everyday there is something new to learn, initiatives are valued & there are boundless opportunities for growth.
Adil Saeed Khan, ACAHead of Internal Audit
41

Profile of Board of Directors
Syed Babar Ali - Chairman
Mr. Ali is the founder of various industries and social welfare institutions. He is the Chairman of Board of Directors since inception of the Company. Besides Tri-Pack, he is the chairman of Acumen Fund, Ali Institute of Education, Babar Ali Foundation, Coca Cola Beverages Pakistan Limited, Gurmani Foundation, IGI Insurance Limited, IGI Investment Bank Limited, Industrial Technical & Educational Institute, National Management Foundation, Syed Maratib Ali Religious and Charitable Trust Society and Tetra Pack Pakistan Limited.
Syed Hyder Ali *
Mr. Ali is the non-executive member of the board since inception. He has done his Masters in Sciences from Institute of Paper Chemistry. He holds directorship in several other companies including IGI Insurance Limited, Nestle Pakistan Limited, International Steels Limited, Packages Lanka (Private) Limited and Sanofi-Aventis Pakistan Limited. He is also serving on the Board of certain philanthropic, educational, charitable and business support organizations including Pakistan Centre for Philanthropy, World Wide Fund for Nature, National Management Foundation, Syed Maratib Ali Religious and Charitable Trust and Pakistan Business Council.
Mr. Kimihide Ando
Mr. Ando is associated with the Company as non-executive director, he is the General Manager for Mitsubishi Corporation’s operations in Pakistan. He has a degree in liberal arts from the international Christian University, Tokyo, Japan and has been with Mitsubishi Corporation for 28 years. He has a diverse Experience in chemicals. He joined the Board in 2010.
* In alphabetical order
42 ANNUAL REPORT 2013

Mr. Shahid Hussain
Mr. Hussain is currently serving as Managing Director at Tri-Pack Films Limited. He is associated with the Company since inception. He has a Degree in Mechanical Engineering. In addition, he is the member of the board of Pakistan Japan Business Forum and Pakistan Institute of Corporate Governance.
Mr. Yasumasa Kondo
Mr. Kondo is non-executive member of the board. He joined the Mitsubishi Corporation in 1986 and has worked with the group in different companies associated with the group. He has served as a General Manager at PVC and Plastic Units. He Graduated in 1986 from The University of Tokyo.
Mr. Asif Qadir
Mr. Qadir holds a Degree in Chemical Engineering from Columbia University, New York, USA. He was appointed as non-executive independent Director of the Company on October 03, 2012. He serves on the Board of Engro Corporation Limited, Engro Fertilizers Limited, Engro Polymer & Chemicals Limited, Engro PowerGen Limited, Engro PowerGen Qadirpur Limited, Sindh Engro Coal Mining Company Limited, Pakistan Poverty Alleviation Fund, Karachi Stock Exchange (Guarantee) Limited, and Jin Kwang JAZ (Pvt) Limited. He is Chairman of the Board for Inbox Business Technologies (Pvt) Ltd and Unicol Limited.
Mr. Khalid Yacob
Mr. Yacob is the director of the Company since inception. He is a fellow member of Institute of Chartered Accountants, England & Wales and Institute of Chartered Accountants, Pakistan and has been associated at senior management positions in A.F. Ferguson & Co, Chartered Accountants, Pakistan and Whinney Murray & Co, Chartered Accountants, Riyadh, Saudi Arabia. Mr. Yacob has vast experience in financial planning & budgeting, financial forecasting and analysis, asset investment, taxation, computer services, client development and staff management. He also holds directorship of Packages Limited, IGI Investment Bank Limited, IGI Funds Limited and Packages Lanka (Private) Limited.
43

Principal Board CommitteesEXECUTIVE COMMITTEE
Kimihide Ando (Chairman)Syed Hyder AliShahid HussainKhalid Yacob
The Executive Committee ensures effective and efficient operations of the Company. They meet periodically to assess the progress of the Company against the set targets. The committee is authorized to conduct every business except the business carried out by the board of directors as required by the section 196 of the Companies Ordinance 1984.
AUDIT COMMITTEE
Asif Qadir (Chairman)Kimihide AndoYasumasa KondoKhalid Yacob TERMS OF REFERENCE OF THE AUDIT COMMITTEE
The terms of reference of the Audit Committee have been derived from the Code of Corporate Governance applicable to listed companies. Thereby Audit Committee shall, among other things, be responsible for recommending to the Board of Directors the appointment of external auditors by the Company’s shareholders and shall consider any questions of resignation or removal of external auditors, audit fees and provision
44 ANNUAL REPORT 2013

by external auditors of any service to the Company in addition to audit of its financial statements. In the absence of strong grounds to proceed otherwise, the Board of Directors shall act in accordance with the recommendations of the Audit Committee in all these matters.
The terms of reference of the Audit Committee also include the following:
a. Determination of appropriate measures to safeguard the Company’s assets;
b. Review of preliminary announcements of results prior to publication;
c. Review of quarterly, half-yearly and annual financial statements of the Company, prior to their approval by the Board of Directors, focusing on:
Major judgmental areas; Significant adjustments resulting from the audit; The going-concern assumption; Any changes in accounting policies and practices; Compliance with applicable accounting standards; and Compliance with listing regulations and other statutory and regulatory requirements.
d. Facilitating the external audit and discussion with external auditors of major observations arising from interim and final audits and any matter that the auditors may wish to highlight (in the absence of management, where necessary);
e. Review of management letter issued by external auditors and management’s response thereto;
f. Ensuring coordination between the internal and external auditors of the Company;
g. Review of the scope and extent of internal audit and ensuring that the internal audit function has adequate resources and is appropriately placed within the Company;
45

h. Consideration of major findings of internal investigations and management’s response thereto;
i. Ascertaining that the internal control system including financial and operational controls, accounting system and reporting structure are adequate and effective;
j. Review of the Company’s statement on internal control systems prior to endorsement by the Board of Directors;
k. Instituting special projects, value for money studies or other investigations on any matter specified by the Board of Directors, in consultation with the Chief Executive and to consider remittance of any matter to the external auditors or to any other external body;
l. Determination of compliance with relevant statutory requirements;
m. Monitoring compliance with the best practices of corporate governance and identification of significant violations thereof; and
n. Consideration of any other issue or matter as may be assigned by the Board of Directors.
The audit committee assists the board in fulfilling its oversight responsibilities as described in the Code of Corporate Governance.

HUMAN RESOURCE AND REMUNERATION (HR & R) COMMITTEE
Mr. Asif Qadir (Chairman)Mr. Shahid HussainMr. Khalid Yacob
Keeping in view the requirement of the Clause (xxv) of the Code of Corporate Governance 2012 a Human Resource and Remuneration (HR&R) Committee was comprised in 2012. This committee consists of the above three members.
TERMS OF REFERENCE OF THE HUMAN RESOURCE AND REMUNERATION (HR&R) COMMITTEE
i) Recommending human resource management policies to the board;
ii) Recommending to the board the selection, evaluation, compensation (including retirement benefits) and succession planning of the CEO;
iii) Recommending to the board the selection, evaluation, compensation (including retirement benefits) of the CEO, CFO, Company Secretary and Head of Internal Audit; and
iv) Consideration and approval on recommendations of the CEO on such matters for key management positions who report directly to the CEO.
Chief Executive’s Review
Dear Stakeholders,
I am pleased to share my views on the performance of the Company, which completed two decades of its existence this year. During these two decades, the Company has firmly established its position and has grown at measured and sustainable pace.
We have kept expanding on the back of state of the art machinery and ever improving customer base. In the year 2013, BOPP Line-4 was commissioned whereas; CPP Line-2 has been commissioned in March 2014. The year 2013 remained a challenging year with continuation of energy crisis, deteriorating law and order situation, sharp decline in rupee value and general slow down in economic growth. De-spite strong headwinds, we were able to increase our revenue by 17% over the last year and were able to pass exactly the same level of growth in EBITDA over the last year.
Cash generated by the Company from operations showed an impressive improvement and it touched
Rs 1,628 million compared to Rs 209 million in 2012.
Our people are our asset and we are focused on creating an engaged work force with continuous capability enhancement through learning and development at both local and international levels and employee engagement programs. I take pride in leading this team, which is a combination of fresh talent and diversified experience of our existing staff.
With our strong heritage, passion and commitment for growth and the core competencies of our people, I am confident of steering out of these difficult times and reach new heights of success. I thank Almighty Allah for His grace, our investors and customers for their trust and loyalty and all the other stakeholders for their partnership.
I wish you the very best.
Shahid Hussain Chief Executive
48

“We have achieved another milestone by
commissioning of Biaxially Oriented Polypropylene
(BOPP) Line-4 in March.”
49

Statement of Compliancewith the Code of Corporate Governance
This statement is being presented to comply with the Code of Corporate Governance (the “Code”) contained in the Listing Regulations of Karachi, Lahore and Islamabad Stock Exchanges for the purpose of establishing a framework of good governance, whereby a listed company is managed in compliance with the best practices of corporate governance.
The Company has applied the principles contained in the Code in the following manner:
1. The Company encourages representation of independent non-executive directors and directors representing minority interests on its Board of Directors. At present the Board
Category Names
Independent Director Mr. Asif Qadir
Executive Director Mr. Shahid Hussain
Non-Executive Directors Syed Babar AliSyed Hyder AliMr. Khalid YacobMr. Kimihide AndoMr. Yasumasa Kondo
The independent director meets the criteria of independence under clause i(b) of the Code.
2. The Directors have confirmed that none of them is serving as a director on more than seven listed companies, including this Company.
3. All the resident directors of the Company are registered as taxpayers and none of them has defaulted in payment of any loan to a banking company, a DFI or an NBFI or, being a member of stock exchange, has been declared as a defaulter by that stock exchange.
4. A casual vacancy that occurred on the Board on February 28, 2013 was filled up by the Directors on the same day.
5. The Company has prepared a “Code of Conduct” and has ensured that appropriate steps have been taken to disseminate it throughout the Company along with its supporting policies and procedures.
6. The Board has developed a Vision/Mission Statement, overall corporate strategy and significant policies of the Company. A complete record of particulars of significant policies along with the dates on which they were approved or amended has been maintained.
7. All the powers of the Board have been duly exercised and decisions on material transactions, including appointment and determination of remuneration and terms and conditions of employment of the CEO, other executive and non-executive directors, have been taken by the Board.
8. The meetings of the Board were presided over by the Chairman and, in his absence, by a Director elected by the Board for this purpose and the Board met at least once in every quarter. Written notices of the Board meetings, along with agenda and working papers, were circulated at least seven days before the meetings. The minutes of the meetings were appropriately recorded and circulated.
9. The Company arranged one orientation course for its Directors during the year. Four directors of the Company viz., Syed Babar Ali, Syed Hyder Ali, Mr. Khalid Yacob and Mr. Asif Qadir are exempted from the
50 ANNUAL REPORT 2013

directors’ training program as per clause (xi) of the Code of Corporate Governance, since apart from having a minimum of 14 years of education, their experience on the board of listed companies is 15 years or more.
10. There were no new appointments of the Head of Internal Audit or Company Secretary during the year. However, all such appointments including their remuneration and terms and conditions of employment are approved by the Board. There was a change of the CFO during the year. The remuneration and terms and conditions of employment of the CFO have been approved by the Board.
11. The Directors’ Report for this year has been prepared in compliance with the requirements of the Code and fully describes the salient matters required to be disclosed.
12. The financial statements of the Company were duly endorsed by the CEO and CFO before approval of the Board.
13. The Directors, CEO and executives do not hold any interest in the shares of the Company other than that disclosed in the pattern of shareholding.
14. The Company has complied with all the corporate and financial reporting requirements of the Code.
15. The Board has formed an Audit Committee. It comprises of four members, all of whom are non-executive directors and the Chairman of the Committee is an independent director.
16. The meetings of the Audit Committee were held at least once every quarter prior to approval of interim and final results of the Company. The terms of reference of the Committee have been formed and advised to the Committee for compliance.
17. The Board has formed a Human Resource and Remuneration Committee. It comprises of three members, of whom two are non-executive directors, including its Chairman.
18. The Board has outsourced the internal audit function to KPMG Taseer Hadi & Co., Chartered Accountants who are considered suitably qualified and experienced for the purpose and are conversant with the policies and procedures of the Company.
19. The statutory auditors of the Company have confirmed that they have been given a satisfactory rating under the quality control review program of the ICAP, that they or any of the partners of the firm, their spouses and minor children do not hold shares of the Company and that the firm and all its partners are in compliance with International Federation of Accountants (IFAC) guidelines on code of ethics as adopted by the ICAP.
20. The statutory auditors or the persons associated with them have not been appointed to provide other services except in accordance with the listing regulations and the auditors have confirmed that they have observed IFAC guidelines in this regard.
21. The ‘closed period’, prior to the announcement of interim/final results, and business decisions, which may materially affect the market price of the Company’s securities, was determined and intimated to directors, employees and stock exchanges.
22. Material/price sensitive information has been disseminated among all market participants at once through stock exchanges.
23. We confirm that all other material principles enshrined in the Code have been complied with.
(Shahid Hussain)Managing Director Karachi: February 25, 2014
51

EN ROUTETO BRIGHTER TOMORROW

Directors’ Report


The Directors of the Company are pleased to submit the report and the audited financial statements for the year ended December 31, 2013.
Compliance with Health, Safety and Environment HSE standards remained a priority and the Company closed the year without any reportable or serious incident in this respect.
The year 2013 proved to be a challenging and difficult year for the overall economy and in particular the manufacturing sector. Fragile law and order situation, worsening energy supplies, inflationary pressure restricting buying power, and volatility in foreign exchange rates, all contributed towards the slowdown in the downstream consumer demand and the unit margins.
MARKET OVERVIEW
Slower growth in downstream demand and concur-rent expansion in capacities by various manufactur-ers in the (Biaxially Oriented Poly Propylene) BOPP films segment has resulted in a supply overhang in the domestic BOPP films segment.
Similarly in the (Cast Poly Propylene) CPP films segment various expansions in excess of 15ktpa are underway. These expansions are expected to double the local CPP capacities and create a supply overhang in this segment also. It is expected that the current oversupply situation of these two segments will start fading out from 2015 with the
ramp-up of downstream demand and the Company is expected to start reaping the benefit of expansion from this upturn in demand.
BOPET films segment which competes with few of your Company’s products is also facing an over capacity situation. Your Company is representing before the relevant Government Forum to remove the uneven benefit passed on to BOPET manufacturers, by declaring them a pioneering industry, explaining that the stretching film technology is not a new technology in Pakistan.
FINANCIAL HIGHLIGHTS
The Company was successful in increasing its sales volumes by 8% to 43,468 tons compared to corresponding period last year despite a slowdown in overall demand. Net Sales Income for the year was higher by 17% on the back of higher volumes and price increases to partially mitigate the negative impact of escalating raw material cost andun-favourable volatility in Pak Rupee value.
With higher input cost, as mentioned above, negatively affecting the unit margins and additional depreciation charge of approximately Rs 376m on account of BOPP Line 4, capitalized in Q1 2013, the gross profit for the year at Rs 1,433m was lower by 5%. Increase in Administrative and Selling expenses were primarily driven by higher transportation cost on account of increasing fuel prices and higher sales volumes. Consequently operating profit was 14% lower at Rs 908m.
In the year 2011-12 your Company started its journey of expansion. BOPP Line 4 was commissioned in 2013 with a cost of Rs 5.4b. CPP Line 2 expansion with a cost of Rs 1.3b is expected to commission in Q1 2014. These expansions were predominantly funded by borrowings from financial institution and partly by internal cash generation as a result financial cost was higher by approximately Rs 443m for the year 2013. Consequently Pre-Tax Profit was lower at Rs 318m. With the recognition of tax benefit on BMR under section 65(b) of the Income Tax Ordinance for expansions, the Profit After Tax was Rs 209m, lower by 64% compared to last year.
Directors’ Report
55

Company generated an Operating Cash ofRs 1,628m compared to Rs 209m in 2012. In addition the EBITDA reflecting the operational performance also remained strong and was 17% higher compared to 2012.
Increase in overall debt compared to 2012 was on account of Capital Expenditures towards the two above mentioned projects. Financial covenants have been largely renegotiated with the financial institutions incorporating the effect of subsequent borrowings relating to CPP Line-2 project in 2013 Key Financial Highlights are as follows:
2013 2012Restated
Sales Volume - (M. Tons) 43,468 40,145
Net Sales Value - (Rs in Million) 11,950 10,241
Gross Profit - (Rs in Million) 1,433 1,515
Net Profit - (Rs in Million) 209 583
EPS - (Rs per share) 6.97 19.42
PROJECTS
Initial teething problems post commissioning of BOPP Line 4 resulting in 45 days of production loss
have been addressed and the line speed is being geared up as per the manufacturer specifications.
Trial production has started for CPP Line 2 project and commissioning is expected in Q1 2014 within the budgeted cost of Rs 1.3b.
DIVIDEND
Recent projects costing approximately Rs 6.7b are expected to contribute significantly towards long term value creation for the Shareholders. In-addition these projects are financed purely by internal cash generation and bank borrowings without requesting for any financial participation from the Shareholders.
Keeping in mind the need to enhance Shareholders’ participation and conserve cash the Board of Directors has decided not to pay any dividend for the year in the longer interest of the Stakeholders.
FUTURE OUTLOOK
Continuous hike in input cost, issues around energy supplies, market overcapacity and slower growth in downstream demand are expected to keep the volumes and margins under pressure going forward.
56 ANNUAL REPORT 2013

During 2014 focus to remain on effective margin and volume management, cash conservation and cost control whilst expanding foot print in the export market. Also with the launch of new and innovative products we expect 2014 to be a better year.
CHANGE OF DIRECTOR
Mr. Tetsuo Obana, Director of the Company resigned on February 28, 2013 and Mr. Yasumasa Kondo was appointed in his place on the same date.Mr. Yasumasa Kondo shall hold office for the remainder of the period of Mr. Tetsuo Obana in whose place he is so appointed.
The Board of Directors wish to record its appreciation for the valuable services rendered by Mr. Tetsuo Obana and extends its warm welcome to Mr. Yasumasa Kondo.
HUMAN RESOURCE
The effectiveness and success of an organization lies not only in the organization’s products or service, but in its resources. The people behind the scenes, operating and running the organization, are by far, the most valuable resource the company has. We at Tri-Pack have a firm belief that these people are the ones who are responsible for helping the organization progress forward and come up with newer more innovative ideas.
We believe that in order to drive commercial success a people oriented approach has to be our top priority. Our development programs not only facilitate personal development but also promote functional excellence. The launch of initiatives such as the Talent Management System and the Leadership Development Program are aimed at developing our future leaders.
HUMAN RESOURCE AND REMUNERATION (HR&R) COMMITTEE
Mr. Asif Qadir Chairman(Independent Director)
Mr. Khalid Yacob Member(Non Executive Director)
Mr. Shahid Hussain Member(Executive Director)
The HR&R Committee was formed on October 2, 2012 and its terms of reference have been approved by the Board and are in line with the guidelines provided in the Code of Corporate Governance.
CORPORATE SOCIAL RESPONSIBILITY (CSR)
CSR is the continuing commitment by businesses to behave in an ethical manner and positively contribute to the development of the community and society in which they operate. Tri-Pack as an organization is aware of this responsibility and has launched various initiatives in the field of promoting education.
In the year 2013, we as an organization contributed generously towards promoting initiatives by various social sector organizations in the pursuit of improving the educational and skill development facilities in Pakistan.
HEALTH, SAFETY AND ENVIRONMENT
Your Company is totally focused on Health, Safety and Environment (HSE) and therefore, proper actions are consistently taken to improve our HSE standards in all business segments.
The management of your Company is committed towards making workers’ lives better not only at the workplace but also outside. We strictly adhere to the applicable HSE guidelines to ensure the well-being of our employees. To achieve these objectives, your Company is involved in various awareness programs and training drills:
Safe driving programs
Proper usage of fire-fighting equipment
First aid usage in cases of various emergencies/events
Awareness sessions to make staff and workers familiar with workplace hazards and ways to minimize the risks to health, lives and environment.
Further, the system to note and address the weaknesses raised by risk analysis assessments of the work environment is effectively in place.
57

QUALITY MANAGEMENT
During the year your Company complied with the requirement of all applicable quality standards. To further improve productivity through machine efficiency your Company has also started the implementation of Total Productive Maintenance (TPM) across both the plants which is expected to complete by the mid of 2014 with the help of foreign consultants.
CONTRIBUTION TO THE NATIONAL EXCHEQUER
Your Company’s contribution to the exchequer in the form of Sales Tax, Customs Duties and Income Taxes etc is approximately Rs 2,870m in 2013.
RELATED PARTIES
We maintain a complete and updated list of related parties. All transactions with related parties are carried out on an unbiased, arm’s length basis. A complete list of all related party transactions is compiled and submitted to the Audit Committee every quarter. After review by the Audit Committee the transactions are placed before the Board for their consideration and approval.
CODE OF CORPORATE GOVERNANCE
The Board of Directors have taken all the necessary steps to comply with the requirements of the Code of Corporate Governance included in the listing regulations of Stock Exchanges in Pakistan and are pleased to declare the following as required by the Code:
i) The financial statements, prepared by the management of the Company, present fairly its state of affairs, the result of its operations, cash flows and changes in equity.
ii) Proper books of account of the Company have been maintained.
iii) Appropriate accounting policies have been consistently applied in preparation of financial statements and accounting estimates except for the changes as stated in Notes to the Financial Statements. The accounting policies are based on reasonable and prudent judgment.
iv) International Financial Reporting Standards, as applicable in Pakistan, have been followed in preparation of the financial statements.
v) The system of internal control is sound in design and has been effectively implemented and monitored. The system is continuously monitored by Internal Audit and through other such monitoring procedures. The process of monitoring internal controls will continue as an ongoing process with an objective to further strengthen the controls.
vi) Details of significant changes in the Company’s operations during the current year as compared to last year and significant plans and decisions for the future prospectus of profits are stated in the Chief Executive‘s Review as endorsed by the Board of Directors.
vii) Key operating and financial data of last ten years is annexed.
viii) Information about the taxes and levies is given in the notes to the financial statements.
ix) There are no doubts upon the Company’s ability to continue as a going concern.
x) There has been no material departure from the best practices of corporate governance, as detailed in listing regulations.
xi) The value of investments of provident and gratuity funds, as at June 30, 2013 based on their un-audited accounts is as follows:
Rs ‘000
Provident 98,457
Gratuity 52,390
The value of investment includes accrued interest.
xii) A separate statement of compliance signed by the Chief Executive Officer is included in this Annual Report.
58 ANNUAL REPORT 2013

BOARD OF DIRECTORS
During the year 2013, six meetings of the Board of Directors were held. The attendance of each Director is as follows:
Name of directors No. of meetings attended
Syed Babar Ali (Chairman)(Non-Executive Director)
3
Mr. Shahid Hussain (Managing Director)(Executive Director)
6
Mr. Asif Qadir (Independent Director)
5
Syed Hyder Ali(Non-Executive Director)
5
Mr. Khalid Yacob(Non-Executive Director)
6
Mr. Kimihide Ando(Non-Executive Director)
6
Mr. Yasumasa Kondo(Non-Executive Director)(appointed w.e.f. February 28, 2013)
2
Mr. Tetsuo Obana(Non-Executive Director)(resigned w.e.f. February 28, 2013)
1
Mr. Masahiko Takahashi (Alternate to Mr. Yasumasa Kondo)
3
Leave of absence was granted to the Directors who could not attend the Board Meetings.
EXTERNAL AUDITORS
The present auditors M/s A. F. Ferguson & Co., Chartered Accountants are retiring and being eligible, offer themselves for reappointment. The Board of Directors on recommendation of the Audit Committee proposes the appointment of M/s A. F. Ferguson & Co., Chartered Accountants as the auditors until the next annual general meeting at a fee to be mutually agreed.
AUDIT COMMITTEE
An Audit Committee of the Board has been in existence since the enforcement of the Code of Corporate Governance. At present, the Audit Committee comprises of one Independent and three Non-Executive Directors as follows:
59

Six meetings of the Audit Committee were held during the year 2013. The attendance of each Member is given hereunder:
Name of memberNo. of
meetingsattended
Mr. Asif Qadir (Independent Director)
6
Mr. Khalid Yacob(Non-Executive Director)
6
Mr. Kimihide Ando(Non-Executive Director)
6
Mr. Yasumasa Kondo (Non-Executive Director)(appointed w.e.f. February 28, 2013)
1
Mr. Masahiko Takahashi (Alternate to Mr. Yasumasa Kondo)
4
Leave of absence was granted to the Members who could not attend the Meetings of the Audit Committee.
The Audit Committee has its terms of reference which have been approved by the Board of Directors and are in line with the guidelines provided in the Code of Corporate Governance.
The Chief Executive Officer, Chief Financial Officer, Head of Internal Audit and external auditors attend Audit Committee meetings by way of invitation. However, they are not the formal members of the Audit Committee. The Company Secretary is the Secretary of the Audit Committee.
CORPORATE AND FINANCIAL REPORTING FRAMEWORK
Trading of Shares by the Chief Executive Officer, Directors, Chief Financial Officer, Company Secretary, their spouses and minor children:
Purchase of SharesNo. of shares
Chief Executive Officer Nil
Directors Nil
Chief Financial Officer Nil
Company Secretary Nil
Spouses Nil
Sale of Shares Nil
PATTERN OF SHAREHOLDING
A statement of the pattern of shareholding of certain class of shareholders as at December 31, 2013 as required under the reporting framework, is included in the annexed shareholders’ information.
The CEO, Directors, CFO, Company Secretary and their spouses or minor children did not carry out any trade in the shares of the Company.
MATERIAL CHANGES
There have been no material changes since December 31, 2013 and the Company has not entered into any commitment, which would affect its position at that date.
ACKNOWLEDGEMENT
We are thankful to our all valued stakeholder including customers, banks, suppliers, contractors, and shareholders, for their excellent support and confidence to achieve the result. We also thank our employees for their focused dedication and hard work throughout this period.
For and on behalf of the Board.
Shahid HussainChief Executive
Karachi, February 25, 2014
60 ANNUAL REPORT 2013

2013
Property, plant and equipment Intangible assets Long term deposits Stores and spares Stock in trade Trade debts Advances and prepayments Other receivables Taxation Cash and bank balances
Property, plant and equipment Intangible assets Long term deposits Stores and spares Stock in trade Trade debts Advances and prepayments Other receivables Taxation Cash and bank balances
2012
57.64%0.07%0.02%2.66%
20.60%10.58%0.50%1.23%1.26%5.44%
19.34%36.03%2.11%
42.52%
54.86%0.08%0.02%2.50%
18.09%12.95%1.09%1.02%4.54%4.85%
2013
Equity & ReservesLong term Financing facilitiesDeferred LiabilitiesCurrent Liabilities
Equity & ReservesLong term Financing facilitiesDeferred LiabilitiesCurrent Liabilities
2012
15.11%33.32%2.48%
49.09%
Fixed Assets & Current Assets
Equity & Liabilities
Balance Sheet Composition
Note: FY 2012 has been restated.
61
Review Report to the Memberson Statement of Compliance with Best Practices ofCode of Corporate Governance
We have reviewed the enclosed Statement of Compliance with the best practices contained in the Code of Corporate Governance (the Code) prepared by the Board of Directors of Tri-Pack Films Limited (the Company) for the year ended December 31, 2013 to comply with the requirements of Listing Regulation No. 35 of the Karachi, Lahore and Islamabad Stock Exchanges where the Company is listed.
The responsibility for compliance with the Code is that of the Board of Directors of the Company. Our responsibility is to review, to the extent where such compliance can be objectively verified, whether the Statement of Compliance reflects the status of the Company’s compliance with the provisions of the Code and report if it does not and to highlight any non-compliance with the requirements of the Code. A review is limited primarily to inquiries of the Company’s personnel and review of various documents prepared by the Company to comply with the Code.
As a part of our audit of the financial statements we are required to obtain an understanding of the accounting and internal control systems sufficient to plan the audit and develop an effective audit approach. We are not required to consider whether the Board of Directors’ statement on internal control covers all risks and controls or to form an opinion on the effectiveness of such internal controls, the Company’s corporate governance procedures and risks.
The Code requires the Company to place before the Audit Committee, and upon recommendation of the Audit Committee, place before the Board of Directors for their review and approval its related party transactions distinguishing between transactions carried out on terms equivalent to those that prevail in arm’s length transactions and transactions which are not executed at arm’s length price and recording proper justification for using such alternate pricing mechanism. We are only required and have ensured compliance of this requirement to the extent of the approval of the related party transactions by the Board of Directors upon recommendation of the Audit Committee. We have not carried out any procedures to determine whether the related party transactions were undertaken at arm’s length price or not.
Based on our review, nothing has come to our attention which causes us to believe that the Statement of Compliance does not appropriately reflect the Company’s compliance, in all material respects, with the best practices contained in the Code as applicable to the Company for the year ended December 31, 2013.
A.F. Ferguson & Co.Chartered Accountants Karachi, March 20, 2014
Audit Engagement Partner: Khurshid Hassan
62 ANNUAL REPORT 2013

Shareholders’ InformationREGISTERED OFFICE
4th Floor, The Forum Suite # 416-422, G-20, Block 9Khayaban-e-Jami, Clifton Karachi-75600Tel. # 92 21 35831618 / 35831664 / 35833011 35874047 - 49Fax # 92 21 35860251
SHARES REGISTRAR
FAMCO Associates (Pvt.) Ltd8-F, Next to Hotel FaranNursery, Block 6, P.E.C.H.S.,Shahrah-e-FaisalKarachi-75400Tel. # 92 21 34380101-2Fax # 92 21 34380106
LISTING ON STOCK EXCHANGES
Tri-Pack’s equity shares are listed on Karachi, Lahore and Islamabad Stock Exchanges.
LISTING FEES
The annual listing fee for the financial year 2013-14 has been paid to all the three stock exchanges within the prescribed time limit.
STOCK CODE
The stock code for dealing in equity shares ofTri-Pack Films at KSE, LSE and ISE is TRIPF.
SHARES REGISTRAR
Tri-Pack’s shares department is operated by FAMCO Associates (Pvt.) Ltd and services about 1,667 shareholders. It is managed by a well-experienced team of professionals and is equipped with the necessary infrastructure in terms of computer facilities and comprehensive set of systems and procedures for conducting the Registration function.
The Shares Registrar has online connectivity with Central Depository Company of Pakistan Limited. It undertakes activities pertaining to dematerialization of shares, share transfers, transmissions, issue of duplicate/re-validated dividend warrants, issue of duplicate/ replaced share certificates, change of address and other related matters.
For assistance, shareholders may contact either the Registered Office or the Shares Registrar.
CONTACT PERSONS:
Mr. S.M. Munawar MoosviTel. # 92 21 35831618 / 35831664 / 35833011Fax # 92 21 35860251
Mr. Ovais KhanTel. # 92 21 34380101-2 Fax # 92 21 34380106
SERVICE STANDARDS
Tri-Pack has always endeavoured to provide investors with prompt services. Listed below are various investor services and the maximum time limits set for their execution:
Purchase of SharesFor request received
through postOver the counter
Transfer of shares 30 days after receipt 30 days after receiptTransmission of shares 30 days after receipt 30 days after receiptIssue of duplicate share certificates 30 days after receipt 30 days after receiptIssue of duplicate dividend warrants 5 days after receipt 5 days after receiptIssue of revalidated dividend warrants 5 days after receipt 5 days after receiptChange of address 2 days after receipt 15 minutes
Well qualified personnel of the Shares Registrar have been entrusted with the responsibility of ensuring that services are rendered within the set time limits.
63

STATUTORY COMPLIANCE
During the year, the company has complied with all applicable provisions, filed all returns/ forms and furnished all the relevant particulars as required under the Companies Ordinance, 1984 and allied rules, the Securities and Exchange Commission of Pakistan (SECP) Regulations and the listing requirements.
DEMATERIALIZATION OF SHARES
The equity shares of the company are under the compulsory dematerialization category. As of date 37.47% of the equity shares of the company have been dematerialized by the shareholders.
DIVIDEND
The Board of Directors of the company has proposed a nil dividend for the financial year ended December 31, 2013 (2012: 100% cash dividend (Rs.10 per share of Rs.10).
BOOK CLOSURE DATES
The Register of Members and Share Transfer Books of the company will remain closed from April 1, 2014 to April 15, 2014 both days inclusive.
DIVIDEND REMITTANCE
Dividend declared and approved at an Annual General Meeting is paid well before the statutory time limit of 30 days:
(i) For shares held in physical form: to shareholders whose names appear in the Register of Members of the company after entertaining all requests for transfer of shares lodged with the company on or before the book closure date.
(ii) For shares held in electronic form: to shareholders whose names appear in the statement of beneficial ownership furnished by CDC as at end of business on book closure date.
WITHHOLDING OF TAX & ZAKAT ON DIVIDEND
As per the provisions of the Income Tax Ordinance, 2001, Income Tax is deductible at source by the Company at the rate of 10% wherever applicable.
Zakat is also deductible at source from the dividend at the rate of 2.5% of the face value of the share, other than corporate holders or individuals who have provided an undertaking for non-deduction.
DIVIDEND WARRANTS
Cash dividends are paid through dividend warrants addressed to the shareholders whose names appear in the Register of Shareholders at the date of book closure. Shareholders are requested to deposit those warrants into their bank accounts, at their earliest, thus helping the company to clear the unclaimed dividend account.
INVESTORS’ GRIEVANCES
To date none of the investors or shareholders have filed any letter of complaints against any service provided by the company to its shareholders.
64 ANNUAL REPORT 2013

LEGAL PROCEEDINGS
No case has ever been filed by shareholders against the company for non-receipt of shares/refund.
GENERAL MEETINGS & VOTING RIGHTS
Pursuant to section 158 of the Companies Ordinance, 1984, Tri-Pack Films Limited holds a General Meeting of shareholders at least once a year. Every shareholder has a right to attend the General Meeting. The notice of such meeting is sent to all the shareholders at least 21 days before the meeting and also advertised in at least one English and one Urdu newspaper having circulation in Karachi, Lahore and Islamabad.
Shareholders having holding of at least 10% of voting rights may also apply to the Board of Directors to call for meeting of shareholders, and if the Board does not take action on such application within 21 days, the shareholders may themselves call the meeting.
All shares issued by the company carry equal voting rights. Generally, matters at the general meetings are decided by a show of hands in the first instance. Voting by show of hands operates on the principle of “One Member-One Vote”. If majority of shareholders raise their hands in favour of a particular resolution, it is taken as passed, unless a poll is demanded.
Since the fundamental voting principle in a company is “One Share-One Vote”, voting takes place by a poll, if demanded. On a poll being taken, the decision arrived by poll is final, overruling any decision taken on a show of hands.
PROXIES
Pursuant to Section 161 of the Companies Ordinance, 1984 and according to the Memorandum and Articles of Association of the Company, every shareholder of the company who is entitled to attend and vote at a general meeting of the company can appoint another person as his/her proxy to attend and vote instead of him/her. Every notice calling a general meeting of the company contains a statement that a shareholder entitled to attend and vote is entitled to appoint a proxy, who may not be a member of the company.
The instrument appointing a proxy (duly signed by the shareholder appointing that proxy) should be deposited at the office of the company not less than forty-eight hours before the meeting.
WEB PRESENCE
Updated information regarding the company can be accessed at Tri-Pack’s website, www.tripack.com.pk. The website contains the company’s profile, the corporate philosophy and major products.
65

Shareholding PatternThe shareholding pattern of the equity share capital of the company as at December 31, 2013 is as follows:
Shareholding Number ofshareholders
Total shares heldFrom To
1 100 488 11,282101 500 579 258,838501 1,000 162 154,949
1,001 5,000 236 680,6775,001 10,000 76 603,343
10,001 15,000 21 267,67515,001 20,000 24 428,50020,001 25,000 11 251,62425,001 30,000 9 254,72230,001 35,000 4 131,80035,001 40,000 7 263,42840,001 45,000 6 254,93245,001 50,000 3 143,10050,001 55,000 4 215,50055,001 60,000 3 170,90860,001 65,000 3 185,90065,001 70,000 2 135,91670,001 75,000 2 150,00085,001 90,000 2 174,45490,001 95,000 2 183,62395,001 100,000 1 100,000
105,001 110,000 1 106,436110,001 115,000 1 113,517115,001 120,000 1 117,800120,001 125,000 1 125,000135,001 140,000 1 137,000150,001 155,000 1 152,500165,001 170,000 1 168,689180,001 185,000 2 364,000205,001 210,000 1 208,410230,001 235,000 2 466,130245,001 250,000 1 250,000260,001 265,000 1 260,705470,001 475,000 1 474,500595,001 600,000 1 595,550680,001 685,000 1 682,260860,001 865,000 1 862,449
1,040,001 1,045,000 1 1,041,4671,350,001 1,355,000 1 1,353,4167,495,001 7,500,000 1 7,499,0009,995,001 10,000,000 1 10,000,000
1,667 30,000,000
66 ANNUAL REPORT 2013

Information as required under the Code of Corporate Governance
Shareholders’ categoryNumber of
shareholdersNumber of shares held
i. Associated Companies, Undertakings and Related Parties (name wise details) Babar Ali Foundation 1 137,000 IGI Insurance Limited 1 1,353,416 Mitsubishi Corporation - Japan 1 7,499,000 Packages Limited 1 10,000,000
Total: 4 18,989,416
ii. Mutual Funds (name wise details) CDC - Trustee AKD Index Tracker Fund 1 2,079 CDC - Trustee Al Meezan Mutual Fund 1 36,828 CDC - Trustee APF-Equity Sub Fund 1 10,000 CDC - Trustee Askari Asset Allocation Fund 1 39,900 CDC - Trustee Askari Equity Fund 1 3,900 CDC - Trustee Atlas Stock Market Fund 1 75,000 CDC - Trustee Meezan Balanced Fund 1 41,500 CDC - Trustee Meezan Islamic Fund 1 208,410 CDC-Trustee Meezan Capital Protected Fund-II 1 2,000 National Bank of Pakistan-Trustee Department NI(U)T Fund 1 862,449
Total: 10 1,282,066
iii. Directors and their spouse(s) and minor children (name wise details) Mr. Asif Qadir 1 100 Mr. Khalid Yacob 1 1,000 Mr. Kimihide Ando 1 500 Mr. Shahid Hussain 1 500 Mr.Yasumasa Kondo 1 500 Syed Babar Ali 1 474,500 Syed Hyder Ali 1 93,500
Total: 7 570,600
iv. Executives NIL NILTotal: NIL NIL
v. Public Sector Companies and Corporations 1 682,260Total: 1 682,260
vi. Banks, Development Finance Institutions, Non-Banking Finance Institutions,
Insurance Companies, Takaful, Modaraba and Pension Funds 13 704,745Total: 13 704,745
vii. Shareholders holding 5% or more voting rights in the Listed Company Mitsubishi Corporation - Japan 1 7,499,000 Packages Limited 1 10,000,000
Total: 2 17,499,000
67

Shareholding PatternS.No. Shareholders’ category No. of
shareholdersNo. ofshares
%
1 Directors, Chief Executive Officer, and their spouse and minor children
7 570,600 1.90
2 Associated Companies, undertakings and related parties
4 18,989,416 63.30
3 NIT and ICP 1 862,449 2.874 Banks Development Financial Institutions, Non
Banking Financial Institutions2 260,767 0.87
5 Insurance Companies 4 866,266 2.896 Modarabas and Mutual Funds 9 419,617 1.407 Shareholders holding 10% 2 17,499,000 58.338 General Public:
a. Local 1,571 5,812,174 19.37
b. Foreign9 Others 69 2,218,711 7.40
Total (excluding: shareholders holding 10%) 1,667 30,000,000 100.00
MonthShare price on the KSE (Rs.)
Highest LowestVolume of shares
traded
January 197.00 184.83 1,121,900February 185.19 181.70 66,200March 192.07 177.00 587,200April 192.47 168.05 189,300May 212.99 170.00 567,100June 219.99 197.15 156,300July 230.00 195.25 153,700August 222.00 191.00 72,900September 200.00 182.50 91,700October 192.00 159.00 72,000November 180.10 163.10 275,700December 205.00 176.00 383,400
SHARE PRICE/VOLUME
The monthly high and low prices and the volume of shares traded on the Karachi Stock Exchange during the financial year 2013 are as under:
68 ANNUAL REPORT 2013

Auditors’ Report to the MembersWe have audited the annexed balance sheet of Tri-Pack Films Limited (the Company) as at December 31, 2013 and the related profit and loss account, statement of changes in equity and cash flow statement together with the notes forming part thereof, for the year then ended and we state that we have obtained all the information and explanations which, to the best of our knowledge and belief, were necessary for the purposes of our audit.
It is the responsibility of the Company’s management to establish and maintain a system of internal control, and prepare and present the above said statements in conformity with the approved accounting standards and the requirements of the Companies Ordinance, 1984 (the Ordinance). Our responsibility is to express an opinion on these statements based on our audit.
We conducted our audit in accordance with the auditing standards as applicable in Pakistan. These standards require that we plan and perform the audit to obtain reasonable assurance about whether the above said statements are free of any material misstatement. An audit includes examining, on a test basis, evidence supporting the amounts and disclosures in the above said statements. An audit also includes assessing the accounting policies and significant estimates made by management, as well as, evaluating the overall presentation of the above said statements. We believe that our audit provides a reasonable basis for our opinion and, after due verification, we report that-
(a) in our opinion, proper books of account have been kept by the Company as required by the Ordinance;
(b) in our opinion-
(i) the balance sheet and profit and loss account together with the notes thereon have been drawn up in conformity with the Ordinance and are in agreement with the books of account and are further in accordance with accounting policies consistently applied except for the changes as stated in note 4 with which we concur;
(ii) the expenditure incurred during the year was for the purpose of the Company’s business; and
(iii) the business conducted, investments made and the expenditure incurred during the year were in accordance with the objects of the Company;
(c) in our opinion and to the best of our information and according to the explanations given to us, the balance sheet, profit and loss account, statement of changes in equity and cash flow statement together with the notes forming part thereof conform with approved accounting standards as applicable in Pakistan, and give the information required by the Ordinance, in the manner so required and respectively give a true and fair view of the state of the Company’s affairs as at December 31, 2013 and of the profit, its changes in equity and cash flows for the year then ended; and
(d) in our opinion zakat deductible at source under the Zakat and Ushr Ordinance, 1980 (XVIII of 1980) was deducted by the Company and deposited in the Central Zakat Fund established under section 7 of that Ordinance.
A.F. Ferguson & Co.Chartered Accountants Karachi, March 20, 2014
Audit Engagement Partner: Khurshid Hassan
69

EN ROUTET O C O N S O L I D A T I O N

Financial Statements

ANNUAL REPORT 201372
Balance Sheet As at December 31, 2013
As at As at December 31, January 1,
Note 2013 2012 2012Restated Restated
----------------(Rupees in thousand)----------------
SHARE CAPITAL AND RESERVES
Authorised share capital 5 1,000,000 1,000,000 1,000,000
Issued, subscribed and paid-up share capital 5 300,000 300,000 300,000
Reserves 6 1,775,185 1,901,890 1,888,974
2,075,185 2,201,890 2,188,974
NON-CURRENT LIABILITIES
Long term finances 7 4,576,924 4,101,924 250,000
DEFERRED LIABILITIES
Deferred taxation 8 299,888 210,022 140,814
Accumulated compensated absences 9 33,612 29,736 19,389
333,500 239,758 160,203
4,910,424 4,341,682 410,203 CURRENT LIABILITIES AND PROVISIONS
Trade and other payables 10 2,742,581 1,985,958 2,106,364
Accrued mark-up 11 175,042 163,149 36,740
Derivative financial instruments 12 43,871 - 79,725
Short term borrowings 13 3,263,531 2,565,817 1,229,758
Current portion of long term finances 7 525,000 125,000 125,000
6,750,025 4,839,924 3,577,587
11,660,449 9,181,606 3,987,790
CONTINGENCIES AND COMMITMENTS 14
13,735,634 11,383,496 6,176,764

73
As at As at December 31, January 1,
Note 2013 2012 2012Restated Restated
----------------(Rupees in thousand)----------------
NON CURRENT ASSETS
Property, plant and equipment 15 7,535,042 6,561,106 2,397,627
Intangible assets 16 11,165 8,270 18,727
Long term deposits 17 2,999 2,303 2,195
7,549,206 6,571,679 2,418,549
CURRENT ASSETS
Stores and spares 18 343,874 302,490 354,560
Stock in trade 19 2,485,187 2,344,940 1,542,125
Trade debts 20 1,778,982 1,204,616 991,922
Financial assets at fair value through profit or loss - - 262,884
Advances and prepayments 21 149,763 56,542 37,217
Other receivables 22 139,650 140,532 37,871
Taxation 622,937 143,825 55,202
Cash and bank balances 23 666,035 618,872 476,434
6,186,428 4,811,817 3,758,215
13,735,634 11,383,496 6,176,764
The annexed notes 1 to 43 form an integral part of these financial statements.
Shahid HussainChief Executive
Syed Hyder Ali Director

ANNUAL REPORT 201374
Profit And Loss AccountFor the year ended December 31, 2013
Note 2013 2012
Restated-----(Rupees in thousand)-----
Net sales 24 11,950,081 10,240,532
Cost of sales 25 10,516,592 8,725,781
Gross profit 1,433,489 1,514,751
Distribution cost 26 294,343 243,590
Administrative expenses 27 231,322 211,742
525,665 455,332
Operating profit 907,824 1,059,419
Other income 28 47,956 32,816
955,780 1,092,235
Finance cost 29 614,150 171,374
Other expenses 30 23,573 57,341
637,723 228,715
Profit before taxation 318,057 863,520
Taxation 31 108,901 280,788
Profit after taxation 209,156 582,732
Other comprehensive income for the year
Items that may be reclassified subsequently to profit or loss
Loss arising during the year on cash flow hedge (43,871) (79,200)
Add: Income tax relating to hedging reserve 14,339 27,720
(29,532) (51,480)Items that will not be reclassified subsequently to profit or loss
Remeasurements of staff retirement benefits 32 (9,589) (34,383)
Income tax on items that will not be reclassified 3,260 12,034
Other comprehensive income for the period - net of tax (6,329) (22,349)
Total comprehensive income for the year 173,295 508,903
Earnings per share - (Rupees) 33 6.97 19.42
The annexed notes 1 to 43 form an integral part of these financial statements.
Shahid HussainChief Executive
Syed Hyder Ali Director

75
Statement of Changes in EquityFor the year ended December 31, 2013
Issued, subscribed and paid-up share
capital
General reserve
Hedging reserveUnappropriated
profit Total
----------------------------------(Rupees in thousand)----------------------------------
Balance as at January 1, 2012 - previously reported 300,000 1,189,000 (52,533) 784,730 2,221,197
Effect of remeasurement of staff retirement benefits (note 4.2) - - - (32,223) (32,223)
Balance as at January 1, 2012 - restated 300,000 1,189,000 (52,533) 752,507 2,188,974
Transactions with owners
Dividend relating to the year ended December 31, 2011 (Rs 20 per share)
- - - (600,000) (600,000)
Transfer to general reserve - 182,000 - (182,000) -
Comprehensive income for the year
Profit after taxation for the year ended December 31, 2012 - - - 582,732 582,732
Other comprehensive income - - (51,480) (22,349) (73,829)
Total comprehensive income for the year ended December 31, 2012 - - (51,480) 560,383 508,903
Transfer to capital work in progress - net of tax - - 104,013 - 104,013
Balance as at December 31, 2012 - restated 300,000 1,371,000 - 530,890 2,201,890
Transactions with owners
Dividend relating to the year ended December 31, 2012 (Rs 10 per share) - - - (300,000) (300,000)
Transfer to general reserve - 234,000 - (234,000) -
Comprehensive income for the year
Profit after taxation for the year ended December 31, 2013 - - - 209,156 209,156
Other comprehensive income (29,532) (6,329) (35,861)
Total comprehensive income for the year ended December 31, 2013 - - (29,532) 202,827 173,295
Balance as at December 31, 2013 300,000 1,605,000 (29,532) 199,717 2,075,185
The annexed notes 1 to 43 form an integral part of these financial statements.
Shahid HussainChief Executive
Syed Hyder Ali Director

ANNUAL REPORT 201376
Cash Flow Statement For the year ended December 31, 2013
Note 2013 2012
Restated-----(Rupees in thousand)-----
CASH FLOWS FROM OPERATING ACTIVITIES
Cash generated from operations 35 1,627,523 208,715
Payment on account of accumulated compensated absences (9,192) (9,244)
Long term deposits (696) (108)
Staff retirement benefits paid (42,684) (41,519)
Income taxes paid (480,548) (315,361)
Net cash inflow / (outflow) from operating activities 1,094,403 (157,517)
CASH FLOWS FROM INVESTING ACTIVITIES
Fixed capital expenditure (1,570,759) (4,083,926)
Purchase of intangible assets (10,182) -
Payment made on settlement of derivatives - (158,925)
Profit received on bank balances 345 222
Redemption of held-for-trading financial assets - 268,783
Sale proceeds on disposal of operating fixed assets 4,830 7,383
Net cash outflow from investing activities (1,575,766) (3,966,463)
CASH FLOWS FROM FINANCING ACTIVITIES
Long term finances paid (125,000) (125,000)
Long term financing acquired 1,000,000 3,976,924
Short term financing - net 475,000 700,000
Finance cost paid (744,506) (323,914)
Dividends paid (299,682) (597,651)
Net cash inflow from financing activities 305,812 3,630,359
Net decrease in cash and cash equivalents (175,551) (493,621)
Cash and cash equivalents at the beginning of the year (546,945) (53,324)
Cash and cash equivalents at the end of the year 36 (722,496) (546,945)
The annexed notes 1 to 43 form an integral part of these financial statements.
Shahid HussainChief Executive
Syed Hyder Ali Director

77
Notes to and Forming Part of the Financial StatementsFor the year ended December 31, 2013
1. THE COMPANY AND ITS OPERATIONS
Tri-Pack Films Limited (the Company) was incorporated in Pakistan on April 29, 1993 as a public limited company under the Companies Ordinance, 1984 (the Ordinance) and is listed on all the stock exchanges in Pakistan. It is principally engaged in the manufacturing and sale of Biaxially Oriented Polypropylene (BOPP) film and Cast Polypropylene (CPP) film. The registered office of the Company is situated at 4th floor, the Forum, Suite # 416 to 422, G-20, Block-9, Khayaban-e-Jami, Clifton, Karachi.
2. SIGNIFICANT ACCOUNTING INFORMATION AND POLICIES
2.1 Accounting convention
These financial statements have been prepared under the historical cost convention, as modified by re-measurement of certain financial assets and financial liabilities (including derivative financial instruments) at fair value and recognition of certain staff retirement and other service benefits at present value.
2.2 Statement of compliance
These financial statements have been prepared in accordance with the requirements of the Ordinance and the approved accounting standards as applicable in Pakistan. Approved accounting standards comprise of such International Financial Reporting Standards (IFRSs) issued by the International Accounting Standards Board and provisions of and directives issued under the Ordinance. In case requirements differ, the provisions or directives of the Ordinance shall prevail.
2.3 New standards, amendments to the approved accounting standards and new interpretations
2.3.1 New standards, amendments to the approved accounting standards and interpretations which became effective during the year ended December 31, 2013
There were certain new standards, amendments to the approved accounting standards and new interpretations issued by the International Financial Reporting Interpretations Committee (IFRIC) that are effective for the year ended December 31, 2013 but are considered not to be relevant or do not have any significant effect on the Company’s operations and are, therefore, not disclosed in these financial statements except for those explained in note 4.
2.3.2 New standards, amendments to approved accounting standards and new interpretation, that are not yet effective
There are certain new standards, amendments to the approved accounting standards and new interpretations that are mandatory for accounting periods beginning on or after January 1, 2013, but are considered not to be relevant or have any significant effect on the Company’s operations and are therefore, not disclosed in these financial statements.
2.4 Staff retirement benefits
The main features of the schemes operated by the Company for its employees are as follows:
2.4.1 Defined contribution plan
Provident fund
The Company operates a recognised provident fund for all its permanent employees who have completed prescribed qualifying period of service. Equal monthly contributions are made, both by the Company and the employees, to the provident fund at the rate of ten percent of basic salary.
ANNUAL REPORT 201378
Notes to and Forming Part of the Financial StatementsFor the year ended December 31, 2013
2.4.2 Defined benefit plan
Gratuity plan
There is an approved funded defined benefit gratuity plan for all employees. Monthly contributions are made to this fund on the basis of actuarial recommendations at the rate of 8.33% per annum of basic salaries. The latest actuarial valuation for the gratuity scheme was carried out as at December 31, 2013. The actual return on plan assets represent the difference between the fair value of plan assets at the beginning and end of the year and adjusted for contributions and benefits paid.
The future contribution rates of these plans include allowances for deficit and surplus. Projected unit credit method, using the following significant assumptions, is used for valuation of this scheme:
- Discount rate used for year end obligation - 13% (2012: 11%) per annum;- Expected rate of increase in salary levels - 12% (2012: 10%) per annum; and- Expected mortality rate SLIC (2001 - 2005) mortality table.
Actuarial gains and losses arising from experience adjustments and changes in actuarial assumptions are charged or credited to equity in other comprehensive income in the period in which they arise. Past service costs are recognized immediately in the profit and loss account.
Pension plan
The Company was operating an approved defined benefit pension fund plan, upto December 31, 2012. The Board of Trustees of the pension fund decided to convert the defined benefit plan to defined contribution plan for all its active employees with effect from January 1, 2013 with no impact on the pensioners appearing on the pensioners’ list as of that date. The proposed scheme was approved for implementation by the Commissioner Inland Revenue on February 22, 2013.
Consequently, the defined benefit pension fund plan currently operates two different plans for its employees:
- Defined contribution plan for all active employees; and - Defined benefit plan for pensioners who have retired before December 31, 2012.
In respect of the defined contribution plan, the Company contributes 20% of members’ monthly salary to the scheme; whereas, an employee may or may not opt to contribute 6% of his monthly salary to the scheme.
The obligation in respect of the defined benefit plan is determined by the actuary at each year end. Any funding gap identified by the actuary is paid by the Company from time to time. The last actuarial valuation was carried out as at December 31, 2013.
Actuarial gains and losses arising from experience adjustments and changes in actuarial assumptions for the defined benefit plan are charged or credited to equity in other comprehensive income in the period in which they arise. Past service costs are recognized immediately in profit and loss account.
2.4.3 Employee compensated absences
The Company also provides for compensated absences for all eligible employees in accordance with the rules of the Company. The provision is recognised on the basis of actuarial valuation. The valuation is based on the following significant assumptions:
- Discount rate used for year end obligation - 13% (2012: 11%) per annum; and- Expected rate of increase in salary levels - 12% (2012: 10%) per annum.

79
The Company accounts for the liability in respect of employees’ compensated absences in the year in which these are earned. The unrecognised actuarial gains or losses at each valuation date are recognised immediately.
2.5 Taxation
Income tax expense comprises current and deferred tax. Income tax expense is recognised in profit and loss except to the extent that it relates to items recognised directly in other comprehensive income, in which case it is recognised in other comprehensive income.
Current
Provision for current tax is based on the taxable income for the year at the current rates of taxation or one percent of turnover, whichever is higher. The charge for current tax is calculated using prevailing tax rates after taking into account tax credits, rebates and exemptions available. It also includes any adjustment to tax payable in respect of prior years.
Deferred
Deferred tax is accounted for using the balance sheet liability method in respect of all temporary differences arising from differences between the carrying amount of assets and liabilities in the financial statements and the corresponding tax bases used in the computation of the taxable profit.
Deferred tax liabilities are generally recognised for all taxable temporary differences and deferred tax assets are recognised to the extent that it is probable that taxable profits will be available against which the deductible temporary differences, unused tax losses and tax credits can be utilised.
Deferred tax assets and liabilities are measured at the tax rates that are expected to apply to the period when the asset is realised or the liability is settled, based on the tax rates (and tax laws) that have been enacted or substantively enacted at the balance sheet date.
Investment tax credits are viewed as increase of the related asset’s tax base. Accordingly, in such situation the deductible temporary difference that arises qualifies for the initial recognition exception as per IAS 12, ‘Income taxes’. Therefore, no deferred tax asset is recognised instead the recognition of the total investment tax occurs as a reduction of current tax.
2.6 Trade and other payables
Liabilities for trade and other payable are carried at cost which is the fair value of the consideration to be paid in future for goods and services received.
2.7 Provisions
Provisions are recognised when the Company has a legal or constructive obligation as a result of past events and it is probable that an outflow of resources embodying economic benefits will be required to settle the obligation and a reliable estimate of the amount can be made. However, provisions are reviewed at each balance sheet date and adjusted to reflect current best estimate.
2.8 Dividend
Dividend distribution to the Company’s shareholders is recognised as a liability in the period in which the dividends are approved by the shareholders / directors, as appropriate.

ANNUAL REPORT 201380
Notes to and Forming Part of the Financial StatementsFor the year ended December 31, 2013
2.9 Property, plant and equipment
Operating fixed assets are stated at cost less accumulated depreciation and accumulated impairment losses, if any, except for leasehold land and capital work in progress which are stated at cost. Cost of leasehold land is amortised using the straight line method over the period of lease term.
Operating fixed assets having cost exceeding the minimum threshold as determined by the management are capitalised. All other assets are charged to income in the year when acquired. Depreciation is charged to profit and loss account on straight line method at the following rates:
Nature of property, plant and equipment Annual rate of depreciation (%)
- Leasehold land 1.03 to 2.22- Buildings on leasehold land 5 to 33.33- Plant and machinery, electrical installations,
tube wells, pumps and tools 10- Furniture and fittings 10 to 20- Office equipment 20 to 33.33- Laboratory equipment and vehicles 20
Depreciation rates are reviewed annually. However, in case of assets which are utilized in connection with capital work in progress, the related depreciation is charged to capital work in progress.
Depreciation on additions and deletions during the year is charged from the month when asset is put into use or up to the month immediately before the month in which the asset is disposed off, respectively.
No depreciation is charged if the asset’s residual value exceeds its carrying amount.
Residual values and the useful lives are reviewed at each balance sheet date and adjusted if expectations differ significantly from previous estimates.
Residual values are determined by the management as the amount it expects it would receive currently for an item of property, plant and equipment if it was already of the age and in the condition expected at the end of its useful life based on the prevailing market prices of similar assets already at the end of their useful lives.
The Company assesses at each balance sheet date whether there is any indication that property, plant and equipment may be impaired. If such indication exists, the carrying amounts of such assets are reviewed to assess whether they are recorded in excess of their recoverable amount. Where carrying values exceed the respective recoverable amounts, assets are written down to their recoverable amounts and the resulting impairment charge is recognised in profit and loss account currently.
Useful lives are determined by the management based on the expected usage of assets, physical wear and tear, technical and commercial obsolescence, legal and similar limits on the use of the assets and other similar factors.
Maintenance and repairs are charged to profit and loss account as and when incurred. Major renewals and improvements are capitalised in accordance with IAS 16, ‘Property, plant and equipment’ and depreciated in a manner that represents the consumption pattern and useful lives. Minor repairs and renewals are charged to profit and loss account.
Profit or loss on disposal of operating fixed assets are included in profit and loss account in the year in which it is realized.

81
2.10 Capital work in progress
Capital work in progress is stated at cost less any identified impairment loss and represents expenditure incurred on property, plant and equipment during the construction and installation including applicable borrowing costs. Transfers are made to relevant property, plant and equipment category as and when assets are available for use.
2.11 Intangible assets
Intangible asset is an identifiable non-monetary asset without physical substance.
Intangible assets are recognised when it is probable that the expected future economic benefits will flow to the Company and the cost of the asset can be measured reliably. Cost of the intangible asset (i.e. computer software) includes purchase cost and directly attributable expenses incidental to bring the asset for its intended use.
Costs associated with maintaining intangible assets are recognised as an expense as and when incurred.
Intangible assets are stated at cost less accumulated amortisation and accumulated impairment losses, if any. Amortisation is charged over the estimated useful life of the asset on a systematic basis applying the straight line method at the rate of 33.33%.
Useful lives of intangible assets are reviewed, at each balance sheet date and adjusted if the impact of amortisation is significant.
The carrying amount of the intangible assets is reviewed for impairment whenever events or changes in circumstances indicate that the carrying amount may not be recoverable. An impairment loss is recognised for the amount by which the intangible asset’s carrying amount exceeds its recoverable amount in profit and loss account. Reversal of impairment losses are also recognised in profit and loss account, however, is restricted to the original cost of the intangible asset.
2.12 Stores and spares
Stores and spares are valued at weighted average cost less allowance for obsolete and slow moving items.
Stores and spares in transit are stated at cost comprising invoice value and other related charges incurred up to the balance sheet date.
2.13 Stock in trade
Stock in trade is valued at the lower of cost and estimated net realisable value. Cost is determined as follows:
Stages of stock in trade Basis of valuation
Raw materials, work in process and finished goods Weighted average cost
Raw materials in transit Invoice value and other related chargesas at balance sheet date
Cost of work in process and finished goods comprises cost of direct materials, labour and appropriate manufacturing overheads.

ANNUAL REPORT 201382
Notes to and Forming Part of the Financial StatementsFor the year ended December 31, 2013
Net realisable value is determined on the basis of the estimated selling price of the product in the ordinary course of business less estimated cost of completion and costs necessary to be incurred for its sale.
2.14 Trade debts Consistent with prior years, trade debts are recognised initially at original invoice amount which is the fair value of consideration to be received in future and subsequently measured at amortised cost less an estimate made for impairment based on a review of all outstanding amounts at the year end. A provision for impairment of trade debts is established when there is objective evidence that the Company will not be able to collect all amounts due according to the original terms of receivables. Bad debts are written off when identified.
2.15 Cash and cash equivalents
Cash and cash equivalents are carried in the balance sheet at cost. For the purpose of cash flow statement, cash and cash equivalents comprise cash on hand, demand deposits and other short term highly liquid investments that are readily convertible to known amounts of cash and which are subject to an insignificant risk of change in value. Cash and cash equivalents also include bank overdrafts / short term borrowings that are repayable on demand or within a period of 3 months from the reporting date.
2.16 Revenue recognition
Revenue comprises the fair value of the consideration received or receivable for the sale of goods and services in the ordinary course of the Company’s activities.
The Company recognises revenue when the amount of revenue can be reliably measured and it is probable that future economic benefits will flow to the Company and specific criteria has been met for each of the Company’s activities as described below:
i) Sales revenue is recognised at the time of dispatch of goods to customers; andii) Returns on bank deposits are accrued on a time proportion basis by reference to the principal
outstanding amount and the applicable rate of return.
2.17 Borrowing costs
General and specific borrowing costs directly attributable to the acquisition, construction or production of qualifying assets, which are assets that necessarily take a substantial period of time to get ready for their intended use or sale, are added to the cost of those assets, until such time as the assets are substantially ready for their intended use or sale.
Investment income earned on the temporary investment of specific borrowings pending their expenditure on qualifying assets is deducted from the borrowing costs eligible for capitalisation.
All other borrowing costs are recognised in profit and loss account in the period in which they are incurred.
2.18 Foreign currency transactions and translation
Foreign currency transactions are recognised or accounted for into Pakistan Rupees using the exchange rate prevailing on the date of the transaction. Monetary assets and liabilities in foreign currencies are converted into Pakistan Rupees at the rates of exchange prevailing on the balance sheet date. Exchange gain / loss on foreign currency translations are included in income / equity along with any related hedge effects.

83
2.19 Functional and presentation currency
Items included in these financial statements are measured using the currency of the primary economic environment in which the Company operates. These financial statements are presented in Pakistan Rupees, which is the Company’s functional and presentation currency.
2.20 Financial instruments
2.21 The Company classifies its financial assets in the following categories:
(a) Investments at ‘fair value through profit or loss’
- Held for trading
These include financial instruments acquired principally for the purpose of generating profit from short term fluctuations in prices or dealers’ margins or are securities included in portfolio in which a pattern of short term profit taking exists. Derivatives are also categorised as held for trading unless they are designated as hedges. Assets in this category are classified as current assets if expected to be settled within 12 months; otherwise, these are classified as non-current assets.
- Financial assets designated at ‘fair value through profit or loss’ upon initial recognition
These include investments that are designated as investments at ‘fair value through profit or loss’ upon initial recognition.
Gains / (losses) arising on sale of investments are included in the profit and loss account currently on the date when the transaction takes place.
Unrealised gains / (losses) arising on revaluation of securities classified as financial assets at ‘fair value through profit or loss’ are included in the profit and loss account in the period in which they arise.
(b) Loans and receivables
Loans and receivables are non-derivative financial assets with fixed or determinable payments that are not quoted in an active market. These are included in current assets, except for maturities greater than 12 months after the balance sheet date, which are classified as non-current assets. The Company’s loans and receivables comprise ‘long term deposits’, ‘trade debts’, ‘advances and prepayments’, ‘other receivables’ and ‘cash and bank balances’ in the balance sheet.
(c) Held to maturity
Held to maturity financial assets are non-derivative financial assets with fixed or determinable payments and fixed maturity with a positive intention to hold them up to maturity.
(d) Available-for-sale
Available-for-sale financial assets are non-derivatives that are either designated in this category or not classified in any of the other categories. These are included in non-current assets unless the investment matures or management intends to dispose of the financial assets within 12 months of the balance sheet date.

ANNUAL REPORT 201384
Notes to and Forming Part of the Financial StatementsFor the year ended December 31, 2013
2.22 Recognition
Regular way purchases and sales of financial assets are recognised on the trade date - the date on which the Company commits to purchase or sell the asset.
2.23 Measurement
Financial instruments are measured initially at fair value (transaction price) plus, in case of a ‘financial asset or financial liability other than those at fair value through profit or loss’, transaction costs that are directly attributable to the acquisition or issue of the financial asset or financial liability. Transaction costs on ‘financial assets and financial liabilities at fair value through profit or loss’ are charged to the profit and loss account immediately.
Subsequent to initial recognition, instruments classified as financial assets at ‘fair value through profit or loss’ and ‘available for sale’ are measured at fair value. Gains / (losses) arising from changes in the fair value of the financial assets at ‘fair value through profit or loss’ are recognised in the profit and loss account. Changes in the fair value of instruments classified as ‘available for sale’ are recognised in other comprehensive income until derecognised or impaired when the accumulated fair value adjustments recognised in other comprehensive income are transferred to the profit and loss account.
Financial assets classified as ‘loans and receivables’ and ‘held to maturity’ are carried at amortised cost using the effective yield method, less impairment losses, if any.
Financial liabilities, other than those at ‘fair value through profit or loss’ are measured at amortised cost using the effective yield method.
2.24 Fair value measurement principles
The fair value of units of mutual funds is based on the net asset value of the fund which are declared on daily basis without any deduction for estimated future selling costs. Financial assets and financial liabilities are priced at their fair market value.
2.25 Impairment
Impairment loss on investment other than ‘available for sale’ is recognised in the profit and loss account whenever the carrying amount of investment exceeds its recoverable amount. If in a subsequent period, the amount of an impairment loss recognised decreases the impairment is reversed through the profit and loss account.
In case of investment classified as ‘available for sale’, a significant or prolonged decline in the fair value of the security below its cost is considered an indicator that the securities are impaired. If any such evidence exists for ‘available for sale’ financial assets, the cumulative loss measured as the difference between the acquisition cost and the current fair value, less any impairment loss on that financial asset previously recognised in the profit and loss account is removed from other comprehensive income and recognised in the profit and loss account. However, any decrease in impairment loss on securities classified as ‘available for sale’ is reversed through the profit and loss account and is recognised in other comprehensive income.
2.26 Derecognition
The Company derecognises a financial asset when the contractual rights to the cash flows from the financial asset expire or it transfers the financial asset and the transfer qualifies for derecognition in accordance with IAS 39, ‘Financial instruments: Recognition and measurement’.

85
The Company uses the weighted average method to determine realised gains and losses on derecognition. A financial liability is derecognised when the obligation specified in the contract is discharged, cancelled or expired.
2.27 Derivatives financial instruments and hedging activities
Derivatives are initially recognised at fair value on the date a derivative contract is entered into and are subsequently remeasured at their fair value. The method of recognising the resulting gain or loss depends on whether the derivative is designated as a hedging instrument, and if so, the nature of the item being hedged. The Company designates derivatives as either fair value hedge or cash flow hedge.
The Company documents at the inception of the transaction the relationship between hedging instruments and hedged items, as well as its risk management objectives and strategy for undertaking various hedging transactions. The Company also documents its assessment, both at hedge inception and on an ongoing basis, of whether the derivatives that are used in hedging transactions are highly effective in off-setting changes in fair values or cash flows of hedged items.
The fair values of various derivative instruments used for hedging purposes are disclosed in note 12. The full fair value of a hedging derivative is classified as a non-current asset or liability when the remaining maturity of the hedged item is more than 12 months, and as current asset or liability when the remaining maturity of the hedged item is less than 12 months. Trading derivatives are classified as current asset or liability.
(a) Fair value hedge
Changes in the fair value of derivatives that are designated and qualify as fair value hedges are recorded in the profit and loss account, together with any changes in the fair value of the hedged asset or liability that are attributable to the hedged risk.
(b) Cash flow hedge
The effective portion of changes in the fair value of derivatives that are designated and qualify as cash flow hedges is recognised in other comprehensive income. The gain or loss relating to the ineffective portion is recognised immediately in the profit and loss account.
Amounts accumulated in equity are reclassified to profit and loss account in the periods when the hedged item affects profit and loss account (for example, when the forecast sale that is hedged takes place). However, when the forecast transaction that is hedged results in the recognition of a non-financial asset (for example, inventory or fixed assets), the gains and losses previously deferred in equity are transferred from equity and included in the initial measurement of the cost of the asset. The deferred amounts are ultimately recognised in cost of goods sold in the case of inventory or in depreciation in the case of fixed assets.
When a hedging instrument expires or is sold, or when a hedge no longer meets the criteria for hedge accounting, any cumulative gain or loss existing in equity at that time remains in equity and is recognised when the forecast transaction is ultimately recognised in the profit and loss account. When a forecast transaction is no longer expected to occur, the cumulative gain or loss that was reported in equity is immediately transferred to the profit and loss account.
2.28 Off-setting of financial assets and financial liabilities
A financial asset and a financial liability is offset and the net amount is reported in the balance sheet if the Company has a legally enforceable right to set-off the recognised amounts and intends either to settle on a net basis or to realise the asset and settle the liability simultaneously.

ANNUAL REPORT 201386
Notes to and Forming Part of the Financial StatementsFor the year ended December 31, 2013
3. SIGNIFICANT ACCOUNTING ESTIMATES AND JUDGEMENTS
The preparation of financial statements in conformity with approved accounting standards requires the use of certain critical accounting estimates. It also requires management to exercise its judgement in the process of applying the Company’s accounting policies. Estimates and judgements are continually evaluated and are based on historic experience and other factors, including expectation of future events that are believed to be reasonable under the circumstances. There were no significant judgements involved in the application of Company’s accounting policies. The management has made the following estimates which are significant to the financial statements:
3.1 Current and deferred income taxes
In making the estimates for income taxes payable by the Company, management considers current income tax laws and the decisions of appellate authorities on certain cases issued in the past. Where the final outcome is different from the amounts that were initially recorded, such differences will impact the income tax provision in the period in which such final outcome is determined. Deferred taxes are measured at the tax rates that are expected to apply to the period when the asset is realised or the liability is settled, based on the tax rates (and tax laws) that have been enacted or substantively enacted at the balance sheet date.
3.2 Provision for retirement and other service benefit obligations
The present value of these obligations depends on a number of factors that are determined on actuarial basis using a number of assumptions. Any changes in these assumptions will impact the carrying amount of these obligations. The present values of these obligations and the underlying assumptions are disclosed in notes 2.4 and 32.
3.3 Property, plant and equipment and intangible assets
Estimates with respect to residual values and useful lives and pattern flow of economic benefit are based on the recommendation of technical teams of the Company. Further, the Company reviews the internal and external indicators for possible impairment of assets on an annual basis. Any change in the estimates in future years might affect the carrying amounts of the respective items of property, plant and equipment (note 15) and intangible assets (note 16) with a corresponding affect on the depreciation charge, amortisation charge and impairment.
3.4 Stock in trade
Assumptions and estimates used in writing down items of stock in trade to their net realisable value (note 19). Net realisable value is determined on the basis of estimated selling price of the product in the ordinary course of business less estimated cost of completion and the estimated costs necessary to be incurred for its sale.
3.5 Derivative hedging financial instruments designated as cash flow hedges
The Company reviews the changes in fair values of the derivative hedging financial instruments at each reporting date based on the valuations done by the management on the basis of forward rates obtained from the bank. These valuations represent estimated fluctuations in the relevant currencies / interest rates over the reporting period and other relevant variables signifying currency and interest rate risks.
Estimates and judgements are continually evaluated and are based on historical experience and other factors, including expectation of future events that are believed to be reasonable under the circumstances.

87
3.6 Provisions
Provisions are based on management’s best estimate. Any change in the estimates in future years might affect the carrying amounts of the provision with a corresponding affect on the profit and loss account of the Company.
4. CHANGES IN ACCOUNTING POLICIES AND DISCLOSURES
4.1 Amendment to IAS 1, ‘Presentation of financial statements’ regarding ‘Other comprehensive income’
The primary change resulting from this amendment is that the Company has grouped items presented in ‘Other comprehensive income’ on the basis of whether they are potentially classifiable to profit or loss subsequently (reclassification adjustments). Had there been no change in the aforementioned accounting, there would not have been any bifurcation of items appearing in the ‘Other comprehensive income’.
4.2 Adoption of amendments in IAS 19, ‘Employee benefits’
During the year, the Company has changed its accounting policy in respect to recognition of actuarial gains and losses, past service costs and expected return on plan assets, whereby with effect from current year, the Company has recognized:
- Actuarial gains and losses as they occur in other comprehensive income, instead of past policy, where actuarial gains and losses were recognised as income or expense in accordance with minimum recommended approach under the previous standard IAS 19, ‘Employees benefits’;
- All past service costs at the earlier of when the amendment or curtailment occurs and when the Company has recognised related restructuring or termination benefits, instead of past policy, where the past service costs were recognised on a straight line basis over the average period until the benefits became vested and if the benefits were already vested, following introduction of or change in scheme, past service costs were recognised immediately in profit and loss account;
- Interest on net defined benefit obligation (net of plan assets) in profit and loss account, which is calculated using the discount rate used to measure the defined benefit obligation or asset, and expected return on plan assets will no longer be recognised in profit and loss account;
- The change has been accounted for in accordance with the requirements of IAS 19, ‘Employees benefits’ as required under IAS 8, ‘Accounting policies, change in accounting estimates and errors’ such a change to be applied retrospectively. Due to the change in accounting policy, the Company has presented as at the beginning of the earliest comparative period i.e. January 1, 2012 and related notes in accordance requirement of IAS 1, ‘Presentation of financial statements’;
- There is a new term ‘remeasurements’. This is made up of actuarial gains and losses, the difference between actual investment returns and the return implied by the net interest cost; and

ANNUAL REPORT 201388
Notes to and Forming Part of the Financial StatementsFor the year ended December 31, 2013
- Had there been no change in the accounting policy due to recognition of actuarial gains and losses on defined benefit plans in accordance with IAS 19, ‘Employees benefits’, the following would have been the impact as of January 1, 2012, December 31, 2012 and for the year then ended:
NoteBalance
previously reported
Effect of change in
accounting policy
Restated amount
--------------(Rupees in thousand)--------------
As at January 1, 2012
Balance SheetReserves 1,921,197 (32,223) 1,888,974 Deferred taxation 158,165 (17,351) 140,814 Trade and other payables 2,073,526 32,838 2,106,364 Other receivables 54,607 (16,736) 37,871
As at December 31, 2012
Balance SheetReserves 6 1,907,785 (5,895) 1,901,890 Deferred taxation 8 239,407 (29,385) 210,022 Trade and other payables 10 1,967,423 18,535 1,985,958 Other receivables 22 157,277 (16,745) 140,532
For the year endedDecember 31, 2012
Profit and LossCost of sales 25 8,761,569 (35,788) 8,725,781 Administrative expenses 27 224,631 (12,889) 211,742
Statement of Changes in Equity
Unappropriated profit 534,055 48,677 582,732 Total comprehensive income 482,575 26,328 508,903
Other Comprehensive Income (51,480) (22,349) (73,829)
Earnings per Share 33 17.80 1.62 19.42
4.3 Amendment in the Fourth Schedule to the Ordinance
During the year the Securities and Exchange Commission of Pakistan has notified certain amendments in the Fourth Schedule to the Ordinance. One of the amendments relates to classification of major spare parts and stand-by equipment as part of property, plant and equipment.

89
Reclassified from Reclassified to 2012 2011-----(Rupees in thousand)-----
Stores and spares Property, plant and equipment 94,092 33,127
4.4 Amendment to IAS 1, ‘Presentation of financial statements’ regarding disclosure requirements for ‘Comparative information’
The amendment clarifies disclosure requirements for comparative information when an entity provides a third balance sheet as at the beginning of the preceding period if it applies an accounting policy retrospectively, and the retrospective application has a material effect on the information in the balance sheet at the beginning of the preceding period. However, the entity need not to present the related notes to the opening balance sheet as at the beginning of the preceding period, presented.
5. SHARE CAPITAL 2013 2012
-----(Rupees in thousand)-----5.1 Authorised share capital
100,000,000 ordinary shares of Rs 10 each (2012: 100,000,000) 1,000,000 1,000,000
5.2 Issued, subscribed and paid-up share capital
30,000,000 ordinary shares of Rs 10 each (2012: 30,000,000)fully paid in cash
300,000 300,000
5.3 Packages Limited, Mitsubishi Corporation, Japan and IGI Insurance Limited held 10,000,000 (2012: 10,000,000), 7,499,000 (2012: 7,499,000) and 1,700,349 (2012: 1,700,349) ordinary shares of the Company respectively, as at December 31, 2013.
6. RESERVESNote 2013 2012
Restated-----(Rupees in thousand)-----
General reserve 1,605,000 1,371,000 Hedging reserve (29,532) - Unappropriated profit 199,717 530,890
1,775,185 1,901,890
7. LONG TERM FINANCES2013 2012
-----(Rupees in thousand)-----
Secured
Finance - 1 7.1 125,000 250,000 Finance - 2 7.2 1,000,000 1,000,000 Finance - 3 7.2 1,000,000 1,000,000 Finance - 4 7.2 1,976,924 1,976,924 Finance - 5 7.2 1,000,000 -
5,101,924 4,226,924 Less: Current portion of long term finances (525,000) (125,000)
4,576,924 4,101,924

ANNUAL REPORT 201390
Notes to and Forming Part of the Financial StatementsFor the year ended December 31, 2013
7.1 The Company has obtained a long term finance facility of Rs 500 million (2012: Rs 500 million) from a commercial bank under mark-up arrangements. Mark-up is payable on semi-annual basis at the rate of six months Karachi Inter Bank Offer Rate (KIBOR) plus 0.50% (2012: 0.50%) per annum. The effective rate of mark-up during the year was 11.55% (2012: 12.45%) per annum. The principal amount is repayable in 8 equal instalments commencing after six months with a grace period of two years from the date of first draw down. This facility is secured by first pari passu hypothecation / mortgage charges on all the Company’s present and future fixed assets including but not limited to land, buildings, plant and machinery, equipment, furniture and fixtures etc.
7.2 The Company has obtained long term finance facilities of Rs 5,000 million (2012: Rs 4,000 million) from various commercial banks under mark-up arrangements including Rs 2,300 million (2012: Rs 1,500 million) under long term financing facility scheme provided by State Bank of Pakistan. Mark-up is payable on semi-annual basis at the rate of six months KIBOR plus 0.75% to 0.8% (2012: 0.75%) per annum . The effective weighted average rate of mark-up during the year was 9.07% to 10.32% (2012: 12.14%) per annum. The principal amount is repayable in 10 equal instalments commencing after six months with a grace period of two years from the date of first draw down. This facility is secured by first pari passu hypothecation / mortgage charges on all the Company’s present and future fixed assets including but not limited to land, buildings, plant and machinery, equipment, furniture and fixtures etc.
8. DEFERRED TAXATION2013 2012
Restated-----(Rupees in thousand)-----
(Debit) / credit balances arising from:
Accelerated tax depreciation allowance 699,445 148,063 Amortisation allowance (3,318) (4,831)Borrowing cost 7,842 108,168 Remeasurement on staff retirement benefits (32,645) (29,385)Tax loss (344,583) - Provision for accumulated compensated absences (10,986) (10,259)Unrealised gain on hedging instrument (14,339) - Provision for doubtful debts (1,528) (1,734)
299,888 210,022
8.1 The movement in temporary differences is as following
Balance as at January 1,
2013
Recognised in profit or loss
Recognised in OCI
Balance as at December 31,
2013--------------------(Rupees in thousand)--------------------
Accelerated tax depreciation allowance 148,063 551,382 - 699,445 Amortisation allowance (4,831) 1,513 - (3,318)Borrowing cost 108,168 (100,326) - 7,842 Remeasurement on staff retirement benefits (29,385) - (3,260) (32,645)Tax loss - (344,583) - (344,583)Provision for accumulated
compensated absences (10,259) (727) - (10,986)Unrealised gain on hedging instrument - - (14,339) (14,339)Provision for doubtful debts (1,734) 206 - (1,528)
210,022 107,465 (17,599) 299,888
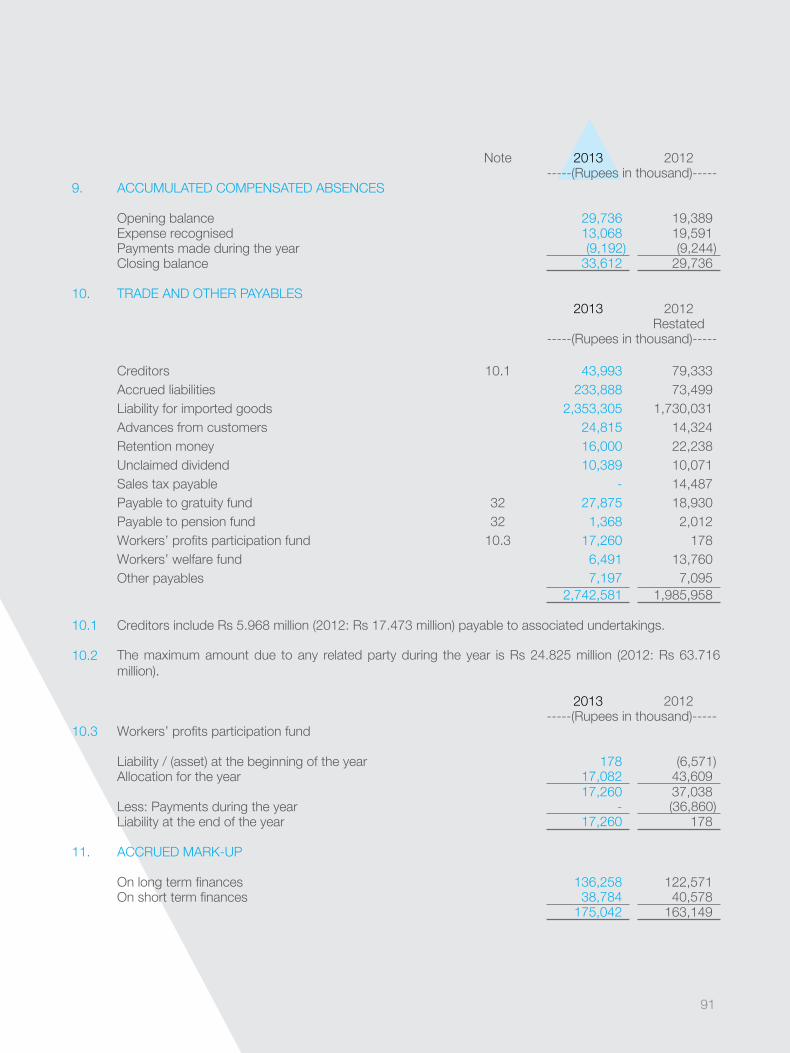
91
Note 2013 2012-----(Rupees in thousand)-----
9. ACCUMULATED COMPENSATED ABSENCES
Opening balance 29,736 19,389 Expense recognised 13,068 19,591 Payments made during the year (9,192) (9,244)Closing balance 33,612 29,736
10. TRADE AND OTHER PAYABLES2013 2012
Restated-----(Rupees in thousand)-----
Creditors 10.1 43,993 79,333 Accrued liabilities 233,888 73,499 Liability for imported goods 2,353,305 1,730,031 Advances from customers 24,815 14,324 Retention money 16,000 22,238 Unclaimed dividend 10,389 10,071 Sales tax payable - 14,487 Payable to gratuity fund 32 27,875 18,930 Payable to pension fund 32 1,368 2,012 Workers’ profits participation fund 10.3 17,260 178 Workers’ welfare fund 6,491 13,760 Other payables 7,197 7,095
2,742,581 1,985,958
10.1 Creditors include Rs 5.968 million (2012: Rs 17.473 million) payable to associated undertakings.
10.2 The maximum amount due to any related party during the year is Rs 24.825 million (2012: Rs 63.716 million).
2013 2012-----(Rupees in thousand)-----
10.3 Workers’ profits participation fund
Liability / (asset) at the beginning of the year 178 (6,571)Allocation for the year 17,082 43,609
17,260 37,038 Less: Payments during the year - (36,860)Liability at the end of the year 17,260 178
11. ACCRUED MARK-UP
On long term finances 136,258 122,571 On short term finances 38,784 40,578
175,042 163,149

ANNUAL REPORT 201392
Notes to and Forming Part of the Financial StatementsFor the year ended December 31, 2013
12. DERIVATIVE FINANCIAL INSTRUMENTS
These represent forward currency contracts designated as cash flow hedges for the foreign currency risk of the firm commitment to purchase raw material. There was no ineffectiveness to be recorded from forward foreign exchange contracts.
The notional principal amounts of the outstanding forward foreign exchange contracts as at December 31, 2013 aggregate Euro 0.242 million (2012: Euro Nil) and USD 16.476 million (2012: USD Nil).
13. SHORT TERM BORROWINGSNote 2013 2012
-----(Rupees in thousand)-----
Secured
Short term money market loans 13.1 1,875,000 1,400,000 Short term running finance 13.2 1,388,531 1,165,817
3,263,531 2,565,817
13.1 Short term money market loans have been arranged from commercial banks as a sub-limit of the running finance facility. These facilities are secured by joint hypothecation by way of first floating charge over current assets including but not limited to stores and spares, stock in trade and trade debts. Rate of mark-up applicable to these facilities ranges between 9.06% to 10.57% (2012: 9.49% to 12.54%) per annum.
13.2 Short term running finances have been obtained under mark-up arrangement with banks payable on various maturity dates up to June 30, 2014. These facilities are secured by joint hypothecation by way of first floating charge over current assets including but not limited to stores and spares, stock in trade and trade debts. Rate of mark-up applicable to these facilities ranges between 9.46% to 11.62% (2012: 10.19% to 13.14%) per annum.
13.3 Total facilities available under mark-up arrangements aggregated Rs 8,100 million (2012: 6,500 million) out of which the amount unavailed at the year end was Rs 4,836 million (2012: Rs 3,934 million).
14. CONTINGENCIES AND COMMITMENTS 2013 2012
-----(Rupees in thousand)-----Contingencies
Guarantees issued by banks on behalf of the Company 226,184 134,334
Commitments
Letters of credit for purchase of raw materials and spares 989,094 294,393
Letters of credit for purchase of plant and machinery 30,405 753,606
Contracts for civil works 46,345 239,287

93
14.1 The facilities for opening of letter of credits and for guarantees as at December 31, 2013 amount to Rs 10,550 million (2012: Rs 7,600 million) and Rs 360 million (2012: Rs 210 million), of which the amount remaining unutilised was of Rs 7,177 million (2012: Rs 4,822 million) and Rs 133.816 million (2012: Rs 75.666 million) respectively.
14.2 During the year 2011, the Commissioner Inland Revenue (Appeals) [CIR (A)] deleted the disallowances made in the amended order in respect of the tax year 2005 issued by the Deputy Commissioner Inland Revenue (DCIR). While framing the appeal effect order DCIR had given appeal effect to the deletions made by the CIR (A). However, sales amounting to Rs 60.282 million during the trial production capitalised as the part of property, plant and equipment have been subjected to tax. The Company filed an appeal with CIR (A) which was heard during the year, however, no appellate order has yet been received. Further, application of rectification under Section 221 of the Income Tax Ordinance, 2001 (the ITO, 2001) was filed during the year 2012 which was time barred by CIR (A) via order number 13/2013 dated October 24, 2013 rejecting the order for condonation. Applications for rectification were filed via letter number DT 2601 and DT 1284 dated February 8, 2012 and November 13, 2013 respectively and the same are pending disposal. The management of the Company, based on the advice of its tax consultant, is confident that the ultimate decision in respect of the aforementioned matters shall be in its favour.
14.3 In respect of tax year 2009, appeal as well as rectification application was filed against the order under Section 122 (1) of the ITO, 2001. However, rectified order has been issued by DCIR under Section 221 of the ITO, 2001. According to the rectified order, disallowances aggregating Rs 22.132 million have been maintained by DCIR with a resulting tax impact of Rs 7.746 million. The Company filed an appeal with CIR (Appeals) which was heard on July 26, 2012 whereas the appellate order is still awaited. The management of the Company, based on the advice of its tax consultant, is confident that the ultimate decision in respect of the aforementioned matter shall be made in its favour.
15. PROPERTY, PLANT AND EQUIPMENTNote 2013 2012
Restated-----(Rupees in thousand)-----
Operating fixed assets 15.1 6,394,753 1,572,261 Capital work in progress 15.2 1,100,939 4,894,753 Major spare parts and stand-by equipments 15.3 39,350 94,092
7,535,042 6,561,106
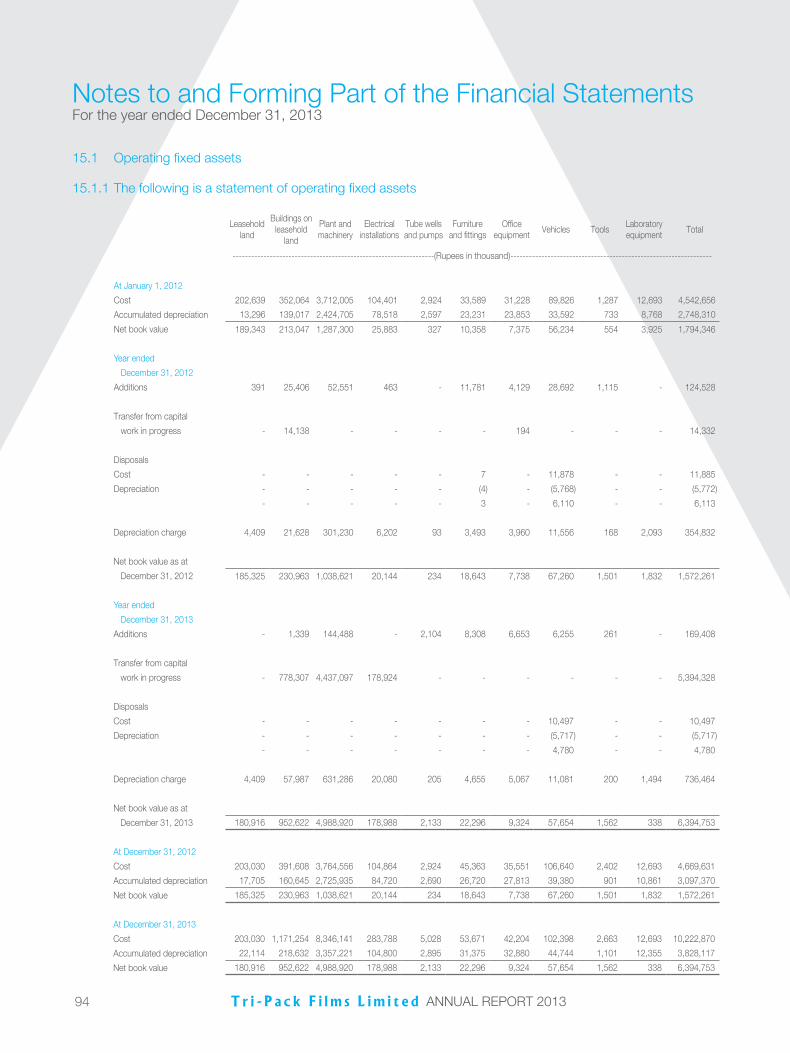
ANNUAL REPORT 201394
Notes to and Forming Part of the Financial StatementsFor the year ended December 31, 2013
15.1 Operating fixed assets
15.1.1 The following is a statement of operating fixed assets
Leasehold land
Buildings on leasehold
land
Plant and machinery
Electrical installations
Tube wells and pumps
Furniture and fittings
Office equipment
Vehicles ToolsLaboratory equipment
Total
-----------------------------------------------------------------(Rupees in thousand)-----------------------------------------------------------------
At January 1, 2012
Cost 202,639 352,064 3,712,005 104,401 2,924 33,589 31,228 89,826 1,287 12,693 4,542,656
Accumulated depreciation 13,296 139,017 2,424,705 78,518 2,597 23,231 23,853 33,592 733 8,768 2,748,310
Net book value 189,343 213,047 1,287,300 25,883 327 10,358 7,375 56,234 554 3,925 1,794,346
Year ended
December 31, 2012
Additions 391 25,406 52,551 463 - 11,781 4,129 28,692 1,115 - 124,528
Transfer from capital
work in progress - 14,138 - - - - 194 - - - 14,332
Disposals
Cost - - - - - 7 - 11,878 - - 11,885
Depreciation - - - - - (4) - (5,768) - - (5,772)
- - - - - 3 - 6,110 - - 6,113
Depreciation charge 4,409 21,628 301,230 6,202 93 3,493 3,960 11,556 168 2,093 354,832
Net book value as at
December 31, 2012 185,325 230,963 1,038,621 20,144 234 18,643 7,738 67,260 1,501 1,832 1,572,261
Year ended
December 31, 2013
Additions - 1,339 144,488 - 2,104 8,308 6,653 6,255 261 - 169,408
Transfer from capital
work in progress - 778,307 4,437,097 178,924 - - - - - - 5,394,328
Disposals
Cost - - - - - - - 10,497 - - 10,497
Depreciation - - - - - - - (5,717) - - (5,717)
- - - - - - - 4,780 - - 4,780
Depreciation charge 4,409 57,987 631,286 20,080 205 4,655 5,067 11,081 200 1,494 736,464
Net book value as at
December 31, 2013 180,916 952,622 4,988,920 178,988 2,133 22,296 9,324 57,654 1,562 338 6,394,753
At December 31, 2012
Cost 203,030 391,608 3,764,556 104,864 2,924 45,363 35,551 106,640 2,402 12,693 4,669,631
Accumulated depreciation 17,705 160,645 2,725,935 84,720 2,690 26,720 27,813 39,380 901 10,861 3,097,370
Net book value 185,325 230,963 1,038,621 20,144 234 18,643 7,738 67,260 1,501 1,832 1,572,261
At December 31, 2013
Cost 203,030 1,171,254 8,346,141 283,788 5,028 53,671 42,204 102,398 2,663 12,693 10,222,870
Accumulated depreciation 22,114 218,632 3,357,221 104,800 2,895 31,375 32,880 44,744 1,101 12,355 3,828,117
Net book value 180,916 952,622 4,988,920 178,988 2,133 22,296 9,324 57,654 1,562 338 6,394,753

95
15.1.2 Depreciation charge for the year has been allocated as follows:
Note 2013 2012-----(Rupees in thousand)-----
Cost of goods manufactured 25.1 713,430 337,983 Distribution cost 26 3,106 2,786 Administrative expenses 27 17,756 11,439 Capital work in progress 2,172 2,624
736,464 354,832
15.1.3 Operating fixed assets include assets having cost of Rs 1,399.365 million (2012: Rs 1,295.548 million) which were fully depreciated as at the year end.
15.1.4 Details of operating fixed assets disposed off during the year ended December 31, 2013.
The following operating fixed assets with a net book value exceeding Rs 50,000 were disposed off during the year:
Particulars Sold to Cost Accumulated depreciation
Net book value
Sale proceedsGain / (loss)
--------------------------------(Rupees in thousand)--------------------------------
Vehicles Ehsan ul Haq 520 350 170 170 - Humayun Naseer 524 352 172 172 - Babar Jamal 524 352 172 172 - Amjad Ali 1,420 652 768 768 - Syed Shahid Iqbal 627 422 205 205 - Muhammad Hassan Qureshi 639 430 209 209 - Muzafar Hameed Butt 1,365 398 967 998 31 Reza Said 1,364 398 966 982 16 Ahsan Amjad 542 364 178 178 - Afzal Ahmed 641 431 210 210 - Mehmood Ahmed 623 419 204 204 - Naeem Ahmed 618 416 202 202 - Mushtaq Ahmed 522 351 171 174 3 Umer Maroof 568 382 186 186 -
10,497 5,717 4,780 4,830 50
15.1.5 All disposals were made as per Company policy.
15.2 Capital work in progress 2013 2012
-----(Rupees in thousand)-----
Plant and machinery 773,776 3,941,795 Building and civil works 23,985 881,401 Advances to suppliers and contractors 303,178 71,557
1,100,939 4,894,753
15.2.1 Capital work in progress includes borrowing cost capitalised during the year aggregating Rs 142.249 million (2012: Rs 278.949 million). The effective rate for capitalisation of borrowing cost during the year was 10.11% (2012: 10.20%).

ANNUAL REPORT 201396
Notes to and Forming Part of the Financial StatementsFor the year ended December 31, 2013
15.3 Major spare parts and stand-by equipments2013 2012
-----(Rupees in thousand)-----
Balance at the beginning of the year 94,092 33,127 Additions during the year 49,186 64,286 Transfers made during the year (103,928) (3,321)Balance at the end of the year 39,350 94,092
16. INTANGIBLE ASSETS
Computer software
At January 1Cost 31,378 31,378 Accumulated amortisation (23,108) (12,651)Net book value 8,270 18,727
Additions during the year 10,182 -
Year ended December 31
Amortisation for the year (7,287) (10,457)Net book value as at December 31 11,165 8,270
At December 31Cost 41,560 31,378 Accumulated amortisation (30,395) (23,108)Net book value 11,165 8,270
16.1 Amortisation charge for the year has been allocated to administrative expenses.
17. LONG TERM DEPOSITS
These represent long term security deposits given to various parties.
18. STORES AND SPARES2013 2012
-----(Rupees in thousand)-----
Stores 67,584 60,176Spares 251,439 228,027 Stores and spares in transit 24,851 14,287
343,874 302,490
19. STOCK IN TRADE
Raw materialsIn hand 991,867 1,703,436 In transit 895,822 499,596
1,887,689 2,203,032
Packing materials 21,244 17,950 Work in process 466,456 102,040Finished goods 109,798 21,918 2,485,187 2,344,940

97
20. TRADE DEBTSNote 2013 2012
-----(Rupees in thousand)-----Unsecured
Considered goodDue from related parties 20.1 & 20.2 75,170 142,267 Others 1,643,199 1,040,845
1,718,369 1,183,112
Considered doubtful others 4,675 5,026
Secured
Considered goodDue from related parties 20.1 & 20.2 5,468 - Others 55,145 21,504
60,613 21,504 1,783,657 1,209,642
Less: Provision for doubtful debts
20.3 (4,675) (5,026)
1,778,982 1,204,616
20.1 Trade debts include the following amounts due from related parties:
Packages Limited 75,170 142,267 Packages Lanka 5,468 -
80,638 142,267
20.2 These are in the normal course of business and are interest free.
20.3 Provision for doubtful debts
Balance at beginning of the year 5,026 332 (Reversal) / provision for the year (351) 4,694 Balance at end of the year 4,675 5,026
20.4 The maximum amount receivable from any related party during the year is Rs 194.577 million (2012: Rs 187.774 million).
20.5 As at December 31, 2013, trade debts of Rs 270.354 million (2012: Rs 153.091 million) were past due but not impaired. These relate to a number of independent customers for whom there is no recent history of default.
The ageing analysis of these trade debts is as follows:
2013 2012-----(Rupees in thousand)-----
Upto 1 - 2 months 66,761 12,186 Upto 3 - 4 months 133,894 90,745Upto 5 - 6 months 47,420 27,759 More than 6 months 22,279 22,401
270,354 153,091

ANNUAL REPORT 201398
Notes to and Forming Part of the Financial StatementsFor the year ended December 31, 2013
20.5.1 Ageing analysis of the amounts due from related parties is as follows:
Upto 1 month 1 to 6 monthsMore than 6
months
As at December 31,
2013
As at December 31,
2012
-----------------------------(Rupees in thousand)----------------------------
Packages Limited 69,660 3,671 1,839 75,170 142,267 Packages Lanka 3,094 2,374 - 5,468 -
72,754 6,045 1,839 80,638 142,267
20.6 As at December 31, 2013, trade receivables of Rs 4.675 million (2012: Rs 5.026 million) were impaired and provided for. The ageing of these receivables is as follows:
Note 2013 2012-----(Rupees in thousand)-----
One year to five years 4,675 5,026
21. ADVANCES AND PREPAYMENTS
Advances, considered good 21.1Due from executives - 4,825 Due from other employees 6,354 1,711
6,354 6,536 Advances to suppliers - considered good 138,248 46,549 Prepayments 5,161 3,457
149,763 56,542
21.1 These advances primarily include car loans and house rent given to executives as per terms of employment. The maximum amounts due at the end of any month during the year from the Chief Executive and other executives were Rs 0.470 million (2012: Rs 0.848 million) and Rs 2.829 million (2012: Rs 4.635 million) respectively.
21.2 For better presentation and to comply with the requirements of Fourth Schedule to the Ordinance, certain balances amounting to Rs 140.532 million which were previously included in ‘Advances, prepayments and other receivables’ as disclosed in the financial statements for the year ended December 31, 2012 have now been reclassified to ‘Other receivables’.
22. OTHER RECEIVABLES 2013 2012-----(Rupees in thousand)-----
Sales tax recoverable 77,747 -Rebate on exports recoverable 29,485 12,552 Security deposit 774 86,722 Others 31,644 41,258
139,650 140,532

99
23. CASH AND BANK BALANCESNote 2013 2012
Cash with banks in -----(Rupees in thousand)-----
Current accountsLocal currency 134,549 200,389 Foreign currency 23.1 1,583 3,028 Cheques in hand 529,162 413,440 Cash in hand 23.1 741 2,015
666,035 618,872
23.1 These include an aggregate amount of Rs 1.942 million (2012: Rs 4.412 million) held in foreign currency.
24. NET SALESNote 2013 2012
-----(Rupees in thousand)-----
Local sales 13,138,838 11,945,742Export sales 712,848 146,842
13,851,686 12,092,584 Less: Sales tax (1,901,605) (1,852,052)
11,950,081 10,240,532 25. COST OF SALES
2013 2012Restated
-----(Rupees in thousand)-----
Opening stock of finished goods 21,918 31,693 Cost of goods manufactured 25.1 10,604,472 8,716,006 Less: Closing stock of finished goods (109,798) (21,918)
10,516,592 8,725,781
25.1 Cost of goods manufactured
Opening stock of work in process 102,040 94,788 Raw materials consumed 25.2 8,670,725 6,765,024 Toll manufacturing charges 36,328 260,633 Salaries, wages and other benefits 372,133 301,328 Fuel, power and water 642,455 650,888 Packing materials consumed 25.3 261,341 210,571 Repairs and maintenance 25.4 140,321 124,334 Insurance 54,385 33,118 Vehicle running and maintenance 27,825 26,437 Travelling 3,675 4,389 Staff retirement benefits 25.5 34,065 3,789 Depreciation 15.1.2 713,430 337,983 Lease rentals 359 - Others 11,846 4,764
11,070,928 8,818,046 Less: Closing stock of work in process (466,456) (102,040)
10,604,472 8,716,006

ANNUAL REPORT 2013100
Notes to and Forming Part of the Financial StatementsFor the year ended December 31, 2013
25.2 Raw materials consumed2013 2012
-----(Rupees in thousand)-----
Opening stock 2,203,032 1,402,758 Purchases 8,355,382 7,565,298 Less: Closing stock (1,887,689) (2,203,032)
8,670,725 6,765,024
25.3 Packing materials consumed
Opening stock 17,950 12,886 Purchases 264,635 215,635 Less: Closing stock (21,244) (17,950)
261,341 210,571
25.4 This includes stores and spares consumed amounting to Rs 57.019 million (2012: Rs 28.456 million).
25.5 This includes Rs 6.732 million (2012: Rs 6.394 million) in respect of contribution to provident fund, Rs 10.813 million (2012: Rs Nil) in respect of pension fund and Rs 8.348 million (2012: Rs 15.103 million) in respect of compensated absences.
26. DISTRIBUTION COSTNote 2013 2012
-----(Rupees in thousand)-----
Salaries, wages and other benefits 49,692 45,802Outward freight 213,944 167,841Travelling 8,255 6,645 Rent, rates and taxes 4,139 3,973 Repairs and maintenance 282 461 Vehicle running and maintenance 2,465 2,185Insurance 1,400 2,492 Staff retirement benefits 26.1 6,921 9,138 Depreciation 15.1.2 3,106 2,786 Lease rentals 181 - Other expenses 3,958 2,267
294,343 243,590
26.1 This includes Rs 1.326 million (2012: Rs 1.292 million) in respect of contribution to provident fund, Rs 2.128 million (2012: Rs Nil) in respect of pension fund and Rs 1.785 million (2012: Rs 2.699 million) in respect of compensated absences.

101
27. ADMINISTRATIVE EXPENSESNote 2013 2012
Restated-----(Rupees in thousand)-----
Salaries, wages and other benefits 109,164 94,072Rent, rates and taxes 6,643 9,302 Printing, stationery and periodicals 6,969 5,788 Postage and telephone 9,242 9,388 Repairs and maintenance 5,000 3,630 Vehicle running and maintenance 3,580 4,095Travelling 4,721 7,192 Insurance 4,833 4,442 Staff training and development 3,551 3,543 (Reversal) / provision for doubtful debts 20.3 (351) 4,694 Staff retirement benefits 27.1 13,478 450 Auditors’ remuneration 27.2 3,405 5,540 Legal and professional expenses 15,576 7,809 Depreciation 15.1.2 17,756 11,439 Amortisation expense 16.1 7,287 10,457 Electricity, gas and water 2,990 2,447 Advertisement 166 206 Donations 27.3 11,232 20,550 Lease rentals 346 - Other expenses 5,734 6,698
231,322 211,742
27.1 Staff retirement benefits include Rs 2.313 million (2012: Rs 2.622 million) in respect of contribution to provident fund, Rs 5.609 million (2012: Rs Nil) in respect of pension fund and Rs 2.935 million (2012: Rs 1.789 million) in respect of compensated absences.
27.2 Auditors’ remuneration2013 2012
-----(Rupees in thousand)-----
Audit fee 1,100 950Review of half yearly accounts, review of statement
of compliance on best corporate practices, audit ofemployees’ retirement funds and other special reviews 980 3,680
Tax services 1,000 600 Out of pocket expenses 325 310
3,405 5,540
27.3 Donations include Rs 10 million (2012: Rs 20 million), Rs 0.250 million (2012: Rs Nil), Rs 0.200 million (2012: Rs Nil) and Rs 0.125 million (2012: Rs Nil) paid to National Management Foundation (NMF), Ali Institute of Education (AIE), Babar Ali Foundation (BAF) and Pakistan Institute of Corporate Governance (PICG) respectively as disclosed in note 39. Syed Babar Ali Esq., and Syed Hyder Ali Esq., the directors of the Company are trustees of NMF. Syed Babar Ali Esq., has the common directorship in the Company, AIE and BAF and Shahid Hussain has common directorship in the Company and PICG.

ANNUAL REPORT 2013102
Notes to and Forming Part of the Financial StatementsFor the year ended December 31, 2013
28. OTHER INCOMENote 2013 2012
-----(Rupees in thousand)-----
Income from financial assetsProfit on bank balances 345 222Realised gain on sale of investment at fair value
through profit or loss - 5,899 345 6,121
Income from assets other than financial assetsProfit on disposal of operating fixed assets 50 1,270 Sale of scrap materials 27,514 21,177
27,564 22,447 Others
Commission earned on insurance premiumfrom a related party 5,966 3,947
Insurance claim from a related party - 301 Exchange gain 14,081 -
20,047 4,248 47,956 32,816
29. FINANCE COST
Mark-up on long term finances 327,728 41,824 Mark-up on short term finances 279,671 93,635 Bank and other charges 6,751 3,624 Exchange loss - 32,291
614,150 171,374
30. OTHER EXPENSES
Workers’ profits participation fund 17,082 43,609 Workers’ welfare fund 6,491 13,732
23,573 57,341
31. TAXATION
Current For the year 31.2 - 235,488 For prior year 1,436 (8,750)
1,436 226,738 Deferred 107,465 54,050
108,901 280,788

103
31.1 Tax reconciliation2013 2012
Restated-----(Rupees in thousand)-----
Profit before taxation 318,057 863,520
Tax @ 34% (2012: 35%) 108,139 302,232
Effect of- Minimum tax 115,012 - - Final tax regime 11,541 6,253 - Tax rebate (120,740) (18,947)- Change in rate adjustment (6,487) -
107,465 289,538 - Prior year charge 1,436 (8,750)
108,901 280,788
Average effective tax rate 34.24% 32.52%
31.2 The investment tax credit amounting to Rs 120.740 million available to the Company by virtue of investment in plant and machinery in accordance with Section 65B of the Income Tax Ordinance, 2001 has been netted off against the current tax charge for the year.
32. STAFF RETIREMENT BENEFITS
Note 2013 2012 2013 2012 Pension Fund Gratuity Fund
Restated Restated -----------------------------(Rupees in thousand)-----------------------------
32.1 The amounts recognized in the balance sheet are as follows:
Present value of defined benefit obligation 32.2.1 50,495 51,083 81,474 62,110 Fair value of plan assets 32.2.2 (49,127) (49,071) (53,599) (43,180)Balance sheet liability December 31 1,368 2,012 27,875 18,930
32.2 Net liability as at January 1 2,012 15,754 18,930 18,540 Charge / (income) to profit and loss account 221 (29,313) 12,253 12,791 (Gain) / loss charged to other comprehensive income (865) 33,146 10,454 1,237 Contribution by the Company - (17,575) (13,762) (13,638)Net liability as at December 31 1,368 2,012 27,875 18,930
32.2.1 The movement in the present value of defined benefit obligation is as follows:
Present value of defined benefit obligation as at January 1 51,083 119,819 62,110 55,581
Service cost - 8,362 10,171 10,473 Interest cost on defined benefit obligation 5,306 14,621 6,832 6,948 Benefits paid (5,691) (5,697) (11,118) (13,031)Losses arising on plan settlements - (32,944) - - Active employees transferred to defined
contribution scheme - (98,210) - - Experience (gain) / loss (203) 45,132 13,479 2,139 Present value of defined benefit obligation as
at December 31 50,495 51,083 81,474 62,110

ANNUAL REPORT 2013104
Notes to and Forming Part of the Financial StatementsFor the year ended December 31, 2013
2013 2012 2013 2012 Pension Fund Gratuity Fund
Restated Restated -----------------------------(Rupees in thousand)-----------------------------
32.2.2 The movement in fair value of plan assets is as follows:
Fair value as at January 1 49,071 104,065 43,180 37,041 Employee contributions - 5,272 - - Contributions made by employer - 17,575 13,762 13,638 Interest income on plan assets 5,085 14,080 4,750 4,630 Active employees transferred to defined
contribution scheme - (98,210) - - Return on plan assets excluding interest income 662 11,986 3,025 902 Benefits paid (5,691) (5,697) (11,118) (13,031)Fair value of as at December 31 49,127 49,071 53,599 43,180
32.2.3 The amounts recognized in the profit and loss account are as follows:
Current service cost - 8,362 10,171 10,473 Actuarial gains in respect of curtailments / settlements - (32,944) - - Interest cost on defined benefit obligation 5,306 14,621 6,832 6,948 Interest income on plan assets (5,085) (14,080) (4,750) (4,630)Employee contributions - (5,272) - -
221 (29,313) 12,253 12,791
32.2.4 Plan assets are comprised as follows:Debt 13,706 26,989 36,575 14,073 Equity 16,556 7,851 13,480 21,635 Cash 18,865 14,231 3,544 7,472
49,127 49,071 53,599 43,180
32.2.5 The sensitivity of the defined benefit obligation to changes in the weighted principal assumptions is:
2013 Pension Gratuity
-----(Rupees in thousand)-----Year end sensitivity analysis on defined benefit obligation:
Discount rate + 100 bps 47,175 73,577 Discount rate - 100 bps 54,290 90,783 Salary increase + 100 bps 54,929 90,658 Salary increase - 100 bps 46,593 73,557
- Average expected remaining working life time of gratuity management employees is 11 years.- Average expected remaining working life time of pension management employees is 7 years.
The above sensitivity analysis are based on a change in an assumption while holding all other assumptions constant. In practice, this is unlikely to occur, and changes in some of the assumptions may be correlated. When calculating the sensitivity of the defined benefit obligation to significant actuarial assumptions the same method (present value of the defined benefit obligation calculated with the projected unit credit method at the end of the reporting period) has been applied.

105
34. REMUNERATION OF THE CHIEF EXECUTIVE, DIRECTORS AND EXECUTIVES
Note 2013 2012Chief
ExecutiveExecutives
Chief Executive
Executives
---------------------(Rupees in thousand)---------------------
Managerial remuneration 7,560 38,447 6,511 31,606 Bonus 2,168 9,600 1,811 8,290 Ex-gratia - - 6,126 - Staff retirement benefits 34.1 1,510 13,853 2,369 11,238 Housing 4,370 27,179 3,792 20,888 Utilities 755 3,816 650 3,137 Leave passage 629 2,915 542 2,614 Medical expenses 118 1,878 72 1,772 Others 127 27,911 903 17,010
17,237 125,599 22,776 96,555
Number of persons 1 36 1 30
34.1 Staff retirement benefits includes amount contributed towards various retirement benefit plans.
34.2 The Chief Executive and other executives are also provided with free use of Company’s maintained cars, residential telephone reimbursement and other benefits.
34.3 Remuneration to non-executive director
Aggregate amount charged in these financial statements for meeting fee to One (2012: One) non-executive director was Rs 325,000 (2012: Rs 50,000).
33. EARNINGS PER SHARE2013 2012
Restated-----(Rupees in thousand)-----
Profit after taxation 209,156 582,732
Number of shares--------(In thousand)--------
Weighted average number of ordinary shares outstanding during the year 30,000 30,000
2013 2012Restated
-----------(Rupees)-----------
Earnings per share 6.97 19.42
33.1 There were no convertible dilutive potential ordinary shares outstanding on December 31, 2013 and 2012.

ANNUAL REPORT 2013106
Notes to and Forming Part of the Financial StatementsFor the year ended December 31, 2013
35. CASH GENERATED FROM OPERATIONSNote 2013 2012
Restated-----(Rupees in thousand)-----
Profit before taxation 318,057 863,520
Adjustments for non-cash charges and other items:
Depreciation 734,292 352,208 Amortisation expense 7,287 10,457 Finance cost 614,150 171,374 Profit on bank balances (345) (222)Gain on investments at fair value through profit or loss - (5,899)(Reversal) / provision for doubtful debts (351) 4,694 Provision for accumulated compensated absences 13,068 19,591 Provision / (reversal) for staff retirement benefits 41,396 (6,215)Profit on disposal of operating fixed assets (50) (1,270)Working capital changes 35.1 (99,981) (1,199,523)
1,309,466 (654,805) 1,627,523 208,715
35.1 Working capital changes
(Increase) / decrease in current assets:
Stores and spares (41,384) 52,070 Stock in trade (140,247) (802,815)Trade debts (574,015) (217,388)Advances and prepayments (93,221) (19,325)Other receivables 882 (102,661)
(847,985) (1,090,119)Increase / (decrease) in current liabilities:
Trade and other payables 748,004 (109,404) (99,981) (1,199,523)
36. CASH AND CASH EQUIVALENTS2013 2012
-----(Rupees in thousand)-----
Short term running finance 13 (1,388,531) (1,165,817)Cash and bank balances 23 666,035 618,872
(722,496) (546,945)

107
37. FINANCIAL INSTRUMENTS BY CATEGORY2013 2012
Restated-----(Rupees in thousand)-----
Financial assets
a) Loans and receivablesLong term deposits 2,999 2,303Trade debts 1,778,982 1,204,616 Advances and prepayments 6,354 6,536 Other receivables 31,644 41,258 Cash and bank balances 666,035 618,872
2,486,014 1,873,585
Financial Liabilities
a) Derivatives used for hedging
Derivative financial instruments 43,871 -
b) Financial liabilities at amortised cost
Long term finances 5,101,924 4,226,924 Trade and other payables 2,654,383 1,912,195 Accrued mark-up 175,042 163,149 Short term borrowings 3,263,531 2,565,817
11,194,880 8,868,085
38. FINANCIAL RISK MANAGEMENT
The Company’s activities expose it to a variety of financial risks: market risk (including interest rate risk, currency risk and price risk), credit risk and liquidity risk. The Company’s overall risk management focuses on the unpredictability of financial markets and seeks to minimise potential adverse effects on the Company’s financial performance.
Risks managed and measured by the Company are explained below:
38.1 Market risk
38.1.1 Interest rate risk
Interest rate risk is the risk that the fair value or future cash flows from a financial instrument will fluctuate due to changes in market interest rates.
The Company’s interest rate risk arises from borrowings which include long term finances (note 7), short term borrowings (note 13) and cash at bank in current accounts (note 23).
At December 31, 2013, if interest rates on borrowings had been 50 basis points higher / lower with all other variables held constant, profit after taxation for the year would have been as follows:

ANNUAL REPORT 2013108
Notes to and Forming Part of the Financial StatementsFor the year ended December 31, 2013
2013 2012At higher
interest rateAt lower
interest rateAt higher
interest rateAt lower
interest rate-----------------------(Rupees in thousand)-----------------------
Finance cost 26,135 (26,135) 21,135 (21,135)Taxation (8,886) 8,886 (7,397) 7,397 Net impact on profit after taxation (17,249) 17,249 (13,738) 13,738
38.1.2 Currency risk
Interest rate risk is the risk that the fair value or future cash flows from a financial instrument will fluctuate due to changes in foreign exchange rates.
Currency risk arises mainly where receivables and payables exist due to transactions entered into foreign currencies. The Company primarily has foreign currency exposures in USD and Euros, cash and cash equivalents, deposits with banks (note 23), trade debts (note 20) in respect of export sales and account payables (note 10) in respect of import of raw materials, stores and spares and plant and machinery. Since the Company’s pricing mechanism is mainly linked to cost of raw materials, therefore, the affects, if any, of any adverse movement in exchange rates in USD can be passed on to the customers to some extent through increase in prices of its finished goods.
As per the Company’s risk management policy, the Company hedges its exposure on firm commitment to purchase property, plant and equipment and stocks.
At December 31, 2013, if the Company’s functional currency (note 2.20) had weakened / strengthened by 5% against the USD with all other variables held constant, profit after taxation for the year would have been higher / lower by Rs 37.026 million (2012: Rs 75.051 million), mainly as a result of foreign exchange losses / gains on translation of financial assets and liabilities denominated in USD.
At December 31, 2013, if the Company’s functional currency (note 2.20) had weakened / strengthened by 5% against the Euro with all other variables held constant, profit after taxation for the year would have been lower / higher by Rs 0.173 million (2012: Rs 4.430 million), mainly as a result of foreign exchange losses / gains on translation of financial assets and liabilities denominated in Euros.
38.1.3 Price risk
Price risk is the risk that the fair value or future cash flows from a financial instrument will fluctuate due to changes in market prices (other than those arising from interest rate risk or currency risk), whether those changes are caused by factors specific to the individual financial instrument or its issuer, or factors affecting all similar financial instruments traded in the market.
38.2 Concentration of credit risk
Credit risk represents the accounting loss that would be recognised at the reporting date if counter parties fail completely to perform as contracted.
Credit risk arises from cash and cash equivalents, deposits with banks as well as credit exposures to customers and other counterparties which include long term deposits, trade debts, advance to employees, rebate on export sales and other receivables. Out of the total financial assets, those that are subject to credit risk amounted to Rs 2,485.273 million (2012: Rs 1,871.570 million). The management of the Company believes that it is not exposed to major concentration of credit risk.

109
Total bank balance of Rs 135.728 million (2012: Rs 203.346 million) has been placed with banks which have a short term credit rating of at least A-1.
A significant component of the receivable balances of the Company relates to amounts due from the local customers. Due to the Company’s long standing business relationships with these counterparties and after giving due consideration to their strong financial standing, management does not expect non-performance by those counter parties on their obligations to the Company. The management continuously monitors the credit exposure towards the customers and makes provision against those balances considered doubtful of recovery.
The Company does not hold any collateral against these assets other than receivable from foreign customers which are secured by way of letter of credits.
38.3 Liquidity risk
Liquidity risk is the risk that an entity will encounter difficulties in meeting obligations associated with financial liabilities. Prudent liquidity risk management implies maintaining sufficient cash, the availability of funding through an adequate amount of committed credit facilities and the ability to close out market positions. The management believes that it will be able to fulfill its financial obligations.
Financial liabilities in accordance with their contractual maturities are presented below:
Contractual cash flows
Less than 1 year
Between 1 to 2 years
Between 2 to 5 years
Between 5 to 10 years
------------------------------(Rupees in thousand)------------------------------
Long term finances 7,467,859 650,708 1,296,206 3,706,596 1,814,349 Accrued mark-up 175,042 175,042 - - - Short term borrowings 3,263,531 3,263,531 - - -Trade and other payables 2,654,383 2,654,383 - - -
13,560,815 6,743,664 1,296,206 3,706,596 1,814,349
38.4 Capital risk management
The Company’s objectives when managing capital are to safeguard the Company’s ability to continue as a going concern in order to provide returns for shareholders and benefits for other stakeholders and to maintain an optimal capital structure to reduce the cost of capital.
In order to maintain or adjust the capital structure, the Company may adjust the amount of dividends paid to shareholders, issue new shares or obtain / repay long term financing from / to financial institutions.
Consistent with others in the industry, the Company monitors capital on the basis of the debt equity ratio. This ratio is calculated as under:
Debt equity ratio = Long term portion of debt divided by long term portion of debt plus total equity.
The Company’s strategy is to maintain the debt equity ratio below 70:30. The debt equity ratios as at December 31, 2013 and 2012 were as follows:

ANNUAL REPORT 2013110
Notes to and Forming Part of the Financial StatementsFor the year ended December 31, 2013
Note 2013 2012Restated
-----(Rupees in thousand)-----
Long term portion of debt 7 4,576,924 4,101,924 Total equity 2,075,185 2,201,890 Total 6,652,109 6,303,814
Debt equity ratio 69:31 65:35
The increase in the debt equity ratio is due to long term financing aggregating Rs 1 billion was obtained and repayments of loan aggregating Rs 125 million were made during the year.
38.5 Fair value of financial instruments
Fair value is the amount for which an asset could be exchanged, or liability settled, between knowledgeable willing parties in an arm’s length transaction. Consequently, differences can arise between the carrying value and fair value estimates. Underlying the definition of fair value is the presumption that the Company is a going concern without any intention or requirement to curtail materially the scale of its operations or to undertake a transaction on adverse terms.
The Company classifies fair value measurements using a fair value hierarchy that reflects the significance of the inputs used in making the measurements. The fair value hierarchy is as follows:
a) Quoted prices (unadjusted) in active markets for identical assets or liabilities (level 1);
b) Inputs other than quoted prices included within level 1 that are observable for the asset or liability, either directly or indirectly (level 2); and
c) Inputs for the asset or liability that are not based on observable market data (that is, unobservable inputs) (level 3).
The estimated fair value of other financial assets and liabilities is considered not significantly different from carrying values as the items are either short term in nature or periodically repriced.

111
39. TRANSACTIONS WITH RELATED PARTIES
The related parties comprise related group companies, staff retirement benefits, directors, key management personnel and close members of the family of directors and key management personnel. The Company in the normal course of business carries out transactions with various related parties.
Significant transactions with related parties are as follows:
Nature of transaction Nature of relationship 2013 2012-----(Rupees in thousand)-----
Purchase of goods and services Associated undertaking 1,960,221 1,516,611
Sale of goods and services Associated undertaking 916,405 819,439
Contributions to staffretirement benefit funds Contribution 42,683 41,521
Dividend Associated undertaking 188,524 377,048
Other income Associated undertaking 5,966 10,448
Donations Associated undertaking 10,575 20,000
Key management personnel Salaries and other benefits tokey management employees 70,307 55,760
Financial assets at fair valuethrough profit or loss
Bonus units received:Nil units (2012: 50,161 units) Associated undertaking - 5,056
Redemptions:Nil units (2012: 2,152,805 units) Associated undertaking - 217,440
- 222,496
The amounts payable to and receivable from related parties have been disclosed in the relevant notes to these financial statements.
40. PLANT CAPACITY AND ACTUAL PRODUCTION2013 2012-----(Metric Tons)-----
Operational capacity 65,800 35,800
Production 44,590 35,770
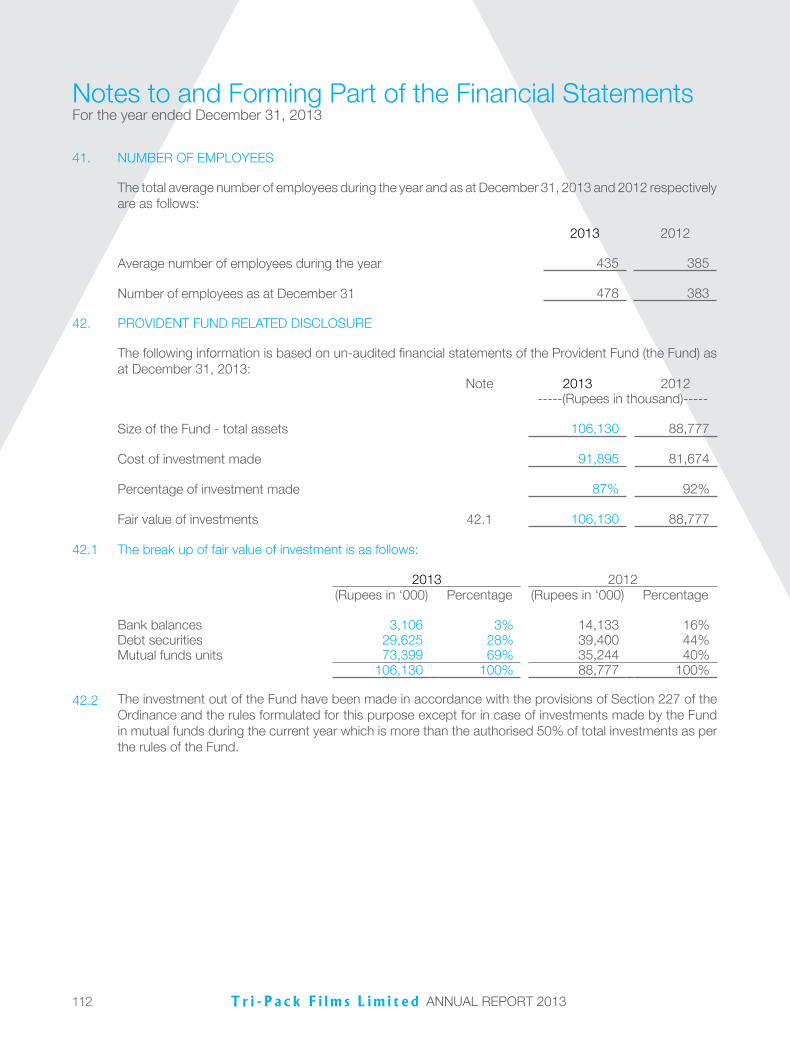
ANNUAL REPORT 2013112
Notes to and Forming Part of the Financial StatementsFor the year ended December 31, 2013
41. NUMBER OF EMPLOYEES
The total average number of employees during the year and as at December 31, 2013 and 2012 respectively are as follows:
2013 2012
Average number of employees during the year 435 385
Number of employees as at December 31 478 383
42. PROVIDENT FUND RELATED DISCLOSURE
The following information is based on un-audited financial statements of the Provident Fund (the Fund) as at December 31, 2013:
Note 2013 2012-----(Rupees in thousand)-----
Size of the Fund - total assets 106,130 88,777
Cost of investment made 91,895 81,674
Percentage of investment made 87% 92%
Fair value of investments 42.1 106,130 88,777
42.1 The break up of fair value of investment is as follows:
2013 2012(Rupees in ‘000) Percentage (Rupees in ‘000) Percentage
Bank balances 3,106 3% 14,133 16%Debt securities 29,625 28% 39,400 44%Mutual funds units 73,399 69% 35,244 40%
106,130 100% 88,777 100%
42.2 The investment out of the Fund have been made in accordance with the provisions of Section 227 of the Ordinance and the rules formulated for this purpose except for in case of investments made by the Fund in mutual funds during the current year which is more than the authorised 50% of total investments as per the rules of the Fund.

113
42.3 The assets of the Fund are managed by the trustees.
43. DATE OF AUTHORISATION
43.1 These financial statements were authorised for issue on February 25, 2014 by the Board of Directors of the Company.
43.2 The Board of Directors have:
- proposed a dividend of Rs “Nil” (2012: Rs 10) per share, amounting to Rs “Nil” (2012: Rs 300 million) for the year ended December 31, 2013 at their meeting held on April 17, 2014 subject to the approval of the members at the annual general meeting to be held on February 25, 2014; and
- approved transfer of unappropriated profit to general reserve amounting to Rs “Nil” (2012: Rs 234 million) for the year ended December 31, 2013.
These financial statements do not recognise the appropriations to dividend as a liability and transfer to general reserves as they have been proposed and approved subsequent to the balance sheet date.
Shahid HussainChief Executive
Syed Hyder Ali Director

ANNUAL REPORT 2013114
Notice is hereby given that the 22nd Annual General Meeting of Tri-Pack Films Limited will be held on Tuesday, April 15, 2014 at 10.30 a.m. at the Beach Luxury Hotel, Moulvi Tamizuddin Khan Road, Karachi to transact the following ordinary business :-
1. To confirm the Minutes of the 21st Annual General Meeting of the Company held on April 17, 2013.
2. To receive and adopt the Audited Financial Statements of the Company for the year ended December 31, 2013 together with the Directors’ and Auditors’ Reports thereon.
3. To appoint Auditors for the year 2014 and to fix their remuneration.
By Order of the Board
Karachi Adi J. CawasjiFebruary 25, 2014 Company Secretary
Notes :
1. The Share Transfer Books of the Company will remain closed from April 1, 2014 to April 15, 2014 (both days inclusive).
2. A member entitled to attend and vote at the meeting may appoint a proxy in writing to attend the meeting and vote on the member’s behalf. A Proxy need not be a member of the Company.
3. Duly completed forms of proxy must be deposited with the Company Secretary at the Registered Office of the
Company at 4th Floor, The Forum, Suite # 416-422, G-20, Block 9, Khayaban-e-Jami, Clifton, Karachi-75600 not later than 48 hours before the time appointed for the meeting.
4. Shareholders (Non-CDC) are requested to promptly notify the Company’s Registrar of any change in their addresses and submit, if applicable to them, the Non-deduction of Zakat Form CZ-50 with the Registrar of the Company M/s FAMCO Associates (Pvt.) Limited, 8-F, Next to Hotel Faran, Nursery, Block 6, P.E.C.H.S., Shahrah-e-Faisal, Karachi-75400. All the Shareholders holding their shares through the CDC are requested to please update their addresses and Zakat status with their Participants. This will assist in the prompt receipt of Dividend.
5. As instructed by the Securities and Exchange Commission of Pakistan (SECP) vide its letter No.EMD/D-II/Misc/2009-1342 dated April 4, 2013 dividend warrants cannot be issued without insertion of CNIC numbers. Therefore, all those shareholders holding physical shares who have not submitted their valid CNICs are requested to send a photocopy of their valid CNIC/National Tax Numbers along with the folio numbers to the Company’s Share Registrar. No future dividend will be payable unless the CNIC Number is printed on the dividend warrants, so please provide the Company with your CNIC Numbers, failing which the Company will not be responsible if it is not able to pay the dividends.
Notice of Annual General Meeting

115
6. In order to make the process of payment of cash dividend more efficient, SECP vide its Circular No.8(4) SM/CDC 2008 dated April 5, 2013 has issued instructions so that the shareholders can get their dividend credited in their respective bank accounts electronically without any delay. The shareholders may, therefore, authorize the Company to credit the dividend directly to their bank account for all future dividends declared by the Company. Accordingly, all non-CDC shareholders are requested to send their bank account details to the Company’s Shares Registrar at the address given above. Shareholders who hold shares with Participant/Central Depository Company of Pakistan Limited (CDC) are advised to provide the mandate to the concerned Stock Broker /Central Depository Company of Pakistan Limited (CDC).
7. Any individual beneficial owner of the Central Depository Company, entitled to vote at this meeting, must bring his/her Computerized National Identity Card (“CNIC”) with him/her to prove his/her identity, and in case of proxy must enclose an attested copy of his/her CNIC. The representatives of corporate bodies should bring attested copy of board of directors’ resolution/power of attorney and/or all such documents required under Circular No.1 dated January 26, 2000 issued by the Securities and Exchange Commission of Pakistan for the purpose.
8. Form of proxy is attached in the Annual Report and should be witnessed by two persons whose names, addresses and CNIC Numbers are mentioned on the forms.

Proxy Form22nd Annual General Meeting
I/We______________________________________________________________________________of _________________________________being a member of Tri-Pack Films Limited and holder of ___________________ Ordinary Shares as per Share Register Folio No.___________________ (Number of Shares) and/or CDC Participant I.D. No.___________ and Sub Account No.___________ hereby appoint __________________ of _____________or failing him/her _____________ of ____________________ or failing him/her ________________of ______________ as my proxy to vote for me and on my behalf at the Annual General Meeting of the Company to be held on Tuesday, April 15, 2014 at 10.30 a.m. at the Beach Luxury Hotel, Moulvi Tamizuddin Khan Road, Karachi and at any adjournment thereof.
Signed this ___________________________day of ___________________________ 2014
WITNESSES: Signature 1. Signature: Name: Address:
CNIC or Passport No:
2. Signature: Name: Address:
CNIC or Passport No:
Note: Proxies in order to be effective, must be received by the Company not less than 48 hours before the meeting. A proxy need not be a member of the Company.
CDC Shareholders and their Proxies are requested to attach an attested photocopy of their Computerized National Identity Card or Passport with this proxy form before submission to the Company.
(Signature should agree with thespecimen signature registeredwith the Company)
Pleaseaffix Rupees fiverevenue stamp

ANNUAL REPORT 2013118
AFFIXCORRECT POSTAGE
The Company Secretary:Tri-Pack Films Limited4th Floor, The Forum, Suite No. 416-422G-20, Block No. 9, Clifton, Khayaban-e-Jami,Karachi-75600, Pakistan.

Registered Office:4th Floor, The Forum, Suite No.416-422G-20, Block No. 9, Clifton, Khayaban-e-Jami, Karachi-75600, Pakistan.Tel: 92 21-3587 4047-49, 3583 1618 Fax: 92 21-3586 0251
www.tripack.com.pk