en.chinacosco.comen.chinacosco.com/chinacosco/uploadfile/20060828111431656.pdf · contents china...
TRANSCRIPT

ANNUAL REPORT 2005
��
��
��
����
�
���
China COSCO Holdings Company Limited12th Floor, Ocean Plaza, 158 Fuxingmennei Street, Beijing,
the People's Republic of China
http://www.chinacosco.com ����� ����� �����

02China COSCO Holdings Company LimitedANNUAL REPORT 2005
Chairman

Contents
China COSCO Holdings Company Limited ANNUAL REPORT 2005
Company Profile
Company Information
Major Events
Financial Highlights
Chairman’s Statement
Management Discussion and Analysis
Directors, Supervisors and Senior Management
Directors’ Report
Report of the Supervisory Committee
Corporate Governence Report
Notice of the Annual General Meeting
Auditors’ Report
Consolidated Balance Sheet
Balance Sheet
Consolidated Income Statement
Consolidated Statement of Changes in Equity
Consolidated Cash Flow Statement
Notes to the Consolidated Financial Statements
Financial Summary
2
3
4
6
9
14
28
37
68
69
81
83
84
86
87
88
90
92
208
The overseas listed flagship
for shipping business of COSCO Group
A major global supplier
of integrated container shipping services
01

02
Company Profile
China COSCO Holdings Company LimitedANNUAL REPORT 2005
China COSCO Holdings Company Limited ( “ChinaCOSCO” or the “Company”, together with itssubsidiaries, the “Group”) was established in thePeople’s Republic of China (the “PRC”) on 3 March2005. It is the overseas listed flagship for shippingbusiness of China Ocean Shipping (Group) Company(“COSCO”, together with its subsidiaries, the “COSCOGroup”), the second largest integrated shippingcompany in the world. China COSCO owns 100% ofCOSCO Container Lines Company Limited (“COSCON”)and approximately 52% of COSCO Pacific Limited(“COSCO Pacific”), a company which is listed on theMain Board of The Stock Exchange of Hong KongLimited (the “Stock Exchange”). The Group is one of theleading global providers of integrated container shippingservices to international and domestic customers. Itsbusiness includes the provision of a wide range ofcontainer shipping, container terminal, container leasing,freight forwarding and shipping agency services acrossthe container shipping value chain. The Company wassuccessfully listed on the Main Board of the StockExchange in Hong Kong on 30 June 2005.
As at 31 December 2005, the Group operated a fleet of124 container vessels through COSCON, with a totalcapacity of 322,000 TEUs, which ranks it amongst thetop ten of all global container vessel fleets in the world.The Group provides container liner shipping services inthe Trans-Pacific route, the Asia-Europe route, the Intra-Asia route, other international routes and domesticroutes in the PRC. The Group’s vessel fleet calls at over120 ports in over 40 countries and regions across the
world, providing integrated container shipping servicesto its customers along 66 international trade lanes, 16international feeder service routes, 9 PRC coastalservice routes and 55 Pearl River Delta and YangtzeRiver feeder service routes. At the same time, the Groupowned 291 sales and service points in major cities in thePRC. It also owned 70 and managed and used 84 salesand service points overseas. The coverage of the abovenetwork enables the Group to provide quality door-to-door services to its customers.
The Group is also engaged in the business of containerterminals, container leasing and logistics servicesthrough COSCO Pacific. As at 31 December 2005, theGroup has invested in 20 terminal projects globally. Thecontainer terminals owned by the Group recorded anannual throughput of approximately 26 million TEUs,which ranks it the fifth in the world. As at 31 December2005, the scale of the Group’s container fleet reached1,042,852 TEUs. The Group’s container leasingbusiness represents about 11% of the market share,ranking it the third in the world. In addition, the Groupowns 16.23% of China International Marine Containers(Group) Co., Ltd. (“CIMC”). CIMC is the world’s largestcontainer manufacturer, representsing over 50% of themarket share.
Being the overseas listed flagship of COSCO Group forshipping business, with its market experience and globaladvantage, China COSCO is heading towards thedirection of becoming a leading integrated shippingservices enterprise in the world.

03
Company Information
China COSCO Holdings Company Limited ANNUAL REPORT 2005
Registered OfficeOcean Plaza, 12th Floor
158 Fuxingmennei Street
Beijing 100031, PRC
Place of Business in Hong Kong49th Floor, COSCO Tower
183 Queen’s Road Central
Hong Kong
Board of DirectorsWEI Jiafu (Executive Director, Chairman and CEO)
ZHANG Fusheng
(Non-executive Director and Vice Chairman)
CHEN Hongsheng
(Executive Director and President)
WANG Futian (Non-executive Director)
LI Jianhong (Non-executive Director)
MA Zehua (Non-executive Director)
MA Guichuan (Non-executive Director)
SUN Yueying (Non-executive Director)**
LIU Guoyuan (Non-executive Director)
LI Boxi (Independent Non-executive Director)
TSAO Wen King, Frank
(Independent Non-executive Director)
HAMILTON Alexander Reid
(Independent Non-executive Director)*
CHENG Mo Chi
(Independent Non-executive Director)**
* Chairman of Audit Committee
** Member of Audit Committee
Joint Company SecretariesZHANG Yongjian
YEUNG Chun Wai, Anthony
Authorised RepresentativesCHEN Hongsheng
YEUNG Chun Wai, Anthony
Qualified AccountantYEUNG Chun Wai, Anthony
AuditorsPricewaterhouseCoopers
Major BankersBank of China
Industrial and Commercial Bank of China
China Merchants Bank
Legal AdviserPaul, Hastings, Janofsky & Walker
Hong Kong H Share Registrar and TransferOfficeComputershare Hong Kong Investor Services Limited
Units 1712-1716
17th Floor, Hopewell Centre
183 Queen’s Road East
Wanchai, Hong Kong
Websitehttp://www.chinacosco.com

04
Major Events
China COSCO Holdings Company LimitedANNUAL REPORT 2005
2005
March China COSCO was established in Beijing.
April COSCO Pacific signed a joint venture heads of agreement to establish a joint venture to constructand operate a container terminal at Nansha Port Phase II.
COSCON was awarded “The Best Shipping Line (China Trade)” by Cargonews China.
COSCON signed a construction contract for four of the world’s largest container vessels (10,000TEUs) with Nantong COSCO KHI Ship Engineering Co., Ltd.. The first vessel is expected to bedelivered in 2008.
COSCO Pacific was selected as one of the Forbes Global 2000 Enterprises in 2005.
May COSCON was awarded five awards in The Fourth China Shipping Industry Awards in 2004,namely (i) the “Best Shipping Company Golden Wheel Prize”, (ii) “China to the US (west and eastcoast) service”, (iii) “China to Europe service”, (iv) “China to Korea service” and (v) “Coastal service(Pan Asia)” for its integrated shipping services. Its subsidiary, COSCO International FreightCompany Limited, was awarded the “Best Freight Forwarding Service Company Gold Prize”.
COSCO Pacific signed a joint venture contract to acquire a 20% equity interest in Nanjing LongtanContainer Limited. The joint venture company commenced operation on 26 August.
COSCON was named “The 2005 Best Carrier for Fast East/East Canada service” by CanadianInternational Freight Forwarders’ Association (CIFFA). This was COSCON’s fourth consecutive yearof winning the same award.
June China COSCO (1919.HK) was listed and commenced trading on the Stock Exchange.
July China COSCO has been officially added to FTSE China Index, FTSE Asia Pacific Index (excludingJapan, Australia and New Zealand), FTSE All-world Index, FTSE Global Emerging Market Index,FTSE/Hang Seng Asian Cyclical Index, and Xinhua FTSE QDII Hong Kong Index.
August Shanghai Pan Asia Shipping Company Limited signed a building contract in relation to nine 200TEUs container vessels with Chongqing Dongfeng Ship Industry Company.
11 container vessels owned by COSCON was named “Quality Vessels of the 21st Century” in theUS.
Wei Jiafu, Chairman of China COSCO, was elected again the Chairman of China Shipowners’Association by unanimous vote at the members’ meeting of China Shipowners’ Association.
September China COSCO was officially added to Hang Seng China Enterprises Index.
COSCO Pacific signed an agreement with Ningbo Port Group Ltd. to form joint venture companyto develop Berth Number 7 of Beilun Container Terminal Phase IV. COSCO Pacific owns 20% ofthe equity interest in the joint venture.
COSCON and COSCO International Freight Co., Ltd. (COSFRE) jointly invested and incorporatedCOSCO South-China International Freight Co., Ltd. in Shenzhen to consolidate the marketingentities in the Southern China region and Hong Kong.

05China COSCO Holdings Company Limited
ANNUAL REPORT 2005
October Wei Jiafu, Chairman of China COSCO, was awarded the “Achievement Award in Shipping” by therenowned shipping and trading association in the US, International Propeller Club. It was the firsttime for International Propeller Club, since its establishment in 1927, to confer this award to theCEO of a shipping company outside the US.
COSCON, K-Line and Hanjin Shipping jointly commenced operation of the South China- MiddleEast express service.
COSCO Pacific was named the “Best Practices in Investor Relations among Asian ComprehensiveEnterprises” and “Best Practices in Investor Relations among Chinese Enterprises” by aninstitutional investor magazine.
November COSCON, Evergreen Marine Corp and Hapag-Lloyd Container Line strengthened theircooperation by consolidating the Far East/Red Sea service and providing direct service forSouthern China.
COSCON was awarded “Shipping Line of the Year” in Asia Logistics Awards 2005 organized byINFORMA Group, publisher of Lloyd’s List, an authoritative media in the shipping industry.
COSCON, K-Line, Yang Ming and Hanjin Shipping convened a meeting and determined that thefocus of the strategic plans for 2006 is to consolidate strategic alliance and enhancecompetitiveness.
Wei Jiafu, Chairman of China COSCO, was awarded a medal by the King of Belgium forrecognising his outstanding contributions to Belgium’s economic development and traderelationship between China and Belgium.
COSCO Logistics Co., Ltd. came first amongst the “Top 100 China Logistics Companies” for thesecond consecutive year.
December The opening ceremony of Yangshan port of Shanghai International Shipping Centre was held inPhase 1 of Yangshan Port. COSCON’s vessel, MV “COSCO CHINA”, with 8,204 TEUs,participated in the ceremony.
COSCO Pacific signed a joint venture agreement to acquire Phase II of Shanghai Yangshan Port.COSCO Pacific owns 10% of the equity interest in the joint venture.
COSCO Pacific signed an agreement to acquire a 20% interest in the Suez Canal ContainerTerminal S.A.E. in Egypt.
Wei Jiafu, Chairman of China COSCO, was elected the “2005 CCTV China Economic Figure ofthe Year”.

06
Financial Highlights
China COSCO Holdings Company LimitedANNUAL REPORT 2005
2005 2004
RMB’000 RMB’000 Change
Turnover 39,165,710 32,188,669 21.7%
Operating profit 7,054,873 5,045,716 39.8%
Profit before income tax 7,450,250 5,243,300 42.1%
Profit attributable to equity holders of the Company 5,450,805 4,157,960 31.1%
Basic earnings per share (RMB) 1.06171 1.01414 4.7%
Final dividend per share (RMB) 0.13 N/A N/A
Dividend payout ratio 29.8% N/A N/A
Total assets 51,675,654 44,249,567 16.8%
Total liabilities 25,730,562 30,847,045 -16.6%
Minority interests 7,508,740 5,953,318 26.1%
Equity attributable to the equity holders of the Company 18,436,352 7,449,204 147.5%
Net debt to equity ratio 32.9% 96.6% N/A
Gross profit margin 21.9% 20.0% N/A

Chairman WEI JIAFU

08China COSCO Holdings Company LimitedANNUAL REPORT 2005
What is the “China Factor”? In Beijing, the urban map is being re-drawn soswiftly that road signs can hardly keep up with the new roads andbuildings. In the global shipping market, large quantity of containers areshipped from China to countries all around the world. This is a sign of thehuge impact of China’s economic growth on the global economy, andnowhere is this impact deeper than in the area of global shipping. As globalcompetition intensifies, the demand for Chinese manufacturing will shiftfrom quantity to quality, which in turn creates more opportunities for China’slogistics and shipping services. The future of the China Factor will put newpressure on global shipping companies to create innovative services andimprove service quality to meet the needs of their customers in the contextof global competition.
The China Factor has led the international shipping industry into a new era.With globalisation and outsourcing trend, China will consolidate its positionof being the “Factory of the World”. And yet, the China Factor faces manychallenges as well, ranging from high oil prices to international terrorismand protectionism. These make it imperative for shipping companies toimprove both the capacity and quality of its shipping services to meet themarket demand, to build global alliances across the shipping industry andto establish a more harmonious atmosphere for dialogue with theircounterparts in the industry, the governments, and the investors.
Going forward, China COSCO will strengthen her leading position inthe global shipping industry as it utilises the opportunities of theChina Factor.
08China COSCO Holdings Company LimitedANNUAL REPORT 2005

09
Chairman’s Statement
China COSCO Holdings Company Limited ANNUAL REPORT 2005
CHAIRMAN’S STATEMENT
In 2005, the world’s shipping market kept up its
momentum and spectacular growth after setting a
record high in 2004, while the “China Factor” continued
to power the industry’s development in China and
around the world. Meanwhile, the combined effect of
globalisation and the shifting of production bases to
Asia has provided a solid foundation for the steady
growth of the shipping market in China. As one of the
world’s leading providers of integrated container
shipping services, the Group is well positioned to
benefit from the strength of China’s domestic economy
and international trade. This is due to its fully-integrated
container shipping value chain, the positive synergy
among its diversified businesses, its quality customer
base, its worldwide network of sales and services, as
well as its advanced information technology systems.
The Group achieved impressive business growth in
2005. During the year, the turnover was
RMB39,165,710,000 and profit attributable to equity
holders of the Company was RMB5,450,805,000, an
increase of 21.7% and 31.1% respectively, exceeded
the profit forecast made when China COSCO was
listed in June 2005. In particular, COSCON, a wholly-
owned subsidiary of China COSCO and the largest
container shipping company in China, attained very
outstanding results in 2005. COSCON recorded a total
container shipping volume of 4,534,610 TEUs and a
total turnover of RMB31,959,809,000, an increase of
19.7% and 17.0% respectively over 2004. The Group’s
container terminal business, which is conducted
through COSCO Pacific, continued to grow rapidly. In
2005, the Group’s container terminals handled a total
throughput of 26,079,612 TEUs, an increase of 16.2%
over 2004. The Group’s container leasing business is
conducted through Florens Container Holdings Limited
(“Florens”). As of 31 December 2005, Florens owned
and managed a container fleet of approximately
1,042,852 TEUs. Its world ranking of being the fourth
largest container company has been promoted to the
third place in 2005.
In line with the long-term development strategy of the
Group, the Board has recommended payment of a final
dividend of RMB0.13 per share (pre-tax) based on the
payout rate indicated in the China COSCO’s listing
prospectus of 29.8%.
2005 was a very significant year for China COSCO in its
corporate history. In the first half of the year, the Group
completed its asset restructuring and was successfully
listed on the Stock Exchange. The listing exercise
enabled us to expand the capacity, to improve the age
and structure of our container vessel fleet, to enhance
our “door-to-door” service platform and to further
optimise our capital structure. All in all, it provided a
strong support to the business development of the
Group.
During the year under review, the Group has
successfully made integration to the value chain of
container shipping, giving full synergic effect among the
various business entities, and enhancing the Group’s
overall capabilities against market risks. In respect of
container shipping, the Group further reduced its
operation risks through various measures such as

010
Chairman’s Statement
China COSCO Holdings Company LimitedANNUAL REPORT 2005
futures trading by which the Group has been able to
reduce its operation costs and mitigate impact brought
about by oil price risks. In addition, in order to expand
the Group’s market share in the shipping market, while
paying attention on the emerging market opportunities,
the Group also promoted on the formation of global
feeder network. During the year, the Group also
continued to enhance information management and
overall level of management, so as to create more
values to customers.
The Group firmly believes that a sound framework of
corporate governance is the cornerstone for the
sustainable growth of its business value. Currently, the
Company retains four independent non-executive
directors, which is above the requirement set out in the
Rules Governing the Listing of Securities on The Stock
Exchange of Hong Kong Limited (the “Listing Rules”).
Besides, the Board has set up five board committees
and an executive committee. The board committee will
help the Board evaluate, review and recommend
development strategies and risk management
measures, monitor and safeguard the independence of
external auditors, and review the nomination of
directors and the relevant remuneration policies, etc.
The executive committee will approve the investment
projects of the Group in accordance with the authority
granted by the Board. China COSCO also aimed at
continuously improving and enhancing its risk
management and internal control procedures so as to
promptly respond to and resolve any potential risk.
opening new shipping services, re-designing the
existing shipping services and adjusting the allocations
of capacities of the various services. At the same time,
the Group has strengthened the coverage and
competitiveness of CKYH Consortium, a consortium
consisting of COSCON, K-Line, Yang Ming and Hanjin
Shipping. For example, CKYH Consortium has
confirmed in the meeting held on 3 November 2005
that the focus of the strategic plan in 2006 will be to
consolidate the strategic alliances and strengthen
competitiveness. CKYH Consortium not only provides
cooperation in the main-routes, but will also expand the
cooperation scope to the joint establishment of feeder
service network. In respect of container terminals, the
Group has continued its global expansion strategy, and
has entered into major joint venture and acquisition
agreements in respect of Guangzhou Nansha Port
Phase II terminal, Shanghai Yangshan Port Phase II
terminal and Suez Canal Terminal at Port Said, Egypt.
In respect of container leasing, the Group further
explored markets and expanded the strengths of its
container fleets through strategic cooperation
partnership with various large shipping companies, and
port operators. In respect of logistics business, on the
basis of continuous consolidation of its brand
advantages, the Group has made further in-depth
development into the target markets, integrated
resources and enhanced the level of its operations.
At the same time, the Group also dedicated in reducing
its operation costs, and capitalising on various
measures such as centralised purchases of fuel and

011China COSCO Holdings Company Limited
ANNUAL REPORT 2005
According to the forecast of the World Bank and the
International Monetary Fund, etc., the global economy
will maintain its steady growth in 2006 and the growth
rate will be similar to that of 2005. 2006 is the first year
for the implementation of the PRC government's
"Eleventh Five-year Plan". We believe that, in the
context of China's continued industrialisation and
urbanisation, as well as the upcoming Beijing Olympics
in 2008, China will continue to realise high economic
growth. Hence, the Group believes that China is likely
to uphold its position as the world's factory and
maintain the substantial growth in its imports and
exports. According to the "Eleventh Five-year Traffics
Technology Development Rule" announced by the
Ministry of Communications in China, the throughput of
China's ports was 4,910,000,000 tons and the
throughput of containers was 75,800,000 TEUs in
2005, which ranked China as number one in the world
in three consecutive years. It is expected that, during
the next five years period, the throughput of China's
coastal ports and the throughput of containers will
realise an average of 8.0% and 12.2% annual growth
respectively. Therefore we believe that the global
demand for container shipping, as well as for container
terminals and the ancillary facilities and services, will
continue to increase. The Group stands to benefit
under such a favorable outlook.
Against this exciting backdrop, however, we are aware
of the challenges ahead. From 2005 till now, rising
crude oil prices, the revaluation of the Renminbi, market
skepticisms on the demand and supply equilibrium of
the global shipping industry, as well as the restructuring
within the industry aroused concerns from the
investment market. As one of the world's major
providers of integrated container shipping services, the
Group is fully prepared to develop strategies to
enhance its operating efficiency. We also intend to
adopt necessary measures to reduce the effects
associated with rising oil prices and Renminbi
appreciation. Meanwhile, supported by the positive
global economic prospects and the "China Factor", it is
our belief that the industry's demand and supply will be
relatively balanced in the coming years.
Going forward, we will continue to increase our
competitiveness to become one of the world's leading
global integrated shipping companies in terms of
business scale, range of services, profitability and
customer satisfaction. To this end, we will continue to
improve our information systems and cost-control
measures. We will also continue to optimise our
container vessel fleet capacity and our shipping route
and terminal networks and services to enhance our
"door-to-door" services. Accordingly, we aim to further
improve customer satisfaction and increase our
profitability so as to create better shareholder value.
Looking back to our achievements in the past year, I
would like to take this opportunity to express the
Board’s gratitude to our shareholders, customers,
employees and business partners for their generous
and unfailing support to the Group. In the future, we

012
Chairman’s Statement
China COSCO Holdings Company LimitedANNUAL REPORT 2005
look forward to working more closely with all of you to
create an even stronger marine fleet, an even wider
shipping network and an even more flexible logistics
system. I believe that China COSCO is heading towards
to become the world’s leading shipping enterprise and
will play its role to the full as the overseas listed flagship
for shipping business of the COSCO Group. Let us
anticipate even more brilliant prospects for the Group in
the international shipping market.
WEI Jiafu
Chairman
11 April 2006


014
Management Discussion and Analysis
China COSCO Holdings Company LimitedANNUAL REPORT 2005
Review of Overall Performance
Benefiting from the favorable conditions in the global
economy and international shipping, the Group’s
business segments which include container shipping,
container terminals, container leasing, freight
forwarding and shipping agency services, etc. had
grown rapidly during the year. The Group’s gross
turnover for 2005 was RMB39,165,710,000,
representing an increase of 21.7% over 2004. Its profit
before income tax and profit attributable to equity
holders of the Company were RMB7,450,250,000 and
RMB5,450,805,000, representing an increase of 42.1%
and 31.1% over 2004 respectively. The substantial
increase in the Group’s profit, as compared with last
year, was due to the continuous growth in shipping and
port handling volume and revenue, reasonable control
of the costs, better utilisation of resources and
enhanced information management.
Review of Operations
Container Shipping Business
Rapid Growth in Shipping Volume and Turnover
In 2005, the Group’s container shipping business
achieved a shipping volume of 4,534,610 TEUs,
representing an increase of 19.7% on a year-to-year
basis. All major routes, including Trans-Pacific, Asia-
Europe, Intra-Asia and China routes achieved growth,
of which Asia-Europe was the most obvious, with a
growth rate reaching 31.7%. The next was China
routes, which had reached a growth rate of 25.1%. The
increase in shipping volume for container shipping
business in 2005 was due to the fact that the shipping
market continued the good momentum from 2004.
Moreover, the Group had timely increased its number of
ships and strength in solicitation activities. The Group
also increased its shipping capacities, added new
services and increased its existence in emerging
markets.
The turnover of the Group’s container shipping
business in 2005 amounted to RMB31,959,809,000,
representing a growth of 17.0% on a year-to-year basis
over the previous year. Trans-Pacific, Asia-Europe,
Intra-Asia, other international routes and China routes
had achieved growth. Among them, Asia-Europe and
China routes had achieved the best performed growth,
reaching 24.5% and 29.2% respectively. The increase
in turnover from container shipping business was due
to the increase in shipping volume on major routes,
details of which are shown in the following tables:

015China COSCO Holdings Company Limited
ANNUAL REPORT 2005
Shipping volume by markets
For the year ended 31 December
2005 2004 Change
TEUs TEUs %
Trans-Pacific 1,183,899 1,000,360 18.3
Asia-Europe (including the Mediterranean) 1,002,561 761,013 31.7
Intra-Asia (including Australia)* 1,392,828 1,214,578 14.7
Other international (including Trans-Atlantic) 240,873 241,369 -0.2
PRC 714,449 571,132 25.1
Total 4,534,610 3,788,452 19.7
* 2005 and 2004 figures include the shipping volume handled by Coheung Marine Shipping Company Limited
Turnover by markets
For the year ended 31 December
2005 2004 Change
RMB’000 RMB’000 %
Trans-Pacific 12,527,188 10,680,016 17.3
Asia-Europe (including the Mediterranean) 9,154,183 7,354,971 24.5
Intra-Asia (including Australia) 5,935,908 5,352,822 10.9
Other International (including Trans-Atlantic) 2,573,389 2,270,638 13.3
PRC 1,480,948 1,146,609 29.2
Sub-total 31,671,616 26,805,056 18.2
Chartered out 288,193 514,787 -44.0
Total 31,959,809 27,319,843 17.0

016
Management Discussion and Analysis
China COSCO Holdings Company LimitedANNUAL REPORT 2005
Optimisation of the trunk routes network
In line with market development and customer
demand, the Group undertook an innovative
reorganisation of its services on trunk east-west routes.
Together with its CKYH Consortium, COSCON further
consolidated and optimised their shipping services to
European/US destinations to further enhance their
service quality and coverage and reduce the risks and
costs of routes development. In the Trans-Pacific
routes, the Group enlarged the service coverage of the
Pacific Northwest route by directly calling at the ports of
Busan and Portland. In addition, the Group reorganised
its European services, and introduced a new loop.
Besides, COSCON also cooperated with Hanjin and K
Line in introducing a new service between South China
and the Persian Gulf.
Development of emerging markets
Through the co-operation with other shipping
companies, COSCON made an aggressive effort in
developing emerging markets. During the year, utilising
the opportunity in reorganising its European shipping
services, Kuala Lumpur was added as a calling port, in
order to focus on the development in the South Asian
subcontinent market. Since April, the US East Coast
biweekly service began to call at Panama, marking
COSCON’s entry to the Caribbean market. The South
China — Red Sea service was reopened in response to
the demand of the Red Sea market brought by the
addition of Jeddah port to the reorganised European
routes. In addition, COSCON introduced a series of
feeder services on the Southeast Asia — Australia,
Hong Kong — Manila , the Naples — Adriatic Sea,
India — Pakistan, and the intra-Bohai routes. The
above global feeder service network enhanced the
Company’s development of the emerging markets.
110,000 TEUs were added through the development of
emerging markets with a revenue of RMB620 million in
2005.
Enhancement of shipping capacity
Our container ship fleet is an essential component of
our competitive edge. To expand its market share and
satisfy the shipping demand of its newly developed
markets, the Group added 9 new vessels with a
combined shipping capacity of 39,240 TEUs during the
year. As of 31 December 2005, the Group had a total
of 124 vessels with an aggregate capacity of 322,414
TEUs, representing an increase of 8% over the previous
year. In addition, the Group recalled certain vessels on
short-term leases to make available the most resources
to cope with the demand in the peak season. As a
result, its available shipping spaces achieved an
increase of 14% over the previous year.
As of 31 December 2005, the Group had an orderbook
of 23 vessels with a combined shipping capacity of
about 180,000 TEUs, which are expected to
commence operation in the next few years. Among the
vessels, 11 are time chartered vessels with a combined
shipping capacity of 79,733 TEUs. The strategies for
the fleet include constantly increasing the proportion of
large-size vessels, in order to enhance the fleet
structure. In the first half of the year, the Group entered
into contracts with Hyundai Heavy Industries and
Nantong COSCO KHI Ship Engineering Co., Ltd. for
the building of a total of eight 10,000 TEU vessels,
making it the first company in the shipping industry to
order vessels of such size.

017China COSCO Holdings Company Limited
ANNUAL REPORT 2005
Improvement of information systems and networks
The Group leveraged advanced information technology
to further build up its efficient customer service system.
In 2005, COSCON further advanced its e-commerce
service by introducing various interactive service
features, including online booking, online shipping
instructions, online printing of bill of lading, electronic
equipment release and online arrival advice. Besides, a
self-service interactive voice response system was
launched in China. The above services have given
tremendous convenience to the global customers of
COSCON, thereby enhancing its service branding and
corporate image.
In line with its business development, the Group
focused on promoting integrated business information
system, IRIS-2, in emerging markets and regions in
which it actively pursues business expansion. Besides,
further steps were taken to improve the features of the
management information system to enable the full
performance of its functions in improving yield
management and reducing costs.
To support the enlarged shipping capacity of the
Company, the Group established 16 additional points of
sales and services globally. Efforts were also made to
reorganise its sales network in the South China region
in order to enhance the Group’s service quality and
market share in the area.
Stringent Cost Controls
The Group reduced the proportion of transshipment
cargoes by optimal route-planning and increasing the
proportion of direct port-calling. It also actively adjusted
the structure of the cargo base. These had resulted in a
reduction of transshipment costs. Meanwhile, the
Group implemented dynamic management of shipping
spaces to maintain a high utilisation rate and improve
the control of the flow of orders. The Group also
effectively lowered the cost on containers by raising the
utilisation rate and reducing the turnaround time.
Besides, IRIS-2 system was used for cost control
which has saved service cost substantially.
The Group had also redesigned the arrangement of
shipping routes, schedules and speeds of ships in
order to minimise the voyage costs.
In addition, the Group also improved its cost control on
fuel procurement. Coupled with the adoption of
centralised procurement and futures trading, the Group
managed to reduce its fuel costs to below market
levels. Owing to the synergy effect resulting from
business integration, the Group also strengthened its
bargaining power and restrained the rate of increase in
port charges.
Business Strategies
In 2006, the Group will further expand its share of the
existing markets, while stepping up its efforts in
developing emerging markets. On the one hand, the
Group will actively utilise the vessels which will be
delivered in 2006 to advance the shipping capacity of
its trunk routes, in order to enlarge its market share in
the European and US markets. On the other hand, it
will actively focus on developments in the emerging
markets to promote the formation of global feeder
service network. At the same time, the Group will
further develop its information systems and adopt
innovative digital marketing initiatives. Under a more
customer-oriented marketing strategy, the Group will
further segmentise its customers in order to formulate

018
Management Discussion and Analysis
China COSCO Holdings Company LimitedANNUAL REPORT 2005
more personalised sales strategies and enhance its
services for high value customers.
Container Terminal Business
In 2005, the Group’s container terminal business, which
is operated through COSCO Pacific, maintained strong
growth momentum, with its total throughput achieving
an annual growth of 16.2% to 26,079,612 TEUs.
During the year, the overall performance of the
container terminal business in China was outstanding,
with growth in their aggregate throughput reaching
16.1%. The performance was particularly brilliant for
Qingdao Qianwan Terminal and Yingkou Terminal in the
Bohai Rim, Yangzhou Yuanyang Terminal and
Zhangjiagang Win Hanverky Terminal in the Yangtze
River Delta, COSCO-HIT Terminal and Yantian Terminal
Phases I, II & III in the Pearl River Delta. Specifically, the
total throughput of the container terminals in the Bohai
Rim grew to 9,370,361 TEUs, representing an annual
growth of 25.2%. As for the container terminals in the
Yangtze River Delta, their total throughput rose to
6,831,502 TEUs, representing an annual growth of
6.1%. The total throughput of the container terminals in
the Pearl River Delta grew by 15.6% year on year to
9,196,652 TEUs.
In respect of the overseas market, the total throughput
of the container terminals of the Group grew by 19.1%
to 681,097 TEUs. Due to the growth in the throughput
of the Singapore Port and the improvement in the
operating efficiency of the terminals, the throughput of
the COSCO-PSA Terminal increased by 6.8% to
611,013 TEUs. As for the European market, the
Antwerp Terminal commenced operation in September
2005.
During the year, by way of acquiring shares in new
terminals and investing in the construction of new
berths in its existing terminals, the Group further
consolidated its global business network. Currently,
certain projects are pending government approvals. For
the year, 30 new berths were added, increasing the
total number of berths of the Group to 100.
019China COSCO Holdings Company Limited
ANNUAL REPORT 2005
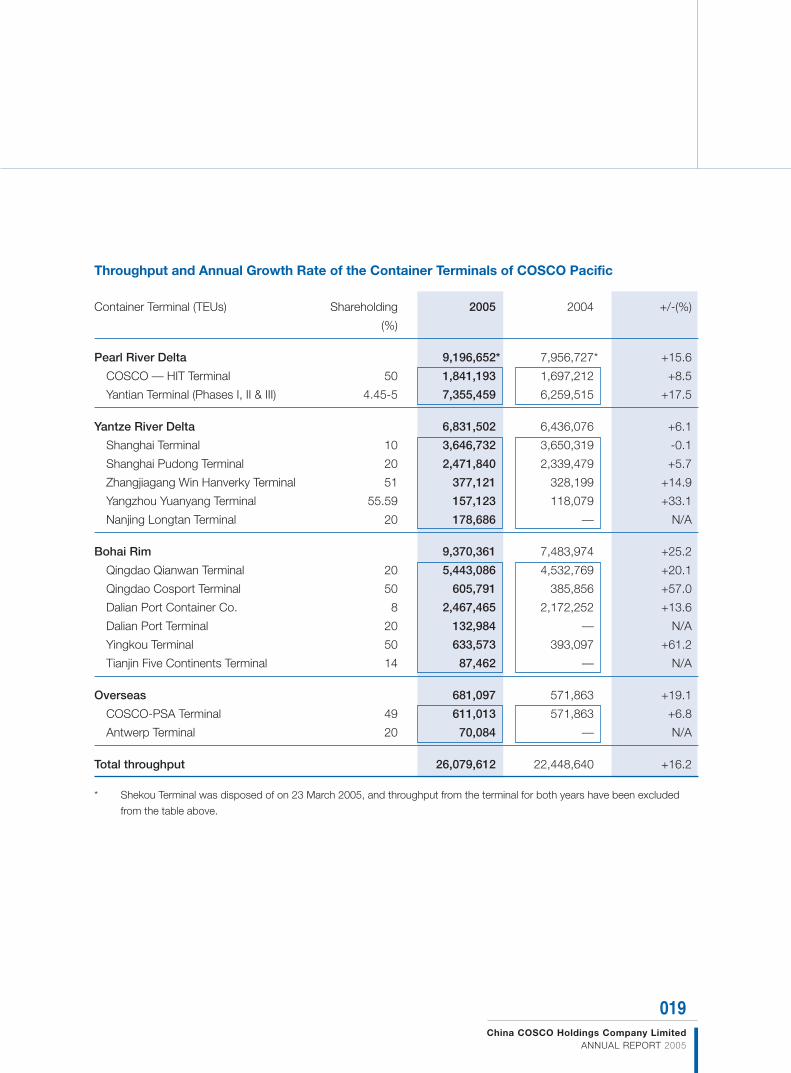
Throughput and Annual Growth Rate of the Container Terminals of COSCO Pacific
Container Terminal (TEUs) Shareholding 2005 2004 +/-(%)
(%)
Pearl River Delta 9,196,652* 7,956,727* +15.6
COSCO — HIT Terminal 50 1,841,193 1,697,212 +8.5
Yantian Terminal (Phases I, II & III) 4.45-5 7,355,459 6,259,515 +17.5
Yantze River Delta 6,831,502 6,436,076 +6.1
Shanghai Terminal 10 3,646,732 3,650,319 -0.1
Shanghai Pudong Terminal 20 2,471,840 2,339,479 +5.7
Zhangjiagang Win Hanverky Terminal 51 377,121 328,199 +14.9
Yangzhou Yuanyang Terminal 55.59 157,123 118,079 +33.1
Nanjing Longtan Terminal 20 178,686 — N/A
Bohai Rim 9,370,361 7,483,974 +25.2
Qingdao Qianwan Terminal 20 5,443,086 4,532,769 +20.1
Qingdao Cosport Terminal 50 605,791 385,856 +57.0
Dalian Port Container Co. 8 2,467,465 2,172,252 +13.6
Dalian Port Terminal 20 132,984 — N/A
Yingkou Terminal 50 633,573 393,097 +61.2
Tianjin Five Continents Terminal 14 87,462 — N/A
Overseas 681,097 571,863 +19.1
COSCO-PSA Terminal 49 611,013 571,863 +6.8
Antwerp Terminal 20 70,084 — N/A
Total throughput 26,079,612 22,448,640 +16.2
* Shekou Terminal was disposed of on 23 March 2005, and throughput from the terminal for both years have been excluded
from the table above.

020
Management Discussion and Analysis
China COSCO Holdings Company LimitedANNUAL REPORT 2005
During the year, the Group adjusted the development
strategy for its terminal operations in the Pearl River
Delta. In order to consolidate its financial resources and
the geographic advantage of the Pearl River Delta,
COSCO Pacific disposed of its 17.5% equity interest in
Shekou Container Terminals Ltd. Immediately
afterwards, COSCO Pacific signed a joint venture
agreement in respect of Nansha Port Phase II in
Guangzhou, thereby acquiring a 59% equity interest in
the joint venture company. Besides, COSCO Pacific
also signed a joint venture agreement in respect of 4
berths in Yangshan Port Phase II in Shanghai, thereby
acquiring a 10% equity interest in the joint venture
company. In its another major acquisition during the
year, COSCO Pacific signed a share purchase
agreement in respect of a 20% equity interest in the
Suez Canal Terminal at Port Said, Egypt, further
reinforcing the solid strengths of COSCO Pacific as a
global container terminal operator.
The policy of the Group is to fully utilise each
investment opportunity and speed up globalisation
process. The continued success of COSCO Pacific’s
container terminal business is attributable to its strategy
of cooperation and is closely related to the strategic
alliance relationship it has formed with the world’s major
shipping companies and operators. On the other hand,
COSCO Pacific will benefit from the global shipping
network of COSCON to implement a high growth, high
returns development strategy for its container terminal
operations. It is expected that the terminals recently
acquired or completed and commenced operation will
give an additional boost to the total container
throughput of COSCO Pacific in 2006.
Container Leasing Business
The Group’s container leasing business is conducted
through Florens, a wholly-owned subsidiary of COSCO
Pacific. In 2005, Floren’s ranking among the global
container leasing companies rose from the fourth to the
third, with a worldwide market share of approximately
10.9%, which was higher than that of 10.1% in 2004.
The number of customers of Florens also expanded
from 218 in 2004 to 256 in 2005, while its fleet grew by
13.5% to 1,042,852 TEUs.
In 2005, the container leasing business grew steadily,
benefiting from the strong growth of international trade
and the increased market share of the Group, with
turnover increasing by 6.4% and amounting to
RMB2,262,976,000. It is expected that in 2006, with
the commissioning of 1,220,000 TEUs of new vessels
capacity being made available for use in the container
shipping market, the demand for containers will
increase further to the advantage of the container
leasing industry.

021China COSCO Holdings Company Limited
ANNUAL REPORT 2005
Freight Forwarding, Shipping Agency and Logistics
Business
The Group’s freight forwarding and shipping agency
business is operated by certain PRC and overseas
subsidiaries of COSCON, which are mainly engaged in
providing supporting services to COSCON and in
assisting the company in strengthening its cost control.
The freight forwarding and shipping agency business of
the Group achieved rapid growth, reaching a turnover
of RMB8,202,784,000, representing an annual growth
of 39.1% over 2004. This was attributable to not only
the increase in the cargo volume handled, but also the
introduction of more value-added services to the
customers, thereby driving the continued rapid growth
in revenues. In addition, revenues received from newly
established subsidiaries around the world also
contributed to the growth in revenues.
Meanwhile, COSCO Logistics, with number one
ranking in China and in which the Group owns 49%
equity interest through COSCO Pacific, substantially
lifted the standards of the door-to-door service of the
Group by way of business integration.
Other Businesses and Investments
The Group holds shares, through
COSCO Pacific, in 4 container
manufacturing enterprises, namely CIMC
(approximately 16.23%), Shanghai CIMC
Reefer Containers Co., Ltd.
(approximately 20.0%), Shanghai CIMC
Far East Container Co., Ltd.
(approximately 20.0%), and Tianjin CIMC
North Ocean Container Co., Ltd. (approximately
22.5%). In 2005, these companies contributed
RMB480,886,000 in net profit to COSCO Pacific.
Among them, approximately 16.23% shareholding of
CIMC, the acquisition of which was completed by
COSCO Pacific in December 2004, contributed
RMB455,645,000 in net profit to COSCO Pacific for the
first time in 2005.
Financial Analysis
Turnover
In 2005, the turnover of the Group was
RMB39,165,710,000, representing an increase of
RMB6,977,041,000 or 21.7% as compared with the
amount of RMB32,188,669,000 in 2004. During the
year, growth was recorded in all business segments of
the Group.
(I) Container Shipping Business
Turnover from the container shipping business
increased by RMB4,639,966,000 to

022
Management Discussion and Analysis
China COSCO Holdings Company LimitedANNUAL REPORT 2005
RMB31,959,809,000, or 17.0%, in 2005. The
rapid growth was sustained by the high freight
rates and the sharp increase of 19.7% in shipping
volume.
(II) Container Terminal Business
Turnover from the container terminal business
increased by 2.7% to RMB158,351,000. This was
mainly because, Zhangjiagang Win Hanverky
Container Terminal Co., Ltd., a container terminal
of the Group, aggressively expanded its domestic
shipping business and successfully increased its
throughput by 14.9%, resulting in an increase of
its turnover by 13.1% to RMB102,340,000, as
compared to RMB90,498,000 in 2004.
(III) Container Leasing Business
During the year, the demand for containers in the
shipping market was stable, and the average
utilisation rate of the Group was maintained at a
relatively high level. In addition, the Group made
an aggressive effort in expanding its container fleet
for international customers to 665,528 TEUs
(2004: 591,283 TEUs), resulting in a 8.8%
increase in the rental income from international
customers. Meanwhile, the rental income from the
intra-group leasing to the container shipping
segment also rose by 3.6%. As a result of the
above two factors, the turnover of the container
leasing and related businesses of the Group grew
by 6.4% to RMB2,262,976,000.
(IV) Freight Forwarding and Shipping Agency Business
The Group’s turnover generated from the freight
forwarding and shipping agency business in 2005
increased by RMB2,304,396,000 to
RMB8,202,784,000, representing an annual
increase of 39.1%. The growth was attributed to
the increase in the container cargo volume
handled.
Cost of services
The Group’s total cost of services increased by
RMB4,838,065,000, or 18.8%, from
RMB25,752,985,000 in 2004 to RMB30,591,050,000
in 2005, which was proportional to the increase in
turnover and revenues. In particular, the increase of the
cost of services was comparatively higher for the
container shipping, freight forwarding and shipping
agency businesses.
(I) Container Shipping Business
The total cost of services for the container
shipping business increased to
RMB23,335,778,000 in 2005, representing an
increase of 15.0%, as compared with or
RMB20,284,178,000 in 2004.
• In 2005, the total costs of equipment and
cargo transportation were
RMB12,814,112,000, representing an
increase of 3.7% as compared with the
amount in 2004. The Group increased its
strength in cost controls and the costs in
equipment and cargo transportation rise at a
slower pace than with shipping volume which
in turn have reduced the unit cost for
equipment and cargo transportation.
• In 2005, the total voyage costs were
RMB6,437,517,000, representing an
increase of 48.1% as compared with
RMB4,347,640,000 of the corresponding
023China COSCO Holdings Company Limited
ANNUAL REPORT 2005
period in 2004. This was mainly attributable to
the increase in fuel costs and port charges. Oil
prices rose continuously in 2005, coupled with
the increase of shipping capacity and number
of voyages, resulting in fuel costs substantially
higher than the previous year and, which
represents an increase of 61.6% over the
previous year. In addition, the Company has
increased shipping capacity whereby large
new vessels were deployed on the Trans-
Pacific and Asia-Europe routes. The increase
in vessel tonnage and number of voyages
resulted an increase in port charges of 21.6%
in 2005 as compared to the corresponding
period of the pervious year. Fuel costs and
port charges are the two factors contributing
the substantial increase in voyage costs of this
year over the previous year.
• Vessel costs were RMB4,084,149,000,
representing an increase of 14.0% or
RMB501,889,000 as compared with RMB
3,582,260,000 in 2004, which was mainly due
to the increase in vessels and is lower than the
increase in the total shipping costs and
shipping volume.
(II) Container Terminal and Container Leasing Businesses
The costs of services for the container terminal
business of the Group mainly comprise container
handling costs, depreciation charges, repairs and
maintenance costs, and wages. The costs of
services for the container terminal business was
RMB91,299,000 in 2005, representing an increase
of 13.4% over 2004, mainly due to the proportional
increase in the handling volume.
The costs of services for the container leasing
business primarily comprise depreciation charges
and container handling expenses, such as depot
costs and repairs and maintenance costs. In 2005,
the costs and expenses of the container leasing
business were RMB857,620,000, which were
RMB5,241,000 less as compared to the amounts
of RMB862,861,000 in 2004. The increase in the
number of containers this year led to an increase in
depreciation charges. However, this factor was
partly offset by the decrease in operating costs for
the containers, which in turn were due to the high
container utilisation rates maintained throughout
the year.
(III) Freight Forwarding and Shipping Agency Business
The costs of services for the freight forwarding and
shipping agency businesses (including land
transportation and other related transportation
charges and fees paid to third party carriers)
increased by 39.4% to RMB6,306,353,000 in
2005. The increase was due to the rapid increase
in shipping and transportation volume.
Other gains
Other gains of the Group includes dividend income from
available-for-sale financial assets, interest income, gain/
loss on interest rate swap contracts, and gain/loss on
foreign exchange. In 2005, other gains of the Group
amounted to RMB179,427,000, representing a decrease
of RMB107,483,000 or 37.5% as compared to the
amount of RMB286,910,000 in 2004. In particular,
dividend income was RMB145,149,000, which
represents a decrease of RMB36,374,000 from 2004.
Certain business segments of the Group settled their
accounts in currencies other than the US dollar. Owing

024
Management Discussion and Analysis
China COSCO Holdings Company LimitedANNUAL REPORT 2005
to fluctuations in exchange rates, a loss on foreign
exchange of RMB171,628,000 was recorded.
Meanwhile, interest income for the year increased by
RMB126,037,000 to RMB173,277,000 primarily due to
the increase in bank balances.
Other operating income
Other operating income in 2005 amounted to
RMB1,026,456,000, representing an increase of
RMB477,372,000, or 86.9%, over 2004. This was
mainly due to the gain on disposal of the investment in
Shekou Terminals of RMB512,117,000 during the year.
Selling, administrative and general expenses
Selling, administrative and general expenses increased
by RMB620,512,000 (or 33.3%) from
RMB1,861,681,000 in 2004 to RMB2,482,193,000 in
2005. This was principally due to increase in staff costs
resulting from an expansion in the freight forwarding and
shipping agency network and expenses incurred for the
restructuring and listing exercises.
Other operating expenses
Other operating expenses in 2005 amounted to
RMB243,477,000, representing a decrease of
RMB120,804,000, or 33.2%, over 2004. This was
mainly due to the decrease in sale of returned containers
during the year as compared to 2004.
Finance costs
The Group’s finance costs increased by
RMB228,633,000, or 35.7%, from RMB639,760,000 in
2004 to RMB868,393,000 in 2005. Due to the increase
of interest rates, the Company’s borrowing costs have
increased. Furthermore, the Group obtained additional
US dollar loans due to the restructuring prior to its listing.
New borrowings were also raised to finance the capital
expenditure during the year. As a result, there was a
corresponding increase in interest expense.
Share of profits less losses of jointly controlled
entities and associates
Net profit contribution from jointly controlled entities in
2005 amounted to RMB601,852,000, representing an
increase of 7.3% as compared to the amount of
RMB560,731,000 in 2004. In particular, Qingdao
Qianwan Container Terminal Co., Ltd. contributed a net
profit of RMB173,835,000, representing an increase of
36.3% over 2004. The results of COSCO Logistics Co.,
Ltd. had grown 7% in 2005 comparing to that of 2004
together with cessation of goodwill amortisation in 2005,
contributed profit of RMB123,373,000 to COSCO
Pacific.
Net profit contribution from associates amounted to
RMB661,918,000, representing a 139.3% increase as
compared to the amount of RMB276,613,000 in 2004.
CIMC, which became an associate of the Group at the
end of last year, made a profit contribution of
RMB455,645,000 (2004: not applicable) for the year.
Antwerp Gateway NV, in which the equity interest was
acquired at the end of last year, recorded a loss of
RMB10,684,000 due to its start-up operation.
Income tax expenses
The Group’s taxation increased from RMB285,757,000
in 2004 to RMB651,319,000 in 2005. The significant
increase was on the one hand, due to the lower tax
charge in 2004 resulting from the utilisation of previously
unrecognised tax losses, and on the other hand, the
higher income tax payable by the Group due to the

025China COSCO Holdings Company Limited
ANNUAL REPORT 2005
growth in profits of the subsidiaries in the PRC and
overseas countries.
On 15 September 2005, pursuant to the Domestic
Enterprise Income Tax Concession Policy of Pudong
New District, the Shanghai Local Tax Office granted its
approval to COSCON that, effective from 1 January
2005, the enterprise income tax rate payable by
COSCON is reduced to 15%.
Financial position
Cashflows
The Group’s principal sources of liquidity and capital
resources are cash flows generated from operations,
listing proceeds and bank loans. Apart from the
proceeds raised from the initial public offering, cash
inflows from operating activities of the Group remained
stable.
The Group’s net cash generated from operating activities
increased by RMB714,514,000, from
RMB5,437,803,000 in 2004 to RMB6,152,317,000 in
2005. The Group’s operating profit before changes in
working capital in 2005 was RMB7,894,012,000, an
increase of RMB1,326,953,000 from that of 2004.
Net cash used in investing activities in 2005 of
RMB7,615,297,000 was primarily used to purchase
property, plant and equipment, such as containers,
container vessels, computers and office equipments
totalling RMB5,820,152,000 and there was a payment
of RMB2,874,478,000 in settlement of the consideration
payable to a subsidiary of COSCO. Meanwhile, the
Group received RMB649,536,000 in proceeds from the
disposal of Shekou Terminals as well as a total of
RMB841,680,000 in dividends from its jointly controlled
entities, associates and available-for-sale financial
assets.
The Group received RMB4,811,772,000 in net cash
from financing activities during 2005. On 30 June 2005,
a total of 2,244,000,000 H shares, with a nominal value
of RMB1.00 (consisting of 2,040,000,000 new shares
and 204,000,000 shares converted from domestic
shares), were issued at HK$4.25 each and were fully
paid in cash. The Group’s financial position was
significantly improved as a result of the receipt of net
proceeds of RMB8,817,797,000 from the issuance of
shares by the Company.
Cash and cash equivalents
As at 31 December 2005, the Group’s cash and cash
equivalents totalled RMB8,147,375,000, representing an
increase of RMB3,252,843,000, or 66.5%, as compared
to the amount of RMB4,894,532,000 as at 31
December 2004. Of the amount, RMB2,159,856,000
was the remaining balance of proceeds from the share
issue as at 31 December 2005.
The Group’s principal sources of liquidity and capital
resources have been, and are expected to continue to
be, cash flows generated from operating activities, the
issuance of new shares and debt financing from banks.
The Group’s principal uses of cash have been, and are
expected to continue to be, for operational costs,
repayment of loans, purchase of container vessels and
containers, investment in container terminals and the
funding of the Group’s digital information technology
systems.
026
Management Discussion and Analysis
China COSCO Holdings Company LimitedANNUAL REPORT 2005
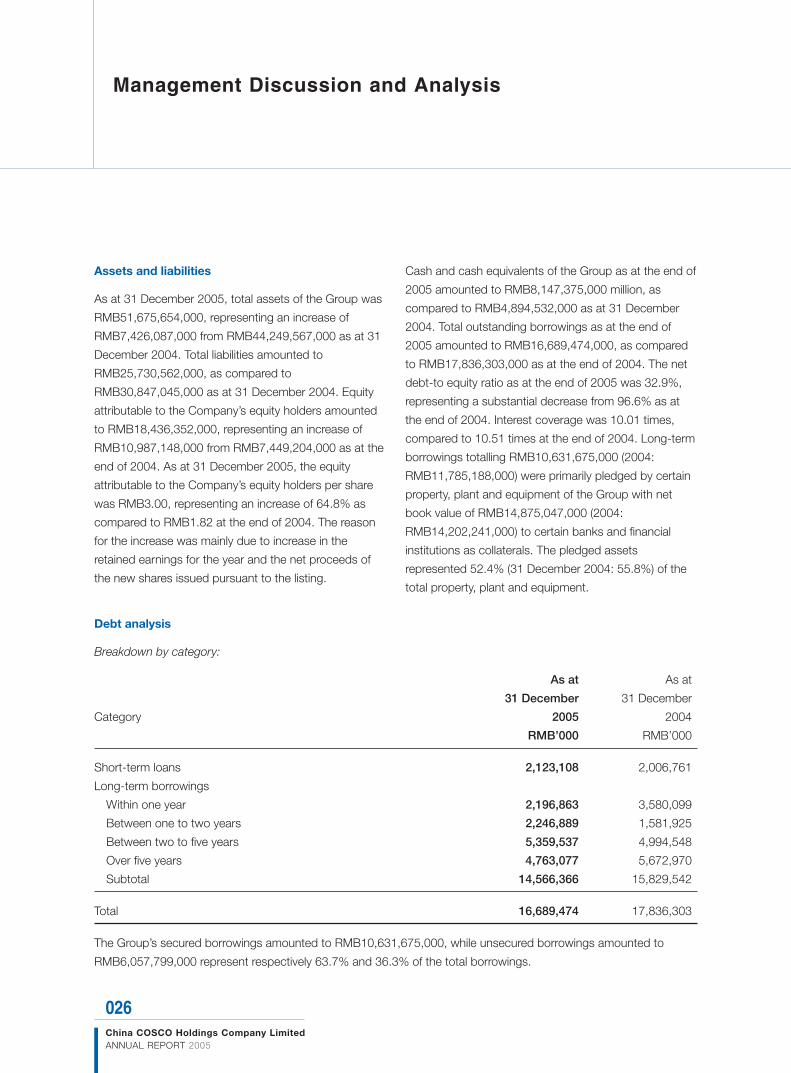
Debt analysis
Breakdown by category:
As at As at
31 December 31 December
Category 2005 2004
RMB’000 RMB’000
Short-term loans 2,123,108 2,006,761
Long-term borrowings
Within one year 2,196,863 3,580,099
Between one to two years 2,246,889 1,581,925
Between two to five years 5,359,537 4,994,548
Over five years 4,763,077 5,672,970
Subtotal 14,566,366 15,829,542
Total 16,689,474 17,836,303
The Group’s secured borrowings amounted to RMB10,631,675,000, while unsecured borrowings amounted to
RMB6,057,799,000 represent respectively 63.7% and 36.3% of the total borrowings.
Assets and liabilities
As at 31 December 2005, total assets of the Group was
RMB51,675,654,000, representing an increase of
RMB7,426,087,000 from RMB44,249,567,000 as at 31
December 2004. Total liabilities amounted to
RMB25,730,562,000, as compared to
RMB30,847,045,000 as at 31 December 2004. Equity
attributable to the Company’s equity holders amounted
to RMB18,436,352,000, representing an increase of
RMB10,987,148,000 from RMB7,449,204,000 as at the
end of 2004. As at 31 December 2005, the equity
attributable to the Company’s equity holders per share
was RMB3.00, representing an increase of 64.8% as
compared to RMB1.82 at the end of 2004. The reason
for the increase was mainly due to increase in the
retained earnings for the year and the net proceeds of
the new shares issued pursuant to the listing.
Cash and cash equivalents of the Group as at the end of
2005 amounted to RMB8,147,375,000 million, as
compared to RMB4,894,532,000 as at 31 December
2004. Total outstanding borrowings as at the end of
2005 amounted to RMB16,689,474,000, as compared
to RMB17,836,303,000 as at the end of 2004. The net
debt-to equity ratio as at the end of 2005 was 32.9%,
representing a substantial decrease from 96.6% as at
the end of 2004. Interest coverage was 10.01 times,
compared to 10.51 times at the end of 2004. Long-term
borrowings totalling RMB10,631,675,000 (2004:
RMB11,785,188,000) were primarily pledged by certain
property, plant and equipment of the Group with net
book value of RMB14,875,047,000 (2004:
RMB14,202,241,000) to certain banks and financial
institutions as collaterals. The pledged assets
represented 52.4% (31 December 2004: 55.8%) of the
total property, plant and equipment.

027China COSCO Holdings Company Limited
ANNUAL REPORT 2005
Breakdown by denomination:
The Group had US dollar borrowings equivalent to
RMB15,780,374,000 and RMB borrowings amounting
to RMB909,100,000 represent respectively 94.6% and
5.4% of the total borrowings.
Contingent liabilities
As at 31 December 2005, the Group had provided
guarantees on a bank borrowing granted to an associate
in the amount of RMB176,899,000 (31 December 2004:
RMB Nil). The claim amounts of the pending lawsuits
totalled at RMB32,656,000. Except for the above and
information disclosed in the Group’s consolidated
financial statements, the Group had no other significant
contingent liabilities.
Foreign exchange and interest rate risks management
In accordance with the requirements of HKAS21, the
management of the Group has determined to adopt US
dollar as the functional currency in view of the fact that
the business activities of the Company and its
subsidiaries mainly operate in such places where the US
dollar is used for transaction purposes. Besides, it is
considered that, given the status of the US dollar in the
international financial market, such arrangement will help
minimise the impact of fluctuations in exchange rates on
the profitability of the Group which might otherwise arise
where the local currency is used as the functional
currency.
The Group controlled the foreign exchange risk by
conducting borrowings as far as possible in currencies
that match the Group’s functional currency used for
transacting the assets and cash receipts of the Group’s
core businesses. Borrowings for the container leasing
business were mainly loans in US dollars, which
matched well with the US dollar revenues and expenses
of the leasing business, minimising any potential foreign
exchange exposure.
In respect of the financing activities of jointly controlled
entities and associates, such as COSCO-HIT Terminal,
COSCO-PSA Terminal and Antwerp Terminal, all material
borrowings were denominated in the respective
functional currencies to minimise the Group’s exposure
to the exchange risks of these investments.
During the year, the Group continued to exercise
stringent control and monitoring mechanisms over the
use of financial derivatives for hedging against its interest
rate risks.
The Group also monitored and adjusted its debt portfolio
of fixed and floating interests from time to time to reduce
market rate risks.
028
Directors, Supervisors and Senior Management
China COSCO Holdings Company LimitedANNUAL REPORT 2005
DIRECTORS
The Company has two executive directors, seven non-executive directors and four independent non-executive
directors. There is no family relationship between any of the directors, the supervisors or senior management of the
Group.
WEI Jiafu(魏家福)
Mr. Wei, aged 56, is currently an executive director, the chairman and CEO of the Company. He joined the COSCO
Group in 1967 and has been the president of COSCO since November 1998. He joined the Group in 1997. He has
been the chairman of COSCO HK and COSCON since 2000. He became an executive director and the chairman of
COSCO Pacific in 2000, and was redesignated as a non-executive director and the chairman in 2005, in which role
he will continue to be responsible for formulating the company’s overall strategy and policy. Mr. Wei is the chairman of
the board of COSCO Investment (Singapore) Limited and COSCO International. He had been the general manager of
Sino-Tanzania Joint Shipping Company, president of COSCO Holding (Singapore) Pte Ltd, managing director of
COSCO Tianjin and COSCO Bulk Carrier Co. Limited. He joined the Company in March 2005. With nearly 40 years
experience in navigation and international shipping business, Mr. Wei, a former marine captain, has excellent business
decision-making capability and substantial capital markets experience. During his office as the president of COSCO
Holding (Singapore) Pte Ltd in 1993, COSCO Investment (Singapore) Limited successfully became the first overseas
listed company of COSCO. Under the leadership of Mr. Wei, both COSCO Pacific and COSCO Investment
(Singapore) Limited have become overseas blue chip listed companies. His strategic view and world vision in his
outstanding leadership has continuously enhanced the sustainable development of COSCO. Mr. Wei is also chairman
of China Shipowners’ Association, chairman of China Group Companies Promotion Association, chairman of China
Federation of Industrial Economics, director of the Board of Boao Forum for Asia, and advisor of the Panama Canal
Authority. Mr. Wei obtained his Doctorate from Tianjin University and his Master of Transportation Planning and
Management degree from Dalian Maritime University. He is also a senior engineer. In 1999, he was awarded the
honour of special contribution to the State. He was elected into the 16th CPC Central Committee for Discipline
Inspection in 2002.

029China COSCO Holdings Company Limited
ANNUAL REPORT 2005
ZHANG Fusheng(張富生)
Mr. Zhang, aged 56, is currently a non-executive director and the vice chairman of the Company. He joined the
COSCO Group and the Group in 1999 and has been an executive vice president and the secretary of the CPC sub-
committee of COSCO in 2002. He was appointed as a director of COSCON in 2002. He was an executive director of
COSCO Pacific from 2003 to 2005. He had been a deputy director of the No.1 division of Tianjin Port Authority,
deputy director of personnel and labour department of MOC, director of institutional reform and regulatory
department of MOC (spokesman of MOC), and vice president of the Beijing branch of Bank of Communications. He
became the secretary of the CPC sub-committee of COSCON and COSCO Shanghai in 1999. Mr. Zhang joined the
Company in March 2005. He has over 30 years of experience in administration and management of shipping
companies, and also has experience in financial management and business operation. An expert in management with
wide exposure in managing different companies within the COSCO Group during his career, Mr. Zhang has
demonstrated outstanding leadership qualities throughout the course of development of the COSCO Group. Mr.
Zhang obtained a Master degree in transportation management and engineering from Wuhan University of
Communications Science and is a senior engineer. In 2003, Mr. Zhang was elected a member of the 10th National
People’s Congress of the PRC.
CHEN Hongsheng(陳洪生)
Mr. Chen, aged 56, is currently an executive director and the president of the Company. Mr. Chen joined the COSCO
Group in 1975 and has been an executive vice president of COSCO since 1998. Although he is an executive vice
president of COSCO, following his appointment as an executive director and the president of the Company, Mr. Chen
no longer oversees other areas in COSCO but will spend his full efforts and time in directing and supervising the
Group’s affairs. Mr. Chen joined the Group in 1997 and has been an executive director of COSCO Pacific since 2003
and a director of COSCON since 2004. He had been the deputy general manager of Penavico Nantong Branch
Company, general manager of shipping department of Penavico, general manager of COSCO Beijing International
Freight Forwarding Company, deputy managing director of COSCO International Freight Forwarding Co., Ltd., deputy
general manger of COSCO Container Lines, managing director of COSCO International Freight Forwarding Co., Ltd.,
deputy managing director of COSCON, chairman of COSCO Shipping Co., Ltd (its A shares listed on Shanghai Stock
Exchange). He joined the Company in March 2005. Mr. Chen is one of the experienced experts engaging in the
container shipping and logistics business at its initial stage in the PRC. He has 30 years of experience in shipping
industry with extensive experience in enterprise operation and management. Mr. Chen is currently a vice chairman of
China Enterprise Confederation and China Enterprise Directors Association. Mr. Chen graduated from Sichuan
Foreign Language College and Capital University of Economics and Business in postgraduate studies in business
administration. He is a senior economist.

030
Directors, Supervisors and Senior Management
China COSCO Holdings Company LimitedANNUAL REPORT 2005
WANG Futian(王富田)
Mr. Wang, aged 56, is currently a non-executive director of the Company. He joined the COSCO Group in 1976. In
2004, he became an executive vice president of COSCO. He joined the Group in 1997 and became the chairman of
the supervisory committee of COSCON in 2000. He has been a director of COSCON since 2004. He was an
executive director of COSCO Pacific from 2003 to 2005. In 1987, he became a member of the senior management of
Dalian Ocean Shipping Company. He became a member of the senior management of COSCO in 1992. Mr. Wang
has been the Chief Legal Counsel of COSCO since March 2005. Mr. Wang was a former marine captain and has 30
years of experience in the shipping industry and extensive experience in corporate operation and management. Mr.
Wang graduated from Dalian Maritime University, majoring in navigation and Capital University of Economics and
Business in postgraduate studies in business administration. He is a senior engineer.
LI Jianhong(李建紅)
Mr. Li, aged 49, is currently a non-executive director of the Company. He joined the COSCO Group in 1989 and
became an executive vice president of COSCO in 2000. He joined the Group in 1997 and was appointed an
executive director of COSCO Pacific. He had been the general manager of Nantong Shipyard and managing director
of COSCO Industry Co., Ltd. and COSCO Property Ltd., assistant president and chief commercial officer of COSCO.
Mr. Li is also the chairman of CIMC. He joined the Company in March 2005. Mr. Li has over 20 years of experience in
corporate management and over 10 years of experience in shipping enterprise management. He has extensive
experience in capital markets and asset management. Mr. Li graduated from the University of East London in the
United Kingdom with a Master of Business Administration degree and holds a Master of Business Administration
degree from Jilin University. He is a senior economist.
MA Zehua(馬澤華)
Mr. Ma, aged 53, is currently a non-executive director of the Company. He joined the COSCO Group in 1977 and
became an executive vice president of COSCO in 2001. He was an executive director of COSCO Pacific from 2003
to 2005. He was the deputy manager of the transportation division of COSCO, general manager of COSCO UK Co.,
Ltd., general manager of business development division and assistant president of COSCO, the president of COSCO
North America Inc., deputy managing director of COSCO Guangzhou and managing director of Qingdao Ocean
Shipping Company. He joined the Company in March 2005. Mr. Ma has nearly 30 years of experience in the shipping
industry and extensive experience in management and operation of shipping companies. Mr. Ma graduated from
Shanghai Maritime University with a Master of International Laws degree. He is a senior economist.

031China COSCO Holdings Company Limited
ANNUAL REPORT 2005
MA Guichuan(馬貴川)
Mr. Ma, aged 51, is currently a non-executive director of the Company. He joined the COSCO Group in 1978 and
was the Chairman of the union of COSCO in 1998. He had been involved in the management of Qingdao Ocean
Shipping Company for many years and became the person-in-charge of Qingdao Ocean Mariner’s College in 1994.
From 2001 to 2003, he became a standing committee member of CPC committee and deputy mayor of Yinchuan,
Ningxia. He joined the Company in March 2005. Mr. Ma has nearly 30 years of experience in the shipping industry
and extensive experience in ship and crew management. In 2003, Mr. Ma was elected an executive committee
member of the 14th national representatives congress of All-China Federation of Trade Unions. Mr. Ma graduated
from Dalian Maritime University majoring in engineering management and Capital University of Economics and
Business in postgraduate studies in administration business.
SUN Yueying(孫月英)
Ms. Sun, aged 47, is currently a non-executive director of the Company. She joined the COSCO Group in 1982 and
has been the chief financial officer of COSCO since 2000. She joined the Group in 2000. She has been a director of
COSCON in 2000 and an executive director of COSCO Pacific in the same year. She was appointed as a director of
COSCO HK in 2002. She was the vice director of the finance department of Tianjin Ocean Shipping Co., the finance
manager of COSCO Japan Co., Ltd, the general manager of the finance and capital division of and the deputy chief
financial officer of COSCO. She joined the Company in March 2005. Ms. Sun has over 20 years of experience in the
shipping industry and extensive experience in corporate financial management. Ms. Sun graduated from Shanghai
Maritime University majoring in shipping finance and accounting. She is a certified accountant and a senior
accountant.
LIU Guoyuan(劉國元)
Mr. Liu, aged 54, is currently a non-executive director of the Company. Mr. Liu joined the COSCO Group in 1975 and
has been an executive director and the vice chairman and president of COSCO HK since 2000. He joined the Group
in 2000. He is currently the vice chairman of the board of COSCO International, the chairman of COSCO (H.K.)
Shipping Company Limited, COSCO (Hong Kong) Industry & Trade Holdings Limited, COSCO Network Ltd., COSCO
(HK) Property Development Ltd. and COSCO Net Beijing Limited. Mr. Liu had been the chief economist of COSCO
Group, deputy managing director of COSCO Tianjin and president of COSCO Europe GmBH. He joined the
Company in March 2005. Mr. Liu has over 30 years of experience in the shipping industry and extensive experience
in corporate management, shipping operation management and investment management. Mr. Liu obtained the
Masters of Laws degree from the Law School of the University of Washington, U.S.. He is a senior economist.

032
Directors, Supervisors and Senior Management
China COSCO Holdings Company LimitedANNUAL REPORT 2005
LI Boxi(李泊溪)
Ms. Li, aged 70, is currently an independent non-executive director of the Company. Ms. Li was a senior researcher,
an executive member and head of the development forecast division of the Development Research Center of the
State Council of the PRC. She had long been involved in research of corporate strategy. Ms. Li was elected as a
member of the 7th and 8th National People’s Congress of the PRC. She is currently the chairman of the committee of
the global competitive organisation, a part-time professor of Nan Kai University and the chief strategic development
consultant of the China Housing Industry Association. She is among the first group awarded the title of special
contribution expert to the State. Ms Li was appointed as an independent non-executive director in June 2005.
TSAO Wen King, Frank(曹文錦)
Mr. Tsao, aged 80, is currently an independent non-executive director of the Company. He has many years of
experience in the shipping industry, and is the founder of IMC Holdings Ltd (“IMC”). He had been the executive
chairman of IMC since 1966. From 1995 to 1997, Mr. Tsao assumed the position of honorary chairman of IMC. Mr.
Tsao is also a non-executive director of Asia Financial Holdings Ltd., a listed company in Hong Kong, and a director
of a number of Hong Kong companies. Currently, he serves as the chairman of Hong Kong Shipowners Association
and Suntec City Development Pte Ltd.. Mr. Tsao was appointed as an independent non-executive director in June
2005.
HAMILTON Alexander Reid(韓武敦)
Mr. Hamilton, aged 64, is currently an independent non-executive director of the Company. He is also an independent
non-executive director of a number of Hong Kong listed companies and a director of a number of Hong Kong private
companies. He was an independent non-executive director of COSCO Pacific from 1994 to 2005 and of COSCO
International from 1997 to 2004. He was a partner of PricewaterhouseCoopers, with whom he practised for 16
years. He has over 20 years experience in audit and accounting. Mr. Hamilton was appointed as an independent
non-executive director in June 2005.
CHENG Mo Chi (鄭慕智), OBE, JP
Mr. Cheng, aged 55, is an independent non-executive director of the Company. He is the chairman of the Main Board
Listing Committee and of the Growth Enterprise Market Listing Committee of the Stock Exchange. He is also an
independent non-executive director of a number of Hong Kong listed companies. He is a non-executive director of a
number of Hong Kong listed companies. Mr. Cheng is a Senior Partner of P.C. Woo & Co. He was a chairman of The
Hong Kong Institute of Directors and is currently its honourable president and chairman emeritus. Mr. Cheng was a
councillor of the Legislative Council. Mr. Cheng was appointed as an independent non-executive director in June
2005.
033China COSCO Holdings Company Limited
ANNUAL REPORT 2005
SUPERVISORS
LI Yunpeng(李雲鵬)
Mr. Li, aged 47, is currently a supervisor and the chairman of the supervisory committee of the Company. He joined
the COSCO Group in 1976 and has been a member of senior management of COSCO since 2004. He joined the
Group in 2000 and was the supervisor of COSCON. Mr. Li was an executive director of COSCO Pacific from 2003 to
2005. Mr. Li joined COSCO in 1998 and had been the deputy general manager of the executive division, general
manager of the supervision division (audit division), general manager of the human resources division and assistant
president. Mr. Li joined the Company in March 2005. Mr. Li has 30 years of experience in the shipping industry and
extensive experience in corporate management and human resources. Mr. Li obtained a Master’s degree in ship and
marine engineering from Tianjin University. He is a senior engineer.
WU Shuxiong(吳樹雄)
Mr. Wu, aged 51, is currently a supervisor of the Company. He joined the COSCO Group in 1972 and the Group in
1997. He has been the secretary to the committee of the CPC and deputy general manager of COSCON since 2002.
He had been a marine chief engineer, deputy director of the fourth shipmanagement department of COSCO
Shanghai, general manager of Shanghai Far East Container Manufacturing Co. Ltd., deputy managing director of
COSCO Shanghai and deputy managing director and safety and quality control manager of COSCON. He joined the
Company in March 2005. Mr. Wu has over 30 years of experience in the shipping industry and extensive experience
in corporate management. Mr. Wu graduated from Shanghai Jiao Tong University, majoring in transportation
management. He is a senior engineer.
LI Zonghao(李宗豪)
Mr. Li, aged 48, is currently a supervisor. He joined the COSCO Group in 1980 and became the general manager of
the supervisory division (audit division) of COSCO in 2001. He joined the Company in March 2005. Mr. Li has over 20
years of experience in shipping industry and extensive experience in internal control. Mr. Li graduated from a law
school with a bachelor degree and in 2001, he graduated from Capital University of Economics and Business in
postgraduate studies in business administration.
YU Shicheng(於世成)
Mr. Yu, aged 51, is currently an independent supervisor of the Company. He was appointed as an independent
supervisor of the Company in 2005. Mr. Yu is currently the president of Shanghai Maritime University, vice chairman of
China Navigation Association, vice chairman of China Maritime Law Association and an arbitrator of China Maritime
Arbitration Commission. He is a professor and a lawyer, has been engaging in teaching and research on the topics of
maritime laws and international maritime policies. He was awarded the honour of special contribution to the State in
1994.

034
Directors, Supervisors and Senior Management
China COSCO Holdings Company LimitedANNUAL REPORT 2005
KOU Wenfeng(寇文峰)
Mr. Kou, aged 40, is currently an independent supervisor of the Company. He was appointed as an independent
supervisor of the Company in 2005. Mr. Kou is currently the general manager of Panwin Investment Consultant
Company Limited and the legal representative of Zhong Fa International Asset Appraisal Company Limited. He had
been the director of the enterprise departments of SASAC and the state asset fund manager of the MOF for more
than ten years, mainly responsible for management work relating to reforms, conversion into stock companies,
reorganisation of assets, and the issue and listing of shares, of State-owned enterprises. He graduated from the
Finance Department of Dongbei University of Finance and Economics. He is a registered asset appraiser in the PRC.
SENIOR MANAGEMENT
XU Lirong(許立榮)
Mr. Xu, aged 48, is an executive vice president of the Company. Mr. Xu joined COSCO Group in 1975 and the Group
in 1999. Mr. Xu was appointed as an executive director of COSCO Pacific in 2000 and was redesignated as a non-
executive director in 2005. He had been a marine captain and deputy director of the first ship management
department of COSCO Shanghai, the general manager of Shanghai International Freight Forwarding Company, the
deputy managing director of COSCO Shanghai and the president of Shanghai Shipping Exchange. He joined the
Company in March 2005. Mr. Xu has over 30 years of experience in the shipping industry. He has extensive
experience in corporate management as well as container shipping business management. Mr. Xu obtained his
Master of Business Administration degree from a joint programme by Shanghai Maritime University and the
Maastricht School of Management of the Netherlands. Mr. Xu is a senior engineer.
SUN Jiakang(孫家康)
Mr. Sun, aged 46, is an executive vice president of the Company. Mr. Sun joined the COSCO Group in 1982 and the
Group in 2002. He became a vice president of COSCO HK in the same year. He has been an executive director and
the managing director of COSCO Pacific in 2002 where he is responsible for the overall strategic planning, corporate
development, management and administration of the company. In 2005, Mr. Sun was elected as the vice chairman of
the board of directors of COSCO Pacific. He had been the director of the third division and second division of the
COSCO Container Lines, the general manager of transportation division and assistant president of COSCO. He
joined the Company in March 2005. Mr. Sun has over 20 years of experience in the shipping industry, and has
extensive experience in the container shipping business and in the operation and management of container shipping
terminals. Mr. Sun holds a Doctor’s degree in Philosophy in Management from Preston University, U.S. and a Master’s
degree in management from Dalian Maritime University. He is a senior engineer.

035China COSCO Holdings Company Limited
ANNUAL REPORT 2005
HE Jiale(何家樂)
Mr. He, aged 51, is the chief financial officer of the Company. Mr. He joined the COSCO Group in 1974 and the
Group in 1998 as the chief accountant of COSCON. He was the finance director of COSCO (Hong Kong) Group
Limited and an executive director of COSCO Pacific from 2003 to 2005, Mr. He had been the deputy director of the
finance division of Shanghai Ocean Shipping Company, the deputy general manager of finance department of the
COSCO Container Lines, the deputy general manager of finance and capital department of COSCO and the chief
financial officer of COSCON. He joined the Company in March 2005. Mr. He has over 30 years of experience in the
shipping business and has extensive experience in corporate finance and finance management. Mr. He graduated
from the postgraduate studies of management science and engineering from Shanghai University. He is a senior
accountant.
ZHANG Yongjian(張永堅)
Mr. Zhang, aged 54, is the secretary of the board and one of the joint company secretaries of the Company. Mr.
Zhang joined COSCO Group in 1976. He was the general manager of the strategic planning and development
division of COSCO in 2002. Mr. Zhang was the general manager of the shipping department and the deputy
managing director of Dalian Ocean Shipping Company and assistant president and the general manager of the
strategic planning and development division of COSCO HK. He joined the Company in March 2005. Mr. Zhang has
30 years of experience in the shipping business, as well as in legal affairs. Mr. Zhang graduated from the Shanghai
Maritime University and the Dalian Maritime University. He has a Master of Law degree. He is a senior economist.
JOINT COMPANY SECRETARIES
ZHANG Yongjian(張永堅)
Mr. Zhang is one of the joint company secretaries of the Company. For further details regarding Mr. Zhang’s
experience, please see the section headed “Senior Management” above.
YEUNG Chun Wai Anthony(楊俊偉)
Mr. Yeung is one of the joint company secretaries of the Company. For further details of Mr. Yeung’s experience,
please see the section headed “Qualified Accountant” below.

036
Directors, Supervisors and Senior Management
China COSCO Holdings Company LimitedANNUAL REPORT 2005
QUALIFIED ACCOUNTANT
YEUNG Chun Wai Anthony(楊俊偉)
Mr. Yeung, aged 30, is the qualified accountant of the Company pursuant to Rule 3.24 of the Listing Rules. Mr. Yeung
is employed by the Company on a full time basis and is a member of the Company’s senior management. He joined
the Company in March 2005. Mr. Yeung graduated from the University of Hong Kong and holds a bachelor degree in
Business Administration (accounting and finance). He is a committee member of the ACCA, and an associate
member of the ACCA, the Hong Kong Logistics Association, the Institute of Management Accountants and an
honorary vice-president to the advisory board of the Business Association of the University of Hong Kong.

037
Directors’ Report
China COSCO Holdings Company Limited ANNUAL REPORT 2005
The Board has pleasure in presenting the Report of the Directors for the year 2005 together with the audited financial
statements of the Group for the year ended 31 December 2005.
Principal Activities
The Group is engaged in providing integrated container shipping services, including container shipping business,
container terminals business, container leasing business, freight forwarding and shipping agency services as well as
logistics services. The Company is an investment holding company and details of the principal activities of the
Company’s principal subsidiaries as at 31 December 2005 are set out in note 41 to the consolidated financial
statements.
Results of the Group
The Group’s results for the year ended 31 December 2005 as prepared in accordance with the Hong Kong Financial
Reporting Standards (“HKFRS”) are set out on page 87 of this report.
Financial Summary
A summary of the results and of the assets and liabilities of the Group for the last four financial years are set out in the
section headed “Financial Summary” of this report.
Profit Appropriation and Dividends
According to the “Regulation Relating to Corporate Reorganisation of Enterprises and the Related Management of
State-owned Capital and Financial Treatment” notice issued by the Ministry of Finance and the reorganisation
agreement entered into by the Company and COSCO on 9 June 2005, the increase in net assets (excluding the
undistributed portion of COSCO Pacific) as a result of the profits generated by the Group during the period between
30 June 2004 (date of valuation) and 3 March 2005 (date of the establishment of the Company) (“initial profit period”)
shall be payable to COSCO.
Pursuant to the shareholders’ resolution approved by shareholders of the Company on 9 June 2005, the increase in
net assets of RMB1,695,121,000 as a result of the profits generated by the Group (excluding COSCO Pacific) during
the period between the date of valuation and 31 December 2004 and a final dividend of RMB299,423,000 for 2004
by COSCO Pacific attributable to the COSCO, totalling RMB1,994,544,000, were paid to COSCO before listing.

038
Directors’ Report
China COSCO Holdings Company LimitedANNUAL REPORT 2005
As regards the portion of the net assets increased during the period between 1 January 2005 and 3 March 2005
(“remaining period of the initial profit period”) payable to COSCO, BDO Reanda Certified Public Accountants Co., Ltd.
appointed by the Company, has conducted a special audit of the Company’s financial statements prepared in
accordance with the relevant accounting principles and financial regulations applicable to PRC companies (“PRC
GAAP”) and of changes in combined shareholders’ equity. As far as the net assets increased during the remaining
period of the initial profit period, the Company determined, after making necessary adjustments, the amount payable
to COSCO is RMB826,096,000, including an interim dividend for 2005 by COSCO Pacific attributable to COSCO
calculated based on the number of days payable to COSCO. As regards the unpaid portion of the net assets
increased during the remaining period of the initial profit period, it is retained as a special reserve which amounted to
RMB279,422,000, the benefit of which is solely attributable to COSCO pursuant to the “Reply in respect to Relevant
Issues concerning the Handling of Net Assets in the Reorganisation of the Core Shipping Business of China Ocean
Shipping (Group) Company for Overseas Listing” (Guo Zi Chan Quan [2005] No. 571) issued by the State-owned
Assets Supervision and Administration Commission. The amount will be converted into domestic shares of the
Company held by COSCO at the offer price of HK$4.25 per share within three years following the listing of the
Company’s shares.
Pursuant to the shareholders’ resolution approved by shareholders of the Company on 9 June 2005, the audited
profit after tax of the Company for the period from the date of establishment (excluding the day) to the date on which
foreign investors hold the shares of the Company according to law and their names are registered in the register of
members (excluding the day) (“subsequent profit period”), will be distributed to COSCO in full as a special distribution
in accordance with the principle of the lower of profits attributable to equity holders of the Company under the PRC
GAAP and the HKFRSs, following the appropriation of 10% each for the statutory surplus reserve, discretionary
surplus reserve and statutory public welfare fund and after making necessary adjustments. BDO Reanda Certified
Public Accountants Co., Ltd. and PricewaterhouseCoopers, who were engaged by the Company, have conducted
special audits of the consolidated income statement of the Group prepared in accordance with the PRC GAAP and
the HKFRSs respectively. According to the special audit results, based on the consolidated net profit realised during
the period as determined under the PRC GAAP, and after the appropriation of 10% each for statutory surplus reserve
fund, statutory public welfare fund and discretionary surplus reserve, the profit to be distributed by the Company to
COSCO for that period is RMB967,926,000, including an interim dividend for 2005 by COSCO Pacific Limited
attributable to COSCO calculated based on the number of days for that period.
The Board recommended the payment of a final dividend of RMB0.13 per share (pre-tax) to the equity holders whose
names appear on the register of shareholders on 15 June 2006.

039China COSCO Holdings Company Limited
ANNUAL REPORT 2005
Use of Proceeds from the Company’s Initial Public Offering
The net proceeds from the Company’s issue of new shares at the time of its listing on the Stock Exchange in June2005 amounted to approximately RMB8,817,797,000. As of 31 December 2005, the net proceeds were used, asstated in the prospectus of the Company, for capital expenditures, enhancing the Group’s “door-to-door” servicessystems, repayment of loans, and as working capital and general corporate purposes.
Major Suppliers and Customers
For the year ended 31 December 2005, the Group’s purchases attributable to the Group’s five largest suppliers wereless than 30% of the Group’s total purchases, and the aggregate sales attributable to the Group’s five largestcustomers were less than 30% of the Group’s total sales.
Reserves
Details of movements in the reserves of the Company and the Group during the year and details of the distributablereserves of the Company as at 31 December 2005 are set out in note 22 to the consolidated financial statementsprepared in accordance with the HKFRS contained herein.
Statutory Reserve Funds
Details of the statutory reserve funds are set out in note 22(b) to the consolidated financial statements prepared inaccordance with the HKFRS contained herein.
Property, Plant and Equipment and Investment Properties
During the year, the Group incurred approximately RMB5,680,710,000 on acquisition of property, plant andequipment for expansion of its shipping capacity. Details of movements in property, plant and equipment andinvestment properties of the Group and the Company during the year are set out in notes 6 and 7 to the consolidatedfinancial statements.
The properties interests of the Group including the interests in certain of the above properties that are attributable tothe Group, together with those of its jointly-controlled entities in which the Group held equity interests of more than50%, were valued by Sallmanns (Far East) Limited, an independent property valuer as at 31 March 2005 amounted toRMB2,687,624,000 and RMB1,254,261,000, respectively. The net revaluation surplus as disclosed in the Company’sprospectus, representing the excess of market value of the properties over their book value, was approximatelyRMB189,529,000. In accordance with the Group’s accounting policy, all properties are stated at cost lessaccumulated depreciation and impairment losses. As such, the net revaluation surplus arising from the valuation hasnot been recognised in the Company’s consolidated financial statements for the year ended 31 December 2005. Hadthe properties been stated at such valuation, an additional depreciation of RMB6,040,000 would have been incurredfor the year ended 31 December 2005.
Employees’ Retirement Plan
Details of the employees’ retirement plans are set out in note 25(b) to the consolidated financial statements preparedin accordance with the HKFRS contained herein.

040
Directors’ Report
China COSCO Holdings Company LimitedANNUAL REPORT 2005
Directors and Supervisors
The directors of the Company during the year were as follows:
Name Date of Appointment as Director
Executive director
WEI Jiafu (Chairman and CEO) 7 March 2005
CHEN Hongsheng (President) 7 March 2005
Non-executive director
ZHANG Fusheng (Vice Chairman) 7 March 2005
WANG Futian 7 March 2005
LI Jianhong 7 March 2005
MA Zehua 7 March 2005
MA Guichuan 7 March 2005
SUN Yueying 7 March 2005
LIU Guoyuan 7 March 2005
Independent non-executive director
LI Boxi 9 June 2005
TSAO Wen King, Frank 9 June 2005
HAMILTON Alexander Reid 9 June 2005
CHENG Mo Chi 9 June 2005
The supervisors of the Company during the year were as follows:
Name Position Date of Appointment as Supervisor
LI Yunpeng Chairman of Supervisory Committee 3 March 2005
WU Shuxiong Supervisor 3 March 2005
LI Zonghao Supervisor 3 March 2005
YU Shicheng Independent supervisor 9 June 2005
KOU Wenfeng Independent supervisor 9 June 2005
Independence of the Independent Non-executive Directors
The Company has received the letter of annual confirmation issued by each of the independent non-executive
directors of the Company as to his/her independence pursuant to Rule 3.13 of the Listing Rules. All of the four
independent non-executive directors of the Company are considered by the Company as independent persons.

041China COSCO Holdings Company Limited
ANNUAL REPORT 2005
Biography of Directors, Supervisors and Members of the Senior Management
Biography of directors, supervisors and members of the senior management as at the date hereof are set out onpages 28 to 36 of this report.
Connected Transactions
Pursuant to Chapter 14A of the Listing Rules, the following connected transactions of the Company requiredisclosures in the annual report of the Company:
1. Non-exempt continuing connected transactions under subsisting agreements
(1) Sub-leasing of time charters from COSCO to COSCON
Seven independent vessel owners had entered into seven bareboat charters with COSCO Maritime (UK)Limited, a wholly-owned subsidiary of COSCO, in relation to seven vessels. By providing seaman servicesand vessel management services, COSCO sub-leases these seven vessels to COSCON under sevensub-time charter agreements, which were entered into between COSCO and COSCON during the periodfrom 25 July 2001 to 24 April 2002. Set out below is the information on these seven charter agreements:
Date of delivery ofvessel pursuant Vessel
Date of charter Term of charter to charter CapacityName of vessel agreement agreement agreement (TEU)
COSCO Antwerp 27 September 2001 From date of delivery 27 September 2001 5,446to 14 January 2008(lessee has an optionto extend the termfrom one year to12 years)
COSCO Hamburg 10 October 2001 From date of delivery 10 October 2001 5,446to 14 January 2008(lessee has an optionto extend the termfrom one year to12 years)
COSCO Rotterdam 13 February 2002 From date of delivery 13 February 2002 5,446to 14 October 2008(lessee has an optionto extend the termfrom one year to12 years)

042
Directors’ Report
China COSCO Holdings Company LimitedANNUAL REPORT 2005
Date of delivery of
vessel pursuant Vessel
Date of charter Term of charter to charter Capacity
Name of vessel agreement agreement agreement (TEU)
COSCO Felixstowe 24 April 2002 From date of delivery 24 April 2002 5,446
to 14 October 2008
(lessee has an option
to extend the term
from one year to
12 years)
COSCO Hong Kong 17 April 2002 From date of delivery 17 April 2002 5,446
to 14 October 2008
(lessee has an option
to extend the term
from one year to
12 years)
COSCO Shanghai 25 July 2001 From date of delivery 25 July 2001 5,446
to 14 January 2008
(lessee has an option
to extend the term
from one year to
12 years)
COSCO Singapore 12 December 2001 From date of delivery 12 December 2001 5,446
to 14 January 2008
(lessee has an option
to extend the term
from one year to
12 years)
The term of each of the four out of the seven sub-time charters run from the date of delivery of the
vessels to 14 January 2008, while the term of each of the other three sub-time charters run from the date
of delivery of the vessels to 14 October 2008.
The Group paid a total of RMB450,416,000 as sub-time charter hire fees in respect of the sub-time
charters mentioned above for the year ended 31 December 2005.

043China COSCO Holdings Company Limited
ANNUAL REPORT 2005
(2) Sub-time charters from COSCO to COSCON
SG Almond Inc., SG Gondola Inc. and SG Pacmar Inc., the respective owners of the three vessels,
COSCO Sakura, COSCO Ran and COSCO Kiku, had entered into the three bareboat charters with each
of River Aquamarine Maritime Inc., River Nereid Maritime Inc. and River Azure Maritime Inc., wholly-
owned subsidiaries of COSCO. By providing seaman services and vessel management services, COSCO
then sub-leases these three vessels to COSCON under time-charter arrangements. Three time charter
agreements were entered into between COSCO, Pan Asia and COSCON in March 2005 in view of the
recent establishment of Pan-Asia in 2004. Set out below is the information on these three charter
agreements.
Date of delivery of
vessel pursuant Vessel
Date of charter Term of charter to charter Capacity
Name of vessel agreement agreement agreement (TEU)
COSCO Sakura 31 March 2005 77 calendar months after 31 August 2001 542
the delivery date (lessee has
an option to extend the
term for 60 calendar months)
COSCO Kiku 31 March 2005 82 calendar months after the 31 January 2002 542
delivery date (lessee has an
option to extend the term
for 60 calendar months)
COSCO Ran 28 March 2005 80 calendar months after 28 November 2001 542
the delivery date (lessee has
an option to extend the term
for 60 calendar months)

044
Directors’ Report
China COSCO Holdings Company LimitedANNUAL REPORT 2005
COSCO had further entered into three new time charter agreements with COSCON in 2005 and the
arrangement of which is similar to those for COSCO Sakura, COSCO Ran and COSCO Kiku as
mentioned above. South New Shipping Inc., South Great Shipping Inc. and South China Shipping Inc.,
the respective owners of the three vessels, COSCO Tianjin, COSCO Dalian and COSCO Xiamen, had
entered into three bareboat charters with each of COSCO Tianjin Maritime Inc., COSCO Dalian Maritime
Inc., and COSCO Xiamen Maritime Inc., wholly-owned subsidiaries of COSCO. COSCO then subleases
the three vessels to COSCON under time-charter arrangement. Three time charter agreements were
entered into between COSCO and COSCON in February and March 2005, and the underlying key terms
are substantially the same. The sub-time charter hire fees charged against COSCON were determined
based on market prices. Set out below is the information on these three charter agreements:
Date of delivery
of vessel pursuant Vessel
Date of charter Term of charter to charter Capacity
Name of vessel agreement agreement agreement (TEU)
COSCO Xiamen 25 February 2005 144 calendar months after 28 February 2005 5,816
the delivery date (lessee has
an option to extend the term
for 24 calendar months)
COSCO Dalian 31 March 2005 144 calendar months after 31 March 2005 5,816
the delivery date (lessee has
an option to extend the term
for 24 calendar months)
COSCO Tianjin 31 March 2005 144 calendar months 6 June 2005 5,816
after the delivery date
(lessee has an option to
extend the term for 24
calendar months)
The Group paid a total of RMB158,127,000 as sub-time charter hire fees in respect of the sub-time
charters mentioned above for the year ended 31 December 2005.

045China COSCO Holdings Company Limited
ANNUAL REPORT 2005
(3) Financial services transactions
COSCO Finance, a non-wholly-owned subsidiary of COSCO, is a non-bank finance entity established
with the approval of the People’s Bank of China. COSCO Finance has served as a financial agency
through which the Group manages its current account settlements between members of the COSCO
Group and the Group.
Pursuant to the financial services agreement entered into between COSCO Finance and the Company
dated 9 June 2005, COSCO Finance has agreed to provide the Group (excluding COSCO Pacific and its
subsidiaries) with a range of financial services, primarily including deposit services, settlement services
and loan.
The pricing policy of COSCO Finance is subject to the People’s Bank of China’s guidelines, including base
lending rates and foreign exchange rates, as well as guidelines published by the PRC self-regulatory
bodies, such as associations of finance companies. If the People’s Bank of China has not specified a fee
or charge for a particular service, then the services will be provided by COSCO Finance on terms no less
favourable than the terms available from commercial banks in China.
The maximum daily outstanding balance of deposits (including accrued interest) placed by the Group
(exclusing COSCO Pacific and its subsidiaries) with COSCO Finance and the maximum daily outstanding
balance of loans (including accrued interest) granted by COSCO Finance to the Group (exclusing COSCO
Pacific and its subsidiaries) for the year ended 31 December 2005 are RMB259,308,000 and
RMB350,000,000 respectively.

046
Directors’ Report
China COSCO Holdings Company LimitedANNUAL REPORT 2005
2. Non-exempt continuing connected transactions under master agreements
The Group (except COSCO Pacific and its subsidiaries) and the relevant connected persons of the Company
have entered into the following eight master agreements. Each of the master agreements contains binding
principles, guidelines and terms and conditions pursuant to which any and all products and services
contemplated therein are to be provided by the relevant provider to the relevant recipient. The eight master
agreements are titled as follows:
(1) Master General Services Agreement
(2) Master Vessel Services Agreement
(3) Master Overseas Agency Services Agreement
(4) Master Container Services Agreement
(5) Master Solicitation Activities Agreement
(6) Master Port Services Agreement
(7) Master Vessel Management Agreement
(8) Master Seamen Leasing Agreement
Further information in respect of the above master agreements are set out in the prospectus of the Company
dated 20 June 2005. The general terms of the master agreements are summarised below:
General principles, price and terms
The master agreements require, in general terms, that: (a) the prices of the products and services to be
provided must be fair and reasonable; and (b) the terms and conditions of the products and services to be
provided should not be less favourable to the Group than those (i) available from or to (as appropriate) the
relevant connected persons, their subsidiaries and/or associates to or from (as appropriate) independent third
parties; and (ii) available from or to (as appropriate) independent third parties to or from (as appropriate) the
Group.
047China COSCO Holdings Company Limited
ANNUAL REPORT 2005
Price determination
Each of the master agreements provides that each relevant product or service must be provided in accordance
with the following general pricing principles:
(a) at State-prescribed prices, being the price set by the relevant laws, regulations and other governmental
regulatory documents issued by the relevant authorities of the Chinese government; or
(b) where there is no State-prescribed price, then according to relevant market prices (that is the price at
which the same or comparable type of products of services are provided from or to (as appropriate)
independent third parties in the same area in the ordinary course of business); or
(c) where there is no relevant market price, then according to the actual cost incurred in providing such
products or services plus a margin.
Term and termination
The initial term of each of the master agreements shall expire on 31 December, 2007. Upon the expiration of
such initial term, each of the master agreements shall automatically continue for a term to be agreed by the
parties, unless at any time any relevant party gives at least 30 days’ prior written notice of termination to the
other party or parties of such master agreements.
Execution agreements
The master agreements are framework agreements which provide the mechanism for the operation of the
connected transactions described above. It is envisaged that from time to time and as required, individual
execution agreements may be required to be entered into between the Group, the relevant connected persons,
their subsidiaries and/or associates, as appropriate.
Each execution agreement will set out the specific products and services requested by the relevant party and
any detailed technical and other specifications which may be relevant to those products or services. The
execution agreements may only contain provisions which are in all material respects consistent with the binding
principles, guidelines, terms and conditions in accordance with which such products and services are required
to be provided as contained in the relevant master agreement.
As the execution agreements are simply further elaboration on the provision of products and services as
contemplated by each of the mater agreements, they do not constitute new categories of connected
transactions.
Actual figures for the year ended 31 December 2005 relating to the eight master agreements are set out in the
next section, together with the annual caps granted by the Stock Exchange with respect to each master
agreement.
048
Directors’ Report
China COSCO Holdings Company LimitedANNUAL REPORT 2005
3. Summary of the annual caps and actual figures in respect of the continuing connected transactions under
subsisting agreements and master agreements
Annual Cap for Actual Figure for
the year ended the year ended
31 December 2005 31 December 2005
Transaction (RMB ‘000) (RMB ‘000)
Non-exempt continuing connected transactions for which a waiver from the independent
shareholders’ approval and disclosure requirements has been granted by the Stock Exchange
1. Sub-leasing of time charters from COSCO to COSCON 460,000 450,416
2. Sub-time charters from COSCO to COSCON 204,000 158,127
3. Financial services transactions:
— Maximum daily outstanding balance of deposits 400,000 259,308
(including accrued interest) placed by the Group
(excluding COSCO Pacific and its subsidiaries)
with COSCO Finance
— Maximum daily outstanding balance of loans 400,000 350,000
(including accrued interest) granted by COSCO
Finance to the Group (excluding COSCO
Pacific and its subsidiaries)
4. Transactions under the Master Vessel Services Agreement 5,480,000 4,757,392
5. Transactions under the Master Overseas
Agency Services Agreement 365,000 262,532
6. Transaction under the Master Container Services Agreement 603,000 399,235
7. Transactions under the Master Solicitation Activities Agreement 1,320,000 750,162
8. Transactions under the Master Port Services Agreement 1,760,000 1,265,664
9. Transactions under the Master Seamen Leasing Agreement 750,000 603,433
Non-exempted continuing connected transactions for which a waiver from the disclosure
requirement has been granted by the Stock Exchange
10. Transactions under the Master General Services Agreement 100,000 58,115
11. Transactions under the Master Vessel Management Agreement 90,000 75,248

049China COSCO Holdings Company Limited
ANNUAL REPORT 2005
The independent non-executive directors of the Company, Ms. LI Boxi, Mr. TSAO Wen King, Frank, Mr,
HAMILTON Alexander Reid and Mr. CHENG Mo Chi have reviewed the above continuing connected
transactions and confirm that these transactions have been entered into:
(1) in the ordinary and usual course of business of the Group;
(2) on normal commercial terms or on terms no less favourable to the Group than terms available to or from
(as appropriate) independent third parties; and
(3) in accordance with the relevant agreement governing them on terms that are fair and reasonable and in
the interests of the shareholders of the Company as a whole.
For the purpose of Rule 14.38 of the Listing Rules, the auditors of the Company, PricewaterhouseCoopers,
have performed certain agreed-upon procedures on the above continuing connected transactions (the
“Transactions”) in accordance with Hong Kong Standard on Related Services 4400 “Engagements to Perform
Agreed-upon Procedures Regarding Financial Information” issued by the Hong Kong Institute of Certified Public
Accountants and reported as below:
(1) the Transactions received the approval of the Company’s board of directors;
(2) in relation to those Transactions involving provisions of goods and services by the Group (for the samples
selected), their pricing was in accordance with the pricing policies of the Group;
(3) the pricing of the Transactions (for the samples selected) was in accordance with the terms of the relevant
agreements governing the transactions or the invoices issued if an agreement was not available; and
(4) the accumulated amounts of the Transactions did not exceed the relevant annual caps.

050
Directors’ Report
China COSCO Holdings Company LimitedANNUAL REPORT 2005
Disclosure of Significant Events
On 16 April, COSCO Pacific signed a joint venture heads of agreement to establish a joint venture to construct and
operate a container terminal at Nansha Port Phase II.
On 30 April, COSCON signed a construction contract for four of the world’s largest container vessels (10,000 TEUs)
with Nantong COSCO KHI Ship Engineering Co., Ltd.. The first vessel is expected to be delivered in 2008.
On 28 May, COSCO Pacific signed a joint venture contract to acquire a 20% equity interest in Nanjing Longtan
Container Limited. The joint venture company commenced operation on 26 August.
On 18 August, Shanghai Pan Asia Shipping Company Limited signed a building contract in relation to nine 200 TEUs
container vessels with Chongqing Dongfeng Ship Industry Company involving an amount of RMB118,620,000.
On 15 September, COSCO Pacific signed an agreement with Ningbo Port Group Ltd. to form joint venture company
to develop Berth Number 7 of Beilun Container Terminal Phase IV. COSCO Pacific owns 20% of the equity interest in
the joint venture.
On 20 September, COSCON and COSCO International Freight Co., Ltd. (COSFRE) jointly invested and incorporated
COSCO South-China International Freight Co., Ltd. in Shenzhen to consolidate the marketing entities in the Southern
China region and Hong Kong. It is responsible for the sale, operation, barge service, equipment and financial
management in the region.
On 19 December, COSCO Pacific signed a joint venture agreement to acquire a 10% interest in Phase II of Shanghai
Yangshan Port.
On 19 December, COSCO Pacific signed an agreement to acquire a 20% interest in the Suez Canal Container
Terminal S.A.E. in Egypt.
Details of the significant events after the balance sheet date of the Group are set out in note 43 to the consolidated
financial statements.
Material Litigation and Arbitration
The Group did not engage in any material litigation or arbitration during the year.
Pre-emptive Rights
The Articles of Association of the Company and the laws of the PRC contain no provision for any pre-emptive rights,
requiring the Company to offer new shares to shareholders on a pro-rata basis to their shareholdings.

051China COSCO Holdings Company Limited
ANNUAL REPORT 2005
Share Capital
Details of the share capital of the Company are set out in the note 21 to the consolidated financial statement
prepared in accordance with the HKFRS contained herein.
Substantial Interests in the Shares and Underlying Shares of the Company
So far as was known to any director of the Company, as at 31 December 2005, shareholders who had interests or
short positions in the shares and underlying shares of the Company which fall to be disclosed to the Company under
the provisions of Divisions 2 and 3 of Part XV of the Securities and Futures Ordinance (the “SFO”), or which were
recorded in the register required to be kept by the Company under Section 336 of the SFO were as follows:
Number of ordinary shares/Percentage of total issued share capital
of the Company’s H Shares
Long Short Lending
Name Capacity position % position % pool % Note
Temasek Holdings Interest of controlled 306,741,500 13.67 — — — — (1)
(Private) Limited corporation
Temasek Capital Interest of controlled 306,741,500 13.67 — — — — (1)
(Private) Limited corporation
Seletar Investments Interest of controlled 306,741,500 13.67 — — — — (1)
Pte Ltd corporation
Singapex Investments Beneficial owner 272,536,000 12.15 — — — — (2)
Pte Ltd
Mr. Li Ka-Shing Founder of discretionary 275,294,000 12.27 — — — — (3)
trusts and interest of
controlled corporations)
Li Ka-Shing Unity Trustee 275,294,000 12.27 — — — — (3)
Trustee Company
Limited (“TUT1”)
Li Ka-Shing Unity Trustee and beneficiary 275,294,000 12.27 — — — — (3)
Corporation Company of a trust
Limited (“TDT1”)

052
Directors’ Report
China COSCO Holdings Company LimitedANNUAL REPORT 2005
Number of ordinary shares/Percentage of total issued share capital
of the Company’s H Shares
Long Short Lending
Name Capacity position % position % pool % Note
Li Ka-Shing Unity Trustee and 275,294,000 12.27 — — — — (3)
Trustcorp Limited beneficiary of a trust
(“TDT2”)
Cheung Kong (Holdings) Interest of controlled 275,294,000 12.27 — — — — (3)
Limited (“CKH”) corporation
Hutchison Whampao Interest of controlled 275,294,000 12.27 — — — — (3)
Limited (“HWL”) corporation
Hutchison International Interest of controlled 275,294,000 12.27 — — — — (3)
Limited (“HIL”) corporation
Hutchison Whampao Interest of controlled 275,294,000 12.27 — — — — (3)
Properties Limited corporation
(“HWPL”)
Cactus Holdings Interest of controlled 275,294,000 12.27 — — — — (3)
Limited (“Cactus”) corporation
Northpier Enterprises Interest of controlled 137,647,000 6.13 — — — — (3)
Limited (“Northpier”) corporation
Vember Lord Limited Beneficial owner 137,647,000 6.13 — — — — (3)
(“Vember Lord”)
Yanter Services Interest of controlled 137,647,000 6.13 — — — — (3)
Limited (“Yanter”) corporation
Rhine Office Investments Beneficial owner 137,647,000 6.13 — — — — (3)
Limited (“Rhine Office”)

053China COSCO Holdings Company Limited
ANNUAL REPORT 2005
Notes:
(1) The three references to 306,741,500 shares relate to the same block of shares in the Company comprising:
(a) 272,536,000 shares held by Singapex Investments Pte Ltd, a wholly owned subsidiary of Temasek Holdings (Private)
Limited, Temasek Capital (Private) Limited and Seletar Investments Pte Ltd; and
(b) 34,205,500 shares held by Aranda Investments, a wholly owned subsidiary of Temasek Holdings (Private) Limited,
Temasek Capital (Private) Limited and Seletar Investments Pte Ltd.
Each of Temasek Holdings (Private) Limited, Temasek Capital (Private) Limited and Seletar Investments Pte Ltd is taken to
have a duty of disclosure in relation to the said shares of the Company by virtue of their deemed interests in the shares under
the SFO.
(2) This relates to 137,647,000 shares in the Company directly and beneficially held by Singapex Investments Pte Ltd as
described in Note (1)(a) above.
(3) The nine references to 275,294,000 shares relate to the same block of shares in the Company comprising 137,647,000
shares directly held by each of Vember Lord and Rhine Office.
Li Ka-Shing Unity Holdings Limited (“Unity Holdings”), of which each of Mr. Li Ka-Shing, Mr. Li Tzar Kuoi, Victor and Mr. Li
Tzar Kai, Richard is interested in one-third of the entire issued share capital, owns the entire issued share capital of TUT1.
TUT1 as trustee of The Li Ka-Shing Unity Trust (“UT1”), together with certain companies which TUT1 as trustee of UT1 is
entitled to exercise or control the exercise of more than one-third of the voting power at their general meetings, hold more
than one-third of the issued share capital of CKH. Certain subsidiaries of CKH are entitled to exercise or control the exercise
of more than one-third of the voting power at the general meetings of HWL.
In addition, Unity Holdings also owns the entire issued share capital of TDT1 as trustee of the Li Ka-Shing Unity Discretionary
Trust (“DT1”) and TDT2 as trustee of another discretionary trust (“DT2”). Each of TDT1 and TDT2 holds units in UT1.
HWL holds the entire issued share capital of HIL, HIL holds the entire issued share capital of HWPL, which in turn holds the
entire issued share capital of Cactus, which in turn holds the entire issued capital of Rhine Office and Vember Lord indirectly,
through Yanter and Northpier respectively.
By virtue of the SFO, each of Mr. Li Ka-Shing (being the settler and may be regarded as founder of DT1 and DT2 for the purpose of
the SFO), TDT1, TDT2, TUT1, CKH, HWL, HIL, HWPL, Cactus, Yanter and Northpier is deemed to be interested in the share capital
of the Company held by Rhine Office and Vember Lord as a substantial shareholder of the Company.
Save as disclosed above, as at 31 December 2005, the Company has not been notified of any other interests or
short positions in the shares or underlying shares of the Company which fall to be disclosed to the Company under
the provisions of Divisions 2 and 3 of Part XV of the SFO, or which were recorded in the register required to be kept
by the Company under Section 336 of the SFO.

054
Directors’ Report
China COSCO Holdings Company LimitedANNUAL REPORT 2005
Legal person shareholders with shareholding of 10% or more
As at 31 December 2005, COSCO held 3,896,000,000 state-owned legal person shares of the Company,
representing 63.5% of the total share capital of the Company.
COSCO, a state-owned enterprise established in the People’s Republic of China, is a controlling shareholder of the
Company. Its legal representative is Mr. Wei Jiafu and its registered capital as at 31 December 2005 was
RMB1,900,000,000. It is principally engaged in integrated shipping business.
Sufficiency of Public Float
As at the date of this report, the total share capital of the Company consisted of 6,140,000,000 shares, of which
2,244,000,000 shares were H shares, representing 36.5% of the Company’s total share capital, all of which were held
by the public.

055China COSCO Holdings Company Limited
ANNUAL REPORT 2005
Share Appreciation Rights Plan
A Share Appreciation Rights Plan was adopted by the Company, which was designed to align the interests of
directors, supervisors and senior management with the Company’s operating results and the Company’s share value.
The issuance of share appreciation rights does not involve any issuance of new shares, nor does it have any dilutive
effect on the shareholders.
On 16 December 2005, the Board had resolved to grant share appreciation rights to certain directors, supervisors
and senior management officers of the Company and its subsidiaries, and other personnel designated by the Board,
including nine directors and three supervisors of the Company at an exercise price of HK$3.195 each under the
Share Appreciation Rights Plan. The share appreciation rights granted to these nine directors and three supervisors
represent 7,400,000 shares of the Company or approximately 0.33% of the Company’s total issued H Shares.
Details of the grant and the movements of the share appreciation rights during the year are set out below:
Number of units of share
appreciation rights
approximate% of
issued shareGranted Exercised Outstanding capital of the
Name of director/ Nature of Exercise during during at 31st Company’sSupervisor Capacity Interest price the year the year December 2005 H Shares Note
Wei Jiafu Beneficial Owner Personal HK$3.195 900,000 — 900,000 0.04% (1)Zhang Fusheng Beneficial Owner Personal HK$3.195 800,000 — 800,000 0.04% (1)Chen Hongsheng Beneficial Owner Personal HK$3.195 700,000 — 700,000 0.03% (1)Wang Futian Beneficial Owner Personal HK$3.195 600,000 — 600,000 0.03% (1)Li Jianhong Beneficial Owner Personal HK$3.195 600,000 — 600,000 0.03% (1)Ma Zehua Beneficial Owner Personal HK$3.195 600,000 — 600,000 0.03% (1)Ma Guichuan Beneficial Owner Personal HK$3.195 600,000 — 600,000 0.03% (1)Sun Yueying Beneficial Owner Personal HK$3.195 600,000 — 600,000 0.03% (1)Liu Guoyuan Beneficial Owner Personal HK$3.195 600,000 — 600,000 0.03% (1)Li Yunpeng Beneficial Owner Personal HK$3.195 600,000 — 600,000 0.03% (1)Wu Shuxiong Beneficial Owner Personal HK$3.195 500,000 — 500,000 0.02% (1)Li Zhonghao Beneficial Owner Personal HK$3.195 300,000 — 300,000 0.01% (1)
Notes:
(1) The share appreciation rights were granted by the Company in units with each unit representing one H share of the Company
pursuant to the Share Appreciation Rights Plan. As of each of the last day of the third, fourth, fifth and sixth anniversary of the
date of grant (i.e. 16 December 2005), the total number of the share appreciation rights exercisable will not exceed 25%,
50%, 75% and 100%, respectively, of each of the total share appreciation rights granted.
(2) During the year, no share appreciation rights mentioned above were lapsed or cancelled.

056
Directors’ Report
China COSCO Holdings Company LimitedANNUAL REPORT 2005
Share Option Schemes of COSCO Pacific
As at 31 December 2005, there are outstanding share options in relation to two share option schemes of COSCO
Pacific, one of which was adopted by its shareholders on 30 November 1994 (the “1994 Share Option Scheme”) and
the other was adopted on 23 May 2003 (the “2003 Share Option Scheme”).
(i) Movements of the options, which have been granted under the 1994 Share Option Scheme, during the year
are set out below:
Number of share options
Percentage
Exercise Outstanding at Exercised Lapsed Outstanding at of total
price 1 January during the during the 31 December issued share
Category HK$ 2005 year year 2005 capital Note
A director of COSCO Pacific 8.80 1,800,000 (900,000 ) — 900,000 0.04% (1),(3),(4)
Employees(2) 8.80 902,000 (648,000 ) — 254,000 0.01% (1),(4)
2,702,000 (1,548,000 ) — 1,154,000
Notes:
(1) The share options were granted on 20th May 1997 (the “Offer Date”) under the 1994 Share Option Scheme. The share
options are exercisable at any time within ten years from the date of grant (i.e. on or before 19th May 2007), subject to
the following conditions:
(a) For those grantees who have completed one year full-time service in the group companies of COSCO Pacific may
exercise a maximum of 20% of share options granted in each of the first five anniversary years from the Offer Date.
(b) For those grantees who have not completed one year full-time service in the Group as at the Offer Date, a maximum of
20% of share options granted may be exercisable on each of the first five anniversary years of the Offer Date after
completion of one year full-time service.
(2) These category comprises management of the subsidiaries of COSCO Pacific.
(3) These share options represent personal interests held by the relevant director as beneficial owner.
(4) The weighted average closing price of the shares of COSCO Pacific (“COSCO Pacific Shares”) immediately before the
dates on which the share options were exercised was HK$15.73.
During the year, no share options were cancelled under the 1994 Share Option Scheme.

057China COSCO Holdings Company Limited
ANNUAL REPORT 2005
(ii) Movements of the share options, which have been granted under the 2003 Share Option Scheme, during the
year are set out below:
Number of share options
Outstanding Outstanding Percentage
Exercise as at Granted Exercised Lapsed as at of total
price 1 January during the during the during the 31 December issued share Exercisable
Category HK$ 2005 year year year 2005 capital period Note
Directors
WEI Jiafu 9.54 1,000,000 — (500,000 ) — 500,000 0.02% 30.10.2003- (1),(4),(5)
29.10.2013
13.75 1,000,000 — — — 1,000,000 0.05% 03.12.2004- (2),(4)
02.12.2014
ZHANG Fusheng 9.54 800,000 — (400,000 ) — 400,000 0.02% 29.10.2003- (1),(3),(4)
28.10.2013
13,75 1,000,000 — — — 1,000,000 0.05% 03.12.2004- (2),(3),(4)
02.12.2014
CHEN Hongsheng 9.54 800,000 — (400,000 ) — 400,000 0.02% 28.10.2003- (1),(4),(5)
27.10.2013
13.75 1,000,000 — — — 1,000,000 0.05% 03.12.2004- (2),(4)
02.12.2014
WANG Futian 9.54 800,000 — (400,000 ) — 400,000 0.02% 29.10.2003- (1),(3),(4)
28.10.2013
13.75 1,000,000 — — — 1,000,000 0.05% 03.12.2004- (2),(3),(4)
02.12.2014
LI Jianhong 9.54 800,000 — (400,000 ) — 400,000 0.02% 29.10.2003- (1),(4),(5)
28.10.2013
13.75 1,000,000 — — — 1,000,000 0.05% 02.12.2004- (2),(4)
01.12.2014
MA Zehua 9.54 800,000 — (400,000 ) — 400,000 0.02% 30.10.2003- (1),(3),(4)
29.10.2013
13.75 1,000,000 — — — 1,000,000 0.05% 03.12.2004- (2),(3),(4)
02.12.2014

058
Directors’ Report
China COSCO Holdings Company LimitedANNUAL REPORT 2005
(ii) Movements of the share options, which have been granted under the 2003 Share Option Scheme, during the
year are set out below: (Continued)
Number of share options
Outstanding Outstanding Percentage
Exercise as at Granted Exercised Lapsed as at of total
price 1 January during the during the during the 31 December issued share Exercisable
Category HK$ 2005 year year year 2005 capital period Note
MA Guichuan 9.54 800,000 — (400,000 ) — 400,000 0.02% 29.10.2003- (1),(3),(4)
28.10.2013
13.75 1,000,000 — — — 1,000,000 0.05% 03.12.2004- (2),(3),(4)
02.12.2014
SUN Yueying 9.54 800,000 — (400,000 ) — 400,000 0.02% 29.10.2003- (1),(4),(5)
28.10.2013
13.75 1,000,000 — — — 1,000,000 0.05% 03.12.2004- (2),(4)
02.12.2014
LIU Guoyuan 9.54 100,000 — (100,000 ) — — — 28.10.2003- (1),(3),
27.10.2013 (4), (5)
13.75 1,000,000 — — — 1,000,000 0.05% 29.11.2004- (2),(3),(4)
28.11.2014
Supervisor
LI Yunpeng 9.54 800,000 — (400,000 ) — 400,000 0.02% 29.10.2003- (1),(3),(4)
28.10.2013
13.75 1,000,000 — — — 1,000,000 0.05% 03.12.2004- (2),(3),(4)
02.12.2014
Others(6) 9.54 12,990,000 — (4,092,000 ) — 8,898,000 0.40% (refer to note 1) (1),(5)
13.75 53,740,000 — (5,896,000 ) — 47,844,000 2.17% (refer to note 2) (2),(5)
84,230,000 — (13,788,000 ) — 70,442,000

059China COSCO Holdings Company Limited
ANNUAL REPORT 2005
(ii) Movements of the share options, which have been granted under the 2003 Share Option Scheme, during the
year are set out below: (Continued)
Notes:
(1) The share options were granted during the period from 28 October 2003 to 6 November 2003 under the 2003 Share Option
Scheme at an exercisable price of HK$9.54. The options are exercisable at any time within ten years from the date on which
an offer is accepted or deemed to be accepted by the grantee pursuant to the 2003 Share Option Scheme (the
“Commencement Date”). The Commencement Date of the options of the grantees was from 28 October 2003 to 6
November 2003.
(2) The share options were granted during the period from 25 November 2004 to 16 December 2004 under the 2003 Share
Option Scheme at an exercisable price of HK$13.75. The options are exercisable at any time within ten years from the
Commencement Date. The Commencement Date of the options of the grantees was from 25 November 2004 to 16
December 2004.
(3) During the year, Mr. LIU Goyuan, Mr. ZHANG Fusheng, Mr. WANG Futian, Mr. MA Zehua, Mr. MA Guichuan and Mr. LI
Yunpeng resigned as executive directors of COSCO Pacific with effect from 9 June 2005.
(4) These share options represent personal interest held by the relevant director as beneficial owner.
(5) The weighted average closing price of the COSCO Pacific Shares immediately before the dates on which the options were
exercised was HK$15.74.
(6) This category comprises, inter alia, continuous contract employees and ex-directors of COSCO Pacific.
During the year, no share options were cancelled under the 2003 Share Option Scheme.

060
Directors’ Report
China COSCO Holdings Company LimitedANNUAL REPORT 2005
Directors’ and Supervisors’ Interests in Shares, Underlying Shares and Debentures
As at 31 December 2005, the interests of the Company’s directors and supervisors in the shares, underlying shares
and debentures of the Company or any of its associated corporations (within the meaning of Part XV of the SFO), as
recorded in the register required to be kept by the Company under Section 352 of the SFO or as otherwise notified to
the Company and the Stock Exchange pursuant to the Model Code for Securities Transactions by Directors of Listed
Issuers (the “Model Code”) were as follows:
(a) Long positions in shares, underlying shares and debentures of the Company
NUMBER OF PERCENTAGE OF
NATURE ORDINARY TOTAL ISSUED
NAME OF DIRECTOR CAPACITY OF INTEREST SHARES HELD H SHARES
Mr. TSAO Wen King, Frank Beneficial owner Family 150,000 0.007%
(b) Long positions in shares of associated corporation
NUMBER OF PERCENTAGE OF
NAME OF NATURE ORDINARY TOTAL ISSUED
NAME OF ASSOCIATED CORPORATION DIRECTOR CAPACITY OF INTEREST SHARES SHARE CAPITAL
COSCO Pacific Tsao Wen King, Frank Beneficial owner Personal 50,000 0.002%
COSCO Corporation Wei Jiafu Beneficial owner Personal 1,400,000 0.13%
(Singapore) Limited
COSCO Corporation Li Jianhong Beneficial owner Personal 950,000 0.09%
(Singapore) Limited
COSCO Corporation Sun Yueying Beneficial owner Personal 1,000,000 0.09%
(Singapore) Limited

061China COSCO Holdings Company Limited
ANNUAL REPORT 2005
(c) Long positions in underlying shares of equity derivatives of associated corporation
Movement of the share options granted to the directors or supervisors of the Company by an associated
corporation during the year is set out below:
Number of share options
Percentage
of total issued
Outstanding Outstanding share
Name of Name of as at Granted Exercised Lapsed as at capital of
associated director/ Nature of Exercise 1 January during the during the during the 31 December associated
corporation supervisor Capacity interest Price 2005 year year year 2005 corporation Note
COSCO Pacific Limited WEI Jiafu Beneficial owner Personal HK$9.54 1,000,000 — (500,000) — 500,000 0.02% (1)
Beneficial owner Personal HK$13.75 1,000,000 — — — 1,000,000 0.05% (1)
ZHANG Fusheng Beneficial owner Personal HK$9.54 800,000 — (400,000) — 400,000 0.02% (1)
Beneficial owner Personal HK$13.75 1,000,000 — — — 1,000,000 0.05% (1)
CHEN Hongsheng Beneficial owner Personal HK$9.54 800,000 — (400,000) — 400,000 0.02% (1)
Beneficial owner Personal HK$13.75 1,000,000 — — — 1,000,000 0.05% (1)
WANG Futian Beneficial owner Personal HK$9.54 800,000 — (400,000) — 400,000 0.02% (1)
Beneficial owner Personal HK$13.75 1,000,000 — — — 1,000,000 0.05% (1)
LI Jianhong Beneficial owner Personal HK$9.54 800,000 — (400,000) — 400,000 0.02% (1)
Beneficial owner Personal HK$13.75 1,000,000 — — — 1,000,000 0.05% (1)
MA Zehua Beneficial owner Personal HK$9.54 800,000 — (400,000) — 400,000 0.02% (1)
Beneficial owner Personal HK$13.75 1,000,000 — — — 1,000,000 0.05% (1)
MA Guichuan Beneficial owner Personal HK$9.54 800,000 — (400,000) — 400,000 0.02% (1)
Beneficial owner Personal HK$13.75 1,000,000 — — — 1,000,000 0.05% (1)
SUN Yueying Beneficial owner Personal HK$9.54 800,000 — (400,000) — 400,000 0.02% (1)
Beneficial owner Personal HK$13.75 1,000,000 — — — 1,000,000 0.05% (1)
LIU Guoyuan Beneficial owner Personal HK$9.54 100,000 — (100,000) — — — (1)
Beneficial owner Personal HK$13.75 1,000,000 — — — 1,000,000 0.02% (1)
LI Yunpeng Beneficial owner Personal HK$9.54 800,000 — (400,000) — 400,000 0.02% (1)
Beneficial owner Personal HK$13.75 1,000,000 — — — 1,000,000 0.05% (1)

062
Directors’ Report
China COSCO Holdings Company LimitedANNUAL REPORT 2005
(c) Long positions in underlying shares of equity derivatives of associated corporation (Continued)
Number of share options
Percentage
of total issued
Outstanding Outstanding share
Name of Name of as at Granted Exercised Lapsed as at capital of
associated director/ Nature of Exercise 1 January during the during the during the 31 December associated
corporation supervisor Capacity interest Price 2005 year year year 2005 corporation Note
COSCO International WEI Jiafu Beneficial owner Personal HK$0.57 1,800,000 — — — 1,800,000 0.13% (2), (3)Holdings Limited
Beneficial owner Personal HK$1.37 1,200,000 — — — 1,200,000 0.08% (2), (4)
LI Jianhong Beneficial owner Personal HK$0.57 1,800,000 — — — 1,800,000 0.13% (2), (3)
Beneficial owner Personal HK$1.37 1,200,000 — — — 1,200,000 0.08% (2), (4)
LIU Guoyuan Beneficial owner Personal HK$0.57 1,800,000 — — — 1,800,000 0.13% (2), (3)
Beneficial owner Personal HK$1.37 1,200,000 — — — 1,200,000 0.08% (2), (4)
COSCO Corporation WEI Jiafu Beneficial owner Personal S$0.2 350,000 — (350,000) — — — (5)(Singapore) Limited
Beneficial owner Personal S$0.2 350,000 — (350,000) — — — (6)
Beneficial owner Personal S$0.735 700,000 — (700,000) — — — (7)
Beneficial owner Personal S$1.614 — 450,000 — — 450,000 0.04 (8)
LI Jianhong Beneficial owner Personal S$0.2 200,000 — (200,000) — — — (5)
Beneficial owner Personal S$0.2 250,000 — (250,000) — — — (6)
Beneficial owner Personal S$0.735 500,000 — (500,000) — — — (7)
Beneficial owner Personal S$1.614 — 300,000 — — 300,000 0.03% (8)
SUN Yueying Beneficial owner Personal S$0.2 250,000 — (250,000) — — — (5)
Beneficial owner Personal S$0.2 250,000 — (250,000) — — — (6)
Beneficial owner Personal S$0.735 500,000 — (500,000) — — — (7)
Beneficial owner Personal S$1.614 — 300,000 — — 300,000 0.03% (8)

063China COSCO Holdings Company Limited
ANNUAL REPORT 2005
(c) Long positions in underlying shares of equity derivatives of associated corporation (Continued)
Notes:
(1) The share options were granted by COSCO Pacific. For further information, please refer to the section headed “Share
Options Scheme of COSCO Pacific”.
(2) The share options were granted by COSCO International Holdings Limited (“COSCO International”), an associated
corporation of the Company.
(3) These share options were granted on 26 November 2003 pursuant to the share option scheme approved by
shareholders of COSCO International on 17 May 2002 (the “Share Option Scheme of COSCO International”) and can
be exercised at HK$0.57 per share at any time between 23 December 2003 and 22 December 2008.
(4) These share options were granted on 2 December 2004 pursuant to the Share Option Scheme of COSCO
International and can be exercised at HK$1.37 per share at any time between 29 December 2004 and 28 December
2014.
(5) The share options were granted by COSCO Corporation (Singapore) Limited (“COSCO Corporation (Singapore)”), an
associated corporation of the Company, on 12 August 2002 and can be exercised at any time between 12 August
2003 and 11 August 2007.
(6) The share options were granted by COSCO Corporation (Singapore) on 1 April 2003 and can be exercised at any time
between 1 April 2004 and 31 March 2008.
(7) The share options were granted by COSCO Corporation (Singapore) on 24 May 2004 and can be exercised at any
time between 24 May 2005 and 23 May 2009.
(8) The share options were granted by COSCO Corporation (Singapore) on 6 April 2005 and can be exercised at any time
between 6 April 2006 and 5 April 2010.
Save as disclosed above, as at 31 December 2005, none of the directors, supervisors or chief executives of the
Company had any interests or short positions in any shares or underlying shares or interests in debentures of the
Company or any of its associated corporations (within the meaning of Part XV of the SFO) which were required to be
notified to the Company and the Stock Exchange pursuant to Divisions 7 and 8 of Part XV of the SFO (including
interests or short positions which they were taken or deemed to have under such provisions of the SFO), or which
were required, pursuant to Section 352 of the SFO, to be entered in the register referred to therein, or which were
required, pursuant to the Model Code, to be notified to the Company and the Stock Exchange.

064
Directors’ Report
China COSCO Holdings Company LimitedANNUAL REPORT 2005
Arrangements to purchase shares or debentures
At no time during the year was the Company, its subsidiaries, its fellow subsidiaries or its holding company a party to
any arrangements to enable the directors, supervisors or senior management of the Company to acquire benefits by
means of the acquisition of shares in, or debentures of, the Company or any other body corporate.
Directors’, Supervisors’ and Five Highest Paid Individuals’ Remunerations
Details of the remunerations of the directors and the supervisors of the Company and the five highest paid individuals
of the Group are set out in note 36 to the consolidated financial statements prepared in accordance with the HKFRS
contained herein.
There were no arrangements under which a director or supervisor of the Company had waived or agreed to waive
any remuneration in respect of the year ended 31 December 2005.
Service Contracts of Directors and Supervisors
Each of the directors and supervisors of the Company has entered into a service contract with the Company. No
director or supervisor of the Company has entered into any service contract with the Company, which is not
terminable by the Company within one year without payment of compensation (other than statutory compensation).
Interests of Directors and Supervisors in Contracts
None of the directors or supervisors of the Company had a material interest, whether directly or indirectly, in any
contract of significance to the business of the Group to which the Company or any of its subsidiaries was a party
during the year ended 31 December 2005.

065China COSCO Holdings Company Limited
ANNUAL REPORT 2005
Disclosure under Rule 13.22 of Chapter 13 of the Listing Rules
In relation to the financial assistance granted by COSCO Pacific, a listed subsidiary of the Company, to certain of its
affiliated companies, a proforma combined balance sheet of its affiliated companies as at 31 December 2005
required to be disclosed under Rule 13.22 of Chapter 13 of the Listing Rules is set out below:
RMB’000
Non-current assets 6,796,367
Current assets 382,955
Current liabilities (1,319,558)
Non-current liabilities (2,961,925)
Net assets 2,897,839
Share capital 2,026,298
Reserves 871,541
Capital and reserves 2,897,839
As at 31 December 2005, the Group’s share of net assets of these affiliated companies amounted to
RMB1,020,412,000.
Board Committees
The Company has established an audit committee, a remuneration committee and a nomination committee a
strategic development committee and a risk management committee. For details regarding the board committees,
please refer to the relevant section in the Corporate Governance Report on pages 74 to 78 of this report.

066
Directors’ Report
China COSCO Holdings Company LimitedANNUAL REPORT 2005
Corporate Governance
The Company is committed to fulfilling its responsibilities to shareholders by ensuring that the proper processes for
oversight and management of its businesses are in place, in operation and are regularly reviewed. For details, please
refer to the relevant section in the Corporate Governance Report on pages 69 to 80 of this report.
Employees and Remuneration Policies
The Group always considers that staff team is the key pillar for its continuous steady growth. Throughout history, the
Group has consistently regarded the team spirit building activities as one of the most important long-term
development plans. To fully cope with the business expansion of its container shipping, container terminal, container
leasing, freight forwarding and shipping agency businesses, the Group strives to provide professional training to the
management and attract competent expertise. The Group endeavours to cultivate harmonious working atmosphere
with the aims of promoting enthusiasm and achieving a co-operative, respectful and faithful relationship.
The Group has continued to improve the remuneration packages for its employees based on fair principles. The
management reviews the remuneration policies on a regular basis to formulate more reasonable incentives and
appraisal measures. As at 31 December 2005, there were 8,579 employees in the Group. Total staff costs of the
Group for the year, including directors’ remuneration, totalled approximately RMB2,504,271,000.
Repurchase, Sale or Redemption of the Shares of the Company
During this reporting period, the Company did not redeem any of its shares. Neither the Company and its subsidiaries
repurchased or sold any shares of the Company during the year.
Donations
Donations made by the Group during the year amounted to RMB2,921,000.

067China COSCO Holdings Company Limited
ANNUAL REPORT 2005
Corporate Culture
The Company sees a positive corporate culture important in laying a solid foundation for the continuous development
of an enterprise. While actively expanding its business, the Group puts much emphasis on building its corporate
culture, setting out the guiding principle of “achieving customer satisfaction and creating value to shareholders” for
our employees with a view to “maximizing return for shareholders”. Having due regard to its employees, shareholders,
customers, other stakeholders and the community as a whole and adhering to its corporate value of “integrity,
creativity, growth, good communication, understanding, sound management, morality and dedicated services”, the
Group takes a people-oriented approach and encourages life-long learning so as to create an environment featuring
“integrity, progression, exploration and innovation”.
Annual General Meeing
The notice of the annual general meeting of the Company is set out on pages 81 to 82 of this report.
Auditors
The Company has appointed PricewaterhouseCoopers and BDO Reanda Certified Public Accountants as the
international and PRC auditors of the Company for the year ended 31 December 2005. PricewaterhouseCoopers has
conducted the audit of the Group’s financial statements which are prepared in accordance with HKFRS.
PricewaterhouseCoopers and BDO Reanda Certified Public Accountants have been engaged by the Company since
its listing date. Resolutions for re-appointments of PricewaterhouseCoopers and BDO Reanda Certified Public
Accountants as the international and PRC auditors of the Company will be proposed at the forthcoming
shareholders’ annual general meeting on 15 June 2006.
By order of the Board of Directors
Wei Jiafu
Chairman
Beijing, the PRC
11 April 2006

068
Report of the Supervisory Committee
China COSCO Holdings Company LimitedANNUAL REPORT 2005
To: All Shareholders
For the year ended 31 December, 2005, all members of the supervisory committee of the Company have adhered to
the principles of diligence and integrity to perform their supervisory duties and safeguard the interests of the
Company and shareholders pursuant to the “Company Law of the People’s Republic of China”, “Rules governing the
Listing of Securities on the Stock Exchange of Hong Kong Limited”, “Articles of Association” of China COSCO and
other relevant laws and regulations.
During the period, the supervisory committee is mainly responsible for: convening meetings of the supervisory
committee, attending board meetings of the Company, reviewing minutes and resolutions of board meetings, make
recommendations and giving advice to the board of directors on the business operations and development plans of
the Company.
During the period, the supervisory committee has supervised the convening procedures, matters to be resolved and
execution of the resolutions of general meetings and board meetings, as well as the performance of duties by senior
management of the Company and the management system of the Company. The supervisory committee believes
that with the objectives of maximizing returns for shareholders, corporate value and operating efficiency, all members
of the board of directors and senior management of the Company have seriously performed their duties, have
conducted business in accordance to the laws and regulated the operations so as to ensure sustained growth of the
Company’s operating results and completed the tasks delegated by shareholders satisfactorily. During the period, no
violation of laws, regulations and articles of association and infringement of shareholders’ interests by the above
people was found.
During the period, the supervisory committee has reviewed the audit report with unqualified opinion issued by
PricewaterhouseCoopers on the Group’s financial statements prepared in accordance with the Hong Kong Financial
Reporting Standards and is of the view that the financial information in the financial statements reflected the operating
results and financial position of the Company in a true, complete and fair manner and the evaluation on relevant
matters was objective and unbiased, and that the profit distribution plan was in line with the current operating
conditions of the Company, which is favourable to the long-term development of the Company.
Li Yunpeng
Chairman of the Supervisory Committee
Beijing, the PRC
11 April 2006

069
Corporate Governance Report
China COSCO Holdings Company Limited ANNUAL REPORT 2005
Since the commencement of its listing on the Main Board of the Stock Exchange on 30 June 2005, the Company is
committed to maintain high standard of corporate governance in compliance with the requirements of the Code of
Best Practice (“Code of Best Practice”) as set out in Appendix 14 to the Listing Rules. To fulfill the responsibilities to
its shareholders, the Company will remain committed to improving its corporate governance practices continuously to
ensure that the appropriate operation monitoring and management procedures are in place, enforced and regularly
reviewed.
In accordance with the Code of Best Practice, this report is prepared to outline and explain the corporate governance
mechanisms of the Company. It includes all the mandatory disclosures and most of the recommended disclosures
required under Appendix 23 to the Listing Rules.
Directors’ Securities Transactions
Since the commencement of its listing, the Company’s Board of Directors (the “Board”) has adopted the Model Code
for Securities Transactions by Directors of Listed Issuers (“Model Code”) as set out in Appendix 10 to the Listing
Rules as the code for the dealings in securities transactions by the directors of the Company. Having made specific
enquiries with all directors, the Company has received written confirmations from all directors that they have complied
with the required standard set out in the Model Code throughout the year ended 31 December 2005.
Board of Directors
The Board of the Company comprises of 2 executive Directors, 7 non-executive directors and 4 independent non-
executive Directors. The Company believes that, given the different backgrounds and experiences of its members,
the Board is capable of making decisions with a high level of care and diligence. On the website of the Company, all
the members of the Board are listed by categories (including Chairman, Vice-Chairman, Executive Director, Non-
executive Director and Independent Non-executive Director), together with their respective biographies.
The Board acts under the objective of maximizing the Company’s operating profits, business value and shareholders’
returns of the Company. In accordance with the articles of association, and the rules of procedures for the Board and
the special committees, and under the leadership of the chairman, the Board formulates and implements the
development strategies, business directions, annual budgets, business plans, investment schemes, investment
proposals and major acquisitions, as well as monitors the performance of the management of the Company.
070
Corporate Governance Report
China COSCO Holdings Company LimitedANNUAL REPORT 2005
In 2005, 9 meetings were held by the Board. The attendance details are as follows:
Attendance
Executive Directors:
Wei Jiafu 8/9 (the remaining 1 meeting attended by his alternate director)
Chen Hongsheng 9/9
Non-executive Directors:
Zhang Fusheng 9/9
Wang Futian 8/9 (the remaining 1 meeting attended by his alternate director)
Li Jianhong 8/9 (the remaining 1 meeting attended by his alternate director)
Ma Zehua 7/9 (the remaining 2 meeting attended by his alternate director)
Ma Guichuan 8/9 (the remaining 1 meeting attended by his alternate director)
Sun Yueying 8/9 (the remaining 1 meeting attended by her alternate director)
Liu Guoyuan 9/9
Independent Non-executive Directors:
Li Boxi 8/9 (the remaining 1 meeting attended by her alternate director)
Tsao Wen King, Frank 9/9
Hamilton Alexander Reid 9/9
Cheng Mo Chi 9/9
The Company has already established the rules of procedures for the Board. The Rules of Procedures for the Board
of Directors and the Special Committees of the China COSCO Holdings Company Limited (the “Rules of
Procedures”) were considered and approved at the 7th meeting of the first Board of the Company. The rules govern,
inter alia, the conduct of meetings, submission and consideration of resolutions, and the recording of minutes.
The Company Secretary is responsible for ensuring that the course of conduct of the Board is in compliance with
such rules and for advising the Board in respect of corporate governance and compliance matters. The Company
Secretary and the Investor Relations Department shall closely communicate with all the directors to ensure that all
matter raised by any director for discussions are included in the agenda of forthcoming board meetings in a timely
manner.

071China COSCO Holdings Company Limited
ANNUAL REPORT 2005
Chairman and Chief Executive Officer
Currently, Mr. Wei Jiafu is the Chairman and Chief Executive Officer of the Company. This has shown a deviation from
the Code on Corporate Governance Practices contained in Appendix 14 to the Listing Rules that the roles of the
Chairman and Chief Executive Officer should be segregated and should not be exercised by the same individual.
The Chairman assumes the responsibility to lead the Board in discharging its duties; provide guidance and make
decisions on the long-term development strategies, corporate development objectives and business philosophies of
the Company; convene and preside at the meetings of the Board; organize the course of business of the Board in
discharging its duties; and scrutinize the implementation of the resolutions of the Board. On the other hand, the
primary role of the Chief Executive Officer is to be responsible for the day-to-day management and operations of the
Company and business of the Group.
The Board considers that an abrupt segregation of the roles of the Chairman and Chief Executive Officer will involve a
realignment of power and authority under the existing corporate structure, which might affect the ordinary business
activities of the Company and might thereby lead to additional costs to the Group. Notwithstanding the above, the
Board will review the current structure from time to time and will make any necessary adjustment as appropriate.

Corporate Governance Report
072China COSCO Holdings Company LimitedANNUAL REPORT 2005
Non-executive Directors
For the year ended 31 December 2005, the Company has been in compliance with the requirements under Rule 3.10
of the Listing Rules, with the number of its non-executive directors being kept above the minimum requirement of
three, and the independent non-executive directors are equipped with the appropriate professional qualifications, or
accounting or related financial management expertise.
Four members, or nearly 1/3, of the Board of the Company are independent non-executive Directors, who have the
expertise and remarkable achievements in strategic development, shipping, finance and legal affairs. The Company
believes that its independent non-executive Directors are sufficient in number and competent to offer advice with due
weight.
The Company has received a written confirmation from each of its independent non-executive Directors concerning
their respective independence as required under Rule 3.13 under the Listing Rules and considers the four
Independent Non-executive Directors to be independent of the Group.
The Company has entered into a service contract with each of its directors for a term of three years. Other than such
service contracts, neither the Company, nor any of its subsidiaries, has any existing or proposed service contract with
any of its independent non-executive Directors. Further, none of the independent non-executive Directors has a
service contract with the Company which is not terminable by the Company within one year without payment of
compensation (other than statutory compensation).
There is no other connection between the Company and each of its directors which is subject to disclosure
requirement.

073China COSCO Holdings Company Limited
ANNUAL REPORT 2005
Directors’ Access to Information
The Company is committed to provide all of its directors with timely access to relevant information to ensure that all of
its directors are able to make an informed decision in discharging their duties and responsibilities.
During 2005, all of the regular Board meetings of the Company were called by giving 14 days’ notice in writing
together with the agenda. As for other Board meetings, the Company has also duly observed the requirement of
giving at least 14 days’ notice in writing. Prior to any Board meetings, the Company Secretary and Investor Relations
Department took the initiative to consult the directors in respect of any material matter to be included in the agenda.
Matters discussed in the Board meetings were recorded and compiled with due care by the Company Secretary. The
records (including minutes) of the Board meetings are kept as important files at the premises of the Company, and
have been available to the directors of the Company as and when necessary.
Formal and informal communications between the management and directors of the Company were carried out via
Board meetings and other activities from time to time.
Quarterly reports on the state of affairs of the Company were submitted to all the directors on a quarterly basis. Since
November 2005, such reports have been submitted to all the directors on a monthly basis to ensure all directors are
informed of the material matters of the Company in a timely manner.
Directors’ Responsibilities for Financial Statements
This section, which sets out the responsibilities of directors for financial statements, shall be read in conjunction, but
interpreted in its own context, with the auditor’s report contained in this annual report, in which the auditor’s
responsibility to report is explained.
The directors acknowledge their responsibility for ensuring that the financial statements are properly prepared to
reflect a true and fair view of the Company and of the Group for each financial year.
The directors are of the view that in the preparation of the financial statements, appropriate accounting policies and
relevant accounting principles and the Group are consistently applied and complied with.
Having made reasonable enquiries, the directors are of the view that the Company has sufficient resources to sustain
its operations in the foreseeable future, and that they are not aware of any uncertainty or situation of a material nature
which may affect the Company’s ability to continue as a going concern. Therefore the directors consider that it is
appropriate to prepare the financial statements of the Company on a going concern basis.

Corporate Governance Report
074China COSCO Holdings Company LimitedANNUAL REPORT 2005
Committees under the Board
There are six committees under the Board and each of these committees has their specific terms of reference. Each
of the members of such committees is authorized to make the relevant decisions within the terms of reference of their
respective committees.
(1) Remuneration Committee
The Remuneration Committee of the Company, established in April 2005, comprises two independent non-
executive Directors and one non-executive Director. It is chaired by Mr. Cheng Mo Chi (Chairman), and the
other two members are Mr. Ma Zehua and Mr. Alexander Reid Hamilton.
The Remuneration Committee is mainly responsible for making recommendations to the Board on the
remuneration polices and structures for the Directors and Supervisors of the Company. In addition, the
Remuneration Committee is also responsible for assessing the performance and determining the salary
packages of the management with the reference to the corporate objectives approved by the Board from time
to time. The Remuneration Committee convenes meetings whenever necessary and reports to the Board.
The details of the terms of reference of the Remuneration Committee are set out in the listing prospectus of the
Company, which can be made available for inspection at any time from the Investor Relations Department of
the Company. The Company also intends to post the details of such information on its website
(www.chinacosco.com) in due course.
During the year, the Remuneration Committee held one meeting, on 16 December 2005, which was attended
by all three members and during which the remuneration matters of the senior management of the Company
were discussed. According to the “Management Practices Concerning the Remunerations of the Senior
Management of China COSCO” submitted by the Remuneration Committee to the Board, the remuneration of
the senior management have been linked to the operating performance of the Company.
The Remuneration Committee is provided with forthcoming assistance in discharging its duties by the Human
Resources Department and Investor Relations Department of the Company. Where necessary and subject to
the established procedures, the committee members may also seek independent professional advice with
costs incurred to be borne by the Company.

075China COSCO Holdings Company Limited
ANNUAL REPORT 2005
(2) Nomination Committee
The Nomination Committee of the Company, established in April 2005, comprises two independent non-
executive Directors and one non-executive Directors. It is chaired by Mr. Tsao Wen King, Frank and the other
two members are Mr. Wang Futian and Mr. Cheng Mo Chi.
The Nomination Committee is mainly responsible for nominating potential candidates for directorships,
reviewing the nomination of directors and making recommendations to the Board on directorship
appointments. The details of the terms of reference of the Nomination Committee are set out in the listing
prospectus of the Company, which can be made available for inspection at any time from the Investor Relations
Department of the Company. The Company also intends to provide the details of such information on its
website (www.chinacosco.com) in due course.
Under Article 96 of the Articles of Association of the Company, “the proposed directors on the first Board shall
be nominated by the promoters and returned by election in the inaugural meeting of the Company.” The first
Board was formed accordingly. In 2005, although the Nomination Committee did not meet formally, its
members did exchange views on the performance of the members of the Board. The Nomination Committee
will convene meetings whenever necessary and report to the Board.
The Nomination Committee is provided with forthcoming assistance in discharging its duties by the Human
Resources Department and Investor Relations Department of the Company. Where necessary and subject to
the established procedures, the committee members may also seek independent professional advice and any
cost incurred shall be borne by the Company.
(3) Audit Committee
The Audit Committee of the Company, established in April 2005, comprises two independent non-executive
Directors and one non-executive Director. It is chaired by Mr. Alexander Reid Hamilton and the other two
members are Ms. Sun Yueying and Mr. Cheng Mo Chi. All members of the committee are competent and
experienced in understanding, analysing and reviewing the financial reports of listed companies. Mr. Hamilton,
the chairman, was formerly a partner of Pricewaterhouse and left the practice about twenty years ago and
ceased to have an economic interest therein at least five years ago. Neither Mr. Cheng Mo Chi, nor Ms. Sun
Yueying was a partner of the auditors of the Company.
For the year ended 31 December 2005, the Company has been in compliance with the requirements relating to
audit committee under Rule 3.21 of the Listing Rules.

Corporate Governance Report
076China COSCO Holdings Company LimitedANNUAL REPORT 2005
The Audit Committee is mainly responsible for reviewing and monitoring the financial reporting procedures of
the Company. It is also responsible for overseeing all matters in respect of, among other things, the
appointment, remuneration, removal and resignation of auditors. Besides, it is the duty of the audit committee
to review the robustness of the internal control system, including the ongoing review of the effectiveness of
various checks and balances in respect of the corporate structure and business processes of the Company, as
well as considering the existence of any potential risks and the degree of urgency in controlling them to ensure
the smooth business operation and effective implementation of the corporate goals and strategies of the
Company. The scope of review covers finance, operation, legal compliance and risk management. Meanwhile,
the Audit Committee reviews the internal audit plans of the Company and submits reports and
recommendations to the Board from time to time. The details of the terms of reference of the Audit Committee
can be made available for inspection at any time from the Investor Relations Department of the Company. The
Company also intends to post the details of such information on its website (www.chinacosco.com) in due
course.
During the Period, the Audit Committee of the Company had only one meeting, which was attended by all
members as well as the president of the Company and Chief Financial Officer, who were invited to offer advice
on the relevant matters. During the meeting, the Audit Committee reviewed the management, accounting
policies and principles, internal control and financial reports of the Group, including the consolidated interim
financial reports prepared by the Company in accordance with the Hong Kong Financial Reporting Standards.
The minutes, prepared by the Company Secretary and endorsed by the chairman of the Audit Committee, was
sent to the members of the committee within seven days of the meeting.
The Audit Committee is provided with forthcoming assistance in discharging its duties by the Finance
Department and Investor Relations Department of the Company. Where necessary and subject to the
established procedures, the committee members may also seek independent professional advice with costs
incurred to be borne by the Company.

077China COSCO Holdings Company Limited
ANNUAL REPORT 2005
(4) Strategic Development Committee
The Strategic Development Committee of the Company, established in April 2005, comprises two independent
non-executive Directors and one non-executive Director. It is chaired by Ms. Li Boxi and the other two
members are Mr. Ma Guichuan and Mr. Tsao Wen King, Frank.
The committee is responsible for considering, evaluating, reviewing and making recommendations to the Board
in respect of proposed major investments, acquisitions and disposals. It is also responsible for conducting
post-investment evaluation of investment projects and for reviewing and considering the overall strategic
direction and business developments of the Company. The details of the terms of reference of the Strategic
Development Committee are set out in the listing prospectus of the Company, which can be made available for
inspection at any time from the Investor Relations Department of the Company. The Company also intends to
post the details of such information on its website in due course.
The Strategic Development Committee is provided with forthcoming assistance in discharging its duties by the
Strategic Development Department and Investor Relations Department of the Company. Where necessary and
subject to the established procedures, the committee members may also seek independent professional advice
and any cost incurred shall be borne by the Company.
(5) Risk Management Committee
The Risk Development Committee of the Company, established in April 2005, comprises two independent non-
executive Directors and one non-executive Director. It is chaired by Mr. Li Jianhong and the other two members
are Ms. Li Boxi and Mr. Tsao Wen King, Frank.
The Risk Development Committee provides independent support to the Board to identify the operational risks
of the Company, monitor and manage these risks, set the direction for the Group’s risk management Strategies
and strengthen the risk management system of the Group. The details of the terms of reference of the Risk
Management Committee are set out in the listing prospectus of the Company, which can be made available for
inspection at any time from the Investor Relations Department of the Company. The Company also intends to
post the details of such information on its website in due course.
The Risk Management Committee is provided with forthcoming assistance in discharging its duties by the
Strategic Development Department, Finance Department and Investor Relations Department of the Company.
Where necessary and subject to the established procedures, the committee members may also seek
independent professional advice with costs incurred to be borne by the Company.

Corporate Governance Report
078China COSCO Holdings Company LimitedANNUAL REPORT 2005
(6) Executive Committee
Under the approval granted in the 9th meeting of the first Board, the Executive Committee of the Company wasestablished in December 2005 to facilitate the business management of the Group in a more efficient andeffective manner. The terms of reference, scope of responsibilities and rules of procedures, applicable to thecommittee, inter alia, have been expressly approved by the Board.
The committee is formed by the directors and senior management of the Company. It is chaired by Mr. WeiJiafu and other members include Mr. Zhang Fusheng, Mr. Chen Hongsheng, Ms. Sun Yueying, Mr. Xu Lirong,Mr. Sun Jiakang, Mr. He Jiale and Mr. Zhang Yongjian. The committee is responsible for reviewing andapproving investment projects within the authority delegated by the Board. Notwithstanding the necessarypowers given to the Executive Committee by the Board, prior written approval of the Board is required forconducting of the major transactions.
The minutes of each meeting of the committee shall be forwarded to all members of the Board within sevendays of the date of the meeting. Resolutions of the Executive Committee are subject to the endorsement at thenext Board meeting subsequent to such resolutions were passed.
Remuneration of Auditors
The Company appointed PricewaterhouseCoopers and BDO Reanda Certified Public Accountants Co., Ltd. as theCompany’s international and PRC auditors on 9 June 2005.
The fees for the audit services, audit-related services and non-audit services provided by the above auditors to theGroup for the period amounted to RMB27,277,000, RMB15,094,000 and RMB2,154,000 respectively.
Internal Control
The Board is responsible for the general internal control of the Group. In order to strengthen its internal control, theCompany, since it was founded, has established a series of codes and regulations, including the “ProvisionalInvestment Management Code for China COSCO Holdings Company Limited”, the “Investment Management Codefor China COSCO Holdings Company Limited”, the “Borrowing and Guarantee Management Code for China COSCOHoldings Company Limited”, the “Code for the Performance Appraisal of the Management of the MemberCompanies of China COSCO”, and the “Regulations Monitoring the Connected Transactions of COSCO ContainerLines Company Limited”. The Company considers that, through overseeing and examining their implementation, thevarious codes and regulations can be effectively inferred thereby generating the effect as desired for improving thestate of affairs of the various businesses of the Company.
The management and directors of the Company held a series of discussions on the effectiveness of the riskmanagement and internal control systems. Mr. Hamilton, the chairman of the Audit Committee, even made a visit tothe headquarters of the Company and to COSCON, a subsidiary of the Company, to discuss with the managementand executives of different functions the internal audit and internal controls of the Company.

079China COSCO Holdings Company Limited
ANNUAL REPORT 2005
The Company believes that the constant improvement and effective implementation of its internal control system can
facilitate the timely reaction to potential risks threatening the Company for the better protection of the interests of its
customers and shareholders.
The Board is largely satisfied with the internal control performance of the Company.
Shareholders’ Rights
The Board and the senior management of the Company are well aware of their respective responsibilities to represent
the interests of the shareholders as a whole and to do their best to create better value to the shareholders.
Article 52 of the Articles of Association of the Company expressly provides for the rights of the shareholders. Under
section 8 of the Articles, the right to attend, to receive notices to, and to vote in general meetings and the rules of
procedure for general meetings are specifically set out to safeguard the rights of the shareholders to express their
opinions in general meetings.
The Company has made aggressive efforts to set up multiple communication channels so as to keep its shareholders
informed in a timely manner of its state of affairs:
• Subsequent to its listing on 30 June 2005, the Company announced its interim results on 15 September 2005.
To keep its shareholder updated of its state of affairs, despite the shortness of time, the Company announced
its quarterly operational summary for the third quarter of 2005 on 10 November 2005.
• General meetings, as a means of communications between the directors and the management, and the
shareholders of the Company, are given a high priority by the Company. Therefore, all the directors and senior
management of the Company will try their best to attend every general meeting.
• News and information relevant to the corporate and business affairs of the Company are uploaded onto the
website of the Company from time to time.
• Shareholders may also contact the company secretary through the Investor Relations Department (852-2809
8028, 86-10-6649 2295/6649 2292) or by email at [email protected].

Corporate Governance Report
080China COSCO Holdings Company LimitedANNUAL REPORT 2005
Investor Relations
The Company considers that good investor relations are conducive to the development of a broader access to
financing, which will help reflect the intrinsic value of the business in the share price, thereby creating value to the
shareholders.
In June 2005, under the leadership of the Chairman, Mr. Wei Jaifu, the senior management of the Company
participated in the roadshow world tour for the promotion of the initial public offering of the shares of the Company.
During the period, the executives met hundreds of investors and other parties around the world through, among
others, one-to-one meetings, press release conferences and luncheon meetings.
The Company’s investor relations activities are coordinated by the secretary to the Board, who is a member of the
senior management. Besides, the Investors Relations Department of the Company has been set up to assume the
responsibilities for information disclosure and communications to external parties. Since listed, the Company has
been in strict compliance with the relevant rules and regulations on information disclosure. It has also been striving to
disclose the important news and events of the Company to the public and the investment community the soonest
practicable and to maintain good two-way communications with different sectors via various communication
channels. By way of two-way communications, the Company is able to help the investors and relevant parties to
appreciate the intrinsic value of its business, and to understand the key issues of concern of the investors so as to
further improve the standards of corporate governance of the Company.
The Company maintains contact and communications with, among others, fund managers, analysts and the
business media in a pragmatic and high efficiency manner. During the period under review, the Company successfully
organized numerous management interviews, telephone conferences and visits by analysts and investors. The
Company also actively participated in a number of investor forums held by investment banks to promote its corporate
profile. At the same time, an investor relations webpage was created on the website of the Company
(www.chinacosco.com) to address the enquiries of the investors. In the second half of 2005, the Company met 198
investors and relevant parties in different meetings. Among the figure, 64% were fund managers, 21% analysts and
15% the business media.
Abiding by the principles of high transparency, integrity, fairness and openness, the Company will continue to
maintain smooth communication channels with different sectors. By doing so, the Company will be able to create
better business and shareholders’ value.
2006 will be the first complete year of operation of the Company after its listing in Hong Kong. The Company will
leverage its wealth of experience to respond to changes in regulatory policies and to take into account the comments
of its shareholders so as to keep on improving its corporate governance standards to support the sustainable healthy
growth of the Company.

081
Notice of Annual General Meeting
China COSCO Holdings Company Limited ANNUAL REPORT 2005
NOTICE IS HEREBY GIVEN that an annual general meeting of China COSCO Holdings Company Limited (the
“Company”) will be held at 2:30 p.m. on Thursday, 15 June 2006 at Function Room, 47th Floor, COSCO Tower, 183
Queen’s Road Central, Hong Kong for the purposes of considering and, if thought fit, passing the following
resolutions (with or without modifications) as ordinary resolutions of the Company:
AS ORDINARY RESOLUTIONS
1. To consider and approve the report of the board of directors of the Company (the “Board of Directors”) for the
year ended 31 December 2005.
2. To consider and approve the report of the supervisory committee of the Company for the year ended 31
December 2005.
3. To consider and approve the report of the auditors and audited consolidated financial statements of the
Company for the year ended 31 December 2005.
4. To consider and approve the payment of a final dividend for the year 2005 and the profit appropriation proposal
(including making an appropriation to the discretionary surplus reserve) as proposed by the Board of Directors.
5. To consider and approve the re-appointment of PricewaterhouseCoopers as the international auditors and BDO
Reanda Certified Public Accountants as the PRC auditors of the Company to hold office until the conclusion of
the next annual general meeting and to authorize the Board of Directors to fix their remuneration.
And to consider and approve other matters, if any.
By order of the Board of Directors
WEI Jiafu
Chairman
Beijing, the PRC
24 April 2006

Notice of Annual General Meeting
082China COSCO Holdings Company LimitedANNUAL REPORT 2005
Notes:
1. According to the Articles of Association of the Company, resolutions at general meetings of the Company will be determined
by a show of hands unless a poll is required under the Listing Rules or demanded before or after any vote by show of hands.
A poll may be demanded by the chairman of the meeting or at least two shareholders entitled to vote, present in person or by
proxy, or by one or more shareholders present in person or by proxy representing 10% or more of all shares carrying the
voting rights at the meeting singly or in aggregate. Irrespective of whether the voting is carried out by show of hands or by
poll, the votes counted will be based on the number of shares represented by such votes.
2. The register of members will be closed from 17 May 2006 to 15 June 2006, both days inclusive, during which period no
transfer of shares will be effected. Holders of H shares and domestic shares of the Company whose names appear on the
register of members of the Company on 16 May 2006 at 4:00 p.m. are entitled to attend this meeting.
3. A shareholder entitled to attend and vote at this meeting may appoint one or more proxies to attend and vote in his stead. A
proxy need not to be a shareholder of the Company.
4. The instrument appointing a proxy must be in writing under the hand of a shareholder or his attorney duly authorised in
writing. If the shareholder is a corporation, that instrument must be either under its common seal or under the hand of its
director(s) or duly authorised attorney(s). If that instrument is signed by an attorney of the shareholder, the power of attorney
authorising that attorney to sign or other authorisation document must be notarised.
5. In order to be valid, the form of proxy together with the power of attorney or other authorisation document (if any) must be
deposited at the registered office of the Company for holders of domestic shares and at the Company’s H share registrar,
Computershare Hong Kong Investor Services Limited (address: Units 1712-1716, 17th Floor, Hopewell Centre, 183 Queen’s
Road East, Wanchai, Hong Kong) for holders of H shares not less than 24 hours before the time appointed for the holding of
this meeting or any adjournment thereof (as the case may be). Completion and return of a proxy form will not preclude a
shareholder from attending and voting in person at this meeting if he so wishes.
6. Shareholders who intend to attend this meeting in person or by proxy should return the reply slip to the registered office of
the Company for holders of domestic shares and the Company’s H share registrar, Computershare Hong Kong Investor
Services Limited, for holders of H shares not later than 20 days before the date of this meeting, i.e. Friday, 26 May 2006.
7. Shareholders or their proxies attending this meeting shall produce their identity documents.

083
Auditors’ Report
China COSCO Holdings Company LimitedANNUAL REPORT 2005
AUDITORS’ REPORT TO THE SHAREHOLDERS OF
CHINA COSCO HOLDINGS COMPANY LIMITED
(incorporated in the People’s Republic of China with limited liability)
We have audited the financial statements on pages 84 to 207 which have been prepared in accordance with accounting
principles generally accepted in Hong Kong.
Respective responsibilities of directors and auditors
The Company’s directors are responsible for the preparation of financial statements which give a true and fair view. In preparing
financial statements which give a true and fair view it is fundamental that appropriate accounting policies are selected and
applied consistently.
It is our responsibility to form an independent opinion, based on our audit, on those financial statements and to report our opinion
to you, as a body, and for no other purpose. We do not assume responsibility towards or accept liability to any other person for
the contents of this report.
Basis of opinion
We conducted our audit in accordance with Hong Kong Standards on Auditing issued by the Hong Kong Institute of Certified
Public Accountants. An audit includes examination, on a test basis, of evidence relevant to the amounts and disclosures in the
financial statements. It also includes an assessment of the significant estimates and judgements made by the directors in the
preparation of the financial statements, and of whether the accounting policies are appropriate to the circumstances of the
Company and the Group, consistently applied and adequately disclosed.
We planned and performed our audit so as to obtain all the information and explanations which we considered necessary in
order to provide us with sufficient evidence to give reasonable assurance as to whether the financial statements are free from
material misstatement. In forming our opinion we also evaluated the overall adequacy of the presentation of information in the
financial statements. We believe that our audit provides a reasonable basis for our opinion.
Opinion
In our opinion the financial statements give a true and fair view of the state of the affairs of the Company and of the Group as at
31 December 2005 and of the profit and cash flows of the Group for the year then ended and have been properly prepared in
accordance with the disclosure requirements of the Hong Kong Companies Ordinance.
PricewaterhouseCoopers
Certified Public Accountants
Hong Kong, 11 April 2006
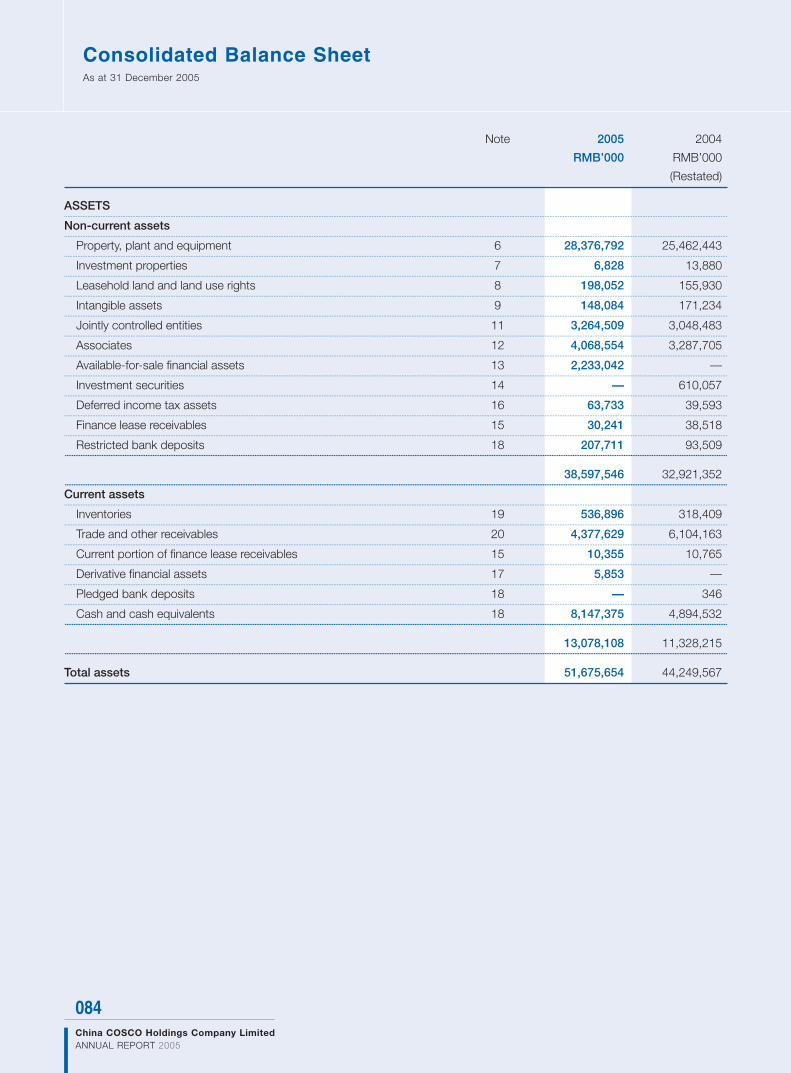
084
Consolidated Balance SheetAs at 31 December 2005
China COSCO Holdings Company LimitedANNUAL REPORT 2005
Note 2005 2004
RMB’000 RMB’000
(Restated)
ASSETS...............................................................................................................................................................................................................................................................................................................................................................................................................
Non-current assets...............................................................................................................................................................................................................................................................................................................................................................................................................
Property, plant and equipment 6 28,376,792 25,462,443...............................................................................................................................................................................................................................................................................................................................................................................................................
Investment properties 7 6,828 13,880...............................................................................................................................................................................................................................................................................................................................................................................................................
Leasehold land and land use rights 8 198,052 155,930...............................................................................................................................................................................................................................................................................................................................................................................................................
Intangible assets 9 148,084 171,234...............................................................................................................................................................................................................................................................................................................................................................................................................
Jointly controlled entities 11 3,264,509 3,048,483...............................................................................................................................................................................................................................................................................................................................................................................................................
Associates 12 4,068,554 3,287,705...............................................................................................................................................................................................................................................................................................................................................................................................................
Available-for-sale financial assets 13 2,233,042 —...............................................................................................................................................................................................................................................................................................................................................................................................................
Investment securities 14 — 610,057...............................................................................................................................................................................................................................................................................................................................................................................................................
Deferred income tax assets 16 63,733 39,593...............................................................................................................................................................................................................................................................................................................................................................................................................
Finance lease receivables 15 30,241 38,518...............................................................................................................................................................................................................................................................................................................................................................................................................
Restricted bank deposits 18 207,711 93,509.........................................................................................................................................................................................................................................................................................................................................................................................
38,597,546 32,921,352.........................................................................................................................................................................................................................................................................................................................................................................................Current assets...............................................................................................................................................................................................................................................................................................................................................................................................................
Inventories 19 536,896 318,409...............................................................................................................................................................................................................................................................................................................................................................................................................
Trade and other receivables 20 4,377,629 6,104,163...............................................................................................................................................................................................................................................................................................................................................................................................................
Current portion of finance lease receivables 15 10,355 10,765...............................................................................................................................................................................................................................................................................................................................................................................................................
Derivative financial assets 17 5,853 —...............................................................................................................................................................................................................................................................................................................................................................................................................
Pledged bank deposits 18 — 346...............................................................................................................................................................................................................................................................................................................................................................................................................
Cash and cash equivalents 18 8,147,375 4,894,532.........................................................................................................................................................................................................................................................................................................................................................................................
13,078,108 11,328,215.........................................................................................................................................................................................................................................................................................................................................................................................
Total assets 51,675,654 44,249,567

085China COSCO Holdings Company Limited
ANNUAL REPORT 2005
Note 2005 2004
RMB’000 RMB’000
(Restated)
EQUITY...............................................................................................................................................................................................................................................................................................................................................................................................................
Capital and reserves...............................................................................................................................................................................................................................................................................................................................................................................................................
Share capital 21 6,140,000 4,100,000...............................................................................................................................................................................................................................................................................................................................................................................................................
Reserves 22 11,498,152 3,349,204...............................................................................................................................................................................................................................................................................................................................................................................................................
Proposed final dividend 22 798,200 —.........................................................................................................................................................................................................................................................................................................................................................................................
18,436,352 7,449,204...............................................................................................................................................................................................................................................................................................................................................................................................................
Minority interests 7,508,740 5,953,318.........................................................................................................................................................................................................................................................................................................................................................................................
Total equity 25,945,092 13,402,522.........................................................................................................................................................................................................................................................................................................................................................................................
LIABILITIES...............................................................................................................................................................................................................................................................................................................................................................................................................
Non-current liabilities...............................................................................................................................................................................................................................................................................................................................................................................................................
Long-term borrowings 23 12,369,503 12,249,443...............................................................................................................................................................................................................................................................................................................................................................................................................
Amount due to COSCO 24 — 9,105...............................................................................................................................................................................................................................................................................................................................................................................................................
Other non-current liabilities 25 127,662 105,881...............................................................................................................................................................................................................................................................................................................................................................................................................
Derivative financial liabilities 17 16,199 —...............................................................................................................................................................................................................................................................................................................................................................................................................
Deferred income tax liabilities 16 708,706 804,798.........................................................................................................................................................................................................................................................................................................................................................................................
13,222,070 13,169,227.........................................................................................................................................................................................................................................................................................................................................................................................Current liabilities...............................................................................................................................................................................................................................................................................................................................................................................................................
Trade and other payables 26 7,357,719 11,673,069...............................................................................................................................................................................................................................................................................................................................................................................................................
Short-term loans 27 2,123,108 2,006,761...............................................................................................................................................................................................................................................................................................................................................................................................................
Current portion of long-term borrowings 23 2,196,863 3,580,099...............................................................................................................................................................................................................................................................................................................................................................................................................
Taxes payable 830,802 417,889.........................................................................................................................................................................................................................................................................................................................................................................................
12,508,492 17,677,818.........................................................................................................................................................................................................................................................................................................................................................................................
Total liabilities 25,730,562 30,847,045.........................................................................................................................................................................................................................................................................................................................................................................................
Total equity and liabilities 51,675,654 44,249,567
Net current assets/(liabilities) 569,616 (6,349,603)
Total assets less current liabilities 39,167,162 26,571,749
On behalf of the Board
Wei Jiafu Chen Hongsheng
Director Director

086
Balance SheetAs at 31 December 2005
China COSCO Holdings Company LimitedANNUAL REPORT 2005
Note 2005
RMB’000
ASSETS...............................................................................................................................................................................................................................................................................................................................................................................................................
Non-current assets...............................................................................................................................................................................................................................................................................................................................................................................................................
Property, plant and equipment 6 6,219...............................................................................................................................................................................................................................................................................................................................................................................................................
Intangible assets 9 119...............................................................................................................................................................................................................................................................................................................................................................................................................
Subsidiaries 10 6,868,438.........................................................................................................................................................................................................................................................................................................................................................................................
6,874,776.........................................................................................................................................................................................................................................................................................................................................................................................Current assets...............................................................................................................................................................................................................................................................................................................................................................................................................
Trade and other receivables 20 355,033...............................................................................................................................................................................................................................................................................................................................................................................................................
Amounts due from subsidiaries 10 10,761,230...............................................................................................................................................................................................................................................................................................................................................................................................................
Bank balances and cash 18 2,262,888.........................................................................................................................................................................................................................................................................................................................................................................................
13,379,151.........................................................................................................................................................................................................................................................................................................................................................................................
Total assets 20,253,927.........................................................................................................................................................................................................................................................................................................................................................................................
EQUITY...............................................................................................................................................................................................................................................................................................................................................................................................................
Share capital 21 6,140,000...............................................................................................................................................................................................................................................................................................................................................................................................................
Reserves 22 7,519,336...............................................................................................................................................................................................................................................................................................................................................................................................................
Proposed final dividend 22 798,200.........................................................................................................................................................................................................................................................................................................................................................................................
Total equity 14,457,536.........................................................................................................................................................................................................................................................................................................................................................................................
LIABILITIES...............................................................................................................................................................................................................................................................................................................................................................................................................
Current liabilities...............................................................................................................................................................................................................................................................................................................................................................................................................
Trade and other payables 26 1,138,649...............................................................................................................................................................................................................................................................................................................................................................................................................
Amounts due to subsidiaries 10 4,411,050...............................................................................................................................................................................................................................................................................................................................................................................................................
Short-term loans 27 242,106...............................................................................................................................................................................................................................................................................................................................................................................................................
Taxes payable 4,586.........................................................................................................................................................................................................................................................................................................................................................................................
5,796,391.........................................................................................................................................................................................................................................................................................................................................................................................
Total liabilities 5,796,391.........................................................................................................................................................................................................................................................................................................................................................................................
Total equity and liabilities 20,253,927
Net current assets 7,582,760
Total assets less current liabilities 14,457,536
On behalf of the Board
Wei Jiafu Chen Hongsheng
Director Director

087
Consolidated Income StatementFor the year ended 31 December 2005
China COSCO Holdings Company LimitedANNUAL REPORT 2005
Note 2005 2004
RMB’000 RMB’000
(Restated)
Turnover 5 39,165,710 32,188,669...............................................................................................................................................................................................................................................................................................................................................................................................................
Cost of services (30,591,050) (25,752,985).........................................................................................................................................................................................................................................................................................................................................................................................
Gross profit 8,574,660 6,435,684...............................................................................................................................................................................................................................................................................................................................................................................................................
Other gains, net 28 179,427 286,910...............................................................................................................................................................................................................................................................................................................................................................................................................
Other operating income 1,026,456 549,084...............................................................................................................................................................................................................................................................................................................................................................................................................
Selling, administrative and general expenses (2,482,193) (1,861,681)...............................................................................................................................................................................................................................................................................................................................................................................................................
Other operating expenses (243,477) (364,281).........................................................................................................................................................................................................................................................................................................................................................................................
Operating profit 29 7,054,873 5,045,716...............................................................................................................................................................................................................................................................................................................................................................................................................
Finance costs 30 (868,393) (639,760).........................................................................................................................................................................................................................................................................................................................................................................................
Operating profit after finance costs 6,186,480 4,405,956...............................................................................................................................................................................................................................................................................................................................................................................................................
Share of profits less losses of...............................................................................................................................................................................................................................................................................................................................................................................................................
- jointly controlled entities 11 601,852 560,731...............................................................................................................................................................................................................................................................................................................................................................................................................
- associates 12 661,918 276,613.........................................................................................................................................................................................................................................................................................................................................................................................
Profit before income tax 7,450,250 5,243,300...............................................................................................................................................................................................................................................................................................................................................................................................................
Income tax expenses 31 (651,319) (285,757).........................................................................................................................................................................................................................................................................................................................................................................................
Profit for the year 6,798,931 4,957,543
Attributable to:...............................................................................................................................................................................................................................................................................................................................................................................................................
Equity holders of the Company 32 5,450,805 4,157,960...............................................................................................................................................................................................................................................................................................................................................................................................................
Minority interests 1,348,126 799,583.........................................................................................................................................................................................................................................................................................................................................................................................
6,798,931 4,957,543
Distributions (in respect of periods prior to listing) 33 3,893,440 3,131,392
Final dividend proposed 33(e) 798,200 N/A
RMB RMB.........................................................................................................................................................................................................................................................................................................................................................................................
Earnings per share for profit attributable to the
equity holders of the Company...............................................................................................................................................................................................................................................................................................................................................................................................................
- basic 34 1.06171 1.01414
- diluted 34 1.05528 1.01414

088
Consolidated Statement of Changes in EquityFor the year ended 31 December 2005
China COSCO Holdings Company LimitedANNUAL REPORT 2005
Equityattributable to
the Company’s Minority TotalNote equity holders interests equity
RMB’000 RMB’000 RMB’000
As at 1 January 2005...............................................................................................................................................................................................................................................................................................................................................................................................................
Balance as at 1 January, as previously reported as equity 7,449,204 — 7,449,204...............................................................................................................................................................................................................................................................................................................................................................................................................
Balance as at 1 January, as previouslyseparately reported as minority interests — 5,953,318 5,953,318.........................................................................................................................................................................................................................................................................................................................................................................................
7,449,204 5,953,318 13,402,522...............................................................................................................................................................................................................................................................................................................................................................................................................
Opening adjustments for the adoption of HKFRS 3,HKASs 32, 39 and 39 (Amendment) in respect of:
...............................................................................................................................................................................................................................................................................................................................................................................................................
- Redesignation of investment securities asavailable-for-sale financial assets 1,016,182 923,096 1,939,278
...............................................................................................................................................................................................................................................................................................................................................................................................................
- Recognition of unamortised transactioncosts on bank borrowings and notes 68,633 23,051 91,684
...............................................................................................................................................................................................................................................................................................................................................................................................................
- Recognition of interest rate swap contractsas derivative financial instruments 7,021 6,378 13,399
...............................................................................................................................................................................................................................................................................................................................................................................................................
- Derecognition of negative goodwill 86,243 78,343 164,586...............................................................................................................................................................................................................................................................................................................................................................................................................
- Share of opening adjustments of jointlycontrolled entities and associates 25,664 23,313 48,977
...............................................................................................................................................................................................................................................................................................................................................................................................................
1,203,743 1,054,181 2,257,924.........................................................................................................................................................................................................................................................................................................................................................................................As at 1 January 2005, as restated 8,652,947 7,007,499 15,660,446...............................................................................................................................................................................................................................................................................................................................................................................................................
Fair value gains on available-for-sale financial assets 64,689 59,641 124,330...............................................................................................................................................................................................................................................................................................................................................................................................................
Share of reserves of a jointly controlled entityand associates 8,929 3,151 12,080
...............................................................................................................................................................................................................................................................................................................................................................................................................
Exchange differences (393,559) (140,429) (533,988)...............................................................................................................................................................................................................................................................................................................................................................................................................
Net expense recognised directly in equity (319,941) (77,637) (397,578)...............................................................................................................................................................................................................................................................................................................................................................................................................
Profit for the year 5,450,805 1,348,126 6,798,931.........................................................................................................................................................................................................................................................................................................................................................................................Total recognised income for 2005 5,130,864 1,270,489 6,401,353...............................................................................................................................................................................................................................................................................................................................................................................................................
Reserve realised upon disposal of anavailable-for-sale financial asset (261,381) (237,871) (499,252)
...............................................................................................................................................................................................................................................................................................................................................................................................................
Recognition of minority interests in relation tocertain jointly controlled entities reclassifiedto subsidiaries — 71,940 71,940
...............................................................................................................................................................................................................................................................................................................................................................................................................
Increase in equity from minority shareholdersof a subsidiary (10,435) 141,628 131,193
...............................................................................................................................................................................................................................................................................................................................................................................................................
Distributions 33 (3,893,440) — (3,893,440)...............................................................................................................................................................................................................................................................................................................................................................................................................
Dividends paid to minority shareholders of a subsidiary — (745,648) (745,648)...............................................................................................................................................................................................................................................................................................................................................................................................................
Issue of new shares 9,232,683 — 9,232,683...............................................................................................................................................................................................................................................................................................................................................................................................................
Share issue expenses (414,886) — (414,886)...............................................................................................................................................................................................................................................................................................................................................................................................................
Contributions from minority shareholders of subsidiaries — 703 703.........................................................................................................................................................................................................................................................................................................................................................................................
As at 31 December 2005 18,436,352 7,508,740 25,945,092

089China COSCO Holdings Company Limited
ANNUAL REPORT 2005
Equity
attributable to
the Company’s Minority Total
Note equity holders interests equity
RMB’000 RMB’000 RMB’000
As at 1 January 2004...............................................................................................................................................................................................................................................................................................................................................................................................................
Balance as at 1 January, as previously reported as equity 1,946,268 — 1,946,268...............................................................................................................................................................................................................................................................................................................................................................................................................
Balance as at 1 January, as previously
separately reported as minority interests — 5,285,448 5,285,448.........................................................................................................................................................................................................................................................................................................................................................................................As at 1 January 2004, as restated 1,946,268 5,285,448 7,231,716...............................................................................................................................................................................................................................................................................................................................................................................................................
Share of reserves of a jointly controlled entity
and associates (596) — (596)...............................................................................................................................................................................................................................................................................................................................................................................................................
Exchange differences 8,414 — 8,414...............................................................................................................................................................................................................................................................................................................................................................................................................
Net income recognised directly in equity 7,818 — 7,818...............................................................................................................................................................................................................................................................................................................................................................................................................
Profit for the year 4,157,960 799,583 4,957,543.........................................................................................................................................................................................................................................................................................................................................................................................
Total recognised income for 2004 4,165,778 799,583 4,965,361...............................................................................................................................................................................................................................................................................................................................................................................................................
Increase in equity from minority shareholders
of a subsidiary (9,221) 274,319 265,098...............................................................................................................................................................................................................................................................................................................................................................................................................
Distributions 33 (3,311,700) — (3,311,700)...............................................................................................................................................................................................................................................................................................................................................................................................................
Disposal of subsidiaries — (2,032) (2,032)...............................................................................................................................................................................................................................................................................................................................................................................................................
Dividends paid to minority shareholders of a subsidiary — (406,732) (406,732)...............................................................................................................................................................................................................................................................................................................................................................................................................
Capital contributions 22(e) 4,658,079 — 4,658,079...............................................................................................................................................................................................................................................................................................................................................................................................................
Contributions from minority shareholders of subsidiaries — 2,732 2,732.........................................................................................................................................................................................................................................................................................................................................................................................
As at 31 December 2004 7,449,204 5,953,318 13,402,522

090
Consolidated Cash Flow StatementFor the year ended 31 December 2005
China COSCO Holdings Company LimitedANNUAL REPORT 2005
Note 2005 2004
RMB’000 RMB’000
Cash flows from operating activities...............................................................................................................................................................................................................................................................................................................................................................................................................
Cash generated from operations 37(a) 6,238,672 5,470,868...............................................................................................................................................................................................................................................................................................................................................................................................................
Interest received 176,039 50,763...............................................................................................................................................................................................................................................................................................................................................................................................................
Net cash settlement from interest rate swap contracts 21,168 —...............................................................................................................................................................................................................................................................................................................................................................................................................
Taxation paid (283,562) (83,828).........................................................................................................................................................................................................................................................................................................................................................................................
Net cash from operating activities 6,152,317 5,437,803.........................................................................................................................................................................................................................................................................................................................................................................................
Cash flows from investing activities...............................................................................................................................................................................................................................................................................................................................................................................................................
Purchase of property, plant and equipment (5,820,152) (2,834,198)...............................................................................................................................................................................................................................................................................................................................................................................................................
Purchase of leasehold land and land use rights (40,727) —...............................................................................................................................................................................................................................................................................................................................................................................................................
Purchase of intangible assets (52,017) (16,568)...............................................................................................................................................................................................................................................................................................................................................................................................................
Investments in jointly controlled entities and associates (375,122) (2,884,630)...............................................................................................................................................................................................................................................................................................................................................................................................................
Purchase of available-for-sale financial assets/investment securities (157,490) (109,422)...............................................................................................................................................................................................................................................................................................................................................................................................................
Proceeds from disposal of property, plant and equipment 476,896 1,467,688...............................................................................................................................................................................................................................................................................................................................................................................................................
Proceeds from disposal of investment properties 6,763 —...............................................................................................................................................................................................................................................................................................................................................................................................................
Proceeds from disposal of intangible assets 264 —...............................................................................................................................................................................................................................................................................................................................................................................................................
Net cash outflow from disposal of subsidiaries 37(b) — (13,609)...............................................................................................................................................................................................................................................................................................................................................................................................................
Cash received from disposal of jointly controlled entities and associates 15,596 68,836...............................................................................................................................................................................................................................................................................................................................................................................................................
Cash received from disposal of investment securities — 460...............................................................................................................................................................................................................................................................................................................................................................................................................
Cash received from disposal of available-for-sale financial assets 649,536 —...............................................................................................................................................................................................................................................................................................................................................................................................................
Loans advanced to a jointly controlled entity,
associates and investee companies (312,396) (349,074)...............................................................................................................................................................................................................................................................................................................................................................................................................
Repayments of loans advanced to jointly controlled entities,
associates and investee companies 157,325 214,788...............................................................................................................................................................................................................................................................................................................................................................................................................
Dividends received from jointly controlled entities 433,619 49,571...............................................................................................................................................................................................................................................................................................................................................................................................................
Dividends received from associates 262,912 495,144...............................................................................................................................................................................................................................................................................................................................................................................................................
Dividends received from investment securities — 181,523...............................................................................................................................................................................................................................................................................................................................................................................................................
Dividends received from available-for-sale financial assets 145,149 —...............................................................................................................................................................................................................................................................................................................................................................................................................
Increase in amounts due from COSCO — (2,000,000)...............................................................................................................................................................................................................................................................................................................................................................................................................
Decrease in amounts due to subsidiaries of COSCO (2,891,597) —...............................................................................................................................................................................................................................................................................................................................................................................................................
(Increase)/decrease in restricted bank deposits (113,856) 7,489.........................................................................................................................................................................................................................................................................................................................................................................................
Net cash used in investing activities (7,615,297) (5,722,002).........................................................................................................................................................................................................................................................................................................................................................................................

091China COSCO Holdings Company Limited
ANNUAL REPORT 2005
Note 2005 2004
RMB’000 RMB’000
Cash flows from financing activities 37(d)...............................................................................................................................................................................................................................................................................................................................................................................................................
Drawdown of long-term borrowings 6,248,448 6,745,461...............................................................................................................................................................................................................................................................................................................................................................................................................
Repayment of long-term borrowings (6,733,031) (5,675,919)...............................................................................................................................................................................................................................................................................................................................................................................................................
Capital element of finance lease obligations — (5,104)...............................................................................................................................................................................................................................................................................................................................................................................................................
Interest element of finance lease obligations — (2,029)...............................................................................................................................................................................................................................................................................................................................................................................................................
Decrease in amount payable to a bank — (1,000,000)...............................................................................................................................................................................................................................................................................................................................................................................................................
Decrease in amounts due to fellow subsidiaries — (768,899)...............................................................................................................................................................................................................................................................................................................................................................................................................
Decrease in amounts due to parent company (9,105) (338,788)...............................................................................................................................................................................................................................................................................................................................................................................................................
Decrease in amount due to a fellow subsidiary under current liabilities — (237,470)...............................................................................................................................................................................................................................................................................................................................................................................................................
Proceeds from exercise of share options of a subsidiary by grantees 179,901 343,628...............................................................................................................................................................................................................................................................................................................................................................................................................
Distributions (2,099,419) (421,810)...............................................................................................................................................................................................................................................................................................................................................................................................................
Contributions — 3,038,628...............................................................................................................................................................................................................................................................................................................................................................................................................
Dividends paid to minority shareholders of subsidiaries (753,568) (406,732)...............................................................................................................................................................................................................................................................................................................................................................................................................
Contributions from minority shareholders of subsidiaries 703 2,732...............................................................................................................................................................................................................................................................................................................................................................................................................
Interest paid (805,871) (503,359)...............................................................................................................................................................................................................................................................................................................................................................................................................
Other incidental borrowing costs and charges paid (34,083) (72,719)...............................................................................................................................................................................................................................................................................................................................................................................................................
Proceeds from issue of new H shares 9,232,683 —...............................................................................................................................................................................................................................................................................................................................................................................................................
Share issue expenses (414,886) —.........................................................................................................................................................................................................................................................................................................................................................................................
Net cash from financing activities 4,811,772 697,620.........................................................................................................................................................................................................................................................................................................................................................................................
Net increase in cash and cash equivalents 3,348,792 413,421...............................................................................................................................................................................................................................................................................................................................................................................................................
Cash and cash equivalents at 1 January 4,894,532 4,495,145...............................................................................................................................................................................................................................................................................................................................................................................................................
Translation differences on cash and cash equivalents (95,949) (14,034).........................................................................................................................................................................................................................................................................................................................................................................................
Cash and cash equivalents at 31 December 18 8,147,375 4,894,532
092
Notes to the Consolidated Financial Statements
China COSCO Holdings Company LimitedANNUAL REPORT 2005
1 General information and Reorganisation
China COSCO Holdings Company Limited (the “Company”) was incorporated in the People’s Republic of China (the “PRC”)
on 3 March 2005 as a joint stock company with limited liability under the Company Law of the PRC. The address of its
registered office is Ocean Plaza, 12th Floor, 158 Fuxingmennei Street, Beijing 100031, the PRC. As part of the restructuring
of China Ocean Shipping (Group) Company (“COSCO”) and its subsidiaries, (collectively “COSCO Group”), COSCO
underwent a group reorganisation (the “Reorganisation”), as detailed below, in preparation for a listing of the Company’s H
shares on the Main Board of The Stock Exchange of Hong Kong Limited (the “Main Board”).
The Company and its subsidiaries (collectively the “Group”) provides integrated container shipping services to international
and domestic customers. The Group’s businesses include the provisions of a range of container shipping, container
terminal, container leasing and freight forwarding and shipping agency services all over the world.
Pursuant to the Reorganisation, the Company issued 4,100,000,000 non-publicly tradable State-owned legal person
shares (“Domestic Shares”) of RMB1.00 per share in exchange for the equity interests of certain subsidiaries, jointly
controlled entities and associates (collectively the “Relevant Companies”) transferred to the Company by COSCO Group.
The Reorganisation comprised mainly the following:
(a) Transfer of the equity interests in COSCO International Freight Co., Ltd, COSCO Container Shipping Agency
Company Limited, Shanghai Pan Asia Shipping Company Limited (“Pan Asia”), and certain overseas companies and
their respective subsidiaries, jointly controlled entities and associates from COSCO Group to COSCO Container Lines
Company Limited (“COSCON”). The equity interests in the PRC companies were transferred at cash consideration
totalling RMB5,000,000 and the equity interests for the overseas companies were transferred at cash consideration
totalling RMB62,743,000.
(b) Transfer of the entire equity interest in COSCO Investments Limited (“COSCO Investments”), and the then 52.39%
equity interest in COSCO Pacific Limited (“COSCO Pacific”) (of which approximately 9.6% were directly held by
COSCO Investments) and its respective subsidiaries, jointly controlled entities and associates from COSCO (Hong
Kong) Group Limited (“COSCO HK”), a wholly owned subsidiary of COSCO, to COSCO Pacific Investment Holdings
Limited (“COSCO Pacific Investment”) at a total consideration of approximately US$347,285,000 (equivalent to
approximately RMB2,874,478,000). The consideration included a shareholder loan due from COSCO Investments to
COSCO HK of approximately US$196,490,000 (equivalent to approximately RMB1,626,348,000) and was settled in
cash by COSCO Pacific Investment.
Prior to the transfer of the entire interest in COSCO Investments from COSCO Group to COSCO Pacific Investment,
COSCO Investments disposed of all of its investments other than the equity interests in COSCO Pacific to two
subsidiaries of COSCO HK at a consideration of US$203,357,000 (equivalent to approximately RMB1,683,185,000).
The disposal resulted in a gain of approximately RMB1,428,385,000 and was accounted for as a deemed
contribution from COSCO for the year ended 31 December 2004 (note 22(e)).
(c) The entire equity interests in COSCON and COSCO Pacific Investment after the equity transfers described above
were injected into the Company by COSCO in exchange for Domestic Shares issued by the Company upon
incorporation.

093China COSCO Holdings Company Limited
ANNUAL REPORT 2005
1 General information and Reorganisation (Continued)
(d) Transfer of the equity interests in, and assets and liabilities of, certain overseas companies from COSCO Group to
certain overseas subsidiaries of COSCON at cash consideration totalling RMB175,988,000.
The Reorganisation was completed in March 2005. Accordingly, the Company became the holding company of the
companies now comprising the Group.
The H shares of the Company were listed on the Main Board on 30 June 2005 (the “Listing Date”). Details of movements in
the Company’s share capital are set out in note 21 to the consolidated financial statements.
The directors of the Company (the “Directors”) regard COSCO, a state-owned enterprise established in the PRC, as being
the Company’s parent company (note 40).
These consolidated financial statements have been approved for issue by the board of directors on 11 April 2006.
2 Summary of significant accounting policies
(a) Basis of preparation
The Group resulting from the Reorganisation referred in note 1 above is regarded as a continuing entity. Accordingly,
the consolidated financial statements for the year ended 31 December 2005 (the “Consolidated Financial
Statements”), including comparative figures, have been prepared on the merger basis as if the Company had been
the holding company of those companies comprising the Group throughout the two years ended 31 December 2004
and 2005 presented, or since their respective dates of incorporation/establishment or from the effective dates of
acquisition/up to the effective dates of disposal, whichever is the shorter period.
These Consolidated Financial Statements have been prepared in accordance with Hong Kong Financial Reporting
Standards (“HKFRSs”) issued by Hong Kong Institute of Certified Public Accountants (“HKICPA”). The Consolidated
Financial Statements have been prepared under the historical cost convention, except that, as disclosed in the
accounting policies below, available-for-sale financial assets and derivative financial assets and financial liabilities are
stated at fair value.
The preparation of the Consolidated Financial Statements in conformity with HKFRSs requires the use of certain
critical accounting estimates. It also requires management to exercise its judgement in the process of applying the
Group’s accounting policies. The areas involving a higher degree of judgement or complexity, or areas where
assumptions and estimates are significant to the Consolidated Financial Statements, are disclosed in note 4.

094
Notes to the Consolidated Financial Statements
China COSCO Holdings Company LimitedANNUAL REPORT 2005
2 Summary of significant accounting policies (Continued)
(b) Changes in significant accounting policies
In 2005, the Group adopted the new/revised HKFRSs below, which are relevant to its operations. The comparative
figures in respect of 2004 have been amended as required, in accordance with the relevant requirements.
HKAS 1 Presentation of Financial Statements
HKAS 2 Inventories
HKAS 7 Cash Flow Statements
HKAS 8 Accounting Policies, Changes in Accounting Estimates and Errors
HKAS 10 Events after the Balance Sheet Date
HKAS 16 Property, Plant and Equipment
HKAS 17 Leases
HKAS 21 The Effects of Changes in Foreign Exchange Rates
HKAS 23 Borrowing Costs
HKAS 24 Related Party Disclosures
HKAS 27 Consolidated and Separate Financial Statements
HKAS 28 Investments in Associates
HKAS 31 Investments in Joint Ventures
HKAS 32 Financial Instruments: Disclosure and Presentation
HKAS 33 Earnings per Share
HKAS 36 Impairment of Assets
HKAS 37 Provisions, Contingent Liabilities and Contingent Assets
HKAS 38 Intangible Assets
HKAS 39 Financial Instruments: Recognition and Measurement
HKAS 39 (Amendment) Transition and Initial Recognition of Financial Assets and Financial Liabilities
HKAS 40 Investment Property
HKFRS 2 Share-based Payment
HKFRS 3 Business Combinations
HKAS-Int 12 Consolidation - Special Purpose Entities
HKAS-Int 12 (Amendment) Scope of HKAS- Int 12 Consolidation – Special Purpose Entities
HKAS-Int 15 Operating Leases - Incentives
HKAS-Int 21 Income Taxes - Recovery of Revalued Non-Depreciable Assets

095China COSCO Holdings Company Limited
ANNUAL REPORT 2005
2 Summary of significant accounting policies (Continued)
(b) Changes in significant accounting policies (Continued)
The overall effects of the adoption of the new/revised HKFRSs are to increase the opening equity (including minority
interests) as at 1 January 2005 by RMB2,257,924,000, the profit for the year ended 31 December 2005 by
RMB534,780,000 and net assets as at 31 December 2005 by RMB2,079,372,000. There was no significant impact
on the profit for the year ended 31 December 2004 following the adoption of the new/revised HKFRSs. Summary of
the effects of adopting the new/revised HKFRSs and the earnings per share for profit attributable to the equity
holders of the Company are set out in note 2(b)(x) to the Consolidated Financial Statements. The major changes in
the Group’s significant accounting policies or the presentation of financial statements as a result of the adoption of
these new/revised HKFRSs are summarised as below:
(i) HKAS 1
The adoption of HKAS 1 has mainly resulted in the following presentational change in the Group’s financial
statements:
(1) minority interests are now required to be shown within the Group’s equity. On the face of the consolidated
income statement, minority interests are presented as an allocation of the total profit or loss for the year;
(2) the Group’s share of profits less losses (net of income taxes) of jointly controlled entities and associates
are required to be presented on the face of the consolidated income statement; and
(3) investment properties are now required to be presented on the face of consolidated balance sheet.
(ii) HKAS 16
Under HKAS 16, when a vessel is acquired, the costs of major components which are usually replaced or
renewed in connection with the dry-docking are identified and depreciated over the period to next estimated
dry-docking date. Costs incurred on subsequent dry-docking of a vessel are capitalised and depreciated over
the period to the next estimated dry-docking date. Dry-docking costs were previously charged to the
consolidated income statement when incurred.
This represents a change in accounting policy. However, as the resulting impact of this change is not material
as a whole, this change has not been applied for retrospectively and a prior year adjustment has not been
made.
The residual values and the useful lives of property, plant and equipment are now required to be reviewed and
adjusted, if appropriate, at each financial year end.
The Directors have reviewed the residual values of vessels and containers, and accordingly, depreciation charge
of vessels and containers for the year ended 31 December 2005 has been calculated based on the revised
estimated residual values. This represents a change in accounting estimate. The change has been accounted
for prospectively.
The Directors have reviewed the residual values of other property, plant and equipment and useful lives of
property, plant and equipment and do not consider that there are significant changes from the previous
estimates.

096
Notes to the Consolidated Financial Statements
China COSCO Holdings Company LimitedANNUAL REPORT 2005
2 Summary of significant accounting policies (Continued)
(b) Changes in significant accounting policies (Continued)
(iii) HKAS 17
The adoption of revised HKAS 17 has resulted in a change in accounting policy relating to reclassification of
leasehold land and land use rights from property, plant and equipment and investment properties to operating
leases. The up-front prepayments made for the leasehold land and the land use rights are expensed in the
consolidated income statement on a straight-line basis over the period of the lease or where there is
impairment, the impairment is charged to the consolidated income statement. In prior years, the leasehold land
and land use rights were stated at cost less accumulated depreciation and impairment losses while the
leasehold land as included in investment properties was stated at valuation.
Since the resulting impact of this change is not material as a whole, it has not been applied retrospectively and
a prior year adjustment has not been made.
(iv) HKAS 21
HKAS 21 requires items included in the financial statements of each of the Group’s entities are measured using
the currency of the primary economic environment in which the entity operates (the “functional currency”). The
Company’s functional currency is United States Dollar (“US dollar” or “US$”). The Consolidated Financial
Statements are presented in Renminbi (“RMB”).
Foreign currency transactions are translated into the functional currency using the exchange rates prevailing at
the dates of the transactions. Foreign exchange gains and losses resulting from the settlement of such
transactions and from the translation at year end exchange rates of monetary assets and liabilities denominated
in foreign currencies are recognised in the income statement.
Translation differences on monetary and non-monetary items are included in the income statement and reserve
respectively.
This represents a change in accounting policy. However, as the resulting impact of this change is not material
as a whole, this change has not been applied retrospectively and a prior year adjustment has not been made.
(v) HKAS 24
HKAS 24 has extended the identification and disclosure of related parties to include state-owned enterprises.
Related parties include COSCO and its subsidiaries, other state-owned enterprises and their subsidiaries
directly or indirectly controlled by the PRC government, other entities and corporations in which the Company is
able to control or exercise significant influence and key management personnel of the Group and COSCO as
well as their close family members.

097China COSCO Holdings Company Limited
ANNUAL REPORT 2005
2 Summary of significant accounting policies (Continued)
(b) Changes in significant accounting policies (Continued)
(vi) HKAS 32, HKAS 39 and HKAS 39 (Amendment)
The adoption of HKASs 32, 39 and HKAS 39 (Amendment) has resulted in changes in the accounting policies
relating to the following:
(1) the Group’s investment securities which were previously stated at cost less provision for impairment
losses are now redesignated as available-for-sale financial assets and carried in the balance sheet at their
fair values. The amount, being the difference between the fair values of these available-for-sale financial
assets and their previous carrying amounts as at 31 December 2004, was credited to the Group’s
opening equity as at 1 January 2005;
(2) the interest rate swap contracts as entered into between the Group and certain financial institutions are
now classified as derivative financial assets/liabilities and recognised in the balance sheet at their
respective fair values. In prior years, derivative financial assets/liabilities were not required to be
recognised in the balance sheet pursuant to the Statements of Standard Accounting Practice issued by
the HKICPA. The recognition of interest rate swap contracts at their fair values as at 1 January 2005 has
resulted in a net increase in the Group’s opening equity as at 1 January 2005;
In addition, the Group has adopted hedge accounting when the hedging relationship between the interest
rate swap contracts with notional principal amounts of US$200,000,000 and the notes as issued by the
Group (note 23(d)) was fully designated and documented. The effect of the application of hedge
accounting is to reduce the fair value loss on interest rate swap contracts for the year ended 31
December 2005; and
(3) the Group’s borrowings or notes which were previously stated at their original carrying amounts are now
required to be stated initially at their fair values, net of transaction costs incurred, and then subsequently
stated at amortised cost. The unamortised transaction costs in respect of these borrowings and notes as
at 31 December 2004, which were previously expensed as incurred, are included in the related
borrowings or notes by a corresponding credit adjustment to the Group’s opening equity as at 1 January
2005.
As HKAS 39 does not permit to recognise, derecognise and measure financial assets and liabilities on a
retrospective basis, all the related financial impact on the Consolidated Financial Statements are reflected as
opening adjustments to the Group’s equity as at 1 January 2005 and accordingly, the comparative figures as
presented in the Consolidated Financial Statements have not been restated.

098
Notes to the Consolidated Financial Statements
China COSCO Holdings Company LimitedANNUAL REPORT 2005
2 Summary of significant accounting policies (Continued)
(b) Changes in significant accounting policies (Continued)
(vii) HKAS 40
The adoption of revised HKAS 40 has resulted in a change in accounting policy for the Group’s investment
properties. Until 31 December 2004, the investment properties were carried at valuation. In accordance with
the provision of HKAS 40, the Group opted for the cost model and the investment properties are carried at cost
less accumulated depreciation and impairment. The net book value of investment properties as at 31
December 2004 was deemed as the cost on 1 January 2005. Any adjustments, including the reclassification of
any amount previously held in revaluation reserve for investment properties, are made to the opening balance of
retained profits. Depreciation on deemed cost commences in 2005 accordingly.
As at 31 December 2004, the valuation of investment properties was less than their original cost and the
revaluation deficits had already been charged to the income statement in prior years and there was no
investment property revaluation reserve. Consequently, no adjustment on opening equity is required.
(viii) HKFRS 2
The adoption of HKFRS 2 has resulted in a change in the accounting policy for share-based payments.
One of the Group’s subsidiaries operates an equity-settled, share-based compensation plan. Until 31
December 2004, the provision of share options granted by the subsidiary to the Group’s employees did not
result in expense in the income statement. With effect from 1 January 2005, the fair value of the employee
services received in exchange for the grant of the share options of the subsidiary is recognised as an expense.
The total amount to be expensed is determined by reference to the fair value of the share options granted by
the subsidiary.
As all the share options previously granted by the subsidiary were vested on or before 1 January 2005 and
accordingly, no adjustment is made in the Consolidated Financial Statements pursuant to the transitional
provisions as set out in HKFRS 2.

099China COSCO Holdings Company Limited
ANNUAL REPORT 2005
2 Summary of significant accounting policies (Continued)
(b) Changes in significant accounting policies (Continued)
(ix) HKFRS 3
The adoption of HKFRS 3 has resulted in a change in the accounting policy for goodwill and negative goodwill.
In prior years, goodwill or negative goodwill on acquisitions of subsidiaries, jointly controlled entities or
associates on or after 1 January 2001 was:
- Amortised on a straight-line basis over its estimated useful life of not exceeding 20 years; and
- Assessed for impairment on goodwill at each balance sheet date.
In accordance with the provisions of HKFRS 3:
- The Group ceased amortisation of goodwill with effect from 1 January 2005;
- Accumulated amortisation of goodwill as at 31 December 2004 has been eliminated with a corresponding
decrease in the cost of goodwill;
- Goodwill is tested annually for impairment, as well as when there is indication of impairment; and
- The carrying amount of negative goodwill as at 31 December 2004 is derecognised and reflected as an
adjustment to the Group’s opening equity as at 1 January 2005.
Upon the adoption of HKFRS 3, the derecognition of a negative goodwill from the acquisition of an associate
was credited to the Group’s opening equity as at 1 January 2005 in accordance with HKFRS 3.
The adoption of HKASs 2, 7, 8, 10, 23, 27, 28, 31, 33, 36, 37, 38, HKAS-Ints 12, 12 (Amendment), 15 and 21 did
not result in any significant change to the Group’s significant accounting policies and the presentation of the
Consolidated Financial Statements.

100
Notes to the Consolidated Financial Statements
China COSCO Holdings Company LimitedANNUAL REPORT 2005
2 Summary of significant accounting policies (Continued)
(b) Changes in significant accounting policies (Continued)
(x) Summary of effects on adopting new/revised HKFRSs
The following tables set out the effects of adopting the new/revised HKFRSs on the Consolidated Financial
Statements.
(a) Consolidated balance sheet at 31 December 2005
Effect of adopting
HKASs 32,
39 & 39
HKAS 1 HKAS 16 HKAS 17 (Amendment) HKAS 40 HKFRS 3 Total
Property, Plant
Presentation and Equipment
of Financial Dry-docking Residual Financial Investment Business
Statements costs values Leases Instruments Property Combinations
RMB’000 RMB’000 RMB’000 RMB’000 RMB’000 RMB’000 RMB’000 RMB’000
Increase/(decrease) in net assets:..........................................................................................................................................................................................................................................................................................................................................................
Assets..........................................................................................................................................................................................................................................................................................................................................................
Property, plant and equipment (6,828 ) 37,823 184,297 (167,918 ) — — — 47,374..........................................................................................................................................................................................................................................................................................................................................................
Investment properties 6,828 — — — — (4,393 ) — 2,435..........................................................................................................................................................................................................................................................................................................................................................
Leasehold land and land use
rights — — — 198,052 — — — 198,052..........................................................................................................................................................................................................................................................................................................................................................
Jointly controlled entities — — — — 2,704 — 20,886 23,590..........................................................................................................................................................................................................................................................................................................................................................
Associates — — — — 33,322 — 158,031 191,353..........................................................................................................................................................................................................................................................................................................................................................
Available-for-sale financial assets — — — — 2,233,042 — — 2,233,042..........................................................................................................................................................................................................................................................................................................................................................
Investment securities — — — — (710,415 ) — — (710,415 )..........................................................................................................................................................................................................................................................................................................................................................
Derivative financial assets — — — — 5,853 — — 5,853..........................................................................................................................................................................................................................................................................................................................................................
Trade and other receivables — — — — 9,410 — — 9,410..........................................................................................................................................................................................................................................................................................................................................................
Liabilities..........................................................................................................................................................................................................................................................................................................................................................
Derivative financial liabilities — — — — (16,197 ) — — (16,197)..........................................................................................................................................................................................................................................................................................................................................................
Deferred income tax liabilities — (5,472 ) (23,083 ) — — — — (28,555 )..........................................................................................................................................................................................................................................................................................................................................................
Long-term borrowings — — — — 123,430 — — 123,430.................................................................................................................................................................................................................................................................................................................................................
Net assets — 32,351 161,214 30,134 1,681,149 (4,393 ) 178,917 2,079,372
The adoption of HKFRS 3, HKASs 32, 39 and 39 (Amendment) do not require the restatement of the
comparative figures of the relevant balance sheet items. All the related financial effects of RMB2,257,924,000
on the consolidated balance sheet as at 31 December 2004 are reflected as opening adjustments to the
Group’s equity as at 1 January 2005. In addition, since the resulting impact of adoption of HKASs 16, 17 and
21 are not material as a whole, this change has not been applied retrospectively and prior year adjustments
have not been made. Accordingly, the consolidated balance sheet as at 31 December 2004 has not been
separately presented.

101China COSCO Holdings Company Limited
ANNUAL REPORT 2005
2 Summary of significant accounting policies (Continued)
(b) Changes in significant accounting policies (Continued)
(x) Summary of effects on adopting new/revised HKFRSs (Continued)
(b) Consolidated income statement for the year ended 31 December 2005
Effect of adopting
HKASs 32,
39 & 39
HKAS 1 HKAS 16 HKAS 17 HKAS 21 (Amendment) HKAS 40 HKFRS 3 Total
Property, Plant
Presentation and Equipment Foreign
of Financial Dry-docking Residual Currency Financial Investment Business
Statements costs values Leases Translation Instruments Property Combinations
RMB’000 RMB’000 RMB’000 RMB’000 RMB’000 RMB’000 RMB’000 RMB’000 RMB’000
Decrease in cost of services — 110,059 — — — — — — 110,059..........................................................................................................................................................................................................................................................................................................................................................
Increase in other gains, net — — — — 284,130 18,673 — — 302,803..........................................................................................................................................................................................................................................................................................................................................................
Decrease/(increase) in
depreciation and amortisation — (72,236 ) 184,297 30,134 — — (289 ) — 141,906..........................................................................................................................................................................................................................................................................................................................................................
Decrease in other operating income — — — — — — (4,104 ) — (4,104 )..........................................................................................................................................................................................................................................................................................................................................................
(Decrease)/increase in share
of profits less losses of..........................................................................................................................................................................................................................................................................................................................................................
- jointly controlled entities (101,599 ) — — — — (4,029 ) — 21,195 (84,433 )..........................................................................................................................................................................................................................................................................................................................................................
- associates (31,833 ) — — — — 467 — (5,487 ) (36,853 )..........................................................................................................................................................................................................................................................................................................................................................
Decrease in finance costs — — — — — 525 — — 525..........................................................................................................................................................................................................................................................................................................................................................
Decrease/(increase) in income tax expenses 133,432 (5,472 ) (23,083 ) — — — — — 104,877.................................................................................................................................................................................................................................................................................................................................................
Increase/(decrease) in profit for the year — 32,351 161,214 30,134 284,130 15,636 (4,393 ) 15,708 534,780
Increase/(decrease) in earnings per share..........................................................................................................................................................................................................................................................................................................................................................
- basic (RMB cents) — 0.63 2.83 0.31 5.53 0.16 (0.09 ) 0.16 9.53.................................................................................................................................................................................................................................................................................................................................................
- diluted (RMB cents) — 0.63 2.81 0.30 5.50 0.16 (0.09 ) 0.16 9.47
No adjustment was made to the consolidated income statement for the year ended 31 December 2004
following the adoption of the new/revised HKFRSs, except that HKAS 1 affected the presentation of minority
interests, share of net after-tax results of jointly controlled entities, associates and other disclosures for that
year. Accordingly, the effect of adopting the new/revised HKFRSs on the consolidated income statement for the
year ended 31 December 2004 has not separately disclosed and presented.

102
Notes to the Consolidated Financial Statements
China COSCO Holdings Company LimitedANNUAL REPORT 2005
2 Summary of significant accounting policies (Continued)
(c) Standards, interpretation and amendments to be published that are not yet effective for the year ended 31 December
2005
The HKICPA has issued the following new standards, amendments and interpretations which are not yet effective for
the year ended 31 December 2005:
Effective for accounting
periods beginning
on or after
HKFRS Interpretation 4 “Determining whether an
Arrangement contains a Lease” 1 January 2006
HKAS 19 (Amendment), “Employee Benefits - Actuarial Gains
and Losses, Group Plans and Disclosures” 1 January 2006
HKAS 39 (Amendment), “Financial Instruments: Recognition
and Measurement”:
- The Fair Value Option 1 January 2006
- Cash Flow Hedge Accounting of Forecast Intragroup
Transactions 1 January 2006
- Financial Guarantee Contracts 1 January 2006
Amendments, as a consequence of the Hong Kong
Companies (Amendment) Ordinance 2005, to:
- HKAS 1 “Presentation of Financial Statements” 1 January 2006
- HKAS 27 “Consolidated and Separate Financial Statements” 1 January 2006
- HKFRS 3 “Business Combinations” 1 January 2006
HKFRS 7 “Financial Instruments: Disclosures” 1 January 2007
HKAS 1 (Amendment) “Presentation of Financial Statements:
Capital Disclosures” 1 January 2007
The Group has not early adopted the above standards, amendments and interpretations in the Consolidated
Financial Statements. The Group has already commenced an assessment of the related impact to the Group but is
not yet in a position to state whether substantial changes to Group’s accounting policies and presentation of the
Consolidated Financial Statements will be resulted.
103China COSCO Holdings Company Limited
ANNUAL REPORT 2005
2 Summary of significant accounting policies (Continued)
The significant accounting policies applied in the preparation of the Consolidated Financial Statements are set out
below.
(d) Group accounting
The Consolidated Financial Statements include the financial statements of the Company and all its subsidiaries made
up to 31 December.
Subsidiaries are fully consolidated from the date on which control is transferred to the Group. They are de-
consolidated from the date that control ceases.
The purchase method of accounting is used to account for the acquisition of subsidiaries by the Group, other than
those subsidiaries acquired pursuant to the Reorganisation (notes 1 and 2(a)). The cost of an acquisition is measured
as the fair value of the assets given, equity instruments issued and liabilities incurred or assumed at the date of
exchange, plus costs directly attributable to the acquisition. Identifiable assets acquired and liabilities and contingent
liabilities assumed in a business combination are measured initially at their fair values at the acquisition date,
irrespective of the extent of any minority interest. The excess of the cost of acquisition over the fair value of the
Group’s share of the identifiable net assets acquired is recorded as goodwill. If the cost of acquisition is less than the
fair value of the net assets of the subsidiary acquired, the difference is recognised directly in the income statement.
Investment in a jointly controlled entity/an associate is accounted for using the equity method from the date on which
it becomes a jointly controlled entity/an associate. The measurement and recognition of goodwill is same as that of
goodwill arising from the acquisition of subsidiaries. Goodwill relating to a jointly controlled entity/an associate is
included in the carrying amount of the investment. Appropriate adjustments to the investor’s share of the profits or
losses after acquisition are made to the consolidated financial statements based on their fair values at the date of
acquisition.
The consolidated income statement includes the Group’s share of the results of jointly controlled entities and
associates for the year, and the consolidated balance sheet includes the Group’s share of the net assets of the jointly
controlled entities and associates and goodwill (net of any accumulated impairment losses) on acquisition.
When the Group’s share of losses in an associate equals or exceeds its interest in the associate, including any other
unsecured receivables, the Group does not recognise further losses, unless it has incurred obligations or made
payments on behalf of the associate.
Intercompany transactions and balances between group companies are eliminated. Unrealised gains on transactions
between group companies and between the Group and its jointly controlled entities and associates to the extent of
the Group’s interest are eliminated. Unrealised losses are also eliminated but (considered an impairment indicator)
unless the transaction provides evidence of an impairment of the asset transferred.
Accounting policies of subsidiaries, jointly controlled entities and associates have been changed where necessary to
ensure consistency with the policies adopted by the Group.

104
Notes to the Consolidated Financial Statements
China COSCO Holdings Company LimitedANNUAL REPORT 2005
2 Summary of significant accounting policies (Continued)
(d) Group accounting (Continued)
(i) Subsidiaries
Subsidiaries are all entities (including special purpose entities) over which the Group has the power to govern
the financial and operating policies generally accompanying a shareholding of more than one half of the voting
rights. The existence and effect of potential voting rights that are currently exercisable or convertible are
considered when assessing whether the Group controls another entity.
In the Company’s balance sheet the investments in subsidiaries are stated at cost less provision for impairment
losses. The results of subsidiaries are accounted by the Company on the basis of dividend income.
(ii) Jointly controlled entities
A jointly controlled entity is a joint venture established as a corporation, partnership or other entity in which the
ventures have their respective interests and establish a contractual arrangement among them to define joint
control over the economic activity of the entity.
(iii) Associates
Associates are all entities over which the Group has significant influence but not control, generally
accompanying a shareholding of between 20% and 50% of the voting rights.
(e) Foreign currency translation
(i) Functional and presentation currency
Items included in the financial statements of each of the Group’s entities are measured using the currency of the
primary economic environment in which the entity operates (the “functional currency”). The Company’s
functional currency is US dollar and its consolidated financial statements are presented in RMB. Presentation
currency is different from the Company’s functional currency because the Company is a PRC incorporated
company which is required to present its financial statements in RMB.
105China COSCO Holdings Company Limited
ANNUAL REPORT 2005
2 Summary of significant accounting policies (Continued)
(e) Foreign currency translation (Continued)
(ii) Transactions and balances
Foreign currency transactions are translated into the functional currency using the exchange rates prevailing at
the dates of the transactions. Foreign exchange gains and losses resulting from the settlement of such
transactions and from the translation at year end exchange rates of monetary assets and liabilities denominated
in foreign currencies are recognised in the consolidated income statement, except when deferred in equity as
qualifying cash flow hedges or qualifying net investment hedges.
Changes in the fair value of monetary securities denominated in foreign currency classified as available-for-sale
are analysed between translation differences resulting from changes in the amortised cost of the securities, and
other changes in the carrying amount of the securities. Translation differences are recognised in the income
statement, and other changes in carrying amount are recognised in equity.
Translation differences on non-monetary financial assets and liabilities are reported as part of the fair value gain
or loss. Translation differences on non-monetary financial assets and liabilities are recognised in profit or loss as
part of the fair value gain or loss. Translation differences on non-monetary financial assets are included in equity.
(iii) Group companies
The results and financial position of all the group entities (none of which has the currency of a hyperinflationary
economy) that have a functional currency different from the presentation currency are translated into the
presentation currency as follows:
(1) assets and liabilities for each balance sheet presented are translated at the closing rate at the date of that
balance sheet;
(2) income and expenses for each income statement are translated at average exchange rates (unless this
average is not a reasonable approximation of the cumulative effect of the rates prevailing on the
transaction dates, in which case income and expenses are translated at the dates of the transactions);
and
(3) all resulting exchange differences are recognised as a separate component of equity.
On consolidation, exchange differences arising from the translation of the net investment in foreign operations,
and of borrowings and other currency instruments designated as hedges of such investments, are taken to
equity. When a foreign operation is sold, exchange differences that were recorded in equity are recognised in
the income statement as part of the gain or loss on sale
Goodwill and fair value adjustments arising on the acquisition of a foreign entity are treated as assets and
liabilities of the foreign entity and translated at the closing rate.

106
Notes to the Consolidated Financial Statements
China COSCO Holdings Company LimitedANNUAL REPORT 2005
2 Summary of significant accounting policies (Continued)
(f) Property, plant and equipment
(i) Assets under construction
Assets under construction represent primarily vessels and buildings under construction, and plant and
equipment pending installation and are stated at cost less accumulated impairment losses. Cost includes all
direct costs relating to the construction of the assets and acquisition.
No depreciation is provided for assets under construction until such time as the relevant assets are completed
and ready for intended use. Assets under construction are transferred to relevant categories of property, plant
and equipment upon the completion of their respective construction.
(ii) Container vessels and containers
Container vessels and containers are stated at cost less accumulated depreciation and impairment losses.
Container vessels and containers are depreciated on a straight-line basis on an anticipated useful life of 25
years and 12 to 15 years respectively, after taking into account the estimated residual values. Cost incurred in
replacing or renewing the separate assets (dry-docking costs) of container vessels are capitalised and
depreciated on a straight-line basis over the estimated period until the next dry-docking (note 2(b)(ii)).
(iii) Other property, plant and equipment
Other property, plant and equipment are stated at cost less accumulated depreciation and impairment losses.
Other property, plant and equipment are depreciated at rates sufficient to write off their costs less accumulated
impairment losses over their estimated useful lives to their respective residual values estimated by the Directors
on a straight-line basis. The estimated useful lives of these assets are summarised as follows:
Buildings 25 to 50 years
Trucks, chassis and motor vehicles 5 to 10 years
Computer and office equipment 3 to 5 years
Historical cost includes expenditure that is directly attributable to the acquisition of the items. Subsequent costs
are included in the asset’s carrying amount or recognised as a separate asset, as appropriate, only when it is
probable that future economic benefits associated with the item will flow to the Group and the cost of the item
can be measured reliably. All other repairs and maintenance are expensed in the income statement during the
period in which they are incurred.
The residual values of the property, plant and equipment and their useful lives are reviewed and adjusted, if
appropriate, at each financial year end. An asset’s carrying amount is written down immediately to its
recoverable amount if the asset’s carrying amount is greater than its estimated recoverable amount.
The gain or loss on disposal of property, plant and equipment is the difference between the net sales proceeds
and the carrying amount of the relevant asset, and is recognised in the income statement.

107China COSCO Holdings Company Limited
ANNUAL REPORT 2005
2 Summary of significant accounting policies (Continued)
(g) Leasehold land and land use rights
Leasehold land and land use rights represent prepaid operating lease payments for land less accumulated
amortisation and any impairment losses. Amortisation is calculated using the straight-line method to allocate the
prepaid operating lease payments for land over the remaining lease term.
(h) Investment properties
Property that is held for long-term rental yields or for capital appreciation or both, and that is not occupied by the
companies in the consolidated group, is classified as investment property.
Investment properties are stated at cost less accumulated depreciation and impairment losses. The cost less
accumulated impairment and residual values of investment properties are depreciated on a straight-line basis over
their estimated useful lives of 25 to 50 years (note 2(b)(vii)).
(i) Intangible assets
(i) Goodwill
Goodwill represents the excess of purchase consideration over the fair value of the Group’s share of the net
identifiable assets of subsidiaries, jointly controlled entities and associates acquired at the date of acquisition.
Goodwill on acquisitions of subsidiaries is included in intangible assets. Goodwill on acquisitions of jointly
controlled entities and associates is included in investments in jointly controlled entities and associates
respectively.
Goodwill is tested annually or when an indication of impairment exists for impairment and carried at cost less
accumulated impairment losses. Impairment loss on goodwill are not reversed. Gains and losses on the
disposal of an entity include the carrying amount of goodwill relating to the entity sold. Goodwill is allocated to
cash-generating units for the purpose of impairment testing.
(ii) Computer software
Acquired computer software licences are capitalised on the basis of the costs incurred to acquire and bring to
use the specific software. These costs are amortised over their estimated useful lives of 5 years on a straight-
line basis.
Costs associated with developing or maintaining computer software programmes are recognised as an
expense as incurred. Costs that are directly associated with the production of identifiable and unique software
products controlled by the Group, and that will probably generate economic benefits exceeding costs beyond
one year, are recognised as intangible assets. Direct costs include the software development employee costs
and an appropriate portion of relevant overheads.
Computer system under development are transferred to computer software upon the completion of the
respective development and amortisation will then be commenced accordingly over the estimated useful lives
of 5 years on a straight-line basis.

108
Notes to the Consolidated Financial Statements
China COSCO Holdings Company LimitedANNUAL REPORT 2005
2 Summary of significant accounting policies (Continued)
(j) Impairment of assets
Assets that have an indefinite useful life are at least tested annually for impairment and are reviewed for impairment
whenever events or changes in circumstances indicate that the carrying amount may not be recoverable. Assets that
are subject to depreciation or amortisation are reviewed for impairment whenever events or changes in
circumstances indicate that the carrying amount may not be recoverable. An impairment loss is recognised for the
amount by which the asset’s carrying amount exceeds its recoverable amount. The recoverable amount is the higher
of an asset’s fair value less costs to sell and value in use. For the purposes of assessing impairment, assets are
grouped at the lowest levels for which there are separately identifiable cash flows (cash-generating units). Non-
financial assets other than goodwill that suffered an impairment are reviewed for possible reversal of the impairment
at each reporting date.
(k) Assets under leases
Leases where substantially all the risks and rewards of ownership of assets remain with the lessors are accounted for
as operating leases. Leases that substantially transfer to the lessees all the risks and rewards of ownership of assets
are accounted for as finance leases.
(i) Where the company is the lessee
(1) Operating leases
Payments made under operating leases (net of any incentives received from the leasing company) are
expensed in the income statement on a straight-line basis over the lease periods.
(2) Finance leases
Finance leases are capitalised at the inception of the lease at the lower of the fair value of the leased
assets or the present value of the minimum lease payments. Each lease payment is allocated between
the capital and finance charges so as to achieve a constant rate on the capital balances outstanding. The
corresponding rental obligations, net of finance charges, are included in current and non-current liabilities.
The finance charges are charged to the income statement over the lease periods.
Assets held under finance leases are depreciated over the shorter of their estimated useful lives or the
lease periods.

109China COSCO Holdings Company Limited
ANNUAL REPORT 2005
2 Summary of significant accounting policies (Continued)
(k) Assets under leases (Continued)
(ii) Where the company is the lessor
(1) Operating leases
When assets are leased out under operating leases, the assets are included in the balance sheet
according to their nature and where applicable, are depreciated in accordance with the Group’s
depreciation policies, as set out in note 2(f) above. Revenue arising from assets leased out under
operating leases is recognised in accordance with the Group’s revenue recognition policies, as set out in
note 2(x)(iii) below.
(2) Finance leases
Finance leases for assets leased out are leases of assets which contain a provision giving the lessee an
option to acquire legal title to the assets upon the fulfillment of certain conditions stated in the contracts.
When assets are leased out under a finance lease, the present value of the minimum lease payments is
recognised as a receivable. The difference between the gross receivable and the present value of the
receivable is recognised as unearned finance income. Revenue on containers leased out under finance
leases is recognised in accordance with the Group’s revenue recognition policies, as set out in note 2(x)(iii)
below.
(l) Investments
Prior to 31 December 2004:
The Group classified its investments in securities, other than subsidiaries, jointly controlled entities and associates as
investment securities.
Listed and unlisted investments which were intended to be held on a continuing basis were stated at cost less
provision for impairment losses.
The carrying amounts of individual investments were reviewed at each balance sheet date to assess whether the fair
values had declined below the carrying amounts. When a decline other than temporary had occurred, the carrying
amount of such investment was reduced to its fair value. The impairment loss was recognised as an expense in the
income statement. This impairment loss was written back to income statement when the circumstances and events
that led to the write-downs and write-offs ceased to exist and there was persuasive evidence that the new
circumstances and events would persist for the foreseeable future.

110
Notes to the Consolidated Financial Statements
China COSCO Holdings Company LimitedANNUAL REPORT 2005
2 Summary of significant accounting policies (Continued)
(l) Investments (Continued)
From 1 January 2005 onwards:
The Group classifies its investments as available-for-sale financial assets. Management determines the classification
of its investments at initial recognition and re-evaluates this designation at every reporting date.
Available-for-sale financial assets are non-derivatives and they are included in non-current assets unless management
intends to dispose of the investment within 12 months of the balance sheet date.
Available-for-sale financial assets are carried at fair value. Unrealised gains and losses arising from changes in the fair
value of monetary and non-monetary securities classified as available-for-sale are recognised in equity. When
securities classified as available-for-sale are sold or impaired, the accumulated fair value adjustments are included in
the income statement as gains or losses from investments.
The fair values of quoted investments are based on current bid prices. If the market for a financial asset is not active
(and for unlisted securities), the Group establishes fair value by using valuation techniques. These include the use of
recent arm’s length transactions, reference to other instruments that are substantially the same, discounted cash flow
analysis, and option pricing models making maximum use of market input and relying as little as possible on entity-
specific input.
The Group assesses at each balance sheet date whether there is objective evidence that available-for-sale financial
assets are impaired. A significant or prolonged decline in the fair value of the securities below its cost is considered as
an indicator that in determining whether the securities are impaired. If any such evidence exists the cumulative loss
(measured as the difference between the acquisition cost and the current fair value, less any impairment loss on that
financial asset previously recognised in the income statement) is removed from equity and recognised in the income
statement. Impairment losses recognised in the income statement on equity instruments are not reversed through the
income statement.
(m) Derivative financial instruments and hedging activities
Derivatives are initially recognised at fair value on the date a derivative contract is entered into and are subsequently
remeasured at their fair value. The method of recognising the resulting gain or loss depends on whether the derivative
is designated as a hedging instrument, and if so, the nature of the item being hedged. The Group designates certain
derivatives as hedge of the fair value of a recognised liability (note 2(b)(vi)(2)).
The Group documents at the inception of the transaction the relationship between hedging instruments and hedged
items, as well as its risk management objectives and strategy for undertaking various hedge transactions. The Group
also documents its assessment, both at hedge inception and on an ongoing basis, of whether the derivatives that are
used in hedging transactions are highly effective in offsetting changes in fair values of the hedged items.
The full fair value of a hedging derivative is classified as a non-current asset or liability if the remaining hedge item is
more than 12 months, and as a current asset or liability, if the remaining maturity of the hedged item is less than 12
months. Trading derivatives are classified as a current asset or liability.

111China COSCO Holdings Company Limited
ANNUAL REPORT 2005
2 Summary of significant accounting policies (Continued)
(m) Derivative financial instruments and hedging activities (Continued)
Changes in the fair value of derivatives that are designated and qualified as fair value hedges are recorded in the
income statement, together with any changes in the fair value of the hedged asset or liability that are attributable to
the hedged risk. The gain or loss relating to the effective portion of interest rate swaps hedging fixed rate borrowings
is recognised in the income statement within finance costs. The gain or loss relating to the ineffective portion is
recognised in the income statement within other gains. Changes in the fair value of the hedge fixed rate borrowings
attributable to interest rate risk are recognised in the income statement within finance costs. If the hedge no longer
meets the criteria for hedge accounting, the adjustment to the carrying amount of a hedge item for which the
effective interest method is used is amortised to profit or loss over the period to maturity.
Certain derivative instruments do not qualify for hedge accounting. Changes in the fair value of any derivative
instruments that do not qualify for hedge accounting are recognised immediately in the income statement within other
gains.
(n) Inventories
Inventories, primarily bunkers and resaleable containers, are stated at the lower of cost and net realisable value.
Costs are calculated on a weighted average basis. Net realisable value of bunkers is the expected amount to be
realised from use as estimated by the Directors whereas that of resaleable containers is determined on the basis of
anticipated sales proceeds less estimated selling expenses.
(o) Trade and other receivables
Trade and other receivables are recognised initially at fair value and subsequently measured at amortised cost using
the effective interest method, less provision for impairment. A provision for impairment of trade and other receivables
is established when there is objective evidence that the Group will not be able to collect all amounts due according to
the original terms of receivables. Significant financial difficulties of the debtor, probability that the debtor will enter
bankruptcy or financial reorganisation, and default or delinquency in payments are considered indicators that the
trade receivable is impaired. The amount of the provision is the difference between the asset’s carrying amount and
the present value of estimated future cash flows, discounted at the effective interest rate. The amount of the provision
is recognised in the income statement within other operating expenses.
(p) Cash and cash equivalents
Cash and cash equivalents include cash in hand, deposits held at call with banks, other short-term highly liquid
investments with original maturities of three months or less, and bank overdrafts.

112
Notes to the Consolidated Financial Statements
China COSCO Holdings Company LimitedANNUAL REPORT 2005
2 Summary of significant accounting policies (Continued)
(q) Provisions
Provisions are recognised when the Group has a present legal or constructive obligation as a result of past events, it
is more likely than not that an outflow of resources will be required to settle the obligation, and a reliable estimate of
the amount can be made. Provisions are not recognised for future operating losses.
Where there are a number of similar obligations, the likelihood that an outflow will be required in settlement is
determined by considering the class of obligations as a whole. A provision is recognised even if the likelihood of an
outflow with respect to any one item included in the same class of obligations may be small.
Provisions are measured at the present value of the expenditures expected to be required to settle the obligation
using a pre-tax rate that reflects current market assessments of the time value of money and the risks specific to the
obligation. The increase in the provision due to passage of time is recognised as interest expense.
(r) Share capital
Ordinary shares are classified as equity. Incremental costs directly attributable to the issue of new shares are shown in
equity as a deduction, net of tax, from the proceeds.
(s) Borrowings
Borrowings are recognised initially at fair value, net of transaction costs incurred. Transaction costs are incremental
costs that are directly attributable to the acquisition, issue or disposal of a financial asset or financial liability, including
fees and commissions paid to agents, advisers, brokers and dealers, levies by regulatory agencies and securities
exchanges, and transfer taxes and duties. Borrowings are subsequently stated at amortised cost; any difference
between the proceeds (net of transaction costs) and the redemption value is recognised in the income statement
over the period of the borrowings using the effective interest method.
Borrowings are classified as current liabilities unless the Group has an unconditional right to defer settlement of the
liability for at least 12 months after the balance sheet date.
(t) Government grants
Grants from the government are recognised at their fair value when there is a reasonable assurance that the Group
will comply with the conditions attaching with them and that the grants will be received.
Grants relating to income are deferred and recognised in the consolidated income statement over the period
necessary to match them with the costs they are intended to compensate. Grants with no future related costs are
recognised as income in the year in which they become receivable.
113China COSCO Holdings Company Limited
ANNUAL REPORT 2005
2 Summary of significant accounting policies (Continued)
(u) Employee benefits
(i) Employee leave entitlements
Employee entitlements to annual leave and long service leave are recognised when they accrue to employees.
A provision is made for the estimated liability for annual leave and long service leave as a result of services
rendered by employees up to the balance sheet date.
Employee entitlements to sick leave and maternity leave are not recognised until the time of leave.
(ii) Bonus entitlements
The expected cost of bonus payments is recognised as a liability when the Group has a present legal or
constructive obligation as a result of services rendered by employees and a reliable estimate of the obligation
can be made.
Liabilities for bonus are expected to be settled within twelve months and are measured at the amounts
expected to be paid when they are settled.
(iii) Retirement benefit costs
The Group has both defined benefit and defined contribution plans throughout the world, the assets of which
are generally held in separate trustee-administered funds. The plans are generally funded by payments from
employees and the relevant companies in the Group, determined by periodic actuarial calculations if required.
A defined contribution plan is a retirement benefit plan under which the Group pays fixed contributions into a
separate entity. Contributions under the defined contribution plans are charged to the income statement as
expense when incurred.
The Group also makes payments and contributions on a monthly basis according to various defined
contribution retirement benefit plans organised by relevant municipal and/or provincial governments in the PRC
and other relevant countries. The Group has no further obligations for post-retirement benefits beyond these
payments as they fall due. Payments made under these plans are expensed as incurred.
A defined benefit plan is a retirement benefit plan that is not a defined contribution plan. Under the plan, an
amount of retirement benefit that an employee will receive on retirement is defined, usually dependent on one or
more factors such as age, years of service and compensation.
The liability recognised in the balance sheet in respect of defined benefit retirement plans is the present value of
the defined benefit obligation at the balance sheet date less the fair value of retirement plan assets, together
with adjustments for unrecognised actuarial gains or losses and past service costs. The defined benefit
obligation is calculated annually by independent actuaries using the projected unit credit method. The present
value of the defined benefit obligation is determined by discounting the estimated future cash outflows using
interest rates of high-quality corporate bonds that are denominated in the currency in which the benefits will be
paid and that have terms to maturity approximating to the terms of the related retirement benefit liability.

114
Notes to the Consolidated Financial Statements
China COSCO Holdings Company LimitedANNUAL REPORT 2005
2 Summary of significant accounting policies (Continued)
(u) Employee benefits (Continued)
(iii) Retirement benefit costs (Continued)
Actuarial gains and losses arising from experience adjustments and changes in actuarial assumptions in excess
of the greater of 10% of the value of retirement plan assets or 10% of the present value of the defined benefit
obligation are recognised in the income statement over the employees’ expected average remaining working
lives.
Past service costs are recognised immediately as income, unless the changes to the retirement benefit plan are
conditional on the employees remaining in service for a specified period of time (the vesting period). In this
case, the past-service costs are amortised on a straight-line basis over the vesting period.
(iv) Other post-employment obligations
The Group also provides post-retirement healthcare benefits to their retirees. The entitlement to these benefits
is conditional on the employee remaining in service up to retirement age and the completion of a minimum
service period. The expected costs of these benefits are accrued over the period of employment using the
same accounting methodology as used for defined benefit retirement plans. Actuarial gains and losses arising
from experience adjustments, and changes in actuarial assumptions in excess of the greater of 10% of the
value of plan assets or 10% of the defined benefit obligation, are charged or credited to income over the
expected average remaining working lives of the related employees. These obligations are valued annually by
independent qualified actuaries.
(v) Early retirement benefits
Employee early retirement benefits are recognised in the period in which the Group has entered into an
agreement with the employee specifying the terms of early retirement or after the individual employee has been
advised of the specific terms. The specific terms vary among the early retired employees depending on various
factors including position, length of service and district of the employee concerned.
(vi) Housing funds
All full-time employees of the Group are entitled to participate in various government-sponsored housing funds.
The Group contributes on a monthly basis to these funds based on certain percentages of the salaries of the
employees. The Group’s liability in respect of these funds is limited to the contributions payable in each period.

115China COSCO Holdings Company Limited
ANNUAL REPORT 2005
2 Summary of significant accounting policies (Continued)
(u) Employee benefits (Continued)
(vii) Share-based payments
The Group regularly entered into equity-settled or cash-settled share-based payment transactions with
employees.
Employee services settled in cash
Employee services received in exchange for cash-settled share-based payments, are recognised at the fair
value of the liability incurred and are expensed when consumed or capitalised as assets, which are depreciated
or amortised. The liability is remeasured at each balance sheet date to its fair value, with all changes recognised
immediately in the income statement.
Employee services settled in equity instruments
One of the Group’s subsidiaries operates an equity-settled, share-based compensation plan. The fair value of
the employee services received in exchange for the grant of the share options of the subsidiary is recognised as
an expense. The total amount to be expensed over the vesting period is determined by reference to the fair
value of the options granted, excluding the impact of any non-market vesting conditions. Non-market vesting
conditions are included in assumptions about the number of options that are expected to become exercisable.
At each balance sheet date, the Group revises its estimates of the number of options that are expected to
become exercisable. It recognises the impact of the revision of original estimates, if any, in the consolidated
income statement, and a corresponding adjustment to equity over the remaining vesting period. The proceeds
received net of any directly attributable transaction costs are credited to share capital (nominal value) and share
premium when the options are exercised.
(v) Deferred income tax
Deferred income tax is provided in full, using the liability method, on temporary differences arising between the tax
bases of assets and liabilities and their carrying amounts in the Consolidated Financial Statements. However, the
deferred income tax is not accounted for if it arises from initial recognition of an asset or liability in a transaction other
than a business combination that at the time of the transaction affects neither accounting nor taxable profit or loss.
Deferred income tax is determined using tax rates (and laws) that have been enacted or substantially enacted by the
balance sheet date and are expected to apply when the related deferred income tax asset is realised or the deferred
income tax liability is settled.
Deferred income tax assets are recognised to the extent that it is probable that future taxable profit will be available
against which the temporary differences can be utilised.
Deferred income tax is provided on temporary differences arising on investments in subsidiaries, jointly controlled
entities and associates, except where the timing of the reversal of the temporary difference is controlled by the Group
and it is probable that the temporary difference will not reverse in the foreseeable future.

116
Notes to the Consolidated Financial Statements
China COSCO Holdings Company LimitedANNUAL REPORT 2005
2 Summary of significant accounting policies (Continued)
(w) Contingent liabilities and contingent assets
A contingent liability is a possible obligation that arises from past events and whose existence will only be confirmed
by the occurrence or non-occurrence of one or more uncertain future events not wholly within the control of the
Group. It can also be a present obligation arising from past events that is not recognised because it is not probable
that outflow of economic resources will be required or the amount of obligation cannot be measured reliably.
A contingent liability is not recognised but is disclosed in the notes to the Consolidated Financial Statements. When a
change in the probability of an outflow occurs so that outflow is probable, it will then be recognised as a provision.
A contingent asset is a possible asset that arises from past events and whose existence will be confirmed only by the
occurrence or non-occurrence of one or more uncertain events not wholly within the control of the Group.
Contingent assets are not recognised but are disclosed in the notes to the Consolidated Financial Statements when
an inflow of economic benefits is probable. When inflow is virtually certain, an asset is recognised.
(x) Recognition of revenue and income
The Group recognises revenues and income on the following basis:
(i) Revenue from container shipping
Freight revenues from the operation of international and domestic containerised transportation business are
recognised on a percentage of completion basis, which is determined on the time proportion method of each
individual vessel voyage.
(ii) Revenue from container terminal operations
Revenue from container terminal operations is recognised when the services rendered are complete and the
vessel leaves the berth.
(iii) Revenue from lease rental income
Rental income arising from assets leased out under operating leases are recognised on a straight-line basis
over the period of each lease.
Revenue on assets leased out under finance leases is allocated to accounting period to give a constant
periodic rate of return on the net investment in the lease in each period.

117China COSCO Holdings Company Limited
ANNUAL REPORT 2005
2 Summary of significant accounting policies (Continued)
(x) Recognition of revenue and income (Continued)
(iv) Revenue from freight forwarding and shipping agency
Revenue is recognised when the services are rendered.
For freight forwarding business, it generally coincides with the date of departure for outward freights and the
time of transfer of goods to the customers at the designated location for inward freight. For shipping agency
services, it generally coincides with the date of departure of the relevant vessels from the port.
Where the Group effectively acts as a principal in arranging transportation of goods for customers, revenue
recognised generally includes the carrier’s charges to the company. Where the Group effectively acts as an
agent for the customers, revenue recognised comprises fees for services provided by the Group.
(v) Income from sale of containers
Revenue from sale of containers is recognised on the transfer of risks and rewards of ownership, which
generally coincides with the time when the containers are delivered to customers and title has passed. Direct
costs relating to the lifting and storage of containers for sale are expressed as incurred.
(vi) Interest income
Interest income is recognised on a time-proportion basis using the effective interest method. When a receivable
is impaired, the Group reduces the carrying amount to its recoverable amount, being the estimated future cash
flow discounted at original effective interest rate of the instrument, and continues unwinding the discount as
interest income. Interest income on impaired loans is recognised using the original effective interest rate.
(vii) Dividend income
Dividend income is recognised when the right to receive payment is established.
(viii) Income on sale of investments
Income on sale of investments is recognised when the title to the investments is passed to the purchaser.
(y) Dividend distribution
Dividend distribution to the Company’s equity holders is recognised as a liability in the financial statements in the
period in which the dividends are approved by the Company’s equity holders.
(z) Borrowing costs
Borrowing costs that are directly attributable to the acquisition, construction or production of an asset that
necessarily takes a substantial period of time to get ready for its intended use or sale are capitalised as part of the
cost of that asset.
All other borrowing costs are charged to the income statement in the year in which they are incurred.

118
Notes to the Consolidated Financial Statements
China COSCO Holdings Company LimitedANNUAL REPORT 2005
2 Summary of significant accounting policies (Continued)
(aa) Segment reporting
A segment is a distinguishable component of the Group that is engaged either in providing products or services
(business segment), or in providing products or services within a particular economic environment (geographical
segment), which is subject to risks and rewards that are different from those of other segments.
In accordance with the Group’s internal financial reporting, the Group has determined that business segments are
presented as the primary reporting format and geographical as the secondary reporting format.
3 Financial risk management
(a) Financial risk factors
The Group’s activities expose it to a variety of financial risks: market risk (including foreign exchange risk and price
risk), credit risk, liquidity risk and interest rate risk. The management manages and monitors these exposures to
ensure appropriate measures are implemented on a timely and effective manner. The Group’s overall risk
management programme focuses on the unpredictability of financial markets and seeks to minimise potential adverse
effects on the Group’s financial performance. The Group uses derivative financial instruments to hedge certain risk
exposures. Details of these financial instruments are disclosed in respective notes. The risks associated with these
financial instruments and the policies on how to mitigate these risks are set out below.
(i) Market risk
(1) Foreign exchange risk
The Group operates internationally and is exposed to foreign exchange risk arising from various currency
exposures (such as RMB and EURO dollar), primarily with respect to the US dollar. Foreign exchange risk
arises from future commercial transactions, recognised assets and liabilities and net investments in
foreign operations. The Group currently does not have a foreign currency hedging policy. However, the
management monitors foreign exchange exposure and will consider hedging significant foreign currency
exposure should the need arise.
(2) Price risk
The Group is exposed to equity securities price risk because the Group’s investments are classified as
available-for-sale financial assets which are required to be stated at their fair values (see fair value
estimation below). The Group is also exposed to bunker’s price risk, the Group uses bunker forward
contracts to manage this risk.
(ii) Credit risk
The Group has no significant concentrations of credit risk. It has policies in place to ensure that credit sales are
made to customers with an appropriate trading history. The Group has policies that limit the amount of credit
exposure to any financial institution.

119China COSCO Holdings Company Limited
ANNUAL REPORT 2005
3 Financial risk management (Continued)
(a) Financial risk factors (Continued)
(iii) Liquidity risk
The Group adopts prudent liquidity risk management which implies maintaining sufficient cash and bank
balances, having available funding through an adequate amount of committed credit facilities and the ability to
close out market positions. Due to the dynamic nature of the underlying businesses, the Group aims to
maintain flexibility in funding by keeping committed credit lines available.
(iv) Cash flow and fair value interest rate risk
As the Group has no significant interest bearing assets, other than deposits and cash and cash equivalents, the
Group’s income and operating cash flows are substantially independent of changes in market interest rates.
The Group raises short-term loans and long-term borrowings at floating rates as well as fixed rates, based
upon the capital market conditions and the Group’s own internal requirements. Interest rate swap contracts
with financial institutions are used to achieve the optimum ratio between fixed and floating rates. The Group
uses certain interest rate swap contracts as hedge of the fair value of notes issued by the Group.
(v) Fair value estimation
The fair values of the Group’s available-for-sale financial assets are determined by reference to the methods
below:
– the quoted market price when the related investment is traded in an active market;
– valuation techniques (including pricing models or discounted cash flow models); and
– the price for similar recent transactions, with adjustment on the different in market conditions and
circumstances.
For major unlisted investment, the Group will determine the fair value of available-for-sale financial assets by
reference to valuation report of an independent professional valuer.
The fair value of interest rate swap contract is calculated as the present value of the estimated future cash
flows.
The nominal values less impairment provision (as applicable) of trade receivables and payables are assumed to
approximate their fair values. The fair value of financial liabilities for disclosure purposes is estimated by discounting
the future contractual cash flows at the current market interest rate that is available to the Group for similar financial
instruments.

120
Notes to the Consolidated Financial Statements
China COSCO Holdings Company LimitedANNUAL REPORT 2005
4 Critical accounting estimates and judgements
Estimates and judgements are continually evaluated and are based on historical experience and other factors, including
expectations of future events that are believed to be reasonable under the circumstance.
Critical accounting estimates and assumptions
The Group makes estimates and assumptions concerning the future. The resulting accounting estimates will, by definition,
seldom equal the related actual results. The estimates and assumptions that have a significant risk of causing a material
adjustment to the carrying amounts of assets and liabilities within the next financial year are discussed below.
(i) Impairment of container vessels and containers
The Group’s major operating assets represent container vessels and containers. The Group tests annually whether
container vessels and containers have suffered any impairment in accordance with the accounting policy stated in
note 2(j). The recoverable amounts of container vessels and containers have been determined based on value-in-use
calculations. These calculations require the use of estimates on the projections of cash inflows from the continue use
of container vessels and containers (including the amount to be received for the disposal of container vessels and
containers) and discount rate.
(ii) Useful lives and residual values of container vessels and containers
The Group’s major operating assets represent container vessels and containers. Management determines the
estimated useful lives of container vessels and containers by reference to the Group’s business model, its assets
management policy and also the industry practice. The useful lives could change significantly as a result of the
changes in these factors. The depreciation expense will increase where useful lives are less than previously estimated
lives.
Management determines the residual values of its container vessels and containers based on all relevant factors
(including the use of the current scrap value of steels in an active market as a reference value) at each measurement
date. The depreciation expense will change where the residual values are different from previously estimated values.
(iii) Fair value of available-for-sale financial assets
If information on current or recent prices of available-for-sale financial assets is not available, the fair values of
available-for-sale financial assets are determined using valuation techniques (including discounted cash flow model or
price/earnings multiple model). The Group uses assumptions that are mainly based on market conditions existing at
each balance sheet date.
(iv) Impairment of goodwill and other assets
The Group tests annually whether goodwill and other assets have suffered any impairment in accordance with the
accounting policy stated in note 2(j). The recoverable amount of an asset or a cash generating unit is determined
based on value-in-use calculations which require the use of assumptions and estimates.

121China COSCO Holdings Company Limited
ANNUAL REPORT 2005
4 Critical accounting estimates and judgements (Continued)
Critical accounting estimates and assumptions (Continued)
(v) Provision of operating costs
Operating costs, which mainly comprise container and cargo costs, vessel and voyage costs, sub-route and
transportation costs, are recognised on a percentage of completion basis. Invoices in relation to these expenses are
received approximately up to 6 months after the expenses have been incurred. Consequently, recognition of
operating costs is based on the rendering of services as well as the latest tariff agreed with vendors.
If the actual expenses of a voyage differ from the estimated expenses, this will have an impact on operating costs in
future periods.
(vi) Income taxes
The Group is subject to income taxes in numerous jurisdictions. Significant judgement is required in determining the
worldwide provision for income taxes. There are many transactions and calculations for which the ultimate tax
determination is uncertain during the ordinary course of business. Where the final tax outcome of these matters is
different from the amounts that were initially recorded, such differences will impact the income tax and deferred tax
provisions in the period in which such determination is made.
(vii) Revenue recognition
The Group recognises container shipping revenues on a percentage of completion basis, which is determined on the
time proportion method of each individual voyage.
Critical judgements in applying the Group’s accounting policies
Income taxes
Deferred tax liabilities have not been established for the withholding tax and differential tax that would be payable on the
undistributed profits of certain subsidiaries primarily operating in the United States of America or the PRC as the Directors
consider that the timing of the reversal of the related temporary differences can be controlled and such temporary
differences will not be reversed in the foreseeable future (note 16).

122
Notes to the Consolidated Financial Statements
China COSCO Holdings Company LimitedANNUAL REPORT 2005
5 Turnover and segment information
Turnover represents gross revenues from container shipping, container terminal, container leasing and freight forwarding
and shipping agency, net of discounts allowed, where applicable.
2005 2004
RMB’000 RMB’000
Container shipping (note a) 31,959,809 27,319,843.........................................................................................................................................................................................................................................................................................................................................................................................
Container terminal 106,378 99,274.........................................................................................................................................................................................................................................................................................................................................................................................
Container leasing (note b) 1,227,429 1,127,659.........................................................................................................................................................................................................................................................................................................................................................................................
Freight forwarding and shipping agency 5,872,094 3,641,893.........................................................................................................................................................................................................................................................................................................................................................................................
39,165,710 32,188,669
Notes:
(a) Revenue from container shipping include charterhire income under operating leases of RMB288,193,000 for the year ended 31
December 2005 (2004: RMB514,787,000).
(b) Revenue from container leasing is analysed below:
2005 2004
RMB’000 RMB’000
Operating lease rentals 1,223,072 1,122,916.........................................................................................................................................................................................................................................................................................................................................................................................
Finance lease income 4,357 4,743.........................................................................................................................................................................................................................................................................................................................................................................................
1,227,429 1,127,659
(c) Primary reporting format - business segments
In accordance with the Group’s internal financial reporting, the Group has determined that business segments are presented as the
primary reporting format and geographical as the secondary reporting format.
The Group is organised on a worldwide basis into the following segments:
- Container shipping
- Container terminal and related businesses
- Container leasing
- Freight forwarding and shipping agency
- Other operations that primarily comprise container manufacturing, banking and investment holding
Unallocated income mainly represents corporate interest income. Unallocated costs mainly represent corporate expenses. Segment
assets consist primarily of property, plant and equipment, investment properties, leasehold land and land use rights, intangible
assets, inventories, receivables and operating cash, and mainly exclude investments in jointly controlled entities, associates,
available-for-sale financial assets and investment securities, derivative financial assets, deferred income tax assets and corporate
assets. Segment liabilities comprise operating liabilities and mainly exclude items such as current and deferred income tax liabilities,
distribution payable, corporate borrowings and related hedging derivatives. Capital expenditure comprises additions to property,
plant and equipment, investment properties, leasehold land and land use rights and intangible assets, including additions resulting
from acquisitions through business combination.

123China COSCO Holdings Company Limited
ANNUAL REPORT 2005
5 Turnover and segment information (Continued)
(c) Primary reporting format - business segments (Continued)
Year ended and as at 31 December 2005
FreightContainer forwarding
terminal and Inter-Container and related Container shipping Other segmentshipping businesses leasing agency operations elimination TotalRMB’000 RMB’000 RMB’000 RMB’000 RMB’000 RMB’000 RMB’000
Turnover.........................................................................................................................................................................................................................................................................................................................................................................................
External sales 31,959,809 106,378 1,227,429 5,872,094 — — 39,165,710.........................................................................................................................................................................................................................................................................................................................................................................................
Inter-segment sales — 51,973 1,035,547 2,330,690 — (3,418,210) —.........................................................................................................................................................................................................................................................................................................................................................................................
31,959,809 158,351 2,262,976 8,202,784 — (3,418,210) 39,165,710.........................................................................................................................................................................................................................................................................................................................................................................................
Segment results 4,705,310 216,743 1,287,470 397,726 6,123 — 6,613,372.........................................................................................................................................................................................................................................................................................................................................................................................
Profit on disposal of anavailable-for-salefinancial asset (note 29(b)) — 512,117 — — — — 512,117
.........................................................................................................................................................................................................................................................................................................................................................................................
Unallocated income 148,522.........................................................................................................................................................................................................................................................................................................................................................................................
Unallocated expenses (219,138).........................................................................................................................................................................................................................................................................................................................................................................................
Operating profit 7,054,873.........................................................................................................................................................................................................................................................................................................................................................................................
Finance costs (868,393).........................................................................................................................................................................................................................................................................................................................................................................................
Share of profits less losses of- jointly controlled entities — 449,012 — 127,615 25,225 — 601,852
.........................................................................................................................................................................................................................................................................................................................................................................................
- associates — 136,427 — 5,567 519,924 — 661,918.........................................................................................................................................................................................................................................................................................................................................................................................
Profit before income tax 7,450,250.........................................................................................................................................................................................................................................................................................................................................................................................
Income tax expenses (651,319).........................................................................................................................................................................................................................................................................................................................................................................................
Profit for the year 6,798,931.........................................................................................................................................................................................................................................................................................................................................................................................
Segment assets 23,445,451 422,903 12,622,708 4,351,793 113 (1,887,249) 38,955,719.........................................................................................................................................................................................................................................................................................................................................................................................
Jointly controlled entities — 1,624,257 — 1,493,052 147,200 — 3,264,509.........................................................................................................................................................................................................................................................................................................................................................................................
Associates — 970,232 — 24,955 3,073,367 — 4,068,554.........................................................................................................................................................................................................................................................................................................................................................................................
Available-for-sale financial assets — 2,134,744 — 8,945 89,353 — 2,233,042.........................................................................................................................................................................................................................................................................................................................................................................................
Unallocated assets 3,153,830.........................................................................................................................................................................................................................................................................................................................................................................................
Total assets 51,675,654.........................................................................................................................................................................................................................................................................................................................................................................................
Segment liabilities 12,274,448 1,030,500 4,665,640 4,551,742 443,861 (1,887,249) 21,078,942.........................................................................................................................................................................................................................................................................................................................................................................................
Unallocated liabilities 4,651,620.........................................................................................................................................................................................................................................................................................................................................................................................
Total liabilities 25,730,562.........................................................................................................................................................................................................................................................................................................................................................................................
Depreciation and amortisation 835,980 10,753 886,338 72,322 3,911 — 1,809,304.........................................................................................................................................................................................................................................................................................................................................................................................
Capital expenditure 2,688,135 35,791 2,749,623 300,860 7,287 — 5,781,696.........................................................................................................................................................................................................................................................................................................................................................................................
Provision for impairmentof trade receivables — — 11,376 15,897 — — 27,273
.........................................................................................................................................................................................................................................................................................................................................................................................
Other non-cash expenses 6,236 1,900 16,117 2,290 1,833 — 28,376

124
Notes to the Consolidated Financial Statements
China COSCO Holdings Company LimitedANNUAL REPORT 2005
5 Turnover and segment information (Continued)
(c) Primary reporting format - business segments (Continued)
Year ended and as at 31 December 2004 (Restated)
FreightContainer forwarding
terminal and Inter-Container and related Container shipping Other segmentshipping businesses leasing agency operations elimination Total
RMB’000 RMB’000 RMB’000 RMB’000 RMB’000 RMB’000 RMB’000
Turnover.........................................................................................................................................................................................................................................................................................................................................................................................
External sales 27,319,843 99,274 1,127,659 3,641,893 — — 32,188,669.........................................................................................................................................................................................................................................................................................................................................................................................
Inter-segment sales — 54,984 999,911 2,256,495 — (3,311,390 ) —.........................................................................................................................................................................................................................................................................................................................................................................................
27,319,843 154,258 2,127,570 5,898,388 — (3,311,390 ) 32,188,669.........................................................................................................................................................................................................................................................................................................................................................................................
Segment results 3,495,858 240,497 1,073,901 210,989 (666 ) — 5,020,579.........................................................................................................................................................................................................................................................................................................................................................................................
Unallocated income 85,083.........................................................................................................................................................................................................................................................................................................................................................................................
Unallocated expenses (59,946 ).........................................................................................................................................................................................................................................................................................................................................................................................
Operating profit 5,045,716.........................................................................................................................................................................................................................................................................................................................................................................................
Finance costs (639,760 ).........................................................................................................................................................................................................................................................................................................................................................................................
Share of profits lesslosses of- jointly controlled entities — 425,893 — 109,511 25,327 — 560,731
.........................................................................................................................................................................................................................................................................................................................................................................................
- associates — 145,212 — 503 130,898 — 276,613.........................................................................................................................................................................................................................................................................................................................................................................................
Profit before income tax 5,243,300.........................................................................................................................................................................................................................................................................................................................................................................................
Income tax expenses (285,757 ).........................................................................................................................................................................................................................................................................................................................................................................................
Profit for the year 4,957,543.........................................................................................................................................................................................................................................................................................................................................................................................
Segment assets 19,802,632 431,099 11,037,299 5,058,914 38,483 (1,948,872 ) 34,419,555.........................................................................................................................................................................................................................................................................................................................................................................................
Jointly controlled entities — 1,402,033 — 1,514,867 131,583 — 3,048,483.........................................................................................................................................................................................................................................................................................................................................................................................
Associates — 866,668 — 18,203 2,402,834 — 3,287,705.........................................................................................................................................................................................................................................................................................................................................................................................
Investment securities — 467,030 — 34,805 108,222 — 610,057.........................................................................................................................................................................................................................................................................................................................................................................................
Unallocated assets 2,883,767.........................................................................................................................................................................................................................................................................................................................................................................................
Total assets 44,249,567.........................................................................................................................................................................................................................................................................................................................................................................................
Segment liabilities 16,166,420 903,846 3,352,748 5,468,213 3,330,816 (1,948,872 ) 27,273,171.........................................................................................................................................................................................................................................................................................................................................................................................
Unallocated liabilities 3,573,874.........................................................................................................................................................................................................................................................................................................................................................................................
Total liabilities 30,847,045.........................................................................................................................................................................................................................................................................................................................................................................................
Depreciation and amortisation 922,684 10,446 842,341 105,225 3,600 — 1,884,296.........................................................................................................................................................................................................................................................................................................................................................................................
Capital expenditure 601,613 8,947 2,279,122 257,490 4,114 — 3,151,286.........................................................................................................................................................................................................................................................................................................................................................................................
Provision/(reversal of provision) forimpairment of trade receivables (6,632 ) — (182 ) 34,232 — — 27,418
.........................................................................................................................................................................................................................................................................................................................................................................................
Other non-cash expenses 23,439 — 7,367 34,204 — — 65,010

125China COSCO Holdings Company Limited
ANNUAL REPORT 2005
5 Turnover and segment information (Continued)
(d) Secondary reporting format - geographical segments
The Group’s businesses are managed on a worldwide basis. The turnover generated from the world’s major trade
lanes for container shipping business mainly includes Trans-Pacific, Asia-Europe, Intra-Asia, PRC and Trans-Atlantic
which are reported as follows:
Geographical Segment trade lanes
America Trans-Pacific
Europe Asia-Europe
Asia Pacific Intra-Asia
China domestic PRC
Other international market Trans-Atlantic and others
In respect of container leasing, the movements of containers under operating leases or finance leases are known
through reports from the lessees but the Group is not able to control the movements of containers except to the
degree that the movements are restricted by the terms of the leases or where safety of the containers is concerned. It
is therefore impracticable to present segment information by geographical area and thus the turnover of which is
presented as unallocated turnover.
In respect of other activities including container terminals and freight forwarding, shipping agency and logistics,
turnover is based on the geographical locations in which the business operations are located.
The Group’s total assets are primarily dominated by its container vessels and containers. The Directors consider that
the nature of the Group’s business precludes a meaningful allocation of container vessels and containers and their
related capital expenditure to specific geographical segments as defined under the HKAS 14 “Segmental reporting”
issued by the HKICPA. These container vessels and containers are primarily utilised across geographical markets for
shipment of cargoes throughout the world. Accordingly, geographical segment information is only presented for
turnover.
2005 2004
RMB’000 RMB’000
America 12,527,188 10,682,762.........................................................................................................................................................................................................................................................................................................................................................................................
Europe 9,524,197 7,473,639.........................................................................................................................................................................................................................................................................................................................................................................................
Asia Pacific 6,280,865 5,507,037.........................................................................................................................................................................................................................................................................................................................................................................................
China domestic 7,032,641 5,126,934.........................................................................................................................................................................................................................................................................................................................................................................................
Other international market 2,573,387 2,270,638.........................................................................................................................................................................................................................................................................................................................................................................................
Unallocated 1,227,432 1,127,659.........................................................................................................................................................................................................................................................................................................................................................................................
Total turnover 39,165,710 32,188,669

126
Notes to the Consolidated Financial Statements
China COSCO Holdings Company LimitedANNUAL REPORT 2005
6 Property, plant and equipment
Group
Trucks,
chassis Computer Assets
Container and motor and office under
Buildings vessels Containers vehicles equipment construction Total
RMB’000 RMB’000 RMB’000 RMB’000 RMB’000 RMB’000 RMB’000
Cost.........................................................................................................................................................................................................................................................................................................................................................................................
At 1 January 2005 572,914 25,483,788 14,771,333 402,035 754,715 635,485 42,620,270.........................................................................................................................................................................................................................................................................................................................................................................................
Exchange differences (1,373) (323,237) (366,887) (1,016) (8,661) (11,263) (712,437).........................................................................................................................................................................................................................................................................................................................................................................................
Reclassifications 27,091 — — 1,576 117,270 (145,937) —.........................................................................................................................................................................................................................................................................................................................................................................................
Additions 88,063 121,978 2,692,282 55,553 103,964 2,618,870 5,680,710.........................................................................................................................................................................................................................................................................................................................................................................................
Disposals/transfers (21,550) — (997,214) (165,365) (28,028) — (1,212,157).........................................................................................................................................................................................................................................................................................................................................................................................
At 31 December 2005 665,145 25,282,529 16,099,514 292,783 939,260 3,097,155 46,376,386.........................................................................................................................................................................................................................................................................................................................................................................................
Accumulated depreciation.........................................................................................................................................................................................................................................................................................................................................................................................
At 1 January 2005 85,754 11,646,531 4,796,854 192,772 435,916 — 17,157,827.........................................................................................................................................................................................................................................................................................................................................................................................
Exchange differences (16) (115,596) (124,769) (681) (5,570) — (246,632).........................................................................................................................................................................................................................................................................................................................................................................................
Charge for the year 23,615 696,483 875,035 31,747 106,044 — 1,732,924.........................................................................................................................................................................................................................................................................................................................................................................................
Disposals/transfers (3,826) — (571,003) (45,104) (24,592) — (644,525).........................................................................................................................................................................................................................................................................................................................................................................................
At 31 December 2005 105,527 12,227,418 4,976,117 178,734 511,798 — 17,999,594.........................................................................................................................................................................................................................................................................................................................................................................................
Net book value
At 31 December 2005 559,618 13,055,111 11,123,397 114,049 427,462 3,097,155 28,376,792

127China COSCO Holdings Company Limited
ANNUAL REPORT 2005
6 Property, plant and equipment (Continued)
Group
Trucks,
chassis Computer Assets
Container and motor and office under
Buildings vessels Containers vehicles equipment construction Total
RMB’000 RMB’000 RMB’000 RMB’000 RMB’000 RMB’000 RMB’000
Cost.........................................................................................................................................................................................................................................................................................................................................................................................
At 1 January 2004 620,917 26,601,768 13,673,223 260,565 709,887 65,342 41,931,702.........................................................................................................................................................................................................................................................................................................................................................................................
Exchange differences 2,435 (793) 2 2,412 6,971 — 11,027.........................................................................................................................................................................................................................................................................................................................................................................................
Reclassifications 3,874 — 8,818 2,659 18,759 (34,110) —.........................................................................................................................................................................................................................................................................................................................................................................................
Additions 30,840 — 2,242,628 167,639 55,811 604,253 3,101,171.........................................................................................................................................................................................................................................................................................................................................................................................
Disposals/transfers (78,303) (1,117,187) (1,153,338) (18,178) (35,472) — (2,402,478).........................................................................................................................................................................................................................................................................................................................................................................................
Disposals of subsidiaries (6,849) — — (13,062) (1,241) — (21,152).........................................................................................................................................................................................................................................................................................................................................................................................
At 31 December 2004 572,914 25,483,788 14,771,333 402,035 754,715 635,485 42,620,270.........................................................................................................................................................................................................................................................................................................................................................................................
Accumulated depreciation.........................................................................................................................................................................................................................................................................................................................................................................................
At 1 January 2004 80,227 11,041,215 4,702,816 166,729 367,865 — 16,358,852.........................................................................................................................................................................................................................................................................................................................................................................................
Exchange differences 399 (239) 6 1,906 4,587 — 6,659.........................................................................................................................................................................................................................................................................................................................................................................................
Charge for the year 22,665 824,586 826,390 46,494 90,539 — 1,810,674.........................................................................................................................................................................................................................................................................................................................................................................................
Disposals/transfers (13,368) (219,031) (732,358) (14,106) (26,322) — (1,005,185).........................................................................................................................................................................................................................................................................................................................................................................................
Disposal of subsidiaries (4,169) — — (8,251) (753) — (13,173).........................................................................................................................................................................................................................................................................................................................................................................................
At 31 December 2004 85,754 11,646,531 4,796,854 192,772 435,916 — 17,157,827.........................................................................................................................................................................................................................................................................................................................................................................................
Net book value
At 31 December 2004 487,160 13,837,257 9,974,479 209,263 318,799 635,485 25,462,443

128
Notes to the Consolidated Financial Statements
China COSCO Holdings Company LimitedANNUAL REPORT 2005
6 Property, plant and equipment (Continued)
Company
Computer
Motor and office
vehicles equipment Total
RMB’000 RMB’000 RMB’000
Cost
Additions 1,400 5,309 6,709.........................................................................................................................................................................................................................................................................................................................................................................................
Accumulated depreciation
Charge for the year (58) (432) (490).........................................................................................................................................................................................................................................................................................................................................................................................
Net book value
At 31 December 2005 1,342 4,877 6,219
Notes:
(a) The aggregate cost and accumulated depreciation of the leased assets, where the Group is the lessor under the operating lease
arrangements, are set out below:
Container
Containers vessels Total
RMB’000 RMB’000 RMB’000
At 31 December 2005
Cost 7,940,649 — 7,940,649.........................................................................................................................................................................................................................................................................................................................................................................................
Accumulated depreciation (2,319,028) — (2,319,028).........................................................................................................................................................................................................................................................................................................................................................................................
5,621,621 — 5,621,621.........................................................................................................................................................................................................................................................................................................................................................................................
At 31 December 2004
Cost 8,023,823 1,001,033 9,024,856.........................................................................................................................................................................................................................................................................................................................................................................................
Accumulated depreciation (2,091,581) (705,816 ) (2,797,397).........................................................................................................................................................................................................................................................................................................................................................................................
5,932,242 295,217 6,227,459
(b) As at 31 December 2005, certain containers and container vessels with an aggregate net book value of RMB4,126,067,000 and
RMB10,748,980,000 respectively (2004: RMB2,730,673,000 and RMB11,471,568,000) were pledged as securities for loan facilities
granted by banks or third parties (note 23(i)).
(c) During the year, the Group transferred containers with an aggregate net book value of RMB171,529,000 (2004: RMB263,382,000)
to inventories.
(d) As at 31 December 2004, the net book value of chassis held under finance leases by the Group was RMB115,171,000.

129China COSCO Holdings Company Limited
ANNUAL REPORT 2005
7 Investment properties
Group
2005 2004
RMB’000 RMB’000
At 1 January (note a) 13,880 12,738.........................................................................................................................................................................................................................................................................................................................................................................................
Exchange differences (183) —.........................................................................................................................................................................................................................................................................................................................................................................................
Reclassifications — (1,275).........................................................................................................................................................................................................................................................................................................................................................................................
Disposals (6,580) —.........................................................................................................................................................................................................................................................................................................................................................................................
Depreciation (289) —.........................................................................................................................................................................................................................................................................................................................................................................................
Revaluation (note 29) — 2,417.........................................................................................................................................................................................................................................................................................................................................................................................
At 31 December 6,828 13,880.........................................................................................................................................................................................................................................................................................................................................................................................
Cost 7,113 13,880.........................................................................................................................................................................................................................................................................................................................................................................................
Accumulated depreciation (285) —.........................................................................................................................................................................................................................................................................................................................................................................................
Net book value 6,828 13,880
Notes:
(a) The investment properties as at 31 December 2004 were revalued on an open market value basis by DTZ Debenham Tie Leung
Limited and Sallmanns (Far East) Ltd., independent professional property valuers.
The net book value of the properties as at 31 December 2004 was deemed as the cost as at 1 January 2005. The portion of
prepaid operating lease payments has not been segregated from the investment properties as the amount is insignificant to the
Group.
(b) During the year ended 31 December 2004, certain investment properties of RMB530,000 and RMB745,000 were transferred to
buildings and leasehold land respectively.
(c) The fair value of the investment properties as at 31 December 2005 was RMB11,161,000.

130
Notes to the Consolidated Financial Statements
China COSCO Holdings Company LimitedANNUAL REPORT 2005
8 Leasehold land and land use rights
Group2005 2004
RMB’000 RMB’000
At 1 January 155,930 130,969.........................................................................................................................................................................................................................................................................................................................................................................................
Additions 48,969 34,822.........................................................................................................................................................................................................................................................................................................................................................................................
Exchange differences (4,931) 1,380.........................................................................................................................................................................................................................................................................................................................................................................................
Amortisation (1,916) (4,303).........................................................................................................................................................................................................................................................................................................................................................................................
Disposals — (6,938).........................................................................................................................................................................................................................................................................................................................................................................................
At 31 December 198,052 155,930
Notes:
(a) The Group’s interests in leasehold land and land use rights represent prepaid operating lease payments and their net book values
are analysed as follows:
Group
2005 2004
RMB’000 RMB’000
In Hong Kong, held on:
Leases of over 50 years 130,681 105,806.........................................................................................................................................................................................................................................................................................................................................................................................
Leases of between 10 to 50 years 1,934 2,096.........................................................................................................................................................................................................................................................................................................................................................................................
132,615 107,902.........................................................................................................................................................................................................................................................................................................................................................................................
Outside Hong Kong, held on:
Leases of over 50 years 9,091 —.........................................................................................................................................................................................................................................................................................................................................................................................
Leases of between 10 to 50 years 56,346 48,028.........................................................................................................................................................................................................................................................................................................................................................................................
65,437 48,028.........................................................................................................................................................................................................................................................................................................................................................................................
198,052 155,930
(b) As at 31 December 2005, land use rights outside Hong Kong with net book value of RMB13,598,000 (2004: RMB14,369,000) were
pledged as securities for loan facility granted by a bank (note 23(i)).

131China COSCO Holdings Company Limited
ANNUAL REPORT 2005
9 Intangible assets
Group Company
Computer
Computer software software
2005 2004 2005
RMB’000 RMB’000 RMB’000
Cost 439,112 393,854 132.........................................................................................................................................................................................................................................................................................................................................................................................
Accumulated amortisation and impairment (291,028) (222,620) (13).........................................................................................................................................................................................................................................................................................................................................................................................
Net book value at 31 December 148,084 171,234 119.........................................................................................................................................................................................................................................................................................................................................................................................
At 1 January 171,234 223,712 —.........................................................................................................................................................................................................................................................................................................................................................................................
Exchange differences (728) 273 —.........................................................................................................................................................................................................................................................................................................................................................................................
Additions 52,017 16,568 132.........................................................................................................................................................................................................................................................................................................................................................................................
Amortisation (74,175) (69,319) (13).........................................................................................................................................................................................................................................................................................................................................................................................
Disposal/write-off (264) — —.........................................................................................................................................................................................................................................................................................................................................................................................
At 31 December 148,084 171,234 119
10 Subsidiaries
Company
2005
RMB’000
Unlisted investments, at cost 6,868,438
Current assets.........................................................................................................................................................................................................................................................................................................................................................................................
Amounts due from subsidiaries (note a) 10,761,230
Current liabilities.........................................................................................................................................................................................................................................................................................................................................................................................
Amounts due to subsidiaries (note a) (4,411,050)
Notes:
(a) The amounts due from/(to) subsidiaries are unsecured, interest free and have no fixed terms of repayment.
(b) Details of principal subsidiaries as at 31 December 2005 are shown in note 41(a) to the Consolidated Financial Statements.

132
Notes to the Consolidated Financial Statements
China COSCO Holdings Company LimitedANNUAL REPORT 2005
11 Jointly controlled entities
Group2005 2004
RMB’000 RMB’000
Share of net assets 2,669,929 2,422,725.........................................................................................................................................................................................................................................................................................................................................................................................
Goodwill on acquisition (note a) 421,741 395,028.........................................................................................................................................................................................................................................................................................................................................................................................
Loans to jointly controlled entities (note b) 172,839 230,730.........................................................................................................................................................................................................................................................................................................................................................................................
3,264,509 3,048,483
Unlisted investments, at cost 4,732,755 4,717,822
Notes:
(a) The carrying amount of goodwill on acquisition of jointly controlled entities as at 31 December 2005 mainly represented the goodwill
on acquisition of equity interests in COSCO Logistics Co., Ltd (“COSCO Logistics”), Qingdao Qianwan Container Terminal Co., Ltd
and Nanjing Port Longtan Containers Co., Ltd of RMB340,974,000 (2004: RMB349,712,000), RMB43,272,000 (2004:
RMB44,381,000), and RMB36,582,000 (2004: N/A) respectively. The estimated useful lives of goodwill range from 20 years to 35
years by reference to the respective joint venture periods of jointly controlled entities. The movement during the year is as follows:
Group
2005 2004
RMB’000 RMB’000
Cost.........................................................................................................................................................................................................................................................................................................................................................................................
At 1 January, as previously reported 415,778 46,707.........................................................................................................................................................................................................................................................................................................................................................................................
Exchange differences (10,387) —.........................................................................................................................................................................................................................................................................................................................................................................................
Elimination (note 2(b)(ix)) (20,232) —.........................................................................................................................................................................................................................................................................................................................................................................................
At 1 January, as restated 385,159 46,707.........................................................................................................................................................................................................................................................................................................................................................................................
Additions 36,582 369,071.........................................................................................................................................................................................................................................................................................................................................................................................
At 31 December 421,741 415,778.........................................................................................................................................................................................................................................................................................................................................................................................
Accumulated amortisation.........................................................................................................................................................................................................................................................................................................................................................................................
At 1 January, as previously reported 20,750 —.........................................................................................................................................................................................................................................................................................................................................................................................
Exchange differences (518) —.........................................................................................................................................................................................................................................................................................................................................................................................
Elimination (note 2(b)(ix)) (20,232) —.........................................................................................................................................................................................................................................................................................................................................................................................
At 1 January, as restated — —.........................................................................................................................................................................................................................................................................................................................................................................................
Amortisation for the year — (20,750).........................................................................................................................................................................................................................................................................................................................................................................................
At 31 December — (20,750).........................................................................................................................................................................................................................................................................................................................................................................................
Net book value.........................................................................................................................................................................................................................................................................................................................................................................................
At 31 December 421,741 395,028
The recoverable amount of the goodwill is determined based on value-in-use calculations. These calculations use cash flow
projections based on financial budgets approved by management of respective jointly controlled entities covering a one-year period.
Cash flows beyond the one-year period are extrapolated using the estimated growth rates stated below. The growth rates do not
exceed the long term average growth rate for container terminal and logistics business in the PRC.

133China COSCO Holdings Company Limited
ANNUAL REPORT 2005
11 Jointly controlled entities (Continued)
Key assumptions used for value-in-use calculations include:
(i) the growth in the projected earnings before interest, depreciation, amortisation and income tax (“EBITDA”) of respective jointly
controlled entities for the coming five years ranging from 5% to 16%;
(ii) the growth rates used to extrapolate cash flow projections beyond a five years’ period ranging from 3% to 5%; and
(iii) a discount rate of 10%.
Management determined projected EBITDA based on past performance and its expectations for the market development. The
discount rates used are pre-tax and reflect specific risks relating to the relevant industry.
Based on the management’s assessment, no impairment has been recognised for the year ended 31 December 2005.
(b) The loans to jointly controlled entities are unsecured. Except for an amount of RMB77,522,000 (2004: RMB81,027,000) which
bears interest at 1.60% (2004: 1.60%) per annum above the applicable swap offer rate as determined by the Association of Banks
in Singapore, the remaining balance is interest free. Loans to jointly controlled entities of RMB77,522,000 (2004: RMB81,027,000)
and RMB95,317,000 (2004: RMB149,689,000) are wholly repayable on or before October 2013 and January 2035 respectively.
(c) The Company has no directly owned jointly controlled entity as at 31 December 2005 and 2004. Details of principal jointly controlled
entities as at 31 December 2005 are shown in note 41(b) to the Consolidated Financial Statements.
(d) The financial information below represents the Group’s interests in respective jointly controlled entities.
Profits less
Non-current Current Non-current Current Minority losses after
assets assets liabilities liabilities interests Turnover income tax
RMB$’000 RMB$’000 RMB$’000 RMB$’000 RMB$’000 RMB$’000 RMB$’000
2005.........................................................................................................................................................................................................................................................................................................................................................................................
COSCO-HIT Terminals (Hong
Kong) Limited 1,184,197 234,964 (1,117,900 ) (108,988 ) — 541,827 229,162.........................................................................................................................................................................................................................................................................................................................................................................................
COSCO Logistics 772,584 2,124,408 (121,634 ) (1,562,714 ) (68,863 ) 5,245,074 123,373.........................................................................................................................................................................................................................................................................................................................................................................................
Others 1,982,566 609,718 (651,749 ) (606,660 ) — 1,412,062 249,317.........................................................................................................................................................................................................................................................................................................................................................................................
3,939,347 2,969,090 (1,891,283 ) (2,278,362 ) (68,863 ) 7,198,963 601,852.........................................................................................................................................................................................................................................................................................................................................................................................
2004.........................................................................................................................................................................................................................................................................................................................................................................................
COSCO-HIT Terminals (Hong
Kong) Limited 1,269,088 161,029 (1,147,374 ) (83,424 ) — 531,491 262,985.........................................................................................................................................................................................................................................................................................................................................................................................
COSCO Logistics 672,374 2,175,552 (79,095 ) (1,628,789 ) (63,650 ) 3,882,269 98,074.........................................................................................................................................................................................................................................................................................................................................................................................
Others 1,881,341 896,687 (780,260 ) (778,934 ) (71,820 ) 1,489,721 199,672.........................................................................................................................................................................................................................................................................................................................................................................................
3,822,803 3,233,268 (2,006,729 ) (2,491,147 ) (135,470 ) 5,903,481 560,731
There are no significant contingent liabilities relating to the Group’s interest in the jointly controlled entities, and no significant
contingent liabilities of the jointly controlled entities themselves.

134
Notes to the Consolidated Financial Statements
China COSCO Holdings Company LimitedANNUAL REPORT 2005
12 Associates
Group
2005 2004
RMB’000 RMB’000
Share of net assets 3,953,562 3,409,625.........................................................................................................................................................................................................................................................................................................................................................................................
Goodwill on acquisition (note a) 702 1,556.........................................................................................................................................................................................................................................................................................................................................................................................
Negative goodwill on acquisition (note a) — (164,596).........................................................................................................................................................................................................................................................................................................................................................................................
Loans to associates (note b) 114,290 41,120.........................................................................................................................................................................................................................................................................................................................................................................................
4,068,554 3,287,705
Investments, at cost.........................................................................................................................................................................................................................................................................................................................................................................................
- Listed shares in Hong Kong 1,768,899 1,814,227.........................................................................................................................................................................................................................................................................................................................................................................................
- Unlisted shares 1,828,026 1,541,600.........................................................................................................................................................................................................................................................................................................................................................................................
3,596,925 3,355,827
Market value of listed shares 1,113,663 1,083,956
Notes:
(a) Movement of goodwill/(negative goodwill) during the year is as follows:
Group
Negative
Goodwill goodwill Total
RMB’000 RMB’000 RMB’000
Cost
At 1 January 2004 — — —.........................................................................................................................................................................................................................................................................................................................................................................................
Additions 1,556 (164,596 ) (163,040).........................................................................................................................................................................................................................................................................................................................................................................................
At 31 December 2004, as previously reported 1,556 (164,596 ) (163,040).........................................................................................................................................................................................................................................................................................................................................................................................
Derecognition (note 2(b)(ix)) — 164,596 164,596.........................................................................................................................................................................................................................................................................................................................................................................................
At 1 January 2005, as restated 1,556 — 1,556.........................................................................................................................................................................................................................................................................................................................................................................................
Partial disposal of equity interest (815) — (815).........................................................................................................................................................................................................................................................................................................................................................................................
Exchange differences (39) — (39).........................................................................................................................................................................................................................................................................................................................................................................................
At 31 December 2005 702 — 702.........................................................................................................................................................................................................................................................................................................................................................................................
Accumulated amortisation
At 1 January 2004 and 31 December 2004 — — —.........................................................................................................................................................................................................................................................................................................................................................................................
Net book amount
At 31 December 2005 702 — 702
At 31 December 2004 1,556 (164,596 ) (163,040)
The goodwill/negative goodwill as set out above was arisen from acquisitions of associates which were completed in December
2004 and accordingly no amortisation was recognised for the year ended 31 December 2004. In accordance with HKFRS 3, with
effect from 1 January 2005, the Group is required to cease amortisation of goodwill/negative goodwill (note 2(b)(ix)).

135China COSCO Holdings Company Limited
ANNUAL REPORT 2005
12 Associates (Continued)
Notes: (Continued)
(b) Loans to associates are unsecured. Balance of RMB66,288,000 (2004: RMB41,120,000) bears interest at 2% (2004: 2%) per
annum above the 10-year Belgium prime rate and has no fixed terms of repayment. The remaining balance of RMB48,002,000
(2004: RMBNil) bears interest at Tokyo Inter-Bank Offered Rate per annum (2004: N/A) and is wholly repayable in April 2008.
(c) The Company has no directly owned associates as at 31 December 2005 and 2004. Details of principal associates as at 31
December 2005 are shown in note 41(c) to the Consolidated Financial Statements.
(d) The financial information below, after making adjustments to conform to the Group’s significant accounting policies, represents the
Group’s interests in respective associates:
Profits less
Total Total Minority losses after
assets liabilities interests Turnover income tax
RMB$’000 RMB$’000 RMB$’000 RMB$’000 RMB$’000
2005
Liu Chong Hing Bank Limited 10,559,034 (9,187,527) — 407,939 82,120.........................................................................................................................................................................................................................................................................................................................................................................................
China International Marine Containers
(Group) Co., Ltd. (“CIMC”) 2,762,421 (1,056,494) (145,611) 5,021,326 455,645.........................................................................................................................................................................................................................................................................................................................................................................................
Others 1,845,611 (823,872) — 280,228 124,153.........................................................................................................................................................................................................................................................................................................................................................................................
15,167,066 (11,067,893) (145,611) 5,709,493 661,918
2004
Liu Chong Hing Bank Limited 9,008,422 (7,661,009) — 268,109 80,949.........................................................................................................................................................................................................................................................................................................................................................................................
CIMC 2,757,027 (1,397,571) (139,426) N/A N/A.........................................................................................................................................................................................................................................................................................................................................................................................
Others 940,559 (98,377) — 327,066 195,664.........................................................................................................................................................................................................................................................................................................................................................................................
12,706,008 (9,156,957) (139,426) 595,175 276,613

136
Notes to the Consolidated Financial Statements
China COSCO Holdings Company LimitedANNUAL REPORT 2005
13 Available-for-sale financial assetsGroup
2005
RMB’000
At 1 January 2005 2,549,449.........................................................................................................................................................................................................................................................................................................................................................................................
Exchange differences (56,884).........................................................................................................................................................................................................................................................................................................................................................................................
Additions 278,971.........................................................................................................................................................................................................................................................................................................................................................................................
Disposals (642,824).........................................................................................................................................................................................................................................................................................................................................................................................
Reclassification to associates (20,000).........................................................................................................................................................................................................................................................................................................................................................................................
Net revaluation surplus recognised in equity 124,330.........................................................................................................................................................................................................................................................................................................................................................................................
At 31 December 2005 2,233,042
Available-for-sale financial assets included the following:
Listed securities in Hong Kong (note b) 89,353.........................................................................................................................................................................................................................................................................................................................................................................................
Unlisted investments (note c) 2,143,689.........................................................................................................................................................................................................................................................................................................................................................................................
2,233,042
Notes:
(a) Available-for-sale financial assets as at 31 December 2005 comprise investments in equity securities of the investee companies andthe shareholders’ loans advanced to an investee company (with the nominal value of RMB402,994,000). The loans advanced to aninvestee company are unsecured, interest free and have no fixed terms of repayment.
(b) Listed securities represents equity interest in an entity which is principally engaged in the operation and management of internationaland domestic container marine transportation.
(c) Unlisted investments mainly comprise equity interests in entities which are engaged in container terminal operations in Yantian,Tianjin and Dalian of China mainland.
14 Investment securitiesGroup
2004
RMB’000
Equity securities, at cost (note a)
- listed investments in Hong Kong 108,231.........................................................................................................................................................................................................................................................................................................................................................................................
- unlisted investments 192,898.........................................................................................................................................................................................................................................................................................................................................................................................
- unlisted investments in fellow subsidiaries 22,100.........................................................................................................................................................................................................................................................................................................................................................................................
Loans to an investee company (note b) 287,692.........................................................................................................................................................................................................................................................................................................................................................................................
Provision (864).........................................................................................................................................................................................................................................................................................................................................................................................
610,057
Market value of listed shares 105,821
Notes:
(a) All the listed and unlisted investment securities and loans to an investee company have been redesignated as available-for-salefinancial assets upon the adoption of HKASs 32 and 39 (note 2(b)(vi)).
(b) Loans to an investee company were unsecured and had no fixed terms of repayment. Except for an amount of RMB103,018,000which bore interest at Hong Kong dollar prime rate per annum, the remaining balance was interest free.

137China COSCO Holdings Company Limited
ANNUAL REPORT 2005
15 Finance lease receivables
Present
value of
minimum
Unearned lease
Gross finance payment
Group receivables income receivable
RMB’000 RMB’000 RMB’000
As at 31 December 2005
Not later than one year 13,752 (3,397) 10,355.........................................................................................................................................................................................................................................................................................................................................................................................
Later than one year and not later than five years 33,790 (5,585) 28,205.........................................................................................................................................................................................................................................................................................................................................................................................
Later than five years 2,076 (40) 2,036.........................................................................................................................................................................................................................................................................................................................................................................................
49,618 (9,022) 40,596.........................................................................................................................................................................................................................................................................................................................................................................................
Less: Amount included under current assets (13,752) 3,397 (10,355).........................................................................................................................................................................................................................................................................................................................................................................................
35,866 (5,625) 30,241
As at 31 December 2004
Not later than one year 14,923 (4,158) 10,765.........................................................................................................................................................................................................................................................................................................................................................................................
Later than one year and not later than five years 38,952 (8,372) 30,580.........................................................................................................................................................................................................................................................................................................................................................................................
Later than five years 8,484 (546) 7,938.........................................................................................................................................................................................................................................................................................................................................................................................
62,359 (13,076) 49,283.........................................................................................................................................................................................................................................................................................................................................................................................
Less: Amount included under current assets (14,923) 4,158 (10,765).........................................................................................................................................................................................................................................................................................................................................................................................
47,436 (8,918) 38,518
As at 31 December 2005, the Group entered into 19 (2004: 20) finance leases contracts for leasing of certain containers.
The average term of the finance lease contracts is 3 years (2004: 4 years).
The cost of assets acquired for the purpose of leasing under finance leases amounted to RMB65,990,000 (2004:
RMB64,966,000) as at 31 December 2005.
Unguaranteed residual values of assets leased under finance lease contracts are estimated at approximately RMB73,000
(2004: RMB74,000).

138
Notes to the Consolidated Financial Statements
China COSCO Holdings Company LimitedANNUAL REPORT 2005
16 Deferred income tax
Deferred income tax is calculated in full on temporary differences under the liability method using taxation rates ranging
from 15% to 44% for the year (2004: 15% to 44%).
The movement on the net deferred tax liabilities is as follows:
Group
2005 2004
RMB’000 RMB’000
At 1 January (765,205) (226,701).........................................................................................................................................................................................................................................................................................................................................................................................
Exchange differences 12,732 (98).........................................................................................................................................................................................................................................................................................................................................................................................
Credited/(charged) to consolidated income statement (note 31) 107,500 (117,319).........................................................................................................................................................................................................................................................................................................................................................................................
Charged to equity (note 33) — (421,087).........................................................................................................................................................................................................................................................................................................................................................................................
At 31 December (644,973) (765,205)
Deferred income tax assets are recognised for tax losses carry forwards to the extent that realisation of the related tax
benefit through the future taxable profits is probable. As at 31 December 2005, the Group has unrecognised tax losses of
RMB75,417,000 (2004: RMB35,404,000) to carry forward, among which, the tax loss of RMB3,306,000 will expire at the
end of year 2006, RMB580,000 will expire at the end of year 2007 and RMB1,355,000 will expire at the end of year 2008.
As at 31 December 2005, deferred tax liabilities of RMB919,200,000 (2004: RMB205,719,000) have not been established
for the tax liabilities that would be payable on the repatriation of undistributed profits of certain subsidiaries primarily
operating in the United States of America and the PRC totalling RMB4,521,800,000 (2004: RMB697,701,000) as the
Directors consider that the timing of the reversal of the related temporary differences can be controlled and such temporary
differences will not be reversed in the foreseeable future.
The Company did not recognise any deferred income tax for the period ended 31 December 2005 and as at 31 December
2005 as the temporary difference is insignificant to the Company.

139China COSCO Holdings Company Limited
ANNUAL REPORT 2005
16 Deferred income tax (Continued)
The movement in deferred tax assets and liabilities (prior to offsetting of balances within the same taxation jurisdiction)
during the year is as follows:
Group
Deferred income tax liabilities
Accelerated Undistributed
tax Accrued profits of
depreciation revenues subsidiaries Others Total
RMB’000 RMB’000 RMB’000 RMB’000 RMB’000
At 1 January 2004 (754,073) (81,852) — (935) (836,860).........................................................................................................................................................................................................................................................................................................................................................................................
Exchange differences 2 — — — 2.........................................................................................................................................................................................................................................................................................................................................................................................
Charged to consolidated income statement (441,032) (28,742) — — (469,774).........................................................................................................................................................................................................................................................................................................................................................................................
At 31 December 2004 and 1 January 2005 (1,195,103) (110,594) — (935) (1,306,632).........................................................................................................................................................................................................................................................................................................................................................................................
Exchange differences 25,843 — — — 25,843.........................................................................................................................................................................................................................................................................................................................................................................................
(Charged)/credited to
consolidated income statement 161,708 90,608 (176,000) 616 76,932.........................................................................................................................................................................................................................................................................................................................................................................................
At 31 December 2005 (1,007,552) (19,986) (176,000) (319) (1,203,857)
Group
Deferred income tax assets
Tax losses Others Total
RMB’000 RMB’000 RMB’000
At 1 January 2004 545,926 64,233 610,159.........................................................................................................................................................................................................................................................................................................................................................................................
Exchange differences — (100) (100).........................................................................................................................................................................................................................................................................................................................................................................................
Credited to consolidated income statement 327,647 24,808 352,455.........................................................................................................................................................................................................................................................................................................................................................................................
Charged to equity (note 33) (421,087) — (421,087).........................................................................................................................................................................................................................................................................................................................................................................................
At 31 December 2004 and 1 January 2005 452,486 88,941 541,427.........................................................................................................................................................................................................................................................................................................................................................................................
Exchange differences (10,681) (2,430) (13,111).........................................................................................................................................................................................................................................................................................................................................................................................
Charged/(credited) to consolidated income statement (42,710) 73,278 30,568.........................................................................................................................................................................................................................................................................................................................................................................................
At 31 December 2005 399,095 159,789 558,884

140
Notes to the Consolidated Financial Statements
China COSCO Holdings Company LimitedANNUAL REPORT 2005
16 Deferred income tax (Continued)
Deferred income tax assets and liabilities are offset when there is a legally enforceable right to set off current tax assets
against current tax liabilities and when the deferred income taxes relate to the same fiscal authority. The following amounts,
determined after appropriate offsetting, are shown in the consolidated balance sheet:
Group
2005 2004
RMB’000 RMB’000
Deferred income tax assets 63,733 39,593.........................................................................................................................................................................................................................................................................................................................................................................................
Deferred income tax liabilities (708,706) (804,798).........................................................................................................................................................................................................................................................................................................................................................................................
(644,973) (765,205)
The amount shown in the consolidated balance sheet
include the following:.........................................................................................................................................................................................................................................................................................................................................................................................
Deferred income tax assets to be recovered after more than 12 months 63,733 39,444.........................................................................................................................................................................................................................................................................................................................................................................................
Deferred income tax liabilities to be settled after more than 12 months (701,006) (653,388)
17 Derivative financial assets/liabilities
Group
2005 2005
Assets Liabilities
RMB’000 RMB’000
Interest rate swaps
- cash flow hedges (note a) 5,853 —.........................................................................................................................................................................................................................................................................................................................................................................................
- fair value hedges (note b) — 16,199.........................................................................................................................................................................................................................................................................................................................................................................................
Total 5,853 16,199
Notes:
(a) The notional principal amounts of the related interest rate swap contracts amounted to US$100,000,000 (equivalent to
approximately RMB807,020,000) (2004: US$100,000,000 (equivalent to approximately RMB827,700,000)) which were committed
with the fixed interest rates ranging from 3.88% to 4.90% (2004: 3.88% to 4.90%) per annum. These interest rate swap contracts
do not qualify for hedge accounting.
(b) The notional principal amount of the related interest rate swap contracts amounted to US$200,000,000 (equivalent to approximately
RMB1,614,040,000) (2004: US$200,000,000 (equivalent to approximately RMB1,655,400,000)) which were committed with the
interest rates ranging from 1.05% to 1.16% (2004: 1.05% to 1.16%) per annum above the London Interbank Offered Rate
(“LIBOR”). These interest rate swap contracts have been designated as a hedge of the fair value of the notes issued by a subsidiary
of Group upon their hedging relationship was fully designated and documented during the year (note 23(d)).
(c) As at 31 December 2005, there were notional amounts of outstanding bunker forward agreements of US$24,864,000 (equivalent to
approximately RMB200,656,000) (2004: US$23,766,000 (equivalent to approximately RMB196,713,000)) entered into by the
Group. The fair value of the outstanding bunker forward agreements has not been recognised in the Group’s financial statements as
at 31 December 2005 as the amount is not significant to the Group.

141China COSCO Holdings Company Limited
ANNUAL REPORT 2005
18 Deposits and cash and cash equivalents
Group Company
2005 2004 2005
RMB’000 RMB’000 RMB’000
Non-current portion
Restricted bank deposits (note a) 207,711 93,509 —.........................................................................................................................................................................................................................................................................................................................................................................................
Current portion
Pledged bank deposits (note b) — 346 —.........................................................................................................................................................................................................................................................................................................................................................................................
Cash and cash equivalents
Money market fund investments (note c) 64,562 — —.........................................................................................................................................................................................................................................................................................................................................................................................
Deposits placed with COSCO Finance Co., Ltd
(“COSCO Finance”) (note d) 54,441 71,214 —.........................................................................................................................................................................................................................................................................................................................................................................................
Bank balances and cash - unpledged 8,028,372 4,823,318 2,262,888.........................................................................................................................................................................................................................................................................................................................................................................................
8,147,375 4,894,532 2,262,888.........................................................................................................................................................................................................................................................................................................................................................................................
Total deposits and cash and cash equivalents (note e) 8,355,086 4,988,387 2,262,888
Notes:
(a) Restricted bank deposits are deposits held as security for repayment of bank loans of the Group and are restricted for the purpose
of the related banking facilities (note 23(i)).
(b) Pledged bank deposits are funds deposited in retention accounts for bank loan repayment or required to be utilised for specific
purposes.
(c) Money market fund investments are highly liquid investments with original maturities within 3 months.
(d) Deposits placed with COSCO Finance, an associate/a fellow subsidiary, bear interest at prevailing market rates.
(e) As at 31 December 2005, exchange controls apply to certain bank balances and cash, which are held by certain subsidiaries of the
Group with bank accounts operating in the PRC, amounted to RMB1,599,478,000 (2004: RMB1,215,179,000).
The carrying amounts of deposits and cash and cash equivalents are denominated in the following currencies:
Group Company
2005 2004 2005
RMB’000 RMB’000 RMB’000
US dollar 3,145,126 2,882,058 117,161.........................................................................................................................................................................................................................................................................................................................................................................................
RMB 1,252,274 805,404 139,762.........................................................................................................................................................................................................................................................................................................................................................................................
HK dollar 2,225,455 277,750 2,005,965.........................................................................................................................................................................................................................................................................................................................................................................................
EURO dollar 570,062 286,813 —.........................................................................................................................................................................................................................................................................................................................................................................................
Other currencies 1,162,169 736,362 —.........................................................................................................................................................................................................................................................................................................................................................................................
8,355,086 4,988,387 2,262,888
(f) The effective interest rates on short-term bank deposits as at 31 December 2005 were in the range of 0.60% to 5.44% per annum
(2004: 0.18% to 5.50% per annum); these deposits have an average maturity of 65 days (2004: 73 days). The bank balances earn
interests at floating rates based on daily bank deposit rates.

142
Notes to the Consolidated Financial Statements
China COSCO Holdings Company LimitedANNUAL REPORT 2005
19 Inventories
Group
2005 2004
RMB’000 RMB’000
Bunker 499,343 288,322.........................................................................................................................................................................................................................................................................................................................................................................................
Resaleable containers and others 37,553 30,087.........................................................................................................................................................................................................................................................................................................................................................................................
536,896 318,409
20 Trade and other receivables
Group Company
2005 2004 2005
RMB’000 RMB’000 RMB’000
Trade receivables (note a)
- third parties 2,697,957 2,052,671 —.........................................................................................................................................................................................................................................................................................................................................................................................
- subsidiaries of COSCO 617,251 648,191 —.........................................................................................................................................................................................................................................................................................................................................................................................
- jointly controlled entities 325,891 173,386 —.........................................................................................................................................................................................................................................................................................................................................................................................
- related companies 8,970 262,896 —.........................................................................................................................................................................................................................................................................................................................................................................................
3,650,069 3,137,144 —.........................................................................................................................................................................................................................................................................................................................................................................................
Bills receivables (note a) 53,219 40,566 —.........................................................................................................................................................................................................................................................................................................................................................................................
3,703,288 3,177,710 —.........................................................................................................................................................................................................................................................................................................................................................................................
Prepayments, deposits and other receivables 443,909 521,875 3,618.........................................................................................................................................................................................................................................................................................................................................................................................
Due from related parties (note c).........................................................................................................................................................................................................................................................................................................................................................................................
- COSCO 16,467 2,032,583 —.........................................................................................................................................................................................................................................................................................................................................................................................
- subsidiaries of COSCO 59,544 182,334 313,775.........................................................................................................................................................................................................................................................................................................................................................................................
- jointly controlled entities 58,666 73,690 37,640.........................................................................................................................................................................................................................................................................................................................................................................................
- associates 566 — —.........................................................................................................................................................................................................................................................................................................................................................................................
- related companies 95,189 115,971 —.........................................................................................................................................................................................................................................................................................................................................................................................
230,432 2,404,578 351,415.........................................................................................................................................................................................................................................................................................................................................................................................
4,377,629 6,104,163 355,033

143China COSCO Holdings Company Limited
ANNUAL REPORT 2005
20 Trade and other receivables (Continued)
Notes:
(a) The normal credit period granted to the customers is generally in the range of 25 to 90 days. At 31 December 2005, the aging
analysis of trade and bills receivables is as follows:
2005 2004
RMB’000 RMB’000
1-3 months 3,489,622 2,841,880.........................................................................................................................................................................................................................................................................................................................................................................................
4-6 months 154,958 200,503.........................................................................................................................................................................................................................................................................................................................................................................................
7-12 months 63,671 113,611.........................................................................................................................................................................................................................................................................................................................................................................................
1-2 years 22,609 44,781.........................................................................................................................................................................................................................................................................................................................................................................................
2-3 years 2,545 34,787.........................................................................................................................................................................................................................................................................................................................................................................................
3,733,405 3,235,562.........................................................................................................................................................................................................................................................................................................................................................................................
Provision for impairment (30,117) (57,852).........................................................................................................................................................................................................................................................................................................................................................................................
3,703,288 3,177,710
(b) The carrying amounts of trade and bills receivables are denominated in the following currencies:
2005 2004
RMB’000 RMB’000
US dollar 2,336,540 1,837,914.........................................................................................................................................................................................................................................................................................................................................................................................
RMB 562,727 791,443.........................................................................................................................................................................................................................................................................................................................................................................................
EURO dollar 419,142 282,577.........................................................................................................................................................................................................................................................................................................................................................................................
Other currencies 384,879 265,776.........................................................................................................................................................................................................................................................................................................................................................................................
3,703,288 3,177,710
(c) The amounts due from related parties are unsecured and interest free.
(d) The carrying amounts of trade and other receivables approximate their fair values.

144
Notes to the Consolidated Financial Statements
China COSCO Holdings Company LimitedANNUAL REPORT 2005
21 Share capital and equity linked benefits
(a) Share capital
Number of Nominal
shares Value
(thousands) RMB’000
Registered, issued and fully paid.........................................................................................................................................................................................................................................................................................................................................................................................
Domestic Shares of RMB1.00 each 3,896,000 3,896,000.........................................................................................................................................................................................................................................................................................................................................................................................
H shares of RMB1.00 each 2,244,000 2,244,000.........................................................................................................................................................................................................................................................................................................................................................................................
As at 31 December 2005 6,140,000 6,140,000
A summary of the movements in the Company’s issued share capital for the period from 3 March 2005 (date of
incorporation of the Company) to 31 December 2005 was as follows:
Domestic
Shares H shares Total
RMB’000 RMB’000 RMB’000
Incorporation on 3 March 2005 (note i) 4,100,000 — 4,100,000.........................................................................................................................................................................................................................................................................................................................................................................................
Domestic Shares converted into H shares (note ii) (204,000) 204,000 —.........................................................................................................................................................................................................................................................................................................................................................................................
Issue of new shares upon listing (note ii) — 2,040,000 2,040,000.........................................................................................................................................................................................................................................................................................................................................................................................
At 31 December 2005 3,896,000 2,244,000 6,140,000
Notes:
(i) The Company was incorporated on 3 March 2005, with an initial registered share capital of RMB4,100,000,000, divided into
4,100,000,000 shares with a nominal value of RMB1.00 each. 4,100,000,000 shares with a nominal value of RMB1.00 each
were issued to COSCO, all of which were credited as fully paid, in consideration for the transfer of the Relevant Companies to
the Company pursuant to the Reorganisation as referred to in note 1 to the Consolidated Financial Statements.
The Domestic Shares rank pari passu, in all material respects, with the H shares. Nonetheless, the transfer of Domestic
Shares (including Domestic Shares held by the Directors, the supervisors and the staff of the Company, if any) is subject to
certain restrictions imposed by the PRC law from time to time.
(ii) The Company’s H shares were listed on the Main Board on 30 June 2005 and 2,244,000,000 H shares, consisting of
2,040,000,000 new shares and 204,000,000 shares converted from Domestic Shares, with a nominal value of RMB1.00
each were issued to the public by way of international offering and public offer at HK$ 4.25 (equivalent to approximately
RMB4.53) each.
The Company raised net proceeds of approximately RMB8,817,797,000 from the issuing of 2,040,000,000 new shares, of
which paid-up share capital was approximately RMB2,040,000,000 and share premium was approximately
RMB6,777,797,000.
The net proceeds from the sales of 204,000,000 H shares converted from Domestic Shares were approximately
RMB880,541,000, after deducting the relevant portion of share issuing expenses of approximately RMB42,727,000. The
National Social Security Fund is entitled to the net proceeds in connection with the sales of these shares. The net proceeds
were paid to the National Social Security Fund during the year.
(iii) The comparative of share capital shown in the consolidated balance sheet represents 4,100,000,000 shares with a nominal
value of RMB1.00 each in the share capital of the Company prior to the share conversion and the issue of new issue upon
listing.
145China COSCO Holdings Company Limited
ANNUAL REPORT 2005
21 Share capital and equity linked benefits (Continued)
(b) Share appreciation rights
The Group has adopted a cash-settled, share-based payment scheme (the “Plan”) which was approved in the
shareholders’ meeting held on 9 June 2005. The Plan provides for the grant of share appreciation rights (“SARs”) to
eligible participants, including the Directors (excluding independent non-executive Directors), supervisors, company
secretary, senior management of the Company and COSCON Group and other grantees as approved by the
Company’s board of directors (collectively “the Grantees”). The Plan will remain in force unless otherwise cancelled or
amended.
Under the Plan, the holders of SARs are entitled the rights to receive an amount in respect of the appreciation in
market value of the Company’s H shares from the date of grant of SARs and the date of exercise. No shares will be
issued under the Plan and therefore the Company’s equity interests will not be diluted as a result of the issuance of
SARs. The maximum number of unexercised SARs permitted to be granted under the Plan is, upon their exercise,
limited to 10% of the Company’s H shares in issue at any time during each year. The maximum number of SARs
granted to any eligible participant (including share appreciation rights granted prior to this Plan) is limited to 25% of
the total number of SARs in issue at any time. Any further grant of SARs in excess of the above limits is subject to the
approval of the Company’s board of directors.
The exercise period of all SARs commences after a vesting period and ends on a date which is not later than 10
years from the date of grant of the SARs. As of each of the last day of the third, fourth, fifth and sixth anniversary of
the date of grant, the total number of SARs exercisable will not exceed 25%, 50%, 75% and 100%, respectively, of
the total SARs granted to the respective eligible participants.
Movements in the number of SARs granted by the Company during the year ended 31 December 2005, for which
the grant was approved by the Company’s board of directors on 16 December 2005, are set out below.
For the year ended 31 December 2005
Number of units of SARs
Granted Exercised Lapsed Outstanding at
Exercise during during during 31 December
Category Note price the year the year the year 2005
Directors (i) HK$3.195 6,000,000 — — 6,000,000.........................................................................................................................................................................................................................................................................................................................................................................................
Supervisors (i) HK$3.195 1,400,000 — — 1,400,000.........................................................................................................................................................................................................................................................................................................................................................................................
Other continuous
contract employees (i) HK$3.195 12,525,000 — — 12,525,000.........................................................................................................................................................................................................................................................................................................................................................................................
Others (i), (ii) HK$3.195 2,225,000 — — 2,225,000.........................................................................................................................................................................................................................................................................................................................................................................................
22,150,000 — — 22,150,000

146
Notes to the Consolidated Financial Statements
China COSCO Holdings Company LimitedANNUAL REPORT 2005
21 Share capital and equity linked benefits (Continued)
(b) Share appreciation rights (Continued)
Notes:
(i) The SARs were granted by the Company on 16 December 2005 and are exercisable between 16 December 2007 to 15
December 2015.
(ii) The SARs were granted to other grantees as approved by the Company’s board of directors (including certain employees of
COSCO) during the year and are classified in the category of “Others”.
The fair value of SARs at the date of grant as determined using the Black-Scholes valuation model was HK$1.9454 per unit. The
significant inputs into the model were share price of HK$ 3.425, exercise price, expected life of SARs of 10 years, expected
dividend rate, and risk-free interest rate of 5.24%. The expected volatility is estimated based on historical daily share price of the
Company for the year. The intrinsic value of SARs as at 31 December 2005 is HK$0.225 per unit.
The fair value of SARS has not been recognised in the Group’s financial statements for the year ended 31 December 2005 as the
amount is insignificant to the Group.
(c) Share options of a subsidiary
The Group’s subsidiary, COSCO Pacific, operates share option schemes whereby options may be granted to eligible
employees and directors or any participants (as defined in the relevant share option schemes) of the Group, to
subscribe for its shares.
Movements of the share options granted by COSCO Pacific during the year ended 31 December 2005 and 2004 are
set out below:
For the year ended 31 December 2005
Number of share options
Outstanding Reclassified Outstanding
at Granted Exercised Lapsed (to)/ at
Exercise 1 January during during during from other 31 December
Category Note price 2005 the year the year the year category 2005
HK$ (note (vi))
Directors (iv) 9.54 6,700,000 — (3,400,000) — — 3,300,000.........................................................................................................................................................................................................................................................................................................................................................................................
(v) 13.75 9,000,000 — — — — 9,000,000.........................................................................................................................................................................................................................................................................................................................................................................................
Supervisor (iv) 9.54 800,000 — (400,000) — — 400,000.........................................................................................................................................................................................................................................................................................................................................................................................
(v) 13.75 1,000,000 — — — — 1,000,000.........................................................................................................................................................................................................................................................................................................................................................................................
Other continuous
contract employees (iii) 8.80 2,702,000 — (1,548,000) — — 1,154,000.........................................................................................................................................................................................................................................................................................................................................................................................
(iv) 9.54 11,670,000 — (3,682,000) — — 7,988,000.........................................................................................................................................................................................................................................................................................................................................................................................
(v) 13.75 43,990,000 — (4,846,000) — (1,000,000) 38,144,000.........................................................................................................................................................................................................................................................................................................................................................................................
Others (iv) 9.54 1,320,000 — (410,000) — — 910,000.........................................................................................................................................................................................................................................................................................................................................................................................
(v) 13.75 9,750,000 — (1,050,000) — 1,000,000 9,700,000.........................................................................................................................................................................................................................................................................................................................................................................................
86,932,000 — (15,336,000) — — 71,596,000

147China COSCO Holdings Company Limited
ANNUAL REPORT 2005
21 Share capital and equity linked benefits (Continued)
(c) Share options of a subsidiary (Continued)
For the year ended 31 December 2004
Number of share options
Outstanding Outstanding
at Granted Exercised Lapsed at
Exercise 1 January during during during 31 December
Category Note price 2004 the year the year the year 2004
HK$
Directors (iv) 9.54 7,600,000 — (900,000 ) — 6,700,000.........................................................................................................................................................................................................................................................................................................................................................................................
(v) 13.75 — 9,000,000 — — 9,000,000.........................................................................................................................................................................................................................................................................................................................................................................................
Supervisor (iv) 9.54 800,000 — — — 800,000.........................................................................................................................................................................................................................................................................................................................................................................................
(v) 13.75 — 1,000,000 — — 1,000,000.........................................................................................................................................................................................................................................................................................................................................................................................
Other continuous
contract employees (ii) 5.53 1,580,000 — (1,580,000 ) — —.........................................................................................................................................................................................................................................................................................................................................................................................
(iii) 8.80 10,600,000 — (7,898,000 ) — 2,702,000.........................................................................................................................................................................................................................................................................................................................................................................................
(iv) 9.54 31,240,000 — (19,550,000 ) (20,000 ) 11,670,000.........................................................................................................................................................................................................................................................................................................................................................................................
(v) 13.75 — 43,990,000 — — 43,990,000.........................................................................................................................................................................................................................................................................................................................................................................................
Others (iv) 9.54 6,180,000 — (4,860,000 ) — 1,320,000.........................................................................................................................................................................................................................................................................................................................................................................................
(v) 13.75 — 10,050,000 (300,000 ) — 9,750,000.........................................................................................................................................................................................................................................................................................................................................................................................
58,000,000 64,040,000 (35,088,000 ) (20,000 ) 86,932,000
Notes:
(i) All the outstanding options were vested and exercisable as at 31 December 2005 and 2004. The Group has no legal or
constructive obligation to repurchase or settle the options in cash. As all grants of share options were vested on or before 1
January 2005 and accordingly, no adjustment is made in the Group’s financial statements pursuant to the transitional
provisions as set out in HKFRS 2.
(ii) The share options were granted on 1 July 1996 under the COSCO Pacific’s 1994 share option scheme and are exercisable
on or before 30 June 2006, subject to the following conditions:
Percentage of the total number of
options granted to each grantee which
can be exercised (including the options Price level per share at which
which have already been exercised) the options can be exercised #
20% of the options HK$6.50 or above
40% of the options HK$7.00 or above
60% of the options HK$7.50 or above
80% of the options HK$8.00 or above
100% or the options HK$8.50 or above
# The price level refers to the closing price of COSCO Pacific’s shares on The Stock Exchange of Hong Kong Limited at
the date prior to the exercise of the options.

148
Notes to the Consolidated Financial Statements
China COSCO Holdings Company LimitedANNUAL REPORT 2005
21 Share capital and equity linked benefits (Continued)
(c) Share options of a subsidiary (Continued)
(iii) The share options were granted on 20 May 1997 (the “Offer Date”) under the COSCO Pacific's 1994 share option scheme
and are exercisable on or before 19 May 2007, subject to the following conditions:
1 For those grantees who have completed one year full-time service in the Group may exercise a maximum of 20% of
share options granted in each of the first five anniversary years from the Offer Date.
2 For those grantees who have not completed one year full-time service in the Group as at the Offer Date, a maximum of
20% of options granted may be exercisable in each of the first five anniversary years of the Offer Date after completion
of one year full-time service.
For those share options granted on 20 May 1997 under the COSCO Pacific's 1994 share option scheme, all grantees may
reserve their rights to exercise and accumulate their share options exercisable during their employment within the COSCO
Pacific group.
(iv) The share options were granted during the period from 28 October 2003 to 6 November 2003 under the COSCO Pacific's
2003 share option scheme at an exercise price of HK$9.54. The options are exercisable at any time within ten years from the
date on which an offer is accepted or deemed to be accepted by the grantee under the COSCO Pacific's 2003 share option
scheme from 28 October 2003 to 6 November 2003.
Following the resignation of an employee, 20,000 share options were lapsed during the year ended 31 December 2004.
(v) The share options were granted during the period from 25 November 2004 to 16 December 2004 under the COSCO
Pacific's 2003 share option scheme at an exercise price of HK$13.75. The options are exercisable at any time within ten
years from the date on which an offer is accepted or deemed to be accepted by the grantee under the COSCO Pacific's
2003 share option scheme from 25 November 2004 to 16 December 2004.
(vi) Certain share options were granted to the directors or senior management of COSCO and fellow subsidiaries which are
disclosed in the category of “Others”. A director of a subsidiary was resigned in 2005. The options granted to him were re-
classified from the category of “Other continuous contract employees” to “Others” during the year.
(vii) The exercise of the 15,336,000 (2004: 35,088,000) share options during the year yielded the proceeds, net of transaction
costs, of RMB179,901,000 (2004: RMB343,628,000).
(viii) Movements in the number of share options outstanding and their related weighted average exercise prices are as follows:
2005 2004
Average Average
exercise Number of exercise Number of
price per share price per share
share options share options
HK$ HK$
At 1 January 12.60 86,932,000 9.30 58,000,000.........................................................................................................................................................................................................................................................................................................................................................................................
Granted N/A — 13.75 64,040,000.........................................................................................................................................................................................................................................................................................................................................................................................
Exercised 11.08 (15,336,000) 9.23 (35,088,000).........................................................................................................................................................................................................................................................................................................................................................................................
Lapsed N/A — 9.54 (20,000).........................................................................................................................................................................................................................................................................................................................................................................................
At 31 December 71,596,000 86,932,000
The weighted average closing price of the COSCO Pacific’s shares on the dates when the share options were exercised was
HK$15.73 (2004: HK$13.35) per share.

149China COSCO Holdings Company Limited
ANNUAL REPORT 2005
22 Reserves
Group
(Accumulated
Statutory losses)/
Capital reserve Exchange retained
reserve funds reserve profits Total
RMB’000 RMB’000 RMB’000 RMB’000 RMB’000
As at 1 January 2004 (64,095) 147,993 17,253 (2,254,883) (2,153,732).........................................................................................................................................................................................................................................................................................................................................................................................
Profit for the year — — — 4,157,960 4,157,960.........................................................................................................................................................................................................................................................................................................................................................................................
Exchange differences — — 8,414 — 8,414.........................................................................................................................................................................................................................................................................................................................................................................................
Share of reserves of jointly
controlled entities and associates — (596) — — (596).........................................................................................................................................................................................................................................................................................................................................................................................
Release of reserves upon deemed disposals (9,072) (613) 464 — (9,221).........................................................................................................................................................................................................................................................................................................................................................................................
Transfer of reserves — 59,485 — (59,485) —.........................................................................................................................................................................................................................................................................................................................................................................................
Distributions (note 33).........................................................................................................................................................................................................................................................................................................................................................................................
- distribution of reserves — — — (1,148,081) (1,148,081).........................................................................................................................................................................................................................................................................................................................................................................................
- transfer of COSCO Pacific — — — (1,248,130) (1,248,130).........................................................................................................................................................................................................................................................................................................................................................................................
- deferred income tax — — — (421,087) (421,087).........................................................................................................................................................................................................................................................................................................................................................................................
- dividends paid to then shareholders — — — (389,304) (389,304).........................................................................................................................................................................................................................................................................................................................................................................................
- disposal/transfer of other subsidiaries — — — (86,036) (86,036).........................................................................................................................................................................................................................................................................................................................................................................................
- others — — — (19,062) (19,062).........................................................................................................................................................................................................................................................................................................................................................................................
Contributions (note e).........................................................................................................................................................................................................................................................................................................................................................................................
- capital injection to a subsidiary 3,000,000 — — — 3,000,000.........................................................................................................................................................................................................................................................................................................................................................................................
- waiver of payable balances
from related parties — — — 229,694 229,694.........................................................................................................................................................................................................................................................................................................................................................................................
- transfer of investments to
then shareholders — — — 1,428,385 1,428,385.........................................................................................................................................................................................................................................................................................................................................................................................
As at 31 December 2004 2,926,833 206,269 26,131 189,971 3,349,204

150
Notes to the Consolidated Financial Statements
China COSCO Holdings Company LimitedANNUAL REPORT 2005
22 Reserves (Continued)
Group
(AccumulatedSpecial Statutory Investment losses)/
Capital reserve reserve revaluation Exchange retainedreserve (Note d) funds reserve reserve profits Total
RMB’000 RMB’000 RMB’000 RMB’000 RMB’000 RMB’000 RMB’000
As at 1 January 2005, as previously reported 2,926,833 — 206,269 — 26,131 189,971 3,349,204.........................................................................................................................................................................................................................................................................................................................................................................................
Opening adjustments for the adoption ofHKFRS 3, HKASs 32, 39 and 39 (Amendment)in respect of:- Redesignation of investment securities as available-for-sale financial assets — — — 1,016,182 — — 1,016,182
.........................................................................................................................................................................................................................................................................................................................................................................................
- Recognition of unamortised transaction costs on bank borrowings and notes — — — — — 68,633 68,633
.........................................................................................................................................................................................................................................................................................................................................................................................
- Recognition of interest rate swap contracts as derivative financial instruments — — — — — 7,021 7,021
.........................................................................................................................................................................................................................................................................................................................................................................................
- Derecognition of negative goodwill — — — — — 86,243 86,243.........................................................................................................................................................................................................................................................................................................................................................................................
- Share of opening adjustments of jointly controlled entities and associates 3,161 — 11,545 14,524 — (3,566 ) 25,664.........................................................................................................................................................................................................................................................................................................................................................................................
As at 1 January 2005, as restated 2,929,994 — 217,814 1,030,706 26,131 348,302 4,552,947.........................................................................................................................................................................................................................................................................................................................................................................................
Capital reduction of a subsidiary (3,720,000 ) — — — — 3,720,000 —.........................................................................................................................................................................................................................................................................................................................................................................................
Capitalisation upon reorganisationof the Company (note a) 2,248,316 279,422 (217,814 ) — (26,131 ) (2,283,793 ) —
.........................................................................................................................................................................................................................................................................................................................................................................................
Share premium arising from issuance ofnew H shares 7,192,683 — — — — — 7,192,683
.........................................................................................................................................................................................................................................................................................................................................................................................
Share issue expenses (414,886 ) — — — — — (414,886 ).........................................................................................................................................................................................................................................................................................................................................................................................
Profit for the year — — — — — 5,450,805 5,450,805.........................................................................................................................................................................................................................................................................................................................................................................................
Release of reserves upon.........................................................................................................................................................................................................................................................................................................................................................................................
- disposal of an available-for-sale financial asset — — — (261,381 ) — — (261,381 ).........................................................................................................................................................................................................................................................................................................................................................................................
- deemed disposals (4,796 ) — — (5,639 ) — — (10,435 ).........................................................................................................................................................................................................................................................................................................................................................................................
- disposal of a jointly controlled entity (279 ) — — — — — (279 ).........................................................................................................................................................................................................................................................................................................................................................................................
Fair value gain on available-for-sale financial assets — — — 64,689 — — 64,689.........................................................................................................................................................................................................................................................................................................................................................................................
Share of reserves of a jointly controlled entity andassociates 9,208 — — — — — 9,208
.........................................................................................................................................................................................................................................................................................................................................................................................
Exchange differences — — — — (393,559 ) — (393,559 ).........................................................................................................................................................................................................................................................................................................................................................................................
Transfer of reserves (note b) — — 1,081,763 — — (1,081,763 ) —.........................................................................................................................................................................................................................................................................................................................................................................................
Distributions (note 33).........................................................................................................................................................................................................................................................................................................................................................................................
- distributions to COSCO — — — — — (3,788,566 ) (3,788,566 ).........................................................................................................................................................................................................................................................................................................................................................................................
- transfer of other subsidiaries — — — — — (94,568 ) (94,568 ).........................................................................................................................................................................................................................................................................................................................................................................................
- others — — — — — (10,306 ) (10,306 ).........................................................................................................................................................................................................................................................................................................................................................................................
As at 31 December 2005 8,240,240 279,422 1,081,763 828,375 (393,559 ) 2,260,111 12,296,352
Representing:Reserves 8,240,240 279,422 1,081,763 828,375 (393,559 ) 1,461,911 11,498,152.........................................................................................................................................................................................................................................................................................................................................................................................
2005 final dividend proposed — — — — — 798,200 798,200.........................................................................................................................................................................................................................................................................................................................................................................................
As at 31 December 2005 8,240,240 279,422 1,081,763 828,375 (393,559 ) 2,260,111 12,296,352

151China COSCO Holdings Company Limited
ANNUAL REPORT 2005
22 Reserves (Continued)
Company
Special Statutory
Capital reserve reserve Accumulated Exchange
reserve (note d) funds loss reserve Total
RMB’000 RMB’000 RMB’000 RMB’000 RMB’000 RMB’000
Capitalisation upon incorporation of
the Company (note a) 2,489,016 279,422 — — — 2,768,438.........................................................................................................................................................................................................................................................................................................................................................................................
Loss for the period from
3 March 2005 to
31 December 2005 (note 32) — — — (75,297) — (75,297).........................................................................................................................................................................................................................................................................................................................................................................................
Share premium arising from
issuance of new H shares 7,192,683 — — — — 7,192,683.........................................................................................................................................................................................................................................................................................................................................................................................
Share issue expenses (414,886) — — — — (414,886).........................................................................................................................................................................................................................................................................................................................................................................................
Distribution (note 33 (b)) — — — (967,926) — (967,926).........................................................................................................................................................................................................................................................................................................................................................................................
Exchange difference (note f) — — — — (185,476) (185,476).........................................................................................................................................................................................................................................................................................................................................................................................
Transfer to statutory reserve funds
(note b) — — 1,081,763 (1,081,763) — —.........................................................................................................................................................................................................................................................................................................................................................................................
At 31 December 2005 9,266,813 279,422 1,081,763 (2,124,986) (185,476) 8,317,536
Representing:
Reserves 9,266,813 279,422 1,081,763 (2,923,186) (185,476) 7,519,336.........................................................................................................................................................................................................................................................................................................................................................................................
2005 final dividend proposed — — — 798,200 — 798,200.........................................................................................................................................................................................................................................................................................................................................................................................
At 31 December 2005 9,266,813 279,422 1,081,763 (2,124,986) (185,476) 8,317,536
Notes:
(a) As described in note 2(a) to the Consolidated Financial Statements, the financial statements of the Group for the years ended 31
December 2005 and 2004 have been prepared on the basis of merger accounting as if the Company had been the holding
company of those companies comprising the Group throughout the two years ended 31 December 2004 and 2005, or since the
respective dates of incorporation/establishment or from the effective dates of acquisition/up to the effective dates of disposal,
whichever is a shorter period. Upon the incorporation of the Company on 3 March 2005, the net value of the interests in COSCON
and COSCO Pacific Investments transferred to the Company from COSCO was converted into the Company’s share capital of
RMB4,100,000,000 of RMB1.00 each with the then existing reserves eliminated (save for investment revaluation reserve) and the
resulting difference dealt with in the capital reserve, special reserve (note 22(d)) and retained profits.

152
Notes to the Consolidated Financial Statements
China COSCO Holdings Company LimitedANNUAL REPORT 2005
22 Reserves (Continued)
(b) Statutory reserve funds
In accordance with the PRC Company Law and the Company’s articles of association, the Company is required to allocate 10% of
its profit after tax as determined in accordance with the relevant accounting principles and financial regulations applicable to PRC
companies (“PRC GAAP”) and regulations applicable to the Company, to the statutory surplus reserve until such reserve reaches
50% of the registered capital of the Company. The appropriation to the reserve must be made before any distribution of dividends to
equity holders. The statutory surplus reserve can be used to offset previous year’s losses, if any, and part of the statutory surplus
reserve can be capitalised as the Company’s share capital provided that the amount of such reserve remaining after the
capitalisation shall not be less than 25% of the share capital of the Company.
In accordance with the PRC Company Law, the Company is required to appropriate 5% to 10% of its profit after tax, as determined
in accordance with PRC GAAP and regulations applicable to the Company, to its statutory public welfare fund for capital
expenditure on staff welfare facilities, the ownership in respect of which belongs to the Group. The statutory public welfare fund is
not available for distribution to equity holders except under liquidation. The appropriation to this fund must be made before any
distribution of dividends to equity holders.
On 9 June 2005, the equity holders of the Company approved the appropriations of RMB173,023,000 to each of the statutory
surplus reserve, statutory public welfare fund and discretionary surplus reserve. Each appropriation represents 10% of the
Company’s profit after tax for the period from 4 March 2005 to 30 June 2005 as determined in accordance with PRC GAAP.
For the year ended 31 December 2005, further appropriations of RMB281,347,000 to each of the statutory surplus reserve and
statutory public welfare fund. Each appropriation represents 10% of the Company’s profit after tax for the period from 1 July 2005 to
31 December 2005, as determined in accordance with PRC GAAP. An appropriation of 10% to the discretionary surplus reserve is
proposed and is subject to the equity holders’ approval at the forthcoming annual general meeting. This proposed appropriation to
the discretionary surplus fund is not reflected in the financial statements until it has been approved at the annual general meeting,
and will be reflected as an appropriation of retained profits for the year ending 31 December 2006.
(c) In accordance with the articles of association of the Company, the net profit after tax of the Company for the purpose of dividend
payments is based on the lesser of (i) the net profit determined in accordance with the PRC GAAP; and (ii) the net profit determined
in accordance with HKFRSs.
On this basis, as at 31 December 2005, amount of retained profits available for distribution (after initial and special distributions to
COSCO on profits relating to periods prior to listing totalled RMB3,788,566,000 (note 33) and the appropriation of reserves (note
22(b)) was approximately RMB1,724,455,000, being the amount determined in accordance with the PRC GAAP.
(d) The Company has obtained from the Ministry of Finance an approval pursuant to which the Company is permitted to retain as a
special reserve, the benefit of which is solely attributable to COSCO, an amount representing the profit of COSCO Pacific
attributable to the Group for the period from 30 June 2004 to 3 March 2005 (being the date of incorporation of the Company) less
dividends payable by COSCO Pacific to the Group in respect of that period. At 31 December 2005, specific reserve amounted to
RMB279,422,000 (note 33(a)).
With regard to such special reserve, pursuant to the reorganisation agreement dated 9 June 2005 entered into between the
Company and COSCO, the Company has agreed with COSCO that it will, at a time it considers appropriate and, in any event,
within three years from the Listing Date, convert such special reserve into domestic shares to be held by COSCO at HK$4.25 per
share, subject to obtaining prior approval from the State-owned Assets Supervision and Administration Commission of the State
Council for such conversion.

153China COSCO Holdings Company Limited
ANNUAL REPORT 2005
22 Reserves (Continued)
(e) Contributions during 2004 represented the following:
2004
RMB’000
Capital injection in cash to a subsidiary 3,000,000.........................................................................................................................................................................................................................................................................................................................................................................................
Waiver of payable balances
- from COSCO 161,539.........................................................................................................................................................................................................................................................................................................................................................................................
- from subsidiaries of COSCO 68,155.........................................................................................................................................................................................................................................................................................................................................................................................
229,694.........................................................................................................................................................................................................................................................................................................................................................................................
Gain on disposal of investments * 1,428,385.........................................................................................................................................................................................................................................................................................................................................................................................
4,658,079
* This represented the gain on disposal of investments by COSCO Investments (note 1(b)).
(f) The Company’s functional currency is US dollar which is different from its presentation currency. Assets and liabilities are translated
at closing rate and income and expenses are translated using the exchange rates prevailing at the dates of the transactions, any
differences are dealt with in the exchange reserve of the Company.
23 Long-term borrowings
Group
2005 2004
RMB’000 RMB’000
Bank loans
- secured (note i) 10,570,648 11,452,327.........................................................................................................................................................................................................................................................................................................................................................................................
- unsecured 1,588,449 1,455,676.........................................................................................................................................................................................................................................................................................................................................................................................
Secured other loans (note i) 61,027 332,861.........................................................................................................................................................................................................................................................................................................................................................................................
Finance lease obligations (note c) — 118,796.........................................................................................................................................................................................................................................................................................................................................................................................
Notes (note d) 2,346,242 2,469,882.........................................................................................................................................................................................................................................................................................................................................................................................
14,566,366 15,829,542.........................................................................................................................................................................................................................................................................................................................................................................................
Current portion of long-term borrowings (2,196,863) (3,580,099).........................................................................................................................................................................................................................................................................................................................................................................................
12,369,503 12,249,443

154
Notes to the Consolidated Financial Statements
China COSCO Holdings Company LimitedANNUAL REPORT 2005
23 Long-term borrowings (Continued)
(a) The long-term borrowings are analysed as follows:
Group2005 2004
RMB’000 RMB’000
Wholly repayable within five years
- bank loans 7,920,595 7,356,254.........................................................................................................................................................................................................................................................................................................................................................................................
- other loans 61,027 84,569
7,981,622 7,440,823.........................................................................................................................................................................................................................................................................................................................................................................................
Not wholly repayable within five years
- bank loans 4,238,502 5,551,749.........................................................................................................................................................................................................................................................................................................................................................................................
- other loan — 248,292.........................................................................................................................................................................................................................................................................................................................................................................................
- finance lease obligations — 118,796.........................................................................................................................................................................................................................................................................................................................................................................................
- notes 2,346,242 2,469,882.........................................................................................................................................................................................................................................................................................................................................................................................
6,584,744 8,388,719
14,566,366 15,829,542

155China COSCO Holdings Company Limited
ANNUAL REPORT 2005
23 Long-term borrowings (Continued)
(b) The Group’s long-term borrowings were repayable as follows:
Group2005 2004
RMB’000 RMB’000
Bank loans
- within one year 2,173,798 3,529,319.........................................................................................................................................................................................................................................................................................................................................................................................
- in the second year 2,222,049 1,528,475.........................................................................................................................................................................................................................................................................................................................................................................................
- in the third to fifth years 5,346,415 4,851,235.........................................................................................................................................................................................................................................................................................................................................................................................
- over five years 2,416,835 2,998,974.........................................................................................................................................................................................................................................................................................................................................................................................
12,159,097 12,908,003.........................................................................................................................................................................................................................................................................................................................................................................................
Other loans
- within one year 23,065 41,649.........................................................................................................................................................................................................................................................................................................................................................................................
- in the second year 24,840 44,319.........................................................................................................................................................................................................................................................................................................................................................................................
- in the third to fifth years 13,122 107,439.........................................................................................................................................................................................................................................................................................................................................................................................
- over five years — 139,454.........................................................................................................................................................................................................................................................................................................................................................................................
61,027 332,861.........................................................................................................................................................................................................................................................................................................................................................................................
Finance lease obligations
- within one year — 9,131.........................................................................................................................................................................................................................................................................................................................................................................................
- in the second year — 9,131.........................................................................................................................................................................................................................................................................................................................................................................................
- in the third to fifth years — 35,874.........................................................................................................................................................................................................................................................................................................................................................................................
- over five years — 64,660.........................................................................................................................................................................................................................................................................................................................................................................................
— 118,796.........................................................................................................................................................................................................................................................................................................................................................................................
Notes
- over five years 2,346,242 2,469,882.........................................................................................................................................................................................................................................................................................................................................................................................
14,566,366 15,829,542
156
Notes to the Consolidated Financial Statements
China COSCO Holdings Company LimitedANNUAL REPORT 2005
23 Long-term borrowings (Continued)
(c) The minimum lease payments under finance leases are summarised as follows:
2005 2004
RMB’000 RMB’000
The minimum lease payments
- within one year — 14,754.........................................................................................................................................................................................................................................................................................................................................................................................
- in the second year — 14,754.........................................................................................................................................................................................................................................................................................................................................................................................
- in the third to fifth years — 44,259.........................................................................................................................................................................................................................................................................................................................................................................................
- over five years — 73,134.........................................................................................................................................................................................................................................................................................................................................................................................
— 146,901.........................................................................................................................................................................................................................................................................................................................................................................................
Future finance charges on finance leases — (28,105).........................................................................................................................................................................................................................................................................................................................................................................................
Present value of finance lease obligations — 118,796
(d) Details of the notes as at 31 December 2005 are as follows:
2005 2004
RMB’000 RMB’000
Principal amount 2,421,060 2,483,100.........................................................................................................................................................................................................................................................................................................................................................................................
Discount on issue (15,325) (15,718).........................................................................................................................................................................................................................................................................................................................................................................................
Notes issuance cost (14,526) —.........................................................................................................................................................................................................................................................................................................................................................................................
Proceeds received 2,391,209 2,467,382.........................................................................................................................................................................................................................................................................................................................................................................................
Accumulated amortised amounts of
- discount on issue 4,269 2,500.........................................................................................................................................................................................................................................................................................................................................................................................
- notes issuance cost 4,043 —.........................................................................................................................................................................................................................................................................................................................................................................................
Effect of fair value hedge (53,279) —.........................................................................................................................................................................................................................................................................................................................................................................................
2,346,242 2,469,882
Notes with principal amount of US$300,000,000 (equivalent to approximately RMB2,421,060,000) were issued by a
subsidiary of COSCO Pacific to investors on 3 October 2003. The notes carried an interest yield of 5.96% per annum
and were issued at a price of 99.367 per cent of their principal amount with a coupon rate of 5.875% per annum. The
notes bear interest from 3 October 2003, payable semi-annually in arrear on 3 April and 3 October of each year,
commencing on 3 April 2004. The notes are guaranteed unconditionally and irrevocably by COSCO Pacific and listed
on the Singapore Exchange Securities Trading Limited.
Unless previously redeemed or repurchased by COSCO Pacific, the notes will mature on 3rd October 2013 at their
principal amount. The notes are subject to redemption in whole, at their principal amount, together with accrued
interest, at the option of COSCO Pacific at any time in the event of certain changes affecting the taxes of certain
jurisdictions.

157China COSCO Holdings Company Limited
ANNUAL REPORT 2005
23 Long-term borrowings (Continued)
(e) The exposure of the Group’s long-term borrowings to interest rate changes and the contractual repricing dates are as
follows:
6 months 6 to 12 1 to 5 Over
or less months years 5 years Total
RMB’000 RMB’000 RMB’000 RMB’000 RMB’000
At 31 December 2005
Total borrowings 430,773 1,766,090 7,606,426 4,763,077 14,566,366.........................................................................................................................................................................................................................................................................................................................................................................................
Effect of interest rate swaps — — — (1,614,040) (1,614,040).........................................................................................................................................................................................................................................................................................................................................................................................
430,773 1,766,090 7,606,426 3,149,037 12,952,326
At 31 December 2004
Total borrowings 160,100 3,419,999 6,576,473 5,672,970 15,829,542.........................................................................................................................................................................................................................................................................................................................................................................................
Effect of interest rate swaps — — — (1,655,400) (1,655,400).........................................................................................................................................................................................................................................................................................................................................................................................
160,100 3,419,999 6,576,473 4,017,570 14,174,142
(f) The carrying amounts of the long-term borrowings are denominated in the following currencies:
2005 2004
RMB’000 RMB’000
US dollar 14,543,374 15,822,341.........................................................................................................................................................................................................................................................................................................................................................................................
RMB 22,992 7,201.........................................................................................................................................................................................................................................................................................................................................................................................
14,566,366 15,829,542
(g) The carrying amounts and fair value of the long-term borrowings are as follows:
Carrying amounts Fair values
2005 2004 2005 2004
RMB’000 RMB’000 RMB’000 RMB’000
Bank loans 12,159,097 12,908,003 12,090,767 12,862,173.........................................................................................................................................................................................................................................................................................................................................................................................
Other loans 61,027 332,861 60,010 331,702.........................................................................................................................................................................................................................................................................................................................................................................................
Finance lease obligations — 118,796 — 118,796.........................................................................................................................................................................................................................................................................................................................................................................................
Notes 2,346,242 2,469,882 2,514,012 2,457,350.........................................................................................................................................................................................................................................................................................................................................................................................
14,566,366 15,829,542 14,664,789 15,770,021
The fair values are based on cash flows discounted using a weighted average borrowing rate of 5.20% (2004: 4.90%)
per annum.

158
Notes to the Consolidated Financial Statements
China COSCO Holdings Company LimitedANNUAL REPORT 2005
23 Long-term borrowings (Continued)
(h) The effective interest rates per annum at the balance sheet date were as follows:
2005 2004
US$ RMB US$ RMB
Bank loans 2.80% to 5.83% 4.70% 2.40% to 3.91% 4.40%.........................................................................................................................................................................................................................................................................................................................................................................................
Other loans 6.80% — 6.80% —.........................................................................................................................................................................................................................................................................................................................................................................................
Notes 6.00% — 6.00% —
(i) The secured bank and other loans are secured, inter alia, by one or more of the following:
(i) First legal mortgage over certain container vessels, containers and land use rights.
(ii) Assignment of the charter, rental income and earnings, requisition compensation, insurance and container lease
agreements relating to certain container vessels and containers.
(iii) Shares and bank deposits of certain subsidiaries.
(iv) Assignment of refund guarantee and shipbuilding contracts relating to certain container vessels.
(v) Corporate guarantees provided by COSCO and a fellow subsidiary as set out below:
2005 2004
RMB’000 RMB’000
COSCO — 3,972,720......................................................................................................................................................................................................................................................................................................................................................................
Fellow subsidiary — 307,365......................................................................................................................................................................................................................................................................................................................................................................
— 4,280,085
24 Amount due to COSCO
The balance as at 31 December 2004 was unsecured, financing in nature and was repaid prior to the listing of the
Company’s shares.
25 Other non-current liabilities
2005 2004
RMB’000 RMB’000
Provision for one-off housing subsidies (note a) 66,583 79,485.........................................................................................................................................................................................................................................................................................................................................................................................
Early retirement benefit obligations (note a) 9,854 15,769.........................................................................................................................................................................................................................................................................................................................................................................................
Retirement benefit obligations (note b) 51,225 10,627.........................................................................................................................................................................................................................................................................................................................................................................................
127,662 105,881

159China COSCO Holdings Company Limited
ANNUAL REPORT 2005
25 Other non-current liabilities (Continued)
Notes:
(a) Movements for the year are as below:
Provision for one-off Early retirement
housing subsidies benefit obligations
2005 2004 2005 2004
RMB’000 RMB’000 RMB’000 RMB’000
At 1 January 79,485 79,485 15,769 15,769.........................................................................................................................................................................................................................................................................................................................................................................................
Reversal of over provision (9,037) — — —.........................................................................................................................................................................................................................................................................................................................................................................................
Payments during the year (3,865) — (5,915) —.........................................................................................................................................................................................................................................................................................................................................................................................
At 31 December 66,583 79,485 9,854 15,769
In 2000, the State Council issued a circular stating that one-off cash housing subsidies should be made to those eligible employees
who have not been allocated with staff quarters at all or who have not been allocated with quarters up to the prescribed standards
before 31 December 1998 when the staff quarter allocation schemes were terminated. The subsidies are determined based on staff
member’s years of service, position and other criteria. In addition, monthly cash housing allowances should be made to other
employees following the withdrawal of allocation of staff quarters. The specific timetable and procedures of implementation of these
policies are to be determined by individual provincial or municipal governments based on the particular situation of the province or
municipality.
The Group has provided for the one-off cash housing subsidies based on the relevant detailed local government regulations when
they are promulgated, or the available information and the best estimate of the management when the local regulations have not
been promulgated. The subsidies were charged to the consolidated income statement in 2000 when the State Council Circular in
respect of cash subsidies was issued and that the payment of which is determined to be probable and the amounts can be
reasonable estimated.
(b) Retirement benefit obligations
Group
2005 2004
RMB’000 RMB’000
Balance sheet obligations for:
Defined benefits (note (i)) 16,975 10,627.........................................................................................................................................................................................................................................................................................................................................................................................
Post-employment medical benefits (note (ii)) 34,250 —.........................................................................................................................................................................................................................................................................................................................................................................................
51,225 10,627
Expensed in income statement for (note 35):
Defined benefits (note (i)) 9,056 11,350.........................................................................................................................................................................................................................................................................................................................................................................................
Post-employment medical benefits (note (ii)) 34,825 —.........................................................................................................................................................................................................................................................................................................................................................................................
43,881 11,350
Notes:
(i) Defined benefits
There is a retirement benefit plan operating as defined benefit plan in a subsidiary of the Group in United States of America.
The assets of the funded plans are held independently of the subsidiary’s assets in separate trustee administered funds. The
plans are valued by a qualified actuary, Summit Financial Corporation, annually using the projected unit credit method.

160
Notes to the Consolidated Financial Statements
China COSCO Holdings Company LimitedANNUAL REPORT 2005
25 Other non-current liabilities (Continued)
(i) Defined benefits (Continued)
The amounts recognised in the balance sheet are determined as follows:
2005 2004
RMB’000 RMB’000
Present value of funded obligations 40,422 30,918......................................................................................................................................................................................................................................................................................................................................................................
Fair value of plan assets (11,471) (9,055)......................................................................................................................................................................................................................................................................................................................................................................
28,951 21,863......................................................................................................................................................................................................................................................................................................................................................................
Unrecognised actuarial losses (7,740) (5,118)......................................................................................................................................................................................................................................................................................................................................................................
Unrecognised past service cost (4,236) (6,118)......................................................................................................................................................................................................................................................................................................................................................................
Liability on the balance sheet 16,975 10,627
Fair value of the plan assets are analysed as follows:
2005 2004
percentage percentage
Equity instruments 61% 63%......................................................................................................................................................................................................................................................................................................................................................................
Debt instruments 20% 19%......................................................................................................................................................................................................................................................................................................................................................................
Other assets 19% 18%......................................................................................................................................................................................................................................................................................................................................................................
100% 100%
The amounts recognised in the income statement are as follows:
2005 2004
RMB’000 RMB’000
Current service cost 2,749 2,620......................................................................................................................................................................................................................................................................................................................................................................
Interest cost 1,937 1,485......................................................................................................................................................................................................................................................................................................................................................................
Expected return on plan assets (807) (578)......................................................................................................................................................................................................................................................................................................................................................................
Net actuarial losses recognised during the year 94 32......................................................................................................................................................................................................................................................................................................................................................................
Past service cost 5,083 7,791......................................................................................................................................................................................................................................................................................................................................................................
Total expense, included in staff costs 9,056 11,350
The expenses were included in selling, administrative and general expenses.
The actual return on plan assets was RMB713,000 (2004: RMB546,000).
The movement in the liability recognised in the balance sheet is as follows:
2005 2004
RMB’000 RMB’000
At 1 January 10,627 2,289......................................................................................................................................................................................................................................................................................................................................................................
Exchange differences (264) —......................................................................................................................................................................................................................................................................................................................................................................
Total expense, included in staff costs as shown above 9,056 11,350......................................................................................................................................................................................................................................................................................................................................................................
Contributions paid (2,444) (3,012)......................................................................................................................................................................................................................................................................................................................................................................
At 31 December 16,975 10,627

161China COSCO Holdings Company Limited
ANNUAL REPORT 2005
25 Other non-current liabilities (Continued)
(i) Defined benefits (Continued)
The principal actuarial assumptions used were as follows:
2005 2004
Discount rate 5.50% 5.75%......................................................................................................................................................................................................................................................................................................................................................................
Expected return on plan assets 8.00% 8.00%
(ii) Post-employment medical benefits
There is a post-employment medical benefit plans in the United States of America. The method of accounting, assumptions
and the frequency of valuations are similar to those used for defined benefit plans.
The main actuarial assumption is a long-term increase in health costs of 10% in 2006 and increase grading down to 5% in
2016 and after.
The amounts recognised in the balance sheet were determined as follows:
2005
RMB’000
Present value of funded obligations 63,209......................................................................................................................................................................................................................................................................................................................................................................
Fair value of plan assets (624)......................................................................................................................................................................................................................................................................................................................................................................
62,585......................................................................................................................................................................................................................................................................................................................................................................
Unrecognised actuarial losses (2,427)......................................................................................................................................................................................................................................................................................................................................................................
Unrecognised past service cost (25,908)......................................................................................................................................................................................................................................................................................................................................................................
Liability in the balance sheet 34,250
Fair value of the plan assets are analysed as follows:
2005 2004
percentage percentage
Equity instruments 61% —......................................................................................................................................................................................................................................................................................................................................................................
Debt instruments 17% —......................................................................................................................................................................................................................................................................................................................................................................
Other assets 22% —......................................................................................................................................................................................................................................................................................................................................................................
100% —
The amounts recognised in the income statement were as follows:
2005
RMB’000
Current service cost 5,915......................................................................................................................................................................................................................................................................................................................................................................
Interest cost 3,114......................................................................................................................................................................................................................................................................................................................................................................
Expected return on plan assets 49......................................................................................................................................................................................................................................................................................................................................................................
Net actuarial losses recognised during the year —......................................................................................................................................................................................................................................................................................................................................................................
Past service cost 25,747......................................................................................................................................................................................................................................................................................................................................................................
Total expense, included in staff costs 34,825
The expense was included in selling, administrative and general expenses.
The actual return on plan assets was RMB49,000 (2004: N/A).

162
Notes to the Consolidated Financial Statements
China COSCO Holdings Company LimitedANNUAL REPORT 2005
25 Other non-current liabilities (Continued)
(ii) Post-employment medical benefits (Continued)
Movement in the liability recognised in the balance sheet:
2005
RMB’000
At 1 January —......................................................................................................................................................................................................................................................................................................................................................................
Total expense, included in staff costs as shown above 34,825......................................................................................................................................................................................................................................................................................................................................................................
Contributions paid (575)......................................................................................................................................................................................................................................................................................................................................................................
At 31 December 34,250
26 Trade and other payablesGroup Company
2005 2004 2005
RMB’000 RMB’000 RMB’000
Trade payables (note a)
- third parties 1,219,930 1,659,317 —.........................................................................................................................................................................................................................................................................................................................................................................................
- subsidiaries of COSCO 335,209 182,927 —.........................................................................................................................................................................................................................................................................................................................................................................................
- jointly controlled entities 192,749 206,895 —.........................................................................................................................................................................................................................................................................................................................................................................................
- associates 137,129 — —.........................................................................................................................................................................................................................................................................................................................................................................................
- related companies 605,311 251,085 —.........................................................................................................................................................................................................................................................................................................................................................................................
2,490,328 2,300,224 —.........................................................................................................................................................................................................................................................................................................................................................................................
Other payables and accruals 2,955,952 3,386,524 24,805.........................................................................................................................................................................................................................................................................................................................................................................................
Distribution payable to COSCO (notes 33(a) and (b)) 1,794,022 — 967,926.........................................................................................................................................................................................................................................................................................................................................................................................Due to related parties (note c)
- COSCO 116,364 2,669,090 —.........................................................................................................................................................................................................................................................................................................................................................................................
- subsidiaries of COSCO 1,053 3,298,117 145,918.........................................................................................................................................................................................................................................................................................................................................................................................
- jointly controlled entities — 19,114 —.........................................................................................................................................................................................................................................................................................................................................................................................
117,417 5,986,321 145,918.........................................................................................................................................................................................................................................................................................................................................................................................
7,357,719 11,673,069 1,138,649
Notes:
(a) As at 31 December 2005, the aging analysis of trade payables of the Group is as follows:
2005 2004
RMB’000 RMB’000
1-6 months 2,305,917 2,096,012.........................................................................................................................................................................................................................................................................................................................................................................................
7-12 months 72,601 58,343.........................................................................................................................................................................................................................................................................................................................................................................................
1-2 years 81,188 50,224.........................................................................................................................................................................................................................................................................................................................................................................................
2-3 years 12,425 42,465.........................................................................................................................................................................................................................................................................................................................................................................................
Above 3 years 18,197 53,180.........................................................................................................................................................................................................................................................................................................................................................................................
2,490,328 2,300,224

163China COSCO Holdings Company Limited
ANNUAL REPORT 2005
26 Trade and other payables (Continued)
(b) The carrying amounts of trade payables are denominated in the following currencies:
2005 2004
RMB’000 RMB’000
US dollar 1,255,305 1,081,730.........................................................................................................................................................................................................................................................................................................................................................................................
RMB 712,722 702,637.........................................................................................................................................................................................................................................................................................................................................................................................
EURO dollar 165,401 177,876.........................................................................................................................................................................................................................................................................................................................................................................................
HK dollar 138,258 141,421.........................................................................................................................................................................................................................................................................................................................................................................................
Other currencies 218,642 196,560.........................................................................................................................................................................................................................................................................................................................................................................................
2,490,328 2,300,224
(c) The amounts due to related parties are unsecured and interest free.
(d) The carrying amounts of trade and other payables approximate their fair values.
27 Short-term loans
Group Company
2005 2004 2005
RMB’000 RMB’000 RMB’000
Bank loans
- secured (note a) — 372,443 —.........................................................................................................................................................................................................................................................................................................................................................................................
- unsecured 1,773,108 1,634,318 242,106.........................................................................................................................................................................................................................................................................................................................................................................................
1,773,108 2,006,761 242,106.........................................................................................................................................................................................................................................................................................................................................................................................
Unsecured loan from COSCO Finance (note b) 350,000 — —.........................................................................................................................................................................................................................................................................................................................................................................................
2,123,108 2,006,761 242,106
Notes:
(a) Bank loans as at 31 December 2004 were secured by trade receivables of a subsidiary amounting to RMB417,657,000.
(b) The loan from COSCO Finance, bore interest at 5.02% per annum as at 31 December 2005.
(c) The effective interest rates of short-term bank loans, as at 31 December 2005 were in the range of 4.70% to 5.58% (2004: 3.26%
to 5.31%) per annum .
164
Notes to the Consolidated Financial Statements
China COSCO Holdings Company LimitedANNUAL REPORT 2005
27 Short-term loans (Continued)
(d) The carrying amounts of short-term loans approximate their fair values. The carrying amounts of the short-term loans are
denominated in the following currencies:
Group Company
2005 2004 2005
RMB’000 RMB’000 RMB’000
US dollar 1,237,000 1,357,761 242,106.........................................................................................................................................................................................................................................................................................................................................................................................
RMB 886,108 649,000 —.........................................................................................................................................................................................................................................................................................................................................................................................
2,123,108 2,006,761 242,106
28 Other gains, net
2005 2004
RMB’000 RMB’000
Dividend income from listed and unlisted investments 145,149 181,523.........................................................................................................................................................................................................................................................................................................................................................................................
Interest income from
- deposits with COSCO Finance (note 18(d)) 1,057 7,815.........................................................................................................................................................................................................................................................................................................................................................................................
- loan to a jointly controlled entity (note 11(b)) 2,642 2,429.........................................................................................................................................................................................................................................................................................................................................................................................
- loans to associates (note 12(b)) 2,673 66.........................................................................................................................................................................................................................................................................................................................................................................................
- loan to an investee company (note 14(b)) — 5,422.........................................................................................................................................................................................................................................................................................................................................................................................
- third parties 166,905 31,508.........................................................................................................................................................................................................................................................................................................................................................................................
173,277 47,240.........................................................................................................................................................................................................................................................................................................................................................................................
Gain on interest rate swap contracts not qualifying as hedges 32,629 —.........................................................................................................................................................................................................................................................................................................................................................................................
Net gain on interest rate swap contracts — 31,742.........................................................................................................................................................................................................................................................................................................................................................................................
Exchange (loss)/gain, net (171,628) 26,405.........................................................................................................................................................................................................................................................................................................................................................................................
179,427 286,910

165China COSCO Holdings Company Limited
ANNUAL REPORT 2005
29 Operating profit
Operating profit is stated after crediting and charging the following:
2005 2004
RMB’000 RMB’000
Crediting:
Gain on disposal of jointly controlled entities and dissolution of an associate, net* 1,029 3,203.........................................................................................................................................................................................................................................................................................................................................................................................
Gain on partial disposal of an associate* 1,458 —.........................................................................................................................................................................................................................................................................................................................................................................................
Recovery of bad debts* 62,459 575.........................................................................................................................................................................................................................................................................................................................................................................................
Gain on disposal of property, plant and equipment* 25,324 77,162.........................................................................................................................................................................................................................................................................................................................................................................................
Gain on disposal of investment securities* — 93.........................................................................................................................................................................................................................................................................................................................................................................................
Government subsidy* (note a) 129,061 99,335.........................................................................................................................................................................................................................................................................................................................................................................................
Gain on deemed disposal of a subsidiary* 48,708 78,530.........................................................................................................................................................................................................................................................................................................................................................................................
Gain on disposal of an available-for-sale financial asset* (note b) 512,117 —.........................................................................................................................................................................................................................................................................................................................................................................................
Write-back of revaluation deficit of investment properties
previously recognised* (note 7) — 2,417.........................................................................................................................................................................................................................................................................................................................................................................................
Gross rental income from investment properties* 457 668
Charging:
Auditors’ remuneration 32,331 11,637.........................................................................................................................................................................................................................................................................................................................................................................................
Amortisation
- leasehold land and land use rights 1,916 4,303.........................................................................................................................................................................................................................................................................................................................................................................................
- intangible assets 74,175 69,319.........................................................................................................................................................................................................................................................................................................................................................................................
Cost of bunkers and fuel consumed 4,694,189 2,923,007.........................................................................................................................................................................................................................................................................................................................................................................................
Cost of resaleable containers sold# 155,026 263,743.........................................................................................................................................................................................................................................................................................................................................................................................
Depreciation
- owned property, plant and equipment leased out under operating leases 496,580 468,247.........................................................................................................................................................................................................................................................................................................................................................................................
- other owned property, plant and equipment 1,236,344 1,337,182.........................................................................................................................................................................................................................................................................................................................................................................................
- property, plant and equipment held under finance leases — 5,245.........................................................................................................................................................................................................................................................................................................................................................................................
- Investment properties 289 —.........................................................................................................................................................................................................................................................................................................................................................................................
Outgoings in respect of investment properties 33 41.........................................................................................................................................................................................................................................................................................................................................................................................
Operating lease rentals
- container vessels 1,845,413 1,163,570.........................................................................................................................................................................................................................................................................................................................................................................................
- containers 752,510 550,292.........................................................................................................................................................................................................................................................................................................................................................................................
- land and buildings 122,126 160,612.........................................................................................................................................................................................................................................................................................................................................................................................
- other property, plant and equipment 260,862 209,264.........................................................................................................................................................................................................................................................................................................................................................................................
Provision for impairment of trade receivables# 27,273 27,418.........................................................................................................................................................................................................................................................................................................................................................................................
Provision for resaleable containers# — 5,322.........................................................................................................................................................................................................................................................................................................................................................................................
Write-off of resaleable containers# — 2,045.........................................................................................................................................................................................................................................................................................................................................................................................
Loss on disposal/write-off of property, plant and equipment# 4,712 13,705
* Item included in other operating income
# Item included in other operating expenses
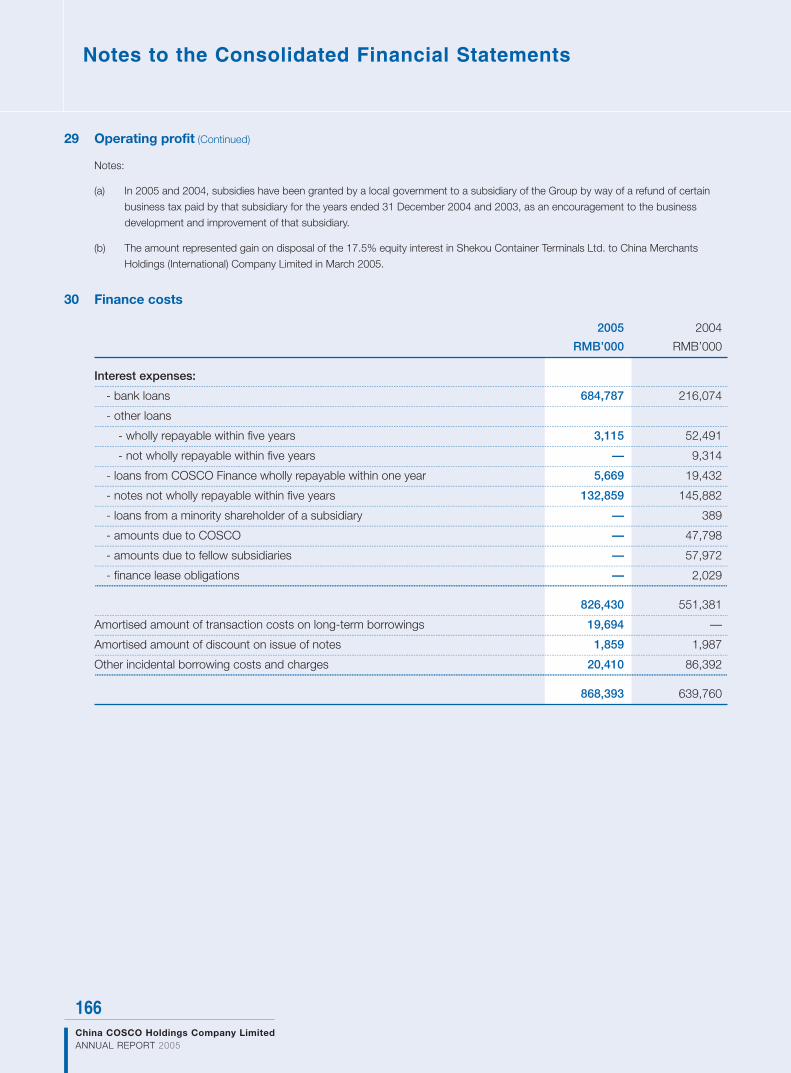
166
Notes to the Consolidated Financial Statements
China COSCO Holdings Company LimitedANNUAL REPORT 2005
29 Operating profit (Continued)
Notes:
(a) In 2005 and 2004, subsidies have been granted by a local government to a subsidiary of the Group by way of a refund of certain
business tax paid by that subsidiary for the years ended 31 December 2004 and 2003, as an encouragement to the business
development and improvement of that subsidiary.
(b) The amount represented gain on disposal of the 17.5% equity interest in Shekou Container Terminals Ltd. to China Merchants
Holdings (International) Company Limited in March 2005.
30 Finance costs
2005 2004
RMB’000 RMB’000
Interest expenses:.........................................................................................................................................................................................................................................................................................................................................................................................
- bank loans 684,787 216,074.........................................................................................................................................................................................................................................................................................................................................................................................
- other loans.........................................................................................................................................................................................................................................................................................................................................................................................
- wholly repayable within five years 3,115 52,491.........................................................................................................................................................................................................................................................................................................................................................................................
- not wholly repayable within five years — 9,314.........................................................................................................................................................................................................................................................................................................................................................................................
- loans from COSCO Finance wholly repayable within one year 5,669 19,432.........................................................................................................................................................................................................................................................................................................................................................................................
- notes not wholly repayable within five years 132,859 145,882.........................................................................................................................................................................................................................................................................................................................................................................................
- loans from a minority shareholder of a subsidiary — 389.........................................................................................................................................................................................................................................................................................................................................................................................
- amounts due to COSCO — 47,798.........................................................................................................................................................................................................................................................................................................................................................................................
- amounts due to fellow subsidiaries — 57,972.........................................................................................................................................................................................................................................................................................................................................................................................
- finance lease obligations — 2,029.........................................................................................................................................................................................................................................................................................................................................................................................
826,430 551,381.........................................................................................................................................................................................................................................................................................................................................................................................
Amortised amount of transaction costs on long-term borrowings 19,694 —.........................................................................................................................................................................................................................................................................................................................................................................................
Amortised amount of discount on issue of notes 1,859 1,987.........................................................................................................................................................................................................................................................................................................................................................................................
Other incidental borrowing costs and charges 20,410 86,392.........................................................................................................................................................................................................................................................................................................................................................................................
868,393 639,760

167China COSCO Holdings Company Limited
ANNUAL REPORT 2005
31 Income tax expenses
2005 2004
RMB’000 RMB’000
(Restated)
Current income tax
- PRC enterprise income tax (note a) 694,987 124,085.........................................................................................................................................................................................................................................................................................................................................................................................
- Hong Kong profits tax (note b) 5,440 10,462.........................................................................................................................................................................................................................................................................................................................................................................................
- Overseas taxation (note c) 59,829 34,272.........................................................................................................................................................................................................................................................................................................................................................................................
Over provision in prior years (1,437) (381).........................................................................................................................................................................................................................................................................................................................................................................................
758,819 168,438.........................................................................................................................................................................................................................................................................................................................................................................................
Deferred income tax (note 16) (107,500) 117,319.........................................................................................................................................................................................................................................................................................................................................................................................
651,319 285,757
The Group’s share of income tax expense of jointly controlled entities and associates for the year totalling RMB101,599,000
(2004: RMB124,093,000) and RMB31,833,000 (2004: RMB43,808,000) are included in the consolidated income
statement as share of profits of jointly controlled entities and associates respectively.
Notes:
(a) PRC enterprise income tax
The provision for enterprise income tax is based on the statutory rate of 33% on the taxable income of each of the PRC companies
of the Group as determined in accordance with the relevant PRC income tax rules and regulations for the year, except for certain
subsidiaries, which are taxed at reduced rates ranging from 15% to 27% based on different local preferential policies on income tax
and approval by relevant tax authorities.
The Group’s PRC sourced income from container leasing is currently exempt from income tax in the PRC in accordance with a
notice granting temporary exemption of income tax on rental payments made to foreign companies for leasing of containers which
are used in international transportation (Guo Shui Fa (1993) No. 49) issued by the State Administration of Taxation of the PRC on 12
March 1993.
(b) Hong Kong profits tax
Hong Kong profits tax has been provided at the rate of 17.5% (2004: 17.5%) on the estimated assessable profits for the year.
(c) Overseas taxation
Taxation on overseas profits has been calculated on the estimated assessable profits for the year at the rates of taxation prevailing in
the countries in which the Group operates. These rates range from 22% to 44% during the year (2004: 22% to 44%).

168
Notes to the Consolidated Financial Statements
China COSCO Holdings Company LimitedANNUAL REPORT 2005
31 Income tax expenses (Continued)
(d) The taxation on the Group’s profit before income tax differs from the theoretical amount that would arise using the tax rate of the
home country of the Company as follows:
2005 2004
RMB’000 RMB’000
(Restated)
Profit before income tax 7,450,250 5,243,300.........................................................................................................................................................................................................................................................................................................................................................................................
Less: Share of profits less losses of jointly controlled entities and associates (1,263,770) (837,344).........................................................................................................................................................................................................................................................................................................................................................................................
6,186,480 4,405,956
Calculated at a tax rate of 33% 2,041,538 1,453,965.........................................................................................................................................................................................................................................................................................................................................................................................
Effect of differential tax rates of other territories (339,972) (189,909).........................................................................................................................................................................................................................................................................................................................................................................................
Effect of preferential tax rate of domestic subsidiaries (13,702) (14,557).........................................................................................................................................................................................................................................................................................................................................................................................
Effect of unrecognised deferred tax liabilities on differential tax rate of domestic subsidiaries (492,144) —.........................................................................................................................................................................................................................................................................................................................................................................................
Income not subject to income tax (143,875) (59,643).........................................................................................................................................................................................................................................................................................................................................................................................
Expenses not deductible for taxation purposes 66,346 78,679.........................................................................................................................................................................................................................................................................................................................................................................................
Utilisation of previously unrecognised tax losses (2,665) (826,803).........................................................................................................................................................................................................................................................................................................................................................................................
Tax losses not recognised 13,519 1,244.........................................................................................................................................................................................................................................................................................................................................................................................
Effect of exchange losses directly recognised in equity (32,556) —.........................................................................................................................................................................................................................................................................................................................................................................................
Effect on deferred tax assets/liabilities due to the change in tax rates (175,572) —.........................................................................................................................................................................................................................................................................................................................................................................................
Recognition of previously unrecognised tax losses — (421,087).........................................................................................................................................................................................................................................................................................................................................................................................
Recognition of temporary differences previously not recognised (88,670) 262,539.........................................................................................................................................................................................................................................................................................................................................................................................
Reversal of deferred tax liabilities previously recognised (170,899) —.........................................................................................................................................................................................................................................................................................................................................................................................
Over provision in prior years (1,437) (381).........................................................................................................................................................................................................................................................................................................................................................................................
Others (8,592) 1,710.........................................................................................................................................................................................................................................................................................................................................................................................
Income tax expenses 651,319 285,757
(e) Business tax
Pursuant to various PRC business tax rules and regulations, the Group is required to pay business tax to relevant local tax bureaus
as below.
Revenues derived from container shipping for inbound shipment and freight forwarding and shipping agencies, and terminal
operations provided by the Group in the PRC are subject to business tax at rates ranging from 3% to 5% during the year. The
related business tax is included in the cost of services.
Certain subsidiaries are currently exempt from business tax on PRC sourced rental income earned from container leasing in
accordance with a notice granting exemption from business tax for foreign enterprises which have no establishment in the PRC
earning rental income from leasing of movable properties (Guo Shui Fa (1997) No. 35) issued by the State Administration of Taxation
of the PRC on 14 March 1997.

169China COSCO Holdings Company Limited
ANNUAL REPORT 2005
32 Profit attributable to equity holders of the Company
The profit attributable to equity holders of the Company include a loss of the Company to the extent of RMB75,297,000.
33 Distributions
2005 2004
RMB’000 RMB’000
Distributions to COSCO
- Initial, paid (note a) 1,994,544 —.........................................................................................................................................................................................................................................................................................................................................................................................
- Initial, payable (note a) 826,096 —.........................................................................................................................................................................................................................................................................................................................................................................................
- Special, payable (note b) 967,926 —.........................................................................................................................................................................................................................................................................................................................................................................................
3,788,566 —.........................................................................................................................................................................................................................................................................................................................................................................................
Transfer of other subsidiaries (note c) 94,568 67,743.........................................................................................................................................................................................................................................................................................................................................................................................
Transfer of COSCO Pacific (note 1(b)) — 1,248,130.........................................................................................................................................................................................................................................................................................................................................................................................
Distribution of reserves (note d) — 1,148,081.........................................................................................................................................................................................................................................................................................................................................................................................
Disposal of subsidiaries — 18,293.........................................................................................................................................................................................................................................................................................................................................................................................
Deferred income tax (note 16) — 421,087.........................................................................................................................................................................................................................................................................................................................................................................................
Dividends to then shareholders — 208,996.........................................................................................................................................................................................................................................................................................................................................................................................
Others 10,306 19,062.........................................................................................................................................................................................................................................................................................................................................................................................
3,893,440 3,131,392
Included in the consolidated statement of changes in equity:
2005 2004
RMB’000 RMB’000
Total distributions 3,893,440 3,131,392.........................................................................................................................................................................................................................................................................................................................................................................................
Add: final dividend to then shareholders proposed in the prior year — 180,308.........................................................................................................................................................................................................................................................................................................................................................................................
3,893,440 3,311,700
Notes:
(a) In accordance with the “Provisional Regulation Relating to Corporate Reorganisation of Enterprises and the Related Management of
State-owned Capital and Financial Treatment” notice issued by the Ministry of Finance (English translation is a direct translation of
Chinese title of the notice), which became effective from 27 August 2002, after the Company’s incorporation, the Company is
required to make a mandatory distribution to COSCO, in an amount equal to the combined net profit of the Group generated during
the period from 30 June 2004 to 3 March 2005 (being the date of incorporation of the Company) (the “Initial Profit Period”), as
determined based on audited financial statements prepared in accordance with the PRC GAAP, after giving effect to relevant
necessary adjustments.
The amounts distributable to COSCO in respect of the Initial Profit Period and the amounts retained as a special reserve as at 3
March 2005 were RMB2,820,640,000 and RMB279,422,000 (note 22(d)) respectively, as derived based on the audited financial
statements prepared in accordance with the PRC GAAP. The Company passed a shareholders’ resolution on 9 June 2005 to
approve an amount of RMB1,994,544,000 as part of initial distribution to COSCO, which was paid prior to the Listing Date. As at 31
December 2005, the distribution payable to COSCO in respect of the Initial Profit Period was RMB826,096,000, of which payment
will be made in 2006.

170
Notes to the Consolidated Financial Statements
China COSCO Holdings Company LimitedANNUAL REPORT 2005
33 Distributions (Continued)
(b) Pursuant to the resolution of the extraordinary shareholders’ meeting dated 9 June 2005, it was resolved to make a special
distribution by the Company to COSCO in an amount equal to the aggregate of the amounts of the distributable profit of the Group
(excluding COSCO Pacific) and dividend payable by COSCO Pacific to the Group, in respect of the period from 4 March 2005 to 29
June 2005 (the “Subsequent Profit Period”). The amounts to be distributable to COSCO for the Subsequent Profit Period is
determined based on audited consolidated income statement prepared in accordance with the PRC GAAP or with the HKFRSs,
whichever is lower. The amount distributable to COSCO for the Subsequent Profit Period was RMB967,926,000, as determined
based on the audited consolidated income statement prepared in accordance with the PRC GAAP.
(c) Pursuant to various agreements entered into between the Group and COSCO Group pursuant to the Reorganisation, COSCO
Group transferred equity interests in, and assets and liabilities of, certain overseas companies to the Group. The difference, being
the considerations paid over the net asset value of the companies transferred, was treated as a deemed distribution to COSCO
Group in the Group’s financial statements.
(d) This represented the distribution of reserves of certain overseas subsidiaries to their then shareholders pursuant to the directors’
resolutions of these companies dated 1 January 2004.
(e) Final dividend proposed
2005 2004
RMB’000 RMB’000
Final, proposed, of RMB0.13 per ordinary share (2004: N/A) 798,200 N/A
At the meeting held on 11 April 2006, the Directors proposed a final dividend of RMB0.13 per ordinary share for the year ended 31
December 2005. This proposed dividend is not reflected as a dividend payable in the financial statements, but will be reflected as an
appropriation of retained profits for the year ending 31 December 2006.

171China COSCO Holdings Company Limited
ANNUAL REPORT 2005
34 Earnings per share
Basic
Basic earnings per share is calculated by dividing the profit attributable to equity holders of the Company by the weighted
average number of ordinary shares in issue during the year.
The comparative basic earnings per share is calculated based on the profit attributable to the equity holders of the
Company and on the assumption that 4,100,000,000 domestic shares issued upon the incorporation of the Company in
connection with the Reorganisation which were deemed to have been in issue since 1 January 2004.
2005 2004
(Restated)
Profit attributable to equity holders of the Company RMB5,450,805,000 RMB4,157,960,000.........................................................................................................................................................................................................................................................................................................................................................................................
Weighted average number of ordinary shares in issue 5,133,972,603 4,100,000,000.........................................................................................................................................................................................................................................................................................................................................................................................
Basic earnings per share RMB1.06171 RMB1.01414
Diluted
Diluted earnings per share is calculated based on the profit attributable to equity holders of the Company and the weighted
average number of ordinary shares in issue during the year, after adjusting for the number of dilutive potential ordinary
shares deemed to be issued at no consideration on the assumption that the special reserve had been converted into
Domestic Shares at the offer price of HK$4.25 (note 22(d)).
2005
Profit attributable to equity holders of the Company RMB5,450,805,000.........................................................................................................................................................................................................................................................................................................................................................................................
Weighted average number of ordinary shares in issue 5,133,972,603.........................................................................................................................................................................................................................................................................................................................................................................................
Adjustments for assumed conversion of special reserve 31,292,600.........................................................................................................................................................................................................................................................................................................................................................................................
Weighted average number of ordinary shares for diluted earnings per share 5,165,265,203.........................................................................................................................................................................................................................................................................................................................................................................................
Diluted earnings per share RMB1.05528
As the Company had no diluted instruments for the year ended 31 December 2004, the diluted earnings per share was
equal to the basic earnings per share.

172
Notes to the Consolidated Financial Statements
China COSCO Holdings Company LimitedANNUAL REPORT 2005
35 Staff costs
An analysis of staff costs, including Directors’, supervisors’ and key management’s emoluments, is set out below:
2005 2004
RMB’000 RMB’000
Crew expenses 612,978 604,464.........................................................................................................................................................................................................................................................................................................................................................................................
Wages and salaries 1,467,148 1,180,015.........................................................................................................................................................................................................................................................................................................................................................................................
Housing benefits (note a) 46,472 19,809.........................................................................................................................................................................................................................................................................................................................................................................................
Retirement benefits costs
- defined benefit plans (note 25(b)) 43,881 11,350.........................................................................................................................................................................................................................................................................................................................................................................................
- defined contribution plans (note b) 64,726 35,383.........................................................................................................................................................................................................................................................................................................................................................................................
Welfare and other expenses 269,066 242,629.........................................................................................................................................................................................................................................................................................................................................................................................
2,504,271 2,093,650
Notes:
(a) These include contributions to PRC government sponsored housing funds (at rates ranging from 5% to 20% of the employees’
basic salary) for full time employees in the PRC during the year.
(b) The employees of the subsidiaries in the PRC participate in various retirement benefit plans organised by the relevant municipal and
provincial governments in the PRC under which the Group was required to make monthly contributions to these plans at rates
ranging from 9% to 20%, dependent on the applicable local regulations, of the employees’ basic salary for the year.
In addition, the Group participates in various defined contribution retirement schemes for its qualified employees in certain countries
outside the PRC. Employees’ and employers’ contributions are calculated based on various percentages of employees’ gross
salaries or fixed sums and length of service. The assets of the schemes are held separately from those of the administered funds
independently.
Forfeited contributions totalled RMB66,000 were utilised during 2004 and no forfeited contributions were available as at 31
December 2005 and 2004 to reduce future contributions.
Contributions totalling RMB19,383,000 (2004: RMB13,305,000) payable to various retirement benefit plans at 31 December 2005
are included in other payables and accruals.
(c) The staff costs disclosed above do not include the amounts of benefits in kind provided to the Directors, supervisors and the
Group’s key managements in respect of staff quarters, share options and share appreciation rights being granted during the year.
Further details of the emoluments of the Directors, supervisors and senior management are disclosed in note 36 to the Consolidated
Financial Statements.

173China COSCO Holdings Company Limited
ANNUAL REPORT 2005
36 Emoluments of Directors, supervisors and senior management
(a) Directors’, supervisors’ and senior management’s emoluments
Details of the emoluments paid and payable to the Directors, supervisors and senior management of the Company
by the Group in respect of their services rendered for managing the business of the Group during the year are as
follows:
2005 2004
RMB’000 RMB’000
(Restated)
Independent non-executive Directors.........................................................................................................................................................................................................................................................................................................................................................................................
- Fees 685 223.........................................................................................................................................................................................................................................................................................................................................................................................
Executive and other non-executive Directors.........................................................................................................................................................................................................................................................................................................................................................................................
- Fees 1,639 1,052.........................................................................................................................................................................................................................................................................................................................................................................................
- Salaries and allowances 4,564 5,403.........................................................................................................................................................................................................................................................................................................................................................................................
- Benefits in kind 322 43,922.........................................................................................................................................................................................................................................................................................................................................................................................
- Discretionary bonuses 22 —.........................................................................................................................................................................................................................................................................................................................................................................................
7,232 50,600.........................................................................................................................................................................................................................................................................................................................................................................................
Supervisors.........................................................................................................................................................................................................................................................................................................................................................................................
- Salaries and allowances 1,659 789.........................................................................................................................................................................................................................................................................................................................................................................................
- Benefits in kind 75 4,842.........................................................................................................................................................................................................................................................................................................................................................................................
- Discretionary bonuses 150 —.........................................................................................................................................................................................................................................................................................................................................................................................
- Retirement benefit contributions 16 14.........................................................................................................................................................................................................................................................................................................................................................................................
- Others 44 —.........................................................................................................................................................................................................................................................................................................................................................................................
1,944 5,645.........................................................................................................................................................................................................................................................................................................................................................................................
Senior management.........................................................................................................................................................................................................................................................................................................................................................................................
- Salaries and allowances 7,599 3,844.........................................................................................................................................................................................................................................................................................................................................................................................
- Benefits in kind — 14,526.........................................................................................................................................................................................................................................................................................................................................................................................
- Discretionary bonuses 407 —.........................................................................................................................................................................................................................................................................................................................................................................................
- Others 61 52.........................................................................................................................................................................................................................................................................................................................................................................................
- Retirement benefit contributions 23 —.........................................................................................................................................................................................................................................................................................................................................................................................
8,090 18,422.........................................................................................................................................................................................................................................................................................................................................................................................
17,266 74,667
Benefits in kind for the year ended 31 December 2004 mainly represented the aggregate fair values of the share
options granted to the Directors, a supervisor and senior management under the COSCO Pacific’s share option
scheme which had not been accounted for in the Group’s financial statements pursuant to the transitional provisions
of HKFRS 2. COSCO Pacific did not grant any share options during the year ended 31 December 2005 (note 21(c)).
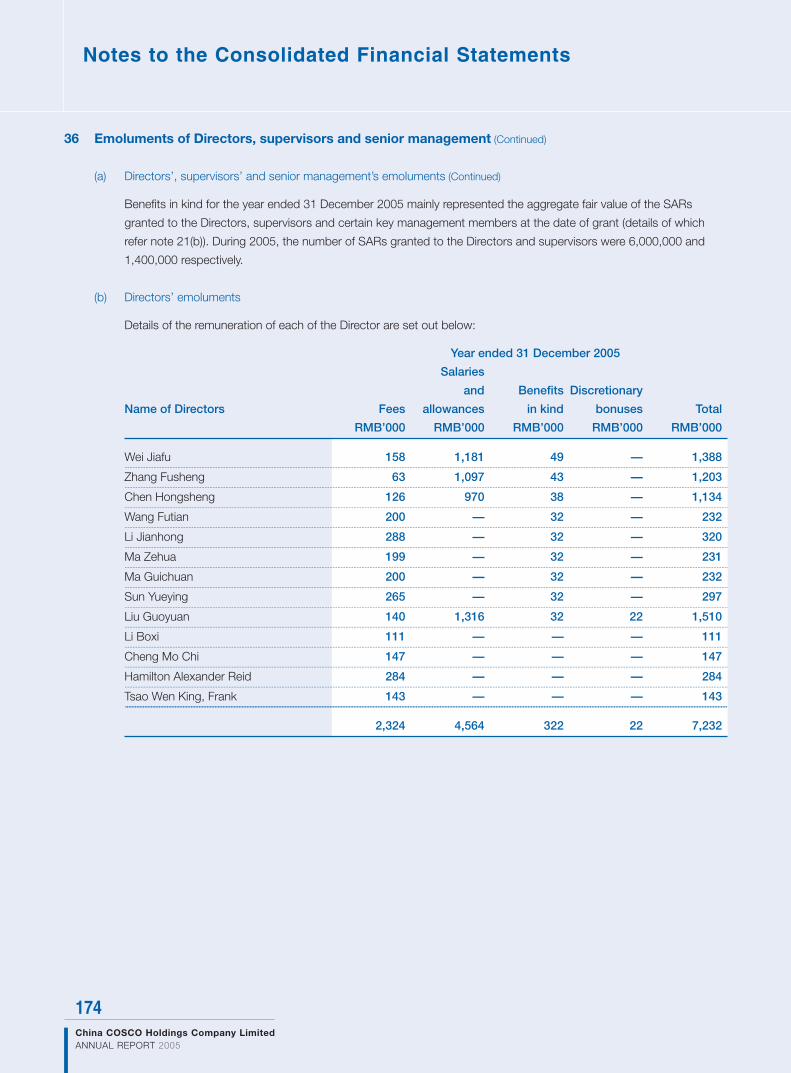
174
Notes to the Consolidated Financial Statements
China COSCO Holdings Company LimitedANNUAL REPORT 2005
36 Emoluments of Directors, supervisors and senior management (Continued)
(a) Directors’, supervisors’ and senior management’s emoluments (Continued)
Benefits in kind for the year ended 31 December 2005 mainly represented the aggregate fair value of the SARs
granted to the Directors, supervisors and certain key management members at the date of grant (details of which
refer note 21(b)). During 2005, the number of SARs granted to the Directors and supervisors were 6,000,000 and
1,400,000 respectively.
(b) Directors’ emoluments
Details of the remuneration of each of the Director are set out below:
Year ended 31 December 2005
Salaries
and Benefits Discretionary
Name of Directors Fees allowances in kind bonuses Total
RMB’000 RMB’000 RMB’000 RMB’000 RMB’000
Wei Jiafu 158 1,181 49 — 1,388.........................................................................................................................................................................................................................................................................................................................................................................................
Zhang Fusheng 63 1,097 43 — 1,203.........................................................................................................................................................................................................................................................................................................................................................................................
Chen Hongsheng 126 970 38 — 1,134.........................................................................................................................................................................................................................................................................................................................................................................................
Wang Futian 200 — 32 — 232.........................................................................................................................................................................................................................................................................................................................................................................................
Li Jianhong 288 — 32 — 320.........................................................................................................................................................................................................................................................................................................................................................................................
Ma Zehua 199 — 32 — 231.........................................................................................................................................................................................................................................................................................................................................................................................
Ma Guichuan 200 — 32 — 232.........................................................................................................................................................................................................................................................................................................................................................................................
Sun Yueying 265 — 32 — 297.........................................................................................................................................................................................................................................................................................................................................................................................
Liu Guoyuan 140 1,316 32 22 1,510.........................................................................................................................................................................................................................................................................................................................................................................................
Li Boxi 111 — — — 111.........................................................................................................................................................................................................................................................................................................................................................................................
Cheng Mo Chi 147 — — — 147.........................................................................................................................................................................................................................................................................................................................................................................................
Hamilton Alexander Reid 284 — — — 284.........................................................................................................................................................................................................................................................................................................................................................................................
Tsao Wen King, Frank 143 — — — 143.........................................................................................................................................................................................................................................................................................................................................................................................
2,324 4,564 322 22 7,232

175China COSCO Holdings Company Limited
ANNUAL REPORT 2005
36 Emoluments of Directors, supervisors and senior management (Continued)
(b) Directors’ emoluments (Continued)
Year ended 31 December 2004
Salaries
and Benefits Discretionary
Name of Directors Fees allowances in kind bonuses Total
RMB’000 RMB’000 RMB’000 RMB’000 RMB’000
Wei Jiafu 163 — 4,842 — 5,005.........................................................................................................................................................................................................................................................................................................................................................................................
Zhang Fusheng 127 — 4,833 — 4,960.........................................................................................................................................................................................................................................................................................................................................................................................
Chen Hongsheng 127 — 4,833 — 4,960.........................................................................................................................................................................................................................................................................................................................................................................................
Wang Futian 127 — 4,833 — 4,960.........................................................................................................................................................................................................................................................................................................................................................................................
Li Jianhong 127 — 4,833 — 4,960.........................................................................................................................................................................................................................................................................................................................................................................................
Ma Zehua 127 — 4,833 — 4,960.........................................................................................................................................................................................................................................................................................................................................................................................
Ma Guichuan 127 — 4,842 — 4,969.........................................................................................................................................................................................................................................................................................................................................................................................
Sun Yueying 127 — 4,842 — 4,969.........................................................................................................................................................................................................................................................................................................................................................................................
Liu Guoyuan — 5,403 5,231 — 10,634.........................................................................................................................................................................................................................................................................................................................................................................................
Hamilton Alexander Reid 223 — — — 223.........................................................................................................................................................................................................................................................................................................................................................................................
1,275 5,403 43,922 — 50,600
Note:
During the year, no emoluments were paid by the Group to any of the Directors as an inducement to join or upon joining the Group
or as compensation for loss of office. No Directors of the Company waived or agreed to waive any emoluments during the year.
(c) Five highest paid individuals
The five individuals whose emoluments were the highest in the Group during the year are as follows:
Number of individuals
2005 2004
Directors — 1.........................................................................................................................................................................................................................................................................................................................................................................................
Employees 5 4.........................................................................................................................................................................................................................................................................................................................................................................................
5 5

176
Notes to the Consolidated Financial Statements
China COSCO Holdings Company LimitedANNUAL REPORT 2005
36 Emoluments of Directors, supervisors and senior management (Continued)
(c) Five highest paid individuals (Continued)
None of the Directors’ emoluments as disclosed in note 36(b) above was included in the emoluments paid to the five
highest paid individuals (2004: one Director). Details of emoluments paid to the five (2004: four) highest paid non-
Director individuals are as follows:
2005 2004
RMB’000 RMB’000
(Restated)
- Salaries and allowances 11,094 8,658.........................................................................................................................................................................................................................................................................................................................................................................................
- Benefits in kind — 17,597.........................................................................................................................................................................................................................................................................................................................................................................................
- Discretionary bonuses 2,132 944.........................................................................................................................................................................................................................................................................................................................................................................................
- Retirement benefit contributions 164 33.........................................................................................................................................................................................................................................................................................................................................................................................
13,390 27,232
The emoluments of the above non-Director individuals fell within the following bands:
Number of individuals
2005 2004
HK$1,500,001 to HK$2,000,000 (equivalent to
approximately RMB1,560,000 to RMB2,080,000) 2 —.........................................................................................................................................................................................................................................................................................................................................................................................
HK$2,000,001 to HK$2,500,000 (equivalent to
approximately RMB2,080,000 to RMB2,600,000) 2 —.........................................................................................................................................................................................................................................................................................................................................................................................
HK$4,500,001 to HK$5,000,000 (equivalent to
approximately RMB4,680,000 to RMB5,200,000) 1 —.........................................................................................................................................................................................................................................................................................................................................................................................
HK$6,000,001 to HK$6,500,000 (equivalent to
approximately RMB6,240,000 to RMB6,760,000) — 2.........................................................................................................................................................................................................................................................................................................................................................................................
HK$6,500,001 to HK$7,000,000 (equivalent to
approximately RMB6,760,000 to RMB7,280,000) — 1.........................................................................................................................................................................................................................................................................................................................................................................................
HK$7,000,001 to HK$7,500,000 (equivalent to
approximately RMB7,280,000 to RMB7,800,000) — 1.........................................................................................................................................................................................................................................................................................................................................................................................
5 4

177China COSCO Holdings Company Limited
ANNUAL REPORT 2005
37 Notes to the consolidated cash flow statement
(a) Reconciliation of profit before income tax to cash generated from operations:
2005 2004
RMB’000 RMB’000
Profit before income tax 7,450,250 5,243,300.........................................................................................................................................................................................................................................................................................................................................................................................
Depreciation 1,733,213 1,810,674.........................................................................................................................................................................................................................................................................................................................................................................................
Amortisation of intangible assets 74,175 69,319.........................................................................................................................................................................................................................................................................................................................................................................................
Amortisation of leasehold land and land use rights 1,916 4,303.........................................................................................................................................................................................................................................................................................................................................................................................
Amortised amounts of transaction costs on long-term borrowings
and discount on issue of notes 21,553 1,987.........................................................................................................................................................................................................................................................................................................................................................................................
Dividend income from listed and unlisted investments (145,149) (181,523).........................................................................................................................................................................................................................................................................................................................................................................................
Share of profits less losses of.........................................................................................................................................................................................................................................................................................................................................................................................
- jointly controlled entities (601,852) (560,731).........................................................................................................................................................................................................................................................................................................................................................................................
- associates (661,918) (276,613).........................................................................................................................................................................................................................................................................................................................................................................................
Gain on disposal of investment securities — (93).........................................................................................................................................................................................................................................................................................................................................................................................
Gain on disposal of an available-for-sale financial asset (512,117) —.........................................................................................................................................................................................................................................................................................................................................................................................
Interest expenses 826,430 551,381.........................................................................................................................................................................................................................................................................................................................................................................................
Interest income (173,277) (47,240).........................................................................................................................................................................................................................................................................................................................................................................................
Gain on deemed disposal of a subsidiary (48,708) (78,530).........................................................................................................................................................................................................................................................................................................................................................................................
Provision for impairment of trade receivables 27,273 27,418.........................................................................................................................................................................................................................................................................................................................................................................................
Recovery of bad debts (62,459) (575).........................................................................................................................................................................................................................................................................................................................................................................................
Provision for resaleable containers — 5,322.........................................................................................................................................................................................................................................................................................................................................................................................
Write-off of resaleable containers — 2,045.........................................................................................................................................................................................................................................................................................................................................................................................
Gain on disposal of property, plant and equipment (20,612) (63,457).........................................................................................................................................................................................................................................................................................................................................................................................
Revaluation surplus of investment properties — (2,417).........................................................................................................................................................................................................................................................................................................................................................................................
Gain on disposal of jointly controlled entities and
dissolution of an associate, net (1,029) (3,203).........................................................................................................................................................................................................................................................................................................................................................................................
Gain on partial disposal of an associate (1,458) —.........................................................................................................................................................................................................................................................................................................................................................................................
Gain on interest rate swap contracts not qualifying as hedges (32,629) —.........................................................................................................................................................................................................................................................................................................................................................................................
Net gain on interest rate swap contract — (31,742).........................................................................................................................................................................................................................................................................................................................................................................................
Exchange loss — 11,042.........................................................................................................................................................................................................................................................................................................................................................................................
Other incidental borrowing costs and charges 20,410 86,392.........................................................................................................................................................................................................................................................................................................................................................................................
Operating profit before working capital changes 7,894,012 6,567,059.........................................................................................................................................................................................................................................................................................................................................................................................
Increase in inventories (218,487) (14,600).........................................................................................................................................................................................................................................................................................................................................................................................
Decrease/(increase) in trade and other receivables 1,592,546 (2,654,251).........................................................................................................................................................................................................................................................................................................................................................................................
(Decrease)/increase in trade and other payables (2,989,573) 1,695,249.........................................................................................................................................................................................................................................................................................................................................................................................
Decrease in other taxes payable (75,076) (122,479).........................................................................................................................................................................................................................................................................................................................................................................................
Decrease/(increase) in finance lease receivables 12,744 (110).........................................................................................................................................................................................................................................................................................................................................................................................
Increase in other non-current liabilities 22,506 —.........................................................................................................................................................................................................................................................................................................................................................................................
Cash generated from operations 6,238,672 5,470,868

178
Notes to the Consolidated Financial Statements
China COSCO Holdings Company LimitedANNUAL REPORT 2005
37 Notes to the consolidated cash flow statement (Continued)
(b) Disposal of subsidiaries
2005 2004
RMB’000 RMB’000
Net assets disposed of:.........................................................................................................................................................................................................................................................................................................................................................................................
Property, plant and equipment and intangible assets — 7,979.........................................................................................................................................................................................................................................................................................................................................................................................
Other non-current assets — 481.........................................................................................................................................................................................................................................................................................................................................................................................
Other current assets — 33,569.........................................................................................................................................................................................................................................................................................................................................................................................
Bank balances and cash — 13,609.........................................................................................................................................................................................................................................................................................................................................................................................
Other current liabilities — (35,313).........................................................................................................................................................................................................................................................................................................................................................................................
Minority interests — (2,032).........................................................................................................................................................................................................................................................................................................................................................................................
— 18,293
Net cash outflow in respect of the disposal of subsidiaries is analysed as follows:
2005 2004
RMB’000 RMB’000
Cash consideration — —.........................................................................................................................................................................................................................................................................................................................................................................................
Bank balances and cash in hand disposed of — (13,609).........................................................................................................................................................................................................................................................................................................................................................................................
Net cash outflow in respect of disposal of subsidiaries — (13,609)
(c) Major non-cash transactions
(i) During the year ended 31 December 2004, the amount due to a fellow subsidiary was set off against
consideration receivable of RMB1,683,185,000 arising from the disposal of investments.
(ii) During the year ended 31 December 2004, the amount due to a subsidiary of COSCO of RMB1,626,348,000
formed part of the consideration payable which was included under current liabilities.
(iii) During the year ended 31 December 2004, amount payable to a bank RMB2,000,000,000 outstanding as at 1
January 2004 was novated to COSCO by COSCON and settled through the amount due from COSCO.
(iv) On 31 December 2004, the amount due to a fellow subsidiary of US$360,000,000 (equivalent to
RMB2,980,000,000) was transferred and novated to COSCO through COSCON.
(v) On 31 December 2004, COSCO and COSCON entered into a loan transfer agreement with a bank, as part of
the debt restructuring of COSCO, to replace the Group’s net payable balances of RMB3,973,000,000
(consisting of borrowings from COSCO of RMB4,804,000,000 and a receivable balance from COSCO of
RMB831,000,000) with bank borrowings of the same amount.
(vi) During the year ended 31 December 2004, the Group entered into finance lease arrangements in respect of
assets with a total capital value at the inception of the leases of RMB123,900,000.

179China COSCO Holdings Company Limited
ANNUAL REPORT 2005
37 Notes to the consolidated cash flow statement (Continued)
(c) Major non-cash transactions (Continued)
(vii) The Group disposed of certain subsidiaries to fellow subsidiaries at nil consideration and the net assets of
which were treated as deemed distributions to COSCO of RMB18,293,000 for the year ended 31 December
2004.
(viii) On 1 January 2004, certain overseas companies distributed reserves of RMB1,148,081,000 to their then
holding company which is now a fellow subsidiary. The balance was subsequently novated to COSCO through
COSCON.
(ix) In 2004, COSCO Group transferred the equity interests in certain PRC and overseas subsidiaries to the Group
for consideration of RMB62,743,000 (note 1(a)), of which RMB37,180,000 was subsequently novated to
COSCO through COSCON. The remaining balance of RMB17,119,000 was included in amounts due to related
parties as at 31 December 2004 and of RMB13,444,000 was paid during 2004.
(x) In 2004, COSCO and certain fellow subsidiaries waived the rights to receive the balances of RMB122,911,000
and RMB68,155,000 from the Group and the waiver of balances was treated as capital contribution.
(xi) In 2005, the Group derecognised the finance lease arrangements in respect of assets with a total value of
RMB118,796,000.

180
Notes to the Consolidated Financial Statements
China COSCO Holdings Company LimitedANNUAL REPORT 2005
37 Notes to the consolidated cash flow statement (Continued)
(d) Analysis of changes in financing during the year
Amount
Amounts payable to a
Amount due to bank under
due to fellow Minority non-current
Borrowings COSCO subsidiaries interests liabilities
RMB’000 RMB’000 RMB’000 RMB’000 RMB’000
Balance at 1 January 2004 12,672,978 2,171,893 5,873,171 5,285,448 3,000,000.........................................................................................................................................................................................................................................................................................................................................................................................
Amortised amount of
discount on issue of notes 1,987 — — — —.........................................................................................................................................................................................................................................................................................................................................................................................
Drawdown of borrowings 6,745,461 — 1,796,462 — —.........................................................................................................................................................................................................................................................................................................................................................................................
Repayment of borrowings (5,675,919) (338,788) (2,565,361) — (1,000,000).........................................................................................................................................................................................................................................................................................................................................................................................
Inception of finance lease
obligations (note c(vi)) 123,900 — — — —.........................................................................................................................................................................................................................................................................................................................................................................................
Finance lease payments (5,104) — — — —.........................................................................................................................................................................................................................................................................................................................................................................................
Transfer (note c(iv)) — 2,980,000 (2,980,000) — —.........................................................................................................................................................................................................................................................................................................................................................................................
Disposal of investments (note c(i)) — — (1,683,185) — —.........................................................................................................................................................................................................................................................................................................................................................................................
Assignment of balances
(notes c(ii), c(iii) and c(v)) 3,973,000 (4,804,000) (1,626,348) — (2,000,000).........................................................................................................................................................................................................................................................................................................................................................................................
Distribution of reserves (note c(viii)) — — 1,148,081 — —.........................................................................................................................................................................................................................................................................................................................................................................................
Transfer of certain oversea
subsidiaries (note c (ix)) — — 37,180 — —.........................................................................................................................................................................................................................................................................................................................................................................................
Increase in equity upon deemed
disposal of subsidiaries — — — 274,319 —.........................................................................................................................................................................................................................................................................................................................................................................................
Disposal of subsidiaries — — — (2,032) —.........................................................................................................................................................................................................................................................................................................................................................................................
Minority interests’ share of profit — — — 799,583 —.........................................................................................................................................................................................................................................................................................................................................................................................
Contributions from minority
shareholders of subsidiaries — — — 2,732 —.........................................................................................................................................................................................................................................................................................................................................................................................
Dividends paid to minority
shareholders of subsidiaries — — — (406,732) —.........................................................................................................................................................................................................................................................................................................................................................................................
Balance at 31 December 2004 17,836,303 9,105 — 5,953,318 —.........................................................................................................................................................................................................................................................................................................................................................................................

181China COSCO Holdings Company Limited
ANNUAL REPORT 2005
37 Notes to the consolidated cash flow statement (Continued)
(d) Analysis of changes in financing during the year (Continued)
Share capital Amount
(including share due to Minority
premium) Borrowings COSCO interests
RMB’000 RMB’000 RMB’000 RMB’000
Balance at 1 January 2005,
as previously reported — 17,836,303 9,105 5,953,318.........................................................................................................................................................................................................................................................................................................................................................................................
Opening adjustments for the
adoption of HKFRS 3,
HKASs 32, 39 and 39
(Amendment) in respect of.........................................................................................................................................................................................................................................................................................................................................................................................
- Redesignation of
investments securities
as available-for-sale
financial assets — — — 923,096.........................................................................................................................................................................................................................................................................................................................................................................................
- Recognition of unamortised
transaction cost on
bank borrowings and notes — (91,684) — 23,051.........................................................................................................................................................................................................................................................................................................................................................................................
- Recognition of interest rate
swap contracts as
derivative financial
instruments — — — 6,378.........................................................................................................................................................................................................................................................................................................................................................................................
- Derecognition of negative
goodwill — — — 78,343.........................................................................................................................................................................................................................................................................................................................................................................................
- Share of opening
adjustments of jointly
controlled entities and
associates — — — 23,313.........................................................................................................................................................................................................................................................................................................................................................................................
Balance at 1 January 2005,
as restated — 17,744,619 9,105 7,007,499.........................................................................................................................................................................................................................................................................................................................................................................................

182
Notes to the Consolidated Financial Statements
China COSCO Holdings Company LimitedANNUAL REPORT 2005
37 Notes to the consolidated cash flow statement (Continued)
(d) Analysis of changes in financing during the year (Continued)
Share capital Amount
(including share due to Minority
premium) Borrowings COSCO interests
RMB’000 RMB’000 RMB’000 RMB’000
Proceeds from issue
of new H shares 9,232,683 — — —.........................................................................................................................................................................................................................................................................................................................................................................................
Share issue expenses (414,886) — — —.........................................................................................................................................................................................................................................................................................................................................................................................
Exchange differences — (419,241) — (140,429).........................................................................................................................................................................................................................................................................................................................................................................................
Amortised amounts of transaction
costs on long-term borrowings
and discount on issue of notes — 21,553 — —.........................................................................................................................................................................................................................................................................................................................................................................................
Drawdown of borrowings — 6,248,448 — —.........................................................................................................................................................................................................................................................................................................................................................................................
Repayment of borrowings — (6,733,031) (9,105) —.........................................................................................................................................................................................................................................................................................................................................................................................
Derecognition of finance lease
obligations (note c(xi)) — (118,796) — —.........................................................................................................................................................................................................................................................................................................................................................................................
Effect of fair value hedge — (54,078) — —.........................................................................................................................................................................................................................................................................................................................................................................................
Release of reserves upon.........................................................................................................................................................................................................................................................................................................................................................................................
- disposal of an available-for-
sale financial asset — — — (237,871).........................................................................................................................................................................................................................................................................................................................................................................................
- deemed disposals — — — 141,628.........................................................................................................................................................................................................................................................................................................................................................................................
Fair value gain of available-for
sale financial assets — — — 59,641.........................................................................................................................................................................................................................................................................................................................................................................................
Share of reserves of a jointly
controlled entity and associates — — — 3,151.........................................................................................................................................................................................................................................................................................................................................................................................
Increase in equity interest in
subsidiaries (previously jointly
controlled entities) — — — 71,940.........................................................................................................................................................................................................................................................................................................................................................................................
Minority interests’ share of profit — — — 1,348,126.........................................................................................................................................................................................................................................................................................................................................................................................
Dividends paid to minority
shareholders of a subsidiary — — — (745,648).........................................................................................................................................................................................................................................................................................................................................................................................
Contributions from minority
shareholders of subsidiaries — — — 703.........................................................................................................................................................................................................................................................................................................................................................................................
At 31 December 2005 8,817,797 16,689,474 — 7,508,740

183China COSCO Holdings Company Limited
ANNUAL REPORT 2005
38 Contingent liabilities
The following is a summary of the significant contingent liabilities as at 31 December 2005:
Group
2005 2004
RMB’000 RMB’000
Guarantee for bank loan facilities granted to an associate (note a) 176,899 —.........................................................................................................................................................................................................................................................................................................................................................................................
Pending lawsuits (note b) 32,656 36,100.........................................................................................................................................................................................................................................................................................................................................................................................
209,555 36,100
Notes:
(a) As at 31 December 2005, Antwerp Gateway NV., an associate of the Group, had bank loans facilities of EURO143,400,000
(equivalent to approximately RMB1,373,729,000), of which EURO18,466,000 (equivalent to approximately RMB176,899,000) is
guaranteed by the Group.
(b) In 2003, the Group was involved in a personal injury case in which a truck was involved in a traffic accident in Illinois, the US,
resulting in death and injury of a number of individuals. Upon advice of US legal counsel, the Directors considered that the exposure
liable to the Group, if any, is fully covered by the Group’s insurance policies.
The Group is subject to other claims in respect of a number of litigations currently under way. As at 31 December 2005, the Group
is unable to ascertain the likelihood and amounts of the respective claims. However, based on advice of legal counsel, the Directors
are of the opinion that, while the claims have not been provided for in the Consolidated Financial Statements or included in the
contingent liabilities as disclosed above, either the Group’s insurance coverage will be adequate to cover any final claims to be
settled or the final claims amounts will be insignificant to the Group.
(c) The Company did not have any significant contingent liabilities as at 31 December 2005.

184
Notes to the Consolidated Financial Statements
China COSCO Holdings Company LimitedANNUAL REPORT 2005
39 Commitments
(a) Capital commitments
Group
2005 2004
RMB’000 RMB’000
Authorised but not contracted for.........................................................................................................................................................................................................................................................................................................................................................................................
Containers 2,562,757 2,919,099.........................................................................................................................................................................................................................................................................................................................................................................................
Vessels 304,000 8,731,959.........................................................................................................................................................................................................................................................................................................................................................................................
Other property, plant and equipment 94,264 115,506.........................................................................................................................................................................................................................................................................................................................................................................................
Investments 675 23,966.........................................................................................................................................................................................................................................................................................................................................................................................
Intangible assets 7,918 —.........................................................................................................................................................................................................................................................................................................................................................................................
2,969,614 11,790,530
Contracted but not provided for.........................................................................................................................................................................................................................................................................................................................................................................................
Containers 67,233 95,599.........................................................................................................................................................................................................................................................................................................................................................................................
Vessels 7,395,075 1,774,059.........................................................................................................................................................................................................................................................................................................................................................................................
Other property, plant and equipment 96,258 66,959.........................................................................................................................................................................................................................................................................................................................................................................................
Investments (note i) 5,744,723 2,906,080.........................................................................................................................................................................................................................................................................................................................................................................................
Intangible assets 11,805 —.........................................................................................................................................................................................................................................................................................................................................................................................
13,315,094 4,842,697
Notes:
(i) The Group’s contracted investments as at 31 December 2005 are as follows:
Group
2005 2004
RMB’000 RMB’000
Investments in:.........................................................................................................................................................................................................................................................................................................................................................................................
- Qingdao Qianwan Container Terminal Co., Ltd 839,462 884,646.........................................................................................................................................................................................................................................................................................................................................................................................
- Antwerp Gateway NV 654,421 1,458,813.........................................................................................................................................................................................................................................................................................................................................................................................
- Dalian Port Container Terminals Co., Ltd 713,341 —.........................................................................................................................................................................................................................................................................................................................................................................................
- Others 356,679 530,472.........................................................................................................................................................................................................................................................................................................................................................................................
Terminal projects in:.........................................................................................................................................................................................................................................................................................................................................................................................
- Nansha of Guangzhou 2,365,343 —.........................................................................................................................................................................................................................................................................................................................................................................................
- Others 815,477 32,149.........................................................................................................................................................................................................................................................................................................................................................................................
5,744,723 2,906,080

185China COSCO Holdings Company Limited
ANNUAL REPORT 2005
39 Commitments (Continued)
(a) Capital commitments (Continued)
(ii) Amounts of capital commitments relating to the Group’s interest in the jointly controlled entities are as follows:
2005 2004
RMB’000 RMB’000
Authorised but not contracted for 67,128 61,250.........................................................................................................................................................................................................................................................................................................................................................................................
Contracted but not provided for 59,042 68,542.........................................................................................................................................................................................................................................................................................................................................................................................
126,170 129,792
(b) Operating lease arrangement - where the Group is the lessor
At 31 December 2005, the Group had future minimum lease receipts under non-cancellable operating leases as
follows:
Group
2005 2004
RMB’000 RMB’000
Vessels and containers.........................................................................................................................................................................................................................................................................................................................................................................................
- not later than one year 838,027 875,475.........................................................................................................................................................................................................................................................................................................................................................................................
- later than one year and not later than five years 1,898,248 1,532,078.........................................................................................................................................................................................................................................................................................................................................................................................
- later than five years 83,632 215,790.........................................................................................................................................................................................................................................................................................................................................................................................
2,819,907 2,623,343.........................................................................................................................................................................................................................................................................................................................................................................................
Investment properties and other properties.........................................................................................................................................................................................................................................................................................................................................................................................
- not later than one year 3,589 4,718.........................................................................................................................................................................................................................................................................................................................................................................................
- later than one year and not later than five years 7,317 12,781.........................................................................................................................................................................................................................................................................................................................................................................................
- later than five years 1,930 1,805.........................................................................................................................................................................................................................................................................................................................................................................................
12,836 19,304.........................................................................................................................................................................................................................................................................................................................................................................................
Other property, plant and equipment.........................................................................................................................................................................................................................................................................................................................................................................................
- not later than one year 8,498 6,166.........................................................................................................................................................................................................................................................................................................................................................................................
- later than one year and not later than five years 21,854 21,313.........................................................................................................................................................................................................................................................................................................................................................................................
30,352 27,479.........................................................................................................................................................................................................................................................................................................................................................................................
2,863,095 2,670,126
The future lease receipts above do not include those lease contracts with the amount of future lease receipts
depends on the timing of pick up and drop off of containers by lessees during the lease period of the contracts.

186
Notes to the Consolidated Financial Statements
China COSCO Holdings Company LimitedANNUAL REPORT 2005
39 Commitments (Continued)
(c) Operating lease commitments - where the Group is the lessee
At 31 December 2005, the Group had future aggregate minimum lease payments under non-cancellable operating
leases as follows:
Group
2005 2004
RMB’000 RMB’000
Land and buildings.........................................................................................................................................................................................................................................................................................................................................................................................
- not later than one year 84,331 68,698.........................................................................................................................................................................................................................................................................................................................................................................................
- later than one year and not later than five years 141,816 97,868.........................................................................................................................................................................................................................................................................................................................................................................................
- later than five years 43,908 41,248.........................................................................................................................................................................................................................................................................................................................................................................................
270,055 207,814.........................................................................................................................................................................................................................................................................................................................................................................................
Vessels and containers.........................................................................................................................................................................................................................................................................................................................................................................................
- not later than one year 2,734,247 2,135,589.........................................................................................................................................................................................................................................................................................................................................................................................
- later than one year and not later than five years 8,909,207 9,570,024.........................................................................................................................................................................................................................................................................................................................................................................................
- later than five years 7,669,724 8,559,998.........................................................................................................................................................................................................................................................................................................................................................................................
19,313,178 20,265,611.........................................................................................................................................................................................................................................................................................................................................................................................
Other property, plant and equipment.........................................................................................................................................................................................................................................................................................................................................................................................
- not later than one year 13,207 9,110.........................................................................................................................................................................................................................................................................................................................................................................................
- later than one year and not later than five years 19,569 7,353.........................................................................................................................................................................................................................................................................................................................................................................................
32,776 16,463.........................................................................................................................................................................................................................................................................................................................................................................................
19,616,009 20,489,888
(d) The Company did not have any significant commitments as at 31 December 2005.
40 Significant related party transactions
The Company is controlled by COSCO, the parent company and a state-owned enterprise established in the PRC.
COSCO itself is a state-owned enterprise controlled by the PRC government. In accordance with HKAS 24 “Related Party
Disclosures” issued by the HKICPA, other state-owned enterprises and their subsidiaries (other than COSCO group
companies), directly or indirectly controlled by the PRC government, are also defined as related parties of the Group.
For the purpose of the related party transaction disclosures, the Group has identified, to the extent practicable, its
customers and suppliers as to whether they are state-owned enterprises. Nevertheless, the Directors believe that
meaningful information in respect of related party transactions has been adequately disclosed.

187China COSCO Holdings Company Limited
ANNUAL REPORT 2005
40 Significant related party transactions (Continued)
In addition to the related party information disclosed elsewhere in the Consolidated Financial Statements, the following is a
summary of significant related party transactions entered into the ordinary course of business between the Group and its
related parties during the year.
2005 2004
RMB’000 RMB’000
Transactions with COSCO.........................................................................................................................................................................................................................................................................................................................................................................................
Expenses.........................................................................................................................................................................................................................................................................................................................................................................................
Vessel costs.........................................................................................................................................................................................................................................................................................................................................................................................
Subcharter expenses (note a) 113,236 —
Transactions with subsidiaries of COSCO and its related entities
(including jointly controlled entities and associates).........................................................................................................................................................................................................................................................................................................................................................................................
Revenues.........................................................................................................................................................................................................................................................................................................................................................................................
Container shipping income (note b) 392,823 391,017.........................................................................................................................................................................................................................................................................................................................................................................................
Shipping-related service income (note l) 15,888 13,707.........................................................................................................................................................................................................................................................................................................................................................................................
Freight forwarding and shipping agency income (note c) 23,786 52,812
Expenses.........................................................................................................................................................................................................................................................................................................................................................................................
Vessel costs.........................................................................................................................................................................................................................................................................................................................................................................................
Vessel services expenses (note d) 267,871 263,250.........................................................................................................................................................................................................................................................................................................................................................................................
Crew expenses (note e) 603,433 604,464.........................................................................................................................................................................................................................................................................................................................................................................................
Subcharter expenses (note a) 495,307 501,346.........................................................................................................................................................................................................................................................................................................................................................................................
Vessel management expenses (note e) 75,248 52,580.........................................................................................................................................................................................................................................................................................................................................................................................
Voyage costs.........................................................................................................................................................................................................................................................................................................................................................................................
Bunker costs (note f) 4,489,521 2,713,529.........................................................................................................................................................................................................................................................................................................................................................................................
Port charges (note g) 1,261,996 1,141,714.........................................................................................................................................................................................................................................................................................................................................................................................
Equipment and cargo transportation costs.........................................................................................................................................................................................................................................................................................................................................................................................
Commission and rebates (note h) 229,363 369,742.........................................................................................................................................................................................................................................................................................................................................................................................
Cargo and transhipment and equipment and repositioning expenses (note i) 231,931 234,047.........................................................................................................................................................................................................................................................................................................................................................................................
Transportation and depot services expenses (note j) 151,482 92,514.........................................................................................................................................................................................................................................................................................................................................................................................
Management fee expenses (note l) 21,257 59,383.........................................................................................................................................................................................................................................................................................................................................................................................
General service expenses (note l) 19,527 7,278.........................................................................................................................................................................................................................................................................................................................................................................................
Rental expenses (note l) 42,646 20,921.........................................................................................................................................................................................................................................................................................................................................................................................
Sales commission for handling of vessels sales (note l) — 10,136.........................................................................................................................................................................................................................................................................................................................................................................................

188
Notes to the Consolidated Financial Statements
China COSCO Holdings Company LimitedANNUAL REPORT 2005
40 Significant related party transactions (Continued)
2005 2004
RMB’000 RMB’000
Others.........................................................................................................................................................................................................................................................................................................................................................................................
Consideration received for the disposal of a subsidiary and
assignment of a shareholders’ loan (note m) 12,760 —.........................................................................................................................................................................................................................................................................................................................................................................................
Purchase of building (note m) 18,600 —.........................................................................................................................................................................................................................................................................................................................................................................................
Downpayments for purchase of container vessels (note o) 392,100 —.........................................................................................................................................................................................................................................................................................................................................................................................
Purchase of.........................................................................................................................................................................................................................................................................................................................................................................................
- an associate (note p) — 1,056,384.........................................................................................................................................................................................................................................................................................................................................................................................
- jointly controlled entities (note q) — 1,252,910.........................................................................................................................................................................................................................................................................................................................................................................................
Disposal of jointly controlled entities (note m) — 41,040.........................................................................................................................................................................................................................................................................................................................................................................................
Disposal of investments in a subsidiary (note m) — 32,189.........................................................................................................................................................................................................................................................................................................................................................................................
Share of general and administrative expenses by a fellow subsidiary (note r) — 33,648
Transactions with jointly controlled entities of the Group.........................................................................................................................................................................................................................................................................................................................................................................................
Revenues.........................................................................................................................................................................................................................................................................................................................................................................................
Container shipping income (note b) 297,991 487,775.........................................................................................................................................................................................................................................................................................................................................................................................
Freight forwarding and shipping agency income (note c) 21,632 39,027.........................................................................................................................................................................................................................................................................................................................................................................................
Management fee income (note l) 21,056 21,222
Expenses.........................................................................................................................................................................................................................................................................................................................................................................................
Voyage costs.........................................................................................................................................................................................................................................................................................................................................................................................
Port charges (note g) 1,091,301 1,001,664.........................................................................................................................................................................................................................................................................................................................................................................................
Equipment and cargo transportation costs.........................................................................................................................................................................................................................................................................................................................................................................................
Commission and rebates (note h) 16,622 43,159.........................................................................................................................................................................................................................................................................................................................................................................................
Cargo and transhipment and equipment and repositioning expenses (note i) 5,093 43,015.........................................................................................................................................................................................................................................................................................................................................................................................
Transportation and depot services expenses (note j) 134,016 123,130.........................................................................................................................................................................................................................................................................................................................................................................................
Rental expenses (note l) 4,595 4,825.........................................................................................................................................................................................................................................................................................................................................................................................
Others.........................................................................................................................................................................................................................................................................................................................................................................................
Purchase of containers (note s) 301,642 51,293
Transactions with associates of the Group.........................................................................................................................................................................................................................................................................................................................................................................................
Expenses.........................................................................................................................................................................................................................................................................................................................................................................................
Container freight charges (note l) 14,562 9,245
Others.........................................................................................................................................................................................................................................................................................................................................................................................
Purchase of containers (note s) 866,147 239,106

189China COSCO Holdings Company Limited
ANNUAL REPORT 2005
40 Significant related party transactions (Continued)
2005 2004
RMB’000 RMB’000
Transactions with other state-owned enterprises.........................................................................................................................................................................................................................................................................................................................................................................................
Revenues.........................................................................................................................................................................................................................................................................................................................................................................................
Container shipping income (note b) 2,867,281 1,674,515.........................................................................................................................................................................................................................................................................................................................................................................................
Freight forwarding and shipping agency income (note c) 459,062 412,046.........................................................................................................................................................................................................................................................................................................................................................................................
Container rental income (note l) 17,281 18,042.........................................................................................................................................................................................................................................................................................................................................................................................
Interest income on bank deposits (note l) 41,527 15,314
Expenses.........................................................................................................................................................................................................................................................................................................................................................................................
Vessel costs.........................................................................................................................................................................................................................................................................................................................................................................................
Vessel services expenses (note d) 74,497 76,020.........................................................................................................................................................................................................................................................................................................................................................................................
Port charges (note g) 1,365,032 960,796.........................................................................................................................................................................................................................................................................................................................................................................................
Transportation and depot services expenses (note j) 269,299 230,811.........................................................................................................................................................................................................................................................................................................................................................................................
General service expenses (note l) 7,320 3,066.........................................................................................................................................................................................................................................................................................................................................................................................
Interest expense (note k) 421,314 244,370
Notes:
(a) COSCO and its subsidiaries leased thirteen vessels to COSCON and Pan Asia by way of sub-time charter arrangements. The
periods of the sub-time charters are of six to twelve years. The daily charterhire rate for each vessel was agreed on a mutual basis.
(b) COSCON provided a subsidiary of COSCO, COSCO Logistics and its subsidiaries and certain state-owned enterprises with
container shipping services. These services were charged on a mutually agreed basis, except for the transactions with the
subsidiary of COSCO and jointly controlled entities, which are governed by the terms under Master Solicitation Activities Agreement
since 9 June 2005 (note n) and the underlying execution agreements. COSCO Logistics was owned as to 51% directly by COSCO
and as to 49% indirectly by COSCO Pacific since January 2004.
(c) The subsidiaries of the Group provided the subsidiaries of COSCO, certain jointly controlled entities of the Group, certain state-
owned enterprises with freight forwarding, shipping agency and related services. The services were charged based on a certain
percentage of the related freight revenue or fixed amounts per volume handled or as terms governed by the Master Overseas
Agency Services Agreement dated 9 June 2005 (note n).
(d) Certain subsidiaries of COSCO and state-owned enterprises provided COSCON and its subsidiaries with lubricants, paint for vessel
repairing, paint for maintenance, vessel materials and parts, vessel radio and communication equipment, etc. The vessel services
were charged on a mutually agreed basis, except for the transactions with subsidiaries of COSCO which are governed by the terms
under Master Vessel Services Agreement dated 9 June 2005 (noted n).
(e) Shanghai Ocean Shipping Company (“SOSC”), a wholly-owned subsidiary of COSCO, provided the Group with crew and vessel
management services. The services rendered were charged based on a mutually agreed basis prior to Listing Date or based on the
actual costs incurred by SOSC and governed by the terms under Master Vessel Management Agreement and Master Seamen
Leasing Agreement dated 9 June 2005 (note n).

190
Notes to the Consolidated Financial Statements
China COSCO Holdings Company LimitedANNUAL REPORT 2005
40 Significant related party transactions (Continued)
(f) Certain subsidiaries and jointly controlled entities of COSCO provided COSCON and its subsidiaries with bunkers at prices with
reference to market rates and governed by the terms under Master Vessel Services Agreement dated 9 June 2005 (note n).
The Group entered into bunker forward agreements through Chimbusco (Singapore) Pte Ltd (“Chimbusco”), a jointly controlled
entity of COSCO. No service fees was charged by Chimbusco for the arrangements of bunker forward agreements.
As at 31 December 2005, there were notional amounts of outstanding bunker forward agreements of RMB200,656,000 (2004:
RMB196,713,000) entered into by the Group for itself and certain fellow subsidiaries. The gain or loss on bunker forward
agreements is shared between the Group and the fellow subsidiaries based on their respective actual consumption of bunker for the
year.
(g) Certain jointly controlled entities of COSCO and jointly controlled entities of the Group and certain state-owned enterprises provided
the Group with container terminal handling and storage services, port services and shipping services. The services rendered were
charged at terms as agreed with the related parties or at terms based on respective underlying agreements entered into between
the Group and the respective related companies or at terms governed by the Master Port Services Agreement dated 9 June 2005
(note n).
(h) Certain subsidiaries of COSCO and certain subsidiaries, jointly controlled entities and an associate of COSCO Logistics, and certain
jointly controlled entities of the Group provided COSCON with shipping agency, freight forwarding, freight solicitation, slot booking
services and other related services. The service was charged based on a certain percentage of the related freight revenue, the
quantity of cargo solicited, at terms as agreed with the related parties and at terms governed by the Master Overseas Agent
Services Agreement dated 9 June 2005 (note n) and the underlying execution agreements.
(i) Certain subsidiaries of COSCO and jointly controlled entities of the Group provided the Group with container services including
provision of container depots, repairs, towage, examination and maintenance of containers and related services. The container
services were charged at terms as agreed with the related parties or at terms governed by the Master Container Services
Agreement dated 9 June 2005 (note n) and the underlying execution agreements.
(j) Certain subsidiaries, jointly controlled entities and associates of COSCO and COSCO Logistics, certain jointly controlled entities of
the Group and state-owned enterprise provided the Group with transportation and depot services. The charges were based on the
terms as governed by the Master Container Services Agreement or Master Solicitation Services Agreement dated 9 June 2005 (note
n) and the underlying execution agreements or at terms as agreed with the related parties.
(k) Interest was charged for loans with state-owned banks in accordance with the terms as set out in the respective agreements or as
mutually agreed between the parties in concern.
(l) These transactions of revenues and expenses in nature were conducted based on terms as set out in the underlying agreements,
based on statutory rates or market prices or actual cost incurred, or as mutually agreed.
(m) These transactions were conducted at terms as set out in the relevant agreements entered into between the Group and the parties
in concern.
(n) On 9 June 2005, the Group (other than COSCO Pacific group) and COSCO Group entered into eight master agreements effective
on or after 9 June 2005 with an initial term of three years relating to the provision of general services, vessel services, agency and
management services, container services solicitation activities, port services, vessel management services, seamen leasing,
properties leasing, provision of products and services. Upon the expiry of the initial term, each of the master agreements shall
automatically continue for a term to be agreed by the parties of such master agreements. Each of the eight master agreements
contains binding principles, guidelines and terms and conditions pursuant to which any and all products and services contemplated
therein are to be provided by the relevant provider to the relevant recipient. The fee of each relevant product or service under each
of the master agreements is determined with reference to state-prescribed prices, market price or the actual cost incurred in
providing such products or services plus a margin. The master agreements are framework agreements which provide the
mechanism for the operation of the related party transactions and individual execution agreements were entered into between the
Group and the related parties, if appropriate.
191China COSCO Holdings Company Limited
ANNUAL REPORT 2005
40 Significant related party transactions (Continued)
(o) In April 2005, the Group entered into several ship building contracts with Nantong COSO KHI Ship Engineering Co., Ltd., a related
party of the Group, for the construction of four 10,000 TEU container vessels. The total contract price was approximately
US$485,800,000 (equivalent to approximately RMB4,021,200,000). As at 31 December 2005, RMB392,100,000 was paid.
(p) On 19 August 2004, COSCO Container Industries Limited (“COSCO Container”), a wholly owned subsidiary of COSCO Pacific,
entered into an agreement with COSCO to acquire its 163,701,456 non-publicly tradable State-owned legal person shares in CIMC,
representing approximately 16.23% of the issued share capital of CIMC, at a cash consideration of RMB1,056,384,000 (equivalent
to approximately US$127,240,000). CIMC, whose A shares and B shares are listed and traded on the Shenzhen Stock Exchange, is
primarily engaged in the manufacturing and sale of modern traffic and transport equipment such as containers, modern road
transport vehicles and airport ground equipment. The acquisition of CIMC was completed on 31 December 2004.
(q) (i) Pursuant to an agreement dated 22 September 2003 (the “Agreement”), COSCO Pacific Logistics Company Limited
(“CPLCL”), a subsidiary of the Group, agreed to acquire from COSCO its 49% equity interest in COSCO Logistics, a then
wholly owned subsidiary of COSCO, at an aggregate amount of RMB1,180,410,000 (equivalent to approximately
US$142,179,000), comprising an amount payable to COSCO of RMB446,410,000 and capital contribution to COSCO
Logistics of RMB734,000,000. The acquisition was completed in January 2004.
CPLCL also paid COSCO an additional consideration of RMB50,000,000 (equivalent to approximately US$6,022,000) in
September 2004 pursuant to the conditions as set out in the Agreement.
(ii) Pursuant to an agreement dated 15 June 2004, COSCO Ports (Yingkou) Limited, a subsidiary of the Group, agreed to
acquire from COSCO its entire 50% equity interest in a company established in the PRC which is principally engaged in the
provision of container terminal business in Yingkou, at a cash consideration of RMB22,500,000. The acquisition was
completed in August 2004.
(r) In the prior year, the general and administrative expenses were shared by a subsidiary of COSCO for the general and administrative
services provided by the Group. The sharing of the expenses incurred was calculated based on the headcount involved in general
and administrative work of the staff of COSCON for the fellow subsidiary.
(s) The purchases of containers from jointly controlled entities of the Group and subsidiaries of CIMC were conducted at terms as set
out in the agreements entered into between the Group and the parties in concern.

192
Notes to the Consolidated Financial Statements
China COSCO Holdings Company LimitedANNUAL REPORT 2005
40 Significant related party transactions (Continued)
Balances with related parties
Other than those disclosed elsewhere in the Consolidated Financial Statements, the outstanding balances with related
entities at year end are as follows:
2005 2004
RMB’000 RMB’000
Deposits.........................................................................................................................................................................................................................................................................................................................................................................................
- State-owned banks and other state-owned
non-bank financial institutions (note a) 5,007,356 1,735,742
Loans.........................................................................................................................................................................................................................................................................................................................................................................................
- State-owned banks and other state-owned
non-bank financial institutions (note a) 7,857,147 10,117,748
Trade and other receivables.........................................................................................................................................................................................................................................................................................................................................................................................
- State-owned enterprises (note b) 302,839 444,456
Trade and other payables.........................................................................................................................................................................................................................................................................................................................................................................................
- State-owned enterprises (note b) 133,943 194,819
Notes:
(a) The deposits and loans were in accordance with the terms as set out in the respective agreements or as mutually agreed between
the parties in concern. The interest rates were set at prevailing market rates.
(b) Trading balances with state-owned enterprises have similar terms of repayments as the balances with third parties while other
balances with state-owned enterprises are unsecured, interest free and repayable on demand.

193China COSCO Holdings Company Limited
ANNUAL REPORT 2005
40 Significant related party transactions (Continued)
Share options granted by related parties
Share options were granted to the Company’s Directors and employees of the Group by two fellow subsdiaries, COSCO
International Holdings Limited (“COSCO International”) and COSCO Corporation (Singapore) Limited (“COSCO Corporation
(Singapore)”). Movement during the year are as follows:
Number of units of share options
Outstanding Outstanding
at Granted Exercised Lapsed at 31
Exercise 1 January during during during December
price 2005 the year the year the year 2005 note
Share Options of
COSCO International.........................................................................................................................................................................................................................................................................................................................................................................................
Directors HK$0.57 5,400,000 — — — 5,400,000 (i).........................................................................................................................................................................................................................................................................................................................................................................................
HK$1.37 3,600,000 — — — 3,600,000 (ii).........................................................................................................................................................................................................................................................................................................................................................................................
Employees HK$0.57 5,000,000 — (300,000) — 4,700,000 (i).........................................................................................................................................................................................................................................................................................................................................................................................
HK$1.37 4,600,000 — — — 4,600,000 (ii).........................................................................................................................................................................................................................................................................................................................................................................................
18,600,000 — (300,000) — 18,300,000
Share options of COSCO
Corporation (Singapore).........................................................................................................................................................................................................................................................................................................................................................................................
Directors S$0.2 800,000 — (800,000) — — (iii).........................................................................................................................................................................................................................................................................................................................................................................................
S$0.2 850,000 — (850,000) — — (iv).........................................................................................................................................................................................................................................................................................................................................................................................
S$0.735 1,700,000 — (1,700,000) — — (v).........................................................................................................................................................................................................................................................................................................................................................................................
S$1.614 — 1,050,000 — — 1,050,000 (vi).........................................................................................................................................................................................................................................................................................................................................................................................
3,350,000 1,050,000 (3,350,000) — 1,050,000
Notes:
(i) The share options were granted on 26 November 2003 under the share option scheme adopted by COSCO International on 17
May 2002 (the “COSCO International Scheme”). The options are exercisable at any time between 23 December 2003 to 22
December 2008.
(ii) The share options were granted on 2 December 2004 by COSCO International under the COSCO International Scheme. The
options are exercisable at any time between 29 December 2004 to 28 December 2014.
(iii) The share options were granted by COSCO Corporation (Singapore) on 12 August 2002 The options are exercisable at any time
between 12 August 2003 and 11 August 2007.
(iv) The share options were granted by COSCO Corporation (Singapore) on 1 April 2003 and are exercisable at any time between 1
April 2004 and 31 March 2008.
(v) The share options were granted by COSCO Corporation (Singapore) on 24 May 2004 and are exercisable at any time between 24
May 2005 and 23 May 2009.
(vi) The share options were granted by COSCO Corporation (Singapore) on 6 April 2005 and are exercisable at any time between 6
April 2005 and 5 April 2010.

194
Notes to the Consolidated Financial Statements
China COSCO Holdings Company LimitedANNUAL REPORT 2005
41 Particulars of subsidiaries, jointly controlled entities and associates
(a) Subsidiaries
As at 31 December 2005, the Group had direct and indirect interests in the following principal subsidiaries:
Place of Attributable equity
incorporation/ Issued/registered interest to the
establishment Type of and fully paid equity holders
Name and operations Principal activities legal entity up share capital of the Company
2005 2004
Shares held directly
1 COSCO Container Lines PRC Container transportation Limited liability RMB2,380,000,000 100% 100%
Company Limited company
COSCO Pacific Investment Hong Kong Investment Limited liability 500 ordinary shares of 100% 100%
Holdings Limited # holding company HK$1,000 each
Shares held indirectly
COSCO Container PRC Shipping Limited liability RMB80,000,000 100% 100%
Shipping Agency agency company
Company Limited
COSCO International PRC Freight forwarding Limited liability RMB200,000,000 100% 100%
Freight Co., Ltd. and transportation company
3 COSCO Pacific Limited # Bermuda Investment holding Limited liability 2,198,966,298 52.03% 52.18%
company ordinary shares of
HK$0.1 each
COSCO Investments Limited # British Virgin Investment holding Limited liability 1 ordinary share of 100% 100%
Islands/ company US$1
Hong Kong
Dalian COSCO PRC Freight forwarding Limited liability RMB20,000,000 100% 100%
International Freight company
Co., Ltd.
COSCO Tianjin PRC Freight forwarding Limited liability RMB20,000,000 100% 100%
International Freight company
Co. Ltd.
COSCO Qingdao PRC Freight forwarding Limited liability RMB24,300,000 100% 100%
International Freight company
Co. Ltd.
COSCO Wuhan PRC Freight forwarding Limited liability RMB34,950,000 51% 51%
International Freight company
Co., Ltd.
COSCO Shanghai PRC Freight forwarding Limited liability RMB114,000,000 100% 100%
International Freight company
Co., Ltd.

195China COSCO Holdings Company Limited
ANNUAL REPORT 2005
41 Particulars of subsidiaries, jointly controlled entities and associates (Continued)
(a) Subsidiaries (Continued)
Place of Attributable equity
incorporation/ Issued/registered interest to the
establishment Type of and fully paid equity holders
Name and operations Principal activities legal entity up share capital of the Company
2005 2004
Shares held indirectly
COSCO Southern China PRC Freight forwarding Limited liability RMB10,000,000 100% —
International company
Freight Co., Ltd.
COSCO Xiamen PRC Freight forwarding Limited liability RMB7,560,000 100% 100%
International Freight company
Co., Ltd.
COSCO Beijing PRC Freight forwarding Limited liability RMB5,705,600 100% 100%
International Freight company
Co., Ltd.
COSCO Xian PRC Freight forwarding Limited liability RMB8,000,000 100% 100%
International Freight company
Co., Ltd.
COSCO Seabow PRC Freight forwarding Sino-Foreign USD1,000,000 70% 70%
International Freight joint venture
Co., Ltd.
Welley Shipping Company PRC Domestic transportation Limited liability RMB13,000,000 100% 100%
(China) Limited agency company
COSCO Qingdao Container PRC Shipping agency Limited liability RMB10,000,000 100% 100%
Shipping Agency company
Co., Ltd.
COSCO Shanghai Container PRC Shipping agency Limited liability RMB10,000,000 100% 100%
Shipping Agency company
Co., Ltd.
COSCO Dalian Container PRC Shipping agency Limited liability RMB3,000,000 100% 100%
Shipping Agency company
Co., Ltd.
COSCO Guangzhou Container PRC Shipping agency Limited liability RMB16,000,000 100% 100%
Shipping Agency company
Co., Ltd.
COSCO Xiamen Container PRC Shipping agency Limited liability RMB10,000,000 100% 100%
Shipping Agency company
Co., Ltd.
COSCO Shenzhen Container PRC Shipping agency Limited liability RMB5,000,000 100% 100%
Shipping Agency company
Co., Ltd.

196
Notes to the Consolidated Financial Statements
China COSCO Holdings Company LimitedANNUAL REPORT 2005
41 Particulars of subsidiaries, jointly controlled entities and associates (Continued)
(a) Subsidiaries (Continued)
Place of Attributable equity
incorporation/ Issued/registered interest to the
establishment Type of and fully paid equity holders
Name and operations Principal activities legal entity up share capital of the Company
2005 2004
Shares held indirectly (Continued)
4 COSCO Tianjin Container PRC Shipping agency Limited liability RMB15,000,000 51% 51%
Shipping Agency company
Co., Ltd.
4 Shanghai O G Enterprise PRC Freight forwarding Limited liability US$4,000,000 70% 70%
Co., Ltd. company
Shanghai Pan Asia Shipping PRC International ocean Limited liability RMB668,800,000 100% 100%
Company Limited shipping, national company
inshore and inland
river internal trade
containers transportation
COSCO Information and PRC Software developing, Sino-foreign equity US$250,000 60% 60%
Technology (Shanghai) Ltd. technical service and joint venture
supporting
China Ocean Shipping Canada Shipping agency Limited liability 400,000 shares of 100% 100%
(Canada) Inc. company US$4.67 each
China Ocean Shipping Canada Shipping agency Limited liability 100 shares of 100% 100%
(East Canada) Inc. company US$0.7 each
COSCO Agencies United States of America Shipping agency Limited liability 1,000 shares of 100% 100%
(Los Angeles), Inc. company US$0.1 each
COSCON France SAS France Freight forwarding Limited liability 500 shares of 100% 100%
(formerly Air Sea Lines Sarl) company EURO16 each
COSCON (UK) Ltd United Kingdom Shunting and Limited liability 100 shares of GBP1 each 100% 100%
(formerly JNF Services Limited) haulage contracting company
COSCO Belgium NV Belgium Shipping agency Limited liability 100 shares of 100% 100%
company EURO1,250 each
COSCO Iberia Ship Agency, Spain Shipping agency Limited liability 10,000 shares of 70% 70%
S.A. company EURO6.02 each
COSCO Container Hong Kong Shipping agency Limited liability 1,000,000 shares of 100% 100%
Line Agencies Limited # company HK$1 each
North Star Shipholding Panama/Japan Vessel owning and Limited liability 1,000 shares of 100% 100%
Ltd. S.A. chartering company US$1 each
COSCO Japan Express Ltd Japan Shipping agency Limited liability 10,000,000 shares of 100% —
company JPY 1 each

197China COSCO Holdings Company Limited
ANNUAL REPORT 2005
41 Particulars of subsidiaries, jointly controlled entities and associates (Continued)
(a) Subsidiaries (Continued)
Place of Attributable equity
incorporation/ Issued/registered interest to the
establishment Type of and fully paid equity holders
Name and operations Principal activities legal entity up share capital of the Company
2005 2004
Shares held indirectly (Continued)
COSKOR Shipping Co., Ltd. Korea Freight forwarding Limited liability 60,000 shares of 100% 100%
(formerly COSCO Logistics company KRW5,000 each
(Korea) Co., Ltd.) #
Wonseong Shipping Co., Ltd. Korea Shipping agency Limited liability 50,000 shares of 100% 100%
(formerly Coshan Shipping company KRW5,000 each
Co., Ltd.) #
Freightworld Pte Ltd. Singapore Shipping agency and Limited liability 200,000 shares of 100% 100%
freight forwarding company SGD 1 each
Freightworld (M) Sdn. Bhd Malaysia Shipping agency and Limited liability 100,000 shares of 100% 100%
freight forwarding company RM1 each
Five Star Shipping and Australia Shipping agency Limited liability 100,000 shares of 100% 100%
Agency Company company AUD 1 each
Pty. Ltd.
BPSC International Australia Freight forwarding Limited liability 110,000 shares of 100% 100%
Shipping & Cargo company AUD 1 each
Service Pty Ltd.
COSCO (New Zealand) New Zealand Shipping agency and Limited liability 100,000 shares of 100% 100%
Limited freight forwarding company NZD 1 each
Green Leaf Promotions New Zealand Management service Limited liability 25,000 shares of 100% 100%
Limited company NZD 1 each
Cheer Hero Development Limited # Hong Kong Container handling, Limited liability 10,000 ordinary shares of 39.02% 39.14%
storage and company HK$10 each
stevedoring
COSCO Container Hong Kong Investment holding, Limited liability 2 ordinary shares of 52.03% 52.18%
Services Limited # depot handling, company HK$1 each
storage and
container repairing
COSCO Pacific (China) PRC Investment holding Limited liability US$37,496,000 52.03% 52.18%
Investments Co. , Ltd company
COSCO Pacific Finance (2003) British Virgin Islands/ Financing Limited liability 1 ordinary share of 52.03% 52.18%
Company Limited # Hong Kong company US$1
COSCO Pacific Logistics British Virgin Islands/ Investment holding Limited liability 1 ordinary share of 52.03% 52.18%
Company Limited Hong Kong company US$1

198
Notes to the Consolidated Financial Statements
China COSCO Holdings Company LimitedANNUAL REPORT 2005
41 Particulars of subsidiaries, jointly controlled entities and associates (Continued)
(a) Subsidiaries (Continued)
Place of Attributable equity
incorporation/ Issued/registered interest to the
establishment Type of and fully paid equity holders
Name and operations Principal activities legal entity up share capital of the Company
2005 2004
Shares held indirectly (Continued)
Florens Container Macau/ Sale of old Limited liability 1 quota (share) of 52.03% 52.18%
(Macao Commercial Offshore) Worldwide containers and company MOP100,000
Limited # administration of
marine shipping
container activities
Florens Container Corporation S.A. # Panama/ Container leasing Limited liability 100 ordinary shares of 52.03% 52.18%
Worldwide company US$100 each
Florens Container Holdings Limited # British Virgin Islands/ Investment holding Limited liability 22,014 ordinary shares of 52.03% 52.18%
Hong Kong company US$1 each
Florens Container Inc. # United States of Container leasing Limited liability 1 ordinary share of US$1 52.03% 52.18%
America company
Florens Container, Inc. (1998) # United States of Container leasing Limited liability 100 ordinary shares of 52.03% 52.18%
America company US$1 each
Florens Container Inc. (1999) # United States of Container leasing Limited liability 100 ordinary shares of 52.03% 52.18%
America company US$1 each
Florens Container, Inc. (2000) # United States of Container leasing Limited liability 100 ordinary shares of 52.03% 52.18%
America company US$1 each
Florens Container, Inc. (2001) # United States of Container leasing Limited liability 1 ordinary share of 52.03% 52.18%
America company US$1
Florens Container, Inc. (2002) # United States of Sale of old containers Limited liability 1 ordinary share of 52.03% 52.18%
America company US$1
Florens Container, Inc. (2003) # United States of Container leasing Limited liability 1 ordinary share of 52.03% 52.18%
America company US$1
Florens Container, Inc. (2004) # United States of Container leasing Limited liability 1 ordinary share of 52.03% 52.18%
America company US$1
Florens Container, Inc. (2005) United States of Container leasing Limited liability 1 ordinary share of 52.03% —
America company US$1
Florens Container Services Australia Provision of container Limited liability 100 ordinary shares of 52.03% 52.18%
(Australia) Pty Limited management services company AUD1 each
Florens Container Services Hong Kong/ Provision of container Limited liability 100 ordinary shares of 52.03% 52.18%
Company Limited # Worldwide management services company HK$1 each
Florens Container Services Germany Provision of container Limited liability 2 shares of 52.03% 52.18%
(Deutschland) GmbH. management services company EURO 12,782.30 each

199China COSCO Holdings Company Limited
ANNUAL REPORT 2005
41 Particulars of subsidiaries, jointly controlled entities and associates (Continued)
(a) Subsidiaries (Continued)
Place of Attributable equity
incorporation/ Issued/registered interest to the
establishment Type of and fully paid equity holders
Name and operations Principal activities legal entity up share capital of the Company
2005 2004
Shares held indirectly (Continued)
Florens Container Services Italy Provision of container Limited liability 20,000 quotas of 52.03% 52.18%
(Italy) S.R.L. management services company EURO 0.52 each
Florens Container Services Japan Provision of container Limited liability 200 ordinary shares of 52.03% 52.18%
(Japan) Co., Ltd. management services company JPY 50,000 each
Florens Container Services United Kingdom Provision of container Limited liability 183,610 ordinary shares of 52.03% 52.18%
(UK) Limited management services company GBP1 each
Florens Container Services United States of America Provision of container Limited liability 1,000 ordinary shares of 52.03% 52.18%
(USA), Ltd. management services company US$0.001 each
Florens Management Services Macau Provision of container Limited liability 1 quota (share) of 52.03% 52.18%
(Macao Commercial Offshore) management services company MOP100,000
Limited #
Florens Shipping Corporation Bermuda/ Container leasing Limited liability 12,000 ordinary shares of 52.03% 52.18%
Limited # Worldwide company US$1 each
Greating Services Limited # Hong Kong Transportation of Limited liability 250,000 ordinary shares of 52.03% 52.18%
containers company HK$1 each
Zhangjiagang Win Hanverky PRC Operation of container Sino-foreign US$16,800,000 26.54% 26.62%
Container Terminal terminal joint venture
Co., Ltd.
COSCO (Cayman) Mercury Cayman Islands/ Investment holding Limited liability 50,000 ordinary shares of 100% 100%
Co., Ltd. # Singapore company US$1 each
Honor River Maritime Inc. Panama/ Vessel owning and Limited liability 2 ordinary shares of 100% 100%
Worldwide chartering company US$100 each
Starry Shipping Inc. Panama/ Vessel owning and Limited liability 2 ordinary shares of 100% 100%
Worldwide chartering company US$100 each
Pretty River Shipping Inc. Panama/ Vessel owning and Limited liability 2 ordinary shares of 100% 100%
Worldwide chartering company US$100 each
Dainty River Shipping Inc. Panama/ Vessel owning and Limited liability 2 ordinary shares of 100% 100%
Worldwide chartering company US$100 each
Sky Manna Maritime Inc. Panama/ Vessel owning and Limited liability 2 ordinary shares of 100% 100%
Worldwide chartering company US$100 each
Golden Cascade Corporation # Liberia/ Vessel owning and Limited liability 100 ordinary shares of 100% 100%
Worldwide chartering company US$100 each

200
Notes to the Consolidated Financial Statements
China COSCO Holdings Company LimitedANNUAL REPORT 2005
41 Particulars of subsidiaries, jointly controlled entities and associates (Continued)
(a) Subsidiaries (Continued)
Place of Attributable equity
incorporation/ Issued/registered interest to the
establishment Type of and fully paid equity holders
Name and operations Principal activities legal entity up share capital of the Company
2005 2004
Shares held indirectly (Continued)
Golden Shore Corporation # Liberia/ Vessel owning and Limited liability 100 ordinary shares of 100% 100%
Worldwide chartering company US$100 each
2 Buyihe Shipping Inc. # Panama/ Vessel owning and Limited liability 100 ordinary shares of 100% 100%
Worldwide chartering company US$100 each
Chaoshanhe Maritime Inc. # Panama/ Vessel owning and Limited liability 100 ordinary shares of 100% 100%
Worldwide chartering company US$100 each
Chuanhe Shipping Inc. # Panama/ Vessel owning and Limited liability 100 ordinary shares of 100% 100%
Worldwide chartering company US$100 each
2 Caiyunhe Maritime Inc. # Panama/ Vessel owning and Limited liability 100 ordinary shares of 100% 100%
Worldwide chartering company US$100 each
2 COSCO Line New Jersey Panama/ Vessel owning and Limited liability 100 ordinary shares of 100% 100%
Shipping Inc. # Worldwide chartering company US$100 each
2 COSCO Line New York Panama/ Vessel owning and Limited liability 100 ordinary shares of 100% 100%
Shipping Inc. # Worldwide chartering company US$100 each
Daqinghe Shipping Inc. # Panama/ Vessel owning and Limited liability 100 ordinary shares of 100% 100%
Worldwide chartering company US$100 each
2 Hanihe Shipping Inc. # Panama/ Vessel owning and Limited liability 100 ordinary shares of 100% 100%
Worldwide chartering company US$100 each
Hutuohe Shipping Inc. # Panama/ Vessel owning and Limited liability 100 ordinary shares of 100% 100%
Worldwide chartering company US$100 each
2 Jingpohe Shipping Inc. # Panama/ Vessel owning and Limited liability 100 ordinary shares of 100% 100%
Worldwide chartering company US$100 each
2 Jinyunhe Maritime Inc. # Panama/ Vessel owning and Limited liability 1,000 ordinary shares of 100% 100%
Worldwide chartering company US$10 each
2 Luhe Shipping Inc. # Panama/ Vessel owning and Limited liability 10,000 ordinary shares of 100% 100%
Worldwide chartering company US$1 each
2 Lubahe Shipping Inc. # Panama/ Vessel owning and Limited liability 100 ordinary shares of 100% 100%
Worldwide chartering company US$100 each
Daqinghe Shipping Inc. # Panama/ Vessel owning and Limited liability 100 ordinary shares of 100% 100%
Worldwide chartering company US$100 each
Miyunhe Maritime Inc. # Panama/ Vessel owning and Limited liability 1,000 ordinary shares of 100% 100%
Worldwide chartering company US$10 each

201China COSCO Holdings Company Limited
ANNUAL REPORT 2005
41 Particulars of subsidiaries, jointly controlled entities and associates (Continued)
(a) Subsidiaries (Continued)
Place of Attributable equity
incorporation/ Issued/registered interest to the
establishment Type of and fully paid equity holders
Name and operations Principal activities legal entity up share capital of the Company
2005 2004
Shares held indirectly (Continued)
2 Naxihe Shipping Inc. # Panama/ Vessel owning and Limited liability 100 ordinary shares of 100% 100%
Worldwide chartering company US$100 each
2 Ninghe Shipping Inc. # Panama/ Vessel owning and Limited liability 10,000 ordinary shares of 100% 100%
Worldwide chartering company US$100 each
Qiyunhe Maritime Inc. # Panama/ Vessel owning and Limited liability 1,000 ordinary shares of 100% 100%
Worldwide chartering company US$10 each
Wanhe Shipping Inc. # Panama/ Vessel owning and Limited liability 10,000 ordinary shares of 100% 100%
Worldwide chartering company US$1 each
2 Xibohe Shipping Inc. # Panama/ Vessel owning and Limited liability 100 ordinary shares of 100% 100%
Worldwide chartering company US$100 each
Xinhuihe Maritime Inc. # Panama/ Vessel owning and Limited liability 100 ordinary shares of 100% 100%
Worldwide chartering company US$100 each
Yangjianghe Maritime Inc. # Panama/ Vessel owning and Limited liability 100 ordinary shares of 100% 100%
Worldwide chartering company US$100 each
Yongdinghe Shipping Inc. # Panama/ Vessel owning and Limited liability 100 ordinary shares of 100% 100%
Worldwide chartering company US$100 each
Yuehe Shipping Inc. # Panama/ Vessel owning and Limited liability 10,000 ordinary shares of 100% 100%
Worldwide chartering company US$1 each
2 Yuguhe Shipping Inc. # Panama/ Vessel owning and Limited liability 100 ordinary shares of 100% 100%
Worldwide chartering company US$100 each
2 Yunhe Shipping Inc. # Panama/ Vessel owning and Limited liability 10,000 ordinary shares of 100% 100%
Worldwide chartering company US$100 each
Zhaoqinghe Maritime Inc. # Panama/ Vessel owning and Limited liability 100 ordinary shares of 100% 100%
Worldwide chartering company US$100 each
Ziyahe Shipping Inc. # Panama/ Vessel owning and Limited liability 100 ordinary shares of 100% 100%
Worldwide chartering company US$100 each
Fenghou Maritime Inc. # Panama/ Vessel owning and Limited liability 1,000 ordinary shares of 100% 100%
Worldwide chartering company US$10 each
Haihou Maritime Inc. # Panama/ Vessel owning and Limited liability 1,000 ordinary shares of 100% 100%
Worldwide chartering company US$10 each
Longhou Maritime Inc. # Panama/ Vessel owning and Limited liability 1,000 ordinary shares of 100% 100%
Worldwide chartering company US$10 each

202
Notes to the Consolidated Financial Statements
China COSCO Holdings Company LimitedANNUAL REPORT 2005
41 Particulars of subsidiaries, jointly controlled entities and associates (Continued)
(a) Subsidiaries (Continued)
Place of Attributable equity
incorporation/ Issued/registered interest to the
establishment Type of and fully paid equity holders
Name and operations Principal activities legal entity up share capital of the Company
2005 2004
Shares held indirectly (Continued)
Tianhou Maritime Inc. # Panama/ Vessel owning and Limited liability 1,000 ordinary shares of 100% 100%
Worldwide chartering company US$10 each
COSCO Charleston Panama/ Vessel owning Limited liability 1,000 ordinary shares of 100% 100%
Maritime Inc. # Worldwide company US$10 each
COSCO New York Panama/ Vessel owning Limited liability 1,000 ordinary shares of 100% 100%
Maritime Inc. # Worldwide company US$10 each
COSCO Boston Maritime Inc. # Panama/ Vessel owning Limited liability 1,000 ordinary shares of 100% 100%
Worldwide company US$10 each
COSCO Norfolk Maritime Inc. # Panama/ Vessel owning Limited liability 100 ordinary shares of 100% 100%
Worldwide company US$100 each
COSCO Asia Maritime Inc. # Panama/ Vessel owning Limited liability 1,000 ordinary shares of 100% —
Worldwide company US$10 each
COSCO Africa Maritime Inc. # Panama/ Vessel owning Limited liability 1,000 ordinary shares of 100% —
Worldwide company US$10 each
COSCO Europe Maritime Inc. # Panama/ Vessel owning Limited liability 1,000 ordinary shares of 100% —
Worldwide company US$10 each
COSCO America Maritime Inc. # Panama/ Vessel owning Limited liability 1,000 ordinary shares of 100% —
Worldwide company US$10 each
COSCO Oceania Shipping Limited. # Hong Kong/ Vessel owning Limited liability 10,000 ordinary shares of 100% —
Worldwide company US$1 each
COSCO Pacific Shipping Limited. # Hong Kong/ Vessel owning Limited liability 10,000 ordinary shares of 100% —
Worldwide company US$1 each
COSCO Indian Ocean Shipping Hong Kong/ Vessel owning Limited liability 10,000 ordinary shares of 100% —
Limited # Worldwide company US$1 each
COSCO Atlantic Shipping Limited. # Hong Kong/ Vessel owning Limited liability 10,000 ordinary shares of 100% —
Worldwide company US$1 each
COSCO Container Lines Hong Kong Marine services Limited liability 1,000,000 shares of 100% 100%
(Hong Kong) Co., Limited. # company HK$1 each
COSCO Container Lines German/Europe Shipping agency Limited liability EURO1,500,000 100% 100%
Europe GmbH # company

203China COSCO Holdings Company Limited
ANNUAL REPORT 2005
41 Particulars of subsidiaries, jointly controlled entities and associates (Continued)
(a) Subsidiaries (Continued)
Place of Attributable equity
incorporation/ Issued/registered interest to the
establishment Type of and fully paid equity holders
Name and operations Principal activities legal entity up share capital of the Company
2005 2004
Shares held indirectly (Continued)
COSCO Container Lines Japan Japan Marine services Limited liability JPY40,000,000 100% 100%
Co., Ltd. company
COSCO Container Lines United States of Shipping agency Limited liability 1,000 ordinary shares of 100% —
Americas, Inc. America company US$0.01 each
Coheung Marine Shipping Hong Kong/ Marine transportation Limited liability 2,980,000 shares of 100% —
Company Limited # Korea company US$1 each
COSCO (Cayman) Golden Cayman Islands/ Treasury Limited liability 1,000 shares of 100% 100%
Company Limited # Worldwide company US$1 each
# Subsidiaries audited by PricewaterhouseCoopers
1 In June 2005, COSCO Container Lines Company Limited reduced its registered capital from RMB6,100,000,000 to
RMB2,380,000,000.
2 Shares of these subsidiaries have been pledged to banks as securities for loan facilities granted (note 23(i)).
3 All shares of COSCO Pacific held by the Group have been held as custody for loan facilities granted to a subsidiary by banks.
4 Those companies were classified as jointly controlled entities as at 31 December 2004.

204
Notes to the Consolidated Financial Statements
China COSCO Holdings Company LimitedANNUAL REPORT 2005
41 Particulars of subsidiaries, jointly controlled entities and associates (Continued)
(b) Jointly controlled entities
As at 31 December 2005, the subsidiaries of the Group had direct interests in the following principal jointly controlled
entities:
Percentage of interest
in ownership/
votingpower/
Place of profit sharing
incorporation/ Issued/registered attributable to the
establishment Principal Type of and fully paid equity holders
Name and operations activities legal entity up share capital of the Company
2005 2004
COSCON Italy S.R.L. Italy Ocean transportation Limited liability 100,000 shares of 50% —
company EURO 1 each
COSCO-HIT Hong Kong Operation of Limited liability 2 “A” ordinary shares of 26.02%/ 26.09%/
Terminals (Hong Kong) container terminal company HK$10 each and 26.02%/ 26.09%/
Limited 2 “B” ordinary shares of 26.02% 26.09%
HK$10 each
4 non-voting
5% deferred shares of
HK$10 each
Qingdao Cosport PRC Operation of container Sino-Foreign RMB337,868,700 26.02%/ 26.09%/
International Container terminal joint venture 26.02%/ 26.09%/
Terminals Co., Ltd. 26.02% 26.09%
Shanghai CIMC Reefer Containers PRC Container manufacturing Sino-Foreign US$31,000,000 10.41%/ 10.44%/
Co., Ltd. joint venture 11.13%/ 11.17%/
10.41% 10.44%
Shanghai CIMC Far East Container PRC In liquidation Sino-Foreign US$9,480,000 10.41%/ 10.44%/
Co., Ltd. (note) joint venture 10.41%/ 10.44%
10.41% 10.44%/
Tianjin CIMC North PRC Container manufacturing Sino-Foreign US$16,682,000 11.71%/ 11.75%/
Ocean Container joint venture 10.41%/ 10.44%/
Co., Ltd. (note) 11.71% 11.75%
Qingdao Qianwan Container PRC Operation of container Sino-Foreign US$199,962,500 10.44%/ 10.41%/
Terminal Co., Ltd. terminal joint venture 9.49%/ 9.46%/
10.44% 10.41%

205China COSCO Holdings Company Limited
ANNUAL REPORT 2005
41 Particulars of subsidiaries, jointly controlled entities and associates (Continued)
(b) Jointly controlled entities (Continued)
Percentage of interest
in ownership/
votingpower/
Place of profit sharing
incorporation/ Issued/registered attributable to the
establishment Principal Type of and fully paid equity holders
Name and operations activities legal entity up share capital of the Company
2005 2004
COSCO Logistics Co., Ltd. PRC Shipping agency, Sino-Foreign RMB1,582,029,851 25.49%/ 25.57%/
freight forwarding, joint venture 23.12%/ 23.19%/
third party logistics and 25.49% 25.57%
supporting services
Yangzhou Yuanyang PRC Operation of container Sino-Foreign US$29,800,000 28.92%/ 29.01%/
International Ports terminal joint venture 26.02%/ 26.09%/
Co., Ltd. 28.92% 29.01%
Yingkou Container Terminals PRC Operation of container Sino-Foreign RMB8,000,000 26.02%/ 26.09%/
Company Limited terminal joint venture 29.73%/ 29.82%/
26.02% 26.09%
COSCO-PSA Terminal Singapore Operation of container Limited liability SGD48,900,000 25.49%/ 25.57%/
Private Limited terminal company 26.02%/ 26.09%/
25.49% 25.57%
Nanjing Port Longtan PRC Operation of container Limited liability RMB474,000,000 10.41%/ —
Container Co., Ltd. terminal company 11.56%/ —
10.41% —
COSCO Container Lines Netherlands Shipping agency Limited liability EURO18,000 50% —
(Netherlands) B.V. company
Note: During the year ended 31 December 2004, the Group’s share of the results of its jointly controlled entities, Shanghai CIMC
Far East Container Co., Ltd. and Tianjin CIMC North Ocean Container Co., Ltd. (collectively “Shanghai and Tianjin CIMC”),
were based on the guaranteed profits as stated in the relevant subcontracting agreements entered into with the venturer of
Shanghai and Tianjin CIMC. The guaranteed profit arrangements for Shanghai and Tianjin CIMC were valid for the period from
1 January 2000 to 31 December 2004.
Shanghai CIMC Far East Container Co., Ltd. (“Shanghai Far East”) commenced its liquidation in October 2005. The Directors
consider that the liquidation of Shanghai Far East will not have any material impact on the Group’s financial statements.
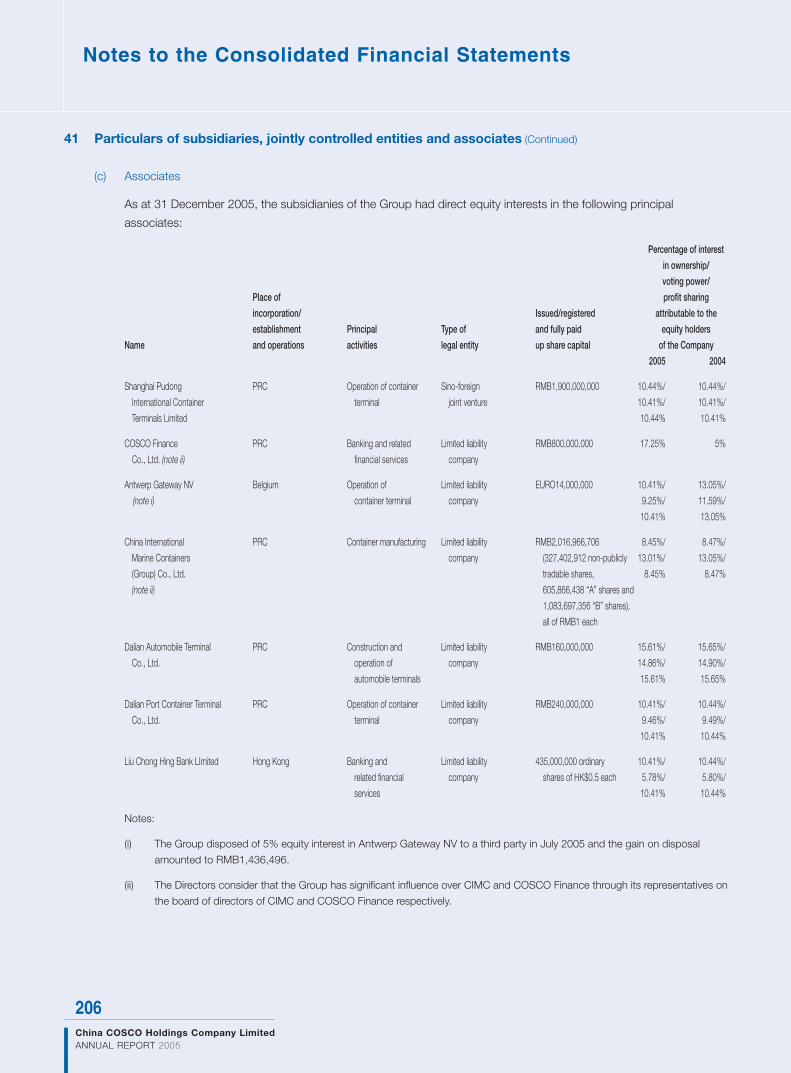
206
Notes to the Consolidated Financial Statements
China COSCO Holdings Company LimitedANNUAL REPORT 2005
41 Particulars of subsidiaries, jointly controlled entities and associates (Continued)
(c) Associates
As at 31 December 2005, the subsidianies of the Group had direct equity interests in the following principal
associates:
Percentage of interest
in ownership/
voting power/
Place of profit sharing
incorporation/ Issued/registered attributable to the
establishment Principal Type of and fully paid equity holders
Name and operations activities legal entity up share capital of the Company
2005 2004
Shanghai Pudong PRC Operation of container Sino-foreign RMB1,900,000,000 10.44%/ 10.44%/
International Container terminal joint venture 10.41%/ 10.41%/
Terminals Limited 10.44% 10.41%
COSCO Finance PRC Banking and related Limited liability RMB800,000,000 17.25% 5%
Co., Ltd. (note ii) financial services company
Antwerp Gateway NV Belgium Operation of Limited liability EURO14,000,000 10.41%/ 13.05%/
(note i) container terminal company 9.25%/ 11.59%/
10.41% 13.05%
China International PRC Container manufacturing Limited liability RMB2,016,966,706 8.45%/ 8.47%/
Marine Containers company (327,402,912 non-publicly 13.01%/ 13.05%/
(Group) Co., Ltd. tradable shares, 8.45% 8.47%
(note ii) 605,866,438 “A” shares and
1,083,697,356 “B” shares),
all of RMB1 each
Dalian Automobile Terminal PRC Construction and Limited liability RMB160,000,000 15.61%/ 15.65%/
Co., Ltd. operation of company 14.86%/ 14.90%/
automobile terminals 15.61% 15.65%
Dalian Port Container Terminal PRC Operation of container Limited liability RMB240,000,000 10.41%/ 10.44%/
Co., Ltd. terminal company 9.46%/ 9.49%/
10.41% 10.44%
Liu Chong Hing Bank LImited Hong Kong Banking and Limited liability 435,000,000 ordinary 10.41%/ 10.44%/
related financial company shares of HK$0.5 each 5.78%/ 5.80%/
services 10.41% 10.44%
Notes:
(i) The Group disposed of 5% equity interest in Antwerp Gateway NV to a third party in July 2005 and the gain on disposal
amounted to RMB1,436,496.
(ii) The Directors consider that the Group has significant influence over CIMC and COSCO Finance through its representatives on
the board of directors of CIMC and COSCO Finance respectively.

207China COSCO Holdings Company Limited
ANNUAL REPORT 2005
41 Particulars of subsidiaries, jointly controlled entities and associates (Continued)
All subsidiaries, jointly controlled entities and associates are private companies, or if incorporated or established outside
Hong Kong, have substantially the same characteristics as a Hong Kong incorporated private company.
The English names of certain subsidiaries, jointly controlled entities and associates referred to in the Consolidated Financial
Statements represent management’s best efforts at translating the Chinese names of these companies as no English
names have been registered.
42 Comparatives
The Group has adopted new/revised HKFRSs which are effective for accounting periods commencing on or after 1 January
2005. As mentioned in note 2(b) to the Consolidated Financial Statements, this has resulted in changes to the presentation
of certain items and the comparative figures have been restated. In addition, certain comparative figures have been
reclassified to confirm with the current year’s presentation.
43 Events after the balance sheet date
As at 31 December 2005, a wholly owned subsidiary of COSCO Pacific holds 327,402,912 of non-publicly tradable shares
of CIMC (the “CIMC Shares”). On 13 March 2006, CIMC announced that, after the consultation with The Shenzhen Stock
Exchange (the “SZSE”), it will commence the necessary procedures under the Equity Division Reform (the “CIMC’s
Reform”).
On 4 April 2006 and 11 April 2006, the Company announced the COSCO Pacific’s proposal for the conversion of the CIMC
Shares to become tradable in the SZSE “A” share market (the “Proposal”). Under the Proposal, COSCO Pacific will grant
put-option certificates (the “Put-options”) to the holders of CIMC tradable A shares (the “A-Share Equity Holders”) in the
proportion of 7 Put-options for every 10 CIMC tradable A shares being hold by these A-Share Equity Holders. With these
Put-options, the A-Share Equity Holders are entitled to sell certain portion of their CIMC tradable A shares to COSCO
Pacific at an exercise price of RMB10 per share during a pre-defined exercisable period. The impact of the Proposal on the
Group’s future financial results and position largely depends on the future market prices of CIMC tradable A shares and the
Put-options which will be listed and tradable on the SZSE. On the assumption that all the Put-options are exercised in full
upon the expiry date, COSCO Pacific has to pay a total sum of approximately RMB4,241,000,000 in cash to acquire
certain portion of the CIMC tradable A shares from the A-Share Equity Holders and COSCO Pacific’s equity interest in
CIMC will then be increased from 16.23% to 37.26%.
The implementation of the Proposal is conditional upon the requisite approval of shareholders of CIMC on 28 April 2006
and the fulfilment of certain condition precedents as set out in the Proposal. If the Proposal is not being approved, COSCO
Pacific has to provide another proposal for the CIMC’s Reform and different proposal will have different financial implications
on the Group’s financial statements.

208
Financial Summary
China COSCO Holdings Company LimitedANNUAL REPORT 2005
For the year ended 31 December
2005 2004 2003 2002
RMB’000 RMB’000 RMB’000 RMB’000
(Restated) (Restated) (Restated)
Turnover 39,165,710 32,188,669 25,852,874 20,925,740
Operating profit/(loss) after finance costs 6,186,480 4,405,956 2,050,206 (883,487)................................................................................................................................................................................................................................................................................................................................................................................................
Share of profits less losses of jointly controlled
entities and associates 1,263,770 837,344 481,202 432,591................................................................................................................................................................................................................................................................................................................................................................................................
Profit/(loss) before income tax 7,450,250 5,243,300 2,531,408 (450,896)................................................................................................................................................................................................................................................................................................................................................................................................
Income tax (651,319) (285,757) (177,506) (146,757)................................................................................................................................................................................................................................................................................................................................................................................................
Profit/(loss) for the year 6,798,931 4,957,543 2,353,902 (597,653)
Profit/(loss) attributable to:
- Equity holders of the Company 5,450,805 4,157,960 1,742,228 (1,196,183)................................................................................................................................................................................................................................................................................................................................................................................................
- Minority interests 1,348,126 799,583 611,674 598,530................................................................................................................................................................................................................................................................................................................................................................................................
6,798,931 4,957,543 2,353,902 (597,653)
As at 31 December
2005 2004 2003 2002
RMB’000 RMB’000 RMB’000 RMB’000
(Restated) (Restated) (Restated)
Total assets 51,675,654 44,249,567 39,124,943 40,625,251
Total liabilities (25,730,562) (30,847,045) (31,893,227) (35,191,410)
Total equity 25,945,092 13,402,522 7,231,716 5,433,841
Note:
The financial figures for the year 2004 and 2005 were extracted from the audited consolidated financial statements whilst the financial figures for
the year 2002 and 2003 were derived from the accountants’ report of the Company’s prospectus dated 20 June 2005 with adjustments following
the adoption of HKFRS.

ANNUAL REPORT 2005
��
��
��
����
�
���
China COSCO Holdings Company Limited12th Floor, Ocean Plaza, 158 Fuxingmennei Street, Beijing,
the People's Republic of China
http://www.chinacosco.com ����� ����� �����