emu and labour market flexibility - bbcnews.bbc.co.uk/2/shared/spl/hi/europe/03/euro/pdf/8.pdf ·...
TRANSCRIPT

EMU study
EMU and labour marketflexibility


EMU and labour marketflexibility
EMU study
This study has been prepared by HM Treasury toinform the assessment of the five economic tests

© Crown copyright 2003
The text in this document (excluding the Royal Coat of Arms and departmental logos)may be reproduced free of charge in any format or medium providing that it isreproduced accurately and not used in a misleading context. The material must beacknowledged as Crown copyright and the title of the document specified.
Any enquiries relating to the copyright in this document should be sent to:
HMSOLicensing DivisionSt Clements House2-16 ColegateNorwichNR3 1BQ
Fax: 01603 723000
E-mail: [email protected]
Printed by the Stationery Office 2003 799366
This study has benefited from review by Professor Christopher Pissarides, workingin a personal capacity as an academic consultant to HM Treasury. All content,conclusions, errors and omissions in this study are, however, the responsibility of HMTreasury alone.
This is one of a set of detailed studies accompanying HM Treasury’s assessment of thefive economic tests. The tests provide the framework for analysing the UKGovernment’s decision on membership of Economic and Monetary Union (EMU).The studies have been undertaken and commissioned by the Treasury.
These studies and the five economic tests assessment are available on the Treasurywebsite at:
www.hm-treasury.gov.uk
For further information on the Treasury and its work, contact:
HM Treasury Public Enquiry Unit1 Horse Guards RoadLondonSW1A 2HQ
E-mail: [email protected]

CO N T E N T S
Page
Executive summary 1
1. The concept of labour market flexibility 7
2. Characteristics of flexible labour markets 13
3. Labour market outcomes 43
4. The institutional environment 61
5. Conclusions: flexibility in the UK and euro area 81
References 83
Annex A: Real wage flexibility 93
Annex B: An indicator of labour market flexibility 95


EX E C U T I V E SU M M A RY
1
1 Labour market flexibility describes how labour markets function. A flexible and efficientlabour market implies higher employment, and so an economy that is fairer (in terms of, forexample, reducing social exclusion), as well as more competitive and more productive. It alsoimplies an economy that is better able to adapt to the changing economic environment.
2 Labour market flexibility is a central element in determining the overall performance ofthe UK economy, irrespective of whether the UK decides to join Economic and MonetaryUnion (EMU).
3 However, a low level of flexibility could be more costly within EMU than outside it, sinceneither an independent monetary policy nor the sterling-euro exchange rate could beadjustment mechanisms in the face of economic shocks. Recognising this, an appraisal oflabour market performance was a central element of the Treasury’s 1997 assessment of thefive economic tests. That assessment concluded:
“In the UK, persistent long-term unemployment, lack of skills and in some areasinsufficient competition indicates insufficient flexibility to adapt to change and tomeet the new challenges of adjustment that a single currency would bring”. (HMTreasury, 1997, page 24.)
4 This study returns to the issue, building on and expanding the analysis undertaken inthe 1997 assessment. It analyses the flexibility of the UK labour market and also flexibility inexisting euro area economies, particularly developments since 1997. It does not, however,attempt to judge whether the level of labour market flexibility is sufficient for the UK to adjustto changes in the economic environment within the constraints of a monetary union. Thisissue is considered in the assessment of the flexibility test – the second of the Government’sfive economic tests for EMU entry.
5 Although labour market flexibility has been discussed widely, it has been defined in anumber of different ways. This study identifies two related concepts of labour marketflexibility. The first relates to how the labour market adjusts to a period of disequilibrium. Thisis achieved through a combination of adjustments in wages, the supply of labour and thedemand for labour. In this interpretation, flexibility is characterised by the rapidredeployment of labour between industries, occupations or regions, ensuring that anydisturbance to the labour market is short-lived.
6 The second concept relates to the institutional factors that determine the structurallevel of unemployment. In this interpretation, flexibility is characterised by high employmentand low structural unemployment rates. The two concepts are related because the long-termunemployed can often find it harder to re-enter employment than those who have beenunemployed for short periods. Since slow adjustment tends to raise the level of long-termunemployment, it also tends to raise the level of structural unemployment and may leadsome workers to withdraw from the labour market altogether.
7 With this in mind, the analysis in this study uses a new framework that considers thecharacteristics, outcomes and institutional environment of the labour market. Thisframework provides a rounded analysis of labour market performance and its determinants,allowing a consideration of current outcomes alongside indicators of likely futureperformance, i.e. whether current outcomes are likely to be sustained.
Concepts oflabour market
flexibility

EX E C U T I V E SU M M A RY
8 Section 2 discusses the different ways the labour market can adjust – the characteristicsof flexible labour markets. It looks at labour market adjustment in general but also identifiesthe specific forms of adjustment that are most relevant to EMU. It is not necessary for a well-performing labour market to be highly flexible on all of these counts, since high flexibility inone dimension may help to compensate for low flexibility in another. Nonetheless, greaterflexibility in each dimension will enable the labour market to operate more effectively andincrease its ability to adapt to changing economic conditions.
9 In most markets, price adjustment is an important factor enabling the market tofunction effectively. The labour market is no exception, with wage levels a major determinantof the supply of and demand for labour. Adjustment in the labour market primarily consistsof ensuring a smooth transfer of labour out of contracting industries and into expandingones. The level of relative wage flexibility needs to be sufficiently high to provide thenecessary incentives for labour to move.
10 Relative wage flexibility appears to be reasonably high in the UK. While the rate ofinflation remains a key benchmark in wage negotiations, there is considerable scope forvariations in wage settlements to reflect conditions in individual industries and regions.Wages appear to have adjusted to regional labour market conditions in the UK and the levelof responsiveness seems to have increased over time. That said, some institutional factors actto constrain relative wage flexibility, including the prevalence of national wage agreements incertain industries and sectors.
11 Aggregate real wage flexibility determines the overall balance of supply and demand inthe labour market and is a key substitute for the adjustment roles of the nominal exchangerate and an independent monetary policy. Although conceptually distinct from relative wageflexibility, the two are likely to be closely related, in particular when labour market adjustmentrequires a reallocation of labour at the sub-national level.
12 In the past, real wage flexibility has appeared relatively weak in the UK, and may havecontributed to the high unemployment experienced in the 1980s and early 1990s. But there isemerging evidence that the level of real wage flexibility has improved, including neweconometric work undertaken for this study. The fact that unemployment has declinedsharply in recent years without igniting inflationary pressures in the labour market suggeststhat the improvement is genuine. There is also some evidence of greater wage moderation inthe euro area.
13 Nominal wage rigidity can arise as a particular source of real wage rigidity, relating tothe fact that wages are adjusted at set intervals. Wages are generally adjusted annually in theUK, providing scope for a relatively high degree of nominal flexibility. The bonus componentof wages has also allowed private sector earnings to adjust in recent years. Downwardnominal rigidity could be a particular concern, since employees are naturally resistant tonominal wage cuts, and employers reluctant to impose them. In recent years, RPIX inflationhas been close to its target of 21/2 per cent a year and average earnings have increased byaround 41/2 per cent a year, providing considerable scope for movements in real and relativewages even where there is resistance to nominal wage cuts. However, this potential constraintcould be more severely tested if the UK were to join EMU since greater nominal wageflexibility may be needed to compensate for the fact that the exchange rate would be fixed.
14 While the analysis suggests there is a high degree of wage flexibility in the UK, this hasnot been fully tested in recent years, and there has been a relatively more stablemacroeconomic environment than in the past. Wage flexbility could be more severely testedif the UK decided to join EMU, where price movements would need to play a greater role inadjustment to shocks.
2
Characteristicsof flexible labour
markets

3
15 Wage flexibility is not the only adjustment mechanism operating in the labour market.Other characteristics serve to complement wage flexibility, by influencing the degree to whichmovements in relative or real wages induce changes in labour supply and demand. Inparticular, adjustment can occur through the reallocation of the workforce, between differentemployers, different locations or different tasks.
16 Geographic labour mobility appears to be relatively low both between and withinEuropean economies. This has been cited as evidence that the euro area might haveinsufficient flexibility to adjust to shocks. However, geographic mobility is an imperfectsubstitute for monetary policy given the latter’s role in responding to shocks that are morecyclical in nature. The importance of geographic mobility as an adjustment mechanism alsodepends on the level of flexibility in other dimensions. For example, high relative wageflexibility, functional flexibility and employment flexibility may reduce the need forgeographic mobility.
17 Employment flexibility represents the ability of employers to adapt working patterns tomeet the demands of prospective employees, and hence boost the available labour supply.The UK and other parts of Europe score well on this measure. A wide variety of workingpractices including part-time and flexible working arrangements enable employees tocombine employment with other activities and responsibilities.
18 The ability of the labour force to acquire and apply different skills, enabling them toadapt readily to technological change, is described as functional flexibility. The 1997assessment expressed concerns that skill shortages might constrain the ability of the UK torespond to the structural changes and increased competition that EMU might bring. Since1997, the steady decline in UK unemployment, including long-term unemployment, suggeststhat functional flexibility has been less of a constraint than the 1997 assessment suggested itmight be.
19 However, skill imbalances remain, in particular regarding the low level of intermediateskills in the UK and correspondingly high numbers with low skill levels. There is a modern rolefor trade unions to play in delivering functional flexibility, especially in the development ofskills. Employers, employees and the Government will need to continue to work together toensure that recent improvements are maintained.
20 The effectiveness of these adjustment mechanisms will be reflected in labour marketoutcomes, as discussed in Section 3. Labour market performance in the UK was poor duringthe 1970s and 1980s. Wage pressures in the labour market contributed to the poor inflationperformance during the 1970s, while ILO unemployment averaged around 91/2 per cent of thelabour force between 1981 and 1996. The Treasury’s 1997 assessment of the five economictests noted that the economy was then reaching a critical point in the economic cycle where,in the past, wage inflation would have accelerated, and that it remained too soon to tellwhether the performance of the labour market had improved or would revert to past patterns.It concluded that:
“In labour markets particularly, the UK has not yet achieved sufficient flexibility tomeet the challenges of EMU membership.” (HM Treasury, 1997, page 7.)
21 The performance of the UK labour market since 1997 shows more concrete signs ofimprovement. ILO unemployment has fallen further to slightly over 5 per cent of the labourforce and the employment rate is close to 75 per cent. Meanwhile wage pressures haveremained moderate and consistent with the Government’s inflation target and trendproductivity growth.
EX E C U T I V E SU M M A RY
Outcomes inflexible labour
markets
EX E C U T I V E SU M M A RY
22 This improved performance has carried through to the UK regional level where therehas been a reduction in the regional dispersion of unemployment rates, as the labour markethas been better able to match the supply of and demand for labour in individual regions.Regional claimant unemployment rates ranged from 2.4 per cent to 12.8 per cent in April1990, but this range had fallen to 1.7 per cent to 4.7 per cent in December 2002. However,challenges still remain to ensure employment opportunities for all.
23 The 1997 assessment also emphasised the importance of ensuring that specific groupsdid not become permanently detached from the labour market and, in particular, highlightedthe level of long-term unemployment as a key failing of the UK labour market. The level oflong-term ILO unemployment has fallen substantially from an annual average of 710,000 in1997 to 316,000 in October 2002. Moreover, since 1997 there have also been increases in theemployment rates of youth workers, older workers and lone parents. However, there remainsignificant challenges to reduce persistent economic inactivity and repeated periods ofworklessness, and to raise levels of employment in the most deprived areas and amongpeople from ethnic minorities.
24 Overall, the evidence on outcomes is consistent with a reduction in the non-accelerating inflation rate of unemployment (NAIRU). Estimates of the structural rate ofunemployment in the UK, which abstract from movements in the cycle, have fallen over the1990s to a level similar to the US, suggesting that there has been a structural improvement inthe UK labour market.
25 The 1997 assessment also noted that Europe as a whole needed to create jobs andrespond to structural change. Between 1997 and 2001 over 10 million jobs were created inEurope, and unemployment fell by 4 million, albeit from a high starting point. However,performance has been mixed, with falls in the structural unemployment rate more evident insome of the smaller EU Member States. The European employment strategy is now reviewedand coordinated on an annual basis under the Luxembourg Process. This strategy wasreinforced at the Lisbon European Council in 2000, when EU leaders agreed a strategy toenable Europe to become “the most competitive and dynamic knowledge-based economy inthe world, capable of sustaining economic growth with more and better jobs and greater socialcohesion”. Labour market reform needs to be pursued with renewed vigour in order to ensurethat the objectives of the Lisbon Programme are met and that EMU is a success.
26 The recent improvement in the UK labour market is attributable to a number ofinstitutional and policy factors, which are examined in Section 4. The design of the tax andbenefit system is critical to the operation of the labour market, with potential effects on boththe demand for and supply of labour. Care needs to be taken to provide an adequate level ofsocial insurance while ensuring that the operation of the tax and benefit system does noterode the incentive to seek work. Since 1997, the Government has implemented a number ofreforms to the UK tax and benefit system in order to make work pay, including reforms toincome tax, national insurance contributions and the introduction of a system of targeted taxcredits. OECD figures show that the UK has replacement rates (the ratio of out-of-work to in-work income) comparable to the US and lower than in many other European countries.
27 Labour market flexibility can be enhanced by active labour market policies, whichprovide incentives for employers to take on the long-term unemployed, and help theunemployed with their job search and the acquisition of new skills. Since 1997, theGovernment’s New Deal programmes have focused on raising employment rates, especiallyamong groups where employment rates have traditionally been below average. A number ofstudies have found that these schemes have enhanced participants’ ability to findemployment and have increased total employment and reduced total unemployment.
4
The institutionalenvironment and
labour marketflexibility

5
28 Well designed employment protection legislation (EPL) offers clear benefits toemployees and employers. But badly designed EPL can impose excessive costs on employersand deter them from offering jobs where the returns from creating the job are too low inrelation to the expected cost. Where this is the case, EPL acts as a barrier to labour marketflexibility. Measuring the impact of EPL on labour market flexibility is not straightforward,and the results need to be interpreted with care. Overall, EPL in the UK is less strict than inmany other OECD countries, and more conducive to labour market flexibility.
29 The National Minimum Wage was introduced in 1999 and underpins the Government’stax and benefit reforms. Because the National Minimum Wage sets a floor to wage levels, it ispotentially a barrier to labour market flexibility. The Government recognises that there is atrade-off between ensuring that it is sufficiently high to provide employees with an adequateminimum wage guarantee and making sure that it is not so high that it deters employers fromoffering jobs.
30 The evidence to date suggests that the National Minimum Wage has not compromisedthe flexibility of the labour market. The UK Government would still be able to determine thelevel of the National Minimum Wage within EMU and ensure that it was set at a level thatprovided a fair minimum income from work to recipients, without generating disincentivesto job creation.
31 Building on the results of econometric studies of the determinants of labour marketperformance, this study constructs a new indicator of labour market flexibility that combinesa variety of institutional factors in the labour market. This measure suggests that theinstitutional environment in the UK labour market compares favourably with that in manyother countries, and suggests that the improved labour market performance observed inrecent years is well founded.
32 The analysis of characteristics, outcomes and the institutional environment containedin this study provides a range of evidence which taken together points to an improvement inthe functioning of the UK labour market since 1997. There have been significant falls in thelevel of overall unemployment, long-term unemployment and the regional dispersion ofunemployment. Macroeconomic stability has undoubtedly contributed to these favourableoutcomes, but another important element has been that the institutional environment hasfostered labour market flexibility.
33 But, despite evidence of improvement in the UK labour market, major challengesremain. More progress is needed to advance the Government’s long-term goal of employmentopportunities for all; in particular, to reduce persistent inactivity and repeated spells ofworklessness. In addition, wage flexibility has not been fully tested in recent years and couldbe more severely tested if the UK decided to join EMU.
34 Progress across the rest of Europe has been mixed, with more concrete signs ofimprovement being evident in some of the smaller EU Member States. Progress in the largerEU economies has been slower and starts from a weak position in terms of unemploymentand employment levels. Continued progress on structural reform will ensure that all ofEurope’s labour markets work to their full potential, raising employment and reducingunemployment to the benefit of Europe. Improved labour market flexibility will also enablethe existing and prospective euro area members to better reap the potential benefits of EMU.
35 These issues are considered in the assessment of the flexibility test – the second of theGovernment’s five economic tests for EMU entry.
EX E C U T I V E SU M M A RY
Conclusions

6

1 TH E CO N C E P T O F L A B O U R MA R K E T
FL E X I B I L I T Y
7
INTRODUCTION
1.1 The UK Government’s central economic objective is to raise the economy’s sustainablerate of growth and achieve rising prosperity through creating economic and employmentopportunities for all. To this end, it has put in place a macroeconomic policy framework toavoid excessive swings in output and inflation and to deliver stability for the long term.Notably, the Bank of England has been given operational independence to set nationalinterest rates and a new fiscal policy framework underpinned by two strict fiscal rules hasbeen introduced to deliver sound public finances.
1.2 The performance of the labour market is also central to the well being of both theeconomy and society. A flexible and efficient labour market, combined with a stablemacroeconomic environment, implies an economy that is fairer, more competitive and moreproductive. It also means an economy that is better able to respond to economic change. Inparticular, the labour market:
• is key to the economy’s sustainable rate of growth and contributes to overallcompetitiveness and productivity;1
• is a major influence on the welfare of individuals and households.Employment goes hand in hand with social justice and, as the LisbonEuropean Council of March 2000 noted, the best safeguard against socialexclusion is a job; and
• can help to relieve the fiscal burden, particularly if there is an ageingpopulation, i.e. higher rates of employment are beneficial for thesustainability of the public finances and pension systems.
1.3 If the UK were to join Economic and Monetary Union (EMU) it would mean neithernational interest rates nor the nominal sterling-euro exchange rate could be adjustmentmechanisms in the face of economic shocks. All other things being equal, this would implythat the UK economy would find it harder to respond to shocks. It is therefore important thatif the UK were to join EMU the economy should be able to adjust by other means. Particularexamples would be adjustment in labour, product and capital markets.
1.4 The purpose of this study is to examine labour market flexibility both in the UK and theeuro area. It does this in general and also in the context of the specific forms of flexibility mostrelevant for EMU. The study does not attempt to judge whether the UK labour market isflexible enough to meet the new challenges of adjustment that a single currency would bring.That is the purpose of the assessment of the five economic tests and, in particular, the secondtest which asks: “if problems emerge is there sufficient flexibility to deal with them?” Thisstudy does, however, inform the assessment.
1.5 Labour market flexibility played a key role in the Treasury’s 1997 assessment of the fiveeconomic tests for EMU membership, which noted that:
“For successful membership of a monetary union the UK needs labour and productmarkets that work effectively...with the loss of domestic control over monetary policyand the exchange rate as a means of adjusting to shocks, a greater burden ofadjustment will fall to factor and product markets”. (HM Treasury, 1997, page 18.)
The importanceof the labour
market…
…domestically...
…and in a singlecurrency
area
The purpose ofthe study
The 1997assessment
1 In the long run the employment rate will affect the level of output and not its growth rate. However, when theemployment rate is changing it can contribute to economic growth.

TH E CO N C E P T O F L A B O U R MA R K E T FL E X I B I L I T Y
1.6 For example, adjustment to a country-specific or asymmetric shock2 may require achange in the real exchange rate and relative wages between countries to keep the adverseimpact on unemployment and output to a minimum. Outside a currency union, this can beachieved either through an adjustment of the nominal exchange rate or an adjustment offactor and goods prices complemented by an appropriate monetary policy. Without thenominal exchange rate within a single currency, this would imply a less flexible economy,unless one of the following conditions held (Soltwedel et al., 1999):
• the exchange rate never worked as a shock absorber, so nothing is sacrificedby giving up this adjustment tool;
• there is only a small probability that economies will be hit by shocks; or
• markets alone are flexible enough to adjust to a shock.
1.7 On the latter point, the 1997 assessment noted that further progress was needed toensure that the UK labour market could adjust sufficiently to an economic shock. Itconcluded that:
“In labour markets particularly, the UK has not yet achieved sufficient flexibility tomeet the challenges of EMU membership”. (HM Treasury, 1997, page 7.)
1.8 This conclusion was based on there being insufficient evidence both thatunemployment could fall further without igniting wage pressures and that individuals hadthe right skills to adapt to changes in the economy. The 1997 assessment also acknowledgedthat further work was needed to ensure the European Union (EU) as a whole was able tocreate jobs and respond to structural change.
1.9 This study therefore revisits the issues raised in the 1997 assessment and assessesdevelopments since, while broadening and deepening the analysis. It is structured around acomprehensive and coherent framework designed to assess the efficiency of different labourmarket adjustment mechanisms. The framework, as set out below in paragraphs 1.16 to 1.17,assesses a range of indicators at three different levels, the characteristics of, the outcomes inand the institutional environment conducive to flexible labour markets, in general and forthe requirements of EMU in particular.
1.10 This study focuses solely on labour market flexibility, although the actual assessment ofthe flexibility test includes both product and capital market flexibility.3 Its findings form a keyanalytical building block. Other studies include:
• Analysis of European and UK business cycles and shocks, which assesses theextent to which the UK is liable to experience asymmetric shocks. Thisunderlies the importance of assessing the strength and speed of marketadjustment mechanisms;
• The exchange rate and macroeconomic adjustment, which analyses the extentto which the exchange rate enables adjustment to shocks;
• Modelling shocks and adjustment mechanisms in EMU, which assesses howadjustment processes, including labour market flexibility, might operatewithin EMU; and
• The United States as a monetary union, which assesses how the US labourmarket adjusts to shocks.
8
1
The 1997conclusions
Framework forthe study
Related EMUstudies
2 Country-specific or asymmetric shocks may be the result of a shock specific to just one country or region within acountry. Alternatively, differences in structure may lead to a common or symmetric shock having a differential orasymmetric impact across countries.3 The links between employment and the product market are discussed briefly in Section 4 on the institutionalenvironment.

9
What does labour market f lex ib i l i ty mean?
1.11 Labour market flexibility has been defined in a number of different ways (see forinstance Lagos, 1994; Pissarides, 1997; Forstater, 2000). For some, flexibility is defined as thespeed with which the labour market can adjust in response to an economic shock. Otherseither identify a flexible labour market as one that exhibits a good equilibrium, i.e. a lowstructural unemployment rate, or characterise it in terms of the institutional features thatinfluence wage setting and supply and demand in the labour market, and ultimately labourmarket performance.
1.12 All three of these approaches warrant attention. Chart 1.1 shows the evolution ofunemployment rates since the 1960s. It illustrates that in the 1960s and 1970s, the US had ahigher unemployment rate than the UK and euro area, with the UK in line with the euro areaaverage.
1.13 During the past 30 years the global economy has been hit by a number of shocks.4 Theseshocks have been predominantly symmetric in nature and led to significant increases inunemployment from the 1960s. However, the adjustment paths that the economies took werenotably different, with high and persistent rates of unemployment in the euro area, and untilthe mid 1990s the UK, and lower and more stable unemployment rates in the US.
TH E CO N C E P T O F L A B O U R MA R K E T FL E X I B I L I T Y1
Definitions oflabour market
flexibility
Chart 1.1: Unemployment rates
Source: European Commission, 2002a.
0
2
4
6
8
10
12
1960 1964 1968 1972 1976 1980 1984 1988 1992 1996 2000
Euro area
UK
US
Per cent
4 In particular, the decline in productivity growth at the start of the 1970s, the oil price shocks in 1973 and 1979, the risein real interest rates at the start of the 1980s, and the skill-biased change in labour demand in the 1990s. However, largeasymmetric shocks, such as the impact of German re-unification, should also be noted.

TH E CO N C E P T O F L A B O U R MA R K E T FL E X I B I L I T Y
1.14 Shocks help explain much of the ratcheting up in unemployment since the 1960s,causing it to deviate from its equilibrium. Recent analysis and evidence suggests that it is theinteraction between shocks and labour market institutions that determines the evolution ofunemployment, employment and labour market performance more generally (Barro, 1988;Blanchard and Wolfers, 2000; Den Haan et al., 2001; Bertola et al., 2001; Nickell et al., 2002;Garibaldi and Mauro, 2002; Chen et al., 2002).5
1.15 Institutions can slow the adjustment process such that the increase in unemploymentfollowing a shock becomes a more permanent or long standing change. This phenomenon issometimes called partial hysteresis. In the extreme case, there can be full hysteresis where theunemployment rate can drift upward or downward with no tendency to return to its originalequilibrium. Unemployment quickly becomes structural rather than temporary, with theresult that the equilibrium unemployment rate tracks the actual unemployment rate.However, there are competing explanations of the long-term persistence of unemployment inEurope.6
• insufficient aggregate demand: because labour is a derived demand it followsthat a shortfall in aggregate demand will translate into higher unemployment.Some commentators have argued that the low level of labour demand isresponsible for higher unemployment in Europe (Glyn and Salverda, 2000);and
• globalisation: import competition from developing economies has increasedunemployment in low-skilled manufacturing industries in Europe.
STRUCTURE OF THE STUDY
1.16 This study employs an organising framework for the analysis which highlights threefacets of the labour market – characteristics, outcomes and the institutional environment –which are illustrated in Figure 1.1. This study defines a flexible labour market as one that hasthe ability to adjust to changing economic conditions in a way that keeps employment high,unemployment and inflation low, and ensures continued growth in real incomes. Thisapplies whatever the monetary regime, but EMU puts a particular premium on certainaspects of flexibility, including that of wages.
10
1
5 Minford and Naraidoo (2002) argue that the increase in structural unemployment emerges from a political process.A change in unemployment (caused by shocks) causes workers to demand policy changes – an example would be higherbenefits. This effect is self reinforcing, i.e. unemployment increases further so the demand for extra protection increases.Eventually this effect subsides as the need for additional tax financing creates too high a burden, reform goes the otherway and unemployment falls from its peak. Therefore, although the long-run level of output is largely supply determined,the interaction between demand policies and the institutional structure may influence the precise position of theequilibrium level of unemployment.6 See IMF(1999).
The interactionof economicshocks and
labour marketinstitutions
What isflexibility?

11
1.17 Flexibility is a difficult concept to quantify and therefore to test numerically. While itwould be conceptually appealing to define an absolute level of flexibility, this is very difficultto achieve in practice. Instead this study analyses whether there is evidence that UK labourmarket flexibility has changed in relative terms, both over time and compared with otheradvanced economies, especially those in the euro area. The study is structured as follows:
• Section 2 discusses the different ways in which the labour market can adjustand the relative speed and strength of these adjustment mechanisms – thecharacteristics of flexible labour markets. Labour market adjustment isdiscussed in general but also in terms of the specific forms of flexibility thatmatter most for EMU. The focus is on a key issue raised in the 1997 assessment– real wage flexibility – and the discussion includes a new econometricanalysis by HM Treasury, which tests for signs of improved real wage flexibilityin the UK. Section 2 also builds on the previous assessment with a fullerdiscussion of the role of nominal wage flexibility, labour mobility and skills;
• labour market outcomes can differ across countries, even when shocks are ofa similar nature. Section 3 discusses the employment performance of the UKand euro area and focuses on those outcomes that are consistent with aflexible labour market, i.e. those that can illustrate smoother labour marketadjustment and those that can show whether any recent improvements aresustainable;
TH E CO N C E P T O F L A B O U R MA R K E T FL E X I B I L I T Y1
Figure 1.1: Determinants of labour market flexibility
Source: Based on Soltwedel et al., 1999.
Geographical andjob mobility
Part-time
Responsivenessof labour market
to shocks
Working timeflexibility
Labour marketperformance
Hiring and firingcosts
Education andtraining
Active labourmarket policy
Wage bargainingsystem
Minimumwage
Wageflexibility
Working timeregulation
Non-wagelabour costs
Characteristics
Institutional environment
Outcomes
• successful membership of EMU requires that any improvements are not justexperienced at a point in time but that they are sustained into the future.Section 4 highlights the institutional environment and the process ofeconomic reform both in the UK and in the rest of the EU. This is an importantexercise because supply side reforms may take time to affect behaviour and soan assessment of these institutions now can help indicate the outcomes thatmay emerge in the medium to long term.7 Section 4 also presents a new cross-country indicator of flexibility developed by HM Treasury based on theseinstitutional factors; and
• Section 5 concludes on the relative degree of flexibility in the UK and euroarea.
12
7 Karanassou and Snower (1998) look at the issue of adjustment lags and why unemployment may persist despite labourmarket reforms. The OECD (2000a, page 165) notes that the impact of labour market reforms on the NAIRU can besubstantial but slow to emerge.
TH E CO N C E P T O F L A B O U R MA R K E T FL E X I B I L I T Y1

2 CH A R AC T E R I S T I C S O F FL E X I B L E
L A B O U R MA R K E T S
13
2.1 This section looks at the different mechanisms by which the labour market adjusts bothin general and in terms of the specific forms of adjustment that are relevant to EMU. Theprocess of adjustment will depend on the type of shock affecting the economy, with somechannels more important for shocks that impact on the economy as a whole, and others moreimportant when adjustment is required in particular industries or regions. Together, thevarious channels of adjustment represent the characteristics of flexible labour markets.Typically, the faster and greater the response, the more flexible the labour market.
This section looks at the different ways in which the labour market can adjust – thecharacteristics of flexible labour markets. It looks at labour market adjustment ingeneral in the UK and euro area but also identifies the specific forms of adjustment thatare most relevant to EMU membership, in particular the additional emphasis it would puton real and nominal wage flexibility, alongside other characteristics.
Wages in the UK appear relatively responsive to labour market conditions:
• relative wage flexibility is reasonably high in the UK meaning that wages adjustin response to imbalances across regions and across skills;
• there is some evidence that real wage flexibility has improved in the UK since1997. A new econometric exercise undertaken by HM Treasury for this studysuggests that real wages have become more responsive to the level ofunemployment. Empirical research also suggests that real wage flexibility relativeto other countries has been improving; and
• nominal wages are generally adjusted on an annual basis in the UK, providingscope for a relatively high degree of nominal wage flexibility. However, theexistence of some downward nominal wage rigidities could potentially interferewith labour market adjustment in the UK.
While this suggests a relatively high degree of wage flexibility in the UK, this has not beenfully tested in recent years, and there has been a relatively more stable macroeconomicenvironment than in the past. Wage flexibility could be more severely tested if the UKdecided to join EMU, where price movements would need to play a greater role inadjustment to shocks.
Geographic labour mobility has not been a key means of equilibrating movements oflabour between and within EU countries, although this study argues that low levels ofgeographic mobility need not necessarily undermine the flexibility of the labour market asa whole. However, this requires that other characteristics such as wage flexibility,employment flexibility and functional flexibility can compensate for a low level ofgeographic mobility and allow labour markets to function effectively.
The UK and other parts of Europe exhibit a relatively high degree of employmentflexibility, demonstrated by a high incidence of part-time working and the adoption offlexible working practices.
In terms of functional flexibility, the stock of workers with low skills in the UK is beingreduced only very slowly. Government intervention has focused on ensuring thatindividuals have the right skills to adapt to economic change, the need for which would begreater in EMU. In short, EMU would put a premium on the need for greater flexibility inall aspects of the labour market.
Overview

CH A R AC T E R I S T I C S O F FL E X I B L E L A B O U R MA R K E T S
2.2 A perfectly flexible economy would be one in which prices and then quantities adjustedinstantly in response to any shock, and in such a way so as to ensure full resource utilisation.For the labour market, perfect flexibility would imply that following any change in theeconomic environment, the labour force would be immediately redeployed to its mostefficient use, with unemployment remaining at its structural level.
2.3 In practice, there are costs and impediments to such instantaneous adjustment, whichare reviewed in more detail in Section 4 on the institutional environment. Such factors meanthat it takes time for relative prices and quantities to fully reflect the new economicenvironment. These adjustment periods will be periods of sub-optimal resource utilisation.In the labour market, this is likely to imply a rise in unemployment. In the case of a flexiblelabour market, the adjustment period will be short-lived, as prices and quantities moverapidly to restore equilibrium. But for less flexible economies, the adjustment period will bemore protracted.
2.4 In practice, it would seem that policy should seek to maximise labour market flexibility.Box 2.1 describes a body of evidence that discusses the implications of the labour market inone region in a monetary union adjusting more rapidly than the labour market in another.However, the argument goes beyond labour markets, and a full appraisal would also examinecapital and product market flexibility. As such, the argument is not pursued further in thisstudy.
14
2
Box 2.1: Different levels of flexibility in a monetary union
A higher degree of labour market flexibility implies a more rapid adjustment to economicshocks, such that the economy spends a shorter period out of equilibrium or, in terms ofthe output gap, actual output remains closer to trend or potential. It would appear,therefore, that the more flexible is the labour market the better.
However, a body of evidence has discussed the effects of differences in the degree offlexibility between different regions of a monetary union (Scheremet, 2000; Guichard andLaffargue, 2000; Hughes Hallett and Viegi, 2000; Dellas and Tavlas, 2002; and as describedin Andrew Hughes Hallett’s contribution to the EMU study Submissions on EMU fromleading academics). The literature discusses how such differences may affect thetransmission mechanism of economic shocks. A shock that initially has a symmetric effectacross the monetary union will evolve into an asymmetric shock if one region adjusts morerapidly than another. Guichard and Laffargue note that:
“Industrialized countries’ labor markets display great heterogeneity concerning wagebargaining processes, degrees of job protection and provision of replacement incomes,etc...therefore, labor markets are likely to lead an initially symmetric shock to haveasymmetric consequences; this is also an important source of concern for the EMU”.(Guichard and Laffargue, 2000, page 2.)
Either way, greater flexibility in all regions would help to ensure a more efficientadjustment process throughout a single currency area. It is important therefore that theexisting euro area as well as the UK is flexible in order to realise fully the benefits of EMU.Further progress towards meeting the Lisbon Economic Reform Programme, as set out indepth in HM Treasury (2002a) and HM Treasury (2002b), would therefore contribute tothe success of EMU, whether or not the UK becomes a member.
Imperfectflexibility
Perfectflexibility
Different levelsof flexibility in amonetary union

15
2.5 Where flexibility is particularly limited, the labour market may fail to adjust completely.In this case, the change in unemployment may become a permanent rather than a transitoryphenomenon. As the economy is constantly adjusting to a changing economic environment,it is analytically helpful to think of actual unemployment as consisting of structural andcyclical components, where the cyclical component corresponds to the transitional aspect ofunemployment, while the structural component corresponds to the permanent element.1
2.6 Irrespective of whether the UK is a member of EMU, shocks will lead to changes in theeconomic environment. There are several mechanisms through which the labour marketmight adjust to such shocks. In a standard demand and supply model, adjustment can takeplace either through a change in the price level (wages), or through movements in the labourdemand and labour supply curves.
2.7 A good exposition of this approach is given in Pissarides (1997). He defines separately awage setting mechanism (how quickly real or nominal wages respond to a shock), a laboursupply relation (the ability and willingness of labour to move to new jobs), and a labourdemand relation (the ability of employers to alter employment quickly). Drawing on such anapproach, this section assesses the characteristics of flexible labour markets in terms of:
• relative wage flexibility: describes movements in wage differentials acrossparticular segments of the labour market, such as different regions or differentoccupations;
• real wage flexibility: how rapidly real wages (the pay of an individual afteradjusting for changes in the price level) respond to imbalances betweenlabour demand and labour supply;
• nominal wage flexibility: the ease with which nominal wages (the pay of anindividual before adjusting for changes in the price level) adjust, in particularwhen this adjustment entails potential wage cuts;
• geographic labour mobility: the ability or willingness of workers to commuteor move residence in order to find employment;
• employment flexibility: the ability of employers to adapt working patterns inresponse to labour supply conditions. Examples include the use of part-timeand flexible working that make it easier for employees to combineemployment with other activities and responsibilities; and
• functional flexibility: the ability of the workforce to perform different tasksand to acquire and apply different skills, enabling employees to perform awide range of jobs, and to adapt readily to technological change.
2.8 It is not necessary for a labour market to be highly flexible on all of these counts, sincehigh flexibility in one dimension may help to compensate for low flexibility in another. Forexample, as discussed in Box 2.2 later in this section, geographic labour mobility is cited as akey adjustment mechanism in the early versions of Optimal Currency Area (OCA) theory. Thesubsequent development of OCA theory has emphasised that real, nominal and relative wageflexibility and capital mobility provide alternative ways for economies to adjust to shocks. Ifthese mechanisms are sufficiently strong then a currency area may be able to respondefficiently to asymmetric shocks even if the geographic mobility of labour is low.
2.9 Nonetheless, greater flexibility in each and every dimension will enable the labourmarket to operate more effectively and increase its ability to adapt to changing economicconditions.
CH A R AC T E R I S T I C S O F FL E X I B L E L A B O U R MA R K E T S2
1 In practice, however, the dividing line between structural and cyclical unemployment is indistinct, with one tending toshade into the other.
How does thelabour market
adjust?
Characteristics offlexible labour
markets
Structural andcyclical
unemployment
CH A R AC T E R I S T I C S O F FL E X I B L E L A B O U R MA R K E T S
WAGE FLEXIBILITY
2.10 In most markets, price adjustment is an important factor enabling the market tofunction effectively. The labour market is no exception, with wage levels a major determinantof the supply of and demand for labour. There are three key dimensions: relative wageflexibility, real wage flexibility and nominal wage flexibility.
Relat ive wage f lex ib i l i ty
2.11 Adjustment in the labour market primarily consists of ensuring a smooth transfer oflabour out of contracting regions, industries or sectors and into expanding ones. If theunemployment rate in one market segment is high then there are two key mechanismsthrough which adjustment can take place: either relative wages across these segments canadjust or labour can move.2 Geographic labour mobility is discussed in paragraphs 2.60 to2.84, and the analysis demonstrates that mobility is limited as an equilibrating mechanism inboth the UK and the euro area. Therefore, relative wage flexibility needs to be sufficiently highto provide the necessary adjustment.
2.12 Relative wage flexibility concerns the adjustment of wages across market segments(such as regions and occupations) in response to a change in the composition of demand orsupply. Flexible relative wages therefore tend to reduce the likelihood of mismatch betweenlabour supply and demand occurring at the sectoral or regional level. In the extreme, ifrelative wages were perfectly flexible and there was no labour mobility (but a lot of jobmobility) all adjustment would occur through changes to wage differentials, and other thingsbeing equal, unemployment would be equal across sectors.
2.13 If wages are relatively flexible across regions then wage growth should be lower in highunemployment regions than in low unemployment regions such that firms are able to sustaincompetitiveness, thereby encouraging investment and the creation of more jobs. A lack ofrelative wage adjustment has been a particular concern across Europe, and is a major reasonbehind the regional unemployment disparities that exist between the former East and WestGermany as well as between northern and southern parts of Spain and Italy (see, for example,Soltwedel et al., 1999).
2.14 Historically, inflexible relative wages across regions were also a problem in the UK.During previous troughs in unemployment in the UK, large regional unemploymentdisparities existed, as relative wages failed to adjust sufficiently and labour failed to move inresponse to high unemployment in the North and relatively lower rates in the South. This isdiscussed further in Section 3.
2.15 However, as Section 3 also sets out, in the most recent economic upswing the variabilityof UK regional unemployment rates has narrowed. Chart 2.1 plots the regional ILOunemployment rate in 1999 against the growth rate of gross weekly earnings over the period1999 to 2001. It illustrates that wages have grown relatively more slowly in the highunemployment regions, suggesting that relative wages have responded to regionalunemployment differences.
16
2
What is relativewage flexibility?
Wage flexibilityacross regions is
a problem inparts of
Europe…
…but relativewages appear toadjust in the UK
2 It is also possible that firms become more mobile, responding to smaller wage differentials than before.

17
2.16 Research suggests that between 1974 and 1997, regional wage growth had aresponsiveness of around 0.3 to regional unemployment (Jackman and Savouri, 1999). Thisimplies that if a region’s unemployment rate exceeds the national average by 1 percentagepoint then its wages tend to grow by 0.3 percentage points less than the national average.Furthermore, the authors also found that the responsiveness increased to around 0.5 after1986, implying that relative wage flexibility has strengthened since that time. Beatson (1995)found evidence that regional wages might have become better aligned with regionalunemployment rates.
2.17 Relative wages can also correct for shifts in the demand for, or the supply of, highlyskilled jobs. In the case of an excess demand for skilled workers or an excess supply ofunskilled workers, flexible economies should exhibit falling relative wages for unskilledworkers or, put another way, as the demand for skilled workers increases so too should theirwages. Evidence suggests that in the UK during the 1980s there was an increase in the returnsto human capital at a time when labour demand for skilled workers was increasing (Beatson,1995).
2.18 Chart 2.2 depicts the ratio of the upper to the lower decile of the gross earningsdistribution in the UK for both manual and non-manual workers. It shows that the earningsgap between the two groups widened in the 1980s and has continued to widen, albeit at aslower pace, since then. The fact that the earnings ratios are not constant is consistent withrelative wages responding flexibly to the demand for different types of worker.
CH A R AC T E R I S T I C S O F FL E X I B L E L A B O U R MA R K E T S2
Relative wageflexibility across
skills
Chart 2.1: Regional unemployment rate and wage growth
Source: New Earnings Survey and ONS.
3 4 5 6 7 8 9 10 117
8
9
10
11
12
13
14Per cent
South East South West
East
London
West Midlands
North West
East Midlands Yorkshire
Scotland
Northern Ireland
Wales
North East
ILO unemployment rate (1999)
Wag
e gr
owth
(199
9-20
01)

CH A R AC T E R I S T I C S O F FL E X I B L E L A B O U R MA R K E T S
2.19 Another potential indicator of relative wage flexibility is the extent to which movementsin inter-industry wage differentials over time encourage the redeployment of labour fromdeclining sectors to expanding sectors. If they do, then industry wage growth in the UK andindustry employment growth should be positively correlated, as expanding sectors raise theirwage offers relative to declining sectors. However, analysis for the period 1990 to 2001 doesnot suggest any significant systematic relationship between industry wage and industryemployment growth, either positive or negative. This is perhaps not surprising as it isconsistent with the usual empirical finding from the mainly US literature that inter-industrywage differentials are highly persistent over long periods of time (see, for example, Borjas andRamey, 2000).
2.20 The fact that relative wages appear flexible in the UK may reflect the moves towardsmore decentralised bargaining, as discussed in Section 4. This has helped to ensure thatwages are sensitive to specific demand conditions at the local level. In their Article IV reporton the UK in 2000, the IMF noted that:
“The U.K. labor market has undergone a number of institutional and structuralchanges since the 1980s, and there are reasons to believe these changes havecontributed to increasing both aggregate and relative wage flexibility...both theimproved aggregate performance of the 1990s and changes in the structure of relativewages across skills, sectors, occupations and regions are consistent with the view thatinstitutional changes in the 1980s have increased the flexibility of wages in responseto changes in demand for output and employment”. (IMF, 2000, page 117.)
Real and nominal wage f lex ib i l i ty
2.21 EMU membership would place a greater onus on the adjustment mechanisms that canreplicate the role of an independent monetary policy and the nominal exchange rate. One ofthe key labour market adjustment mechanisms cited in the literature is that of real wageadjustment, as the OECD note in the context of EMU:
“Labour market adjustment, however, could be sharpened by greater sensitivity ofreal wages to excess supply and demand across regions and sectors. The capacity ofwages to adjust rapidly to a change in labour market conditions is critical”. (OECD,1999a, page 156.)
18
2
Chart 2.2: Earnings inequality in the UK
Source: New Earnings Survey.
1.0
1.5
2.0
2.5
3.0
3.5
4.0
1962 1967 1972 1977 1982 1987 1992 20021997
Non-manual All
Manual
Ratio of upper to lower decile for gross earnings
Inter-industrywage differentials

19
2.22 Real wage flexibility describes the degree to which real wages respond to unemploymentor to market disequilibria. When unemployment is high, workers’ bargaining power is weak,so real wages tend to decline.3 The decline in real wages increases employers’ demand forlabour and hence brings unemployment back towards its equilibrium level. Whenunemployment is low, the same processes operate in the opposite direction, with real wagestending to rise, leading to a decline in the demand for labour, until unemployment returns toits equilibrium level. Labour market adjustment is faster when real wages are more sensitiveto labour market conditions.
2.23 The real wage can adjust through changes in the price level or through changes in thenominal wage. Therefore, nominal rigidities are important because they can slow theadjustment of real wages to an economic shock and increase the negative impact on outputand employment. Nominal wage flexibility by itself is insufficient because it only facilitatesadjustment to purely nominal shocks. Any real shock, whether emanating from the supplyside of the economy or the demand side (such as a switch in consumer preferences), requiresrelative prices to change, and hence requires real flexibility.
2.24 The following discussion therefore addresses two key questions:
• how flexible are real wages in the UK?
• do nominal rigidities exist in the UK labour market and to what extent do theyslow the adjustment of real wages?
Real wage f lex ib i l i ty
2.25 The 1997 assessment found that a lack of real wage flexibility in the UK meant that thelabour market was insufficiently flexible to deal with any problems that might emerge inEMU. With specific reference to wages, the 1997 assessment noted the UK had:
“A system of wage determination that is relatively successful at ensuring that relativewages reflect new and changing demands. But it remains to be seen whether thehistorical problem of recurrent cycles of wage inflation and unemployment has beenaddressed”. (HM Treasury, 1997, page 21.)
2.26 Much recent research has looked at real wage flexibility using cross-countrycomparisons. In line with the preceding analysis, econometric studies typically measure thedegree of real wage flexibility by the coefficient on the unemployment variable (or a similarconcept) in an aggregate wage equation.4 Table 2.1 summarises the results. Themethodologies and datasets differ, making it difficult to compare the results across studies, sothe table presents an ordinal ranking.5 The consistent conclusion of research prior to the mid1990s was that the UK had a relatively low level of real wage flexibility. This is quite a strikingobservation given the different techniques used.
CH A R AC T E R I S T I C S O F FL E X I B L E L A B O U R MA R K E T S2
3 Layard, Nickell and Jackman (1991) contains a full exposition of the wage bargaining model.4 If real wages are very flexible then an estimated wage equation may give a low or insignificant coefficient onunemployment. In the extreme case of perfect real wage flexibility, a shock is absorbed instantaneously by real wagessuch that unemployment is constant. Therefore, no relationship is observed between the real wage change andunemployment despite there being a clear connection between the two. For more detail on this point see Goubert andOmey (1996).5 Beatson (1995) contains a similar approach.
How real wages adjust
The role ofnominal rigidities
Real wageflexibility in the
1997 assessment

CH
AR
AC
TER
ISTICS
OF
FLE
XIB
LEL
AB
OU
RM
AR
KE
TS
20 2
Table 2.1: Real wage flexibility rankings over time (1 = most flexible)
GJL Coe NS BLN Coe(2) AM LNJ ABWVP EM H3 AB TY GO TRS RiV VJ OECD TS HSZ BFT MR BD FRP
Short Long U is U is Short Long U U Short Long-run -run I(0) I(1) -run -run level change -run -run
Period 1970s-
1951-801965-83 1965-83 1954-81 1953-83 1960s-85 1952-85 – – 1960-91 – 1979-91 mid 90s – 1967-91 1973-95 – – 1969-97 1969-97 1970s-971970-97 1970-95 1970-95 1980-99 – – 1960s-991980s-99
Rank1 JAP SWZ GER JAP JAP JAP JAP JAP JAP SWE JAP BEL SWE GER JAP JAP NLD US AUS EA POR POR SWE FIN GRE BEL GER AUT POR2 SWZ JAP JAP SWZ SWZ AUT NOR ITA GER JAP SWE DEN FIN BGM FRA AUT JAP AUT ITA SPA SWZ ITA US BEL AUT FIN ITA FRA UK3 NZ CAN AUS SWE AUT US SWE SWE FRA AUT AUT GER JAP JAP US SPA US JAP US GER IRE NLD FIN DEN UK GER UK UK AUT4 SWE GER ITA ITA SWE ITA SWZ AUT US SPA SWZ IRE AUS ITA GER SWE BEL ITA UK BEL BEL AUT POR GER BEL SPA FIN GER SPA5 AUT US AUT AUT NOR CAN FIN FRA ITA TUR NOR AUT FRA5 FRA CAN POR IRE DEN GER ITA CAN GER NLD SWE DEN ITA BEL US NLD6 NLD AUS CAN NLD GER FIN AUS US UK NOR FIN FRA ITA5 UK ITA ITA UK UK FRA FRA GRE SWZ UK US IRE UK IRE CAN FRA7 FRA AUT SWZ FIN FRA AUS NLD NLD ITA ITA ITA GER US UK NLD DEN EU EA1,2 AUS NLD BEL DEN POR FRA FRA FRA SWE BEL8 CAN NLD NLD IRE IRE FRA GER BEL NLD FRA UK CAN FIN GER SWE SPA1 NLD DEN UK GER UK SPA IRE SPA ITA DEN9 BEL ITA FRA GER AUS NLD FRA IRE GER NLD NLD US6 FRA EU BEL BEL1 US GER FRA GRE AUT GER NLD4 SPA US10 FIN FRA US CAN BEL SPA BEL FIN BEL AUS UK6 GRE SPA GER NLD1 UK NOR SPA JAP NLD FIN POR4 SWE11 AUS UK UK BEL FIN UK IRE SPA FRA BEL BGM ITA NLD US FRA IRE SWE AUT 4 GER12 US US NZ GER UK DEN SWZ IRE DEN AUT FRA AUS IRE ITA CAN13 ITA UK CAN US GER AUS CAN GER SWE IRE FIN SPA SPA ITA14 NOR AUS NLD DEN UK UK GER UK FRA FIN FRA BEL GRE FIN15 SPA FRA UK SPA US US IRE FIN SPA AUS AUT FRA16 DEN NOR DEN ITA CAN SPA US ITA ITA JAP17 GER ITA DEN DEN NZL18 IRE US NZ UK SWE19 UK POR SPA
20 UKKey: GJL = Grubb, Jackman and Layard (1983); Coe = Coe (1985); NS = Newell and Symons (1985); BLN = Bean, Layard and Nickell (1986); Coe (2) = Coe et al. (1987); AM = Alogoskoufis and Manning (1988); LNJ = Layard, Nickell and Jackman (1991);
ABWVP = Anderton et al. (1992); EM = Elmeskov and MacFarlan (1993); H = Heylen (1993); AB = Anderton and Barrell (1993); TY = Tyrvainen (1995); GO = Goubert and Omey (1996); TRS = Turner et al. (1996); RiV = Roeger and in't Veld (1997); VJ = Viñals andJimeno 1998); OECD = OECD (1999a); TS = Turner and Seghezza (1999); HSZ = Horn et al. (1999); BFT = Berthold, Fehn and Thode (1999); MR = McMorrow and Roeger (2000); BD = Barrell and Dury (2001); FRP = Fabiani and Rodriguez-Palenzuela (2001).
Notes: 1: Equal 7th.2: Euro area.3: Constructed as average of previous literary studies.4: Equal 9th.5: Equal 5th.6: Equal 9th.

2.27 Research since the mid 1990s suggests that there has been an improvement in the UKrelative to other countries, with estimates of the responsiveness of real wages tounemployment ranking among the top half of the sample of countries considered. This couldbe consistent with an improvement in real wage flexibility in the UK, as the IMF (2000) note:
“Consistent with the better cyclical performance of the labor market in the 1990s,recent estimates of the responsiveness of aggregate real wages to unemployment showa greater degree of real wage flexibility for the United Kingdom than previousestimates”. (IMF, 2000, page 100.)
2.28 However, it may only be true that the UK’s relative position has changed, with noabsolute improvement. Flexibility may have deteriorated elsewhere, but to a lesser extent ornot at all in the UK. In order to look for signs of improvement in the UK over time, aggregatewage equations can be examined to see if a structural break has occurred. This will overcomeone problem with the results presented in the cross-country studies, namely that theestimation procedure requires a long back-run of data, such that any recent improvements inthe supply side of the economy will be difficult to identify.
2.29 The literature on UK real wage flexibility is dated, and appears somewhat inconsistentwith the apparent improvement observed in the past few years (see Section 3). Some evidencedoes suggest that structural reforms in the UK have tended to increase the degree of real wageflexibility in the UK (Turner et al., 1996) while other research finds no such evidence(Ramaswamy and Prasad, 1994; Anderton et al., 1992).
2.30 New HM Treasury work points to an improvement in real wage flexibility in the UK, andis shown in Chart 2.3.6 It shows an estimate of real wage flexibility derived from the Treasurymodel’s wage equation, plotted over the period 1982–2000. If real wage flexibility hasincreased, the value of the long-run coefficient on unemployment should have fallen (i.e.become more negative) over time, showing that any given level of unemployment has a bigger(offsetting) impact on wages.
CH A R AC T E R I S T I C S O F FL E X I B L E L A B O U R MA R K E T S2A relative
improvement inthe UK
A neweconometric
exercise by HMTreasury...
21
6 More detail on this approach is contained in Annex A.
Chart 2.3: Long-run unemployment coefficient
-0.14
-0.12
-0.10
-0.08
-0.06
-0.04
-0.02
1984Q21982Q2 1986Q2 1988Q2 1990Q2 1992Q2 1994Q2 1996Q2 1998Q2 2000Q2
Source: HM Treasury.

CH A R AC T E R I S T I C S O F FL E X I B L E L A B O U R MA R K E T S
2.31 The long-run coefficient on unemployment has fallen, consistent with an increase inreal wage flexibility over time. However, identifying significant changes with confidence isdifficult under this approach – indeed the change is not statistically significant. In short, thebalance of evidence is suggestive of, and consistent with, an improvement in real wageflexibility, but the econometric work alone cannot support a definitive conclusion.
2.32 Another way to examine whether real wage flexibility has improved over time is fromlooking at how the coefficient on unemployment has evolved between two sample periodssplit at different points. The results presented in Table 2.2 suggest that the long-rununemployment coefficient (the unemployment rate divided by the ECM coefficient) increasesduring the second part of the sample period (with the sample splits at 1983, 1985 and 1990)and in most cases the changes are significant.7
Table 2.2: Split sample estimates of the coefficient on unemployment
Sample period
1974Q1- 1983Q1- 1974Q1- 1985Q2- 1974Q1- 1990Q1-1982Q4 2000Q4 1985Q1 2000Q4 1989Q4 2000Q4
Unemployment rate coefficient -0.020 -0.023 -0.020 -0.027 -0.011 -0.036
t-ratio 2.8 2.9 3.0 3.3 2.1 3.8
ECM coefficient -0.441 -0.172 -0.359 -0.244 -0.155 -0.294
t-ratio 2.5 3.2 2.8 3.6 2.3 3.2
LR unemploymentcoefficient -0.04 -0.13 -0.05 -0.11 -0.07 -0.12
Wald test CHSQ(1)1 13.82 9.94 5.001 Testing the restriction that the LR coefficient is equal to the estimated coefficient for the other part of the sample. Critical value = 3.84 (i.e. readingsgreater than this imply that the changes are significantly different from the first sample period).Source: HM Treasury.
22
2
7 A separate approach involving splitting the unemployment coefficient at a point in time (such that the equation includestwo unemployment variables) was also tried. These results suggested that flexibility had been declining over theestimation period, albeit at a slow rate. However, it should be borne in mind that this approach holds the ECM coefficientconstant. These results therefore suggest that the changes in the long-run coefficient are driven by changes in itsdenominator rather than the numerator. This is also evident from Table 2.2 where in some cases the absolute value of theECM coefficient gets significantly smaller in the second part of the sample, pushing up the absolute value of the long-rununemployment coefficient. This implies that the (unrestricted) long-run coefficients move over time, not just thecoefficient on unemployment, and therefore may be indicative of more general instability rather than relating purely tochanges in wage flexibility.
...finds signs ofmore UK real
wage flexibility

23
2.33 Table 2.1 illustrates that, at least until recently, the degree of flexibility of real wages inthe long run has appeared higher in continental Europe than in the UK. However, the pictureis different for the speed of adjustment in the short run. Chart 2.4 illustrates that the actualspeed of adjustment of real wages towards their long-run equilibrium level is relatively fast inthe US and UK; half of the adjustment is complete in under two years for both, compared withthree and a half years in Germany and four years in France (OECD, 1999a).
2.34 So although unemployment has a significant downward influence on real wages incontinental Europe in the long run, the slow pace at which real wages adjust may lead toshort-term costs, such as output loss and job losses.
Nominal wage f lex ib i l i ty
2.35 Real wages can adjust either through a change in the nominal wage or through changesin the price level. In a low inflation environment, the distinction between nominal and realwage rigidities becomes less clear. Nevertheless, the existence of downward nominal rigiditiesmay prevent real wages from falling sufficiently in response to a negative shock. The questionis whether, and by how much, this leads to an increase in unemployment (reflecting the factthat the wage change may be higher than a worker’s marginal product).
CH A R AC T E R I S T I C S O F FL E X I B L E L A B O U R MA R K E T S2Real wage
adjustment inthe short run
Nominal and realwage rigidities
Chart 2.4: Real wage flexibility1
Source: OECD, 1999a.
0.0
0.5
1.0
1.5
2.0
2.5
3.0
3.5
4.0
4.5
Franc
e
German
y
Belgi
umSp
ainItaly
Austr
iaUK
Netherl
andsUS
1 Years required for real wages to complete half of the adjustment towards their long-run equilibrium level.

CH A R AC T E R I S T I C S O F FL E X I B L E L A B O U R MA R K E T S
2.36 The system under which wages are determined in the UK indicates scope for relativelyflexible nominal wages. Wages are generally adjusted annually in the UK, providing potentialfor a relatively high degree of nominal wage flexibility compared to areas where multi-annualsystems dominate, although at the possible price of some rigidity in the short term. Evidencefrom the CBI Pay Databank suggests that around 95 per cent of company settlements are for12 months or less (Table 2.3). The prevalence of multi-year contracts in the US is often citedas a major reason for the high level of nominal inflexibility revealed in econometric studies.
Table 2.3: Duration of UK company pay settlements (calendar year 2001)
Services Manufacturing
Size of settlement Less than More than Less than More than(per cent) 12 months 12 months 12 months 12 months 12 months 12 months
2.5 or less 15 80 1 45 240 7
2.51–4.5 11 249 17 21 425 37
4.51–6.5 3 62 3 2 45 1
6.51–8.5 0 19 2 0 1 0
8.51–10.5 2 9 0 0 5 010.51 or more 0 11 1 0 2 0Source: CBI Databank Survey of Services and Manufacturing.
2.37 Where real wage reductions are necessary, downward nominal rigidities could be aparticular concern since employees are naturally resistant to a cut in nominal wages, andmany employers are reluctant to impose them for fear of lowering their employees’ moraleand productivity (Bewley, 1999).8
2.38 Evidence suggests that downward nominal rigidities may exist in the US, although thereare variations in terms of the exact size of such effects (see McLaughlin,1999, for an overview).
2.39 A growing body of evidence, using household panel datasets, is now testing for theexistence of downward nominal rigidities in the UK. Charts 2.5a and 2.5b show thedistribution of hourly pay settlements from the Labour Force Survey (LFS) between 2001 and2002 for individuals who have not moved employer over the year (although they may havemoved jobs within a firm). The two series shown are basic pay and gross pay (the latterincludes bonuses and overtime payments).
2.40 The LFS shows that annual pays cuts do happen in the UK. The prevalence of payincreases is higher but this is to be expected if workers are paid according to their marginalproduct and productivity is rising. In the LFS basic pay survey, 14 per cent of individualsreceived a pay cut, compared to 75 per cent receiving an increase. In the gross pay survey,these figures are 35 per cent and 63 per cent respectively. Analysis using different datasetsgives similar results (Nickell and Quintini, 2001; Smith, 2000).
2.41 However, there is a concentration of wage settlements at zero in the wage changedistribution, suggesting some nominal wage rigidity in the UK. In the LFS basic hourly wagechange distribution, 12 per cent of non-job changers had exactly a zero wage change. In theLFS gross hourly wage change distribution this percentage falls to 3 per cent. Similarly, Smithfinds that between 1991 and 1996, 9 per cent of non-job changers had zero nominal paygrowth. She argues that institutional factors, such as long-term contracting and rounding,exaggerate this and accounting for these factors only 1 per cent of workers have pay that maybe downwardly rigid. However, as Nickell and Quintini note, long-term contracts themselvesmay be a particular source and indicator of nominal rigidities.
24
2Wage
settlements inthe UK
The importanceof downward
nominal wagerigidities
8 Smith (2002) finds that pay cuts reduce workers’ happiness compared with those that do not experience a pay fall.However, she finds no evidence that pay cuts are worse than pay freezes, meaning that the morale theory may explaingeneralised (or real) downward rigidity but fails to explain downward nominal rigidity.

25
2.42 The distributions also show that gross pay is more flexible than basic pay due to theinclusion of bonuses and overtime. Overtime pay and bonuses tend to be more responsive tothe state of demand in the economy and to a firm’s performance than basic pay and theymight have allowed the private sector to be more flexible in the recent downturn. However,the role that such payments play in moderating nominal wage changes will be limitedbecause eventually they will reach some minimum level.
CH A R AC T E R I S T I C S O F FL E X I B L E L A B O U R MA R K E T S2
Source: Labour Force Survey.
0
2
4
6
8
10
12
14
16
-50 0 +50
Freq
uenc
y
Per cent
Percentage change in basic hourly pay
Chart 2.5a: Survey evidence of nominal wage rigidity in the UK – basic pay
0
2
4
6
8
10
12
14
16
0-50 +50
Per cent
Freq
uenc
y
Percentage change in gross hourly paySource: Labour Force Survey.
Chart 2.5b: Survey evidence of nominal wage rigidity in the UK – gross pay
CH A R AC T E R I S T I C S O F FL E X I B L E L A B O U R MA R K E T S
2.43 Downward nominal wage rigidities have not been a substantial difficulty for the UK todate. Since 1997, RPIX inflation has been close to its target of 21/2 per cent a year and averageearnings have increased by around 41/2 per cent a year, providing considerable scope formovements in real and relative wages even where there is resistance to nominal wage cuts.
2.44 However, this potential constraint could be more severely tested by a decision to joinEMU. For instance, without an independent monetary policy as an adjustment mechanism,more adjustment may fall on prices and the need for nominal wage adjustment would behigher.
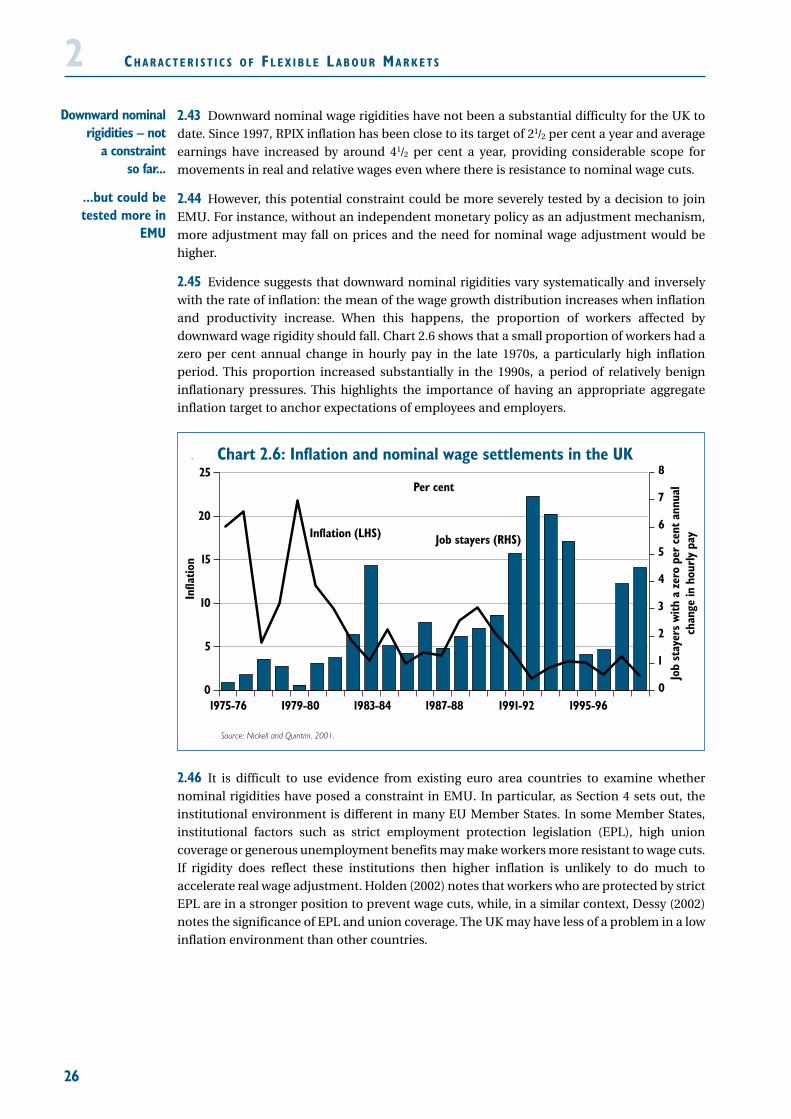
2.45 Evidence suggests that downward nominal rigidities vary systematically and inverselywith the rate of inflation: the mean of the wage growth distribution increases when inflationand productivity increase. When this happens, the proportion of workers affected bydownward wage rigidity should fall. Chart 2.6 shows that a small proportion of workers had azero per cent annual change in hourly pay in the late 1970s, a particularly high inflationperiod. This proportion increased substantially in the 1990s, a period of relatively benigninflationary pressures. This highlights the importance of having an appropriate aggregateinflation target to anchor expectations of employees and employers.
2.46 It is difficult to use evidence from existing euro area countries to examine whethernominal rigidities have posed a constraint in EMU. In particular, as Section 4 sets out, theinstitutional environment is different in many EU Member States. In some Member States,institutional factors such as strict employment protection legislation (EPL), high unioncoverage or generous unemployment benefits may make workers more resistant to wage cuts.If rigidity does reflect these institutions then higher inflation is unlikely to do much toaccelerate real wage adjustment. Holden (2002) notes that workers who are protected by strictEPL are in a stronger position to prevent wage cuts, while, in a similar context, Dessy (2002)notes the significance of EPL and union coverage. The UK may have less of a problem in a lowinflation environment than other countries.
26
2Downward nominal
rigidities – nota constraint
so far...
...but could betested more in
EMU
Chart 2.6: Inflation and nominal wage settlements in the UK
Source: Nickell and Quintini, 2001.
0
1
2
3
4
5
6
7
8
0
5
10
15
20
25Per cent
Job stayers (RHS)Inflation (LHS)
1991-921987-881983-841979-801975-76 1995-96
Infla
tion
Job
stay
ers
with
a z
ero
per
cent
ann
ual
chan
ge in
hou
rly
pay

27
2.47 Perhaps the most relevant example in the euro area is Germany, where the inflation ratehas historically been lower than that in the UK and is currently one of the lowest in the EU.Decressin and Decressin (2002) find that the prevalence of wage cuts is similar in Germany tothe UK and the US; around one fifth of non-job changers experience a fall in their nominalwage, with the most frequent change being a zero change. They also find that the zero boundis more of a constraint at lower rates of inflation, similar to UK experience. Beissinger andKnoppik (2000) note that real wage adjustments in Germany are hampered by low rates ofinflation and nominal wage growth.
2.48 More generally, a number of studies have attempted to identify the impact of EMUmembership on wage pressures. The focus has been on the interaction between the monetaryauthority and wage setters, or the impact that EMU could have on contract setting. Some ofthe possible effects identified are:
• wage restraint may be higher if increased macroeconomic variability in EMUincreases the incentives for contracts of a shorter duration, thereby givingfirms the capacity to adjust wages in the short term. Under certainassumptions, Calmfors and Johansson (2002) find that EMU membershipcreates an incentive for a reduction in contract length;
• wage restraint may be lower if being inside EMU reduces wage bargainers’perception of the inflationary impact of their wage demands. For example,they may feel that the European Central Bank (ECB) will be moreaccommodating in their response to high wage claims because they targeteuro area rather than national inflation (Cukierman and Lippi, 2001; Soskiceand Iversen, 1998; Grüner and Hefeker, 1999);
• wage restraint may be lower if EMU leads to trade unions cooperating acrossnational borders, meaning that wages respond less flexibly to an asymmetricshock affecting one particular country (Borghijs, 2000); and
• wage restraint may be lower if EMU leads to a greater use of contingencyclauses in wage contracts. Calmfors and Johansson (2002) find that EMUincreases the incentives for indexation clauses (where higher than expectedinflation triggers higher wage increases, but the effect does not operate forlower than anticipated inflation).9 In this case, the indexation acts in a similarmanner to downward nominal rigidity, although the nominal floor is nolonger a zero change but rather the increase is given by indexation.
2.49 The results of these studies are theoretical and it is not clear which of these effects woulddominate in practice. The OECD note that EMU membership may have increased wagemoderation in the euro area:
“Continued wage moderation in recent years partly reflects high unemployment. Butit could also suggest the possibility of a structural change in the area’s wagesetting…the advent of the euro may also have affected wage setting in the euro area,as there is no longer any possibility for sharp wage increases being accommodatedlater on by currency realignments”. (OECD, 2002c, page 22.)
CH A R AC T E R I S T I C S O F FL E X I B L E L A B O U R MA R K E T S2Nominal
rigidities inGermany
The impact ofEMU on wage
pressures
9 Spain is an example of where these clauses operate and in 2002 the inflation outturn exceeded its target. In thepreliminary conclusions of their Article IV Report on Spain, the IMF (2002) notes that: “the continued and widespreadexistence of backward looking wage safeguard clauses is a heritage of a high-inflation past and does not sit well with therequirements of a competitive economy in monetary union. In our discussions, we found a widespread recognition of the benefitsof wage moderation, which however risk being undone by such clauses”.

CH A R AC T E R I S T I C S O F FL E X I B L E L A B O U R MA R K E T S
2.50 These effects are discussed in more detail in Lars Calmfors’ contribution to the EMUstudy Submissions on EMU from leading academics. He notes that the forces that keep wagepressures down may be weakened in EMU relative to the forces that inhibit downward wageadjustment, such as an aversion to pay cuts (which is independent of EMU). This may havean asymmetric impact on the degree of nominal wage flexibility, such that temporarydemand shocks lead to an increase in wages that is later hard to reverse. His overallassessment is that more macroeconomic variability would increase the incentive for morewage flexibility, but that it is only likely to counteract the variability to a limited degree.
2.51 Similarly, in his contribution to the EMU study Submissions on EMU from leadingacademics, Barry Eichengreen notes that the loss of the exchange rate as an adjustmentmechanism has had a modest effect on encouraging reforms that have enhanced wageflexibility, but that the actual pace of reform is slow.
2.52 Separate research argues more strongly that wage moderation has increased in the run-up to EMU. Lauer (1999) notes how a trend shift has occurred in wage determination.Historically, southern European countries tended to conduct a more expansive wage policythan their northern counterparts but were able to maintain their competitive position due toa continuous devaluation in their currencies. Therefore, being within the single currency mayhave led to more wage moderation.
2.53 Research on wage flexibility on countries inside the Exchange Rate Mechanism (ERM) isinconclusive. Anderton and Barrell (1993) found that real wage flexibility improved in Italyover the period of their ERM membership but such an effect was absent for the other ninecountries in their study. Barrell and Dury (2001) in their study of eleven countries found astructural break in their Spanish wage equation after Spain joined the ERM.
2.54 In their Article IV review of the UK in 2000, the IMF noted that:
“…the potential costs of joining EMU stemming from a lack of sufficient wageflexibility in the United Kingdom may have diminished in recent years.” (IMF, 2000,page 117.)
2.55 The evidence presented suggests that UK wages adjust to imbalances across regionsand across skills. There is considerable scope for variations in wage settlements to reflectconditions in individual industries and regions. Evidence suggests that wages have adjustedto regional labour market conditions in the UK and that the level of responsiveness hasincreased over time.
2.56 The evidence also shows that real wages have become more responsive to labourmarket conditions. This is apparent in the new econometric exercise undertaken for thisstudy. While the evidence presented needs to be interpreted with some caution, the findingsare consistent with an improvement in the UK’s relative position in internationalcomparisons of real wage flexibility.
2.57 Overall, nominal wages are generally adjusted annually in the UK, providing scope for arelatively high degree of nominal flexibility. However, the existence of a spike at zero in thewage change distribution suggests that downward nominal rigidity could potentially interferewith labour market adjustment.
2.58 Wage flexibility has not been fully tested in recent years, and there has been a relativelymore stable macroeconomic environment than in the past. Looking forward, any decision tojoin EMU would put an additional emphasis on real and nominal wage flexibility.
28
2
Conclusion:wage flexibility

29
L ABOUR MOBILITY AND EMPLOYMENT FLEXIBILITY
2.59 Labour market adjustment also occurs through the reallocation of the workforce,between different employers, different locations or different tasks:
• geographic mobility – the ability of the labour force to move within andbetween regions, and across borders;
• employment flexibility – the ability of the labour market to generatecontractual arrangements that match the demands of employers andemployees, including the ability to vary hours of work and length of tenure, asappropriate; and
• functional flexibility – the ability of the workforce to perform a range of tasks,and thereby adapt to changes in the demand for different skills, occupationsor work practices.
Geographic mobi l i ty
2.60 Geographic mobility describes the ability of the workforce to move within and betweenregions. The discussion here is confined to the role of geographic labour mobility as anadjustment mechanism. Geographic mobility also has a social aspect; for example there is anissue of how much mobility is optimal if it can damage family networks and incur socialfracture, as discussed in more depth in HM Treasury (2002a).
2.61 The Treasury’s 1997 assessment of the five economic tests noted that:
“Mobility of labour is important in ensuring that people can find jobs when theyneed them. Mobility between Britain and other EU countries is not particularly high,especially compared with mobility between US states, for a variety of cultural andinstitutional reasons”. (HM Treasury, 1997, page 22.)
2.62 This section provides a more comprehensive analysis and contrasts geographic mobilityin the UK and euro area with the US. It observes that mobility is weaker in Europe than theUS, but argues that this may not constitute a major impediment to overall labour marketflexibility in EMU, provided that other characteristics of flexibility are strong.
2.63 The EMU study by HM Treasury The United States as a monetary union sets out how thegeographic mobility of the workforce has been found to be an important adjustmentmechanism in the US. Blanchard and Katz (1992) found that following an economic shock inthe US, migration was the main mechanism by which the employment rate adjusted back toits original level. Similar findings have been reported elsewhere, for example Bayoumi andPrasad (1996). The work of Blanchard and Katz is often cited as evidence that for monetaryunions to be successful, labour must be mobile. The authors noted that:
“Labor mobility across European countries is also likely to remain lower than labormobility across U.S. states. To the extent that labor mobility is the main source ofadjustment in the United States, this suggests that shocks will have larger and longerlasting effects on relative unemployment in Europe…our paper thus warns, theadjustment to relative shocks in the European common currency area may turn outto be a painful and protracted process”. (Blanchard and Katz, 1992, page 56.)
CH A R AC T E R I S T I C S O F FL E X I B L E L A B O U R MA R K E T S2
Mobility inthe US

CH A R AC T E R I S T I C S O F FL E X I B L E L A B O U R MA R K E T S
2.64 As discussed in Box 2.2, the macroeconomic costs implied by low geographic mobility ina currency union can be traced back to Optimum Currency Area (OCA) theory (Mundell,1961). It observes that low geographic mobility in the EU may not be as large a constraint asis sometimes perceived. Nevertheless, geographic mobility is still desirable because, forexample, it opens up new opportunities for work and training, and hence for the acquisitionof further transferable skills.
2.65 Despite ‘legally’ free movement across EU Member States (guaranteed in law by the EUtreaty), geographic mobility between EU countries is limited and unlikely to act as asignificant adjustment mechanism.10 As set out in HM Treasury (2002a), only around 0.1 percent of the total EU population changed official residence between Member States in 2000.Moreover, only a small proportion of individuals are willing to commute across borders inorder to work, while maintaining residence in their own country. Chart 2.7 shows that around0.4 per cent of the EU population work in another country, split broadly evenly betweenworking inside and outside the EU.
30
2
Box 2.2: Geographic labour mobility and OCA theory
Because geographic mobility has been found to be high in existing monetary unions suchas the US, it is often claimed that, in order for monetary unions to be successful, labourmust be mobile within the currency area. In contrast, low rates of mobility in the euro areahave raised some concerns about its viability as a single currency area.
Optimal Currency Area (OCA) theory, first developed by Mundell (1961), is the startingpoint for analysing these issues.
In his original work, Mundell analysed how economies respond to disturbances under fixedand floating exchange rate regimes. His analysis assumed that nominal wages and priceswere slow to adjust and hence relative wage flexibility was limited. Under a fixed exchangerate regime, factor mobility, including the geographic mobility of labour, provided a criticaladjustment mechanism following a regional asymmetric shock. In particular, geographicmobility implied that unemployed workers would move from depressed to boomingregions to restore equilibrium.
The subsequent development of OCA theory has emphasised that relative wage flexibilityand capital mobility provide alternative ways for economies to adjust to shocks.a Crucially,if these mechanisms are sufficiently strong, then a currency area may be able to respondefficiently to asymmetric shocks even if the geographic mobility of labour is low. Thecombination of high capital mobility and flexible wages encourages capital to flow towardsregions of high unemployment rather than requiring labour to move to regions of highemployment.
Low geographic mobility in the EU may therefore not be as large a constraint as issometimes perceived. However, it remains the case that greater geographic labourmobility will tend to enhance overall labour market flexibility, for example by opening upnew opportunities for training, and will be particularly important if other mechanismsallowing adjustment to regional imbalances are weak.
a Further details are provided in Peter Kenen’s contribution to the EMU study Submissions on EMU from leadingacademics, and also in Bean (1992).
Mobility acrossEU borders
10 Indeed, Krueger (2000) notes that there was no tendency for mobility to increase after the remaining restrictions onmobility were removed in 1993.
Geographicmobility and OCA theory

31
2.66 Cross border movements between the UK and other EU Member States are also fairlylow. While the UK has experienced a net inflow of migrants during the 1990s, only around onequarter of those entering the UK and one third of those leaving the UK were from the EUcountries, with the net flow almost balanced. Much of the net inflow is due to migrants fromcountries outside the EU, split between Commonwealth citizens and citizens of other non-EU countries. Cross-border migration between the UK and the rest of Europe has notsubstantially increased over the 1990s.
2.67 Data for the US are not strictly comparable, but movements across State boundariesindicate considerably greater mobility. Around 6.7 million people a year crossed state bordersin the 1990s, equivalent to 2.5 per cent of the total population.
2.68 These cross-border movements have to be seen in the context of mobility withincountries, where the factors that limit international mobility (such as language and culturalbarriers) apply less strongly.11 In his contribution to the EMU study Submissions on EMU fromleading academics, Daniel Gros argues that if mobility is as low within countries of amonetary union as it is between them, then the monetary union should be no more difficultto manage than the situation in individual countries.
2.69 Evidence suggests that mobility within EU Member States is low. In 1999, just 1.2 percent of the total population or 1.4 per cent of the employed population of the EU movedregions (essentially within the same Member State). While comparisons with the US aredifficult due to differences in size, evidence suggests that in 1999 around 5.9 per cent of thetotal US population changed residence between US counties (European Commission, 2002b).
CH A R AC T E R I S T I C S O F FL E X I B L E L A B O U R MA R K E T S2
Chart 2.7: Cross border commuting, 1999
Source: European Commission, 2002b.
0.0
0.2
0.4
0.6
0.8
1.0
1.2
1.4
1.6
1.8
EUFinSpaDenGerUKNldPorFraAutLuxBel
Per cent of employed population
Resident in Member State, working in another
Resident in Member State, working outside the EU
Mobility withincountries
11 The European Commission (1995) found that the main reason for not working abroad was in fact simply anunwillingness to do so. Cultural and language barriers, though important, were cited as less of a constraint.

CH A R AC T E R I S T I C S O F FL E X I B L E L A B O U R MA R K E T S
2.70 Table 2.4 provides a cross-country analysis of inter-regional migration. Within the EU,the UK appears to have relatively high gross migration, on a similar scale to that of the US.However, in contrast to the US, net migration is relatively low in the UK, and is similar to otherEU countries.12 One difficulty with these comparisons is that regional classifications differ;data are for level 2 units except for the UK and US, which are on the ‘larger’ level 1 definition.For the UK and US, other things being equal, the size of the migratory flows would appeareven larger if smaller regional units were being observed.
Table 2.4: Rates of labour mobility
Ratio of Ratio of net Ratio of grossNumber gross flows flows to flows to net
of regions to population population flows
1995 1998
Belgium 11 1.27 - 0.09 7.4
Finland 5 0.92 - 0.09 10.3
France 22 1.49 1.58 -
Germany 16 1.24 1 0.10 7.8
Italy 20 0.50 0.532 0.10 19.3
Netherlands 12 1.61 - 0.07 4.3
Portugal 7 0.543 - 0.12 21.8
Spain 17 0.60 4 - 0.07 11.7
Sweden 8 1.61 - 0.16 9.8
UK 12 - 2.30 0.13 5.5US 51 2.22 2.40 0.37 15.4Source: OECD (2000b).1 Data for 1993 not 1995.2 Data for 1997 not 1998.3 Data for 1990 not 1995.4 Data for 1994 not 1995.
2.71 Empirical evidence confirms that mobility is not a key adjustment mechanism withinEU countries (OECD, 1999a; De Grauwe and Vanhaverbeke, 1991; Decressin and Fatás, 1995;Obstfeld and Peri, 1998). The OECD note that:
“Statistical measures of the relationship between migration and regional labourmarket variables, suggest that geographic labour mobility is limited as anequilibrating mechanism in the euro area”. (OECD, 1999a, page 129.)
2.72 Research that focuses specifically on the UK suggests that geographic mobility isgenerally limited. In particular, unemployment rates are not found to act as a strong incentiveto migrate (Lindley et al., 2002) or at least that large and persistent unemploymentdifferentials are required across localities for workers to start to migrate from declining toexpanding regions (Jackman and Savouri, 1999).
2.73 Jackman and Savouri also find that there appears to have been no change in theresponsiveness of labour mobility to unemployment between 1974–86 and 1986–97. This isnot a unanimous view. For example, Cameron and Muellbauer (2001) find that job migrationrates have tended to increase since 1989.
32
2
Empiricalevidence on
mobility
12 Gross migration (or flows) shows the proportion of the resident population that changed region over the year within thenational economy. Net flows show the percentage of total migration that results in an actual change in the regionalpopulation.

33
2.74 Unsurprisingly, adjustment in the UK is higher at the local level compared to theregional level. Böheim and Taylor (1999) find that, over the period 1991–97, movementswithin local authorities account for 66.2 per cent of moves, with movements between regionsaccounting for 17.5 per cent of total moves. Similarly, Greenaway et al. (2002) find that 10 percent of the workforce change address each year but only 2 per cent change region.
2.75 However, there still exist areas of high unemployment that sit alongside, and withintravelling distance of, labour markets with high levels of vacancies. This suggests thatmobility is not the root cause of unemployment in the UK, and that other factors are alsoimportant. These include a lack of skills and aptitudes; inadequate matching betweenemployers and jobless people; worries about making the transition from benefits into work;and racial discrimination against ethnic minorities (HM Treasury, 2000a). It might also reflectsegregation in the labour market where, for example, women can be highly segregated intopart-time employment and certain sectors. This can make it difficult to redeploy labour intoother sectors to correct for imbalances in the labour market.
2.76 A number of reasons have been put forward for the low level of geographic mobilityacross the EU and the decline in migration rates over the last few decades. These include:
• the general increase in unemployment across Europe since the 1970s: there islittle incentive to move to a ‘low’ unemployment region if opportunities thereare still limited (Pissarides and McMaster, 1990);
• the narrowing of per capita incomes across the EU: as the gap between wagesor incomes has narrowed between EU Member States, this has lowered theincentive to migrate;
• structural factors: this includes the role of housing market regulations andtransactions costs; the high use of fixed-term contracts, which carry low jobsecurity and so discourage job mobility; and inefficient job matchingmechanisms (see Davies and Hallet (2001) and HM Treasury (2002a) for anoverview); and
• cultural factors: such as language barriers and family networks.
2.77 The housing market may be a particular constraint to labour mobility in the UK. Thiscould be the case if house prices are high in a region where there is excess labour demand.Despite the existence of vacancies in that region, individuals may be unwilling to move if highhouse prices significantly affect cost of living differentials. Muellbauer and Cameron (1998)found evidence that, while relative employment and earnings do influence regional migrationrates, this is counteracted by relatively high house prices.
2.78 Housing tenure may also constrain mobility in the UK by affecting an individual’s abilityto move between regions. It is not straightforward, for example, for social renters to movebetween regions. The incidence of social renting is relatively high in the UK, withapproximately 21 per cent of households renting from councils or housing associations,although this is down from over 30 per cent in the early 1980s (Lind Frogner, 2002a).
2.79 Labour mobility tends to be easier the greater the proportion of private rentedaccommodation. The transactions costs tend to be low in moving between private rentedaccommodation and contracts tend to be for a short time relative to other forms of tenure.The UK has one of the lowest proportions of private rented accommodation available, at11 per cent of the total housing stock (around half the EU average), with only Italy and Irelandhaving a lower percentage. However, the area of highest house prices in the UK, London, hasa higher proportion of private rented accommodation than other regions at 16 per cent of thetotal housing stock.
2.80 Housing market issues are discussed in detail in the EMU study by HM TreasuryHousing, consumption and EMU.
CH A R AC T E R I S T I C S O F FL E X I B L E L A B O U R MA R K E T S2
Why is mobilitylow in Europe?
The housingmarket in the UK

CH A R AC T E R I S T I C S O F FL E X I B L E L A B O U R MA R K E T S
2.81 As set out in HM Treasury (2002a), many of the barriers to mobility relate to familycommitments, career progression and benefits, and property. Therefore, the willingness tochange residence tends to drop sharply once individuals reach their mid-thirties, implyingthat adverse demographics may reduce the mobility of the EU labour force going forward.
2.82 In his contribution to the EMU study Submissions on EMU from leading academics,Barry Eichengreen notes that the transparency of the single currency will facilitate greatermobility over time, but that it will be a slow process. The question therefore is whether thecurrent low level of geographic mobility is likely to be a constraint to the viability of EMU andits successful operation. There are several reasons why this may not be the case:
• labour mobility is only appropriate when shocks are permanent: given the largesunk costs involved in moving residence, a decision to migrate can be largelyirreversible and so inappropriate when a shock requires short-termstabilisation. Geographic mobility is therefore unlikely to be an idealsubstitute for monetary policy, which responds to short-term or cyclicalshocks over the business cycle;
• mobility is limited within and not just between EU Member States: as discussedabove, mobility has not been a significant adjustment mechanism within EUcountries, despite the fact that the persistence of regional differences inunemployment appears to be greater within rather than across Member States(see Section 3). However, despite a low level of mobility, these nationalmonetary unions functioned effectively in the presence of shocks at theregional level (Eichengreen, 1998). In his contribution to the EMU studySubmissions on EMU from leading academics, Daniel Gros observes that thedifference between international and inter-regional mobility in Europe is low,such that low mobility in EMU should be no more of a constraint than withinthe Member States themselves;
• the historical importance of mobility in the US might have been overstated:recent work revisits the numbers of Blanchard and Katz and develops a verydifferent interpretation of US experience, suggesting that in the past 30 yearsemployment rates in the US have actually recovered very slowly in response tostate specific shocks (Glyn and Rowthorn, 2002). In a similar vein, Asdrubali etal. (1996) estimate that in the US labour migration accounts for only 2.7 percent of the adjustment to a shock each year, suggesting that the role ofmobility is only of marginal importance;
• the assumptions of OCA theory: as discussed in Box 2.2, subsequentdevelopments of OCA theory have emphasised that relative wage flexibilityand capital mobility provide alternative ways for economies to adjust toshocks. If these mechanisms are sufficiently strong, then a currency area maybe able to respond efficiently to asymmetric shocks even if the geographicmobility of labour is low;
• social costs: the economic benefits of geographic mobility need to be weighedagainst the potential social costs. High geographic mobility may erode socialsupport structures, contributing in particular to the breakdown of familynetworks; and
• regional concentration: in his contribution to the EMU study Submissions onEMU from leading academics, Daniel Gros argues that high mobility increasesthe degree of regional concentration and hence the susceptibility of aneconomy to asymmetric shocks.
34
2Mobility unlikely
to increaserapidly...
...so will lowmobility be a
barrier to EMU’ssuccess?

35
2.83 In conclusion, while in theory geographic labour mobility helps an economy respond tostructural changes, the slow speed with which labour moves in the EU means it cannot berelied on as an adjustment mechanism. In any case, geographic mobility would be animperfect substitute for the loss of monetary policy given the latter’s role in responding toshocks that are more cyclical in nature.
2.84 Low geographic labour mobility need not necessarily undermine the flexibility of thelabour market as a whole. However, this requires that other characteristics can compensate.That said, more geographic mobility would help adjustment where other labour marketadjustment mechanisms are slow, supporting a successful EMU for existing members, and forthe UK and other countries should they decide to join.
Employment f lex ib i l i ty
2.85 Employment flexibility (sometimes called job mobility) refers to the ability, orwillingness, of employees to change employment quickly. Two aspects of employmentflexibility are considered: the structure of employment, i.e. the composition of work on offer,and the degree of flexibility in working time.
2.86 Not all employment is of a full-time or permanent variety. Rather employers andemployees can both benefit from a diversity of working patterns, enabling them to offer ortake jobs that suit their particular needs. Flexible working arrangements can help to increasethe supply of labour, by making it easier for new workers to enter the labour market in orderto take up new job opportunities. They can also have a beneficial impact on productivity, bysupporting the more effective use of human resources within the economy. This includes, forexample, the better utilisation of the skills of those with caring responsibilities. However, iflabour market regulations constrain the choices of employers and employees, then this mayreduce the patterns of work available. In turn, this may increase the likelihood of anindividual becoming unemployed or being excluded from the labour market altogether,hence reducing the flexibility of the labour market.
2.87 The proportion of total employment made up of part-time or temporary work is notconstant across countries or indeed the business cycle. Chart 2.8 shows that the incidence ofpart-time employment in the UK increased steadily over the 1980s and early 1990s, fromaround 20 per cent of total employment to around 25 per cent. Since that time, the figure hasremained broadly stable.
CH A R AC T E R I S T I C S O F FL E X I B L E L A B O U R MA R K E T S2Conclusion:geographic
labour mobility
Part-timeemployment
Chart 2.8: Part-time employment in the UK
Source: Labour Force Survey.
19
20
21
22
23
24
25
26
200019981996199419921990198819861984 2002
Per cent of total employment

CH A R AC T E R I S T I C S O F FL E X I B L E L A B O U R MA R K E T S
2.88 The UK has a much higher proportion of part-time employment than most OECDcountries. During the 1990s, the incidence of part-time employment increased in manyEuropean countries, and by 2001 ranged from around 5 per cent of total employment inGreece to around one third in the Netherlands (Chart 2.9).
2.89 When employment is sufficiently flexible to generate part-time jobs, a range of groupsare better able to enter the labour market. The composition of part-time employment alsosuggests that employment flexibility is high in the UK and parts of Europe, notably:
• part-time employment is generally undertaken by females. In the UK, 79 percent of employees in part-time work are women, a pattern that is reflectedacross the EU. To a large extent, this reflects choice: in the UK, almost 73 percent of women working part-time do not want a full-time job (Eurostat, 2001).In addition, it is clear that the availability of part-time employmentopportunities has been key to boosting female employment rates. EU datasuggest countries with a higher incidence of part-time work tend also to havehigher female employment rates, though this relationship is not absolute.However, the prevalence of part-time work may reflect the absence of otherflexible working options that enable people to combine full-time work withfamily responsibilities. As in many countries, the nature of part-time work inthe UK generally means lower pay and more limited training and careerprogression prospects (Walby and Olsen, 2002); and
• in recent years, there has been an increase in male part-time employment inEurope, from around 4.2 per cent of employment in the EU in 1990 to 5.6 percent in 2001. In part this reflects the increase in the number of students, whooften work part-time during study. Again this may illustrate employmentflexibility – as the demand from students for part-time jobs increases, thelabour market provides them.
36
2
Chart 2.9: Change in the incidence of part-time employment, 1990 and 2001
Source: OECD, 2002a.Note: Data are 1999 for Germany and UK.
0 5 10 15 20 25 30 350
5
10
15
20
25
30
35
2001 = 19902001 > 1990
2001 < 1990
GreKor
Spa Por
Lux Ita
Ire
Fra
Tur
US
SweDen
NorIce
Nld
AusSwzJap
UKNZ
CanGerBel
Fin
Percentage of total employment, 2001
Percentage of total employment, 1990

37
2.90 However, if the composition of part-time employment becomes overly segregated thenthis may limit the flexibility of the labour market. For example, in the UK private sector, part-time jobs are heavily concentrated in relatively low-skilled occupations. This may force thosechoosing to work part time into a low-skilled occupation regardless of their own skill level. Forexample, the Equal Opportunities Commission (2001) has noted that few women who workpart-time are in high status jobs.
2.91 Moreover, as noted above, the composition of employment also matters for patterns ofpay. Evidence suggests that the relative pay of women in part-time employment has declinedsince the 1970s (Desai et al., 1999). In terms of full-time employment, the ratio of women’s tomen’s pay has risen since the 1970s. However, in terms of part-time employment the ratio islargely unchanged.
2.92 Fixed-term or temporary work contracts may assist labour market adjustment byenabling workers to move jobs quickly. Fixed-term contracts may also provide a bridge topermanent employment by enabling novice workers to gain experience. In addition,employers may be more willing to offer fixed-term contracts when the outlook for theeconomy is more uncertain. Consistent with this, Otoo (1999) concluded that a rising share offixed-term employment has reduced the natural rate of unemployment in the US – most likelydue to improved matching.
2.93 However, a high proportion of temporary workers may be detrimental to the economyif it reduces the incentives for employers to offer training and development opportunities toworkers who they judge are unlikely to stay with them in the longer term.
2.94 Given these contrasting arguments, it is important to be cautious when drawingconclusions about the relationship between labour market flexibility and the proportion ofworkers on fixed-term contracts. In addition, the relationship will depend on the ease withwhich permanent contracts can be terminated.
2.95 In the UK, 6.7 per cent of employees were on temporary contracts in 2000. This is low byEuropean standards, where the average was 13.4 per cent (Chart 2.10). Spain is an outlier inEU terms, with a third of employees on temporary contracts.
CH A R AC T E R I S T I C S O F FL E X I B L E L A B O U R MA R K E T S2
Fixed-termcontracts
Chart 2.10: Temporary contracts, 2000
Source: Eurostat, 2001.
Percentage of total employees
0
5
10
15
20
25
30
35
LuxIreUKAutBelItaDenGerGreNldSweFraFinPorSpaEU

CH A R AC T E R I S T I C S O F FL E X I B L E L A B O U R MA R K E T S
2.96 People may, of course, take part-time or temporary employment only because theycannot find full-time or permanent work. Evidence for the UK suggests that the number of‘involuntary’ part-time and temporary workers is low. In 2000, the proportion of part-timeworkers who were in part-time work because they could not find a full-time job was 9.7 percent, the third lowest in the EU. This compared with an overall EU average of 15.8 per cent,although with a range from 3.5 per cent in the Netherlands to 43.7 per cent in Greece(Eurostat, 2001). Workers who would prefer a permanent job but are in a temporary positionappear to be more prevalent. In both the UK and EU, around 35 per cent of workers on fixed-term contracts would like a permanent job but are unable to find one.
2.97 Diverse working patterns, such as shift work and evening work, benefit employersbecause they enable them to match more closely labour inputs to production and also cutdown on labour costs by eliminating overtime payments. The evidence presented in Table 2.5suggests that there is a high incidence of these practices in the UK. Evans et al. (2001),however, note that while such working arrangements have become more common across theOECD countries, they are far from widespread.
Table 2.5: Incidence of diverse working patterns (2000)
Percentage of employees who usually work:
Shift work Evening Night Saturday Sunday
UK 10.9 31.4 12.6 25.9 13.3EU average 12.7 18.0 7.6 27.9 11.4EU (Maximum) 24.4 31.4 12.6 41.3 19.5EU (Minimum) 6.0 5.2 2.3 10.0 4.3
Source: Eurostat, 2001
2.98 It is also informative to look at the degree of job turnover, while recognising that highturnover may also be to the detriment of firm-specific human capital formation. Median jobtenure is 3.4 years in Australia, 4.2 years in the US and 5.0 years in the UK compared to7.3 years in the euro area (OECD, 1999a). The lower tenure in the UK appears to reflect ahigher propensity of voluntary quits rather than lay-offs. This is important because a highernumber of involuntary job separations such as redundancies may indicate a failure of thelabour market to adjust smoothly, whereas voluntary separations are consistent with a morefluid labour market. Moreover, to the extent that high average tenure arises becauseemployment regulations make lay-offs unduly expensive, then this is a sign of inflexibility.
2.99 Evidence for the UK suggests that, in aggregate, job tenure has remained relatively stablesince the mid 1970s, and that overall quits rather than lay-offs are the main reason behind jobseparations (Gregg and Wadsworth, 1999). However, there are differences across gender, withtenure among women with children increasing (reflecting the increased provision and use ofmaternity leave) while tenure has fallen for men and women without children.
2.100 Evidence also suggests that the UK has a greater diversity in hours worked than otherEU countries. Most countries tend to have a heavy concentration of employees workingwithin a narrow range of hours, shown by a prominent peak in the hours’ distribution. TheUK, in contrast, shows little evidence of a spike, suggesting that working hours are generallyunaffected by the legislation that is in place (Evans et al., 2001).
2.101 In conclusion, the UK economy exhibits a relatively high degree of employmentflexibility, demonstrated by a high incidence of part-time working and the adoption of flexibleworking practices. This may go some way to offsetting the low level of geographic mobilitydiscussed earlier.
38
2
Diverse workingpatterns
Job turnover
Diversity inhours worked in
the UK
Conclusion:employment
flexibility
Choice ornecessity?

39
Funct ional f lex ib i l i ty
2.102 Within a single currency area it is important that individuals have the basic skills tocompete for a wide and changing range of jobs. Skilled workers can adapt faster and moreeffectively to technological change, making the economy more flexible and more productiveover the longer term.13 In particular, it is important that workers have the ability to respond toany structural changes that membership of a single currency could bring.14 The Treasury’s1997 assessment noted that:
“Another important area where the performance of the UK may not meet thedemands of a monetary union is in the field of lifelong learning and skills. The UK isrelatively strong in higher education, but elsewhere levels of attainment remain low,and many young people leave school without the basic skills they need for themodern labour market”. (HM Treasury, 1997, page 24.)
2.103 Functional flexibility describes the ability of the labour force to acquire and applydifferent skills. It reflects both the educational attainment of the workforce and ongoingtraining and development. Both are necessary in order to tackle:
• skills shortages: this relates to difficulties in recruitment where the skills of theworkforce do not match those demanded by actual or potential employers;and
• skills gaps: deficiencies in the skill level of a firm’s existing workforce.
2.104 Since the 1997 assessment, there is evidence that the incidence of firms citing skilledlabour shortages and skills gaps has been falling in the UK. This has come at a time when,given the continued falls in unemployment, these might have been expected to increase. Inparticular:
• the Employer Skills Survey shows that the level of skills shortages fell from102,000 in 1999 to around 94,000 in 2001 for firms with five or moreemployees. For firms of the same size, the survey shows that the level of skillsgaps fell from 860,000 in 1999 to 748,000 in 2001 (see Lind Frogner, 2002b, formore detail);
• Chart 2.11 plots the level of skill shortages, as reflected in the Confederation ofBritish Industry (CBI) Survey and the claimant count unemployment rate. Itillustrates that skill shortages are highly cyclical, rising when unemploymentfalls and the pool of available labour becomes smaller in size. However, itshows that while unemployment has fallen to an historically low level, skillshortages have increased but remain at lower levels than in the previous twotroughs of unemployment and are not significantly higher than in 1997; and
CH A R AC T E R I S T I C S O F FL E X I B L E L A B O U R MA R K E T S2
The importanceof skills
13 Greenaway et al. (2002) find that individuals in the UK with a high level of general skills are more likely to move fromdeclining to expanding sectors. Mauro and Spilimbergo (1998) find that labour market adjustment is sluggish among thelow skilled. Workers with high skills migrate quickly in response to a decline in regional labour demand. In contrast, thelow skilled either drop out of the labour force or remain unemployed for a lengthy period.14 The existence of skills shortages matters for labour market flexibility because it may encourage employers to raisewages in order to attract workers from other firms and industries. However, Lind Frogner (2002b) discusses what impactskill shortages have had on the growth of average earnings and finds that while skill shortages do increase earnings growththe impact is only small, such that there would need to be a notable increase in shortages for there to be a significantimpact on earnings. Lind Frogner also notes that since 1998 there appears to have been a change in the relationshipbetween earnings and skills shortages. Over recent years, it appears that the time it takes for skill shortages to have animpact on earnings has shortened, implying a more flexible labour market with less inertia.
Skills shortagesfor firms have
not significantlyincreased…

CH A R AC T E R I S T I C S O F FL E X I B L E L A B O U R MA R K E T S
• the British Chambers of Commerce survey shows that, having followed abroadly upward trend in the early to mid 1990s, recruitment difficulties havebeen broadly stable since 1997 in both the manufacturing and service sectorsand on a level comparable to the late 1980s.
2.105 While this suggests that skill shortages have not been as large a constraint as the 1997assessment suggested they might be, skill imbalances and gaps still remain in the widereconomy. Despite debates over the international evidence, some clear messages emerge fromthe data about the strengths and weaknesses of the UK skills base, as set out in HM Treasury(2002c):15
• the number of people in the UK with high skills compares well withinternational levels (although the UK still trails the world leader – the US);16
• the level of intermediate skills in the UK is low, especially compared withGermany, other European countries and, under some interpretations, the US;and
• there are a large number of people in the UK workforce with low skills. Morethan a third of UK workers have low skills, compared to less than a fifth inGermany.
2.106 Intermediate skills are particularly important both in their own right and also inproviding a platform for individuals to progress to higher skill levels. There have been somerecent signs of improvement, with the percentage of all working age individuals with NVQlevel 3 or higher (which broadly represents anything at or above an intermediate level ofskills) increasing from 37 per cent in 1997 to 44 per cent in November 2002 (Chart 2.12).
40
2
Chart 2.11: Unemployment1 and skill shortages2
Source: ONS and CBI.1 Claimant count unemployment rate (source: ONS).2 Respondents identifying skilled labour shortages as a factor limiting output (source: CBI survey).
0
10
20
30
40
50
60
0
2
4
6
8
10
12
Unemployment rate(RHS)
CBI Skill Shortages(LHS)
CBI s
kill
shor
tage
s Unemploym
ent rate
1972 1974 20022000199819961994199219901988198419821978 19801976 1986
Per centPer cent balance
…butimbalances
remain
15 International comparisons of human capital are difficult to make. Some countries do not certify all education andtraining, and it is difficult to establish equivalences between different qualification systems where they do exist.International comparisons therefore tend to vary somewhat depending on the interpretation of the evidence, but theposition of the UK relative to its main European competitors in terms of intermediate skills appears poor in almost allstudies (see for example, O’Mahony and de Boer, 2002).16 It is, however, particularly difficult to make skill comparisons with the US. For example, education and training is basedon state and local systems, and there are very few nationally recognised qualifications. Moreover, there are difficulties inclassifying the skill level of high school graduates. For more detail on this point see HM Treasury (2002b).
Signs of progresssince 1997…

41
2.107 Moreover, evidence suggests that, since 1997, the flow of skills into the workforce hasimproved reflecting a better performance of the school system. In particular, literacy andnumeracy levels have increased. Between 1997 and 2002, the percentage of 11 year oldsachieving the levels expected for their age in English rose by almost 12 per cent, and in mathsby 11 per cent. In addition, the proportion of 16 year olds obtaining at least five GCSEs atgrades A* – C rose from 45 per cent in 1997 to 51 per cent in 2002.
2.108 However, the Government has recognised that more can be done to increase the supplyof skills, and with it improve productivity growth and create stable employment. TheGovernment is taking concerted action to improve both the skills of young people enteringthe workforce and the opportunities available to those already in the workforce to acquirenew skills.
2.109 To maintain this progress, the Government has introduced further reforms, includingthe setting of demanding new targets, such as minimum attainment targets for schools andnew targets to increase post-16 participation in education and training; reforms to strengthenand expand vocational programmes such as the Modern Apprenticeships (MA) scheme; andmeasures to improve access to higher education. More details of this strategy are set out inHM Treasury (2002c) and HM Treasury (2002d).
2.110 But, this will only create a gradual change in the supply of skilled workers in the UK and,even over the medium term, the bulk of the UK’s workforce will be made up of existingemployees. It is also necessary, therefore, that the UK continues to develop the trainingopportunities for those already in work. The Government has introduced a number of newpolices to this end, including polices to improve the volume, quality and distribution of initialand continuing training.
2.111 In particular, the Skills for Life Programme has already supported over 250,000 adults toimprove their basic literacy and numeracy skills, while the University for Industry, whichoffers flexible and convenient learning opportunities, has reached over 500,000 adults. TheGovernment is committed to reducing the number of adults in the workforce who lack NVQlevel 2 skills by 40 per cent by 2010. Its plans to achieve this will be set out in detail in aNational Skills Strategy, which will be published in summer 2003.
CH A R AC T E R I S T I C S O F FL E X I B L E L A B O U R MA R K E T S2
…but moreprogress can be
made
Chart 2.12: Percentage of working age population with NVQ level 3+
Source: Labour Force Survey.Note: Figures are for Great Britain.
36
37
38
39
40
41
42
43
44
45
May-97 May-98 May-99 May-00 May-01 May-02
Per cent
Improvingworkforce skills

CH A R AC T E R I S T I C S O F FL E X I B L E L A B O U R MA R K E T S
2.112 Overall, a highly educated workforce with a culture of lifelong learning is more likely tobe able to adapt to an economic shock. The number of people in the UK with high skillscompares well with international levels. However, the level of intermediate skills is low and alarge proportion of people possess low skills. Although skill shortages do not appear to havebeen as big a constraint for firms as the 1997 assessment suggested they might be, a continualimprovement in skill levels, particularly among those with the lowest skills, is necessary inorder that the UK economy can continue to respond to technological change:17 EMU will puta spotlight on functional flexibility alongside other types of flexibility. The Government’sapproach to improving skills, which will be set out in the National Skills Strategy, is likely tohave a positive impact on labour market outcomes.
42
2
17 Haskel and Martin (2001) provide econometric evidence that if technological change continues to be skill biased thenpolicies that create a one-off increase in the skill level of the workforce will only lead to a temporary reduction in skillshortages.
Conclusion:functionalflexibility

3 L A B O U R MA R K E T OU TC O M E S
43
3.1 This section analyses labour market outcomes in the UK and the euro area. It begins bydiscussing the recent performance of the labour market in both areas, by focusing onemployment and jobs. While noting that progress has been made across Europe it askswhether the improvements will unwind following an economic shock. The discussiontherefore moves on to consider a range of indicators that enable an appraisal of whether suchimprovements are sustainable.
The Treasury’s 1997 assessment stressed that Europe needed to be able to create jobs andrespond to structural change in order to ensure the success of EMU. Creating employmentopportunities for all has formed an integral part of reform efforts in the UK and in Europe.Progress on reform has delivered notable improvements. Employment andparticipation rates have increased in the UK and euro area, and between 1997 and 2001over 10 million jobs were created in Europe, at a time of stronger growth in the EU.
However, historically, in the face of a shock, employment growth has been slow to returnto a sustainable path. This section considers a range of outcomes to assess whether therecent improvements, with respect to greater job creation, are sustainable and reflect anunderlying improvement. It considers:
• the structural unemployment rate: recent estimates suggest that theequilibrium unemployment rate has declined in the UK over the 1990s, and ataround 51/2 per cent is approaching the current US rate. This performance hasbeen matched in some smaller euro area economies such as Ireland and theNetherlands. But in the three largest continental European economiesimprovements have only come through recently, and from relatively high startingpoints;
• wage pressures: the recent profile of average earnings growth in the UK issuggestive of some improvement on the supply side. During the current economiccycle unemployment has fallen to historic lows yet average earnings growth hasremained consistent with the inflation target and trend productivity growth;
• mismatch: there has been an improvement in the UK between the matching ofvacancies and unemployment in the 1990s. Moreover, there has been a reductionin the regional dispersion of unemployment rates, as the market has been betterable to match the supply and demand for labour in individual regions. However,regional unemployment differentials are more prevalent in other parts of Europe;and
• cyclical responsiveness of employment: the pace at which employmentincreased in the UK in the 1990s recovery, compared to that of the 1980s, suggeststhat employment has become more responsive to the cycle.
Together, these indicators are consistent with an improvement in the underlyingperformance of the UK labour market and point towards a more flexible labour marketthan in the past. However, progress in the rest of Europe has been mixed, with significantdifferences remaining in the level of structural unemployment and the pace with which itis being reduced.
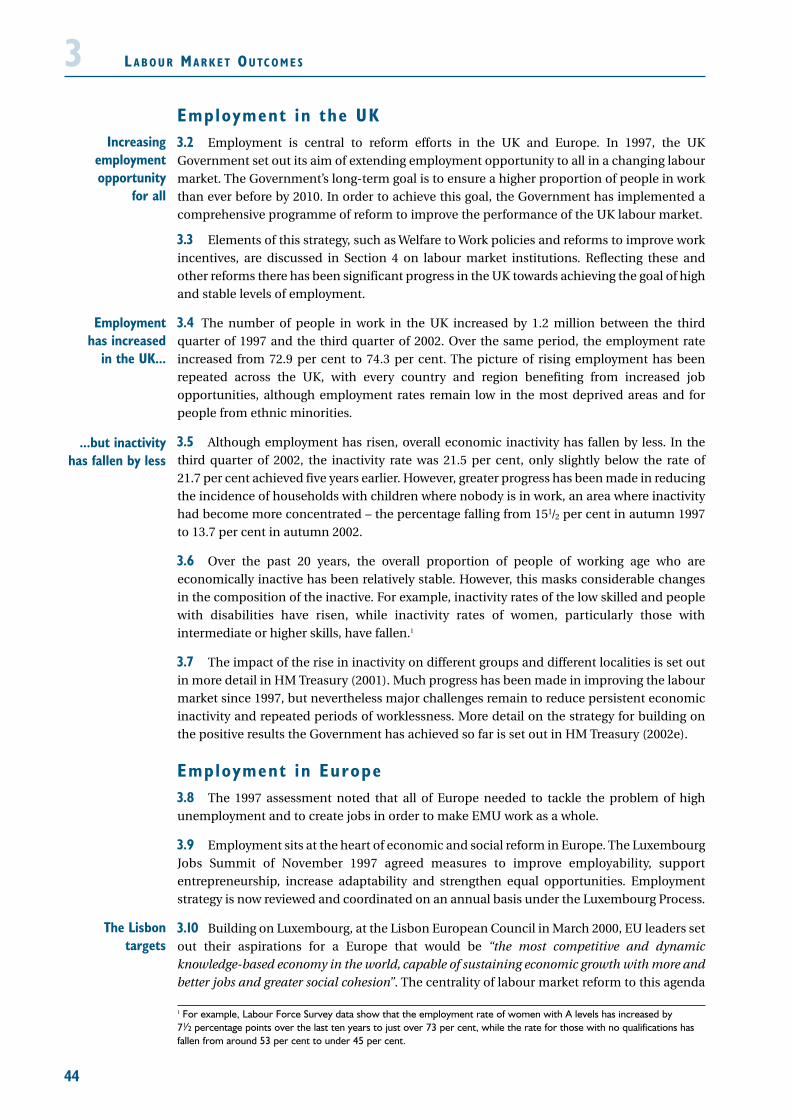
L A B O U R MA R K E T OU TC O M E S
44
3Employment in the UK3.2 Employment is central to reform efforts in the UK and Europe. In 1997, the UKGovernment set out its aim of extending employment opportunity to all in a changing labourmarket. The Government’s long-term goal is to ensure a higher proportion of people in workthan ever before by 2010. In order to achieve this goal, the Government has implemented acomprehensive programme of reform to improve the performance of the UK labour market.
3.3 Elements of this strategy, such as Welfare to Work policies and reforms to improve workincentives, are discussed in Section 4 on labour market institutions. Reflecting these andother reforms there has been significant progress in the UK towards achieving the goal of highand stable levels of employment.
3.4 The number of people in work in the UK increased by 1.2 million between the thirdquarter of 1997 and the third quarter of 2002. Over the same period, the employment rateincreased from 72.9 per cent to 74.3 per cent. The picture of rising employment has beenrepeated across the UK, with every country and region benefiting from increased jobopportunities, although employment rates remain low in the most deprived areas and forpeople from ethnic minorities.
3.5 Although employment has risen, overall economic inactivity has fallen by less. In thethird quarter of 2002, the inactivity rate was 21.5 per cent, only slightly below the rate of 21.7 per cent achieved five years earlier. However, greater progress has been made in reducingthe incidence of households with children where nobody is in work, an area where inactivityhad become more concentrated – the percentage falling from 151/2 per cent in autumn 1997to 13.7 per cent in autumn 2002.
3.6 Over the past 20 years, the overall proportion of people of working age who areeconomically inactive has been relatively stable. However, this masks considerable changesin the composition of the inactive. For example, inactivity rates of the low skilled and peoplewith disabilities have risen, while inactivity rates of women, particularly those withintermediate or higher skills, have fallen.1
3.7 The impact of the rise in inactivity on different groups and different localities is set outin more detail in HM Treasury (2001). Much progress has been made in improving the labourmarket since 1997, but nevertheless major challenges remain to reduce persistent economicinactivity and repeated periods of worklessness. More detail on the strategy for building onthe positive results the Government has achieved so far is set out in HM Treasury (2002e).
Employment in Europe3.8 The 1997 assessment noted that all of Europe needed to tackle the problem of highunemployment and to create jobs in order to make EMU work as a whole.
3.9 Employment sits at the heart of economic and social reform in Europe. The LuxembourgJobs Summit of November 1997 agreed measures to improve employability, supportentrepreneurship, increase adaptability and strengthen equal opportunities. Employmentstrategy is now reviewed and coordinated on an annual basis under the Luxembourg Process.
3.10 Building on Luxembourg, at the Lisbon European Council in March 2000, EU leaders setout their aspirations for a Europe that would be “the most competitive and dynamicknowledge-based economy in the world, capable of sustaining economic growth with more andbetter jobs and greater social cohesion”. The centrality of labour market reform to this agenda
Employmenthas increased
in the UK...
...but inactivityhas fallen by less
The Lisbontargets
1 For example, Labour Force Survey data show that the employment rate of women with A levels has increased by 71⁄2 percentage points over the last ten years to just over 73 per cent, while the rate for those with no qualifications hasfallen from around 53 per cent to under 45 per cent.
Increasingemploymentopportunity
for all

45
L A B O U R MA R K E T OU TC O M E S3was underlined by an agreement to ambitious targets for total and female employment, withan employment target for older workers agreed one year later in Stockholm.2
3.11 There have been improvements in the employment performance of the EU labourmarket since 1997, a period which has also seen a pick up in economic growth:
• between 1997 and 2001, over 10 million jobs were created in Europe;
• the EU employment rate increased from 60.5 per cent in 1997 to 63.9 per cent in 2001. On a comparable basis, over the same period, the UKemployment rate increased from 70.0 per cent to 71.7 per cent; and
• the EU participation rate increased from 67.7 per cent in 1997 to 69.2 per centin 2001. On a comparable basis, over the same period, the UK participationrate increased from 75.3 per cent to 75.6 per cent.
3.12 While much has been achieved since 1997 in creating employment opportunities for all,more remains to be done if the EU is to realise its aspirations and potential, as set out in moredetail in HM Treasury (2002a). The EU’s key employment weaknesses lie in its lack ofopportunities for older workers and women, and a steady withdrawal of men, particularlythose without qualifications, from the labour force.
3.13 Europe has seen significant improvements before, which were not subsequentlysustained. Indeed, European experience in the face of an economic shock has been onewhere labour market activity fell and adjustment was insufficiently effective to put theeconomy back quickly onto a path of sustainable growth and rising employment. Followingthe economic slowdown during the early 1990s, the adverse impact on employment lasteduntil 1994, with the employment rate some two and a half percentage points lower than 1991.
3.14 Although employment growth in the UK and Europe has been maintained during therecent period of weaker activity, growth prospects are not guaranteed looking forward. It isnot clear therefore that the recent improvements will be sustained if a more prolongedeconomic shock were to hit the EU economy.
The key labour market outcomes3.15 The remainder of this section therefore focuses on the key labour market outcomes insignalling a flexible labour market, both in general and specific to the challenge posed byEMU. It examines outcome indicators that point to smoother labour market adjustment andthose that show whether any recent improvements are sustainable. It looks at the followingUK and euro area indicators, and where applicable uses the US as a benchmark:
• the structural unemployment rate: unemployment has both a cyclical and astructural component. The longer-term or structural component isdetermined by a set of institutional and behavioural factors, while the cyclicalcomponent will change with the economic cycle. The structuralunemployment rate therefore shows to what extent a fall in unemploymentreflects greater flexibility rather than simply strong cyclical growth;
• wage pressures: Section 2 discussed the importance of real wage flexibility inadjustment. It found some evidence that, in the UK, real wages have becomemore responsive to the level of unemployment. This section looks at theprofile of average earnings growth and long-term unemployment, andexamines if their evolution is consistent with such a conclusion;
Are theimprovements
sustainable?
The keyoutcomes in aflexible labour
market
Employment hasincreased in
Europe
2 The targets are to achieve employment rates of 70 per cent in total, 60 per cent for females and 50 per cent for olderworkers by 2010.

L A B O U R MA R K E T OU TC O M E S
46
3• mismatch: mismatch refers to an imbalance between the supply of and
demand for labour in market segments. Mismatch indicators, such as therelationship between unemployment and vacancies or the dispersion ofregional unemployment rates, may go some way to illustrate how well labouris able to move and the degree to which relative wages can adjust; and
• the cyclical responsiveness of employment: this refers to the responsivenessof jobs to the economic cycle. An increase in responsiveness may be indicativeof an improvement in microeconomic conditions, such as an easing of therestrictions governing hiring and firing or an increase in the incidence oftemporary or part-time employment contracts.3
Structura l unemployment
3.16 It is important to distinguish between the cyclical and structural components ofunemployment. The cyclical component reflects the negative impact of a temporary shockwhereas the structural component is closely linked to the institutional and behaviouralcharacteristics of the economy. It is only when unemployment is at, or close to, itsequilibrium rate that the inflation rate is stable. When unemployment is above this leveldownward pressure should be exerted on inflation and vice versa. Hence this unemploymentrate is termed the non-accelerating inflation rate of unemployment – or NAIRU for short.
3.17 It is not necessary for countries participating in a single currency to have the sameNAIRU: it is deviations from the NAIRU that drive inflationary pressures. But it can be shownthat the more flexible are labour and product markets, the lower is the structural rate ofunemployment (Layard et al., 1991). Therefore, the level of the NAIRU can help to gauge theunderlying degree of flexibility of the economy, while changes in the NAIRU can help indicatewhether the economy has become more flexible over time. Evidence suggests that increasesin the NAIRU are related to poor employment performance (European Commission, 2002c).Therefore the NAIRU is also a good indicator of the sustainability of recent changes inemployment.
3.18 Chart 3.1 shows OECD estimates of the NAIRU since the early 1980s.4 Structuralunemployment increased almost uniformly in Europe between 1980 and 1990. Thediscussion in Section 1 set out how this reflects the interaction of economic shocks andlabour market institutions, leading to temporary increases in unemployment becoming morepermanent and long-standing. Since the early 1990s, on OECD estimates:
• the NAIRU in the UK has fallen from around 8 per cent to around 51/2 per cent,(close to the Treasury’s own estimate of around 51/4 per cent). This isapproaching the current level of the NAIRU in the US;
• progress in the other large EU Member States has been slower. Structuralunemployment has been relatively stable since 1990 and remains at highlevels; and
The NAIRU
3 It should be noted that an increase in the responsiveness of employment may be an indication of an improvement inemployment flexibility but it can also be an indication of a deterioration in wage flexibility. In an equilibrium context, ifwages were perfectly flexible, then employment should react only to labour supply shocks and nothing else, because thewage rate would absorb the labour demand shock.4 Similar profiles are reported in Denis et al. (2002) and Turner et al. (2001).
The NAIRU hasfallen in the UK,
but remains highin some Member
States

47
L A B O U R MA R K E T OU TC O M E S3• there have been significant falls in the NAIRU in some of the smaller EU
Member States such as Ireland and the Netherlands, where performance hasmatched if not bettered the US. Evidence suggests that the strongest increasesin cyclically-adjusted employment have also come in these countries(European Commission, 2002c). However, their weights are relatively smallsuch that their impact on the overall euro area NAIRU is small.5
3.19 Although there are uncertainties in accurately quantifying the NAIRU, Chart 3.1suggests that a significant proportion of unemployment in Europe is non-cyclical (see alsoIMF, 1999). Another way of examining the extent of structural improvement is to look at thePhillips curve (Phillips, 1958), which depicts the relationship between unemployment andinflation. If unemployment is primarily structural, then efforts to reduce the jobless ratebelow this point by boosting aggregate demand will quickly lead to rising inflation. If,however, unemployment falls because of structural improvements, this decline should occurwithout the accompaniment of rising inflation.
3.20 Charts 3.2a–3.2c depict the Phillips curve in the UK, the euro area and the US. In the UKspecifically, two factors points towards a reduction in structural unemployment:
• shifts in the curve: the inward shift in the curve since 1985 suggests thatunemployment has been able to fall further without generating inflationarypressures; and
• movements along the curve: a different interpretation is that expectations haveadapted to inflation targeting since the early 1990s. If this were the case, thePhillips curve no longer describes policy trade-offs. Instead, changes inunemployment are independent of inflation and rather they trace changes inthe NAIRU. In this case, the horizontal curve since the mid 1990s suggests afall in the NAIRU.
Chart 3.1: Estimates of structural unemployment (NAIRU)
Source: OECD, 2002b.
0
2
4
6
8
10
12
14
16
18
1980–82 1990–92 2001 2003
Fra EU12USUKSpaPorNldItaIreGer
Per cent
The Phillipscurve
5 See OECD (2002c) for a breakdown of the change in euro area structural unemployment.
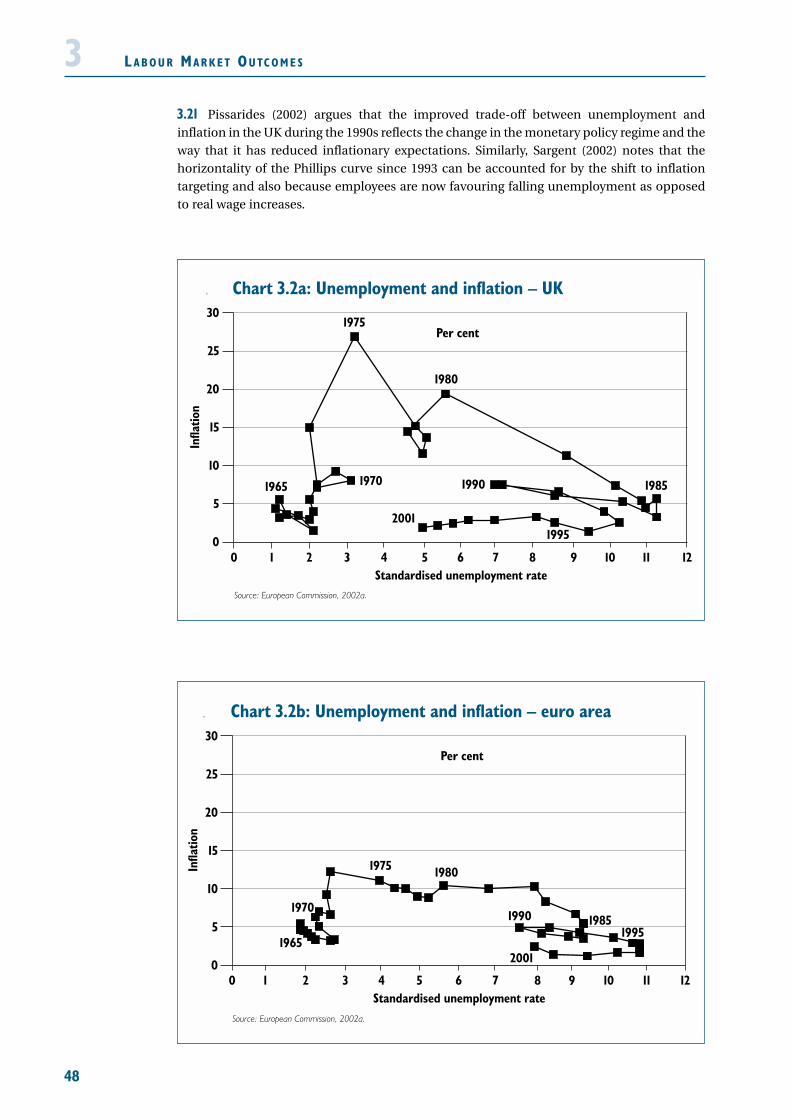
L A B O U R MA R K E T OU TC O M E S
48
33.21 Pissarides (2002) argues that the improved trade-off between unemployment andinflation in the UK during the 1990s reflects the change in the monetary policy regime and theway that it has reduced inflationary expectations. Similarly, Sargent (2002) notes that thehorizontality of the Phillips curve since 1993 can be accounted for by the shift to inflationtargeting and also because employees are now favouring falling unemployment as opposedto real wage increases.
Chart 3.2b: Unemployment and inflation – euro area
0 3 5421 6 9 111087 120
5
10
15
20
25
30
1975Infla
tion
Standardised unemployment rate
1980
1990
2001
1970
19651995
1985
Per cent
Source: European Commission, 2002a.
Chart 3.2a: Unemployment and inflation – UK
0 1 2 3 654 9 111087 120
5
10
15
20
25
301975
Infla
tion
Standardised unemployment rate
1980
1990
2001
1970
1995
1985
Per cent
Source: European Commission, 2002a.
1965

49
L A B O U R MA R K E T OU TC O M E S3
3.22 In the US, the Phillips curve has been relatively flat since the early 1980s; unemploymenthas fallen without generating inflationary pressure. For the euro area as a whole, the Phillipscurve has been reasonably flat since the 1990s, suggesting that the fall in unemployment has,at least partly, been structural in nature. Unlike the situation in the US and UK, however, inaggregate the euro area unemployment rate has not fallen to or below the level recorded in1980 (HM Treasury, 2002a).
3.23 A related indicator is the sacrifice ratio, which measures the amount of unemploymentcreated by reducing inflation. While sacrifice ratios are a useful concept, the estimates tend tobe too volatile to provide a reliable measure of the flexibility of the labour market, asdiscussed further in Box 3.1.
Chart 3.2c: Unemployment and inflation – US
0
5
10
15
20
25
30
1975
Infla
tion
Standardised unemployment rate
1980
19902001
1995 1985
Per cent
Source: European Commission, 2002a.
11109876543210 12

L A B O U R MA R K E T OU TC O M E S
50
3Box 3.1: Sacrifice ratios
Section 2 discussed the concept of nominal and real wage flexibility as an adjustmentmechanism to economic shocks. If downward nominal wage rigidities exist, meaning thatemployees are resistant to cuts in their nominal pay, real wage adjustment could be moredifficult during periods of low inflation. Acting under the constraint of a downward floor towages, firms may make recourse to laying off workers.
Following this line of reasoning, the sacrifice ratio measures the amount of unemploymentcreated (or output lost) by reducing inflation by a certain amount, normally by onepercentage point. Because nominal or real rigidities may increase its value, conceptuallythe sacrifice ratio is a meaningful measure of labour market flexibility. However, it haslimitations, which create problems of interpretation.
The chart above shows a range of estimates (and the average) derived using elevendifferent methods by Andersen and Wascher (1999). It illustrates that estimates of thesacrifice ratio are sensitive to the chosen methodology and specification.
Estimates of the UK sacrifice ratio ranged from 0 per cent to 5 per cent and averaged2 per cent. This means that for each 1 per cent change in inflation, unemployment (oroutput) changed by between 0 and 5 per cent.
The same study also found that country rankings vary dramatically according to thespecification adopted. For example, the US has the fourth lowest sacrifice ratio on oneestimate and the highest on another. Similarly, the UK ranks best on one measure butworst on another. Andersen and Wascher note in their conclusions that:
“Estimates of sacrifice ratios for individual countries are highly sensitive to the estimationmethods used, which may, in part, explain the lack of consensus often found in theliterature.” (Andersen and Wascher, 1999, page 24.)
Overall, sacrifice ratios are useful as a concept, but the estimates tend to be too wide-ranging to provide a reliable measure of the flexibility of a country’s labour market overtime or relative to other countries.
Sacrifice ratios: range of estimates, 1985-98
Source: Andersen and Wascher (1999), Table 12b.
0
2
4
6
8
10
12
14
16
18
Switz
erla
nd
Swed
en
Spai
n
Port
ugal
Norw
ay
New
Zea
land
Neth
erla
nds
Irel
and
Finl
and
Denm
ark
Belg
ium
Aust
ralia
Cana
daUK
Ital
y
Fran
ce
Germ
any
Japa
n
Unite
d St
ates
Maximum
Average
Minimum

51
L A B O U R MA R K E T OU TC O M E S3Wage pressures
3.24 Section 2 discussed the concept of real wage flexibility as an adjustment mechanism.Historically, the problem in the UK has been that real wages have been rigid in the face of highlevels of unemployment, while sustained falls in unemployment have been followed by astrong acceleration in wage growth, i.e. inflexibility and an apparent asymmetry in thereaction of real wages to unemployment. The 1997 assessment noted that the UK economywas approaching a critical point in the economic cycle where, in the past, wage inflationwould have accelerated as unemployment fell further.
3.25 Chart 3.3 shows the recent profile of average earnings and unemployment in the UK. Itis consistent with there having been a recent supply side improvement in the UK – animprovement in wage flexibility and a decline in the NAIRU. During the current economiccycle, unemployment has fallen to rates last seen in the 1970s yet average earnings growth hasremained relatively benign – at around 41/2 per cent. This appears consistent with the inflationtarget and trend productivity growth of 2 per cent.6
3.26 Chart 3.4 shows the wage share in the UK (the share of wages in GDP). If real wages riseabove productivity, income is redistributed from profits to labour, resulting in an increase inthe wage share. Increases in the wage share above 75 per cent of GDP have tended to signallabour market overheating, and have been followed by increases in unemployment. In recentyears the wage share has remained moderate, despite a steady decline in unemployment,suggesting a greater degree of wage moderation than in the past. However, in the past threeyears, the wage share has risen close to levels associated with overheating in the past,suggesting that the unemployment rate may now be close to the NAIRU.
Average earningsgrowth has been
benign
6 The Bank of England’s Inflation report from August 1997 noted that annual nominal earnings growth, at 4.5 per cent, isconsistent with the inflation target and trend productivity, (Bank of England, 1997).
The wage share
Chart 3.3: Average earnings growth and unemployment
Source: ONS.Note: Earnings data are the GB headline rate ( latest 3 months on 3 months a year earlier). Unemployment is ILO unemployment rate.
0
5
10
15
20
25
30
35
1975 19811978 1984 1987 1990 1993 1996
Average earnings growth
Per cent
ILO unemployment
20021999

L A B O U R MA R K E T OU TC O M E S
52
3
3.27 In the short-run, it is difficult to tell whether the moderation in average earnings growthwill be a permanent effect or is simply due to (temporarily) favourable supply conditions. Itis possible, for instance, that benign wage growth reflects the high exchange rate, the wagerate being kept low primarily because the price of imported goods is low. Indeed, Nickell(2001) defines equilibrium unemployment as that consistent with stable inflation and a zerobalance of payments deficit. This definition is arguably restrictive and evidence does suggestthat countries can run balance of payments imbalances for many years. Nevertheless, Nickellstill estimates that the NAIRU has fallen in the UK in the late 1990s and his estimates of aNAIRU of around 5.7 per cent between 1997 and 2000 is similar to the estimates shown inChart 3.1.
3.28 The moderation in average earnings growth may reflect the recent declines in long-termunemployment, a point recently noted in the Bank of England’s Inflation Report (Bank ofEngland, 2002). When the duration of an individual’s unemployment spell increases, theymay decide to stop searching for work or their skills may atrophy. This reduces the effectivesupply of labour such that supply bottlenecks can materialise. To this end, given that thelong-term unemployed are able to exert less downward pressure in the wage bargainingprocess, wages may become less responsive to unemployment. If the long-term unemployeddrift into economic inactivity, their chances of ever returning to work are sharply reduced,effectively reducing labour supply permanently.
3.29 The 1997 assessment therefore rightly emphasised the importance of ensuring thatspecific groups did not become permanently detached from the labour market. This would beimportant not only to smooth adjustment in EMU but also to increase social inclusion. Since1997 there is evidence that such groups are being reintegrated into the UK labour market. Inparticular:
• long-term ILO unemployment (unemployment over 12 months) stood ataround 316,000 in October 2002, compared to an annual average of 710,000 in1997 and a peak of nearly 1.3 million in December 1993. It now constitutesaround 21 per cent of total unemployment, compared to over 30 per cent in1997 and over 40 per cent in the early 1990s (Chart 3.5);
The role of thelong-term
unemployed
Labour marketattachment hasincreased since
1997...
Chart 3.4: Unemployment and the wage share in the UK
Source: European Commission, 2002a.
0 2 4 6 8 10 1269
70
71
72
73
74
75
76
77
78
Unemployment rate (per cent)
Wag
e sh
are
(per
cen
t of G
DP)
1965
1960
1970
1975
2001
19801990
19951985

53
L A B O U R MA R K E T OU TC O M E S3• the lone parent employment rate rose to 53.6 per cent in spring 2002, the
highest for more than 20 years;
• the youth employment rate (workers aged 18–24) has increased from 66.7 percent in October 1997 to 67.4 per cent in October 2002; and
• the employment rate of older workers (50 years and over) has risen from 64.6per cent in October 1997 to 68.7 per cent in October 2002.
3.30 Challenges still remain to ensure employment opportunities for all. Increases in femaleemployment have largely been limited to single women or those with working partners.Conversely, falls in male employment have largely occurred among single men or those withnon-working partners. Typically, therefore, increases in employment have increased thenumber of households in which all of those of working age were in work, and concentratedworklessness in households where no one was in work. For families with children, especiallylone parents, and people on disability benefits, a lack of help with job search wascompounded by poor work incentives from the tax and benefit system.
3.31 Since the 1997 assessment, progress has been made. The proportion of households thatare workless has fallen from 17.4 per cent in autumn 1997 to 16.1 per cent in autumn 2002.Worklessness among people with disabilities has been slower to fall. While annual flows on toincapacity-related benefits have fallen by nearly a quarter since 1996, the average duration ofongoing claims has increased by more than 10 per cent to 5 years and 8 months. As aconsequence, more than 2.7 million people are now claiming incapacity-related benefits –more than the combined total of lone parents and unemployed people on benefit.
3.32 It is important to ensure that if a negative shock hits the economy, people do not simplydrift back into persistent inactivity or repeated periods of worklessness. In order to help allthe workless find employment, the Government has extended assistance to all worklessbenefit claimants, widening the focus of its Welfare to Work polices, as set out in HM Treasury(2002e).
Chart 3.5: Duration of UK ILO unemployment
Source: ONS.
0
10
20
30
40
50
60
70
1993 1994 1995 1996 1997 1998 1999 2000 2001 2002
6 - 12 months
Over 12 months
Up to 6 months
Per cent of total unemployment
...but challengesremain

L A B O U R MA R K E T OU TC O M E S
54
33.33 Despite recent declines, long-term unemployment remains a major problem in parts ofthe EU and more prevalent among women than men. In 2001, some 43 per cent of the EU’sunemployed had been looking for work for over a year, although this was down from 47.0 percent in 1990 and 47.6 per cent in 1998. Under this definition, long-term unemployment spellsin many smaller EU Member States are comparable to the UK. However, the proportion oflong-term unemployed is higher in some of the larger EU economies, where long-termunemployment makes up around 50 per cent or more of total unemployment (Chart 3.6).
Mismatch
3.34 Mismatch occurs where there is an imbalance between the demand for and supply oflabour in market segments. Mismatch indicators can help illustrate how easily labour canmove across sectors and regions and the degree to which relative wages can adjust.
3.35 The Beveridge Curve depicts the relationship between unemployment and vacancies. Itindicates how well unemployed individuals are matched to the available job vacancies in aneconomy. To the extent that labour market institutions can affect the matching of theunemployed to vacancies, a shift in the curve can indicate a structural improvement in thelabour market. An outward shift means that the matching process has deteriorated (that is ahigher unemployment rate for a given vacancy rate). An inward shift indicates animprovement (a lower unemployment rate for a given vacancy rate). Movements along thecurve reflect cyclical fluctuations; in an economic downturn, hiring declines andunemployment picks up.
The BeveridgeCurve
Chart 3.6: Long-term unemployment, 2001
Source: OECD 2002a.Note: Data for Germany (2000) and the Netherlands (1999).
0
10
20
30
40
50
60
70
80
90
ItaIreGreGerBelSpaPorFraJapUKLuxFinAusDenSweAutCanUS
6 months and over 12 months and over
Per cent of total unemployment

55
L A B O U R MA R K E T OU TC O M E S3
3.36 Chart 3.7a shows that the curve shifted outwards in the UK from the 1960s to the 1980s,and particularly in the latter decade. However, it appears that the curve has shifted inwardsover the 1990s, indicating an improvement in the matching process between vacancies andunemployment. The same is true of the US.
3.37 This contrasts with an outward shift in both Germany and France. Nickell et al. (2001and 2002) note that since the 1980s, countries fall into two groups: those for which the curveshifted right (Belgium, Finland, France, Germany, Japan, Norway, Spain, Sweden andSwitzerland) and those for which it moved to the left (Canada, Denmark, the Netherlands, theUK and the US). Harder to place, but showing recent improvement, are Australia, Austria,New Zealand and Portugal. Broadly similar results were reported in a recent study of the euroarea, for which the curve in aggregate appears to have shifted outwards (European CentralBank, 2002).
a) UK
Unemployment rate
Vaca
ncy
rate
1960
1965
1995
1975
2001
1990
1980
1970
1985
Per cent
0 2 4 6 8 10 12 140.0
0.2
0.4
0.6
0.8
1.0
1.2
1.4
1.6
c) Germany
Source: OECD, Eurostat.
Unemployment rate
Vaca
ncy
rate
1965
1970
1960
1975
1980 19901995
2001
1985
Per cent
0 2 4 6 8 10 120.0
0.5
1.0
1.5
2.0
2.5
3.0
3.5d) France
Unemployment rate
Vaca
ncy
rate
19601965
19701975
19801990 1995
1985
2001
Per cent
0 2 4 6 8 10 12 140.0
0.2
0.4
0.6
0.8
1.0
1.2
1.4
b) US
Unemployment rate
Vaca
ncy
rate
1960
19651970
1975
1980
19952001
1990
1985
Per cent
2 3 4 5 6 7 8 9 10 110.05
0.06
0.07
0.08
0.09
0.10
0.11
0.12
0.13
Chart 3.7: Beveridge curves for the UK, US, Germany and France
An inward shiftin the UK in the
1990s...
...but notmatched across
Europe

L A B O U R MA R K E T OU TC O M E S
3.38 Wide and persistent differentials in regional unemployment are also problematic. In theLayard, Nickell and Jackman framework, an increase in regional dispersion translates into anincrease in the NAIRU (if, for example, mobility is limited then high unemployment areas willnot moderate wage pressures elsewhere). Disparities can also imply significant welfare costsfor certain groups. The OECD (2000b) notes that regions with high unemployment also tendto have high female and youth unemployment.
3.39 Evidence suggests that the UK labour market has been better able to match the supplyof and demand for labour in individual regions. While the recovery of the late 1980s waslargely confined to the south of England, more recently every region in the UK has seen sharpfalls in unemployment.
3.40 Chart 3.8 shows the variation in regional unemployment rates in the UK, as measuredby the standard deviation. It broadly illustrates how regional differences tend to rise indownturns and fall during economic recoveries, i.e. regional inequality is higher whenunemployment is higher. The UK regional standard deviation fell sharply in the early 1990s,and has been on a more shallow downward trend since then.
3.41 Table 3.1 suggests that the recent fall in the standard deviation perhaps cannot just beexplained by cyclical factors. On a claimant count basis, the difference between the highestand lowest unemployment rate is currently around 3.0 percentage points. During previoustroughs in unemployment in 1979 and 1990, these figures were 5.7 and 10.4 percentage pointsrespectively. The average absolute deviation of regional unemployment rates is now 0.8percentage points, compared to almost 3 percentage points in the mid 1980s.
56
3
Chart 3.8: Regional unemployment dispersion
Source: ONS.
1975 1979 19811977 1983 1985 1987 1989 1991 1993 1995 1997 1999 2001
Standard deviation of UK regional claimant count unemployment rates
0.0
0.5
1.0
1.5
2.0
2.5
3.0
3.5
4.0
Regionalunemploymentdifferentials...
...have fallen inthe UK...

57
Table 3.1: Regional unemployment in the UK
Regional claimant count unemployment
Average absoluteUK claimant count deviation from
unemployment UK rate rate Min Max (percentage points)
November 1979 3.7 2.1 7.8 1.3April 1990 5.2 2.4 12.8 2.1December 2002 3.1 1.7 4.7 0.8Source: ONS.Note: Dates for 1979 & 1990 refer to trough in UK unemployment rate.
3.42 However, differences within regions are now as important as those between regions.Localised pockets of unemployment remain. Many local authority districts that have lowemployment rates can be found alongside districts with a large number of vacancies or jobs.The policies that the Government has introduced to tackle the barriers which prevent localpeople from taking local jobs are set out in HM Treasury (2002e).
3.43 A reduction in regional unemployment disparities is not as apparent across all parts ofEurope. While unemployment in the EU has fallen during the 1990s, the gap between theoverall EU unemployment rate and the unemployment rate of the peripheral regions in thelarger Member States has increased (Kostoris Padoa-Schioppa and Basile, 2002).
3.44 Chart 3.9 shows the range of regional unemployment rates across the EU. It illustratesthat unemployment rates in some EU regions are around ten times higher than the bestperforming regions. The differentials are particularly striking in the big four continentalEuropean economies.7 Moreover, the historic pattern of regional unemployment shows thatthe regional disparities within Member States have been relatively persistent over time(Soltwedel et al., 1999).
L A B O U R MA R K E T OU TC O M E S3
7 Chart 3.9 excludes data from the Departements D’outre-Mer region of France.
Chart 3.9: Regional dispersion of unemployment rates, 2001
Source: EurostatNote: NUTS level 2
0
4
8
12
16
20
24
28
Bel
VlaamsBrabant
Hainaut
Halle/Dessau
Oberbayern
DytikiMakedonia
Kriti
Andalucia
Navarra
Languedoc-Roussillon
Alsace
Groningen
Utrecht
Wien
Oberösterreich
Alentejo
Centro(P)
Itae-Suomi
Uusimaa(Suuralue)
NorraMellansverige
Stockholm
Merseyside
Maximum
Average
Minimum
Berkshire, Bucksand Oxfordshire
Calabria
Trentino-AltoAdige
Ger Gre Spa Fra Ita Nld Aut Por Fin Swe UK
Per cent
...but pockets ofunemployment
remain

L A B O U R MA R K E T OU TC O M E S
The cyc l i ca l respons iveness o f employment
3.45 Evidence suggests that the employment intensity of growth reflects the degree of labourmarket flexibility (Döpke, 2001) and the employment performance of the EU in the mostrecent cyclical upturn has been a key focus for attention. However, whether it is alwaysbeneficial for employment and unemployment to be more responsive to the cycle is not clear.In the context of a short-lived economic downturn it may make sense to retain labour inanticipation of the upturn – meaning the employment responsiveness to output is lower. Inthe context of a major restructuring, it is preferable for employment to exit rapidly fromdeclining industries – that is, the employment responsiveness to output is higher.
3.46 In the UK, the pace at which employment increased in the 1990s recovery, compared tothat of the 1980s suggests that employment has become more responsive to the cycle.Although the path of output in the 1990s was broadly similar to the previous recovery,employment rose much earlier in the cycle (Chart 3.10) and unemployment fell. Althoughevidence suggests that the pace of employment growth was still slower than in othercountries, this differential had narrowed substantially in the 1990s compared to a decadeearlier (Morgan, 1996).
3.47 In the EU, the responsiveness of the jobless rate to the economic cycle appears tohave risen strongly over the past decade. European Commission estimates of this cyclicalcomponent (known as Okun’s coefficient: µ) are shown in Chart 3.11 for the periods 1969–89and 1989–2001.
58
3
Chart 3.10: Employment growth in the UK over the cycle
Source: ONS.
94
95
96
97
98
99
100
101
Quarters following trough in GDP
0 1 2 3 4 5 6 7 8 9 10 11 12 13 14 15
Empl
oym
ent l
evel
(tro
ugh
in G
DP =
100)
1980s
1990s
Employmentappears more
responsive to thecycle

59
3.48 In the 1970s and 1980s, a negative output gap of 1 per cent pushed the EUunemployment rate up by around 0.4 per cent, an effect of similar magnitude to the US.However, the cyclical responsiveness of the labour market appears to have increasedsignificantly in most EU Member States over the 1990s. This may reflect more employmentflexibility, for example a greater incidence of part-time or temporary contracts, or the easingon restrictions on the hiring and firing of workers.
Conclus ion
3.49 Providing enhanced employment opportunities for all is a priority for the UK andEurope. Reflecting the reform process since 1997, there has been considerable progress interms of creating jobs and extending employment opportunity to all both in the UK and euroarea. However, job creation alone is not indicative of a flexible labour market and this sectionhas considered a range of indicators to assess whether such improvements are sustainable.
3.50 The UK labour market has shown concrete signs of improvement since 1997.Unemployment has fallen to a historically low level, while wage pressures have remainedmoderate and consistent with the Government’s inflation target and trend productivitygrowth. This development is consistent with the observed reduction in the NAIRU over thisperiod. Evidence also suggests that employment has become more responsive to the cycle.
3.51 Improvement in the overall performance of the labour market is reflected in animproved performance of its constituent parts. In particular, in the UK there has been animprovement in the matching of the unemployed to the available vacancies and there hasbeen a reduction in the regional dispersion of unemployment rates, as the market has beenbetter able to match the supply of and demand for labour in individual regions. However,challenges still remain to ensure employment opportunities for all. Inactivity rates remainhigh, particularly among people with disabilities, lone parents and those with the lowestskills, while employment rates remain low in the most deprived areas and for people fromethnic minorities.
L A B O U R MA R K E T OU TC O M E S3
Chart 3.11: Cyclical responsiveness of the labour market1
Source: European Commission, 2002d.1Impact of a 1 per cent negative output gap on unemployment.
0.0
0.2
0.4
0.6
0.8
1.0
1.2
1.4
Spa Bel
Okun
coe
ffici
ent
JapGreLuxAutPorIreUSDenItaUKNldSwe FraFin Ger
1969–89 1989–2001

3.52 Progress in Europe has been mixed, with differences in the level of structuralunemployment and the pace with which it is being reduced. Substantive improvements havebeen observed in some of the smaller EU Member States, while structural unemployment hasonly been reduced moderately in the larger Member States and from a relatively high startingposition.
3.53 The analysis is backward looking both for the UK and euro area. Successful membershipof a currency union would require a flexible labour market not just at a point in time but alsoin the future. To assess this, Section 4 discusses the institutional environment in the labourmarket.
60
L A B O U R MA R K E T OU TC O M E S3

4 TH E IN S T I T U T I O N A L EN V I R O N M E N T
61
4.1 Section 2 discussed how the labour market adjusts to changes in the supply of anddemand for labour. When adjustment is fast, this tends to be reflected in superior labourmarket outcomes, as set out in Section 3. Both sections suggested that there has been animprovement in labour market performance in the UK since 1997.
The preceding analysis suggests that the UK labour market has become more flexible since1997. To make a success of UK membership of EMU would require that theseimprovements are not just experienced at a point in time but are sustained into the future.This section provides an analysis of the institutional environment including policies towardsthe labour market, which have been shown to influence both equilibrium unemploymentand how well an economy adjusts to shocks. The main findings are:
• since 1997, the Government has implemented a number of reforms to the tax andbenefit system to ensure that work is financially rewarding. Figures show that theUK has a replacement rate comparable to the US and lower than in manyEuropean countries. The tax wedge is also one of the lowest in the OECD and hasbeen on a broadly downward trend since the 1980s;
• the Government’s New Deal programme has aimed to increase the effectivelabour supply by improving work skills and disciplines and by focusing on improvingthe labour market attachment of young people, lone parents and the long-termunemployed. A number of studies have found that these active labour marketpolicies have enhanced participants’ ability to find employment;
• evidence suggests that employment protection legislation is less heavyhanded than in many other OECD countries and more conducive to labour marketflexibility. New legislation has been introduced since 1997 to improve standards inthe workplace, such as the National Minimum Wage and the Working TimeDirective. The evidence to date is that these have not unduly compromised theflexibility of the labour market;
• the UK’s labour market is characterised by a decentralised system of collectivebargaining. Such a system means that relative wages can adjust more readily toindustry, sectoral and regional conditions. The decline in collective bargaining overthe past two decades also supports aggregate wage flexibility; and
• a high level of competition will increase the benefits associated with adecentralised bargaining system. Evidence suggests that in the UK the productmarket, which is becoming an increasing feature in discussions of labour marketrigidities, is one of the least regulated in the euro area and indeed the OECD.
Overall, the section suggests that recent improvements in the performance of the UKlabour market are well founded. It concludes by presenting a summary indicator offlexibility based on these institutional factors. While there is no blueprint for success, theanalysis and indicator rankings suggest that the institutional environment in the UKappears to be more conducive to labour market flexibility than in many other countries,particularly in Europe. Progress has been made in Europe, but labour market reform needsto be pursued with vigour to improve the functioning of the EU labour market.

TH E IN S T I T U T I O N A L EN V I R O N M E N T
4.2 Successful membership of EMU requires that these improvements are not justexperienced at a point in time but that they are sustained into the future. This sectiontherefore complements the preceding analysis and provides an analysis of a number of labourmarket policies and institutions which influence both equilibrium unemployment and howwell an economy adjusts to shocks. The evolution of these institutions is important becausesupply side reforms may take time to affect behaviour; an assessment of these institutionsnow can indicate the outcomes that may emerge in the medium to long term.
4.3 At the outset, it is worth setting out how these institutions might be expected toinfluence equilibrium unemployment and the way in which an economy adjusts to shocks.Table 4.1 attempts such an exercise on the basis of the consensus among analysts on theexpected impact. Some institutions affect wages directly, and thereby the potentialresponsiveness of wages to disequilibrium in the labour market. Other factors directlyinfluence the effectiveness with which the unemployed are matched to vacancies. Given thatthis may lead to an increase in long-term unemployment, this can lead to a secondary impacton wage pressures.
Table 4.1: The influence of labour market institutions
Expected impact on:
Matching Equilibrium process Wage pressure unemployment
(+ = improve, (+ = increase, (+ = increase, - = worsen) - = decrease) - = decrease)
Employment Protection Legislation -? +? +?Tax wedge +? +?Replacement rate - + +Benefit duration - + (secondary) +Active Labour Market Policy + - (secondary) -Union density + +Union coverage + +Union/employer coordination - -
4.4 While there is a broad agreement about the expected impact of institutional factors,opinion is more divided regarding their quantitative importance, which can vary subject tomodel specification and country coverage and can be strongly influenced by interactioneffects.1 This section does not attempt a quantitative weighting but concludes by presentinga summary indicator of flexibility based on these institutions, drawing on a recent influentialstudy.2
L ABOUR MARKET FLEXIBILITY AND EMPLOYMENTOPPORTUNITY
The tax and benef i t system4.5 The interaction of the tax and benefit system is an important influence on labour marketflexibility via its impact on labour supply, unemployment and wages. The Treasury’sassessment of the five economic tests in 1997 noted that:
“We also need to ensure that our tax and benefit system supports an effective andflexible labour market and ensures that work pays”. (HM Treasury, 1997, page 24.)
62
4
1 Coe and Snower (1997) and Belot and van Ours (2000) both suggest that institutions interact with one another and havecomplementary effects on unemployment. A priori, this might suggest that those countries that undertook comprehensivelabour market reform and exploited these complementarities would have more favourable market outcomes.2 Blanchard and Wolfers (2000).

63
4.6 The impact of the tax and benefit system on labour market flexibility chiefly flowsthrough two channels, namely the extent to which it causes real wage resistance and theextent to which it reduces incentives to participate in the labour market.
4.7 The concept, whereby workers attempt to sustain real wages despite shifts inequilibrium unemployment, is known as real wage resistance. There is evidence to suggestthat real wage resistance exists, at least in the short run, such that a tax increase leads tohigher unemployment, although this can vary across countries. Daveri and Tabellini (2000)found that in continental Europe, but not other OECD countries, higher labour tax ratestranslate into higher gross wages. For each percentage point increase in labour taxes, there isa corresponding increase in the real wage of nearly half a percentage point. Tyrväinen (1995)also found that the degree of real wage resistance is low outside of continental Europe, forexample in the UK and US. Evidence suggests that the effect may not persist into the long run,or if it does that the effect on unemployment is not particularly large (Nickell and Layard,1999).
4.8 The tax and benefit system can also interact to create disincentives that discourageparticipation in the labour market or reduce the number of hours an individual is willing towork, namely:
• the unemployment trap: those individuals without work find that thedifference between in- and out-of-work incomes is too small to provide anincentive to take a job; and
• the poverty trap: those already in work may be discouraged from workinglonger hours or taking a better paid job because simultaneously paying moretax and receiving less benefit may leave them little better off.
4.9 Because the unemployment and poverty traps discourage individuals from moving intoemployment or taking a more financially rewarding job, they can reduce the flexibility of thelabour market. For example, discouraging job search can reduce the stock of workers able tofill the available vacancies, which might discourage employers from opening vacancies. Highbenefits can also impact on wage pressures directly. By reducing the fear of unemployment orreducing competition for jobs, they can increase the reservation wage or encourage unions topush for excessive wages.
4.10 Although the actual direction of the supply response to a tax change is theoreticallyambiguous,3 evidence supports the principle that high tax rates influence the labour supply decision of certain individuals. In particular, partners in single earner couples andlone parents are generally found to be the most responsive to incentives, while the laboursupply of prime-age males is less likely to respond to a tax change (Carone and Salomäki,2001).
4.11 This existence of incentive effects is also evident in studies that look at the tax andbenefit system jointly. For example, Disney (2000) finds that high average replacement rates(the ratio of out-of-work income to in-work income) tend to lengthen the spell ofunemployment.
4.12 Since 1997 the Government has reformed the UK tax and benefit system to ensure thatwork pays more than welfare and that there are incentives to move up the earnings ladder. Inparticular:
TH E IN S T I T U T I O N A L EN V I R O N M E N T4
3 There are two offsetting effects to a tax change – the income and substitution effects. A cut in taxation would encouragethe individual to work more because the opportunity cost of leisure has increased (the substitution effect). However, asincome increases, the same goods (leisure) can be purchased with less work effort, i.e. the individual is encouraged towork less (the income effect).
Tax and benefitreforms since
1997
Real wageresistance
Incentives towork

TH E IN S T I T U T I O N A L EN V I R O N M E N T
• a new lower starting rate of income tax was introduced in April 1999 and thebasic rate of income tax was reduced in April 2000 to the lowest level for 70years;
• the entry fee on national insurance contributions (NICs) was abolished in April1999 and the threshold above which employees pay NICs was increased to bealigned with the income tax personal allowance in April 2000 and 2001; and
• a number of in-work tax credits have been introduced to provide additionaltargeted support for working families (see HM Treasury, 2002e).
4.13 The reforms have been targeted at all levels of the income distribution, but especially onthose with low incomes. This in itself is potentially important for labour market flexibility. Theeffect of taxes on unemployment and wages depends on the structure of taxation. Progressivetaxation is likely to be friendlier towards employment because low-wage workers, who havehigher wage elasticities, pay less tax (Pissarides, 1999).
4.14 The tax and benefit reforms have significantly increased the gains to work acrosshouseholds (HM Treasury, 2002e). The available evidence suggests that, in doing so, thesereforms have had positive effects on labour market participation in the UK (Gregg et al., 1999;Blundell et al., 2000; HM Treasury, 2000b; Blundell and Hoynes, 2001).
4.15 Moreover, these reforms have also lessened the poverty trap, which may imply asignificant change in work effort for those who face lower withdrawal rates. The number offamilies facing a marginal deduction rate of over 70 per cent has fallen by two thirds since1997 (HM Treasury, 2002e). While the number of families facing a withdrawal rate of 60 percent has increased, this reflects the extension of in-work support to families who werepreviously not eligible for such assistance. Moreover, any effect on work incentives ismitigated by the income disregard in the new tax credits,4 which means that recipients willnot see their tax credits reduced as soon as their income rises.
4.16 The reforms have also led to a reduction in the tax wedge in the UK. Chart 4.1 showsestimates of the tax wedge for single people and for one-earner families with two children.Both have resumed the downward trend seen over the 1980s, which was interrupted brieflyduring the mid-1990s. For the former, the tax wedge has fallen by over 2 percentage pointsbetween 1997 and 2001, and for the latter by 7 percentage points.
64
4
Reducingunemployment
and povertytraps . . .
. . . and the taxwedge
Chart 4.1: Tax wedge in the UK
Source: OECD.
16
20
24
28
32
36
40
19991997199519931991198919871985198319811979 2001
Single person without children
One-earner family with two children
Tax
wed
ge (p
er c
ent)
4 If gross family income rises by up to £2,500 then during the financial year in which the rise takes place the tax credit isunaffected.

65
4.17 Chart 4.2 shows estimates of the tax wedge in EU countries and US, taken as a straightaverage across eight family types. The tax wedge in the UK is lower than in the majority of EUcountries and the US. Tax wedges in continental Europe increased from the early 1980s andin a number of cases still remain higher than in the early 1980s levels. However, since 1997 taxwedges across the rest of Europe have fallen, reflecting moves across Europe to boost workincentives (see Carone and Salomäki (2001) for a thorough overview).
4.18 As noted above, taxation is only half of the story. Even if the tax system rewardsemployment, incentives to work could be low if the benefit system discourages job search.Chart 4.3 shows the OECD’s summary measure of benefit entitlements – the gross replacementrate. It illustrates that, on average, the UK has one of the lowest gross replacement rates inEurope (the replacement rate is a measure of the ratio of out-of-work to in-work income). Overthe 1990s, the replacement rate has remained broadly stable in the UK and at a lower level thanthe majority of the EU.
TH E IN S T I T U T I O N A L EN V I R O N M E N T4The tax wedge is
low byinternational
standards . . .
Chart 4.2: Tax wedges
Source: OECD, 2002d.Note: Average of tax wedge estimates for eight different family types and wage levels.
0
10
20
30
40
50
60
Ire UK Lux US Por Spa Gre Aut Den Nld Ita Fra Fin Ger Swe Bel
Per cent of labour costs
. . . as is thereplacement rate
Chart 4.3: Gross replacement rates
Source: OECD, 2002e.Note: Average of gross replacement rates for two earnings levels, three family types and over a three year period.
0
10
20
30
40
50
60
70
US UK DenNldPorFinBelFraAutSpaIreLuxIta SweGre Ger
Out-of-work as a percentage of in-work income

TH E IN S T I T U T I O N A L EN V I R O N M E N T
4.19 However, despite high replacement rates, some continental European economies havemanaged to maintain work incentives and sustain high rates of employment. Empiricalevidence suggests that the way in which the benefit system is administered is just asimportant as the level of financial support; most notably, the eligibility period and theeligibility requirements.
4.20 For instance, Buti et al. (1997) and Scarpetta (1996) found that the eligibility period forbenefits has a significant impact on the duration of unemployment, while there is empiricalevidence of a spike in the exit rate from unemployment before the point at which benefits areexhausted (Bover et al., 1996). Nickell (1997) found that high unemployment was associatedwith generous benefit systems that were allowed to run on indefinitely, combined with littleor no pressure on the unemployed to find work, and Grubb (2000) also found a significantimpact via eligibility criteria.
4.21 Chart 4.4 plots the gross replacement rate, a summary measure of benefit generosity,against a summary measure of the strictness of eligibility criteria in unemployment benefits.5 Itshows that some continental European economies offset generous benefits by imposing stricteligibility criteria. These data are out of date and for some countries may not reflect currentpositions. The UK is not shown in the comparison because the estimates for the strictness ofeligibility criteria do not reflect the current position, and in particular do not reflect thestrengthening of the compulsion and conditionality elements of the New Deal programmes.6
4.22 Housing Benefit provides help with rental costs for low income tenants in and out ofwork. Around 3.8 million tenants currently rely on it for help with their rent. However, thedesign and administration of Housing Benefit can hinder the transition to work for somepeople. Claimants often do not know until after they have moved into a property whether ornot their entitlement will meet the cost of their rent. Moreover, delays in processing newapplications after a claimant returns to employment can lead to rent arrears and debt,dissuading some people from moving into work.
66
4Benefit
administrationalso matters
5 See Danish Ministry of Finance (1998) for full details of the indicators. Also see Grubb (2000) for a discussion of thisapproach.6 Were updated UK estimates available, they would be likely to show the UK in the upper left portion of the chart.
Chart 4.4: Benefit generosity (1999) and strictness of eligibility criteria (1997)
Source: OECD, 2002e (benefit generosity); Danish Ministry of Finance, 1998 (strictness of eligibility conditions).
0 10 20 30 40 50 60 700.0
0.5
1.0
1.5
2.0
2.5
3.0
3.5
4.0
4.5
Sum
mar
y m
easu
re o
f str
ictn
ess
ofel
igib
ility
cri
teri
a
Summary measure of benefit generosity
US
Increasing strictness
Increasing generosity
CzeAus
LuxSwe
CanGer
Ire
Aut
Den
Nld
Por
NorBel
Fin Fra
Housing Benefit

67
4.23 The Government recently announced new measures to simplify and streamline theadministration of Housing Benefit, reducing its capacity to act as a barrier to work, includingpilots in Pathfinder areas of a flat rate local housing allowance for tenants in the deregulatedprivate rented sector. These measures will also provide valuable evidence on which to basefurther action to improve and reform the functioning of Housing Benefit over the longer term.
4.24 Overall, evidence suggests that the tax and benefit reforms introduced since 1997 haveimproved the flexibility of the UK labour market. The adverse incentive presented by theunemployment trap has been reduced and the tax wedge, which was already low byinternational standards, has fallen further. The reforms have dramatically reduced theincidence of the very highest marginal deduction rates. Although the incidence of familiesfacing withdrawal rates above 60 per cent has increased, this reflects the extension of in-worksupport to those who were previously not eligible for assistance.
4.25 Continued tax and benefit reform represents a common challenge for the EU, but withindividual reform paths being set by Member States. Reform is being pushed by therecommendations of the Broad Economic Policy Guidelines and the Employment Guidelinesand many Member States have reformed, or announced plans to reform, personal incometaxes.
Act ive Labour Market Pol ic ies (ALMPs)
4.26 In addition to creating an environment that rewards work, it is also important to raisethe effectiveness of the unemployed and smooth their reintegration into the labour market.This can reduce the need for employers to raise wages and therefore increase the medium tolong-run responsiveness of wages to unemployment, in particular by:
• increasing competition in the labour market: extended periods out of work canhave adverse effects on the unemployed or employers’ perceptions of theunemployed. The unemployed can become demotivated, their skills canatrophy or become outdated and they can lose the habits associated withworking. This will make employers reluctant to hire them. The unemployedthus become less able to compete in the labour market for vacancies againstthose already in work or employers may use long-term unemployment as areason to discriminate during the selection process. Employmentprogrammes can re-skill the unemployed, give them experience of workingand get them back into the habit of work. This increases the effective supplyof labour and means that employers face less pressure to raise wages in orderto attract people to work for them;
• increasing the matching of the unemployed to job vacancies: job searchassistance to the unemployed can help to ensure that they search for jobs bothmore intensively and more effectively, thereby speeding up the process ofmatching an unemployed individual to a vacant job. Programmes targeted atthe economically inactive – who are not searching at all – can encourage themto return to the labour market, increasing the pool of people available to fillvacancies. An open vacancy imposes costs on employers in terms of lostoutput and profits. Employers may therefore increase wages in order to fill thevacancy more quickly. Job search assistance, by reducing the time these jobsare vacant for a given wage level, can decrease these costs, giving employersless incentive to raise wages and more incentive to open vacancies; and
• reducing the mismatch between labour demand and labour supply: the skillsthat the unemployed have to offer employers may not match those whichemployers require. This includes not just mismatch in terms of skill shortages
TH E IN S T I T U T I O N A L EN V I R O N M E N T4
Employeeeffectivenessmatters for
flexibility
Conclusion:tax and benefit
system

TH E IN S T I T U T I O N A L EN V I R O N M E N T
or shortages of people to do particular jobs, but also regional or areamismatch (where the unemployed are concentrated in areas where jobs aresparse and vice versa). Training programmes can, where carefully targetedboth on individuals and employers’ needs, help to reduce such mismatch.This will mean that employers do not have to bid up wages in order to attractparticular types of labour that would otherwise be scarcer.
4.27 Raising the effectiveness of the unemployed therefore both reduces the NAIRU andincreases the speed of adjustment of the labour market back to the NAIRU – particularly ifpolicy prevents a build up of long-term unemployed and workless individuals in a recession.
4.28 Since 1997, the Government has introduced a range of Welfare to Work polices toprevent the unemployed from becoming permanently detached from the labour market, andto successfully reintegrate the long-term unemployed and inactive into employment (HMTreasury, 2002e).
4.29 Notably the Government has introduced the New Deal programme to help reduce long-term and youth long-term unemployment and to address the barriers to work faced by thoseon the margins of the labour market, including lone parents and the over 50s.
4.30 Figures suggest that spending on Active Labour Market Policies is still low in the UKcompared to other countries. Chart 4.5 shows spending on ALMPs per person unemployed (asa percentage of GDP per member of the labour force). It suggests that the UK and the US devotea relatively small amount of spending to this type of policy.
4.31 However, what is more important is the effectiveness of the spending, and it has beenquestioned whether the programmes that have been undertaken in the OCED have achievedtheir original objectives for programme participants (OECD, 2001). The IMF notes that thereis little evidence that the use of ALMPs in Germany, France, Italy and Spain has contributedto increasing employment or creating longer lasting jobs (IMF, 2001).
4.32 Evidence, drawn from both the UK and other OECD countries on the success of ALMPs,is growing. The conditions associated with the receipt of the main benefit for unemployedpeople – the Job Seekers’ Allowance (JSA) – make it an active policy. Recipients of JSA must be
68
4
ALMP spending islow compared to
other countries
Chart 4.5: Spending on ALMPs per person unemployed
0
5
10
15
20
25
30
35
40
45
50
Mex Cze
Gre USUK Ita
Hun
Spa
Jap
CanNZ Aus
Kor
Fin
Aut
Fra
Por
Ger
Bel
Swz
Swe
Nor
Nld
Den
Percentage of GDP per member of the labour force (2000)1
Source: OECD database on labour market programs for data on spending, GDP and labour force; OECD Labour Force Statistics for data on unemployment.1Except for UK (1999) and Greece (1998).
Has ALMP in theUK worked?
Active LabourMarket Policy in
the UK
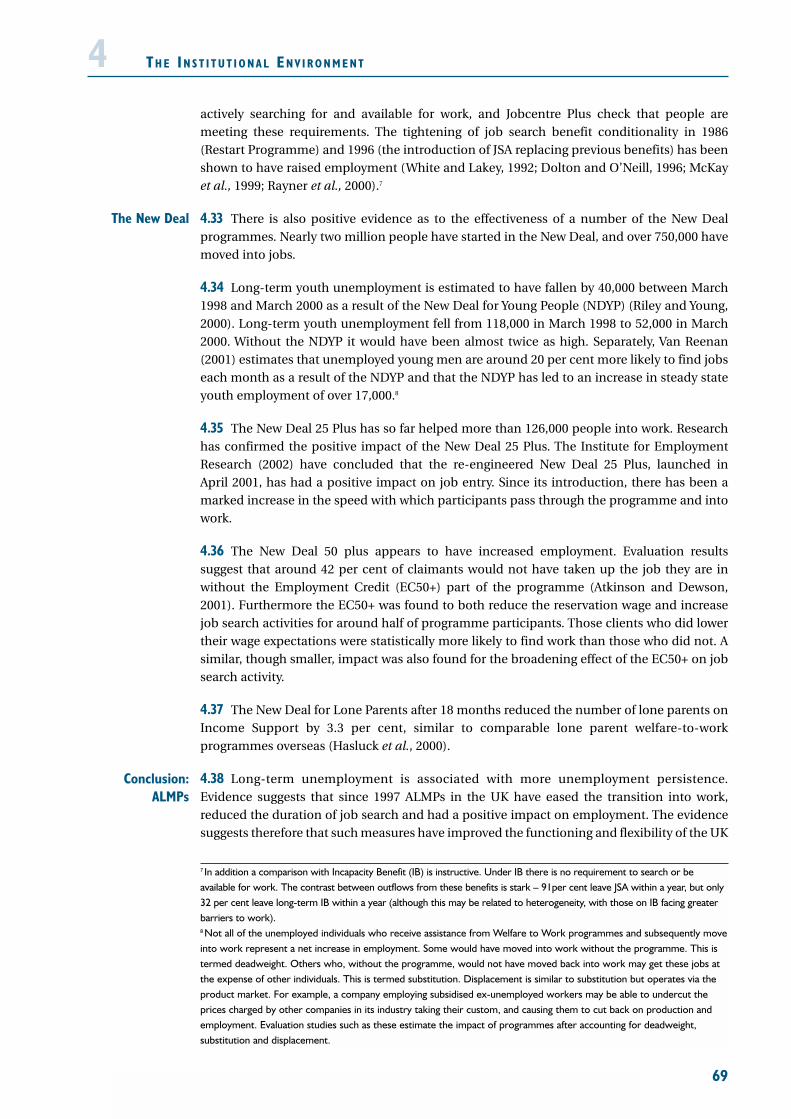
69
actively searching for and available for work, and Jobcentre Plus check that people aremeeting these requirements. The tightening of job search benefit conditionality in 1986(Restart Programme) and 1996 (the introduction of JSA replacing previous benefits) has beenshown to have raised employment (White and Lakey, 1992; Dolton and O’Neill, 1996; McKayet al., 1999; Rayner et al., 2000).7
4.33 There is also positive evidence as to the effectiveness of a number of the New Dealprogrammes. Nearly two million people have started in the New Deal, and over 750,000 havemoved into jobs.
4.34 Long-term youth unemployment is estimated to have fallen by 40,000 between March1998 and March 2000 as a result of the New Deal for Young People (NDYP) (Riley and Young,2000). Long-term youth unemployment fell from 118,000 in March 1998 to 52,000 in March2000. Without the NDYP it would have been almost twice as high. Separately, Van Reenan(2001) estimates that unemployed young men are around 20 per cent more likely to find jobseach month as a result of the NDYP and that the NDYP has led to an increase in steady stateyouth employment of over 17,000.8
4.35 The New Deal 25 Plus has so far helped more than 126,000 people into work. Researchhas confirmed the positive impact of the New Deal 25 Plus. The Institute for EmploymentResearch (2002) have concluded that the re-engineered New Deal 25 Plus, launched in April 2001, has had a positive impact on job entry. Since its introduction, there has been amarked increase in the speed with which participants pass through the programme and intowork.
4.36 The New Deal 50 plus appears to have increased employment. Evaluation resultssuggest that around 42 per cent of claimants would not have taken up the job they are inwithout the Employment Credit (EC50+) part of the programme (Atkinson and Dewson,2001). Furthermore the EC50+ was found to both reduce the reservation wage and increasejob search activities for around half of programme participants. Those clients who did lowertheir wage expectations were statistically more likely to find work than those who did not. Asimilar, though smaller, impact was also found for the broadening effect of the EC50+ on jobsearch activity.
4.37 The New Deal for Lone Parents after 18 months reduced the number of lone parents onIncome Support by 3.3 per cent, similar to comparable lone parent welfare-to-workprogrammes overseas (Hasluck et al., 2000).
4.38 Long-term unemployment is associated with more unemployment persistence.Evidence suggests that since 1997 ALMPs in the UK have eased the transition into work,reduced the duration of job search and had a positive impact on employment. The evidencesuggests therefore that such measures have improved the functioning and flexibility of the UK
TH E IN S T I T U T I O N A L EN V I R O N M E N T4
7 In addition a comparison with Incapacity Benefit (IB) is instructive. Under IB there is no requirement to search or beavailable for work. The contrast between outflows from these benefits is stark – 91per cent leave JSA within a year, but only32 per cent leave long-term IB within a year (although this may be related to heterogeneity, with those on IB facing greaterbarriers to work).8 Not all of the unemployed individuals who receive assistance from Welfare to Work programmes and subsequently moveinto work represent a net increase in employment. Some would have moved into work without the programme. This istermed deadweight. Others who, without the programme, would not have moved back into work may get these jobs atthe expense of other individuals. This is termed substitution. Displacement is similar to substitution but operates via theproduct market. For example, a company employing subsidised ex-unemployed workers may be able to undercut theprices charged by other companies in its industry taking their custom, and causing them to cut back on production andemployment. Evaluation studies such as these estimate the impact of programmes after accounting for deadweight,substitution and displacement.
Conclusion:ALMPs
The New Deal

TH E IN S T I T U T I O N A L EN V I R O N M E N T
labour market. However, there remain significant challenges around tackling persistenteconomic inactivity and repeated periods of worklessness.
L ABOUR MARKET FLEXIBILITY AND REGUL ATION
4.39 An appropriate degree of regulation can correct market failures and increase fairnessand safety in the workplace. Effectively targeted regulation can also improve the flexibility ofthe labour market by improving the quality of job matching and therefore reducing the costof labour turnover to firms. However, if regulation is set ineffectively then it can constrain thechoices of employers and employees, i.e. reduce labour market flexibility.
4.40 Since 1997, the Government has introduced a framework of decent minimum standardsto promote fairness in the workplace, including the National Minimum Wage and a newWorking Time Directive. However, if this legislation were applied sub-optimally, it coulddiscourage the creation of entry-level jobs, especially for the low-skilled.
4.41 The Government introduced the National Minimum Wage in April 1999 to ensure fairminimum standards of pay and to underpin the reforms to the tax and benefit system. Withregard to membership of the single currency, however, some commentators have argued thatthe introduction of a minimum wage will reduce the flexibility of the labour market. There aretwo ways that a minimum wage could do this:
• by inhibiting the workings of the price mechanism: this is the case if aminimum wage sets an inappropriate ‘going rate’ for wage rises moregenerally, leading to stronger wage growth in the aggregate economy thanwould be expected given the state of the labour market; and
• reducing employment: under a competitive model of the labour market, if awage floor is set above market clearing levels then, in the low productivity –low wage end of the labour market, employment will fall. If the individualsthat move into unemployment or inactivity become detached from the labourmarket, either permanently or at least for a time, then they are less able toexert pressure in the wage bargaining process and wages become lessresponsive to unemployment.
4.42 In the UK, the National Minimum Wage is not adjusted in a mechanical way. Instead theLow Pay Commission (LPC) reviews the level of the main National Minimum Wage and thedevelopment rate and makes recommendations, if appropriate, for change. The LPC makeparticular reference to the effect on pay, employment and competitiveness; the impact ondifferent groups of workers; the impact on pay structures; and the interaction with the tax andbenefit system. In maintaining a degree of discretion over its level, the potential for theNational Minimum Wage to set an inappropriate benchmark is reduced. This helps to ensurethat wages can still respond effectively to a particular labour market situation.
4.43 Research to date suggests that the National Minimum Wage has not had a notableimpact on earnings growth. Dickens and Manning (2002) find that the there has been virtuallyno impact on the pay of those workers who were not directly affected. Moreover, the changesthat did occur happened in the immediate months following its introduction, with the impactdeclining over time, reflecting the fact that the National Minimum Wage has not beenadjusted on a regular cycle. In addition, Gregg and Pasanen (2001) find that the tighteninglabour market is the most likely cause of improved adult entry wages since 1996 rather thanthe introduction of the National Minimum Wage.
70
4
Can a minimumwage reduce
labour marketflexibility?
Evidencesuggests no
adverse impacton earnings...

71
4.44 Ultimately whether minimum wages are good or bad for employment depends on theirlevel. At some point a minimum wage will hit the demand constraint and reduce bothemployment and the ability of firms to deal with shocks. Evidence so far, however, wouldsuggest that the level of the National Minimum Wage is still below the point where theconstraint starts to bite, and that there has been no adverse impact on aggregate employment(Stewart, 2002; Dickens, 2001).
4.45 Given that productivity rises with labour market experience, the constraint for youthworkers is at a lower level. This implies the need for a lower youth wage, as has beenintroduced in the UK. Again the evidence suggests that there has been no discernible impacton youth unemployment (Stewart, 2002). The only area where the National Minimum Wageappears to have reduced employment is in the care home sector (Machin et al., 2002).
4.46 Moreover, the impact of a minimum wage may potentially be rather different if the lowwage end of the labour market does not approximate to the simple competitive model. Ifinstead the labour supply curve to the individual firm is upward sloping, then minimumwages could, over a certain range, increase employment. One class of models with thisproperty incorporate labour turnover and associated costs. In these models, a firmattempting to attract additional workers will need to raise the wage it offers. These sorts ofmodels may help to explain why the latest evidence suggests that the elasticity of youthemployment with respect to minimum wages is so low (Brown, 1999).
4.47 Chart 4.6 provides estimates of the minimum wages across countries in terms of their leveland as a proportion of full-time median earnings (ideally this would be calculated at a lowerpoint of the income distribution, but this is the only measure available for cross-countrycomparison). It shows that in the UK, the National Minimum Wage appears moderate in relationto earnings and does not appear to be significantly higher or lower than elsewhere, despite thefact that minimum wages have fallen relative to average wages over time in many countries.
4.48 In conclusion, the National Minimum Wage could potentially reduce employment andthe ability of the labour market to adjust to shocks. However, the evidence so far suggests thatthe National Minimum Wage is set at a level below where this constraint starts to bite.Membership of EMU would not affect the Government’s ability to determine the level of theNational Minimum Wage in the UK.
TH E IN S T I T U T I O N A L EN V I R O N M E N T4
Internationalminimum wage
comparisons
Chart 4.6: Minimum wage levels, 2000
Source: Low Pay Commission, 2001.
1 2 3 4 5 620
30
40
50
60
70
80
Level (UK £s using purchasing power parities)
Per
cent
of f
ull-t
ime
med
ian
earn
ings
Por
Gre
SpaKor
Jap
NZ
USA
Can
UK
IreNld
Aus
Fra
Bel
...oremployment

TH E IN S T I T U T I O N A L EN V I R O N M E N T
4.49 Working time regulations, introduced in October 1998, set workers a limit of a 48 hourworking week on average. The Government has sought to ensure that working timeregulations balance the interests of employees and employers, and do not reduce labourmarket flexibility unduly. Evidence suggests that few firms have adapted to the regulations bychanging working hours or working practices, instead choosing to comply with theregulations by using individual opt-outs, derogations or workforce agreements (Neathey andArrowsmith, 1999).
4.50 Employment Protection Legislation (EPL) sets out the rules governing hiring and firingin the workplace. It defines the rights of employees with respect to factors such as the lengthof working time and working patterns, in so doing insuring workers against unanticipated jobloss or discriminatory dismissals. It also sets out the constraints on employers such as theregulation of dismissals and severance payments. Therefore, if EPL is well designed, it offersclear benefits to employees.
4.51 EPL affects both job creation and destruction. An employer may be reluctant to dismissstaff due to the firing costs involved. They may similarly be discouraged from hiring workersif they believe that they will be required to retain employees who will eventually becomesurplus to requirements.
4.52 It is not clear which, if either, of these effects dominates. The net impact of EPL onemployment and unemployment is therefore uncertain. Evidence suggests the impact is smalland/or ambiguous (Bertola, 1999; Jackman et al., 1996) or that there is only a general relationship,which can break down when other explanatory factors are taken into account (OECD, 1999b).
4.53 What is clear, however, is that the impact of EPL on labour market turnover isunambiguously negative. This can increase the duration of unemployment spells and henceincrease the amount of hysteresis in wage setting (Nickell, 1997; Jackman et al., 1996). Moreover,there are two further effects that EPL could have on labour market adjustment. It could:
• reduce the efficiency of job matching: from an employee perspective, EPLcould reduce the diversity of working patterns. For example, if the demandfrom employers is affected by the legislation affecting different types of workthis could potentially push workers into forms of employment they wouldprefer not to be in; and
• increase employee bargaining power: EPL can also have a direct effect onwages by increasing the job security of those in work, encouraging them todemand larger pay increases without a fear of dismissal during negotiations,i.e. increasing insider-outsider effects. Saint-Paul (1999), for example, noteshow to some extent EPL makes it more difficult for employers to resist wagedemands by refusing to employ the worker any longer.
4.54 Chart 4.7 shows an indicator of EPL over the 1990s. Bearing in mind certain caveats,9 thepattern that emerges is one where regulations in Southern Europe appear more heavyhanded compared to regulations in other economies. The chart also illustrates that there hasbeen a general easing of EPL over the 1990s in the rest of Europe, primarily through theliberalising of legislation covering temporary contracts. The data only go up to 1998, but thetrend of reducing the strictness of EPL appears to have continued towards the end of the1990s (Garibaldi and Mauro, 2002). Despite this, the UK remains one of the countries whereEPL is the least heavy handed.
72
4
9 Bertola et al. (2000) suggest that revised EPL indicators are needed to capture the complexity of the existing institutionalframework, insofar as current EPL rankings are not a reliable guide. Morgan (2001) attempts to rank the strictness of EPLbased on a question in the European Commission’s ad hoc labour survey as to whether regulation on shedding staff is anobstacle to employing more people. Morgan finds that there are differences between how countries perceive regulatoryprovisions with the rankings implied in Chart 4.7.
Working timeregulations
EmploymentProtectionLegislation

73
4.55 The role of product market regulation is increasingly featuring in discussions of labourmarket rigidities in the UK and EU. Competitive product markets create incentives to uselabour efficiently. In the Layard, Nickell and Jackman (1991) framework both the labourmarket and the product market determine the NAIRU jointly.
4.56 For example, Krueger and Pischke (1997) emphasise (although they do not test formally)that labour market flexibility alone does not explain why employment growth has beenstronger in the US than in Europe. Rather, they suggest that restrictions on entrepreneurs andproduct market regulations can distort labour demand. More recently, Pissarides (2001) findsthat company start up costs can affect employment patterns by influencing the creation ofnew firms and therefore total job creation, while Jean and Nicoletti (2002) suggest thatproduct market restrictions can increase wage premia.
4.57 An authoritative account of the cross-market effects of labour market and product marketregulations can be found in OECD (2002f) and Anderson et al. (2000). However, given that theseinteractions exist, it is informative to examine indicators of product market regulation as ameans of describing the underlying performance or flexibility of the labour market.
4.58 A full assessment of the flexibility of the product market is beyond the scope of thisstudy and would be for the assessment of the flexibility test. To underpin the assessment,Chart 4.8 shows an overall indicator of the degree of product market regulation. It suggeststhat the UK has the most flexible product market in the OECD, with the general pattern beingthat the degree of regulation is higher in continental Europe. Although this is only one surveyand dates back to 1998, the results are consistent with separate qualitative surveys of businesspeople and experts (Nicoletti and Pryor, 2001).
4.59 The overall level of regulation appears to be relatively low in the UK. Employmentprotection legislation in the UK is less heavy handed than in many other OECD countries, andmore conducive to market flexibility. However, at the same time there have been moves acrossEurope to reduce the stringency of these rules and regulations. The National Minimum Wagecould reduce the flexibility of the labour market if it were either set at too high a level, or setan inappropriate going rate. However, evidence to date suggests it has not been undulyrestrictive. Membership of the single currency would not affect the ability of the UKGovernment to determine the level of the National Minimum Wage.
TH E IN S T I T U T I O N A L EN V I R O N M E N T4
Product marketregulation
Conclusion:regulation
Chart 4.7: Indicators of the strictness of EPL, 1990 and 1998
Source: Nicoletti, Scarpetta and Boylaud (2000).Note: A lower index means a lower level of legislation and a lower level of strictness.
0 1 2 3 4 50
1
2
3
4
5
Sric
tnes
s in
1998
Strictness in 1990
USUK
Jap
AusSwz
Ita
Gre
Spa
Ger
1998 = 19901998 > 1990
1998 < 1990
Swe
Can NZ
Ire
Aut
Den
Nld
Por
Nor
BelFin
Fra

TH E IN S T I T U T I O N A L EN V I R O N M E N T
L ABOUR MARKET FLEXIBILITY AND COLLECTIVEBARGAINING
4.60 A large body of evidence has discussed whether the structure of collective bargaining iscorrelated with economic performance. The most often cited piece of work is that of Calmforsand Driffill (1988) who looked at the impact of centralised and decentralised bargainingsystems on the performance of the labour market.
4.61 Centralisation refers to the level at which wages are negotiated. Under a decentralisedsystem, wage settlements are agreed at the company level between employees and individualemployers. In the extreme, individual contracts are agreed separately for each employee in aparticular industry and wage outcomes should approximate those of perfectly competitivemarkets.
4.62 As the bargaining process becomes more centralised, a larger number of companies inan industry conduct wage negotiations jointly. In the extreme, one union and one employeragree wages at the national level. In between the decentralised and centralised systems is anintermediate position, where trade unions representing industries, groups or regions bargain,for example, with employer associations.
4.63 Calmfors and Driffill reasoned that a non-linear relationship exists between the degreeof centralisation and labour market performance. This arises because of two relationships:
• the price elasticity of demand for the product: the more competition that a firmfaces, the greater will be the price elasticity of demand for its product. Ascompetition intensifies then a given price increase due to higher wages willhave a larger negative impact on the demand for the firm’s output. Asbargaining moves to a more centralised/ industry level there are fewer closesubstitutes for products such that a higher price will not reduce demand to thesame extent. The general conclusion is that the decentralised wage bargainingsystem will give rise to more wage discipline via the higher elasticity ofdemand for the product; and
74
4
Thecentralisation of
collectivebargaining
Chart 4.8: Summary indicator of product market regulation, 1998
Source: Nicoletti, Scarpetta and Boylaud, 2000.Note: A lower index means a lower level of regulation.
0.0
0.5
1.0
1.5
2.0
2.5
Ire Aus US NZ Aut Ger Den Nld Swe Can Jap Spa Fin Por Swz Bel Fra Gre Nor ItaUK

• negative externalities: wage bargains for certain groups may negatively impact onindividuals not directly affected by the negotiations. As wage bargaining becomesmore centralised/ country wide, then the distinction between those who benefitand those who are harmed by higher wage claims becomes less well defined. Thegeneral conclusion is that centralised bargaining systems internalise this negativeexternality and have outcomes characterised by lower wage increases.
4.64 The result of the interaction of these two relationships is that the highest wage demandstend to be associated with an intermediate position. In this situation unions are too large forcompetitive forces to work but too small to internalise the negative effects of their wagedemands. Employers’ bodies are large enough to ‘bind’ their members, but not sufficientlylarge so as to take account of the needs of all employers and potential employers. This resultsin a hump-shaped relationship between the centralisation of wage setting and wageoutcomes. Or in other words, wage flexibility tends to be higher when bargaining is highlycentralised or highly decentralised.
4.65 Whether this relationship holds empirically is not clear, and research tends to producea variety of findings (OECD, 1997). This may reflect the fact that Calmfors and Driffill onlyconsider the level of centralisation. A more rounded picture of collective bargaining wouldalso need to look at:
• the degree of coordination: this refers to the degree of consensus amongbargainers. Even if bargaining is relatively decentralised, if negotiations arehighly coordinated among unions and/ or employers then the actual outcomemight approximate that of a more centralised bargaining system; and
• the breadth of collective bargaining: this refers to the presence of trade unions inthe labour market, measured by trade union density (trade union membershipas a percentage of all employees) and union coverage (the proportion ofemployees whose pay is affected by collective agreements). Even centralisedbargaining will have a small impact if union density and coverage are low.
4.66 Over the 1980s, the UK moved towards more decentralised and less coordinatedcollective bargaining. As Chart 4.9 illustrates, the UK’s degree of centralisation andcoordination is also low by international standards. If the hump-shaped hypothesis holds,then on the basis of the chart, relative wage rigidity would be higher in most of continentalEurope, where bargaining is carried out at the intermediate level.
TH E IN S T I T U T I O N A L EN V I R O N M E N T4
The UK becamemore
decentralisedover the 1980s
Coordination andthe breadth of
collectivebargaining
Chart 4.9: Level of wage bargaining centralisation and coordination in the EU, 2000
Source: Based on data from the European Industrial Relations Observatory.
0 2 4 6 8 10 12 14
0
1
2
3
4
5
6
7
8
9
10
Grea
ter
coor
dina
tion
Greater centralisation
Fra
UK
Lux Spa
Aut
Ita
Ger/Por/Swe
Nld
Gre Den
Fin/Nor Bel/Ire
Centralisation
Coor
dina
tion
75

TH E IN S T I T U T I O N A L EN V I R O N M E N T
4.67 The fact that decentralisation and coordination are low in the UK is conducive to relativewage flexibility, i.e. wages can adapt more readily to the prevailing conditions in a particularindustry. Moreover, under the Calmfors and Driffill hypothesis, the benefits of decentralisationshould increase the greater is the degree of competition in the product market. As has alreadybeen discussed, the level of product market competition is relatively high in the UK whichwould likely augment the positive outcomes associated with decentralisation.10
4.68 The trade-off of such a decentralised and uncoordinated system, according to Calmforsand Driffill, would be that wage setters in the UK would push for higher wages withoutconsidering the impact on aggregate variables, i.e. aggregate wage flexibility would be lower.Although this might be true as far as it goes, the argument does not consider the degree ofunion power or density. Union power is also an important determinant of aggregate wageflexibility. Trade unions can directly affect the real wage through their influence on nominalwage setting. Where union power is higher, the prevalence of insiders, who may care lessabout increasing employment prospects of outsiders and more about their own wages willalso be higher. The incentive for wage moderation will therefore be less if unions pursue amark-up for their members.
4.69 In the UK there has been a marked fall in trade union density since the 1970s (see Brook(2002) for an overview). The proportion of employees who were union members declinedfrom over half in the 1970s to less than 30 per cent in 2001. This largely reflects the impact oftrade union legislation over the 1980s, and the relative decline of sectors traditionallyassociated with unionisation. In absolute terms, the number of trade union members hasfallen by up to 51/2 million over the past two decades (Chart 4.10).
76
4
Trade uniondensity has
declined in theUK
Chart 4.10: Trade union density and membership
1 CO is the Certification Officer.Source: ONS.
0
5
10
15
20
25
30
35
40
0
2000
4000
6000
8000
10000
12000
14000
16000
1979 1981 1983 1985 1987 1989 1991 1993 1995 1997 1999 2001
Membership (GB: CO)1
Membership (GB: LFS)
Density (GB: LFS)
Dens
ity (p
er c
ent)
Mem
bers
hip
(tho
usan
ds)
10 McHugh (2002) notes that increased product market competition makes the difference between centralised anddecentralised bargaining regimes irrelevant, and that it can counteract the negative externalities due to the coordinationfailure associated with decentralised systems.

77
4.70 Union density may not reflect accurately the true number of employees affected by unionactivity. France, for example, has a fairly low level of trade union density, but coverage is very highbecause laws extend union contracts to non-union workplaces (Chart 4.11). However, in the UK,trade union density and coverage are virtually synonymous. In 2001, just over one third ofemployees were covered by collective agreements, some way below the level in the early 1980s.Indeed in the UK, US and New Zealand union coverage has fallen alongside the fall in union densitywhile across continental Europe the gap appears to be widening (Nickell et al., 2001).
4.71 Theory would seem to suggest that the system of industrial relations in the UK wouldnot encourage work-related training. Under a decentralised bargaining system, theprevalence of different settlements across firms could lead to job switching or poaching. Theargument would be that this may dissuade employers from providing training if they fear thattheir own employees will move to another firm (Hall and Soskice, 2001). Similarly,Arulampalam and Booth (1998) found that non-union employees are less likely to receivetraining than individuals in a union covered job. In practice, there is a modern role for tradeunions to play in delivering functional flexibility. This underlines the importance ofencouraging work-based training and ensuring that employees are equipped with skillsbefore entering the workplace, as discussed in Section 2.
4.72 In conclusion, the UK system of industrial relations is one that appears conducive towage flexibility. The decentralised and uncoordinated nature of collective bargaining meansthat relative wages can adjust to conditions across industries, sectors and regions. The declinein collective bargaining over the last past two decades also supports aggregate wage flexibility.
AN INDICATOR OF L ABOUR MARKET INSTITUTIONS
4.73 Building on the results of a recent econometric study11 into the institutionaldeterminants of labour market performance, Chart 4.12 presents an indicator of labourmarket flexibility developed by HM Treasury for this study.
TH E IN S T I T U T I O N A L EN V I R O N M E N T4Trade union
coverage is alsolow
Chart 4.11: Trade union density and coverage, 2000, per cent
Source: European Industrial Relations Observatory.
0 20 40 60 80 1000
20
40
60
80
100
Cove
rage
Density
Fra
Spa
US Jap
UK
Por
Ger
Nld
Aut Bel SweFin
Den
Does the UK’sframework
support work-related training?
Conclusion:collective
bargaining
An indicator offlexibility
11 Blanchard and Wolfers (2000).

4.74 The indicator pools together the evidence on the institutional environment, therebygiving some indication of the sustainability of labour market outcomes and the progress ofeconomic reform. It combines measures discussed earlier in this section – the replacementrate, benefit duration, spending on active labour market policies, employment protectionlegislation, the tax wedge, union coverage, and union density – into one single measure offlexibility (Annex B sets out its full derivation).
4.75 The indicator enables a summary comparison of how flexible countries are relative toone another, based on a set of institutional factors. An averagely flexible economy (relative toother countries) scores a value of seven. Countries that are more (less) flexible than theaverage score a value less (more) than seven.
4.76 What the indicator does not enable is an assessment of whether an economy hasbecome more flexible over time. Nor should it be seen as suggesting a blueprint for labourmarket reform. The EU Member States with the highest employment rates all have verydifferent institutional environments. Economic reform needs to be tailored to the needs andaspirations of a diverse and changing Europe.
4.77 Nevertheless, the results are consistent with the discussion in this section, namely thatlabour market institutions and regulations are less stringent in the UK than in continentalEurope and suggests that the improved labour market performance observed in recent yearsis well founded.
4.78 The results also correlate closely with other composite indicators of labour marketperformance (see, for example, Dicks and Papadavid, 2002). Although some question marksremain surrounding the ranking of certain countries, it shows that greater flexibility tends tobe associated with countries outside of continental Europe.
Chart 4.12: An indicator of labour market flexibility
0
1
2
3
4
5
6
7
8
9
UK
Indi
cato
r sc
ore
Swz Jap Can Ire Aut NZGer Aus Ita Spa Swe Nld Nor Por Fin Fra Den BelUS
Source: HM Treasury.Note: A lower value implies a more flexible institutional environment.
TH E IN S T I T U T I O N A L EN V I R O N M E N T
78
4

79
4.79 In determining whether or not a monetary union is economically beneficial, the state ofthe labour market is often assumed to be exogenous. In actuality, it is unlikely that this wouldbe the case – the Lucas critique. That is to say, entry into EMU itself might act as a catalyst forlabour market reform. However, the actual direction of the effect is inconclusive. For example:
• EMU could increase the desire for reform because the elimination of thenominal euro-sterling exchange rate and monetary policy as adjustmentmechanisms increases the need for flexible labour markets i.e. there is aprecautionary motive for reform; and
• EMU could lead to less reform if there is a coordination failure. A countrycould introduce structural reforms that reduced the structural unemploymentrate. However, they might not get the benefits of lower interest rates thatwould be evident under an independent monetary policy because the ECBresponds to euro area wide inflation developments (see, for example, Saint-Paul, 2002).
4.80 While some work suggests that reform is a function of the exchange rate regime, (Viñalsand Jimeno, 1996; Anderton and Barrell, 1993; Eichengreen, 1998; and Bertola et al., 2001) itis difficult to draw a definitive conclusion. The ambiguity is apparent in other literature, seefor example Berthold and Fehn, 1998; Sibert and Sutherland, 2000; Calmfors, 2001.
TH E IN S T I T U T I O N A L EN V I R O N M E N T4EMU as a catalyst
for reform

80

5 CO N C LU S I O N S : FL E X I B I L I T Y I N T H E
UK A N D E U R O A R E A
81
5.1 Labour market flexibility is an important objective irrespective of whether a country isinside or outside of a currency union. But it takes on an added importance when neither thenominal exchange rate nor national interest rates can be adjustment mechanisms in the faceof economic shocks.
5.2 This study has discussed the flexibility of the UK labour market in the context of andto inform the Treasury’s assessment of the five economic tests for possible entry into EMU. Ithas discussed the flexibility of the UK and euro area labour markets, both in general and interms of the specific forms of flexibility that are most relevant to a currency union. Theanalysis is intended to help inform the question of whether the UK labour market could copeeffectively with any problems that might emerge in EMU.
5.3 The Treasury’s previous assessment in 1997 concluded that there was insufficientflexibility in the labour market to meet the challenges of EMU membership. This study hasre-examined the issues raised at that time, but has also broadened and deepened theanalysis. This has been structured under a comprehensive framework that has:
• examined the different mechanisms by which the labour market can adjust –the characteristics of flexible labour markets;
• discussed the current position of the UK labour market, in relation to itshistorical performance and in comparison with other countries – theoutcomes in flexible labour markets; and
• looked at the institutional environment in the labour market and how theseinstitutions can slow the adjustment of prices and quantities.
5.4 The following key points stand out from the preceding analysis under this framework:
• in line with the favourable growth of average earnings, a new econometricexercise undertaken for this study has presented some evidence of increasedreal wage flexibility in the UK. However, this has not been significantly testedin recent years and could be more severely tested if the UK decided to joinEMU, where price movements would need to play a greater role inadjustment to shocks;
• evidence would seem to be against geographic mobility being prevalent interms of equilibrating movements of labour between and within EUcountries. However, this study has argued that the practical importance oflabour mobility, while a relevant factor, has been overplayed in the academicdebate about monetary unions in general, and EMU in particular. However,this requires that other characteristics such as wage flexibility, employmentflexibility and functional flexibility can compensate for a low level ofgeographic mobility and allow labour markets to function effectively;
• there have been significant improvements at the macroeconomic level where,in particular, alongside employment growth there has been a reduction in theNAIRU and the growth of average earnings has been benign. At themicroeconomic level, government intervention has focused on ensuring thatindividuals have the right skills to adapt to economic change. However, whilethere has been a significant decline in long-term unemployment, the stock ofworkers with low skills is being reduced only very slowly; and

CO N C LU S I O N S : FL E X I B I L I T Y I N T H E UK A N D E U R O A R E A
• the changes to the institutional environment in the UK over the 1980s and1990s have contributed to improving the flexibility of the UK labour market. Anew indicator of flexibility based on these institutions also suggests that theUK performs well in relation to other economies. The impact of recent and on-going reforms will only emerge gradually over a number of years, and so mayhave yet to fully materialise in wider labour market outcomes.
5.5 In conclusion, there is evidence that the UK labour market has become more flexiblesince the Treasury’s previous EMU assessment in 1997 and that the labour market would bein a better position to respond to any problems that might emerge within EMU, were the UKto decide to join. Macroeconomic stability has undoubtedly contributed to the favourableoutcomes that have been observed, but another important element has probably been thatthe institutional and policy environment has been conducive to labour market flexibility.
5.6 But, despite evidence of improvement in the UK labour market, major challengesremain. More progress is needed to advance the Government’s long-term goal of employmentopportunities for all, in particular, to reduce persistent inactivity and repeated spells ofworklessness. In addition, wage flexibility has not been fully tested in recent years and couldbe more severely tested if the UK decided to join EMU.
5.7 Progress across the rest of Europe has been mixed, with more concrete signs ofimprovement being evident in some of the smaller EU Member States. Progress in the largerEU economies has been slower and starts from a weak position in terms of unemploymentand employment levels. Continued progress on structural reform will ensure that all ofEurope’s labour markets work to their full potential raising employment and reducingunemployment to the benefit of Europe. Improved labour market flexibility will also enablethe existing and prospective euro area members to better reap the potential benefits of EMU.
5.8 These issues are considered in the assessment of the flexibility test – the second of theGovernment’s five economic tests for EMU entry.
82
5

RE F E R E N C E S
83
Alogoskoufis, G.S. and Manning, A. (1988) ‘On the Persistence of Unemployment’, EconomicPolicy 7, (October), pp. 428-469.
Andersen, P.S. and Wascher, W.L. (1999) ‘Sacrifice Ratios and the Conduct of Monetary Policyin Conditions of Low Inflation’, Bank for International Settlements Working Paper No. 82.
Andersen, T.M., Haldrup, N. and Sørensen, J.R. (2000) ‘EU Labour Markets: Effects of GreaterProduct Market Integration’, Economic Policy 15 (30), (April), pp. 106-133.
Anderton, R., Barrell, R., Willem in’t Veld, J.W., and Pittis, N. (1992) ‘Forward looking Wagesand Nominal Intertia in the ERM’, National Institute Economic Review, (August), pp. 94-105.
Anderton, R. and Barrell, R. (1993) ‘The ERM and Structural Change in European LabourMarkets: A Study of 10 Countries’, National Institute of Economic and Social ResearchDiscussion Paper No. 40.
Arulampalam, W. and Booth, A.L. (1998) ‘Training and Labour Market Flexibility: Is There aTrade-off?’, Paper presented at the British Association for the Advancement of ScienceMeetings, Leeds, 10-11 September 1997 under the title ‘Labour Market Flexibility and SkillsAcquisition: Is There a Trade-off?’.
Asdrubali, P., Sørensen, B.E. and Yosha, O. (1996) ‘Channels of Interstate Risk Sharing: UnitedStates 1963-1990’, The Quarterly Journal of Economics, (November), pp. 1081-1110.
Atkinson, J. and Dewson, S. (2001) ‘Evaluation of the New Deal 50plus: Research withIndividuals (Wave 1)’ Research and Development Report, ESR91, Employment Service.
Bank of England (1997) Inflation Report, (August).
Bank of England (2002) Inflation Report, (August).
Barrell, R. and Dury, K. (2001) ‘Asymmetric Labour Markets in a Converging Europe: DoDifferences Matter?’ ENEPRI Working Paper No. 2.
Barro, R.J. (1988) ‘The Persistence of Unemployment’, American Economic Review 78 (2),pp. 32-37.
Bayoumi, T. and Prasad, E. (1996) ‘Currency Unions, Economic Fluctuations and Adjustment:Some New Empirical Evidence’, IMF Working Paper No. WP/96/81.
Bean, C.R., Layard, P.R.G. and Nickell, S.J. (1986) ‘The Rise in Unemployment: A Multi-Country Study’, Economica Supplement 53, pp. 1-22.
Bean, C., (1992) ‘Economic and Monetary Union in Europe’, Centre for EconomicPerformance Discussion Paper No.86.
Beatson, M. (1995) ‘Labour Market Flexibility’, Employment Department, Research PaperSeries No. 48.
Beissinger, T. and Knoppik, C. (2000) ‘Downward Nominal Rigidity in West-German Earnings1975-1995’, University of Regensburg Discussion Paper No. 344.
Belot, M. and van Ours, J.C. (2000) ‘Does the Recent Success of Some OECD Countries inLowering Their Unemployment Rates Lie in the Clever Design of Their Labour MarketReforms?’. Centre for Economic Policy Research Discussion Paper No. 2492.
RE F E R E N C E S
Berthold, N. and Fehn, R. (1998) ‘Does EMU Promote Labor-Market Reforms?’, Kyklos 51,pp. 509-536.
Berthold, N., Fehn, R. and Thode, E. (1999) ‘Real Wage Rigidities, Fiscal Policy and the Stabilityof EMU in the Transition Phase’, IMF Working Paper No. WP/99/83.
Bertola, G. (1999) ‘Microeconomic Perspectives on Aggregate Labor Markets’, inO.C. Ashenfelter and D. Card (eds) Handbook of Labor Economics, 3C Amsterdam: North-Holland.
Bertola, G., Boeri, T. and Cazes, S. (2000) ‘Employment Protection in Industrialized Countries:the Case for New Indicators’, International Labour Review 139(4), pp. 57-72.
Bertola, G., Boeri, T. and Nicoletti, G. (eds) (2001) Welfare and Unemployment in a UnitedEurope. Cambridge Mass: MIT Press.
Bewley, T.F. (1999) Why Wages Don’t Fall During a Recession. Cambridge, MA: HarvardUniversity Press.
Blanchard, O.J. and Katz, L.F. (1992) ‘Regional Evolutions’, Brookings Papers on EconomicActivity 1, pp. 1-75.
Blanchard, O. and Wolfers, J. (2000) ‘The Role of Shocks and Institutions in the Rise ofEuropean Unemployment: the Aggregate Evidence’, The Economic Journal 110 (March),C1-C33.
Blundell, R,. Duncan, A,. McCrae, J. and Meghir, C. (2000) ‘The Labour Market Impact of theWorking Families’ Tax Credit’, Fiscal Studies 21 (1), pp. 75-104.
Blundell, R. and Hoynes, H. (2001) ‘Has “In-Work” Benefit Reform Helped the Labour Market?’NBER Working Paper No. 8546.
Böheim, R. and Taylor, M. (1999) ‘Residential Mobility, Housing Tenure and the LabourMarket in Britain”, Institute for Social and Economic Research and Institute for LabourResearch, University of Essex. <www.iser.essex.ac.uk/pubs/workpaps/pdf/99-16.pdf>
Borghijs, A. (2000) ‘Does EMU Lead to European Wage-Setting?’ Paper presented at theENEPRI International Workshop on Asymmetries in Labour Market, September 29-30, Paris.
Borjas, G.J. and Ramey, V.A. (2000) ‘Market Responses to Interindustry Wage Differentials’,NBER Working Paper No. 7799.
Bover, O., Arellano, M. and Bentolila, S. (1996) ‘Unemployment Duration, Benefit Durationand the Business Cycle’, Banco de España, Servicio de Estudios, Estudios Económicos No. 57.
Brook, K. (2002) ‘Trade Union Membership: An Analysis of Data from the Autumn 2001 LFS’,Labour Market Trends 110 (7), (July), pp. 343-354.
Brown, C. (1999) ‘Minimum Wages, Employment, and the Distribution of Income’, in O. C.Ashenfelter and D. Card (eds) Handbook of Labor Economics, 3B, Amsterdam: North-Holland.
Buti, M., Franco, D. and Pench L.R. (1997) ‘Reconciling the Welfare State with Sound PublicFinances and High Unemployment’, in Commission of the European Communities: TheWelfare State in Europe: Challenges and Reforms, European Economy, Reports and Studies 4.
Calmfors, L. (2001) ‘Unemployment, Labor Market Reform and Monetary Union’, Journal ofLabor Economics 19 (2) pp. 265-289.
84

85
Calmfors, L. and Driffill, J. (1988) ‘Bargaining Structure, Corporatism and MacroeconomicPerformance’, Economic Policy 6, (April), pp. 14-61.
Calmfors, L. and Johansson, A. (2002) ‘Nominal Wage Flexibility, Wage Indexation andMonetary Union’, CESIFO Working Paper No. 761.
Cameron, G. and Muellbauer, J. (2001) ‘Earnings, Unemployment, and Housing in Britain’,Journal of Applied Econometrics 16, pp. 203-220.
Carone, G. and Salomäki, A. (2001) ‘Reforms in Tax-Benefit Systems in Order to IncreaseEmployment Incentives in the EU’, European Commission Economic Paper No. 160.
Chen, Y-F., Snower, D. and Zoega, G. (2002) ‘Labour Market Institutions and MacroeconomicShocks’, Centre for Economic Policy Research Discussion Paper No. 3480.
Coe, D.T (1985) ‘Nominal Wages, the NAIRU and Wage Flexibility’, OECD Economic Studies 6,pp. 87-126.
Coe, D.T., Chan-Lee, J. and Prywes, M. (1987) ‘Microeconomic Changes and MacroeconomicWage Disinflation in the 1980s’, OECD Economic Studies 8, pp. 121-157.
Coe, D.T. and Snower, D.J. (1997) ‘Policy Complementarities: the Case for FundamentalLabour Market Reform’, Centre for Economic Policy Research Discussion Paper No. 1585.
Cukierman, A. and Lippi, F. (2001) ‘Labour Markets and Monetary Union: A Strategic Analysis’,The Economic Journal 111, (July), pp. 541-565.
Danish Ministry of Finance (1998) ‘Availability Criteria in Selected OECD-Countries’, WorkingPaper No. 6.
Daveri, F. and Tabellini, G. (2000) ‘Unemployment and Taxes: Do Taxes Affect the Rate ofUnemployment?’, Economic Policy (April), pp. 48-104.
Davies, S. and Hallet, M. (2001) ‘Policy Responses to Regional Unemployment: Lessons fromGermany, Spain and Italy’, European Commission Economic Paper No. 161.
De Grauwe, P. and Vanhaverbeke, W. (1991) ‘Is Europe an Optimum Currency Area? Evidencefrom Regional Data’, Centre for Economic Policy Research Discussion Paper No. 555.
Decressin, A. and Decressin, J. (2002) ‘On Sand and the Role of Grease in Labor Markets: HowDoes Germany Compare?’ IMF Working Paper No.WP/02/164.
Decressin, J. and Fatás, A. (1995) ‘Regional Labor Market Dynamics in Europe’, EuropeanEconomic Review 39, pp. 1627-1655.
Dellas, H. and Tavlas, G. (2002) ‘Wage Rigidity and Monetary Union’, Centre for EconomicPolicy Research Discussion Paper No. 3679.
Den Haan, W.J., Haefke, C. and Ramey, G. (2001) ‘Shocks and Institutions in a Job MatchingModel’, NBER Working Paper No. 8463.
Denis, C., McMorrow, K. and Röger, W. (2002) ‘Production Function Approach to CalculatingPotential Growth and Output Gaps – Estimates for the EU Member States and the US’,European Commission Economics Papers No. 176.
Desai, T., Gregg, P., Steer, J. and Wadsworth, J. (1999) ‘Gender and the Labour Market’, in P.Gregg and J. Wadsworth, The State of Working Britain. Manchester: Manchester UniversityPress.
RE F E R E N C E S

RE F E R E N C E S
Dessy, O. (2002) ‘Nominal Wage Rigidity in the European Countries: Evidence from theEuropanel’. <www.diw.de/deutsch/abteilungen/ldm/archiv/ar2002/panel2002/session_d2/111_dessy.pdf>
Dickens, R. (2001) ‘The National Minimum Wage’, in R. Dickens, J. Wadsworth and P. GreggThe State of Working Britain – Update 2001. York: York Publishing Services Ltd.
Dickens, R. and Manning, A. (2002) ‘Has the National Minimum Wage Reduced UK WageInequality?’, Centre for Economic Performance Discussion Paper No. 533.
Dicks, M. and Papadavid, P. (2002) ‘The Causes of Unemployment’, Lehman BrothersStructural Economics Research Paper No. 5.
Disney, R. (2000) ‘The Impact of Tax and Welfare Policies on Employment and Unemploymentin OECD Countries’, IMF Working Paper No. WP/00/164.
Dolton, P. and O’Neill, D. (1996) ‘Unemployment Duration and the Restart Effect: SomeExperimental Evidence’, The Economic Journal 106(435), (March) pp. 387-400.
Döpke, J. (2001) ‘The “Employment Intensity” of Growth in Europe’, Kiel Institute of WorldEconomics Working Paper No. 1021.
Eichengreen, B. (1998) ‘European Monetary Unification: A Tour D’horizon’, Oxford Review ofEconomic Policy 14 (3), pp. 24-40.
Elmeskov, J. and MacFarlan, M. (1993) ‘Unemployment Persistence’, OECD Economic Studies21, pp. 59-88.
Equal Opportunities Commission (2001) ‘The Gender Pay Gap: a Research Review’,<www.eoc.org.uk/EOCeng/EOCcs/Research/gender_pay_gap_research_review_findings.pdf>
European Central Bank (2002) ‘Labour Market Mismatches in Euro Area Countries’.<www.ecb.int/pub/pdf/labourmarket2002.pdf>
European Commission (1995) ‘The 1994 EU Labour Market Survey in the Context of an ActiveEmployment Policy in the European Union’ in European Economy 3.
European Commission (2002a) ‘Statistical Annex of European Economy’, (Autumn).
European Commission (2002b) ‘Commission’s Action Plan for Skills and Mobility’, (February).
European Commission (2002c) ‘Employment in Europe 2002: Recent Trends and Prospects’,Directorate General for Employment and Social Affairs.
European Commission (2002d) ‘European Economy: Economic Forecasts Spring 2002’, No. 2.
Eurostat (2001) European Social Statistics Labour Force Survey Results 2000.
Evans, J.M., Lippoldt, D.C. and Marianna, P. (2001) ‘Trends in Working Hours in OECDCountries’, OECD Labour Market and Social Policy Occasional Paper No. 45.
Fabiani, S. and Rodriguez-Palenzuela (2001) ‘Model-based Indicators of Labour MarketRigidity’, European Central Bank Working Paper No. 57.
Forstater, M. (2000) ‘Full Employment and Economic Flexibility’, Economic and LabourRelations Review 11(0) Supplement, pp. 69-88.
Garibaldi, P. and Mauro, P. (2002) ‘Employment Growth: Accounting for the Facts’, EconomicPolicy 17 (34), (April), pp. 67-113.
86

87
Glyn, A. and Rowthorn, R. (2002) ‘Convergence and Stability in US Regional Employment’,Oxford University Economics Department Discussion Paper No. 092.
Glyn, A. and Salverda W. (2000) ‘Does Wage Flexibility Really Create Jobs?’, Challenge, Vol. 43(1), (January/ February), pp. 32-43.
Goubert, L. and Omey, E. (1996) ‘An Alternative Measure of Wage Flexibility’ InternationalAdvances in Economic Research 2 (3), (August), pp. 199-221.
Greenaway, D., Upward, R. and Wright, P. (2002) ‘Structural Adjustment and the Sectoral andGeographical Mobility of Labour’, Centre for Economic Policy Research Discussion Paper No.3662.
Gregg, P,. Johnson, P. and Reed, H. (1999) Entering Work and the British Tax and BenefitSystem, Institute for Fiscal Studies, (March).
Gregg, P. and Pasanen, P. (2001) ‘Entry Wages Since 1996’. In R. Dickens, J. Wadsworth and P.Gregg The State of Working Britain – Update 2001. York: York Publishing Services Ltd.
Gregg, P. and Wadsworth, J. (1999) ‘Job Tenure, 1975-98’ in P. Gregg and J. Wadsworth, TheState of Working Britain. Manchester: Manchester University Press.
Grubb, D., Jackman, R. and Layard, R. (1983) ‘Wage Rigidity and Unemployment in OECDCountries’, European Economic Review 21, pp. 11-39.
Grubb, D. (2000) ‘Eligibility Criteria for Unemployment Benefits’, OECD Economic Studies No.31 (II), pp. 147-184.
Grüner, H.P. and Hefeker, C. (1999) ‘How Will EMU Affect Inflation and Unemployment inEurope?’ Scandinavian Journal of Economics 101(1), pp. 33-47.
Guichard, S. and Laffargue, J.P (2000) ‘The Wage Curve: The Lessons of an Estimation Over aPanel of Countries’, Paper presented at the International Workshop on EMU and Asymmetriesin Labour Market, Paris, 29-30 September.
Hall, P. A. and Soskice, D. (2001) Varieties of Capitalism: The Institutional Foundations ofComparative Advantage. Oxford: Oxford University Press.
Haskel, J. and Martin, C. (2001) ‘Technology, Wages and Skill Shortages: Evidence from UKMicro Data’, Oxford Economic Papers 53 (4) pp. 642-658.
Hasluck, C., Elias, P. and McKnight, A. (2000) ‘Evaluation of the New Deal for Lone Parents:Early Lessons from the Phase One Prototype – Cost-Benefit and Econometric Analyses’, DSSResearch Report No. 110, CDS: Leeds.
Heylen, F. (1993) ‘Labour Market Structures, Labour Market Policy and Wage Formation in theOECD’, LABOUR 7 (2) pp. 25-51.
HM Treasury (1997) UK Membership of the Single Currency: An Assessment of the FiveEconomic Tests, October.
HM Treasury (2000a) The Goal of Full Employment: Employment Opportunity for allThroughout Britain – Trends in Regional and Local Vacancies and Unemployment, February.
HM Treasury (2000b) Tackling Poverty and Making Work Pay – Tax Credits for the 21st CenturyThe Modernisation of Britain’s Tax and Benefit System No. 6, March.
HM Treasury (2001) The Changing Welfare State: Employment Opportunity for All, November.
RE F E R E N C E S

RE F E R E N C E S
HM Treasury (2002a) Towards Full Employment in the European Union, July.
HM Treasury (2002b) Realising Europe’s Potential: Economic Reform in Europe, February.
HM Treasury (2002c) Developing Workforce Skills: Piloting a New Approach, April.
HM Treasury (2002d) ‘Meeting the Productivity Challenge’, Chapter 3 in the Pre-BudgetReport, November.
HM Treasury (2002e) ‘Increasing Employment Opportunity for All’, Chapter 4 in the Pre-Budget Report, November.
Holden, S. (2002) ‘The Costs of Price Stability – Downward Nominal Wage Rigidity in Europe’,Department of Economics, University of Oslo, March.
Horn, G.A, Scheremet, W. and Zwiener, R (1999) Wages and the Euro. Heidelberg: New York.
Hughes Hallett, A. and Viegi, N. (2000) ‘Labour Market Institutions and Monetary Policy inEMU: Do Asymmetries Matter?’, Paper presented at the International Workshop on EMU andAsymmetries in Labour Market, 29-30 September, Paris.
International Monetary Fund (1999) ‘Chronic Unemployment in the Euro Area: Causes andCures’, in World Economic Outlook, May.
International Monetary Fund (2000) ‘Wage Flexibility and EMU’, IMF Staff Country Report No.00/106.
International Monetary Fund (2001) ‘Selected Euro-Area Countries: Rules-Based Fiscal Policyand Job-Rich Growth in France, Germany, Italy and Spain – Report with SupplementaryInformation’, IMF Country Report No. 01/203.
International Monetary Fund (2002) ‘Spain – 2002 Article IV Consultation PreliminaryConclusions’, November 11 (available at <www.imf.org>).
Institute for Employment Research (2002), ‘The Re-engineered New Deal 25 Plus: A Summaryof Recent Evaluation Evidence’, September.
Jackman, P. and Savouri, S. (1999) ‘Has Britain Solved the ‘Regional Problem?’, in P. Gregg andJ. Wadsworth, The State of Working Britain. Manchester: Manchester University Press.
Jackman, P., Layard, R. and Nickell, S. (1996) ‘Combatting Unemployment: Is FlexibilityEnough?’. Centre for Economic Policy Research Discussion Paper No. 293.
Jean, S. and Nicoletti, G. (2002) ‘Product Market Regulation and Wage Premia in Europe andNorth America: An Empirical Investigation’, OECD Economics Department Working PaperNo. 318.
Karanassou, M. and Snower, D.J. (1998) ‘How Labour Market Flexibility AffectsUnemployment: Long-term Implications of the Chain Reaction Theory’, The EconomicJournal 108 (May), pp. 832-849.
Kostoris Padoa-Schioppa, F. and Basile, R. (2002) ‘Unemployment Dynamics of the‘Mezzogiornos of Europe’: Lessons for the Mezzogiorno of Italy’. Centre for Economic PolicyResearch Discussion Paper No. 3594.
Krueger, A.B. and Pischke, J.S. (1997) ‘Observations and Conjectures on the US EmploymentMiracle’. Paper presented at the Third Public GAAC Symposium. Labor Markets in the USAand Germany, ZEW, Mannheim, 10-11 June.
88

89
Krueger, A. (2000) ‘From Bismarck to Maastricht: The March to European Union and theLabor Compact’, National Bureau of Economic Research Working Paper No. 7456.
Lagos, R.A. (1994) ‘Labour Market Flexibility: What Does it Really Mean?’, Cepal Review 54,(December), pp. 81-95.
Lauer, C. (1999) ‘The Effects of European Economic and Monetary Union on Wage Behaviour’,IZA Discussion Paper No. 36.
Layard, R., Nickell, S. and Jackman, P. (1991) Unemployment: Macroeconomic Performanceand the Labour Market. Oxford: Oxford University Press.
Lind Frogner, M. (2002a) ‘Housing Tenure and the Labour Market’, Labour Market Trends 110(10) (October), pp. 523-534.
Lind Frogner, M. (2002b) ‘Skills Shortages’, Labour Market Trends 110 (1), (January) pp. 17-27.
Lindley, J., Upward, R. and Wright, P. (2002) ‘Regional Mobility and UnemploymentTransitions in the UK and Spain’, The University of Nottingham Research Paper 2002/ 19.
Low Pay Commission (2001) The National Minimum Wage, Third Report (Volume 1).
Machin, S., Manning, A. and Rahman, L. (2002) ‘Where the Minimum Wage Bites Hard: theIntroduction of the UK National Minimum Wage to a Low Wage Sector’, Centre for EconomicPerformance Discussion Paper, No. 544.
Mauro, P. and Spilimbergo, A. (1998) ‘How do the Skilled and Unskilled Respond to RegionalShocks? The Case of Spain’, IMF Working Paper No. WP/98/77.
McCormick, B. (1997) ‘Regional Unemployment and Labour Mobility in the UK’, EuropeanEconomic Review 41, pp. 581-589.
McHugh, J. (2002) ‘Wage Centralization, Union Bargaining, and MacroeconomicPerformance’, IMF Working Paper No. WP/02/143.
McKay, S., Smith, A., Youngs, R. and Walker, R. (1999) ‘Unemployment and Jobseeking afterthe Introduction of the Jobseeker’s Allowance’. DSS Research Report No. 99. CDS: Leeds.
McLaughlin, K.J. (1999) ‘Are Nominal Wage Changes Skewed Away from Wage Cuts?’, FederalReserve Bank of St. Louis Review, (May/ June), pp. 117-132.
McMorrow, K. and Roeger, W. (2000) ‘Time-varying Nairu/ Nawru estimates for the EU’sMember States’, European Commission Economic Paper No. 145.
Minford, P. and Naraidoo, R. (2002) ‘Vicious and Virtuous Circles – the Political Economy ofUnemployment’, Centre for Economic Policy Research Discussion Paper No. 3618.
Morgan, J. (1996) ‘Labour Market Recoveries in the UK and Other OECD Countries’, LabourMarket Trends 104 (12) (December), pp. 529-539.
Morgan, J. (2001) ‘Employment Security and the Demand for Labour in Europe’, AppliedEconomics 33, pp. 1763-1774.
Muellbauer, J. and Cameron, G. (1998) ‘The Housing Market and Regional Commuting andMigration Choices’, Scottish Journal of Political Economy, (September), pp. 420-446.
Mundell, R.A. (1961) ‘A Theory of Optimum Currency Areas’, American Economic Review 51,(September), pp. 657-665.
RE F E R E N C E S

RE F E R E N C E S
Neathey, F. and Arrowsmith, J. (1999) ‘Early Implementation of the Working Time Regulations’,An Interim Report of Research for the Department of Trade and Industry, October.
Newell, A. and Symons, J.S.V. (1985) ‘Wages and Employment in the OECD Countries’, Centrefor Labour Economics, London School of Economics Discussion Paper No. 219.
Nickell, S. (1997) ‘Unemployment and Labor Market Rigidities: Europe versus North America’,Journal of Economic Perspectives 11 (3) pp. 55-74.
Nickell, S. (2001) ‘Has UK Labour Market Performance Changed?’, Speech given at the Societyof Business Economists, 16 May.
Nickell, S. and Layard, R. (1999) ‘Labor Market Institutions and Economic Performance’Chapter 46 in O. Ashenfelter and D. Card (eds) Handbook of Labor Economics 3C. Amsterdam:North Holland.
Nickell, S. and Quintini, G. (2001) ‘Nominal Wage Rigidity and the Rate of Inflation’, Centre forEconomic Performance Discussion Paper No. 489.
Nickell, S., Nunziata, L., Ochel, W. and Quintini, G. (2001) ‘Why do Jobless Rates Differ?’,Centrepiece, (Autumn), pp. 7-17.
Nickell, S., Nunziata, L., Ochel, W. and Quintini, G. (2002) ‘The Beveridge Curve,Unemployment and Wages in the OECD from the 1960s to the 1990s’, Centre for EconomicPerformance Discussion Paper No. 502.
Nicoletti, G. and Pryor, F.L. (2001) ‘Subjective and Objective Measures of the Extent of ProductMarket Regulations’ <www.aei.brookings.org/publications/related/measures.pdf>
Nicoletti, G, Scarpetta, S. and Boylaud, O. (2000) ‘Summary Indicators of Product MarketRegulation with an Extension to Employment Protection Legislation’, OECD EconomicsDepartment Working Paper No. 226, (April).
Obstfeld, M. and Peri, G. (1998) ‘Regional Nonadjustment and Fiscal Policy: Lessons for EMU’,NBER Working Paper No. 6431.
OECD (1997) ‘Economic Performance and the Structure of Collective Bargaining’, in OECDEmployment Outlook. OECD: Paris, July.
OECD (1999a) ‘Adaptability to Shocks: the Role of Labour Markets’, in EMU Facts, Challengesand Policies. OECD: Paris.
OECD (1999b) ‘Employment Protection and Labour Market Performance’, in OECDEmployment Outlook’. OECD: Paris, June.
OECD (2000a) ‘Revised OECD Measures of Structural Unemployment’, in OECD EconomicOutlook. OECD: Paris, December.
OECD (2000b) ‘Disparities in Regional Labour Markets’, in OECD Employment Outlook.OECD: Paris, June.
OECD (2001) ‘Recent Labour Market Developments and Prospects’, in OECD EmploymentOutlook. OECD: Paris, June.
OECD (2002a) Employment Outlook. OECD: Paris, July.
OECD (2002b) Economic Outlook. OECD: Paris, June.
OECD (2002c) Economic Survey of the Euro Area, July.
90

91
OECD (2002d) Taxing Wages 2000-2001. OECD: Paris.
OECD (2002e) Benefits and Wages OECD Indicators 2002 Edition. OECD: Paris.
OECD (2002f) ‘And the Twain Shall Meet: Cross Market Effects of Labour and Product MarketPolicies’, in OECD Employment Outlook. OECD: Paris, July.
O’Mahony, M. and de Boer, W. (2002) ‘Britain’s Relative Productivity Performance: Updates to1999 – Final Report to DTI/ Treasury/ ONS’, National Institute of Economic and SocialResearch, March.
Otoo, M.W. (1999) ‘Temporary Employment and the Natural Rate of Unemployment’, TheFederal Reserve Board Finance and Economics Discussion Series, 1999-66, December.
Phillips, A.W. (1958) ‘The Relation Between Unemployment and the Rate of Change of MoneyWage Rates in the United Kingdom, 1861-1957’, Economica. 25, pp. 283-99.
Pissarides, C.A. (1997) ‘The Need for Labor-Market Flexibility in European Economic andMonetary Union’, Swedish Economic Policy Review. 4, pp. 513-546.
Pissarides, C.A. (1999) ‘Policy Influences on Unemployment: The European Experience’,Scottish Journal of Political Economy 46 (4) (September), pp. 389-418.
Pissarides, C.A. (2001) ‘Company Start-Up Costs and Employment’, Centre for EconomicPerformance Discussion Paper No. 520.
Pissarides, C.A. (2002) ‘Unemployment in Britain: A European Success Story’, Paper writtenfor the conference Unemployment in Europe: Reasons and Remedies, jointly organised byYrjo Jahnsson Foundation and CESifo, Munich, December 6-7 2002.
Pissarides, C.A. and McMaster, I. (1990) ‘Regional Migration, Wages and Unemployment:Empirical Evidence and Implications for Policy’, Oxford Economic Papers 42, pp. 812-831.
Ramaswamy, R. and Prasad, E. (1994) ‘Shocks and Structural Breaks: Labor Market Reforms inthe United Kingdom’, IMF Working Paper, No. WP/94/152.
Rayner, E., Shah, S., White, R., Dawes, L. and Tinsley, K. (2000) ‘Evaluating Jobseeker’sAllowance: A Summary of the Research Findings’, DSS Research Report No. 116. CDS: Leeds.
Riley, R. and Young, G. (2000) ‘The New Deal for Young People: Implications for Employmentand the Public Finances’, Research and Development Report ESR62, Employment Service.
Roeger, W. and in’t Veld, J. (1997) ‘Quest II: A Multi Country Business Cycle and Growth Model’,European Commission Economic Paper No. 123, (October).
Saint-Paul, G. (1999) ‘Assessing the Political Viability of Labor Market Reform: The Case ofEmployment Protection’, Federal Reserve Bank of Saint Louis Review, (May-June), pp. 73-88.
Saint-Paul, G. (2002) ‘Macroeconomic Fluctuations and the Timing of Labour MarketReforms’, Centre for Economic Policy Research Discussion Paper No 3646.
Sargent. J.R. (2002) ‘Towards a New Economy? Recent Inflation and Unemployment in theUnited Kingdom’, National Institute Economic Review 181, (July), pp. 69-86.
RE F E R E N C E S

RE F E R E N C E S
Scarpetta, S. (1996) ‘Assessing the Role of Labour Market Policies and Institutional Settings onUnemployment: A Cross-Country Study’, OECD Economic Studies 26, pp. 43-98.
Scheremet, W. (2000) ‘On the Convergence of Wage Policy after EMU’, Paper presented at theInternational Workshop on EMU and Asymmetries in Labor Market, 29-30 September, Paris.
Sibert, A. and Sutherland, A. (2000) ‘Monetary Union and Labour Market Reform’, Journal ofInternational Economics 51, pp. 421-435.
Smith, J.C. (2000) ‘Nominal Wage Rigidity in the United Kingdom’, The Economic Journal(Conference Papers), 110, C176-C195.
Smith, J.C. (2002) ‘Pay Cuts and Morale: A Test of Downward Nominal Rigidity’, WarwickEconomic Research Paper No. 649, (September).
Soltwedel, R., Dohse, D. and Krieger-Boden, C. (1999) ‘EMU Challenges European LaborMarkets’, IMF Working Paper, No. WP/ 99/ 131.
Soskice, D. and Iversen, T. (1998) ‘Multiple Wage-Bargaining Systems in the Single EuropeanCurrency Area’, Oxford Review of Economic Policy 14 No. (3) pp. 110-124.
Stewart, M.B. (2002) ‘The Impact of the Introduction of the UK Minimum Wage on theEmployment Probabilities of Low Wage Workers’, University of Warwick Working Paper,February. <(www.warwick.ac.uk/fac/soc/Economics/stewart>
Turner, D., Richardson, P. and Rauffet, S. (1996) ‘Modelling the Supply Side of the Major OECDEconomies’, OECD Economics Working Paper No. 167.
Turner, D. and Seghezza, E. (1999) ‘Testing for a Common OECD Phillips Curve”, OECDEconomics Department Working Paper No. 219.
Turner, D., Boone, L., Giorno, C., Meacci, M., Rae, D. and Richardson, P. (2001) ‘Estimating theStructural Rate of Unemployment for the OECD Countries’, OECD Economic Studies 33, pp.171-216.
Tyrväinen, T. (1995) ‘Wage Determination in the Long-Run, Real Wage Resistance andUnemployment’, Bank of Finland Discussion Paper 12/95.
Van Reenan, J. (2001) ‘No More Skivvy Schemes? Active Labour Market Policies and the BritishNew Deal for the Young Unemployed in Context’, <www.nber.org>, (May).
Viñals, J. and Jimeno, J.F. (1996) ‘Monetary Union and European Unemployment’ Centre forEconomic Policy Research Discussion Paper No. 1485.
Viñals, J. and Jimeno, J.F. (1998) ‘The Impact of EMU on European Unemployment’,Oesterreichische Nationalbank Working Paper No. 34.
Walby, S. and Olsen, W. (2002) ‘The Impact of Women’s Position in the Labour Market on Payand Implications for UK Productivity’, Report to Women and Equality Unit, (November).
White, M. and Lakey, J. (1992) ‘The Restart Effect: Does Active Labour Market Policy ReduceUnemployment?’, Policy Studies Institute Report No. 739.
92

A AN N E X A : RE A L WA G E F L E X I B I L I T Y
93
A1 This annex gives more detail on the new estimate of real wage flexibility presented inSection 2.
A2 The estimates of real wage flexibility are derived from a simplified version of the wageequation in the Treasury model – a forecasting model of the UK economy. The wage equationis estimated as:
[1]
where PSAVEI is the private sector average earnings index, ILOUR is the ILO unemploymentrate, PROD is whole economy productivity, PGVA is the GDP deflator, TE is the employers’ taxrate and PRXMIP is the retail prices index excluding mortgage interest payments. The modelassumes static and dynamic homogeneity in prices and static homogeneity in productivity.The equation has the static long-run solution (for the level of real wages) of:
Ln(PSAVEI/ PGVA) = ∂1 – ∂2Ln(ILOUR) + Ln(PROD) – Ln(TE) [2]
A3 ∂2 is the long-run elasticity of real wages with respect to unemployment and thereforecan be viewed as a measure of ‘real wage flexibility’. If real wage flexibility has increased, theabsolute value of ∂2 should have got larger; in this equation more negative.
A4 Denoting ∂2t as the value of ∂2 over the sample period there are two ways to obtainestimates of this series using recursive least squares. The first of these is to estimate it directlyby running recursive estimates of equation [2]. However, simply estimating the long-runsolution of the model risks losing valuable information by omitting variables that are known,through equation [1], to have important short-run effects and in turn might bias theestimated long-run coefficients. An alternative approach, which uses all the informationavailable, is to derive estimates of ∂2 from recursive estimates of the structuralunemployment and error correction parameters in equation [1] since:
∂2t = �6t / �5t [3]
A5 This is the approach taken in the new work and is the parameter plotted in Chart 2.3.
[ ]
dummies
)ILOUR(gLn))PGVA*PROD/()TE*PSAVEI((Lng
)PGVA/PRXMIP(Ln)g1(
)PROD(Ln)g1(
)ILOUR(Ln)g1()PGVA(Ln)g1(g)TE1)(PSAVEI(Ln)g1(
65
4
3
2
3
0i
i
i1
+
+++
++
-+-+=+- ∑=
αααα
αβα
—
—

94
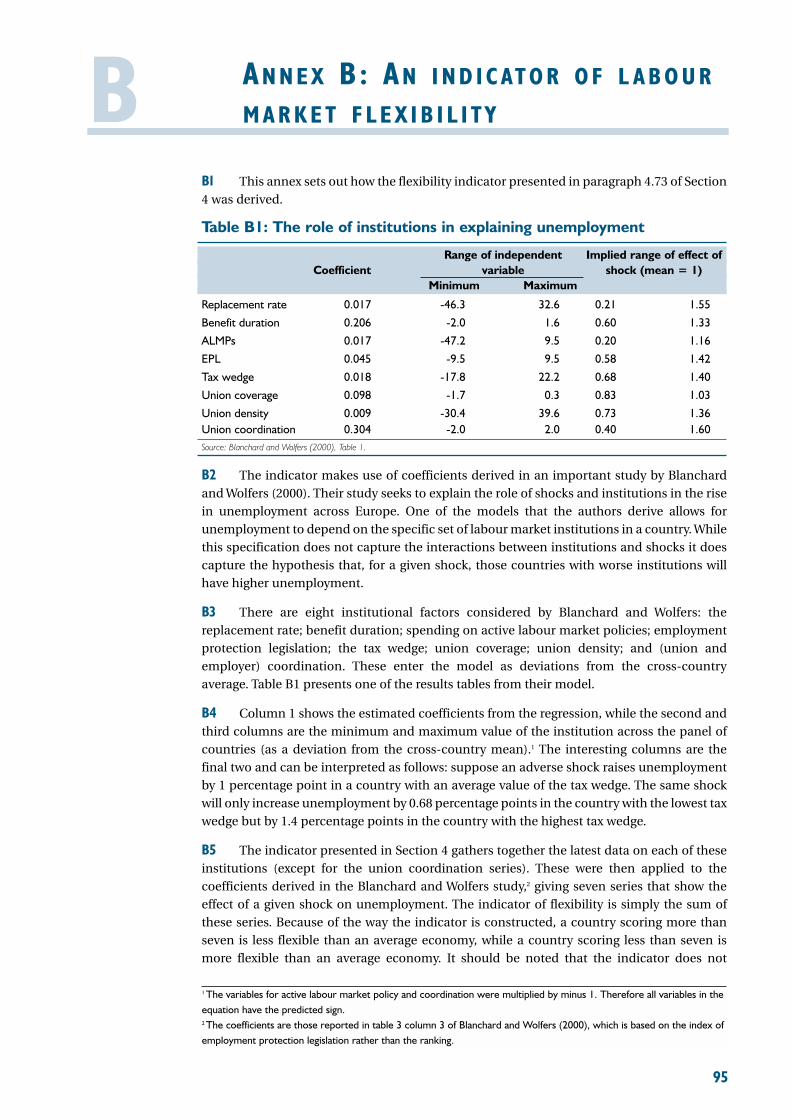
B AN N E X B: AN I N D I C AT O R O F L A B O U R
M A R K E T F L E X I B I L I T Y
95
B1 This annex sets out how the flexibility indicator presented in paragraph 4.73 of Section4 was derived.
Table B1: The role of institutions in explaining unemployment
Range of independent Implied range of effect ofCoefficient variable shock (mean = 1)
Minimum Maximum
Replacement rate 0.017 -46.3 32.6 0.21 1.55
Benefit duration 0.206 -2.0 1.6 0.60 1.33
ALMPs 0.017 -47.2 9.5 0.20 1.16
EPL 0.045 -9.5 9.5 0.58 1.42
Tax wedge 0.018 -17.8 22.2 0.68 1.40
Union coverage 0.098 -1.7 0.3 0.83 1.03
Union density 0.009 -30.4 39.6 0.73 1.36Union coordination 0.304 -2.0 2.0 0.40 1.60Source: Blanchard and Wolfers (2000), Table 1.
B2 The indicator makes use of coefficients derived in an important study by Blanchardand Wolfers (2000). Their study seeks to explain the role of shocks and institutions in the risein unemployment across Europe. One of the models that the authors derive allows forunemployment to depend on the specific set of labour market institutions in a country. Whilethis specification does not capture the interactions between institutions and shocks it doescapture the hypothesis that, for a given shock, those countries with worse institutions willhave higher unemployment.
B3 There are eight institutional factors considered by Blanchard and Wolfers: thereplacement rate; benefit duration; spending on active labour market policies; employmentprotection legislation; the tax wedge; union coverage; union density; and (union andemployer) coordination. These enter the model as deviations from the cross-countryaverage. Table B1 presents one of the results tables from their model.
B4 Column 1 shows the estimated coefficients from the regression, while the second andthird columns are the minimum and maximum value of the institution across the panel ofcountries (as a deviation from the cross-country mean).1 The interesting columns are thefinal two and can be interpreted as follows: suppose an adverse shock raises unemploymentby 1 percentage point in a country with an average value of the tax wedge. The same shockwill only increase unemployment by 0.68 percentage points in the country with the lowest taxwedge but by 1.4 percentage points in the country with the highest tax wedge.
B5 The indicator presented in Section 4 gathers together the latest data on each of theseinstitutions (except for the union coordination series). These were then applied to thecoefficients derived in the Blanchard and Wolfers study,2 giving seven series that show theeffect of a given shock on unemployment. The indicator of flexibility is simply the sum ofthese series. Because of the way the indicator is constructed, a country scoring more thanseven is less flexible than an average economy, while a country scoring less than seven ismore flexible than an average economy. It should be noted that the indicator does not
1 The variables for active labour market policy and coordination were multiplied by minus 1. Therefore all variables in theequation have the predicted sign. 2 The coefficients are those reported in table 3 column 3 of Blanchard and Wolfers (2000), which is based on the index ofemployment protection legislation rather than the ranking.

AN N E X B: AN I N D I C AT O R O F L A B O U R M A R K E T F L E X I B L I T Y
attempt to model interaction effects, of the institutions, i.e. their overall impact can be greateror less than the sum of their parts.
B6 As Chart 4.12 in Section 4 shows, the UK ranks second out of the countries consideredin terms of its degree of flexibility. The rankings are broadly in line with those presented in arecent study by Dicks and Papadavid (2002) – the correlation between the country rankings inthe two studies is 0.81. The labour market flexibility indicator derived by Fabiani andRodriguez-Palenzuela (2001) also shows a sizeable gap between labour market flexibility inthe US and continental European countries, with the UK in between.
96
B