empowerment of farmers through farmer field school …€¦ · farmer field school in andhra...
TRANSCRIPT

EMPOWERMENT OF FARMERS THROUGH FARMER FIELD SCHOOL IN ANDHRA PRADESH
BY
MIDDHE SREENIVASULU
M.Sc. (Ag.)
DOCTOR OF PHILOSOPHY
IN THE FACULTY OF AGRICULTURE
EXTENSION EDUCATION INSTITUTE COLLEGE OF AGRICULTURE, RAJENDRANAGAR
ACHARYA N.G. RANGA AGRICULTURAL UNIVERSITY RAJENDRANAGAR, HYDERABAD-500030
MARCH, 2011

EMPOWERMENT OF FARMERS THROUGH FARMER
FIELD SCHOOL IN ANDHRA PRADESH
By
MIDDHE SREENIVASULU
M.Sc. (Ag.)
THESIS SUBMITTED TO THE
ACHARYA N.G.RANGA AGRICULTURAL UNIVERSITY
IN PARTIAL FULFILMENT OF THE REQUIREMENTS
FOR THE AWARD OF THE DEGREE OF
DOCTOR OF PHILOSOPHY
IN THE FACULTY OF AGRICULTURE
(EXTENSION EDUCATION)
EXTENSION EDUCATION INSTITUTE COLLEGE OF AGRICULTURE, RAJENDRANAGAR
ACHARYA N.G. RANGA AGRICULTURAL UNIVERSITY RAJENDRANAGAR, HYDERABAD-500030
MARCH, 2011

CERTIFICATE
This is to certify that Middhe Sreenivasulu, has satisfactorily prosecuted
the course of research and that the thesis entitled “EMPOWERMENT OF
FARMERS THROUGH FARMER FIELD SCHOOL IN ANDHRA
PRADESH” submitted is the result of original research work and is of
sufficiently high standard to warrant its presentation to the examination. I also
certify that the thesis or part of the thesis has not been previously submitted by
him for a degree of any university
Date: (Dr R.RATNAKAR) (Chairman of the Advisory committee)

CERTIFICATE
This is to certify that the thesis entitled “EMPOWERMENT OF FARMERS THROUGH FARMER FIELD SCHOOL IN ANDHRA PRADESH” submitted in partial fulfillment of the requirements for the award of degree of DOCTOR OF PHILOSOPHY IN AGRICULTURE in the major field of Extension Education of the Acharya N. G. Ranga Agricultural University, is a record of the bonafide research work carried out by MIDDHE.SREENIVASULU under my guidance and supervision. The subject of the thesis has been approved by the student’s Advisory committee.
No part of the thesis has been submitted by the student for any other degree or diploma. The published part has been fully acknowledged. All the assistance and help received during the course of the investigation have been duly acknowledged by the author of the thesis.
(Dr R.RATNAKAR)
Chairman of the Advisory committee
Thesis approved by the Student Advisory Committee
Chairman (Dr R.RATNAKAR) ___________________ Director Extension Education Institute Rajendranagar, Hyderabad
Member (Dr. V.SUDHA RANI) ___________________
Associate Professor Extension Education Department
College of agriculture Rajendranagar, Hyderabad
Member (Dr M.GANAESH) ___________________ Dean of Students Affairs) ANGRAU, Rajendranagar, Hyderabad Member (Dr. B.S. KULAKARNI) ___________________ Professor & Head Dept. of Statistics & Mathematics
College of agriculture Rajendranagar, Hyderabad.
DECLARATION
I, MIDDHE SREENIVASULU, hereby declare that the thesis entitled
“EMPOWERMENT OF FARMERS THROUGH FARMER FIELD SCHOOL IN
ANDHRA PRADESH” submitted to the Acharya N G Ranga Agricultural University
for the degree of ‘DOCTOR OF PHILOSOPHY IN AGRICULTURE IN THE
MAJOR FIELD OF EXTENSION EDUCATION’ is the result of original research
work done by me. I also declare that any material contained in the thesis has not been
published earlier.
Date: (M.SREENIVASULU)
Place :

LIST OF CONTENTS
Chapter Title Page.No
I Introduction
II Review of literature
III Materials and methods
IV Results and Discussion
V Summary and Conclusions
Literature cited
Appendices

LIST OF TABLES Table No. Title Page
No.
3.1 District wise ICDP Cotton FFS programmes conducted during 2006-2007
3.2 Variables and their empirical measurement
4.1 Distribution of FFS and Non FFS farmers based on their age
4.2 Distribution of respondents according to their education
4.3 Distribution of respondents according to their experience (In farming)
4.4 Distribution of respondents according to their farm size
4.5 Distribution of respondents according to their mass media exposure
4.6 Distribution of FFS and Non FFS farmers based on their extension contact
4.7 Distribution of FFS and Non FFS farmers based on their group orientation
4.8 Distribution of FFS and Non FFS farmers based on their market intelligence
4.9 Distribution of FFS and Non FFS farmers based on their risk orientation
4.10 Distribution of FFS and Non FFS farmers based on their innovativeness
4.11 Distribution of FFS and Non FFS farmers based on their management orientation
4.12 Distribution of FFS and Non FFS farmers based on their Attitude towards FFS
4.134 Difference in the attitude of FFS and Non FFS farmers towards FFS programme [District wise]
4.14 Distribution of FFS and Non FFS farmers based on their Knowledge on ICM Cotton
4.15 Response analysis of knowledge items
4.16 Difference in the Knowledge of FFS and Non FFS farmers on ICM Cotton [District wise]

Table No. Title Page
No.
4.17 Distribution of FFS and Non FFS farmers based on their Skills learnt on ICM Cotton practices
4.18 Response analysis of Skills learnt
4.19 Difference in the Skill scores of FFS and Non FFS farmers in FFS on ICM Cotton [District wise]
4.20 Distribution of FFS and Non FFS farmers based on their Adoption of ICM Cotton practices
4.21 Response analysis of Extent of adoption
4.22 Difference in the extent adoption scores of FFS and Non FFS farmers on ICM Cotton [District wise]
4.23 Distribution of FFS and Non FFS farmers based on their Agro Ecosystem Management of ICM Cotton practices
4.24 Response analysis of Agro ecosystem management
4.25 Difference in the AEM scores of FFS and Non FFS farmers in FFS on ICM Cotton [District wise]
4.26 Distribution of FFS and Non FFS farmers based on their Decision making ability ICM Cotton practices
4.27 Response analysis of Decision making ability
4.28 Difference in the Decision scores of FFS and Non FFS farmers in FFS on ICM Cotton [District wise]
4.29 Correlation co-efficient between the Attitude and independent variables of FFS and non FFS farmers towards Cotton ICM practices
4.30 Regression co-efficient of selected independent variables with Attitude on Cotton ICM practices (Warangal)
4.31 Regression co-efficient of selected independent variables with Attitude on Cotton ICM practices (Kadapa)
4.32 Regression co-efficient of selected independent variables with Attitude on Cotton ICM practices (Guntur)
4.33 Correlation co-efficient between the knowledge level of Cotton ICM practices and independent variables of FFS and non FFS farmers
4.34 Regression co-efficient of selected independent variables with

Table No. Title Page
No.
Knowledge on Cotton ICM practices (Warangal)
4.35 Regression co-efficient of selected independent variables with Knowledge on Cotton ICM practices (Kadapa)
4.36 Regression co-efficient of selected independent variables with Knowledge on Cotton ICM practices (Guntur)
4.37 Correlation coefficients between the independent variables and skill of FFS and non FFS farmers on ICM Cotton
4.38 Regression co-efficient of selected independent variables with Skill on Cotton ICM practice (Warangal)
4.39 Regression co-efficient of selected independent variables with Skill on Cotton ICM practice (Kadapa)
4.40 Regression co-efficient of selected independent variables with Skill on Cotton ICM practice (Guntur)
4.41 Correlation coefficients between the independent variables and Adoption of FFS and non FFS farmers on ICM Cotton
4.42 Regression co-efficient of selected independent variables with Adoption on Cotton ICM practices (Warangal)
4.43 Regression co-efficient of selected independent variables with Adoption on Cotton ICM practices (Kadapa)
4.44 Regression co-efficient of selected independent variables with Adoption on Cotton ICM practices (Guntur)
4.45 Correlation coefficients between the independent variables and AEM of FFS and non FFS farmers on ICM Cotton
4.46 Regression co-efficient of selected independent variables with AEM on Cotton ICM practices (Warangal)
4.47 Regression co-efficient of selected independent variables with AEM on Cotton ICM practices (Kadapa)
4.48 Regression co-efficient of selected independent variables with AEM on Cotton ICM practices (Guntur)
4.49 Correlation coefficients between the independent variables and Decision of FFS and non FFS farmers on ICM Cotton
4.50 Regression co-efficient of selected independent variables with Decision on Cotton ICM practices (Warangal)

Table No. Title Page
No.
4.51 Regression co-efficient of selected independent variables with Decision on Cotton ICM practices (Kadapa)
4.52 Regression co-efficient of selected independent variables with Decision on Cotton ICM practices (Guntur)
4.53 Constraints expressed by FFS Farmers
4.54 Suggestions given by farmers
4.55 Constraints faced by officials
4.56 Suggestions given by officials

LIST OF ILLUSTRATIONS
Fig. No. Title Page
No.
1 Conceptual model of the study
2. Distribution of FFS and Non FFS farmers based on their Attitude towards FFS
3 Distribution of FFS and Non FFS farmers based on their Knowledge on ICM Cotton practices
4 Distribution of FFS and Non FFS farmers based on their Skills learnt on ICM Cotton practices
5 Distribution of FFS and Non FFS farmers based on their Adoption of ICM Cotton practices
6 Distribution of FFS and Non FFS farmers based on their Agro-Ecosystem Management of ICM Cotton practices
7 Distribution of FFS and Non FFS farmers based on their Decision making ability ICM Cotton practices
8 Strategies to successful implementation of FFS and empowerment of farmers
9 Empirical model of the study

LIST OF APPENDICES Appendix
No. Title Page No.
I Interview Schedule
II Development of Scale on attitude of farmers towards FFS
III Knowledge of farmers on Cotton ICM Technologies
ACKNOWLEDGEMENTS I earnestly revere the Lord Almighty for his boundless blessings which accompanied me in all endeavours. I take it as an extreme privilege to express my heartfelt thanks and sincere gratitude to my Major Advisor and Chairman of Advisory Committee, Prof. R. Ratnakar Director ,Extension Education Institute ,Rajendranagar, Hyderabad for his noble hearted help, guidance, cooperation and encouragement which have inculcated in me the spirit of confidence to successfully complete this research work. Without his personal involvement at every stage, it would have never been possible to see this work in the present shape. I deem it my privilege in expressing my deep sense of gratitude and respect to Dr.V.Sudha Rani, Associate Professor, Extension Education Department College of Agriculture, R,nagar and member of my Advisory Committee for her learned counsel, scholarly guidance, constant encouragement and constructive suggestions in the planning and execution of the research work. My sincere and heartfelt thanks to her for determined guidance and evincive criticism in the preparation and presentation of the study. I with to extend my genuine thanks to Dr.M.Ganesh Dean of Student’s Affair ANGRAU Hyderabad, and member of my Advisory Committee for sparing his precious time in giving me valuable guidance and timely suggestions during the preparation of the dissertation. I am thankful to Dr. B.S.Kulakarni, Professor and University Head, Department of Statistics and Mathematics, College of Agriculture, Rajendranagar for his learned guidance and valuable suggestions during the course of my study. I sincerely extend my gratitude to all the staff of Extension Education Institute Rajendranagar for their kind cooperation and valuable suggestions throughout the course of my work. I always remember the help of staff of Department of Agriculture of Mahabubnagar, Warangal, Guntur and Kadapa districts for their help during the research work .I would like to express my sincere thanks to my friend DDA FTC MBNR and colleagues of DAATTC Mahabubnagar for their help rendered during the course of my research work. I would like to express my earnest thanks to my father Sri. M.Narsimhulu , mother Smt. Ramakistamma , farther in-law Sri.S.Bhima Raju , Mother in-law Smt Mangayamma for their blessings . Last but the not the least I am indebted my wife Smt. Lakshmi Rajyam and daughters Richy , Chintu for their moral backing during the course of my research work . Date: March, 2011 (M.SREENIVASULU)

ABBREVATIONS
AP : Andhra Pradesh
A.O : Agricultural Officer
AEO : Agricultural Extension Officer
ADA : Assistant Director Of Agriculture
FFS : Farmer Field School
ICM : Integrated Crop Management
IPM : Integrated Pest Management
FAO : Food and Agriculture Organisation
AEM : Agro Ecosystem Management
ITK : Indigenous Technical Knowledge
GO : Government organization
ICT : Information and communication technology
NSKE : Neem Seed Kernal Extract
n : Sample number
N : Total Sample Size
NGO : Non-Government Organisations

Name of the Author : SREENIVASULU. M
Title of the thesis : EMPOWERMENT OF FARMERS THROUGH FARMER FIELD SCHOOL IN ANDHRA PRADESH Degree for which submitted : DOCTOR OF PHILOSOPHY
Faculty : AGRICULTURE
Major field of study : EXTENSION EDUCATION
Major advisor : Prof. R.RATNAKAR Director, EEI, Rajendranagar University : ACHARYA N G RANGA AGRICULTURAL UNIVERSITY Year of submission : 2011
ABSTRACT
The agriculture services in the country now in the process of reorientation of their development strategies towards supporting farmer empowerment. One method of empowering farmers and their capacity building is through Farmers Field School [FFS]. FFS is a participatory approach to adult education adopted by Indian government since 1990 towards the achievement of ecologically sound , profitable and socially sustainable small scale farming. Participatory extension approaches such as farmer to farmer extension and FFS encourage farmers to utilize their resources, own knowledge, skills while integrating new expertise, enhance farmers position as manager of their own land and resources.FFS empowered to build up their self- confidence and self- reliance. This implies the need to decentralize expertise to the field level by educating local people to analyze field situations and to make appropriate management decisions. Thus, the Field School was a school without walls that taught basic agro-ecology and management skills.From 2004 onwards,the state governments modified the existing extension approach from demonstration to FFS so as to enable farmers to evaluate technologies by themselves and have taken steps to institutionalize the IPM-FFS model for cotton and other crops in their main stream extension.
The study entitled “ Empowerment of Farmers Through Farmer Field School in A.P ” was mainly intended to find out the empowerment in terms of Attitude, Knowledge, Skills, Adoption, Agro ecosystem management and Decision making ability of cotton integrated crop management practices by farmers after FFS programme. An attempt is also made to study the agro ecosystem management and utilization of ITKs farmers while practicing cotton FFS. The findings of the study

would help for further refinement of FFS programme for reaching more noumber of farmers with adoptable low cost technologies in Cotton.
An ex-post-facto research design was adopted for the study.180 FFS farmers (30 from one FFS) and 18 Extension officers (6 from each district) selected purposively and 180 Non FFS farmers (30 from each village) were selected randomly for the study. Thus, a total of 360 farmers (180 FFS farmers and 180 Non FFS farmers) and 18 Extension officers from three districts of A.P formed the sample of the study.A pre-tested interview schedule with measurement devices of all variables was used for collection of raw data. The data thus collected was coded and analysed with the help of appropriate statistical tests.
Majority of FFS farmers belonged to middle aged, high school education, had 3-13 years of experience in farming, small farmers, medium level of mass media exposure, medium extension contact, medium group orientation, medium market intelligence, medium level of risk orientation, medium innovativeness and medium level of management orientation. In case of Non FFS farmers, majority belonged to middle age ,primary school education , had 3-13 years of experience in farming, small farmers , medium level of mass media exposure, medium extension contact, medium group orientation, medium market intelligence, medium level of risk orientation, medium innovativeness and medium level of management orientation.
Majority of the FFS respondents were having favourable attitude and opined that FFS is an innovative school of learning for farmers at field level and promote eco-friendly technologies. Majority of respondents had medium knowledge about Cotton ICM practices and they could diagnose nutritional deficiencies and sucking pest damage. Majority of respondents belonged to medium skills learnt category, Adoption, ,Agro ecosystem management and Decision making ability towards Cotton ICM practices. Further the Z-test results confirmed that the FFS farmers had significant improvement in Cotton ICM aspects over Non FFS farmers.
Correlation analysis revealed that Education, Mass media exposure, Market intelligence, Risk orientation, Innovativeness and management orientation were positively significant whereas Age and Experience in farming were found be negatively significant with Attitude level of FFS farmers on Cotton ICM practices.All the 11 independent variables put together explained for about 76.66 percent variation in the attitude of FFS farmers and 48.33 percent in Non FFS farmers about Cotton FFS programme. In case of Knowledge of FFS farmers, Education, Mass media exposure and Innovativeness were positively significant whereas Age and Experience in farming were found be negatively significant with Knowledge level of FFS farmers on Cotton ICM practices. Whereas in Non FFS farmers all the variables were non- significant. All the 11 independent variables put together explained for about 80.00 percent variation in the Knowledge of FFS farmers and 44.33 percent in Non FFS farmers about Cotton FFS programme.
Education, Mass media exposure and Innovativeness were significant with Skill of FFS farmers on Cotton ICM practices, whereas all the variables were found to be non -significant with skills of non FFS farmers. All the 11 independent variables put together explained for about 77.00 percent variation in the Skill of FFS farmers and 42.00 percent in Non FFS farmers about Cotton FFS programme

Education, Mass media exposure and Innovativeness were positively significant whereas Age and Experience in farming were found be negatively significant with Knowledge level of FFS farmers on Cotton ICM practices. Whereas incase of non FFS farmers age, education and experience were found to be positively significant relationship with Adoption of Cotton ICM practices. All the 11 independent variables put together explained for about 74.00 percent variation in the Adoption of FFS farmers and 46.66 percent in Non FFS farmers about Cotton FFS programme
Education, Mass media exposure and Innovativeness were positively significant whereas Age and Experience in farming were found be negatively significant with agro ecosystem management of FFS farmers on Cotton ICM practices. Whereas in case of non FFS farmers all the variables were found to be non- significant relationship with agro ecosystem management of Cotton ICM practices. All the 11 independent variables put together explained for about 55.33 percent variation in the Agro ecosystem management of FFS farmers and 37.33 percent in Non FFS farmers about Cotton FFS programme.
Relationship between selected profile characteristics of the FFS and Non FFS farmers and their Decision towards Cotton FFS shows that Education, Innovativeness were positively significant whereas Age and Experience in farming were found be negatively significant with decision of FFS farmers on Cotton ICM practices. Whereas incase of non FFS farmers, Education and management orientation were found to be positively significant relationship with decision of Cotton ICM practices. All the 11 independent variables put together explained for about 70.33 percent variation in the decision of FFS farmers and 43.00 percent in Non FFS farmers about Cotton FFS programme.
Except Neem based products no other ITKS were used in FFS programme. But in case of non FFS farmers ,ITKs like Putting light in Pot acts as light trap in Cotton crop, Apply Inguva 30g/plant and then irrigate to reduce wilt incidence, Puttamannu 50g+ Cow urine 50ml+Cow dung 50g used for treatment [acts as anti- biotic and improves germination percentage]
Finally a hypothetical strategy was developed for successful implementation of FFS programme based on farmers and officials suggestions and results derived from the study. Based on the above findings, several implications for future research were drawn. The suggestions offered through the study, if followed, there would be a great benefit to farming community through FFS programme.

CHAPTER 1
INTRODUCTION
Empower farmers with Knowledge and Skill to make India hunger free Dr. M.S.Swaminathan
Agriculture provides livelihood for majority of population in India. However, its
intensification has reduced the economic capacity and sustainability of small farming
system by inducing a significant increase in the inputs use in production. It is high time
for paradigm shift in the agriculture extension approaches .The agriculture services in
the country is in the process of reorientation of their development strategies towards
supporting farmer empowerment. One method of empowering farmers and their
capacity building is through Farmers Field School [FFS]. FFS is a participatory
approach to adult education adopted by Indian government since 1990 towards the
achievement of ecologically sound, profitable and socially sustainable small scale
farming. FFF is based on the assumption that farming communities have a vast body of
knowledge, skills and experience on which they can build their future. Participatory
extension approaches such as farmer to farmer extension and FFS encourage farmers to
utilize their resources, own knowledge, skills while integrating new expertise, enhance
farmers position as manager of their own land and resources. FFS empowered to build
up their self confidence and self reliance.
HISTORY OF FFS
WORLD
The term “Farmer Field Schools” came from the Indonesian expression Sekolah
Lapangan meaning just field school. The first Field Schools were established in 1989 in
Central Java during a pilot season by 50 plant protection officers to test and develop

field training methods as part of their IPM training of trainer’s course. Two hundred
Field Schools were established in that season with 5000 farmers participating. The
following season in 1990 an additional 45,000 farmers joined Field Schools run by 450
crop protection officers. This work was undertaken by the FAO assisted Indonesian
National IPM Programme.
The Farmer Field School (FFS) has one of the most impressive track records in
participatory community approaches with 2–3 million farmers graduated on the
agricultural subject of Integrated Pest Management (IPM) during the past 15 years,
mainly in Asia, but more recently in Africa, the Middle East and Latin America also. A
review of 25 impact studies indicated a range of positive outcomes of IPM Farmer Field
Schools such as drastic reductions in agro-pesticide use, economic benefits and
empowerment effects. The FFS approach evolved from the need to strengthen the
ecological basis of Integrated Pest Management (IPM) to deal with the variability and
complexity of agro-ecosystems though reducing reliance on pesticides. The ecology of
opportunist insects (which include mosquitoes) is highly localized and dynamic, with
populations fluctuating many fold both spatially and temporally. Accordingly, most
tropical smallholder agro-ecosystems require management decisions that are tailored to
local and contemporary conditions. This implies the need to decentralize expertise to the
field level by educating local people to analyze field situations and to make appropriate
management decisions. Thus, the Field School was a school without walls that taught
basic agro-ecology and management skills.
INDIA
In India the FAO Inter country programme for rice started in 1994 followed by
the FAO_EU IPM Programme for Cotton in Asia between 2000-2004 and since then

more than 8700 FFS were conducted in 28 states of India. From 2004 onwards, the state
governments modified the existing extension approach from demonstration to FFS so as
to enable farmers to evaluate technologies by themselves. In India realizing the
effectiveness of FFS and economic and social benefits to resource poor farmers, the
states of A.P, Karnataka and Maharastra have taken steps to institutionalize the
IPM_FFS model for cotton and other crops in their main stream extension.
Andhra Pradesh
Agriculture education has moved from farmer training centres to villages by
establishing a state wide net work of Polam badis [Farm Schools]. Polam badi offers
practical demos and training on field for 14 weeks. The Department of Agriculture,
Government of A.P has taken up promotion of FFS in large scale since Rabi-2004 to
reduce cost of cultivation, increase the productivity, and reduce pesticide usage by
adopting eco friendly alternatives to pesticides and also creating awareness among
farmers about the pesticides hazards. It also ensures empowering the farmers to take up
economical decisions in adopting practices of integrated crop management [ICM]. In
A.P about 20,000 FFS s were conducted from 2001 to 2007 [Kharif] on Maize, Rice,
Cotton, Oilseed crops.
Description of Farmer Field School [FFS]
Farmer field school consists of group of people with a common interest, who get
together on a regular basis to study the “how and why” of a particular topic. The topic
covered can vary considerably from ICM [INM+ IPM], Organic agriculture, Farm
mechanization, Soil husbandry, Income generating activities such as bio-agents
production. The vow of FFS would be to produce a healthy crop in a eco friendly
approach duly considering the fundamentals of eco-system. FFS are comparable to

programmes such as study circles, religious studies at church, mosque or temple or
specialized study programmes for any skill.
The basic principles of Farmer field school are
1. Grow healthy crop
2. Conserve natural enemies
3. Observe crops regularly
4. Farmers become experts through participation in FFS.
Why farmer field school ?
In developing countries, pesticides are often used under conditions which
generate the hazards to health and environment .The success of green revolution in the
prosperity of big farmers where natural resources are available in plenty i.e fertile soils,
water, human resources. Advent to the green revolution farmers depend on high cost
input based agriculture resulting in
Increased cost of cultivation
Less returns on their investment
Poisonous chemical pesticide residues in the food stuff
Human health hazards and
Polluted environment
In the above scenario, it is felt that the farmers have to be educated on viable
technology through a sustainable means.
How FFS is conducted?
FFS are conducted on the following basic concepts
1. Adult /Non formal education : The field schools are oriented to provide basic agro
ecological knowledge and skills in a participatory manner so that farmers experience
is integrated in the programme. The FFS offers the opportunities to farmers to learn

by sharing, by being involved in experimentation, discussion and decision making.
This strengthens the sense of ownership of rural communities in technological
package and evolving new knowledge on skills.
2. Technology strong facilitator: The field school is usually conducted by an
extension officer / farmer. But in all cases, the facilitator must have skills at growing
the crop concerned.
3. Based on crop phenology and time limited : The field school and season long
training for trainers are based on the crops phenology. Seedling issues are studied
during the seedling stage , fertilizers issues are discussed during high nutrient
demand stages and so on. This method allows to use the crop as a teacher, and to
ensure that farmers can immediately use and practice what is being learned.
4. Group study: Most field schools are organized for groups of about 25-30 persons
with common interests can support each other, both with their individual experience
and strength and to create a “critical mass”. As individuals, trying something new is
often socially inappropriate (e.g. reducing sprays, cover crops), but with group
support, trying something new becomes acceptable. The total participants are sub
divided into groups of five persons so as to facilitate all members can better
participate in field observations, analysis, discussions and take precautions.
5. Field school site: The field schools are always held in the community where
farmers live so that they can easily attend weekly and maintain the field school
studies. The extension officer [Facilitator] travels to the site on the day of field
school. Total size of polambadi learning field is 2 acres, out of which ½ ac is for
ICM ,1 acre is for field validation trials and ½ acre is for farmers practice.

Base line survey: The base line survey conducted to identify production gaps in
polambadi village covering 10 farmers of poalambadi and non polambadi at random.
Polambadi curriculum: Based on base line survey 14 week curriculum is developed
for carrying out polambadi activities. The duration of each polambadi session will be 4-
5 hours [i.e 8 AM to 1-15 PM].
Polambadi day: The schedule day of polambadi for each village is finalized by the
Facilitator [ADA.A.O, AEO and Farmer facilitator] in consultation with farmers of
polambadi [Avoid market day].
Orientation training: Pre seasonal orientation training is conducted in each season at
state /district/ mandal level.
Technical upgradation: Under technical upgradation, the farmers were trained in Seed
testing, Soil testing, Seed treatment methodology, Bio fertilizers, Vermicompost, Green
manuring, Zinc sulphate /Gypsum application. Precautions while purchasing agriculture
inputs by farmers, Preparation of NSKE and Farm machinery.
Field day: At the end of season, field day was organized before harvest or at the time of
harvest in which local community members and local policy makers are involved.
Test and validate: The Field School method proposes that no technology will
necessarily work in a new location, and therefore must be tested, validated, and adopted
locally. Thus, IPM methods are always tested in comparison with conventional
Training of Trainers (technically sound facilitator training)
Farmer Field Schools - basic field course - group organisation - research methods
Community Action - clubs, etc. - farmer to farmer study - farmer forums
Activity flow in IPM programmes

practices. The end result is that beneficial aspects of IPM are incorporated into existing
practices.
Hands-on learning activities: Besides season-long field studies, the Field School also
uses other hands on learning activities to focus on specific concepts. “Zoos” in which
insect life cycles can be observed more easily on potted plants. These methods also
provide ways for farmers to continue studying after the Field School. Farmers are able
to use the same methods to help other farmers to learn about IPM as well.
Evaluation and Certification: All Field Schools include field based pre- and post-tests
for the participants. Farmers with high attendance rates and who master the field skill
tests are awarded graduation certificates. For many farmers, the Field School is the first
time that they have graduated from any school or received a certificate in recognition of
their farming skills, a point of great pride to many families.
A process, not a goal: It must be remembered that Field Schools is a method to provide
farmers with a learning environment so that they can achieve the goal of reducing
inputs, and increasing yields and profits. In some programmes, the number of Field
Schools, or expansion of programmes becomes the overwhelming target and success
criteria, hence quality suffers and the initial goals are not met.
“Work self out of a job”: The facilitator in a Field School attempts to work him/herself
out of a job but building the capacity of the group. Indeed, many Fields Schools take
over the job of the extension facilitator by doing Farmer to Farmer training and other
local activities to strengthen other members of the community.
Follow-up: All Field Schools normally have at least one follow-up season, the intensity
of which will be determined by the motivation of the Field School participants, time
constraints of participants and facilitator, and to some extent - funding. Follow-up has

been known to be a little as monthly support sessions for farmers to discuss their own
problems in implementing IPM, to as much as farmers running a complete Field School
for other farmers. Often farmers agree to repeat the Field School process for one more
season to verify findings, or to repeat the process of the Field School on a new crop to
learn IPM for the next crop. Some groups begin to form associations, people’s
organisations, and clubs that are officially or un-officially organised and carry on
studying as a group. The facilitator usually becomes less central in the process if he/she
has done a good job, more often providing some technical backstopping and stimulation
for the group.
Local funding goal: Some of the Field School activities focus on future planning and
funding raising. There is an explicit goal for groups to become independent and seek
support from various agencies. Writing a proposal and receiving a funding grant from
government or NGO sources. In national agriculture policy it is desirable to have funds
available directly to farmer groups that request support for their local activities.
FFS AND FARMERS EMPOWERMENT
The empowerment term was originally used by FAO experts from 1995
onwards. The FFS is effective in promoting empowerment of farmers due to the
following reasons:
It addresses a felt need and quickly produces an obvious benefit
It demands critical thinking and develops problem solving skills
It promotes collective action among farmers
It provides an opportunity for experimentation and further innovation

FFS empowerment can be at three levels
Individual empowerment: Farmers who have participated in FFS carry out
careful observation and analysis to decide what practices to apply in their own fields
Group empowerment: FFS members collectively plan and conduct experiments
to learn about agro-ecology and test or adapt new practices
Community empowerment: The FFS group organizes activities that benefit
other members of the community, including farmer to farmer training.
1.1 NEED AND IMPORTANCE OF STUDY
Farmer Field School [FFS] go beyond a reduction in pesticide use and increase
in yield. The curriculum emphasizes the development of critical analytic and
communication skills. This has triggered further development of field experiments by
farmers, collective action, leadership, planning and organization. It is enviable and
worth to study the empowerment of farmers through FFS as it gives clear picture of
attitude of the farmers towards FFS programme, but also give proper direction and the
vision to trainers and policy makers.
This study was mainly intended to find out the empowerment in terms of
Knowledge, Skills, and Decision making ability, Adoption of cotton integrated crop
management practices by farmers after FFS programme. An attempt is made to study
the agro ecosystem management and utilization of ITKs farmers while practicing cotton
FFS. The findings of the study would help for further refinement of FFS programme for
reaching more number of farmers with adoptable low cost technologies in Cotton.
Keeping in view the importance of farmer to farmer extension as means of
empowerment the present study is designed to study the empowerment, of farmers
through Farmer Field school in Andhra Pradesh with the following objectives.
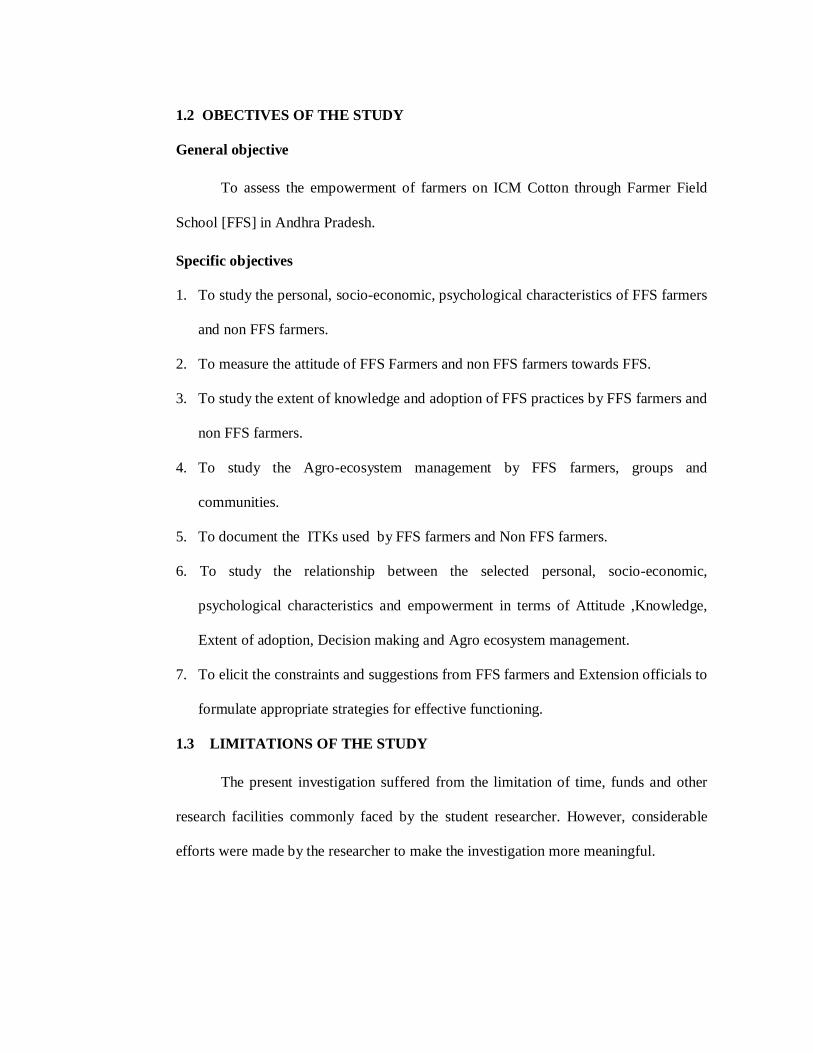
1.2 OBECTIVES OF THE STUDY
General objective
To assess the empowerment of farmers on ICM Cotton through Farmer Field
School [FFS] in Andhra Pradesh.
Specific objectives
1. To study the personal, socio-economic, psychological characteristics of FFS farmers
and non FFS farmers.
2. To measure the attitude of FFS Farmers and non FFS farmers towards FFS.
3. To study the extent of knowledge and adoption of FFS practices by FFS farmers and
non FFS farmers.
4. To study the Agro-ecosystem management by FFS farmers, groups and
communities.
5. To document the ITKs used by FFS farmers and Non FFS farmers.
6. To study the relationship between the selected personal, socio-economic,
psychological characteristics and empowerment in terms of Attitude ,Knowledge,
Extent of adoption, Decision making and Agro ecosystem management.
7. To elicit the constraints and suggestions from FFS farmers and Extension officials to
formulate appropriate strategies for effective functioning.
1.3 LIMITATIONS OF THE STUDY
The present investigation suffered from the limitation of time, funds and other
research facilities commonly faced by the student researcher. However, considerable
efforts were made by the researcher to make the investigation more meaningful.

1.4 LAYOUT OF THE THESIS
The thesis is presented in six chapters .It begins with introduction which include
history of FFS, need and importance, objectives, limitations of the study. The second
chapter deals with review of literature pertaining to variables of study. The third chapter
consists of methodology adopted for research. The results and discussion of study are
presented in the fourth chapter. Lastly the fifth chapter includes the summary of the
research study, implications of the findings and suggestions for future implementation.
Literature cited and appendices of the study presented at the end.

CHAPTER II
REVIEW OF LITERATURE
A comprehensive review of literature is an essential part of investigation, as it is
not only gives an idea on the work done in the past and helps in delineating of problem
area but also provides basis for interpretation and discussion of results.
The past studies pave the way for future research endeavors. An acquaintance
with earlier pertinent studies has been felt necessary to develop good understanding of
the present study. Therefore, an attempt was made in this chapter to review the literature
which has meaningful relation to the present study. The literature related to the variables
selected in the study which have meaningful relation to the various objectives of study
was reviewed and furnished under the following heads.
2.1 Selected profile characteristics of FFS and Non FFS farmers
2.2 Attitude of FFS and non FFS farmers
2.3 Knowledge of FFS and Non FFS farmers
2.4 Skill of FFS and non FFS Farmers
2.5 Extent of Adoption of FFS and non FFS farmers
2.6 Agro ecosystem management by FFS and non FFS farmers
2.7 Exploration of ITKS by FFS and Non FFS farmers
2.8 Decision making ability of FFS and Non FFS farmers
2.9 Relationship between profile characteristics and dependent variables.
2.10 Constraints and suggestions of FFS farmers and Extension officials
2.11 Conceptual model of the study and derivation of hypothesis
2.12 Definition and operationalization of the terms used in the study.

2.1 SELECTED PROFILE CHARACTERISTICS OF FFS AND NON FFS
FARMERS
2.1.1 Age
Ramakrishna (1999) indicated that a large number of (65.83 %) trainees were
under middle age group followed by young (19.17 %) and old age ( 15 .00 %) groups in
his study on the impact of TANWA.
Murthy (2000) identified that majority (55.83%) of beneficiaries of
Janmabhoomi programme were middle aged.
Madhavilatha (2002) reported that (36%) of FTC trained farmers belonged to
middle age followed by equal percentage (31.6%) of young and old age in case of
trained farmers. Among untrained farmers (43.33%) belonged to middle age followed
by old (30%) and young (26.67%) age farmers respectively.
Ravichandra Prasad (2002) reported that majority of the beneficiaries (60.71%)
were middle aged followed by young age (35.71%) and old age (3.58%) categories
respectively.
Obaiah (2004) revealed that more than half 52.14 per cent were middle aged
while per cent were young aged and 21.43 per cent were old aged in FFS.
Ravishanker (2005) concluded that majority of respondents were old with
respect to weather forecasting.
2.1.2 Education
Veerendranath (2000) revealed that majority of castor growers ( 30 per cent )
were illiterate, 18.89 per cent of them belonged to can read only category,17.22 per cent
of them had primary level of education, 16.11 per cent of them belonged to can read and

write category, 9.44 per cent were under middle school of education ,6.67 per cent were
under intermediate category and the rest 1.67 per cent belonged to graduates and post
graduates.
Madhavilatha (2002) reported that (35.0%) FTC trained farmers were educated
up to high school level followed by middle school (28.33%) college and above (25%)
and primary school (6.67%).
Ravichandra prasad (2002) reported that (35.12%) of beneficiaries were
educated up to primary level followed by middle school (16.07%), high school
(12.50%), functionally literate (12.5%),illiterate (12.5%) and college level (10.71%)
Sivasubramanyam (2003) indicated that majority of respondents (35.0%) had
primary school education followed by middle school (18.33%), higher secondary school
(15.00%), secondary school (12.5%), can read and write (10.00%) and can read only
(9.17%)
Obaiah (2004) indicated that among trained farmers , (37.86 %) had education
up to primary school level, followed by high school (20.17 %),middle school (17.14 %)
,illiterates (14.29 %), functionally literate (7.14 %) and college education (2.86%).
Comparatively one third (31.43 %) of the un trained farmers had education up to
primary school level followed by high school level (27.14 %), middle school education
(17.14 %), illiterate (14.29 %) ,functionally illiterate (8.57 %) and college education
(1.43 %).
Natarajan (2004) revealed that majority of FFS farmers belonged to middle
school (34.44%) followed by high school(28.89%), higher secondary school (18.89%)
,primary school(16.67%) and illiterate (1.11%), where as in case of Non FFS majority
were primary educated (30.00%) followed by functionally literate (26.67%), high
school (18.88%), middle school (17.785) and illiterate (5.56%)
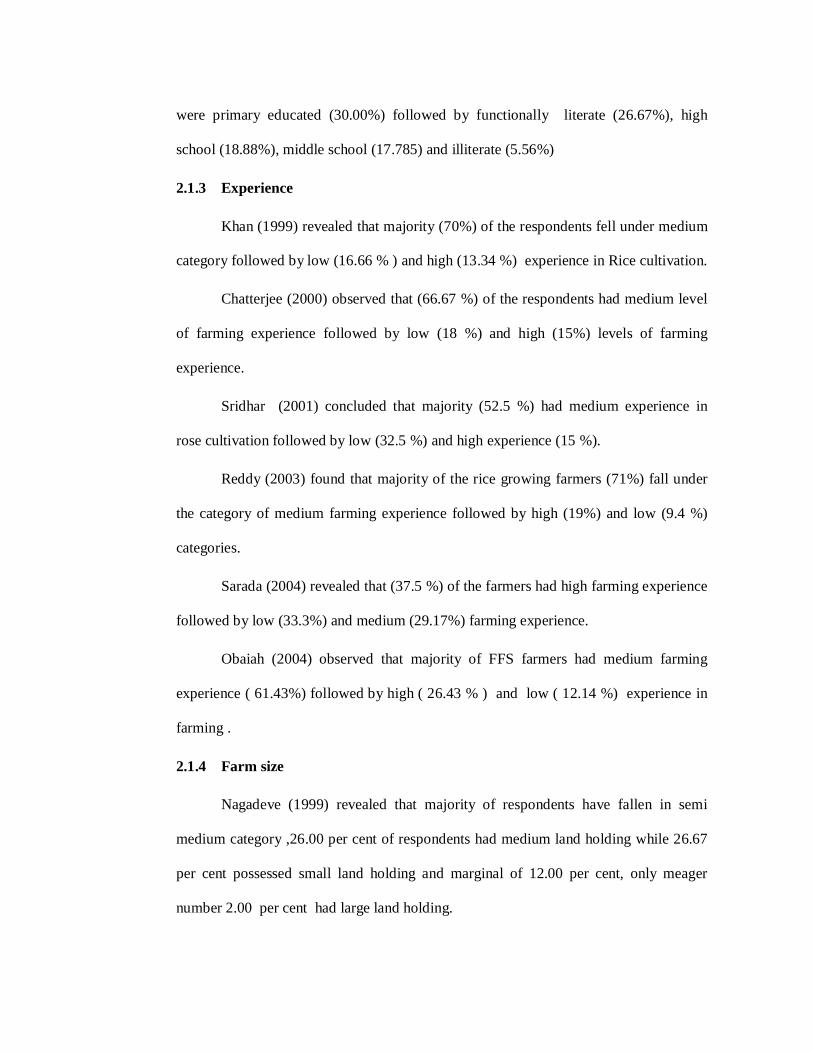
2.1.3 Experience
Khan (1999) revealed that majority (70%) of the respondents fell under medium
category followed by low (16.66 % ) and high (13.34 %) experience in Rice cultivation.
Chatterjee (2000) observed that (66.67 %) of the respondents had medium level
of farming experience followed by low (18 %) and high (15%) levels of farming
experience.
Sridhar (2001) concluded that majority (52.5 %) had medium experience in
rose cultivation followed by low (32.5 %) and high experience (15 %).
Reddy (2003) found that majority of the rice growing farmers (71%) fall under
the category of medium farming experience followed by high (19%) and low (9.4 %)
categories.
Sarada (2004) revealed that (37.5 %) of the farmers had high farming experience
followed by low (33.3%) and medium (29.17%) farming experience.
Obaiah (2004) observed that majority of FFS farmers had medium farming
experience ( 61.43%) followed by high ( 26.43 % ) and low ( 12.14 %) experience in
farming .
2.1.4 Farm size
Nagadeve (1999) revealed that majority of respondents have fallen in semi
medium category ,26.00 per cent of respondents had medium land holding while 26.67
per cent possessed small land holding and marginal of 12.00 per cent, only meager
number 2.00 per cent had large land holding.

Nadre (2000) stated that 50.00 per cent of respondents had land up to 4.0 ha
followed by 4.1 to 10.0 ha category with (32.7 % ) and (11.5 %) respondents were
found in the category of above 10.00 ha .
Baswarajaiah (2001) observed that 43.33 percent of respondents were small
farmers followed by with a little variation of marginal (30.0 %) and medium farmers
(25.83 %) ,while negligible percent (0.84%) of big farmers.
Gattu (2001) reported that half of (50.0%) of the respondents were found to be
medium farmers followed by small farmers (35.99%) and large farmers (15.0%).
Sivanandan (2002) stated that majority of the respondents (56.0%) were small
farmers followed by marginal (26.0%) and big (18 %) farmers.
Reddy (2003) revealed that majority of rice growers were in the medium
category (53.06%) followed by small (29.79%) and big farmers (17.14%)
Obaiah (2004) indicated that half 48.57 per cent of the trained farmers belongs
to medium land holding category and followed by 20.0 per cent with large holdings
,16.43 per cent small holdings and 15 .0 per cent had marginal holdings. Whereas 44.29
per cent untrained farmers had marginal land holdings followed by large, small and
medium land holdings with 21.43 per cent, 18.57 per cent and 15.71 per cent
respectively.
Natarajan (2004) revealed that majority of FFS farmers belonged to small
(63.33%) followed by big (21.11 %) and marginal (15.56%), where as in case of Non
FFS, majority were marginal (53.33%) followed by small (38.89%) and big (7.78%)

2.1.5 Mass media exposure
Chatterjee (2000) revealed that 51.67 per cent of the beneficiaries fell under
medium level of mass media exposure followed by low (28.83%) and high (20.00%)
level mass media exposure.
Veerendranath (2000) observed that majority of them (52.78%) had medium
mass media exposure and rest of them 25.00 per cent and 22.22 per cent had low and
high mass media exposure.
Gattu (2001) revealed that majority (75.83%) of the respondents had medium
mass media exposure followed by low (14.17%) and high (10.00%) mass media
exposure.
Madavilatha (2002) reported that 40.00 percent of respondents had high level of
mass media exposure followed by equal percentage of medium (30%) and low (30%)
levels incase of trained farmers , where as 38.33 per cent of respondents had low level
of mass media exposure followed by medium (35.00%) and high (26.67%) levels incase
of untrained farmers respectively.
Ravichandra Prasad(2002) indicated that 73.22 per cent of the beneficiaries had
medium mass media exposure followed by high (16.07%) and low (10.07%) mass
media exposure respectively. Where as the non beneficiaries 53.33 per cent of them had
low mass media exposure followed by medium (35.73%) and high mass media
exposure.
Obaiah (2004) reported that 58.57 per cent of respondents had medium level of
mass media exposure followed by equal percentage of medium (20.71%) and low
(20.72%) levels in case of trained farmers, where as 55.72 per cent of respondents had

medium level of mass media exposure followed by low (35.71%) and high (8.57%)
levels incase of untrained farmers respectively.
2.1.6 Extension contact
Murthy (2000) identified that majority (64.17%) of beneficiaries of
Janmabhoomi programme had medium extension contact.
Ravisankar (2000) revealed that 46.67 per cent of respondents had high level of
extension contact followed by medium (30.00%) and low (23.33%) levels.
Madhavilatha (2002) reported that 43.33% per cent of respondents had high
extension contact followed by low (30.00%) and medium (26.67%) levels in case of
trained farmers ,where as 45.00 per cent had medium level of extension contact
followed by high (30.00%) and low (25.00%) levels incase of untrained farmers.
Ravichnadra Prasad (2002) indicated that majority of the beneficiaries (80.36%)
had medium extension contact followed by high (14.28%) and low (5.36%) extension
contact, where as non beneficiaries less than half of them 48.21 percent had low
extension contact followed by (41.07%) and (10.72%) with medium and high extension
contact respectively.
Sivasubramanyam (2003) reported that majority of the respondents (60.84%)
had medium level of extension agency contact followed by low level of contact with
extension agency (30.83%),only 8.33 per cent of the respondents had high extension
agency contact.
Obaiah (2004) indicated that 55.72 per cent of the trained farmers had medium
extension contact followed by 22.14 per cent each had low and high extension contact.
Whereas 62.86 percent untrained farmers had medium extension contact followed by
21.43 per cent high and 15.71 per cent low extension contact respectively.
2.1.7 Group orientation
Srinivasan (1996) while reporting about the working of two NGOs assisted
women groups of IFAD project ,noticed that the belonging to group gave the women a
lot of confidence .These women were able to take charge of their lives and solve their
problems only through united action.
Bagyalakshimi (2002) Observed that the self help group members had medium
group orientation (46.25%) followed by high (39.58%) and low (22.08%)
2.1.8 Market intelligence
Balappa Shivaraya and Hugar (2002) revealed a strong integration among all
the selected markets in Karnataka (India) both in onion and potato, except in Bijapur in
onion. Therefore, to continue the present system of market integration, there is a need to
establish cells for vegetables to generate market intelligence which would provide a
better platform for guiding the farmers in marketing their produce.
Prameela Sharma (2004) indicated that efficient marketing structures optimized
the supply chain from farmer to consumer by adding significant value and mitigating
risk to ensure that the consumer obtains the produce in the desired time, place and form.
Sundar and Raju (2005) revealed that higher profitability of superba compared
to competing crops is an important reason for the cultivation of this crop in the study
area. The study recommends, among others, the strengthening of market intelligence to
address the problem concerning price fluctuations of G. superba seeds. The
strengthening of research and extension is also recommended to address production and
marketing constraints.
Singh (2005) in his study indicated that Market intelligence of total international
demand and present levels of wild and domesticated supplies along with prices of
planting stock and different grades of produce need to be made available to prospective
farmers to prevent trade cycles.
2.1.9 Risk orientation
Singh et al (1999) indicated that majority of farmers had low (63%) risk
preference followed by medium ( 22%) and low (15%) risk preference towards dry
farming technologies.
Veerendranath (2000) reported that majority of small farmers had low risk
orientation, medium farmers had medium and large farmers had high risk orientation
respectively
Subramanyam (2002) inferred that 75.00 per cent of the trained farmers had
medium risk preference while 13.34 per cent had low and 11.66 per cent had high levels
of risk preference.
Madavilatha (2002) reported that 45.00 per cent of respondents had medium
level of risk orientation followed by low (31.67%) and high (23.33%) levels in case of
trained farmers ,where as 48.33 per cent had low level of risk orientation followed by
high (28.33%) and medium (23.33%) levels in untrained farmers.
Siva Subramanayam (2003) concluded that majority (60.84%) of the coconut
farmers had medium level of risk orientation while 24.17 per cent had low and 15 per
cent had high levels of risk orientation.

Ravishankar (2005) reported that majority of respondents were high market
orientation with respect to weather forecasting .
2.1.10 Innovativeness
Veerendranath (2000) revealed that majority of the respondents (39.44%) had
medium innovativeness and the rest of them (30.66%) and (30.00%) had low and high
innovativeness respectively,
Madavilatha (2002) reported that 45.00 per cent of respondents had medium
innovativeness followed by high (30.00%) and low (25.00%) levels in case of trained
farmers, where as 41.67 per cent had medium level of innovativeness followed by high
(33.33%) and low (25.0%) levels in untrained farmers.
Ravichandra Prasad (2002) reported that 67.86 per cent of the beneficiaries had
medium innovativeness followed by high (17.86%) and low (14.28%) levels. Non
beneficiaries 51.78 per cent of them had low innovativeness followed by medium
(37.50%) and high (10.72%) innovativeness respectively.
Reddy (2003) reported that majority (70.2 %) of the rice growers had medium
innovativeness followed by high (15.1%) and low 14.7%) innovativeness.
Purnima (2004) found that majority of the respondents in her study had high
innovativeness towards jute diversification programme.
Obaiah (2004) indicated that 56.43 per cent of respondents had medium level of
innovativeness followed by high (31.00%) and low (30.00%) levels in case of trained
farmers, where as 65.71 per cent had medium level of innovativeness followed by high
(22.86%) and low (11.43%) levels in un trained farmers.

Ravishanker (2005) stated that majority of respondents had medium level of
innovativeness with respect to weather forecasting.
2.1.11 Management orientation
Dayanidhi (1997) stated that majority of small farmers (38.7%) and medium
farmers (42.02%) were under medium management orientation category where as
majority of large farmers (52.63%) were having high management orientation.
Vijayachandra (1998) reported that trained farm women were distributed only
among two categories, namely medium management orientation (62.50%) and high
management orientation (37.50%) and none of them fell under low management
orientation category.
Obaiah (2004) indicated that 50.71 per cent of respondents had medium level of
management orientation followed by high (25.71%) and low (23.58%) levels incase of
trained farmers. Majority of (68.57%) untrained farmers had low management followed
by high (21.43%) and medium (10.00%) management orientation.
Ramprasad (2004) concluded that majority of farmers had medium management
orientation (78.4%) followed by low (14.4 %) and high (7.2%)
DEPENDENT VARIABLES 2.2 ATTITUDE
Meti and Sundaraswamy (1998) stated that majority of the farmers had
favourable attitude towards improved farm implements.
Kumar et al. (1999) inferred that majority of the farmers were neutral or
undecided in their attitude towards the agro-forestry programme.

Nagadev (1999) revealed that majority of respondents (68.67%) had moderately
favourable attitude, while 16.66 per cent had more favourable attitude and 14.67 per
cent respondents had less favourable attitude.
Prasad and Sundaraswamy (2000) found that 36.67 per cent of the respondents
belonged to less favourable attitude category followed by 34.33 per cent belonged to
more favourable category. A significant percentage (29.00%) of respondents belonged
to favourable category.
Ramamurthy (2000) indicated that 72.50 per cent of beneficiaries had
favourable attitude, followed by 11.67 per cent with more favourable and 15.83 per cent
with less favourable attitude towards Janmabhoomi programme.
Kapala (2002) observed that majority of the farmers (52.00 %) had favourable
attitude towards sustainable agriculture, followed by more favourable attitude (27.50
%) and less favourable attitude (20.50 %)
Reddy et al. (2001) indicated that most of the farmers (37.50%) had negative
attitude followed by positive (31.63%) and neutral (30.83%) attitude towards dry land
agricultural technology.
Lakshmana (2003) concluded that majority of respondents (65.66%) had
favoruable attitude and 3.33 per cent had highly unfavourable attitude towards ITKs and
their blending with modern technologies.
Obaiah (2004) observed that majority of the trained farmers had moderately
favourable attitude (55.72%) followed by 31 per cent each less and more favourable
attitude. Where as in case un trained farmers they had less favourable attitude (55.71%)
followed by moderately (32.86%) and more favourable attitude (11.43%) towards IPM
in rice.

Krishnamurhty et.al, (2005) revealed that 43 per cent farmers had more
favourable attitude followed by less favourable attitude (29%) and favourable attitude
(28%) towards IPM practices in Rice.
Patel et. al. (2007) indicated that majority (55.00%) of the farmers had medium
favourable attitude towards IPM strategy followed by 30 per cent low and 15 per cent
high favourable attitude towards IPM strategy.
2.3 Knowledge
Bhairamkar et al. (1998) revealed that more than half (53.33%) of the
beneficiaries had high knowledge while 26.67 per cent had no knowledge about the IPM
programme. On the other hand ,43.33 per cent of non-beneficiaries had medium
knowledge, while 36.67 per cent had no knowledge about IPM programme. The
knowledge scores of the beneficiaries, non-beneficiaries and total sample were 12.46,
6.65 and 9.51 per cent respectively.
Bhople and Lakhdive (1998) indicated that more than 50.00 per cent of the
farmers know about IPM practices.
Murthy and Veerabhadraiah (1999) in their study on Impact of IPM farmer
field school training programme on knowledge level of rice farmers reveled a highly
significant difference between trained and untrained farmers with respect to mean
knowledge index.
Lipi Das et al. (2005) observed that there was remarkable change in knowledge
level of farmers in all three ICM technologies after exposure to on farm trials .The pre
exposure mean knowledge level increased from 27 to 86 % indicating a change of (59
%) in over all knowledge level of farmers.

Krishnamurhty et.al. (2005) observed that 53 per cent trained farmers had high
knowledge followed by low knowledge (27.00%) and medium knowledge (20.00%)
regarding IPM practices in Rice. Where as 45 percent untrained farmers had low
knowledge followed by high (32.00 %) and medium (23.00%) knowledge in respect of
IPM practices in Rice.
Jaswinder Singh and Kuldip Kumar (2006) observed that majority (60.67 %) of
the farmers had medium knowledge level with score between 13-17 in soil and water
management practices. .
Waman et al, (2006) revealed that nearly half the cotton growers had high
knowledge level on IPM practices in cotton.
Jeyalakshmi and Santhagovind (2008) revealed that over all knowledge level of
farm women on sustainable plant protection technologies was found to be low in
paddy.
Maraddi et.al, (2007) observed that more than half of the respondents belonged
to medium knowledge level category (53.33 %) followed by low (32.77 %) and high
(13.89 %) in respect of sugarcane cultivation practices.
2.4 SKILL
Kumar (1996) revealed that majority (58%) of trainees had medium level of skill
followed by high (31%) and low (11 %) level of skill after training by K.V.Ks.
Chandravathi (1997) reported that all the women farmers expressed that the
training programme was highly advantageous for improving skills in seed treatment,
seed selection, gypsum application and preparation of spray fluid etc.

Vijayachandrika (1998) found that majority (77.50 %) of the trained farm
women belonged to medium category of skills acquisition followed by 20.00 percent
belonging to high category of skills acquisition with regard to rice crop.
Raju (1999) revealed that majority (70.83%) of the trainees had medium level of
operational skills acquired followed by low operational skills acquired (17.50%) and
high operational skills acquired (11.67%) in ANTWA training programme.
Obaiah (2004) More than half ( 54.29%) of the trained farmers belonged to
medium skills learnt category followed by high (25%) and low (20.91%) categories of
skills learnt .In case of untrained farmers majority (63.57%) of them belonged to low
skills learnt group followed by medium (20%) and high (1.43%) categories of skills
learnt in Rice IPM.
2.5 ADOPTION
Thyagarajan and Vasanthakumar J (2000) found that majority of the farmers
were in low category of adoption (48.33%) of recommended rice technologies followed
by high (28.675) and medium (23.0%) adoption.
Vijyalan (2001) in his study on eco friendly agricultural practices in Rice
revealed that rice growers were found to have low (41.66 %) adoption level followed by
medium (32.5 %) and high (25.84 %) levels.
Subramanyam (2002) found that 58.33 per cent of respondents had medium
adoption followed by high (25 %) and low (16.67 %) level of adoption in case of AMC
trained farmers ,where as 63.34 per cent of respondents had low adoption followed by
medium (21.66 %) and high (15.00 %) levels of adoption in case of untrained farmers.
Madhavilatha (2002) reported that 35.00 percent of respondents had high extent
of adoption followed by low (33.33 %) and medium (31.67 %) extent in case trained

farmers ,where as 40.00 percent had low extent of adoption followed by high (31.67 %)
and medium (28.33 %) extent of adoption in untrained farmers.
Wasnik (2003) stated that 46.40 percent of farmers had high adoption followed
by medium (38.60 %) and low (15 %) after introduction of watershed development
programme.
Natarajan (2004) revealed that majority of FFS farmers belonged to medium(
36.66%) adoption category followed by high (35.66 %) and low(27.78%), where as in
case of Non FFS majority were medium (36.67%) followed by low (33.33%) and high
(30.00%)
Waman et al. (2006) revealed that majority of the farmers had low to medium
level of adoption of recommended IPM practices in Cotton.
2.6 AGRO ECOSYSTEM MANAGEMENT Pest defender management
Ooi and Kenmore (2005) concluded that educating farmers about biological
control result in farmers using less chemical insecticides and becoming more efficient in
their production activities.
Mancini (2006) stated that those farmers who had learned more about pest and
predator ecology attained the highest reductions in pesticide usage.
Input management
Mancini (2006) observed that adoption of IPM reduced pesticide use by 78 per
cent without affecting crop productivity, suggesting that a large part of the current use
of pesticides is unnecessary

Nisha Aravind (2006) found that the non-IPM fields received an imbalance
dosage of nutrient treatment as well as chemical pesticide sprays, while the IPM fields
were applied with a balanced fertilizer treatment (NPK), planted at lower densities with
wider spacing and need-based botanical and biological pesticides application. Benefit
cost ratio was higher for IPM farmers (1:2.01) compared to that of non-IPM farmers.
Arun Balamatti and Rajendra Hegde (2007) found that FFS training has
strengthened women's knowledge and skills on soil and water conservation, soil fertility
management and better practices of crop production and protection. The availability of
food crops for home consumption has improved.
Biodiversity conservation
Singh et al (2006) stated that farmers possess an immense knowledge of their
environment based on the years of informal wisdom and close observation of the nature.
By living in rich and variety of complex ecosystems, they have developed an
understanding of ecosystem, food web, and techniques for their effective management.
People knowledge and perception towards environment are important elements cultural
identity and biodiversity conservation.
Ooi and Kenmore (2005) indicated that the species diversity was higher in IPM
plots compared with plots regularly treated with insecticides. In India, the number of
species was 48 in IPM plots and 31 in non-IPM plots, with an increase in biological
control knowledge (FFS farmers scoring 16.9 points for recognizing natural enemies
compared to 2.3 for non-IPM), there is a concomitant reduction in use of insecticides
(43% for IPM farmers versus 34% for non-IPM)

2.7 Use of ITKs
Singh and Rao (1993) documented several traditional conservation farming
practices followed by farmers in rainfed farming systems under different groups such
as tillage and moisture conservation practices, land management ,water harvesting and
crop management practices.
Mane and Sutaria (1993) documented different traditional practices followed by
tribal farmers in different crops in Gujarath state.
Rambabu (1997) found that majority of farmers were medium adopters in
Cotton (63.34%) cropping system followed by low and high adoption.
Atchuta Raju (2002) concluded that majority of respondents (57.50 %) had
medium level of adoption of eco-friendly farming practices followed by 22.50 percent
low level of adoption and remaining 20.00 percent with high level of adoption.
Lakshmana (2003) indicated that majority of ITKs found rational (85.71 %) and
remaining ITKs (14.29%) were found not rational.
Karthekeyan et al.(2006) described about five indigenous technologies
involving cow based products used by farmers for various purposes and an analysis on
its impact in Tamil Nadu.
2.8 DECISION MAKING
Neelarani (1999) in her study found that in majority of tribal families ,husband
alone took majority of decisions regarding agricultutal activities.
Chatterjee (2000) inferred that majority (68.33%) of the respondents had
medium level of decision making ability followed by low (18.33%) and high (13.33 %)
levels of decision making ability.

Devi (2000) found that majority of respondents had medium level (49.28%)
decision making ability followed by high (28.26%) and low (22.46%)
Obaiah (2004) reported that majority (57.14%) of the FFS trained farmers were
having medium decision making ability followed by high and low decision making
ability with equal percentage (i.e 21.43% each).In case of untrained farmers, 42.86 per
cent were found to be under low decision making ability category followed by medium
(41.43%) and high (15.71%) decision making ability categories.
Nisha Aravind (2006) in her study on effectiveness of Farmer field school
(FFS) approach in rice ecosystem for IPM observed that farmer regained the
competence to make rational decisions concerning the management of crops.
2.9 Association of profile Characters with that of Attitude, Knowledge, Skill, Extent of adoption, Agro ecosystem management and Decision making
1. ATTITUDE
Attitude Vs Age
Ramprasad (2004) concluded that age had positively significant relationship
with attitude level of farmers.
Attitude Vs Education
Singh et al. (1999) concluded that there was positive and significant relationship
between education and attitude of farmers towards dry farming technologies .
Chandra et al.(2000) inferred that there was no significant association between
education and attitude of farmers towards watershed development practices.
Prasad and Sundaraswamy (2000) indicated that there was positively significant
association between education and attitude of farmers towards dryland agricultural
technologies.

Ramamurhty (2000) reported that there was a negative significant relationship
between education and attitude of farmers
Obaiah (2004) reported that there was positive and significant relationship
between education and attitude of FFS and non farmers towards IPM in rice.
Attitude Vs Farming experience
Srinu (1997) reported that there was positively significant relationship between
farming experience and attitude of farmers.
Prasad and Sundaraswamy (2000) indicated that there was positive non-
significant association between farming experience and attitude of farmers towards
dryland agricultural technologies.
Atchuta Raju (2002) concluded that farming experience had positively
significant relationship with attitude of farmers towards sustainable agriculture..
Obaiah (2004) reported that there was positive and significant relationship
between farming experience and attitude of FFS and non farmers towards IPM in rice.
Ramprasad (2004) stated that farming experience had positively significant
relationship with attitude of farmers.
Attitude Vs Farm size
Singh et al. (1999) stated that there was positive non-significant association
between land holding and attitude of farmers towards dry farming technologies .
Chandra et al.(2000) reported that there was negatively significant association
between farm size and attitude of farmers towards water shed development
Ramamurthy (2000) reported that there was a positive significant relationship
between farm size and attitude of farmers

Atchuta Raju (2002) concluded that farm size had positively significant
relationship with attitude level of farmers towards sustainable agriculture.
Ramprasad (2004) stated that farm size had positively significant relationship
with attitude of farmers .
Attitude Vs Mass media exposure
Singh et al. (1999) stated that there was positively significant association
between mass media exposure and attitude of farmers towards dry farming technologies.
Chandra et al. (2000) inferred that there was positive and non significant
relationship between mass media exposure and attitude of farmers towards water shed
development
Ramamurhty (2000) reported that there was a positive significant relationship
between mass media exposure and attitude of farmers
Prasad and Sundaraswamy (2000) indicated that there was positively significant
association between mass media exposure and attitude of farmers towards dryland
agricultural technologies.
Obaiah (2004) reported that there was non significant relationship between mass
media exposure and attitude of farmers
Attitude Vs Extension contact
Meti and Sundaraswamy (1998) indicated that there was non significant
relationship between extension participation and attitude of farmers
Chandra et al.(2000) indicated that there was positively significant association
between extension participation and attitude of farmers towards watershed development
practices.
Prasad and Sundaraswamy (2000) stated that there was a positive significant
relationship between extension participation and attitude of farmers towards dryland
agricultural technologies.
Ramamurthy (2000) stated that there was a negatively significant relationship
between extension participation and attitude of farmers.
Obaiah (2004) reported that there was a non significant relationship between
extension contact and attitude of farmers
Attitude Vs Risk orientation
Chandra et al. (2000) indicated that risk orientation had positively significant
relationship with attitude level of farmers towards sustainable agriculture.
Prasad and Sundaraswamy (2000) reported that there was a positively significant
relationship between attitude and risk orientation of farmers.
Atchuta Raju (2002) concluded that risk orientation had positively significant
relationship with attitude level of farmers towards sustainable agriculture.
Attitude Vs Innovativeness
Ramakrishna (1999) stated that there was positive relationship between
innovativeproneness and attitude of farmers.
Atchuta Raju (2002) concluded that innovativeness had positively significant
relationship with attitude level of farmers towards sustainable agriculture.
Obaiah (2004) reported that there was positive and significant relationship
between innovativeness and attitude of FFS and non farmers towards IPM in rice.

Attitude Vs Management orientation
Obaiah (2004) reported that there was positive and significant relationship
between management orientation and attitude of FFS and non farmers towards IPM in
rice.
Ramprasad (2004) concluded that management orientation had positively
significant relationship with attitude level of farmers.
2.Knowledge. Knowledge Vs Age
Veeraiah et al (1998) revealed that age had negative and significant relationship
with the level of knowledge of trained farmers about recommended critical skills in
rainfed groundnut cultivation.
Ramakrishnan (1999) concluded that age had a negative and significant
relationship with knowledge gained trainees.
Hemanth Kumar (2002) reported that there was no significant relationship
between age and knowledge level of the oriental tobacco farmers.
Madhavilatha (2002) reported that there was no significant relationship between
age and knowledge level of the trained farmers.
Saritha Vaish et al. (2003) concluded that age had highly significant relationship
with knowledge level of rural women on rice production technology.
Satpal Singh et al.(2003) revealed that age had negative significant relationship
with knowledge level of farmers on sunflower production technology.
Obaiah (2004) indicated that age had positively significant relationship with
knowledge of FFS and non FFS farmers on IPM in rice.

Knowledge Vs Education
Balasubramani et al. (2000) reported that there was positive and significant
relationship between education and knowledge level of Rubber growers
Borkar et al. (2000) found that there was a positively significant relationship
between education of the farmers with their knowledge level of biofertilizers .
Veerendranath (2000) indicated that there was a positive and significant
relationship between education and knowlleldge of rainfed castor growing farmers.
Hemanth Kumar (2002) inferred that there was a positive and significant
relationship between education and knowledge level of the respondents about oriental
tobacco practices.
Madhavilatha (2002) reported that there was a positive significant relationship
between education and knowledge level of the trained farmers.
Satpal Singh et al.(2003) revealed that education had positively significant
relationship with knowledge level of farmers on sunflower production technology.
Obaiah (2004) stated that education had positively significant relationship with
knowledge of FFS and non FFS farmers on IPM in rice.
Knowledge Vs Farming experience
Sindhe et al. (1999) indicated that there was a negatively significant correlation
between farming experience and knowledge about improved practices of Rabi Jowar
Balasubramani et al. (2000) indicated that there was positive and non significant
relationship between farming experience and knowledge level of Rubber farmers

Chatterjee (2000) inferred that there was a positively significant relationship
between farming experience and knowledge level about the recommended technologies
of NWDPRA.
Veerendranath (2000) reported that there was non-significant relationship
between experience and knowledge of rainfed castor growing farmers.
Obaiah (2004) indicated that farming experience had positively significant
relationship with knowledge of FFS and non FFS farmers on IPM in rice.
Knowledge Vs Farm size
Sindhe et al (1999) indicated that there was a positive and significant association
between land holding and knowledge about improved practices of Rabi Jowar
Singh et al (1999) observed that there was a positive and non significant
relationship between land holding and knowledge level of dry farming technologies.
Borkar et al (2000) indicated that there was a positive and significant association
between land holding and knowledge level of bio fertilizers.
Madhavilatha (2002) reported that there was a positive significant relationship
between farm size and knowledge level of the trained farmers.
Obaiah (2004) indicated that farm size had positively significant relationship
with knowledge of FFS and non FFS farmers on IPM in rice.
Knowledge Vs Mass media exposure
Singh et al (1999) observed that there was a positively significant relationship
between mass media exposure and knowledge level of dry farming technologies.
Borkar et al (2000) indicated that there was a positively significant association
between mass media exposure and knowledge level of bio fertilizers.

Chatterjee (2000) stated that there was a positive and significant relationship
between mass media exposure and knowledge level about the recommended
technologies of NWDPRA.
Gattu (2001) stated that there was a positive and significant relationship
between mass media exposure and knowledge level.
Satpal Singh et al. (2003) revealed that mass media exposure had positively
significant relationship with knowledge level of farmers on sunflower production
technology.
Obaiah (2004) indicated that mass media exposure had positively significant
relationship with knowledge of FFS and non FFS farmers on IPM in rice.
Knowledge Vs Extension contact
Prasad and Sundaraswamy (1999) concluded that there was positive and
significant relationship between extension participation and knowledge level about dry
land technologies.
Ramamurhty (2000) observed that there was a positive and significant
association between extension participation and knowledge level
Borkar et al. (2000) indicated that there was a positive and significant
association between extension participation and knowledge level of bio fertilizers.
Ravichandra Prasad (2002) reported that there was a positive and significant
relationship between extension participation and knowledge level of beneficiaries about
package of practices of rice OFEDs.

Satpal Singh et al.(2003) revealed that extension contact had positively
significant relationship with knowledge level of farmers on sunflower production
technology.
Obaiah (2004) indicated that extension contact had positively significant
relationship with knowledge of FFS and non FFS farmers on IPM in rice.
Knowledge Vs Market intelligence
Chander (1991) reported that in case of medium and large farmers ,market
orientation had positive significant relationship with knowledge on the recommended
technologies of watershed development project.
Reddy (1998) revealed that there was a positive and significant relationship
between market orientation and knowledge of the farmers of KVV.
Knowledge Vs Risk orientation
Gattu (2001) reported that risk orientation had positively significant relationship
with knowledge level of respondents.
Atchuta Raju (2002) concluded that risk orientation had positively significant
relationship with knowledge level of farmers on ecofriendly farming practices.
Satpal Singh et al. (2003) revealed that risk orientation had positively
significant relationship with knowledge level of farmers on sunflower production
technology.
Natarajan (2004) indicated that risk orientation had positively significant
relationship with knowledge level of farmers on recommended IPM practices.

Knowledge Vs Innovativeness
Devi and Manoharan (1999) reported that there was positively significant
relationship between innovativeness and knowledge level.
Ramakrishnan (1999) reported that there was positively significant relationship
between innovation proneness and knowledge level
Veerendranath (2000) concluded that there was a positive and significant
relationship between innovativeness and knowledge level of rainfed castor growing
farmers.
Kalaskar et al. (2001) reported that there was positively significant relationship
between innovation proneness and knowledge level of coconut growers.
Madhavilatha (2002) reported that there was a positive significant relationship
between innovativeness and knowledge level of the trained farmers.
Obaiah (2004) indicated that innovativeness had positively significant
relationship with knowledge of FFS and non FFS farmers on IPM in rice.
Knowledge Vs Management orientation
Obaiah (2004) indicated that management orientation had positively significant
relationship with knowledge of FFS and non FFS farmers on IPM in rice.
3. Skills Skills Vs Age
Ramakrishnan (1999) concluded that age had a negative and significant
relationship with operational skills acquired by the trainees.

Skills Vs Education
Ramakrishnan (1999) inferred that there was a positive and significant
relationship between education and operational skills acquired by the trainees.
Obaiah (2004) reported that there was positive and significant relationship
between education and skills of FFS and non farmers towards IPM in rice.
Skills Vs Farming experience
Subbarao (1996) observed that there was a negative and significant
relationship between farming experience and skills
Obaiah (2004) reported that there was positive and significant relationship
between farming experience and skills of FFS and non farmers towards IPM in rice
Skills Vs Extension contact
Ramakrishnan (1999) inferred that there was a positive and significant
relationship between extension contact and operational skills acquired by the trainees.
Obaiah (2004) reported that there was positive and significant relationship
between extension contact and skills of FFS and non farmers towards IPM in rice
Skills Vs Mass media exposure
Ramakrishnan (1999) inferred that there was a positive and significant
relationship between mass media exposure and operational skills acquired by the
trainees.
Obaiah (2004) reported that there was a non significant relationship between
mass media exposure and skills of farmers

Skills Vs Innovativeness
Obaiah (2004) reported that there was positive and significant relationship
between innovativeness and skills of FFS and non farmers towards IPM in rice
Skills Vs Management orientation
Obaiah (2004) reported that there was positive and significant relationship
between management orientation and skills of FFS and non farmers towards IPM in rice
4. Extent of adoption Adoption Vs Age
Raju (1999) revealed that age had negative significant relationship with adoption
of different agricultural practices taught in the training programmes under ANTWA of
trained farm women.
Veerendranath (2000) reported that age had negative significant relationship
with adoption of rainfed castor growing farmers.
Ravichnadra Prasad (2002) stated that there was no significant relationship
between age and adoption level of beneficiaries about package of rice OFEDs.
Hemanth Kumkar (2002) reported that there was no significant relationship
between age and adoption level of oriental tobacco farmers.
Avinash Kumar Singh et al. (2003) concluded that age had singnificant
relationship with adoption of improved chick pea technology.
Adoption Vs Education
Manjunatha (1999) stated that education had positively significant relationship
with adoption.

Veerendranath (2000) reported that education had positive and significant
relationship with adoption of rainfed castor growing farmers.
Baswarajaiah (2001) revealed that education had positively significant
relationship with adoption of respondents.
Madhavilatha (2002) reported that there was a positive significant relationship
between education and adoption level of trained farmers.
Avinash Kumar Singh et al. (2003) concluded that education had significant
relationship with adoption of improved chick pea technology.
Satish (2003) reported a positive and significant relationship between education
and adoption risk management practices by the papaya growers.
Adoption Vs Farming experience
Chandra (2000) inferred that there was a positive and significant relationship
between farming experience and adoption of respondents.
Baswarajaiah (2001) revealed that farming experience had negative non
significant relationship with adoption of respondents.
Atchuta Raju (2002) concluded that farming experience had positively
significant relationship with adoption level of eco friendly farming practices.
Ravichnadra Prasad (2002) concluded that there was a negative and significant
relationship between farming experience and adoption level of the beneficiaries about
the package of practices of rice OFEDs.
Natarajan (2004) revealed that farming experience had no significant
relationship with adoption of farmers on IPM practices.
Adoption Vs Farm size
Chandra et al. (2000) inferred that there was a positive and significant
relationship between farm size and adoption of respondents.
Madhavilatha (2002) reported that there was a positive significant relationship
between farm size and adoption level of trained farmers.
Avinash Kumar Singh et al. (2003) concluded that farm size had significant
relationship with adoption of improved chick pea technology.
Satish (2003) revealed that there was non significant relationship between farm
size and adoption risk management practices by the papaya growers.
Ravishankar (2005) indicated that there was positive significant relationship
between farm size and decision making ability of farmers of weather forecasting
Adoption Vs Mass media exposure
Chandra (2000) inferred that there was a positive and significant relationship
between mass media exposure and adoption of respondents.
Gattu (2001) stated a positively significant relationship between mass media
exposure and adoption level
Madhavilatha (2002) reported that there was a positive significant relationship
between mass media exposure and adoption level of trained farmers.
Satish (2003) reported a positive and significant relationship between mass
media exposure and adoption risk management practices by the papaya growers.
Avinash Kumar Singh et al. (2003) concluded that mass media exposure had
significant relationship with adoption of improved chick pea technology.

Adoption Vs Extension contact
Raju (1999) revealed that extension contact had positive and significant
relationship between extension contact and adoption of practices taught under
ANTWA for trained farm women.
Chandra (2000) inferred that there was a positive and significant relationship
between extension contact and adoption of respondents.
Subramanyam (2002) concluded that there was a positive and significant
relationship between extension contact and adoption of latest agricultural technology
by trained farmers of AMCc.
Avinash Kumar Singh et al. (2003) concluded that extension contact had
significant relationship with adoption of improved chick pea technology.
Motamed and Baldeo Singh (2003) reported that there was a positive and
significant relationship between extension contact and adoption level of the improved
sericulture practices.
Adoption Vs Risk orientation
Veerendranath (2000) reported that a positive and significant relationship
between risk orientation and adoption of rain fed castor farmers.
Gattu (2001) indicated positive significant relationship between risk orientation
and adoption level of trained farmers.
Madhavilatha (2002) reported that there was a positive significant relationship
between risk orientation and adoption level of trained farmers.

Subramanyam (2002) concluded that there was a positive and significant
relationship between risk orientation and adoption of latest agricultural technology by
trained farmers of AMCs.
Ravishankar (2005) indicated that there was a positive and significant
relationship between risk orientation and adoption of weather forecasting.
Adoption Vs Innovativeness
Manjunatha (1999) stated that there was positive significant relationship
between innovativeness and adoption level
Madhavilatha (2002) reported that there was a positive significant relationship
between innovativeness and adoption level of trained farmers.
Subramanyam (2002) concluded that there was a positive and significant
relationship between innovativeness and adoption of latest agricultural technology by
trained farmers of AMCc.
Satish (2003) reported a positive and significant relationship between
innovativeness and adoption risk management practices by the papaya growers.
Ravishankar (2005) indicated that there was a positive and significant
relationship between innovativeness and adoption of weather forecasting.
5. Decision making Decision making Vs Age
Rani (1999) observed that positive but non significant relationship between age
and decision making ability of farm women.
Mahitha Kiran (2000) found that there was no significant relationship between
age and decision making ability of farm women in agriculture.

Kumar (2001) found that age had not shown any significant relationship with
farm decision making of floriculture farmers.
Radha Krishna et.al. (2008) revealed that there was positive and significant
relationship between age and decision making level of members of SHG.
Decision making Vs Education
Rani (1999) observed that education was significantly related with decision
making ability of farm women.
Mahitha Kiran (2000) found that there was no significant relationship between
education and decision making ability of farm women in agriculture.
Kumar (2001) found that education was positively significant with farm decision
making of floriculture farmers
Obaiah (2004) found that there was no significant relationship between
education and decision making ability of FFS farmers.
Radha Krishna et.al. (2008) revealed that there was non significant relationship
between education and decision making level of members of SHG.
Decision making Vs Farming experience
Vijayalakshmi (1995) concluded that there was positive and non-significant
relationship between farming experience and decision making on farm women.
Sumana (1996) observed that there was non-significant relationship between
farming experience and decision making pattern of farm women.
Obaiah (2004) reported that there was positive and significant relationship
between farming experience and decision making of FFS and non FFS farmers.

Decision making Vs Farm size
Vijayalakshmi (1995) observed that land holding status of family was found to
be non-significant with decision making ability of farm women.
Kumar (2001) found that farm size was positively significant with farm decision
making of floriculture farmers
Mahitha Kiran (2000) found that there was no significant relationship between
farm size and decision making ability of farm women in agriculture.
Radha Krishna et.al. (2008) revealed that there was positive and significant
relationship between farm size and decision making level of members of SHG.
Decision making Vs Extension contact
Rani (1999) observed that Positive and significant relationship between
extension contact and decision making ability of farm women.
Mahitha Kiran (2000) found that there was positive significant relationship
between extension contact and decision making ability of farm women in agriculture.
Obaiah (2004) reported that there was positive and significant relationship
between farming experience and decision making of FFS and non FFS farmers.
Radha Krishna et.al. (2008) revealed that there was positive and significant
relationship between extension contact and decision making level of members of SHG.
Decision making Vs Mass media exposure
Vijayalakshmi (1995) observed that there was positive and non-significant
relationship between mass media exposure and decision making ability of farm
women.
Mahitha Kiran (2000) found that there was positive significant relationship
between mass media exposure and decision making ability of farm women in
agriculture.
Obaiah (2004) reported that there was positive and significant relationship
between mass media exposure and decision making of FFS and non FFS farmers.
Decision making Vs Risk orientation
Rani (1999) observed that Positive and non significant relationship between risk
orientation t and decision making ability of farm women.
Mahitha Kiran (2000) found that there was positive significant relationship
between risk orientation and decision making ability of farm women in agriculture.
Ravishankar (2005) stated that there was positive significant relationship
between risk orientation and decision making ability of respondents of weather
forecasting.
Radha Krishna et.al. (2008) revealed that there was positive and significant
relationship between risk orientation and decision making level of members of SHG.
Decision making Vs Innovativeness
Mahitha Kiran (2000) found that there was positive significant relationship
between innovativeness and decision making ability of farm women in agriculture.
Obaiah (2004) reported that there was positive and significant relationship
between innovativeness and decision making of FFS and non FFS farmers.
Ravishankar (2005) stated that there was positive significant relationship
between innovativeness and decision making ability of respondents of weather
forecasting.

Decision making Vs Management orientation
Rani (1999) observed that there was a positive and non significant relationship
between management orientation and decision making ability of farm women.
Obaiah (2004) reported that there was positive and significant relationship
between management orientation and decision making of FFS and non FFS farmers.
2.10 CONSTRAINTS
Jain and Bhattacharya (2000) indicated that five types of constraints which
includes social, financial, situational, technological and operational .A majority of
respondents (685%) reported that non awareness about bio-fertilisers product. Other
constraints were lack of practical oriented training (64%),lack of relevant literature
(60%) ,lack of handling skills (56%) lethaergy due to cumbersome technique (54%),
lack of confidence on bio fertilizers input (52%) and poor quality of bio fertilizer (50%)
.Few (44%) reported lack of bio fertilizer supply were centre in village and lack of
storage facility.
Baswarajaih (2001) concluded that the problems expressed by the farmers were
lack of resources, follow up action by implementing officials, technical guidance by
scientists ,efforts on the part of implementing agency to educate and convince the
farmers about the programme, illiteracy and the farmers were habituated to subsidies,
low level of motivation and less availability of suitable technology for resource poor
situations ,credit facility, timely supply of inputs.
Madhavilatha (2002) reported that problems as perceived by the FTC trained
farmers were high cost of input (75%), lack of awareness on advanced IPM
practices(61.67%), difficulty in implementing biological methods(43.33%), lack of
methods for easy detection of the ETIL (36.66%) ,non availability of inputs in time

(31.67%), inability to contact extension agencies at the time of need (26.67%),
difficulty in calculating pesticide doses (20.00%), high cost of labour (16.67%), lack
of simple monitoring methods (11.67%) high cost of sprayers (8.33%), difficulty in
remembering scouting methods (3.33%).
Obaiah (2004) indicated that problems expressed by FFS farmers were Farmer
field school timings are not convenient for majority of farmers (93.57%) was an
important problem followed by poor mobility facilities to the extension staff (90.71%)
,non-availability of inputs in time (88.57%) ,lack of literature on proven IPM
technologies (84.42%), non availability of trained facilitators for the FFS (81.42%)
,shortage of funds and infrastructure facilities (77.14%) ,lack of proper monitoring
(72.85%) ,inadequate training to the field staff (69.28%) ,lack of proper training
material (64.28%) and poor coordination between plant protection services ,research
institutes and extension functionaries (61.42%)
Natarajan (2004) stated that high cost of inputs, high labour cost, difficulty in
remembering ETL and scouting methods, labour scarcity during peak period of the
season were the major problems encountered by the beneficiaries of rice IPM FFS.
2.10.1 Suggestions
Rambabu (1997) revealed that the important suggestions made by the farmers to
overcome the constraints were: improvement of sound research on ecological farming
practices, make available the bio-fertilisers and neem products on subsidy rates by
government, establishment of bio-gas plants for getting more organic manure and
strengthening the extension system to immediate dissemination of proven indigenous
technologies.

Nagadeve (1999) revealed that the important suggestions made by the IPM
trained farmers to overcome the constraints were timely supply of inputs at reasonable
cost (74%) ,regular farm visit of extension worker (70%) arranging more credit facilities
(64%), less rate of interest on loan (58%), providing the subsidy on inputs (42%)
should be find out. Timely technical guidance (38%) ,oraganising more number of
training programmes and involving the other farmers of village in training programme
(32%) and follow up training programme (28%) for successful implementation of IPM
programmes and there by improve the plant protection status of farmers.
Baswarajaiah (2001) concluded that the suggestions offered by the farmers for
improving participation, making proper follow up action, leadership abilities,
encouraged to develop capacity to analyse the problems and interests of people to be
provoked to intensify extension activities ,timely supply of inputs with subsidized rates
,provision of timely technical guidance by scientists, provided adequate training for
timely execution of soil and moisture conservation works.
Vasantha (2002) in her study on IPM technologies in cotton revealed that lack of
organizational or cooperative efforts by farmers as the major problem for which it was
suggested that formation of farmers clubs and cooperative societies for effective group
actions as the need of hour.
Obaiah (2004) indicated that the suggestions made by FFS farmers were
conduct FFS programme at 9 AM (92.14%) ,separate and exclusive transport facilities
may be arranged to the facilitators to attend the FFS in time (91.42%) ,supply of critical
inputs in time (88.57%) ,publications may be published in vernacular language
regarding proven IPM technologies and may be supplied (87.57%) ,officials must be
trained in key components of programme (81.42%) adequate funds to be allotted to

meet the basic requirements and to incur the expenditure on contingencies (78.57%)
,proper monitoring of the programme at every stage by the superior officer (72.85%)
,providing training material for smooth conduct of FFS(64.28%) ,maintenance of proper
coordination between plant protection services ,research institutes and extension
functionaries.
Natarajan (2004) stated that reduction in high cost of inputs, simple procedures
to remember ETL and scouting methods as important suggestions in the adoption of
IPM practices in rice.
2.11. Conceptual model of the study and derivation of hypothesis
2.11.1 Conceptual model of the study
In the light of inferences derived from recorded evidences in the literature , conceptual
model has been developed for the study (Empowerment of Farmers through Farmer
Field School in Andhra Pradesh) has been assessed on level of attitude, knowledge,
skills learnt, adoption , agro-ecosystem management and decision making by FFS and
non FFS farmers. The independent variables representing the personal,Socio-economic
and psychological characteristics were selected ,based on the review of literature and in
consultation with experts in the field of extension to examine nature and extent of
relationship with attitude, knowledge, skills learnt, adoption , agro-ecosystem
management and decision making by FFS and non FFS farmers
This model was positively perceived with a view to give Empowerment of farmers in
comparison of selected behavioral dimensions of FFS and non FFS framers like attitude,
knowledge, skills learnt, adoption , agro-ecosystem management and decision making

and independent variables affecting them and the relationship was diagrammatically
presented in Fig.1 which will help to derive hypothesis for empirical testing.
2.11.2 Derivation of hypothesis
Based on the review of literature and conceptual frame work for the study ,the
following hypothesis were found to examine the dependent variables and its selected
dimensions and to test their relationship with independent variables.
General Hypothesis -1
There will be relationship between the independent variables of FFS
and Non FFS farmers with their Attitude
General Hypothesis -2
There will be relationship between the independent variables of FFS
and Non FFS farmers with their Knowledge.
General Hypothesis -3
There will be relationship between the independent variables of FFS
and Non FFS farmers with their Skill learnt.
General Hypothesis -4
There will be relationship between the independent variables of FFS
and Non FFS farmers with their Adoption of Cotton FFS practices.
General Hypothesis -5
There will be relationship between the independent variables of FFS
and Non FFS farmers with their Agro-ecosystem management.
General Hypothesis -6
There will be relationship between the independent variables of FFS
and Non FFS farmers with their Decision making.

2.12 Definition and operationalization of the terms used in the study
Empowerment: Empowerment is operationalized as a process that enables farmers to increase
their knowledge and build skills in identifying and analyzing problems encountered and
take appropriate decisions and actions to prevent and reduce risks and to solve
problems.
Knowledge
Knowledge was operationalized as the number of eco-friendly farming practices
known to farmers in order to protect the natural resources in the farmers field school
area.
Attitude
Attitude was operationalized as the mental disposition of the respondent about
various aspects of ICM either positively or negatively.
Skill
An ability and capacity acquired through deliberate, systematic, and sustained
effort to smoothly and adaptively carryout complex activities.
Decision making ability
Decision making ability was operationalized as the degree to which an
individual justifies his selection of most efficient means/ ways from among the
available alternatives on the basis of scientific criteria.
Agro ecosystem management
Agro ecosystem management was defined as tool that provide integration and
synthesis of soil test results, management priorities, and environmental concerns.
Adoption
Adoption was operationalized as practicing the ICM technologies in cotton by
FFS farmers as per recommendations of Department of Agriculture.
Age
Age of the respondent was operationalized as the number of completed years at
the time of enquiry.
Education
Education of the respondent was operationalized as the formal education
attained by the respondent
Farm size
Land holding was operationalized as the total extent of land an individual farmer
possessed and cultivated.
Farming experience
Farming experience was operationalized as the number of completed years of
experience in farming by the respondent.
Extension contact
Extension contact was operationalized as the frequency of contact of respondent
with extension personnel i.e AEO,A.O,ADA,FFS facilitator, Adarsha rythu and
ANGRAU Scientist
Group orientation
Group orientation was operationalized as the degree to which the farmer is
oriented towards group for achieving common goal and in adopting new ideas in FFS.

Market intelligence
Market intelligence is operationalized as the process of acquiring and analyzing
information in order to understand the market to determine the current and future needs
and preferences, attitude and behaviour of the market and to assess the changes in
business environment that may affect the size and nature of the market in the future.
Mass media exposure
Mass media exposure was operationalized as the frequency with which the
respondent reads news paper and agril. Journals, listens radio and watches television,
C.Ds for farm information.
Innovativeness
It was operationalized as the degree to which an individual adopts new ideas and
new information related to FFS practices.
Risk orientation
Risk orientation was operationalized as the degree to which the farmer was
oriented towards risk and uncertainty in adopting new ideas in FFS.
Management orientation
Management orientation was operationalized as the degree to which a farmer is
oriented towards scientific farm management comprising of planning, production and
marketing functions of his farm enterprise.
CHAPTER III
MATERIALS AND METHODS
The present chapter deals with methodology adopted for the present study. It
includes the research design, local of the study, sampling procedure, empirical
measurement of the variables, procedures followed in development of Attitude of
farmer, Knowledge test, Skill, Extent of adoption, Agro-ecosystem management and
Decision making towards Farmers Field Schools. The methods followed have been
described under the following sub heads.
3.1 Research design
3.2 Locale of the study
3.3 Sampling procedure
3.4 Empirical measurement of the variables
3.5 Constraints and suggestions for effective implementation of Farmers Filed
Schools in Cotton
3.6 Tools for data collection
3.7 Statistical tests used to analyze the data
3.1 RESEARCH DESIGN
Ex-post-facto research was followed for carrying out the study. Expost facto
research design is systematical empirical enquiry in which the dependent variables have
not been directly manipulated because they have already occurred or they are inherently
not manipulable. With respect to the type of variables under consideration, size of
respondents and phenomenon to be studied, the ex-post–facto design was chosen as an
appropriate research design.
3.2 LOCALE OF THE STUDY
The state of Andhra Pradesh was purposively selected for the study as the
investigator is familiar with the local language, which helps to develop rapport and also

enable in depth study combined with personal observation. Moreover, the investigator is
working in ANGRAU, the only Agricultural University in Andhra Pradesh.
3.3 SAMPLING PROCEDURE
3.3.1 Selection of Districts
Three districts one each from Telangana, Rayalaseema and Andhra region i.e.,
Warangal, Kadapa and Guntur were selected purposively based on highest number of
FFSs on Cotton crop during 2006-2007. (Table 3.1)
3.3.2 Selection of Mandals
Two mandals from each district were selected purposively based on highest
number of Cotton Farmers Field schools organized during 2006-2007. The list of
mandals are given below :
S.No District Mandal
1 Warangal Hasanparthy Nekkonda
2 Kadapa Porumamilla Kalasapadu
3 Guntur Tadikonda Amaravathi
3.3.2 Selection of Farmer Field Schools
One Farmer Field School was selected from each mandal,thus six FFSs were
selected for the study. The villages selected are presented given below:
S.No Mandal Village 1 Hasanparthy Seethampeta
Nekkonda Deekshakunta 2 Porumamilla Rajasahebpeta
Kalasapadu Rajupalem 3 Tadikonda Ponnekallu
Amaravathi Daranikota

Location of selected districts in Andhra Pradesh State

Location of Warangal District in A.P
Location of selected mandals in Warangal District

Location of Kadapa District in A.P.
Location of selected mandals in Kadapa District

Location of Guntur district in A.P
Location of selected mandals in Guntur District

3.3.3 Selection of respondents
180 FFS farmers (30 from one FFS) and 18 Extension officers (6 from each
district) selected purposively and 180 Non FFS farmers (30 from each village) were
selected by proportionate random sampling method for the study. Thus, a total of 360
farmers (180 FFS farmers and 180 Non FFS farmers) and 18 Extension officers from
three districts of A.P formed the sample of the study.
S.No Mandal Village No. of FFS Farmers
No. of Non FFS farmers
No. of Extension Officials
1 Hasanparthy Seethampeta 30 30 3
2 Nekkonda Deekshakunta 30 30 3
3 Porumamilla Rajasahebpeta 30 30 3
4 Kalasapadu Rajupalem 30 30 3
5 Tadikonda Ponnekallu 30 30 3
6 Amaravathi Daranikota 30 30 3
3.4 EMPIRICAL MEASUREMENT OF THE VARIABLES
Variables for this study were selected based on review of literature, in
consultation with the experts in the field and advisory committee members. The
variables which were found to have relevance to the present research, were included in
the study. Eleven independent variables were selected for this study for understanding
the characteristics of respondents, their relationship and extent of influence on the six
dependent variables namely, Attitude, Knowledge, Skills, Extent of adoption, Agro
ecosystem management and Decision making ability. The methods used for measuring
the variables are presented in the following Table 3.2

Table 3.2 : Variables and their empirical measurement
S. NO. VARIABLES EMPIRICAL MEASUREMENT
I. Independent Variables
Personal variables
1 Age In completed years
2 Education Scale developed by Venkatramaiah (1983) revised in (1990) with modifications
3 Experience in FFS and farming
In completed years
Socio-Economic variables
4 Farm size As per land reforms act.
5 Mass Media exposure Schedule developed for the study
6 Extension contact Scale developed by Byra Reddy (1971)
Psychological variables
7 Group orientation Schedule developed for the study
8 Market intelligence Schedule developed for the study
9 Risk orientation Scale developed by Supe [1969] with suitable modifications
10 Innovativeness Scale developed by Feaston (1968) with suitable modifications
11 Management orientation Scale developed by Samantha (1977) with suitable modifications
II. Dependent Variables
1 Attitude Scale developed for the study
2 Knowledge Test developed for the study
3 Skill Schedule developed for the study
4 Adoption Index developed for the study
5 Agro ecosystem management
Index developed for the study
6 Decision making ability Index developed for the study

3.4.1 Independent Variables
3.4.1.1 Age
Age of the respondents was operationalized as the number of completed years at
the time of enquiry. A Score of one was given to each completed year to obtain the age
of a respondent.
The respondents were later grouped as:
Young - below 35 years
Middle - 35 - 58 years
Old - above 58 years
These categories were expressed in terms of Frequencies and percentages at the
time of presentation of results.
3.4.1.2 Education
In the present study education was operationalised as formal education an
individual received. The educational status was noted against the category, composed
of the following.
Categories Score Illiterate 1
Primary school 2 High School 3
Intermediate 4 Graduate 5
Post graduate 6 3.4.1.3 Experience in FFS and Farming
Farming experience refers to number of completed years of the respondent’s
involvement in FFS and agriculture production and scores were assigned as given
below.

S.No. Category Score
a. Up to 1 year experience 1
b. 1-2 years experience 2
c. More than 2 years 3
After obtaining the scores, the respondents were arranged in three categories
based on mean and S.D.
S.No. Category Score
1. Low farming experience Below Mean – S.D
2. Medium farming experience Between Mean + S.D
3. High farming experience Above mean + S.D
3.4.1.4 Farm size
This variable was operationalized as the number of standard hectares possessed
by respondents at the time of enquiry.
The respondents individual scores were noted for calculation and based on the
scores obtained from land holdings, the respondents were classified into three groups as
follows.
Categories Score
1. Small farmers up to I ha [2.5 acres]
2. Medium farmers 1-2 ha[2.5 to 5.0 acres]
3. Large farmers Above 2 ha[5 acres]
As per section 8, sub-section (a) B of the Andhra Pradesh reforms (Ceiling on
Agricultural holdings ) Act No. 1 of 1973; the section 8 (1) B reads as follows:
___________ and for the purpose of computing the specified limit in case where
holdings of any person both wet and dry land one Hectare of wet land shall be deemed
to be equal to 2.5 acres of dry land.

3.4.1.5 Mass media exposure
Mass media exposure was operationalised as the extent of exposure to radio,
television, Newspaper, Agril. Magazines, C.D./D.V.Ds and Internet by respondents.
To measure the degree of exposure to mass media sources, each respondent was
asked to indicate on a six point continuum as to how often he/she got information about
improved farm practices from each of the sources. The scoring for the responses was
daily (5), weekly (4), fortnightly (3), once in a month (2), rarely (1) and never 0 were
given. The score for an individual respondent was obtained by adding the scores over
different sources.
The respondents were grouped into 3 categories based on mean and standard
deviation as follows:
S.No. Category Score range 1. Low Mass media exposure Below Mean – S D 2. Medium Mass media exposure Between Mean + S D 3. High Mass media exposure Above Mean +S D 3.4.1.6 Extension contact
Extension contact was operationlaised as the degree to which respondent
maintain contact with formal extension oraganisations like State department of
Agriculture, University scientists, N.G.Os, Polam badi master trainers, Adarshs ryhus
and Input dealers. The Scale developed by Byra Reddy (1971) was used with suitable
modifications for the study. The respondents were asked to check each agency they
meet during last six months .
Scoring Frequency Score Weekly 4 Fortnightly 3 Once in month 2 Rarely 1 Never 0

Based on the total score of the respondents, they were grouped as follows:
S.No. Category Score range
1. Low extension Contact Below Mean – S D
2. Medium extension Contact Between Mean + S D
3. High extension Contact Above Mean + S D
3.4.1.7 Group orientation
Group orientation was operationalized as the degree to which the farmer was
oriented towards group for achieving common goal and in adopting new ideas in FFS.
The schedule was developed for quantifying the variable. The schedule consists of
eight statements, of which 1,2,4,5 were negative and rest were positive. These items
were quantified on three point responsive categories i.e. True, Somewhat true and Not
true
Response
Score True Somewhat true Not true
Positive 3 2 1
Negative 1 2 3
Based on the total score of the respondents, they were grouped as follows:
S.No. Category Score range
1. Low group orientation Below Mean – S D
2. Medium group orientation Between Mean + S D
3. High group orientation Above Mean + S D
3.4.1.8 Market intelligence
Market intelligence is operationalized as the process of acquiring and analyzing
information in order to understand the market to determine the current and future needs
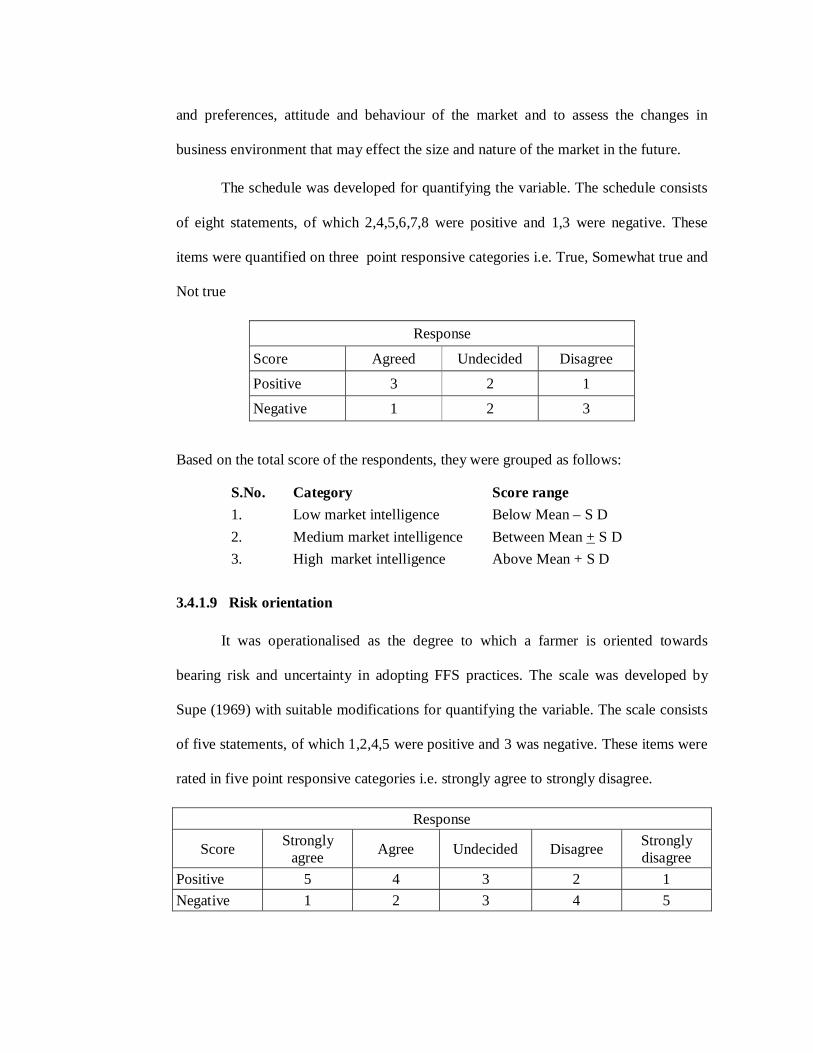
and preferences, attitude and behaviour of the market and to assess the changes in
business environment that may effect the size and nature of the market in the future.
The schedule was developed for quantifying the variable. The schedule consists
of eight statements, of which 2,4,5,6,7,8 were positive and 1,3 were negative. These
items were quantified on three point responsive categories i.e. True, Somewhat true and
Not true
Response
Score Agreed Undecided Disagree
Positive 3 2 1
Negative 1 2 3
Based on the total score of the respondents, they were grouped as follows:
S.No. Category Score range 1. Low market intelligence Below Mean – S D 2. Medium market intelligence Between Mean + S D 3. High market intelligence Above Mean + S D 3.4.1.9 Risk orientation
It was operationalised as the degree to which a farmer is oriented towards
bearing risk and uncertainty in adopting FFS practices. The scale was developed by
Supe (1969) with suitable modifications for quantifying the variable. The scale consists
of five statements, of which 1,2,4,5 were positive and 3 was negative. These items were
rated in five point responsive categories i.e. strongly agree to strongly disagree.
Response
Score Strongly agree Agree Undecided Disagree Strongly
disagree Positive 5 4 3 2 1 Negative 1 2 3 4 5

The final score was calculated by simple addition of all the scores ,the
respondents were categorized as followed by keeping mean + S D
S.No. Category Score range 1. Low risk orientation Below Mean – S D
2. Medium orientation Between mean + S D
3. High orientation Above Mean + S D
3.4.1.10 Innovativeness
It was operationalised as the degree to which an individual adopts new ideas and
new information related to FFS practices. The innovativeness scale developed by
Feaston (1968) was adopted with slight modifications. It consists of nine items, of
which 1,2,3,4,6 were positive and 5,7,8,9 were negative. These items were quantified on
three point responsive categories i.e. True, Somewhat true and Not true
Response
Score Agreed Undecided Disagree
Positive 3 2 1
Negative 1 2 3
The final score was calculated by simple addition of all the scores ,the
respondents were categorized as followed by keeping mean + S D
S.No. Category Score range 1. Low innovativeness Below Mean – S D
2. Medium innovativeness Between mean + S D
3. High innovativeness Above Mean + S D

3.4.1.11 Management orientation
Management orientation was operationalized as the degree to which a farmer
was oriented towards scientific farm management comprising of planning, production
and marketing functions of his farm enterprise. The scale developed by Samantha
(1977) was used for the study. The scale consists of 3 sub sections i.e Planning
orientation with 4 positive and 3 negative statements, Production orientation with 2
negative and 8 positive statements, and Marketing orientation with 6 positive and one
negative statements. The scale with three sub scales was administered to the
respondents with three responsive continuum viz., ‘agree’ ‘undecided’ and ‘disagree’
All the above three variables were measured on three point continuum of agree,
undecided and disagree with weights of 3, 2 and 1 for positive statements and 1, 2 and 3
for negative statements, respectively.
The summation of scores of each sub-scale constitutes the total score on
management orientation of each farmer.
After summation of all scores obtained the farmers were grouped into three
categories based on the mean and standard deviation.
S.No. Category Score range 1. Low Management orientation Below Mean – S D 2. Medium Management orientation Between Mean + S D 3. High Management orientation Above Mean + S D
3.4.2 Dependent variables
3.4.2.1. Attitude
Attitude is a precondition factor for any action. Attitude of an individual plays
an important role in determining ones behavior with respect to a particular

psychological object. For any programme to be successful, it is needless to say that the
clients should have a favourable attitude towards that programme. According Allport
(1935) “an attitude is a mental and neutral state of readiness, organized through
experience, exerting a directive or dynamic influence upon the individual’s response to
all objects and situations with which it is related”. Thurstone (1946) explained that the
affective component of an attitude, which gives a motivating character, serves as a link
between cognition and action tendencies. An upshot of this fact the farmers’ attitude
towards FFS will largely determine the nature and extent of their involvement and
participation in the programme. Attitude of farmers towards the FFS programme is of
crucial importance in explaining the extent to which they use its benefits. It is therefore
necessary to measure the attitude of farmers towards FFS and take such steps as they are
required to make the programme successful
3.4.2.1.1. Methodology: The method of summated rating scale suggested by Likert
(1932) and Edwards was followed in the construction of attitude scale.
3.4.2.1.2 Collection of Statements: Statements covering all aspects of farmers towards
Farmers field school were collected with the help of available literature, consultation
with experts in the area of FFS and with the help of resource personnel. As such 92
statements representing the attitude of farmers towards FFS were collected.
3.4.2.1.3 Editing the statements : The statements were then edited according to the
criterion given by Edwards (1957).Out of 92 statements ,85 statements which satisfied
the criterion were selected.
3.4.2.1.4. Selection of items: The above 85 statements were then administered to a
group of 60 respondents. The respondents were asked to indicate their degree of
agreement or disagreement with each statement on a five continuum ranging from

Strongly agree to strongly disagree. The scores for the positive statements were
assigned as Strongly agree (5), Agree (4), Undecided (3), Disagree (2) and Strongly
disagree (1).The scoring for negative statements was reversed. The total score for each
of the respondent was the sum of scores of all the items.
The subjects were then arranged in an array based on the total score obtained by
them. The top 25 per cent of the subjects with highest score (High group) and 25 per
cent of the subjects with lowest score (Low group) were used as criterion groups.
3.4.2.1.5 Calculation of ‘t’ value
To evaluate individual statement, the critical ratio i.e. t-value which is a measure
of the t-unit to which a given statement differentiates between the high and low group of
respondents for each statement was calculated by using the formula suggested by
Edwards (1957).
XH- XL t = -------------------------------- --------------------------- (XH- XH) 2 + (XL –XL) 2
-------------------------- N (n-1)
Where,
(XH - XH)2 = XH-2 – (XH)2
(XL – XL)2 = X-2 – (XL)2
XH = The mean score on a given statement for the high group XL = The mean score on a given statement for the low group XH
2 = Sum of squares of the individual score on a given statement for High group XL
2 = Sum of squares of the individual score on a given statement for Low group XH = Summation of scores on a given statement for High group
XL = Summation of scores on a given statement for low group n = no. of respondents for in each group = Summation 3.4.2.1.6 Selection of Attitude statements for final scale
After computing the “t” value for all the items (Appendix.2) 25 statements
comprising of 15 positive and 10 negative statements with highest t value equal to or
greater than 1.75 were finally selected and included in the attitude scale.
3.4.2.1.7Scoring techniques: The items on the attitude scale were provided with 5
point psychological continuum i.e. Strongly agree, Agree, Undecided, Disagree and
Strongly disagree with weights of 5, 4, 3, 2, and 1 respectively for the positive
statements and 1,2,3,4, and 5 for the negative statements. The attitude score of the
respondents could be obtained by summing up the scores for all the items in the scale.
3.4.1.2.8 Validity: Validity of a scale is the property that ensures that the obtained scale
measures the variables it is supposed to measure. The validity of the scale was tested
using the Content validity.
3.4.1.2.9 Content validity. The scale was examined for the content validity by
determining how well the content of the scale represented the subject matter under
study. As all the possible items covering the universe of content were selected by
discussing with experts, Subject matter specialists and from all the available literature
on the subject, the scale satisfied the content validity.
3.4.1.2.10 Reliability: A scale is reliable only when it gives consistently the same
results when applied to the same sample. The reliability of the scale was found out by
using Test and Re-Test method .The scale is administered to a fresh group of 60

respondents (Excluding sample area).After a period of 15 days the scale was again
administered to the same respondents and thus two sets of score were obtained. The
reliability coefficient was found to be 0.86 which indicate that the scale is reliable.
3.4.1.2.11 Administration of Scale
The twenty five attitude statements were translated into Telugu and administered
to the sampled Farmers Field Schools farmers and Non FFS farmers of 6 farmers field
schools comprising of 3 districts for studying the attitude of the farmers. Each
statement was read out to the respondents by the investigator and the response to each
statement in terms of their own degree of agreement or disagreement was noted down in
the proper column with a () mark.
The score for each individual in the scale was computed by summing up the
weights of individual item response. The possible attitude score was 25 to 125.
3.4.2.1.12 Classification of respondents
Based on the attitude score obtained the farmers were grouped into three
categories by using mean and standard deviation.
S.No. Category Score range
1. Less favourable attitude Below Mean – S.D
2. Moderately favorable attitude Between mean + S.D
3. More favorable attitude Above Mean + S.D
3.4.2.2 Knowledge
In the present study, Knowledge was operationalised as the quantum of eco
friendly farming practices known to farmers in order to protect the natural resources in
the Farmers Field School area. The main objective of the study was to find out
knowledge levels of FFS farmers and Non FFS farmers about Cotton integrated crop
management practices.
3.4.2.2.1 Construction of knowledge test
Collection of items
The content of the test was composed of questions called items. A
comprehensive list of knowledge questions on Cotton management practices i.e., with
special emphasis on Integrated Crop Management practices was prepared by study of
relevant literature, consulting officials of extension staff of state department of
Agriculture who have experience in Cotton FFS.
3.4.2.2.2 Selection of items
The selection of items was done on the basis of the following criteria.
1. Response to items should promote thinking than routine memorization
2. They should differentiate the well informed respondent from less informed and
should have certain difficulty value.
3. The items included should cover all areas of knowledge about integrated crop
production technology in Cotton.
By using above criteria, 42 items were selected for developing knowledge test,
after editing carefully and by subjecting them to expert’s endorsement, given in
Appendix3. The experts consists Extension specialists, master trainers who train
the farmers of Farmers Field School of Dept. of Agriculture, Advisory
committee and experienced farmers in cotton cultivation.
3.4.2.2.3 Form of questions
The items selected for the construction of knowledge test on Integrated crop
management practices in Cotton were framed in the objective form of questions namely

multiple choice, fill in the blanks, True or false and yes or No. The particulars on the
type of questions were furnished in the Appendix 4.
3.4.2.2.4 Pre-testing
The items selected for the knowledge test were pre-tested separately by
administering the items to 30 respondents. Care was taken to see that selection of
matching sample of 30 respondents from outside the main sample of this study.
3.4.2.2.5 Item analysis
Item analysis was carried out by administering the pre-tested items to 30
respondents (selected at random) who are growing Cotton crop. Care was taken to see
that they were outside the main sample for this investigation.
Item analysis was carried out to yield two kinds of information i.e index of Item
difficulty and index of Item discrimination. The index of ‘item discrimination’ provided
information on how well an item measures or discriminates ,where as the ‘Item
difficulty ‘ indicates the extent to which an item was difficult .The function of the item
discrimination index was used to find out whether an item really discriminates a well
informed respondent from poorly informed respondent.
The data thus obtained was subjected for typical item analysis. The 42 test items
were administered to each one of the 30 respondents .The scores allotted were ‘one’ for
correct answer and ‘zero’ for incorrect response. After computing the total scores were
obtained for each of the 30 respondents on 42 items. They were arranged in order from
highest score to lowest .Based on which the respondents were then divided into six
equal groups. These groups were labeled as G1, G2, G3, G4, G5 and G6 with five
respondents in each group. For the purpose of item analysis, middle two groups G3 and
G4 were eliminated keeping only four extreme groups with high and low scores.

After getting the four extreme groups for item analysis, the responses for each of
the items were subjected to calculate difficulty index, discrimination power and point
biserial correlation as shown below.
3.4.2.2.6 Item difficulty index (P)
The item difficulty index was worked out as the percentage of respondents
answering an item correctly. The assumption of the item difficulty index was that, the
difficulty is linearly related to the level of respondent’s knowledge about recommended
practices. The items with ‘P’ values ranging from 20 to 80 were considered for the final
selection of the knowledge test battery.
Difficulty Index was computed by using the following formula and presented in
Appendix.3
No. of respondents answering correctly x 100 Difficulty index = -------------------------------------------------------------------- Total no. of respondents
3.4.2.2.7 Discrimination index (E 1/3)
The second criterion for item selection was the item discrimination index
indicated by ‘E 1/3’ which is calculated by the formula.
(S1+S2) – (S5+S6) E1/3 = ----------------------------- N/3
Where S1, S2, and S5 S6 are the frequencies of correct answers in groups G1,
G2, G5 and G6, respectively. N is the total number of respondents of the sample
selected for items analysis that is 30. The value of the discrimination index for the
knowledge items on Cotton management practices with special emphasis on Integrated

Crop Management practices in Farmers Field Schools area were presented in
Appendix.3
The items with E 1/3 value ranging from 0.2 to 0.8 were considered for the final
selection of knowledge test.
3.4.2.2.8 Point biserial correlation (r pbis)
The main aim of calculating Point biserial correlation ( rpbis ) was to work the
internal consistency of the items i.e., the relationship of the total score to a
dichotomized answer to any given item. In a way, the validity power of the item was
computed by the correlation of the individual item of preliminary knowledge test
calculated by using following formula presented in Appendix.
Mp - MQ
r pbis = ------------------------------- X / PQ
S.D. Where,
r pbis = point biserial correction coefficient
MP = Mean of the total scores of the respondents who answered the item
correctly or
Sum of total of XY MP = ---------------------------------------- Total number of correct answers
MQ = Mean of the total scores of the respondents who answered the item
incorrectly or
Sum total of X - Sum total of XY MQ = ------------------------------------------------ Total number of wrong answers
S.D = Standard deviation of entire sample
P = Proportion of respondents giving correct answer to the item

Total number of correct answers P = ----------------------------------------------------- Total number of respondents
Q = Proportion of respondents giving incorrect answer to the item
Q = 1 – P
X = Total score of the respondent for all items
Y = Response of the individual for the items
(Correct=1 Incorrect=0)
XY = Total score of the respondent multiplied by the response of the individual
to the item
(Correct=1 : Incorrect=0)
Items having significant point bi serial correlation at 1% and 5% level were
selected for final knowledge test.
Representativeness of the test
Care was taken to see that the test items selected finally covered the entire
universe of the relevant behavioural aspects of respondent’s knowledge about
recommended cotton ICM practices.
3.4.2.2.9 Selection of the items Out of 42 items ,30 items were finally selected based on
1. Items with difficulty level indices ranging from 20 to 80
2. Items with discrimination indices ranging from 0.20 to0.80
3. Items having significant point biserial correlation either at 1 percent or 5 percent
level

Thus, the finally selected knowledge items comprising 4 types of questions i.e
multiple choice ,fill in the blanks , Yes or No and True or False ,totaling to 30 items of
test battery on knowledge of cotton ICM practices.
The final knowledge test items selected for the test are given in the interview
schedule furnished in Appendix – 1
3.4.2.2.10 Reliability of the test
The test was administered to 30 respondents separately with an interval of 15
days .The two sets knowledge scores obtained by the farmers were correlated. The
correlation co-efficient (r=0.85) was highly significant indicating a high degree of
dependability of the instrument for measuring knowledge of the farmers.
3.4.2.2.11 Validity of the test
Knowledge test developed on cotton production technology with special
emphasis on Integrated Crop Management practices in Farmers field Schools area was
subjected to content and construct validity. The construct validity of the test items was
tested by the method of point biserial correlation (rpbis). The items have significant
values at 1% and 5% level indicated the validity of the test.
The content validity of knowledge test was derived a long list of test items
representing the whole universe of recommended practices of ICM on Cotton crop
collected from various sources as discussed earlier. It was assumed that the score
obtained by administering the knowledge test of this study measures what was intended
to measure.
Thus the knowledge test developed in the present study can measure the
knowledge of FFS farmers on ICM Cotton as it showed the greater degree of reliability
and validity.

3.4.2.2.12 Administration of the test
All the 30 items in the knowledge test read out to the respondents after
establishing rapport with them. The respondents were asked to answer the items by
themselves.
Scoring procedure : A score of one and zero given for correct and wrong answer for
each item respectively and the total number of correct responses given by a respondent
out of the 30 items was the knowledge score obtained by him or her. Thus the maximum
minimum possible score for a respondent were 30 and Zero respectively.
3.4.2.2.13 Categorization of the respondents
After arriving knowledge scores, the respondents were grouped into three
categories based on mean and standard deviation.
S.No. Category Score range
1. Low Knowledge Below Mean – S.D.
2. Medium Knowledge Between Mean + S.D.
3. High Knowledge Above Mean + S.D.
3.4.2.3 Skill
Skill was operationalised as the ability of the respondent to perform selected
skills in the field situation.
The respondents were asked to indicate skills learnt through FFS programme
and were recorded on a three point continuum as fully confident, partially confident and
not confident through personal interview by the investigator. A score of two was
assigned to fully confident, one was assigned to partially confident and Zero was
assigned to not confident items.

Based on the total score obtained by the respondents, they were grouped into
following three categories by taking mean and standard deviation into consideration.
S.No. Category Score range
1. Less Skilled Below Mean – S.D
2. Medium Skilled Between Mean + S.D
3. High Skilled Above Mean + S.D
3.4.2.4 Extent of Adoption
It was opertionalised as the degree to which farmers adopt the recommended
FFS Cotton Integrated crop management practices in his own field.
An index of extent of adoption FFS Cotton was constructed based on extensive
review of literature and in consultation with FFS experts. The index consists of 4 parts
i.e Experiments adopted (13 items), Adoption of principles of IPM package (13 items).
General management practices of Cotton (9 items) and Farmer expert (15 items). The
adoption was measured on two point continuum i.e Fully adopted and Not adopted by
assigning 2 and 1 respectively. Thus the total score for each respondent was obtained by
summing up the scores on all items, which ranged from 0-50. Then adoption index for
each individual was worked out by using the formula used by Sengupta (1967)
No. of practices adopted Adoption Index = -------------------------------------------- x 100 No. of practices recommended
Based on the adoption index obtained, farmers were then grouped in to three
categories as shown below using mean and Standard deviation.

S.No. Category Score range
1. Low adoption Below Mean – S.D.
2. Medium adoption Between Mean + S.D
3. High adoption Above Mean + S.D
3.4.2.5 Agro ecosystem management
Agro ecosystem management was defined as tool that provide integration and
synthesis of soil test results, management priorities, and environmental concerns. An
index of Agro ecosystem management in FFS Cotton was constructed based on
extensive review of literature and in consultation with FFS experts. The index consists
of 4 parts i.e Pest and defender management (8 items), Input management (7 items),
Bio diversity conservation (11items) and ITKs practices used. The Agro ecosystem
management was measured on dichotomous continuum i.e Yes and No by assigning 1
and 0 respectively. Thus the total score for each respondent was obtained by summing
up the scores on all items, which ranged from 0-26.
Based on the total score obtained, farmers were then grouped into three
categories as shown below using mean and Standard deviation.
S.No. Category Score range
1. Low agro eco system management Below Mean – S.D.
2. Medium agro eco system management Between Mean + S.D
3. High agro eco system management Above Mean + S.D
3.4.2.6 Decision Making Ability
It was operationalised as the degree to which an individual justifies his selection
of the most efficient means from among the available alternatives on the basis of
scientific criteria for achieving maximum economic profits. After scrutinizing the
decision areas and checking the relevancy with learned people, some items were
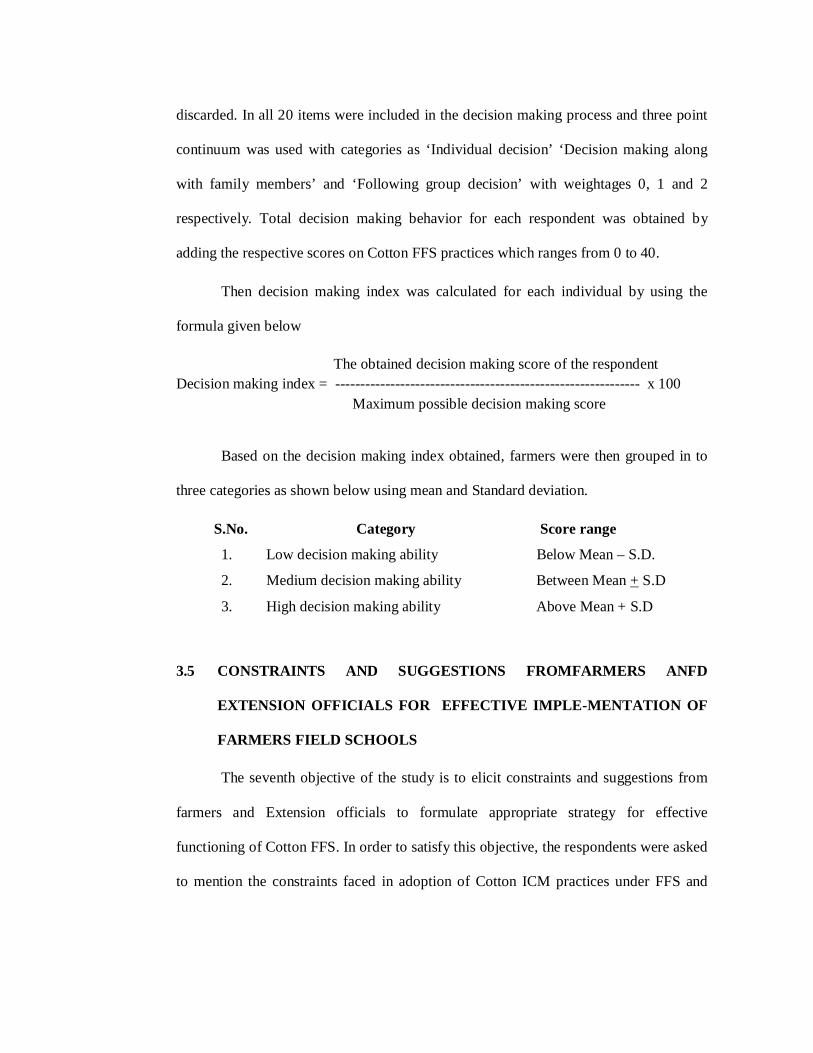
discarded. In all 20 items were included in the decision making process and three point
continuum was used with categories as ‘Individual decision’ ‘Decision making along
with family members’ and ‘Following group decision’ with weightages 0, 1 and 2
respectively. Total decision making behavior for each respondent was obtained by
adding the respective scores on Cotton FFS practices which ranges from 0 to 40.
Then decision making index was calculated for each individual by using the
formula given below
The obtained decision making score of the respondent Decision making index = ------------------------------------------------------------- x 100
Maximum possible decision making score
Based on the decision making index obtained, farmers were then grouped in to
three categories as shown below using mean and Standard deviation.
S.No. Category Score range
1. Low decision making ability Below Mean – S.D.
2. Medium decision making ability Between Mean + S.D
3. High decision making ability Above Mean + S.D
3.5 CONSTRAINTS AND SUGGESTIONS FROMFARMERS ANFD
EXTENSION OFFICIALS FOR EFFECTIVE IMPLE-MENTATION OF
FARMERS FIELD SCHOOLS
The seventh objective of the study is to elicit constraints and suggestions from
farmers and Extension officials to formulate appropriate strategy for effective
functioning of Cotton FFS. In order to satisfy this objective, the respondents were asked
to mention the constraints faced in adoption of Cotton ICM practices under FFS and

suggestions for successful implementation of FFS. The responses were then ranked
based on the frequency and percentage for significant elucidation.
3.6 TOOLS FOR DATA COLLECTION
3.6.1 Development of interview schedule
Data were collected from the respondents by using an interview schedule
developed for the study based on the objectives. The schedule thus constructed was
administered in non sample area by interviewing 30 Cotton farmers. Based on the
experience gained during pre testing, the schedule layout, question structure and their
sequence were modified. The interview schedule is furnished in Appendix-1. The
schedule later translated in to Telugu, the local language of the area of study for
eliciting responses from the farmers without difficulty.
The schedule was designed in to 3 parts. Part A consists of personal, socio-
economic and psychological characteristics of the respondents; part B include Attitude,
Knowledge, Skills, Extent of Adoption ,Agro ecosystem management and Decision
making ability and part C is designed to measure constraints faced in adoption of Cotton
ICM practices under FFS and suggestions for successful implementation of FFS. The
complete schedule is appended at Appendix-A of the thesis.
3.6.2 Establishing rapport
Establishing rapport with the farmers was the very important task for any
investigation of social science. Hence, initially informal contacts were made with the
farmers with the help of local leaders of the villages by taking the assistance of
Agriculture officers and scientists of DAATT centers namely Warangal, Kadapa and

Guntur. An atmosphere of friendliness and familiarity was created with farmers,
through informal talks pertaining to general problems. All these methods were
extremely helpful in not only building up rapport but also resulted in obtaining valid
and reliable information.
3.6.3 Data collection
The investigator interviewed all the selected respondents personally and data
were recorded directly on the schedule, which enabled to get first hand information and
gave an opportunity to observe the reactions of farmers. Friendly atmosphere was
maintained during the interview to see that the respondents were at ease and expressed
their opinion without restraint personally by the researcher in local language with the
help of the interview schedule and the data was recorded directly in the schedule. It was
made sure that the respondents correctly understood the questions in the interview
schedule by repeating the questions wherever necessary.
3.6.4 Data Analysis procedure
The data collected from all respondents were coded and tabulated .Then data
were subjected to different statistical tests keeping in view the objectives of the study.
The findings emerge out of data analysis were interpreted, discussed and necessary
inferences and conclusions were drawn.
3.7 STATISTICAL TESTS USED TO ANALYZE THE DATA
Following statistical tests and analytical procedures were used for analysis of
the data of the present investigation.
3.7.1 Arithmetic mean (X)
The arithmetic mean is the quotient that results when the sum of all the items
scores divided by the number of items (n).

∑ X X = ----------- N Where, X = Arithmetic mean ∑ X = sum of scores n = number of respondents
3.7.2 Frequency and percentage
Some of the data were subjected to frequencies and percentages and used to
know the distribution of respondents according to variables.
3.7.3 Standard deviation (S.D.)
Standard deviation is the square root of the mean of the sum of the squares of the
deviation taken from the mean of the distribution.
Where,
1 (∑x)2 = ------- ∑X2 - ---------- n n Where,
= Standard deviation
∑X = sum of the deviation of the scores from mean
n = number of items
3.7.4 Pearson’s correlation coefficient (r)
Pearson’s correlation coefficient was used to find out the relationship between
the scores of variables.
(∑X) (∑Y) ∑XY -- ------------------- n r = ----------------------------------------------------- (∑X)2 (∑Y)2
(∑X2 -----------------) ( ∑Y2 --------------) n n Where, r = Co-efficient correlation between x and Y
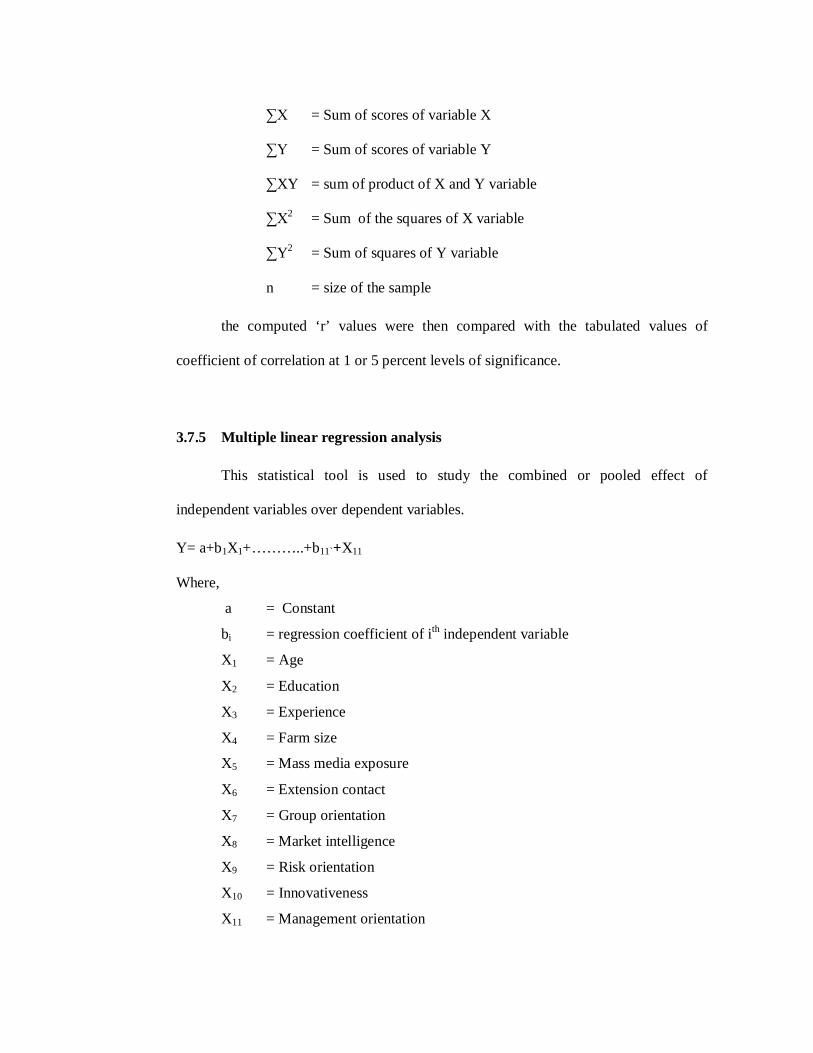
∑X = Sum of scores of variable X
∑Y = Sum of scores of variable Y
∑XY = sum of product of X and Y variable
∑X2 = Sum of the squares of X variable
∑Y2 = Sum of squares of Y variable
n = size of the sample
the computed ‘r’ values were then compared with the tabulated values of
coefficient of correlation at 1 or 5 percent levels of significance.
3.7.5 Multiple linear regression analysis
This statistical tool is used to study the combined or pooled effect of
independent variables over dependent variables.
Y= a+b1X1+………..+b11`+X11
Where,
a = Constant
bi = regression coefficient of ith independent variable
X1 = Age
X2 = Education
X3 = Experience
X4 = Farm size
X5 = Mass media exposure
X6 = Extension contact
X7 = Group orientation
X8 = Market intelligence
X9 = Risk orientation
X10 = Innovativeness
X11 = Management orientation

And the dependent variables (Y) for the regression equation are
Y1 = Attitude
Y2 = Knowledge
Y3 = Skill
Y4 = Extent of adoption
Y5 = Agro ecosystem management
Y6 = Decision making ability
The regression coefficient bi were tested for their significance by computing the
following formula :
| bi | t (n-k-1) d.f = -------------- SE (bi) Where,
n is the number of observations
k is the number of independent variables
SE is the standard error
bi is the regression coefficient, and ‘t’ is the test criterion for significance.
Coefficient of multiple determinations (R2) was calculated by
Regression sum of Squares (RSS) R2 = ------------------------------------------------ Total sum of squares (TSS)
R2 is always less than unity and expressed in percentage. It indicate the extent of
variation in dependent variable (Y) that is explained by the independent variables (Xi) in
the regression equation r.

3.7.6 ‘Z’ Test
‘Z’ test has used to test the significant difference between two sample means in
respect of dependent variable of respondent i.e. FFS farmers and non FFS farmers. ‘Z’
value has been calculated by the following formula.
| X1 –- X2 | Z = ------------------- S1
2 S2 2
------ + ------- n1 n2
Where,
X1 = Mean of the first sample
X2 = Mean of the second sample
S12 = Variance of first sample
S22 = Variance of second sample
n11
= No. of individuals in first sample
n22
= No. of individuals in second sample
The computed ‘Z’ values were compared with the table value at 1% and 5%
level of significance from Standard Normal Distribution Tables for drawing meaningful
conclusions.
All the above procedures were worked out by feeding the processed data into
computer.

Table : 3.1 . District wise ICDP Cotton FFS programmes conducted during
(2006-2007)
S.No District /Region Target [No. of FFS]
Achievement Remarks
Andhra region
1 Srikakaulam 0 0 2 Vizianagaram 2 2 3 Visakhapatnam 2 2 4 East Godavari 0 0 5 West Godavari 0 0 6 Krishna 14 14 7 Guntur 62 62 Selected for study 8 Prakasam 12 12 9 Nellore 0 0 Rayalaseema region 10 Kurnool 2 1 11 Ananthapur 0 0 12 Kadapa 12 10 Selected for study 13 Chittoor 0 0 Telangana region 14 Rangareddy 27 27 15 Nizamabad 0 0 16 Medak 28 28 17 Mahaboobnagar 36 36 18 Nalgonda 57 57 19 Warangal 73 73 Selected for study 20 Khammam 70 70 21 Karimnagar 43 43 22 Adilabad 67 67 Total 510 504
CHAPTER IV
RESULTS AND DISCUSSION
This chapter highlights the findings of the investigation with reference to the
objectives of the study. The data collected were coded, analysed, interpreted and
meaningful conclusions were drawn based on the results obtained are presented under
the following heads.
4.1. Profile characteristics of the FFS and Non FFS farmers
4.2 Attitude of FFS and Non FFS farmers towards FFS programme
4.3 Level of knowledge of FFS farmers and Non FFS farmer towards Cotton
integrated crop management practices.
4.4 Skill level of FFS and Non FFS farmers in Cotton
4.5 Extent of adoption of Cotton ICM practices by FFS and non FFS
4.6 Agro ecosystem management by FFS and Non FFS farmers
4.7 Level of Decision making by FFS and Non FFS farmers
4.8 Documentation of ITKS in Cotton FFS
4.9 Relationship between the selected personal, socio-economic, psychological
characteristics and empowerment in terms of Attitude, Knowledge, Skill, Extent of
adoption, Agro ecosystem management and Decision making.
4.10 Constraints and suggestions from FFS farmers and Extension officials to
formulate appropriate strategies for effective functioning.
4.11. Empirical model of the study

4.1 PROFILE CHARACTERISTICS OF THE FFS AND NON FFS FARMERS
The distribution of respondents into different categorized based on their selected
profile of characteristics were presented in the following tables and interpreted
frequencies, percentages, mean and standard deviation.
4.1.1 Age
As per the chronological age of respondents they were grouped into three
categories namely young, middle and old age. The distribution of respondents according
to age is given in Table 4.1.
It is clear from the above table that majority of FFS farmers belonged to middle
age (70.00%) followed by young (36.66%) and old age (2.3%) , whereas in case of
Non FFS farmers 67.77 percent belonged to middle age followed by 26.66 percent
young and 4.6 percent old age group.
District wise distribution shows that in Warangal district majority (58.33 %) of
FFS farmers belonged to middle age followed by 40.00 percent in young age and 1.66
percent old aged category and incase of Non FFS majority 70.00 percent belonged to
middle age, 21.66 percent of them belonged to young and 5 percent to old age category.
In Kadapa district majority (86.66 %) of FFS farmers belonged to middle age
followed by 10.00 percent in young age and 3.33 percent old aged category and incase
of Non FFS majority 73.33 percent belonged to middle age, 21.66 percent of them
belonged to young and 5 percent to old age category.
In Guntur district majority (65.00 %) of FFS farmers belonged to middle age
followed by 33.33 percent in young age and 1.66 percent old aged category and incase

of Non FFS majority 60.00 percent belonged to middle age, 36.66 percent of them
belonged to young and 3.33 percent to old age category.
An insight of table 4.1. reveals that majority of respondents belonged to
middle age group both in case FFS and Non FFS farmers .The probable reason for such
distribution might be middle and young aged persons actively involved in the training
programmes of FFS in Cotton. The other reason was Cotton FFS requires frequent
monitoring of field, recording observations on weekly basis as when class is conducted.
This finding is in consistent with Ravichandra Prasad (2002).
4.1.2 Education
Based on education, the FFS and Non FFS farmers were grouped in to six
categories The distribution is presented in Table 4.2
From the above table 4.2 it could be concluded that majority of FFS farmers
belonged to high school education (38.33%), followed by intermediate education
(22.22%), primary school education (20.55%), graduate education (10.00%) and
illiterate (8.8 %). In case of Non FFS respondents majority were educated up to primary
school (40.00%), followed by illiterate (30.00%), high school (22.2%), intermediate
(6.66%) and graduates (1.11%).
District wise distribution shows that in Warangal district majority (31.66 %) of
FFS farmers educated upto high school level, followed by intermediate education
(23.33%), illiterate (18.33%), primary school education 16.66%) and graduates
(10.00%) and incase of Non FFS majority 46.66 percent educated up to primary school,
25.00 percent of them illiterate, 21.66 percent high school, 5 percent intermediate and
1.66 per cent graduated.

In Kadapa district majority (43.33 %) of FFS farmers belonged to high school
education followed by primary school (23.33%), intermediate (18.3%), graduation
(13.33%) and illiterate (1.66%) and incase of Non FFS majority 35.00 percent were
illiterate followed by 28 percent, 26.66 percent, 8.3 percent and 1.66 percent belonged
to high school, primary, intermediate and graduate education.
In Guntur district majority (40.00 %) of FFS farmers belonged to high school
education followed by intermediate (25.00 %), primary (21.66% ), graduate (6.6%) and
illiterate (6.6%) respectively. Whereas in case of Non FFS, majority 46.66 percent
belonged to primary education, 30.00 percent of them illiterate, 16.66 percent high
school and 6.66 percent intermediate education.
An insight of table 4.2 reveals that majority of respondents belonged to high
school education, intermediate education and primary education level incase of FFS.
The probable intention for such distribution might be during selection in to FFS group
the officials might have given more emphasis to educated farmers. The focus was after
completion of FFS programme these should act as facilitators for next FFS in that
village. This finding is in consistent with Madavilatha (2002) and Natarajan (2004).
4.1.3 Experience in farming
Based on farming experience, the FFS and Non FFS farmers were grouped into
three categories. The distribution is given in the given Table 4.3.
It was evident from the Table that majority (51.11%) of FFS farmers had 3-13
years of experience in farming followed by 14-27 years (35.55%) and 27 years above
(7.77%). In case of Non FFS respondents, majority were under 3-13 years category
(50.55%) , 14-27 years (31.66%) and 27 years above (17.7%) respectively.

District wise distribution shows that in Warangal district majority (56.66 %) of
FFS farmers had 3-13 years of experience followed by 14-27 years (30.00%) and 27
year above (13.33%) and in case of Non FFS majority 53.33 percent had 3-13 years of
experience followed by 38.33 percent above 27 years and 8.33 percent 14-27 years.
In Kadapa district, majority (58.33 %) of FFS farmers had 14-27 years of
experience followed by 3-13 years (31.66%) and 27 year above (10.00%) and incase of
Non FFS majority 45.00 percent had 14-27 years of experience followed by 41.66
percent 3-13 years and 13.33 percent 27 year above.
In Guntur district majority (65.00 %) of FFS farmers had 3-13 years of
experience followed by 14-27 years (35.00%) and incase of Non FFS majority 56.66
percent had 3-13 years of experience followed by 41.66 percent 14- 27 years and 1.66
percent 27 years above.
An insight of table 4.3 reveals that majority of respondents both in FFS and
Non FFS belonged to 3-13 years of experience category followed by 14-27 years’
experience category in farming. This shows clear indication that majority of farmers
were young and middle aged therefore they had 3-13 years of experience in farming and
one year experience in FFS. This finding is in consistent with Reddy (2003), Sarada
(2004) and Obaiah (2004)
4.1.4 Farm size
Based on farm size the FFS and Non FFS farmers were grouped in to three
categories. The distribution is presented in Table 4.4.
From the above table, it could be concluded that majority (61.66%) of FFS
respondents were small farmers followed by big (22.22%) and marginal (16.11%). In
case of Non FFS respondents, majority (52.77%) were small followed by marginal
(33.33%) and big (13.88%) respectively.
District wise distribution shows that in Warangal district majority (73.33 %) of
FFS farmers had small farm size followed by marginal (18.33%) and big (8.33%) and in
case of Non FFS majority 58.33 percent were small followed by 31.66 percent
marginal and 8.33 percent big farmers.
In Kadapa district majority (55.00 %) of FFS farmers had small farm size
followed by big (36.66%) and marginal (8.33%) and incase of Non FFS majority 41.66
percent were small followed by 38.33 percent marginal and 20.00 percent big farmers.
In Guntur district majority (56.66 %) of FFS farmers had small farm size
followed by marginal and big (21.66%) and incase of Non FFS majority 58.33 percent
were small followed by 30.00 percent marginal and 11.66 percent big farmers.
It was clear from the Table 4.4 that majority of FFS respondents belonged to
small farmers. The probable reason might be the small and marginal farmers were given
importance in selection for the FFS. This finding is in consistent with Sivanandan
(2002) and Natarajan (2004)
4.1.5 Mass media exposure
Based on mass media exposure, the FFS and Non FFS farmers were grouped in
to three categories The distribution is given in Table 4.5.
It could be observed from the Table 4.5 that 59.44 percent of FFS farmers had
medium level of mass media exposure followed by 22.77 percent low and 17.77 high. In
case of Non FFS farmers, majority (37.77%) medium level of exposure followed by
low (36.60%) and high mass media exposure (25.55%) respectively.

District wise distribution shows that in Warangal district majority (61.66 %) of
FFS farmers had medium level mass media exposure followed by low (20.00%) and
high (18.33%) and incase of Non FFS majority 38.33 percent medium and low
followed by 23.33 high mass media exposure.
In Kadapa district, majority (60.00 %) of FFS farmers had medium level of
mass media exposure followed by low (26.66%) and high (13.33%) and incase of Non
FFS majority (43.33 percent) were low followed by 28.33 percent medium and high
mass media exposure.
In Guntur district majority (56.66 %) of FFS farmers had medium level of mass
media exposure followed by low and high (21.66%) and in case of Non FFS majority
46.66 percent were medium followed by 28.33 percent low and 25.00 percent high
mass media exposure.
It is clear from the Table 4.5 that majority of FFS respondents belonged to
medium level of mass media exposure. The probable reason might be because majority
of farmers were small with minimum access to various mass media, D.V.Ds and
Internet etc. The poor financial status also other reason for medium level of mass media
exposure. This finding is in consistent with Chatterjee (2000) and Gattu (2001).
4.1.6 Extension contact
Based on extension contact, the FFS and Non FFS farmers were grouped in to
three categories The distribution is given in Table 4.6.
From the table 4.6 , it could be observed that 63.88 percent of FFS farmers had
medium level of extension contact followed by 21.11 percent low and 15.00 high. In
case of Non FFS farmers majority (52.22%) were medium level followed by low
(31.66%) and high extension contact (16.11%) respectively.

District wise distribution shows that in Warangal district majority (66.66 %) of
FFS farmers had medium level extension contact followed by low (16.66%) and high
(16.66%) and in case of Non FFS majority 46.66 percent were medium followed by
28.33 percent low and 25.00 high extension contact.
In Kadapa district, majority (76.66 %) of FFS farmers had medium level of
extension contact followed by high (13.33%) and low (10.00%) and in case of Non
FFS, majority 58.33 percent were medium followed by 33.33 percent low and 8.33
percent high extension contact.
In Guntur district majority (48.33 %) of FFS farmers had medium level of
extension contact followed by low (36.66 %) and high (15.00%) and incase of Non FFS
majority 50.00 percent were medium followed by 31.66 percent low and 18.33 percent
high extension contact.
It was clear from the Table, 4.6 that majority of FFS respondents belonged to
medium level of extension contact. Therefore efforts of extension agencies must be
augmented in order to reach the majority of farmers. This could be done by conducting
more trainings, exposure visits, rythusadassus field days and farmers scientists
interaction meets etc. This finding is in consistent with Ravichandra Prasad (2002)
Sivasubramanyam (2003)
4.1.7 Group orientation
Based on group orientation, the FFS and Non FFS farmers were grouped in to
three categories The distribution is given in Table 4.7.
From the above table, it could be observed that 53.33 percent of FFS farmers
had medium level of group orientation followed by 27.20 percent high and 19.44

percent low. In case of Non FFS farmers majority (46.66%) were medium level
followed by low (31.66%) and high group orientation (21.66%) respectively.
District wise distribution shows that in Warangal district, majority (60.00 %) of
FFS farmers had medium level group orientation followed by high (23.33%) and low
(16.66%) and in case of Non FFS, majority 55.55 percent were medium followed by
26.66 percent low and 18.33 high group orientation.
In Kadapa district, majority (52.33 %) of FFS farmers had medium level of
group orientation followed by high (28.33%) and low (18.33%) and incase of Non FFS
majority 40.00 percent were medium followed by 35.00 percent low and 25.00
percent high group orientation.
In Guntur district, majority (46.66 %) of FFS farmers had medium level of
group orientation followed by high (30.00 %) and low (23.33%) and incase of Non FFS
majority 45.00 percent were medium followed by 33.33 percent low and 21.66 percent
high group orientation.
It was clear from the Table 4.7 that majority of FFS respondents had medium
group orientation followed by high. The probable reason is more group related
activities were conducted in FFS programme thus farmers had medium to high group
orientation.. This finding is in consistent with Bagyalakshimi (2002)
4.1.8 Market intelligence
Based on market intelligence, the FFS and Non FFS farmers were grouped in to
three categories The distribution is given in Table 4.8.
It could be observed from the Table 4.8 that 54.44 percent of FFS farmers had
medium level of market intelligence followed by 25.00 percent high and 20.55 percent

low. In case of Non FFS farmers, majority (49.44%) were medium level followed by
low (27.22%) and high mass media exposure (23.33%) respectively.
District wise distribution shows that in Warangal district majority (56.66 %) of
FFS farmers had medium level of market intelligence followed by high and low with
(21.66%) and incase of Non FFS majority 51.66 percent were medium followed by
26.66 percent low and 21.66 high market intelligence.
In Kadapa district majority (58.33 %) of FFS farmers had medium level of
market intelligence followed by low (28.33%) and high (13.33%) and incase of Non
FFS majority 36.66 percent were medium followed by 33.33 percent low and 30.00
percent high market intelligence.
In Guntur district majority (48.33 %) of FFS farmers had medium level of
market intelligence by high (31.66%) and low (20.00%) and incase of Non FFS
majority 60.00 percent were medium followed by 21.66 percent low and 18.33
percent high market intelligence.
It was clear from the Table 4.8 that majority of FFS respondents had medium
level of market intelligence followed by high. The probable reason might be majority
of farmers had undergone awareness progarmmes through FFS and also trainings
conducted by Dept of agriculture from time to time. This could be improved by
concerted efforts by the Department of agriculture mainly towards market led extension.
4.1.9 Risk orientation
Based on risk orientation the FFS and Non FFS farmers were grouped in to three
categories The distribution is given in Table 4.9
It could be observed from the Table 4.9 that 56.11 percent of FFS farmers had
medium level of risk orientation followed by 22.77 percent high and 21.11 low. In case
of Non FFS farmers, majority (45.55%) were medium level followed by low (28.55%)
and high risk orientation (25.55%) respectively.
District wise distribution shows that in Warangal district majority (46.66 %) of
FFS farmers had medium level risk orientation followed by low (28.33%) and high
(25.00%) and incase of Non FFS majority 41.66 percent were medium followed by
35.00 percent low and 23.33 high risk orientation.
In Kadapa district majority (71.66%) of FFS farmers had medium level of risk
orientation followed by low (15.00%) and high (13.33%) and incase of Non FFS
majority 38.33 percent were medium followed by 33.33 percent low and 28.33 percent
high risk orientation.
In Guntur district majority (50.00 %) of FFS farmers had medium level of risk
orientation followed by high (30.00%) and low (20.00%) and incase of Non FFS
majority 56.66 percent were medium followed by 25.00 percent high and 18.33
percent low risk orientation.
It was clear from the Table 4.9 that majority of FFS respondents belonged to
medium level of risk orientation followed by high. The probable reason might be
majority of FFS farmers were adopting inter cropping system and integrated crop
management practices in cotton crop. This finding is in consistent with Madavilatha
(2002)
4.1.10 Innovativeness
Based on innovativeness the FFS and Non FFS farmers were grouped in to three
categories The distribution is given in Table 4.10.
It could be observed from the Table 4.10 that 50.00 percent of FFS farmers had
medium level of innovativeness followed by 26.66 percent high and 23.33 low. In case
of Non FFS farmers’ majority (43.88%) were medium level followed by low (32.22%)
and high innovativeness (23.88%) respectively.
District wise distribution shows that in Warangal district majority (53.33 %) of
FFS farmers had medium level innovativeness followed by high (25.00%) and low
(21.66%) and incase of Non FFS majority 41.66 percent were medium followed by
36.66 percent low and 21.66 high innovativeness.
In Kadapa district majority (55.00%) of FFS farmers had medium level of
innovativeness followed by low (21.66%) and high (23.33%) and in case of Non FFS
majority 50.00 percent were medium followed by 30.00 percent low and 20.00 percent
high innovativeness.
In Guntur district majority (41.66 %) of of FFS farmers had medium level of
innovativeness followed by high (31.66%) and low (26.66%) and in case of Non FFS
majority 40.00 percent were medium followed by 30.00 percent low and high
innovativeness.
It was clear from the Table 4.10 that majority of FFS respondents belonged to
medium level of innovativeness followed by high. The probable reason might be
majority of FFS farmers aware of latest information about cotton through various media
like FFS weekly class, trainings, interaction meetings etc. This finding is in consistent
with Madavilatha (2002), Reddy (2003) and Ravishanker (2005)
4.1.11 Management orientation
Based on management orientation, the FFS and Non FFS farmers were grouped
in to three categories The distribution is given in the Table 4.11.
It could be observed from the Table 4.11 that 60.55 percent of FFS farmers had
medium level of management orientation followed by 22.22 percent high and 17.22

low. In case of Non FFS farmers’ majority (56.11%) were medium level followed by
low (23.33%) and high management orientation (20.55%) respectively.
District wise distribution shows that in Warangal district majority (65.00 %) of
FFS farmers had medium level management orientation followed by high (20.00%) and
low (21.66%) and in case of Non FFS majority 48.33 percent were medium followed by
28.33 percent low and 23.33 high management orientation.
In Kadapa district, majority (60.00%) of FFS farmers had medium level of
management orientation followed by high (23.33%) and high (16.66%) and incase of
Non FFS, majority 60.00 percent were medium followed by 20.00 percent low and
20.00 percent high management orientation.
In Guntur district majority (56.66%) of FFS farmers had medium level of
management orientation followed by high (23.33%) and low (20.00%) and in case of
Non FFS majority 60.00 percent were medium followed by 21.66 percent low and
18.33 percent high management orientation.
It was clear from the Table 4.11 that majority of FFS respondents belonged to
medium level of management orientation followed by high. The probable reason might
be majority of FFS farmers planning and adopting package of practices as per
recommendations given by experts. This finding is in consistent with Obaiah (2004)
4.2 ATTITUDE OF FFS AND NON FFS FARMERS
It could be observed from the Table 4.12 that 58.88 percent of FFS farmers
expressed moderately favourable attitude followed by 23.33 percent high and 17.77 low.
In case of Non FFS farmers, majority (55.55%) were medium level followed by low
(30.00%) and high favourable attitude towards FFS programme (14.44%) respectively.

District wise distribution shows that in Warangal district majority (58.33 %) of
FFS farmers had moderately favourable attitude followed by high (25.00%) and low
(16.66%) and in case of Non FFS, majority 46.66 percent were medium followed by
38.33 percent low and 15.00 high favourable attitude towards FFS Programme.
In Kadapa district majority (75.00%) of FFS farmers were moderately
favourable towards FFS followed by high (23.66%) and low (18.33%) and incase of
Non FFS majority 65.00 percent were medium followed by 21.66 percent low and
13.33 percent high favourable attitude towards FFS Programme .
In Guntur district majority (60.66%) of FFS farmers had moderately favourable
attitude followed by high (21.66%) and low (18.33%) and incase of Non FFS majority
55.55 percent were medium followed by 30.00 percent low and 15.00 percent high
favourable attitude towards FFS Programme.
It is clear from the Table 4.12 that majority of FFS respondents belonged to
moderately favourable attitude, followed by high where as in Non FFS category
majority had moderately favourable attitude followed by low towards FFS programme.
The probable reason might be majority of FFS farmers experienced the outcomes of
FFS and acting as master trainers and facilitators in the same village. This finding is in
consistent with Kappala (2002), Nagadev (1999) and Obaiah (2004)
In order to find out the significance difference in mean of attitude scores of FFS
and Non FFS farmers, ‘ Z’ test was applied .The size of sample, mean and standard
deviation of the two groups were given in the table 4.13.
It was evident from the table 4.13 that calculated Z values 56.31,51.81 and
76.19 were greater than the table Z value at 0.05 level of probability .So the null
hypothesis was rejected and hence it could be concluded that there exists a significance
difference between the mean attitude level of FFS farmers and Non FFS farmers
towards FFS programme. The mean score were also clearly demarcating the FFS and
Non FFS farmers about attitude level towards FFS programme. The Principle of
“Seeing is believing” with FFS concept, experiencing the positive outcome from FFS,
might have contributed to have more favorable attitude by FFS farmers when compared
to non FFS.
4.3 KNOWLEDGE OF FFS AND NON FFS FARMERS
It could be observed from the Table 4.14 that 57.77 per cent of FFS farmers had
medium level knowledge level about cotton I.C.M practices followed by 24.44 per cent
high and 17.77 per cent low. In case of Non FFS farmers, majority (46.66%) were in the
category of medium knowledge level followed by low (36.11%) and high (17.22%)
knowledge of cotton ICM practices respectively.
District wise distribution shows that in Warangal district, majority (63.33 %) of
FFS farmers had medium knowledge about Cotton ICM followed by high (23.33%) and
low (13.33%) and in case of Non FFS majority 50.00 percent were medium followed by
35.00 percent low and 15.00 high knowledge of cotton ICM practices respectively.
In Kadapa district majority (53.33%) of FFS farmers had medium knowledge
about Cotton ICM followed by high (25.00%) and low (21.66%) and in case of Non
FFS, majority 46.66 percent were medium followed by 33.33 percent low and 20.00
percent high knowledge of cotton ICM practices respectively
In Guntur district majority (56.66%) of FFS farmers had medium knowledge
about Cotton ICM followed by high (25.00%) and low (18.33%) and in case of Non
FFS, majority 43.33 percent were medium followed by 40.00 per cent high and 16.66
per cent low knowledge of cotton ICM practices respectively .

It was clear from the Table 4.14 that majority of FFS respondents belonged to
medium knowledge level followed by high and in Non FFS category majority had
medium knowledge about Cotton ICM. The probable reason might be FFS farmers had
undergone training on cotton ICM and practiced in their field condition. Weekly classes
also might have contributed to their knowledge level when compared to Non FFS
farmers. This finding is in consistent with Murthy and Veerabhadraiah (1999), Obaiah
(2004) ) and Jaswinder Singh and Kuldip kumar (2006)
Response analysis of knowledge items by FFS farmers and Non FFS
Knowledge
It is clear from the response analysis table 4.15 that majority of FFS farmers
know about Deep summer ploughing and destruction of crop residue help to reduce
pest/diseases (91%), No. of Bird perches per acre of cotton, Selection of suitable hybrid
will give good yields(88%), Insecticide used for Stem application(87%), Neem oil is
antifeedent (82%), Indiscriminate spray of insecticides is prime reason for increase in
cost of cultivation, Sticky traps are used against white flies and NPV Virus solution is
sprayed against Heliothis (81%).FFS farmers lack knowledge about Seed treatment
chemical for wilt disease (60%) and Refugee Bt rows around Bt Cotton(58%).They
know about Indiscriminate spray of insecticides is prime reason for increase in cost of
cultivation(64%),Selection of suitable hybrid will give good yields(58%), Neem
oil(57%), Deep summer ploughing (54%) and destruction of crop residue help to reduce
pest/ diseases, Cotton+ Greengram intercropping ratio (54%) and crop rotation (52%).
In contrary most non FFs farmers were not aware of the seed treatment chemical for
wilt disease (82%), Reason for Boll cracking(81%)

Difference in the Knowledge of FFS and Non FFS farmers on ICM Cotton
(District wise)
In order to find out the significance difference in mean Knowledge scores of
FFS and Non FFS farmers, ‘Z’ test was applied .The size of sample, mean and standard
deviation of the two groups were given in table 4.16.
It was evident from the table 4.16 that calculated Z values 29.11,21.47 and 21.88 were
greater than the table Z value at 0.05 level of probability .So the null hypothesis was
rejected and hence it could be concluded that there exists a significance difference
between the mean knowledge level of FFS farmers and Non FFS farmers towards ICM
in Cotton. This could be due to participation in FFS weekly classes, attending
orientation programmes organised by Dept. of Agriculture on cotton crop.
4.4 Skill of FFS and Non FFS farmers
It could be observed from the Table 4.17 that 57.77 percent of FFS farmers were
belonged to medium skill learnt category about cotton FFS I.C.M practices followed by
25.00 percent high and 17.22 low. In case of Non FFS farmers, majority (47.22%) were
medium skills learnt category followed by low (28.33%) and high (24.44%) skills of
cotton FFS ICM practices respectively.
District wise distribution shows that in Warangal district majority (63.33 %) of
FFS farmers had medium skills level about Cotton ICM followed by high (20.00%) and
low (16.66%) and incase of Non FFS majority 53.33 percent farmers had medium skills

followed by 26.00 percent high and 20.00 low skills of cotton ICM practices
respectively.
In Kadapa district majority (60.00%) of FFS farmers had medium skills level
about Cotton ICM followed by high (25.00%) and low (15.00%) and incase of Non
FFS majority 35.00 percent were medium category followed by 36.66 percent low and
28.33 percent high skills learnt category of cotton ICM practices respectively
In Guntur district majority (50.00%) of FFS farmers belonged to medium skill
learnt category about Cotton ICM followed by high (30.00%) and low (20.00%) and
incase of Non FFS majority 53.33 percent were medium followed by 28.33 percent
high and 18.33 percent low about skills of cotton ICM practices respectively .
It is clear from the Table 4.17 that majority of FFS respondents belonged to
medium skills category followed by high and in Non FFS category majority had
medium skills about Cotton ICM. The probable reason might be FFS farmers learned
the skills during FFS weekly classes conducted by Dept. of Agriculture official and
then practicing the same in their field condition. This finding is in consistent with
Kumar (1996) and Obaiah (2004)
Response analysis
Skills
Is evident from the Table 4.18 that majority of FFS farmers were fully confident
in skills like Identification of dead larvae due to Bt spray (82%), Cotton Eco System
Analysis (81%), Identification infestation of sucking pests(73%), Preparation of
NSKE(70%), Identification of deficiency of micro nutrients(69%), Stem application
with Pesticide (69%), Longest line (Resource utilization) (68%), Seed germination
test(68%), Collection of soil samples (66%) and Preparation of spray fluid (64%). But

they were not confident in skills like Tricho cards preparation (23%), Pit fall trap
method (38%) Water holding capacity of different soils (36%), and Preparation of
Green chilli and Garlic extract (40%).While Non FFS farmers about (30%) confident in
skills like Identification of dead larvae due to Bt spray, Crop condition Field condition,
Pests, Poison bait preparation, Seed germination test and Seed treatment.
In order to find out the significance difference in mean Skill scores of FFS and
Non FFS farmers, ‘Z’ test was applied. The size of sample, mean and standard deviation
of the two groups given in the table 4.19
It was evident from the table 4.19 that calculated Z value 28.84, 23.32 and 26.81
were greater than the table Z value at 0.05 level of probability .So the null hypothesis
was rejected and hence it could be concluded that there exists a significance difference
between the mean skill level of FFS farmers and Non FFS farmers towards ICM in
Cotton. The variation between FFS and non FFS farmers is due to skill oriented classes
in FFS programme and practicing the same in their field situation. Moreover
involvement of farmers in practical sessions definitely improves the efficiency to
practice skills.
4.5 ADOPTION
Distribution of FFS and Non FFS farmers’ respondents based on their Adoption
of ICM Cotton practices are given in Table 4.20
It could be observed from the Table 4.20 that 55.55 percent of FFS farmers were
in the medium adoption category about cotton I.C.M practices followed by 23.88
percent high and 20.55 low. In case of Non FFS farmers’ majority (46.11%) were in the
medium adoption category followed by low (32.77%) and high (21.11%) adoption of
cotton ICM practices respectively.
District wise distribution shows that in Warangal district majority (58.33 %) of
FFS farmers had medium extent of adoption about Cotton ICM followed by high
(21.66%) and low (20.00%) and in case of Non FFS majority 51.66 percent were
medium adoption category followed by 25.00 percent low and 23.33 high adoption of
cotton ICM practices respectively.
In Kadapa district majority (58.33%) of FFS farmers were in the medium
adoption of Cotton ICM followed by high (23.33%) and low (18.33%) and in case of
Non FFS, majority 46.66 percent were medium followed by 40.00 percent low and
13.33 percent high Adoption of cotton ICM practices respectively
In Guntur district majority (50.00%) of FFS farmers in medium adoption about
Cotton ICM followed by high (26.66%) and low (23.33%) and incase of Non FFS,
majority 46.00 percent were medium adoption category followed by 33.33 percent high
and 26.66 percent low adoption category of cotton ICM practices respectively .
Discussion: It is clear from the Table 4.20 that majority of FFS respondents
belonged to medium adoption category followed by high and in Non FFS category
majority had medium followed by low adoption about Cotton ICM. The probable
reason might be that FFS farmers after observing the field results in experimental plot
might have adopted the same in their field condition. The interaction with experts and
FFS master trainees also might have contributed to adoption of Cotton FFS practices.
This finding is in consistent with Thyagarajan (2000) and Natarajan (2004).
Response analysis
Extent of adoption
It could be seen from above table 4.21 that most of FFS farmers were adopting
practices recommended seed rate(91%), Deep summer ploughing (88%), Sowing time
(87%), Crop residue destruction (82%), Agro ecosystem analysis (81%), Peer group
communication(79%), Participation in field day (77%), Daily monitoring (77%), Long
term experiments like No. of plants / hole, New Hybrids, De topping, Removal of
fruiting bodies (76%)), Analysis of crop condition(73%), Collection and destruction of
larvae(72%), Effect of pesticide spray on defenders(71%), Risk management (71%) and
Installation of bird perches(70%). But they were not adopting Release of Trichogramma
eggs, Seed treatment with Trichoderma viridae, PTD and Documentation of
experiences. In case of Non FFS farmers they were adopting timely sowing, New
Hybrids, Recommended seed rate, Daily monitoring.
Difference in the extent adoption scores of FFS and Non FFS farmers on
ICM Cotton (District wise) (Table 4.22)
In order to find out the significance difference in mean adoption scores of FFS
and Non FFS farmers, ‘Z’ test was applied. The size of sample, mean and standard
deviation of the two groups were given in Table 4.22.
It was evident from the table 4.22 that calculated Z values 45.01,61.93 and 51.11
were greater than the table Z value at 0.05 level of probability .So the null hypothesis
was rejected and hence it could be concluded that there exists a significance difference
between the mean adoption level of FFS farmers and Non FFS farmers towards ICM
in Cotton. The significance difference between FFS and non FFS farmers in adoption of
cotton ICM practices might be due to their personal experience with technology
introduction during FFS programme. It is clear that once the farmer sees the positive
results of new technology, then the adoption will be at faster rate. Innovativeness of
FFS farmers also contributed to higher adoption than non FFS farmers.
4.6 AGRO ECOSYSTEM MANAGEMENT OF FFS AND NON FFS FARMERS
Distribution of FFS and Non FFS farmers respondents based on their Agro
Ecosystem Management of ICM Cotton practices (Table 4.23).
It could be observed from the Table 4.23 that 56.66 percent of FFS farmers had
medium agro ecosystem management about cotton Integrated Cotton Management
practices followed by 23.88 percent high and 19.44 low. In case of Non FFS farmers’
majority (50.55%) were medium agro ecosystem management category followed level
by low (28.88%) and high (20.55%) of cotton ICM practices respectively.
District wise distribution shows that in Warangal district majority (65.00 %) of
FFS farmers had medium agro ecosystem management about Cotton ICM followed by
high (20.00%) and low (15.00%) and incase of Non FFS majority 55.00 percent were
medium agro ecosystem management category followed by 25.00 percent low and
20.00 high cotton ICM practices respectively.
In Kadapa district majority (50.00%) of FFS farmers were had medium agro
ecosystem management of Cotton ICM followed by high (26.66%) and low (23.33%)
and incase of Non FFS majority 56.66 percent were medium followed by 21.66 percent
each low and high agro ecosystem management of cotton ICM practices,respectively

In Guntur district majority (55.00%) of FFS farmers had medium agro
ecosystem management about Cotton ICM followed by high (25.00%) and low
(20.00%) and in case of Non FFS majority 51.66 percent were medium followed by
28.33 percent high and 20.00 percent low agro ecosystem management of cotton ICM
practices respectively .
It was clear from the Table 4.23 that majority of FFS respondents belonged to
medium level agro ecosystem management of cotton ICM practices followed by high
and in Non FFS category majority had medium followed by low agro ecosystem
management about Cotton ICM. The probable reason might be that FFS farmers might
have observed the AEM by facilitator in the field condition , there by the AEM is better
in FFS as against Non FFS farmers. This finding is consistent with Rambabu (1997)
and Atchuta Raju (2002) ,
RESPONSE ANALYSIS
Agro ecosystem management
It could be concluded from the Table 4.24 that majority of FFS farmers were
convinced that ICM technology under FFS has resulted in biodiversity conservation
like Spiders, Coccinellid beetle (Akshinatala purugu), Dragon flies(92%), NPV and Bt
solution when used against pests will result in building natural predators
population(91%), Spray of botanical pesticides will develop natural predators(85%)
,Use of organic manures like FYM / Vermicomposting improves overall fertility of
soil(85%), Use of quality seed will result in better yields (82%), Decomposition of
applied FYM in the soil leads to increased microbial activity(82%),Parasites and
predators conservation will result in Bio diversity conservation(81%), Use of micro
irrigation system will lead to conservation of irrigation water and improves micro

climate(79%), Use of bio control agents like Verticillium , NPV, .Bt. will reduce pest
incidence(77%), Insect Zoo/ Cage study will help in identification of Predators/
Parasites to enable Bio diversity conservation (76%), Adoption of soil test based
fertilizer application to decrease pest incidence (73%), and Adoption of IPM package
for better micro climate (70%) will help in agro ecosystem management in Cotton FFS.
While in Non FFS farmers agreed that Application of soil test based NPK fertilizers to
reduce pest and diseases (58%),Use of organic manures like FYM / Vermicompost
improves overall fertility of soil (54%) ,Use of quality seed will result in better
yields(53%), Use of botanicals like NSKE will helps in developing predators’
population(48%), Growing Greengram as inter crop in Cotton for developing predators’
population(47%) and Intercropping with Greengram will improve soil fertility(46%).
Z-Test
In order to find out the significance difference FFS and Non FFS farmers Z’ test
was applied .The size of sample ,mean and standard deviation of the two groups were
given in the table 4.25
It was evident from the table 4.25 that calculated Z values 19.41,19.64 and 18.39
were greater than the table Z value at 0.05 level of probability .So the null hypothesis
was rejected and hence it could be concluded that there exists a significance difference
between the mean AEM level of FFS farmers and Non FFS farmers towards ICM in
Cotton. The main principle of FFS is AEM. Exposure to AEM practices in field
situation, practicing the same, could be the reasons for significance difference between
FFS and non FFS farmers.
4.7 DECISION MAKING ABILITY OF FFS AND NON FFS FARMERS

It could be observed from the Table 4.26 that 51.11 percent of FFS farmers
belonged to medium decision making category about cotton I.C.M practices followed
by 27.77 percent high and 21.11 low. In case of Non FFS farmers, majority (45.00%)
were in medium decision making category followed by low (31.11%) and high
(23.88%) of cotton ICM practices respectively.
District wise distribution shows that in Warangal district, majority (46.66 %) of
FFS farmers had medium decision making category about Cotton ICM followed by
high (31.66%) and low (21.66%) and incase of Non FFS majority 38.33 percent were in
medium decision making category followed by 36.66 percent low and 15.00 high
decision of cotton ICM practices respectively.
In Kadapa district, majority (53.33%) of FFS farmers had medium decision
making of Cotton ICM followed by high (26.66%) and low (20.00%) and in case of
Non FFS majority (46.66 percent) were in medium decision making category followed
by 30.00 percent each low and 23.33 high decision of cotton ICM practices
respectively
In Guntur district majority (53.33%) of FFS farmers had medium decision
making category about Cotton ICM followed by high (25.00%) and low (21.66%) and
incase of Non FFS, majority (50.00 percent) were medium decision making category
followed by 26.66 percent high and 23.33 percent low decision category of cotton ICM
practices respectively .
It was clear from the Table 4.26 that majority of FFS respondents belonged to
medium decision making category followed by high and in Non FFS category
majority had medium followed by low decision making about Cotton ICM. The
probable reason was FFS farmers active participation in analyzing the prevailing
condition about cotton with other members might have enhanced their decision making
ability when compare to Non FFS group. This finding is consistent with Devi (2000),
Obaiah (2004) and Nisha Aravind (2006)
Response analysis
It could be concluded from the table 4.27 that majority of FFS farmers agreed
that group decision is better in case of Adoption of IPM(79%), Collection of Soil
sample(60%), Sowing of inter crop like Greengram (54%),Time of sowing(53%), Long
term experiments(53%), Use of fertlisers, Adoption of Short term experiments(51%),
Selection of variety /hybrid(51%), Type /quantity of fertilizer(47%) Use ITKs (46%)
and Joint decision with spouse is good in activities like, Source of credit(54%),
investment on crop production(48%),Maintain optimum plant density(47%). Individual
decision in case of time of application of fertilisers (53%), Sowing of boarder crop
around cotton(51%), better option in case of use of bio pesticides(47%), Irrigation
schedule (40%) and While majority the non FFS farmers opined that individual
decision is better in all activities.
Z-Test
In order to find out the significance difference in mean decision scores of FFS
and Non FFS farmers, ‘Z’ test was applied .The size of sample ,mean and standard
deviation of the two groups were given in the table 4.28.
It was evident from the table 4.28 that calculated Z value 21.47,2.42 and 32.05
were greater than the table Z value at 0.05 level of probability .So the null hypothesis
was rejected and hence it could be concluded that there exists a significance difference
between the mean decision level of FFS farmers and Non FFS farmers towards ICM in
Cotton. FFS enhances the analytical skills of farmers to take appropriate decisions to

overcome the field level problems, this might be the reason for higher rate of decision
making ability of FFS farmers to that of non FFS farmers
4.8 DOCUMENTATION OF ITKS IN COTTON FFS
1. Sucking pest management in Cotton
1. Title of ITK : Neem seed kernel extract[NSKE] reduce sucking pest in cotton
2. General description of ITK practice: NSKE @ 5 % solution
3. Location where ITK Practiced : Rajasahebpet Porumamilla Kadapa , A.P
4. Purpose for which ITK used : To reduce sucking pest incidence
5. Rationale hypothesis of the treatments used to solve the target problem:
Acts as anti feedent for pest
6. What is the impact of practice as experienced by users : Satisfactory
7. General information: Major crops: Cotton, Maize, Rice
8. Details of farming situation where the practice is adopted : Rainfed black soils
9. Particulars of ITK
a. Crop and variety used : Cotton /Private hybrid
10. Provide information on compatibility: Compatible with local crop management practices.
11. Details of users of ITK : FFS groups
12. Since how many years this practice is used and its modifications made over years: 2-3 years
13. How many farmers in the village use the practice : 10 farmers
14. Provide information on reasons in case of non-use : Nil
15. What is the alternate practice of ITK: Carbendazim @ 2 g /kg of seed
16. Documentary evidence of ITK : ---
17. Name of and address of discloser: FFS groups A,P
18. Name and address of person to whom incentive money to be sent:

19. Certified that disclosure on the ITK has been made in the knowledge of the local democratic institution
Place: Rajasahebpet, Porumamilla Kadapa
2. Pest monitoring
1. Title of ITK : Indigenous light trap
2. General description of ITK practice: Putting electrical bulb in the earthen pot with small holes
3. Location where ITK Practiced : Seethampet Hasanparthy mandal Warangal district, A.P
4. Purpose for which ITK used : To monitor pest population
5. Rationale hypothesis of the treatments used to solve the target problem: Acts as light trap
6. What is the impact of practice as experienced by users : Satisfactory
7. General information: Major crops: Cotton, Maize, Rice
8. Details of farming situation where the practice is adopted : Rainfed black soils
9. Particulars of ITK
b. Crop and variety used : Cotton /Private hybrid
10. Provide information on compatibility: Compatible with local crop management practices.
11. Details of users of ITK :Adi Reddy/OC/Hindhu/Degree
12. Since how many years this practice is used and its modifications made over years: 2-3 years
13. How many farmers in the village use the practice : 10-15 farmers
14. Provide information on reasons in case of non use : Nil
15. What is the alternate practice of ITK: Plastic Light trap
16. Documentary evidence of ITK : ---
17. Name of and address of discloser: Adi Reddy Seethampet, Waranagal district A,P
18. Name and address of person to whom incentive money to be sent: Adi Reddy Seethampet, Waranagal district A,P

19. Certified that disclosure on the ITK has been made in the knowledge of the local democratic institution
Place: Seethampet,Hasanparthy,Warangal dis
3. Improvement of seed germination in Cotton crop
1. Title of ITK : Anti- biotic for improving germination percentage in Cotton
2.General description of ITK practice: Putta mannu 50g+ Cow urine 50ml+Cow dung 50 g - used for treatment
3.Location where ITK Practiced : Seethampet Hasanparthy mandal Warangal district, A.P
4. Purpose for which ITK used : To reduce incidence of soil borne fungi in cotton
5. Rationale hypothesis of the treatments used to solve the target problem: Acts as anti biotic against soil borne fungi and improves seed germination in cotton.
6. What is the impact of practice as experienced by users : Satisfactory
7. General information: Major crops: Cotton, Maize, Rice
8. Details of farming situation where the practice is adopted : Rainfed black soils
9. Particulars of ITK
c. Crop and variety used : Cotton /Private hybrid
10. Provide information on compatibility: Compatible with local crop management practices.
11. Details of users of ITK : FFS group Seethampet
12. Since how many years this practice is used and its modifications made over years: 2-3 years
13. How many farmers in the village use the practice : 20 farmers
14. Provide information on reasons in case of non use : Nil
15. What is the alternate practice of ITK: Trichoderma viridae / Carbendazim
16. Documentary evidence of ITK : ---
17. Name of and address of discloser: Adi Reddy Seethampet, Waranagal district A,P

18. Name and address of person to whom incentive money to be sent: Adi Reddy Seethampet, Waranagal district A,P
19. Certified that disclosure on the ITK has been made in the knowledge of the local democratic institution
4. Cotton wilt disease management
1. Title of ITK : Indigenous treatment to reduce wilt disease in cotton
2. General description of ITK practice: Inguva 0.3g/plant and then irrigate to reduce wilt incidence
3. Location where ITK Practiced : Seethampet Hasanparthy mandal Warangal district, A.P
4. Purpose for which ITK used : To monitor disease incidence
5. Rationale hypothesis of the treatments used to solve the target problem: Acts as seed treatment chemical against wilt
6. What is the impact of practice as experienced by users : Satisfactory
7. General information: Major crops: Cotton, Maize, Rice
8. Details of farming situation where the practice is adopted : Rainfed black soils
9. Particulars of ITK
d. Crop and variety used : Cotton /Private hybrid
10. Provide information on compatibility: Compatible with local crop management practices.
11. Details of users of ITK :Adi Reddy/OC/Hindhu/Degree
12. Since how many years this practice is used and its modifications made over years: 2-3 years
13. How many farmers in the village use the practice : 10 farmers
14. Provide information on reasons in case of nonuse : Nil
15. What is the alternate practice of ITK: Carbendazim @ 2 g /kg of seed
16. Documentary evidence of ITK : ---
17. Name of and address of discloser: Adi Reddy Seethampet, Waranagal district A,P

18. Name and address of person to whom incentive money to be sent: Adi Reddy Seethampet, Waranagal district A,P
19. Certified that disclosure on the ITK has been made in the knowledge of the local democratic institution.
Traditional way to control wilt in Cotton
Cotton is a commercial crop grown by farmers in Black cotton soils of A.P.
In addition to pest problem now a days wilt disease is causing lot of damage to
cotton crop. At present there are no remedial measures to wilt disease during the
crop growth period. At this juncture farmers of Warangal district started using
Ingua 0.3 g/ plant ,which is arresting the spread of disease in Cotton field. Due to
this traditional practice the farmers are getting good yields at low cost.
Germination improvement in Cotton
In cotton cultivation sometimes germination is a problem due to soil type ,
low moisture levels and seed/ soil borne diseases. To overcome soil borne fungus
problem the framers of Warangal district adopted an age old practice of mixing
Putta mannu [50 g} +Cow urine [50 ml]+ Cow dung [50 g] and applying to the
seeds. After mixing the cow dung paste ,the seed is shade dried and sown in the field
. Due to this practice the growth of cotton crop is good.
Indigenous light trap in Cotton
Light trap is used in cotton ,rice and toher crops to monitor the pest population and
to take necessary prophylactic control measures. Farmers of Warangal district of
Hasanparthy mandal are using pots with holes + bulb for monitoring adult

population of pod borers in Cotton. Due to this practice there is a scope for
collecting more number of moths when compare to normal light trap method.
4.9 RELATIONSHIP BETWEEN THE SELECTED PERSONAL, SOCIO-
ECONOMIC, PSYCHOLOGICAL CHARACTERISTICS AND
EMPOWERMENT IN TERMS OF KNOWLEDGE, SKILL, EXTENT OF
ADOPTION, AGRO ECOSYSTEM MANAGEMENT AND DECISION
MAKING
4.9.1 Relationship between selected profile characteristics and Attitude of FFS
and Non FFS farmers (District wise)
In order to study the nature of relationship between selected independent
variables and attitude of FFS and Non FFS farmers towards ICM Cotton, correlation
coefficient s (r) were computed and presented in the Table 4.29
The relationship between the scores of selected independent variables and the
attitude of FFS and Non FFS farmers was tested by null hypothesis and empirical
hypotheses.
Null hypothesis: There is no relationship between the selected independent variables
i.e. age, education, experience, farm size, mass media exposure, extension contact,
group orientation, market intelligence, risk orientation, innovativeness, management
orientation and the attitude of FFS and Non FFS farmers.
Empirical hypothesis: There is a significant relationship between the selected
independent variables i.e age, education, experience, farm size, mass media exposure,

extension contact, group orientation, market intelligence, risk orientation,
innovativeness, management orientation and the attitude of FFS and Non FFS farmers.
It can be seen from the Table 4.29 that in Warangal district, Education ( 0.93) ,
Extension contact (0.44), Group orientation (0.50),Market intelligence(0.63),Risk
orientation(0.61), Innovativeness(0.65), Management orientation (0.80) were found to
be positively significant, Age (-0.60) and Experience in farming (-0.57) were negatively
significant and Mass media exposure and Farm size were non-significant with attitude
of FFS farmers. In case of Non FFS farmers except Education (0.42) remaining
variables were non - significant with Attitude towards Cotton ICM.
It is clear from the Table 4.29 that in Kadapa district Education ( 0.75) and
Mass media exposure (0.43) were positively significant at 0.01 level of probability;
Innovativeness was significant at 0.05 level, Farm size (0.073), Extension contact
(0.14), Group orientation (0.15), Market intelligence(0.07), Risk orientation (0.08) and
Management orientation(0.11) were found to be non- significant and Age (-0.34) and
Experience in farming (-0.38) were negatively significant with Attitude at 0.01 level of
probability. In case of Non FFS farmers Age (0.30) and Education (0.294) were
positively were significant and rest of the variables found to be non-significant with
attitude towards Cotton ICM.
It is evident from the Table 4.29 that in Guntur district Education (0.82) was
positively significant at 0.01 level , Age(-0.2626) was negatively significant and rest of
the variables were non- significant with attitude of FFS farmers. Hence null hypothesis
was accepted for the above variables. In case of Non FFS Farmers Experience (0.266),
Extension Contact (0.255) were positively significant while other variables were non-
significant with Attitude towards Cotton ICM. Hence the null hypothesis was rejected
and concluded that the attitude of farmers was dependent on independent variables and
empirical hypothesis was accepted.
An over view of table 4.29 indicate that Education, Mass media exposure,
Market intelligence, Risk orientation, Innovativeness and Management orientation were
positively significant, whereas Age and Experience in farming were found be negatively
significant with Attitude level of FFS farmers on Cotton ICM practices.
Discussion
Age versus attitude
An over view of table 4.29 indicate that age was negatively significant with
attitude of FFS farmers. The probable reason might be increased in age did not favour
the new concepts in agriculture extension and FFS. The traditional values also favour
to develop negative attitude on new technology.
Education versus Attitude
It could be observed from table 4.29 that Education had positive and significant
relationship with attitude of FFS farmers. The trend might be due to the fact that the
educated farmers were already aware of FFS practices through various sources of
information. Educated farmers think and analyse the new concepts with positive
outlook. This finding is in agreement with results of Prasad and Sundaraswamy (2000)
and Obaiah (2004)
Farming experience versus attitude
A close observation of table 4.29 reveal that farming experience was negatively
significant with attitude of farmers on Cotton FFS .This might be the longer experience
in farming and traditional farming approach did not motivate the selected farmers
towards FFS.

Mass media exposure versus Attitude
An over view of table 4.29 indicate that mass media exposure had significant
relationship with Attitude of FFS farmers. Mass media like Television, Interactive C.Ds,
Agril.magazines, news papers might have created greater attitude among farmers
towards Cotton ICM . Mass media stimulate the mental ability of farmers to have more
knowledge about Cotton ICM. This result is line with the results of Prasad and
Sundaraswamy (2000)
Market intelligence versus Attitude
It was clear from the Table 4.29 that there was positive and significant
relationship between market intelligence and attitude. High education, rich mass media
exposure, risk taking ability might contribute to this relationship. Concerted efforts to be
made to create awareness on market intelligence at various forums
Risk orientation versus Attitude
It was evident from the Table 4.29 that risk orientation had positive significant
relationship with attitude towards Cotton ICM. Risk orientation was expressed as the
degree to which a respondent has desired to take risk and has courage to face
uncertainty. A farmer with this trait would have better attitude. This result is line with
the results of Atchuta Raju (2002).
Innovativeness versus Attitude
A close observation of Table 4.29 indicated that there was positive and
significant relationship between innovativeness and attitude of farmers towards Cotton
ICM. Innovativeness is an individual interest and desire to seek change in traditional
practices. Farmer introduces change into his own field as and when the practice is
practicable and feasible. This result is line with the results of Atchuta Raju (2002).

Management orientation versus Attitude
An over view of table 4.29 shows that management orientation had significant
relationship with attitude of FFS farmers. This might be due well planned, executed and
monitored demonstrations in FFS programme. Farmers with innovativeness and good
market intelligence have good managerial ability in farm. This result is line with the
results of Obaiah (2004).
Influence of Independent of variables on Attitude of FFS and Non FFS farmers
Multiple regression analysis
District wise Multiple regression analysis was carried out to determine the combined
effect of all independent variables on Attitude of FFS and Non FFS farmers
A perusal of Table 4.30 revealed that in Warangal district, the variation in
Attitude by selected independent variables was explained to the extent of 92 percent and
38 percent in FFS and Non FFS farmers. The unexplained variation to the extent of 8
percent may be attributed to variables not included in this study. Education, Farm size,
Extension contact, Group orientation, Risk orientation and Management orientation
contributed significantly. The computed ‘F’ Value was 56.4260, Hence it could be
concluded that all variables taken for the study together explained a significant amount
of variation in attitude of FFS farmers.
A perusal of Table 4.31 revealed that in Kadapa district, the variation in Attitude
by selected independent variables was explained to the extent of 64 percent and 20
percent in FFS and Non FFS farmers. The unexplained variation to the extent of 36
percent may be attributed to variables not included in this study. Education,
Innovativeness contributed significantly. The computed ‘F’ Value is 7.86 .Hence it

could be concluded that all variables taken for the study together explained a significant
amount of variation in attitude of FFS farmers.
A perusal of Table 4.32 revealed that in Guntur district the variation in Attitude
by selected independent variables was explained to the extent of 73 per cent and 20 per
cent in FFS and Non FFS farmers. The unexplained variation to the extent of 27 percent
in case of FFS farmers may be attributed to variables not included in this study.
Education and Risk orientation contributed significantly. The computed ‘F’ Value was
12.39. Hence it could be concluded that all variables taken for the study together
explained a significant amount of variation in attitude of FFS farmers.
From the above, it is clear that variables like Education , Farm size, Extension
contact, Group orientation, Risk orientation and Management orientation in Warangal ,
Education, Innovativeness in Kadapa and Education and Risk orientation in Guntur
districts contributed significantly for the most of variation in the Attitude of
respondents about FFS Cotton.
Discussion
An overview of three districts indicates that education was a critical element in forming
favorable (or) unfavorable attitude towards new concepts like FFS. Higher the education
the ability to analyze and adopt concepts like FFS would be more towards the positive
mode. As per the findings of study the education level of FFS farmers was better than
non FFS farmers as education had positive and significant relationship with attitude of
FFS farmers. FFS is a group approach, therefore working in groups enabled individual farmer
to discuss, analyse and understand the new concepts and take risk in adopting the same.
The finding showed that there is a need to concentrate efforts on mass media for
wide publicity about FFS concept and encourage other farmers to adopt FFS concept.

Similarly awareness programmes to farmers on market intelligence should be arranged
as they give rich benefits from new concepts like FFS. Where as in non FFS farmers
education contributed significantly to attitude towards FFS.
4.9.2 Relationship between selected profile characteristics of FFS and non FFS
farmers and their Knowledge level of Cotton ICM practices
In order to study the nature of relationship between selected independent
variables and knowledge level of FFS and Non FFS farmers towards ICM Cotton,
correlation coefficient s (r) were computed and the values presented in Table 4.33
The relationship between the scores of selected independent variables and the
knowledge level of FFS and Non FFS farmers was tested by null hypothesis and
empirical hypotheses.
Null hypothesis: There will be no significant relationship between the selected
independent variables i.e age, education, experience, farm size, mass media exposure,
extension contact, group orientation, market intelligence, risk orientation,
innovativeness, management orientation and the knowledge level of FFS and Non FFS
farmers.
Empirical hypothesis: There will be a significant relationship between the selected
independent variables i.e age, education, experience, farm size, mass media exposure,
extension contact, group orientation, market intelligence, risk orientation,
innovativeness, management orientation and the knowledge level of FFS and Non FFS
farmers.

It is evident from the Table 4.33 that in Warangal district, Education (0.84),
Extension contact (0.48), Group orientation (0.47), Market intelligence(0.50), Risk
orientation(0.51), Innovativeness (0.63) and Management orientation (0.61), Farm size
(0.27) and Mass media exposure (0.26) were found to be positively significant and Age
(-0.49) and Experience in farming (-0.47) were negatively significant with Knowledge
of FFS farmers on Cotton ICM. In case of Non FFS farmers except Education (.0.43),
remaining variables were found to be non –significant with Knowledge on ICM Cotton.
Hence the null hypothesis was rejected and concluded that the Knowledge of farmers
was dependent on independent variables, hence empirical hypothesis was accepted.
From the table 4.33 it is observed that in Kadapa district Education (0.87),
Mass media exposure (0.48) were positively significant, Age (-.029) and experience in
farming (-.035) were negatively significant and Extension contact, Group orientation,
Market intelligence, Risk orientation, Innovativeness and Management orientation were
found to be non- significant with Knowledge In case of Non FFS farmers, all the
variables were non-significant with knowledge on ICM Cotton. Hence the null
hypothesis was rejected and concluded that the Knowledge of farmers was dependent on
independent variables therefore empirical hypothesis was accepted.
It could be clear from the Table 4.33 that in Guntur district Education ( 0.89)
was positively significant, Age (-0.331) and Experience in farming (-0.25) negatively
significant and rest of the variables were non- significant with Knowledge of FFS
farmers on ICM Cotton. In case of Non FFS farmers all the variables were found to be
non- significant with Knowledge on ICM Cotton. Hence the null hypothesis was
rejected accepting the empirical hypothesis.
Discussion

It is clear from the Table 4.33 that computed ‘r’ values of independent variables
namely Education, Mass media exposure and Innovativeness were positively
significant whereas Age and Experience in farming were found be negatively
significant with Knowledge level of FFS farmers on Cotton ICM practices.
Age versus Knowledge
It is evident from the Table 4.33 that age was negatively significant with
Knowledge of FFS farmers towards Cotton ICM. Aged and more experienced farmers
have a strong belief and affinity towards traditional farm technologies, their perception
level also decreases about latest concepts, this might be the reason for the negative
relationship. This result is accordance with results of Ramakrishnan (1999) and Satpal
Singh et al. (2003)
Education versus Knowledge
It could be observed from table 4.33 that Education had positive and significant
relationship with knowledge level of by FFS farmers. Education not only adds
knowledge but also expand horizons of individuals. Higher the education, wider will be
the interaction of individuals with different sources and increases the ability to grasp
facts, analyse and interpret them in accurate way. Educated farmers will have more
information seeking habits and better access to all types of communication media. This
finding is in agreement with results of Satpal Singh et al. (2003) and Obaiah (2004).
Experience versus Knowledge
It was obvious from the Table 4.33 that there was negative and significant
relationship between education and experience of FFS farmers on Cotton ICM practices.

The probable reason might be that as experience increases the inquisitiveness to learn
and understand new concepts is decreased. The low extension contact, lack of
awareness, might be the possible reason for the above trend. This result is line with the
results of Sindhe et al. (2000) and Veerendranath (2000)
Mass media exposure versus Knowledge
An over view of table 4.33 indicate that mass media exposure had significant
relationship with Knowledge of FFS farmers. High level of mass media exposure
enhances the respondent knowledge level on several aspects of the Cotton ICM
practices. News paper, agriculture magazines, television, radio, Village knowledge
centres and mobile message services considered to be the accelerators of diffusion of
innovations. Farmers with constant touch with mass media were likely to have better
knowledge on current advances in technology. This result is line with the results of
Chatterjee (2000) and Gattu (2001)
Innovativeness versus Knowledge
It could be observed from the table 4.33 that there was positive and significant
relationship between innovativeness and knowledge level of Cotton ICM by FFS
farmers. Innovativeness associated with the individuals earliness in use of new
practices. The possession of this particular trait predisposes the individual for better
acquisition of technology in terms of knowledge about Cotton ICM practices, hence the
above trend was noticed. This result is line with the results of Kalaskar et al.(2001) and
Obaiah (2004).
Influence of Independent of variables on Knowledge of FFS and Non FFS farmers

Multiple regression analysis
Further to determine the combined effect of all selected independent variables in
explaining variation in Knowledge of FFS and non FFS farmers, multiple linear
regression analysis was carried out and the results presented in the Table 35,36,37.
A perusal of Table 4.34 revealed that in Warangal district the variation in
Knowledge by selected independent variables was explained to the extent of 73 percent
and 39 percent in FFS and Non FFS farmers. The unexplained variation to the extent of
27 percent in case of FFS farmers may be attributed to variables not included in this
study. Education in FFS farmers and farm size in Non FFS farmers contributed
significantly. The computed ‘F’ Value was 12.12, Hence it could be concluded that all
variables taken for the study together explained a significant amount of variation in
Knowledge of FFS farmers.
An over view of Table 4.35 revealed that in Kadapa district the variation in
Knowledge by selected independent variables was explained to the extent of 82 percent
and 17 percent in FFS and Non FFS farmers. The unexplained variation to the extent of
18 percent in case of FFS farmers may be attributed to variables not included in this
study. In FFS farmers Education and Innovativeness contributed significantly. The
computed ‘F’ Value was 20.67, Hence it could be concluded that all variables taken for
the study together explained a significant amount of variation in Knowledge of FFS
farmers.
A perusal of Table 4.36 revealed that in Guntur district the variation in
Knowledge by selected independent variables was explained to the extent of 85 percent
and 16 percent in FFS and Non FFS farmers. The unexplained variation to the extent of
15 percent in case of FFS farmers may be attributed to variables not included in this

study. In FFS farmers Age, Education and Risk orientation contributed significantly.
The computed ‘F’ Value was 26.20, Hence it could be concluded that all variables taken
for the study together explained a significant amount of variation in Knowledge of FFS
farmers.
From the above it is evident that Education in Warangal, Education and
Innovativeness in Kadapa and age, education and risk orientation in Guntur districts
contributed significantly for most of the variation in Knowledge of respondents about
ICM practices in Cotton. Therefore, it is clear that education level plays a vital role in
acquiring knowledge about Cotton ICM. The farmers with medium innovativeness will
have interest to learn and practice new farming practices in their fields and expose
themselves to different sources of information. The risk orientation is more in farmers
with higher education and innovativeness. Where as in case of non FFS farmers
Education and Farm size in Warangal district contributed significantly.
Relationship between selected profile characteristics of FFS and non FFS farmers with their Skill towards Cotton ICM practices
In order to study the relationship between selected profile characteristics of FFS
and non FFS farmers with their Skill towards Cotton ICM practices, correlation
coefficient s (r) were computed and presented in the Table 4.37
The relationship between the scores of selected independent variables and the
skill of FFS and Non FFS farmers was tested by relevant null and empirical hypotheses.
Null hypothesis: There will be no significant relationship between the selected
independent variables i.e age, education, experience, farm size ,mass media exposure,
extension contact, group orientation, market intelligence, risk orientation,
innovativeness, management orientation and the skill of FFS and Non FFS farmers.

Empirical hypothesis : There will be a significant relationship between the selected
independent variables i.e age, education, experience , farm size ,mass media exposure,
extension contact, group orientation, market intelligence, risk orientation,
innovativeness, management orientation and the skill of FFS and Non FFS farmers.
As seen from Table 4.37 that in Warangal district Education ( 0.86), Extension
contact (0.43),Group orientation (0.54), Market intelligence(0.55), Risk
orientation(0.57), Innovativeness (0.60) and Management orientation (0.60) were found
to be positively significant, Age (-0.47) and Experience (-0.43) were negatively
significant while Farm size and Mass media exposure were non- significant with Skills
on Cotton ICM. In case of Non FFS farmers except Education (0.332), Market
intelligence(0.273) remaining variable were found to be non-significant with Skill.
Hence the null hypothesis was rejected confirming the significant relationship between
scores on the independent variables and scores of Skill on ICM Cotton.
It was evident from the table 4.37 that in Kadapa district, Education ( 0.76),
Mass media exposure (0.42) were positively significant at 0.01 level of probability,
Extension contact (0.30) significant at 0.05 level, Age (-0.29) negatively non-
significant at 0.05 level while Experience, Farm size, Risk orientation were negatively
non-significant and rest of variables were non-significant with Skill of FFS farmers. In
case of Non FFS farmers Age, Experience in farming ,Farm size, Mass media exposure,
Market intelligence, Innovativeness were negatively and rest of the variables non-
significant with Skill. Hence the null hypothesis was rejected confirming the significant
relationship between scores on the independent variables and scores of Skill on ICM
Cotton.
It could be noted from the Table 4.37 in Guntur district, Education ( 0.869) was
positively significant at 0.01 level, Age, Experience were negatively non-significant
and rest of the variables were non-significant with Skill of FFS farmers on ICM Cotton.
In case of Non FFS farmers mass media, market intelligence were negatively and rest of
the variables non-significant with Skill on ICM Cotton. Hence the null hypothesis was
rejected confirming the significant relationship between scores on the independent
variables and scores of Skill on ICM Cotton.
An over view of table 4.37 indicate that Education, Mass media exposure and
Innovativeness were significant with Skill of FFS farmers on Cotton ICM practices,
whereas all the variables were found to be non -significant with skills of non FFS
farmers.
Discussion
Education versus Skill
Education had positive and significant relationship with skill learnt by FFS
farmers. It was quite logic that farmers with high education could learn skills of ICM
cotton and practice in their farm. This finding was in agreement with results of Kumar
(1996) and Ramakrishnan (1999).
Mass media exposure versus Skills
An over view of table 4.37 indicate that mass media exposure had significant
relationship with Skill learnt by FFS farmers. This might be due to increased exposure
to different media like T,V. D.V.Ds, Interactive C.D.s by FFS farmers. This result is
line with the results of Ramakrishnan (1999)
Innovativeness versus Skill

It could be observed from the table 4.37 that innovativeness is positively
significant with skills learnt by FFS farmers. Innovativeness is an individual’s interest
and inclination towards learning new skills. The individuals with high education learns
new skills easily and also transfer the same to his field condition. FFS also teach field
based skills to farmers. This result is line with the results of Obaiah (2004).
Influence of Independent of variables on Skill of FFS and Non FFS farmers
Multiple regression analysis
Further in order to determine the combined effect of all the independent
variables in explaining variation in skill of FFS and non FFS farmers towards Cotton
ICM practices, multiple linear regression analysis was carried out and the results were
presented in Tables 4.38,4.39 and 4.40
A perusal of Table 4.38 revealed that in Warangal district the variation in Skill
by selected independent variables was explained to the extent of 80 percent and 24
percent in FFS and Non FFS farmers. The unexplained variation to the extent of 20
percent in case of FFS farmers may be attributed to variables not included in this study.
Education and Farm size contributed significantly. The computed ‘F’ Value was 18.32,
Hence it could be conclude that all variables taken for the study together explained a
significant amount of variation in Skill of FFS farmers.
A perusal of Table 4.39 revealed in Kadapa district the variation in Skill by
selected independent variables was explained to the extent of 71 percent and 17 percent

in FFS and Non FFS farmers. The unexplained variation to the extent of 29 percent in
case of FFS farmers may be attributed to variables not included in this study. Age,
Education, Experience and Extension contact contributed significantly. The computed
‘F’ Value was 11.05, Hence it could be conclude that all variables taken for the study
together explained a significant amount of variation in Skill of FFS farmers.
A perusal of Table 4.40 revealed that Guntur district the variation in Skill by
selected independent variables was explained to the extent of 80 percent and 27 percent
in FFS and Non FFS farmers. The unexplained variation to the extent of 20 percent in
case of FFS farmers may be attributed to variables not included in this study. Education
and Group orientation contributed significantly. The computed ‘F’ Value was 17.56,
Hence it could be conclude that all variables taken for the study together explained a
significant amount of variation in Skill of FFS farmers.
Discussion : From the above it is clear that in Warangal district Education and Farming
experience, in Kadapa district Age, Education , Experience and Extension contact were
positively significant while in Guntur district Education and Group orientation
contributed significantly for most the of variation in the Skills of FFS farmers about
Cotton ICM practices.
It could be concluded from above that education helps an individual to
understand and practice the skill easily with regard to cotton ICM practices. More
experience in FFS programme enable the farmers to practice the skills and also to show
the same to other farmers. This finding need attention and there should be provision to
utilise services of experienced FFS farmers in training the newly selected FFS farmers,
there by transfer of skills will be essay from farmer to farmer.

Where as in non FFS farmers education and experience contributed significantly
as explained in case of FFS farmers.
Relationship between selected profile characteristics of FFS and non FFS farmers with their Adoption towards Cotton ICM practices
In order to study the nature of relationship between selected independent
variables and adoption of FFS and Non FFS farmers towards ICM Cotton , correlation
coefficient s (r) were computed and the values presented in the Table.4.41
The relationship between the scores of selected independent variables and the
adoption of FFS and Non FFS farmers was tested by null hypothesis and empirical
hypotheses.
Null hypothesis: There will be no significant relationship between the selected
independent variables i.e age, education, experience, farm size, mass media exposure,
extension contact, group orientation, market intelligence, risk orientation,
innovativeness, management orientation and the adoption of FFS and Non FFS farmers.
Empirical hypothesis : There will be a significant relationship between the selected
independent variables i.e age, education, experience, farm size ,mass media exposure,
extension contact, group orientation, market intelligence, risk orientation,
innovativeness, management orientation and the adoption of FFS and Non FFS farmers.
It can be seen from the Table 4.41 in Warangal district, Education
(0.89), Extension contact (0.33), Group orientation (0.499), Market intelligence (0.54),
Risk orientation(0.47), Innovativeness (0.54) and Management orientation (0.60) were
was positively significant at 0.01 level, Age, Experience were negatively significant at
0.01 level of probability and Farm size and Mass media exposure were non-significant
with Adoption. In case of Non FFS farmers Education (0.630) and Management

orientation (0.256) were positively significant and remaining variables were non-
significant with Adoption .Hence the null hypothesis was rejected and concluded that
the Adoption of farmers was dependent on independent variables and empirical
hypothesis was accepted.
It is clear from the Table 4.41 that in Kadapa district, Education ( 0.73), Mass
media exposure (0.45) were positively significant at 0.01 level, Innovativeness(0.27)
was significant at 0.05 level, Age, Experience, Farm size, Market intelligence, Risk
orientation were negatively non-significant and Extension contact, Group orientation
and Management orientation were non-significant with adoption. In case of Non FFS
farmers, Age (0.336) and Experience (0.322) were positively significant and rest of
variables were found to be non-significant with Adoption. Hence the null hypothesis
was rejected and concluded that the Adoption of farmers was dependent on independent
variables and empirical hypothesis was accepted.
It can be seen from the Table 4.41 in Guntur district, Education ( 0.821) was
positively significant at 0.01 level and Age, Experience, Extension contact, Group
orientation, Management orientation were negatively non-significant whereas Farm
size, Mass media exposure, Market intelligence, Risk orientation, Innovativeness were
non-significant with adoption. In case of Non FFS farmers except mass media exposure
and Market intelligence, all the variables were non- significant with Adoption. Hence
the null hypothesis was rejected and concluded that the Adoption of farmers was
dependent on independent variables and empirical hypothesis was accepted.
Discussion
It is clear from the Table 4.41 that computed ‘r’ values of independent variables
namely Education, Mass media exposure and Innovativeness were positively significant

whereas Age and Experience in farming found be negatively significant with
Knowledge level of FFS farmers on Cotton ICM practices. Whereas incase of non FFS
farmers age, education and experience were found to be positively significant
relationship with Adoption of Cotton ICM practices.
Age versus Adoption
It is evident from Table 4.41 that age was negatively significant with Adoption
of FFS farmers towards Cotton ICM. The probable reason might be that over aged
individuals ability to understand and analyse the new concept like FFS will be less and
also the affinity in old farm practices make them to reject new ideas. This finding was
in agreement with results of Raju (1999).
Age was significant relationship with Adoption of Cotton ICM practices in case
of non FFS farmers. The probable reason might be that more experience in Cotton
cultivation, education levels, sharing of ideas with experts etc contributed. This result is
accordance with results of Avinash Kumar Singh et al. (2003).
Education versus Adoption
It could be observed from the table 4.41 that Education had positive and
significant relationship with Adoption of Cotton ICM practices by FFS and non FFS
farmers. With increase in education, farmers have more information seeking habits
resulting better access to farm information sources to know latest recommendations.
Another fact that educated farmers had better understanding of new innovations which
might have made them to accept and adopt cotton ICM practices. Hence the above
relationship was noticed. This finding was in agreement with results of Avinash Kumar
Singh et al. (2003) Satish (2003).
Experience versus Adoption

It was obvious from the Table 4.41 that there was negative and significant
relationship between experience of FFS farmers on Cotton ICM practices. The probable
reason might be that with increased farming experience, farmers will have negative
attitude to adopt new practices particularly which involve risk. They have confidence in
their age old practices with which they could get good yields. This finding was in
agreement with results of Natarajan (2004)
Where as incase of non FFS farmers experience had positive relationship with
adoption. A farmer who had more experience might be knowing the potentiality,
applicability and utility of taking up more practices and aware of relevant remedial
measures incase of ill effects. This finding was in agreement with results of
Baswarajaiah (2001))
Mass media exposure versus Adoption
An over view of table 4.41 indicate that mass media exposure had significant
relationship with adoption of FFS farmers. Increased mass media exposure by different
sources provide enormous opportunity for repeated exposure to new technologies,
which in turn will lead to more adoption and lessen the gap in use of technology. This
might be the probable reason for this kind of relationship. High level of mass media
exposure enhances the respondents knowledge level on several aspects of the Cotton
ICM practices. This result is line with the results of Madhavilatha (2002).
Market intelligence versus Adoption
Market intelligence had negatively non significant relationship with adoption of
FFs practices .It is natural that market intelligence facilities was not available and useful
to small and marginal farmers .
Innovativeness versus Adoption

It could be observed from table 4.41 that there was positive and significant
relationship between innovativeness and adoption level of Cotton ICM by FFS farmers.
Innovators are early adopters of new ideas, information related to Cotton ICM. When
convinced of new technology, they were at a considerable advantage over others
because of the experience already gained which results in the continuous use over
considerable period of time. This result is line with the results of Ravishankar (2005).
Influence of Independent of variables on Adoption of FFS and Non FFS farmers
Multiple regression analysis
District wise Multiple regression analysis was carried out to determine the
combine effect of all independent variables on Adoption of FFS and Non FFS farmers.
A perusal of Table 4.42 indicate that in Warangal district the variation in
Adoption by selected independent variables was explained to the extent of 83 percent
and 51 percent in FFS and Non FFS farmers. The unexplained variation to the extent of
17 percent in case of FFS farmers may be attributed to variables not included in this
study. Education contributed significantly. The computed ‘F’ Value was 22.53, Hence it
could be concluded that all variables taken for the study together explained a significant
amount of variation in Adoption of FFS farmers.
Kadapa
A perusal of Table 4.43 revealed that in Kadapa district the variation in
Adoption by selected independent variables was explained to the extent of 66 percent
and 26 percent in FFS and Non FFS farmers. The unexplained variation to the extent of
27 percent in case of FFS farmers may be attributed to variables not included in this
study. Education and Innovativeness contributed significantly. The computed ‘F’ Value
was 8.66, Hence it could be conclude that all variables taken for the study together
explained a significant amount of variation in Adoption of FFS farmers.
Guntur
A perusal of Table 4.44 revealed that in Guntur district the variation in Adoption
by selected independent variables was explained to the extent of 73 percent and 20
percent in FFS and Non FFS farmers. The unexplained variation to the extent of 27
percent in case of FFS farmers may be attributed to variables not included in this study.
Age, Education and Experience contributed significantly. The computed ‘F’ Value was
12.29, Hence it could be concluded that all variables taken for the study together
explained a significant amount of variation in Adoption of FFS farmers.
Discussion : From the above it is clear that in Warangal district Education was
positively significant, in Kadapa district Education and Innovativeness were positively
significant and in Guntur district Age, Education and Farming experience contributed
significantly for the most of variation in the Adoption of FFS farmers about Cotton
ICM practices. It is clear that education is a motivating force in adoption of new
concepts. It triggers the earning to adoption process FFS farmers. In addition to
education, experience in FFS / farming also hastens the adoption of new concepts. This
finding indicates that for introduction of new technologies at field level, education and
experience should be considered.
Relationship between selected profile characteristics and Agro Ecosystem
Management of Cotton FFS

In order to study the nature of relationship between selected independent
variables and AEM of FFS and Non FFS farmers towards ICM Cotton, correlation
coefficient (r) were computed and the values presented in the Table 4.45.
The relationship between the scores of selected independent variables and the
AEM of FFS and Non FFS farmers was tested by null hypothesis and empirical
hypotheses.
Null hypothesis: There will be no significant relationship between the selected
independent variables i.e age , education, experience , farm size ,mass media exposure,
extension contact, group orientation ,market intelligence, risk orientation,
innovativeness, management orientation and the AEM of FFS and Non FFS farmers.
Empirical hypothesis: There will be significant relationship between the selected
independent variables i.e age, education, experience, farm size, mass media exposure,
extension contact, group orientation, market intelligence, risk orientation,
innovativeness, management orientation and the AEM of FFS and Non FFS farmers.
It can be seen from the Table 4.45 that in Warangal district, Education (0.59),
Group orientation(0.34), Market intelligence (0.303), Risk orientation (0.364),
Innovativeness (0.50) and Management orientation (0.56) were positively significant at
0.01 level, Mass media exposure was positively significant at 0.05 level, Age,
Experience were negatively significant at 0.05 level of probability, Farm size and
Extension contact were non-significant with Agro ecosystem management. In case of
Non FFS farmers Education (0.47) was positively significant, age, experience in
farming, farm size, Mass media exposure, Market intelligence were negatively non-
significant and rest of the variables were found to be non- significant with Agro
ecosystem management. Hence the null hypothesis was rejected and concluded that the
Agro ecosystem management of farmers was dependent on independent variables and
empirical hypothesis was accepted.
It is clear from the Table 4.45 that in Kadapa district, Education ( 0.69), Mass
media exposure (0.43) were positively significant at 0.01 level, Age and experience
were negatively significant at 0.05 level ,Farm size and Risk orientation were
negatively non-significant and Extension contact, Group orientation, Market orientation,
Innovativeness and Management orientation were non-significant with Agro ecosystem
management. In case of Non FFS farmers all the variables found to be non-significant
with Agro ecosystem management. Hence the null hypothesis was rejected and
concluded that the Agro ecosystem management of farmers was dependent on
independent variables and empirical hypothesis was accepted.
It can be seen from the Table 4.45 in Guntur district, Education ( 0.735) was
positively significant at 0.01 level and Age was negatively significant at 0.01 level,
Experience, Extension contact, Management orientation were negatively non-significant
whereas Farm size , Mass media exposure, Group orientation, Market intelligence, Risk
orientation, Innovativeness were non-significant with Agro ecosystem management. In
case of Non FFS farmers all the variables found to be non-significant with Agro
ecosystem management. Hence the null hypothesis was rejected and concluded that the
Agro ecosystem management of farmers was dependent on independent variables and
empirical hypothesis was accepted.
Discussion
It is clear from the Table 4.45 that computed ‘r’ values of independent
variables for all three districts namely Education, Mass media exposure and
Innovativeness were positively significant whereas Age and Experience in farming were

found be negatively significant with agro ecosystem management of FFS farmers on
Cotton ICM practices. Whereas incase of non FFS farmers all the variables were found
to be non- significant relationship with agro ecosystem management of Cotton ICM
practices.
Age versus agro ecosystem management
It is evident from the Table 4.45 that age was negatively significant with agro
ecosystem management of FFS farmers towards Cotton ICM. The probable reason
might be that with increase in age the ability to perceive new concepts and their
management is difficult, as some time they involve risk, costly, and yields less returns.
Education versus agro ecosystem management
It could be observed from the table 4.45 that Education had positive and
significant relationship with agro ecosystem management of Cotton ICM practices by
FFS farmers. Highly educated farmers know management skills about crop, the agro
ecosystem and biodiversity. The planning execution and implementation was also in
line with recommendations of experts.
Experience versus agro ecosystem management
It was obvious from the Table 4.45 that there was negative and significant
relationship between experience of FFS farmers on Cotton ICM practices. The probable
reason might be that with old age, rich experience in various crops ,farmers will look for
better profits with least risk. Therefore they have negative attitude to adopt new
practices particularly which involve risk.
Mass media exposure versus agro ecosystem management
An overview of Table 4.45 indicate that mass media exposure had significant
relationship with agro ecosystem management of FFS farmers. Mass media plays a

significant role in transfer of technology from lab to land. The farmers with easy access
to different sources of information might manage crops without disturbing the crop
surroundings.
Innovativeness versus agro ecosystem management
It could be observed from the table 4.45 that there was positive and significant
relationship between innovativeness and agro ecosystem management level of Cotton
ICM by FFS farmers. Innovators have optimistic thinking, approach towards new
concepts, they take risks and try new technologies and implement in their field.
Influence of Independent of variables on AEM of FFS and Non FFS farmers
Multiple regression analysis
District wise Multiple regression analysis was carried out to determine the combined
effect of all independent variables on AEM of FFS and Non FFS farmers.
A perusal of Table 4.46 revealed that in Warangal district the variation in Agro
ecosystem management by selected independent variables was explained to the extent
of 46 percent and 43 percent in FFS and Non FFS farmers. The unexplained variation to
the extent of 54 percent in case of FFS farmers may be attributed to variables not
included in this study. Education in FFS and Group orientation in Non FFS contributed
significantly. The computed ‘F’ Value was 3.77, Hence it could be concluded that all
variables taken for the study together explained a significant amount of variation in
Agro ecosystem management of FFS farmers.
Kadapa

A perusal of Table 4.47 revealed that in Kadapa district the variation in Agro
ecosystem management by selected independent variables was explained to the extent
of 56 percent and 46 percent in FFS and Non FFS farmers. The unexplained variation to
the extent of 44 percent in case of FFS farmers may be attributed to variables not
included in this study. Education in FFS and Market intelligence in Non FFS
contributed significantly. The computed ‘F’ Value was 5.72, Hence it could be
concluded that all variables taken for the study together explained a significant amount
of variation in Agro ecosystem management of FFS farmers.
Guntur
A perusal of Table 4.48 revealed that in Guntur district the variation in Agro
ecosystem management by selected independent variables was explained to the extent
of 64 percent and 23 percent in FFS and Non FFS farmers. The unexplained variation to
the extent of 36 percent in case of FFS farmers may be attributed to variables not
included in this study. Age, Education, Experience in farming and Risk orientation in
FFS and Management orientation in Non FFS contributed significantly. The computed
‘F’ Value was 8.029, Hence it could be concluded that all variables taken for the study
together explained a significant amount of variation in Agro ecosystem management of
FFS farmers.
Discussion : From the above it is clear that in Warangal district (Education), in Kadapa
district (Education) and in Guntur district (Age, Education, experience and risk
orientation) contributed significantly for the most of variation in the Agro ecosystem
management among FFS farmers about Cotton. In case of untrained farmers, Group
orientation and Market intelligence and Management orientation significantly
contributed in the Agro ecosystem management.
It is clear from the above that to practice AEM education is crucial, as it help to
understand the concept, analyze its feasibility and judges the adoptability. Experiences
also contributed in taking appropriate decisions about AEM practices and its cost
effectiveness. In case of non FFS farmers group orientation, management orientation,
market intelligence contributed significantly. This indicated that they have experience in
working groups like Rythu Mitra groups, Farmer’s club etc.
Relationship between selected profile characteristics and Decision making on
Cotton ICM Practices (District wise)
In order to study the nature of relationship between selected independent
variables and decision of FFS and Non FFS farmers towards ICM Cotton , correlation
coefficient s (r) were computed and the values presented in the Table 4.49.The
relationship between the scores of selected independent variables and the decision of
FFS and Non FFS farmers was tested by null hypothesis and empirical hypotheses.
Null hypothesis: There will be no significant relationship between the selected
independent variables i.e age, education, experience, farm size, mass media exposure,
extension contact, group orientation, market intelligence, risk orientation,
innovativeness, management orientation and the decision of FFS and Non FFS farmers.
Empirical hypothesis : There will be a significant relationship between the selected
independent variables i.e age, education, experience, farm size ,mass media exposure,

extension contact, group orientation, market intelligence, risk orientation,
innovativeness, management orientation and the decision of FFS and Non FFS farmers.
It can be seen from the Table 4.49 that in Warangal district, Education (0.85),
Extension contact (0.36), Group orientation(0.51), Market intelligence (0.54), Risk
orientation(0.52),Innovativeness (0.52) and Management orientation(0.59) were
positively significant at 0.01 level, Age, Experience were negatively significant at 0.01
level of probability and Farm size and Mass media exposure were non-significant with
Decision. In case of Non FFS farmers Education (0.50) and Management
orientation(0.33) were positively significant at 0.01 level and rest of the variables were
non significant with Decision .Hence the null hypothesis was rejected and concluded
that the Decision of farmers was dependent on independent variables and empirical
hypothesis was accepted.
It can be seen from the Table 4.49 that in Kadapa district, Education ( 0.75),
Mass media exposure(0.38) were positively significant at 0.01 level, Age ,Experience
were negatively significant whereas Farm size, Extension contact, Group orientation,
Market intelligence, Risk orientation, Innovativeness and Management orientation were
non-significant with Decision. In case of Non FFS farmers Risk orientation (0.262) was
positively significant at 0.01 level and Farm size was negatively significant with
Decision making. Hence the null hypothesis was rejected and concluded that the
Decision of farmers was dependent on independent variables and empirical hypothesis
was accepted.
It can be seen from the Table 4.49 that in Guntur district, Education ( 0.758)
was positively significant at 0.01 level, and Age was negatively significant at 0.01
level; Experience, Group orientation were negatively non-significant whereas Farm
size, Mass media exposure, Extension contact, Market intelligence, Risk orientation,
Innovativeness and Management orientation were non-significant with Decision. In case
of Non FFS farmers farm size was significant with Decision. Hence the null hypothesis
was rejected and concluded that the Decision of farmers was dependent on independent
variables and empirical hypothesis was accepted.
Discussion
It is clear from the Table 4.49 that computed ‘r’ values of independent
variables for all three districts namely Education, Innovativeness were positively
significant whereas Age and Experience in farming were found be negatively significant
with decision of FFS farmers on Cotton ICM practices. Whereas incase of non FFS
farmers Education and management orientation were found to be positively significant
relationship with decision of Cotton ICM practices.
Age versus Decision
It is evident from the Table 4.49 that age was negatively significant with decision of
FFS farmers towards Cotton ICM. As age increases the analytical skills to take
appropriate decision of individual decreased. This might be due to poor risk bearing
ability, lack of awareness, low mass media exposure. This finding was in agreement
with results of Mahitha Kiran (2000)
Education versus Decision
It could be observed from the table 4.49 that Education had positive and
significant relationship with decision on Cotton ICM practices by FFS and non FFS
farmers. With increase in education, farmers decision making ability will be increase.
The access to various sources of information , exposure visits might also contribute to
significance. This finding was in agreement with results of Natarajan (2004)

Experience versus decision
It was obvious from the Table 4.49 that there was negative and significant
relationship between experience of FFS farmers on Cotton ICM practices. The probable
reason might be that well experienced, farmers may not venture to take up latest
innovation with doubts in their mind about success. This finding was in agreement with
results of Sumana (1996)
Innovativeness versus decision
It could be observed from the table 4.49 that there was positive and significant
relationship between innovativeness and decision making level of FFS farmers
indicating that more the innovativeness, greater the would be the decision making
behaviour. It was natural that an individual receptive to new ideas and information on
Cotton ICM tries to experiment with them and takes decisions quickly. The result is line
with the results of Ravishankar (2005) .
Management orientation versus Decision
It is clear that from table 4.49 that management orientation of Non FFS farmer had
positively significant relationship with decision making. This might be due to their vast
experience in farm management. Good managers always take smart decisions and
become model farmers.
Influence of Independent of variables on Decision making of FFS and Non FFS
farmers
Multiple regression analysis
District wise Multiple regression analysis was carried out to determine the
combine effect of all independent variables on Decision making of FFS and Non FFS
farmers

A perusal of Table 4.50 revealed that in Warangal district, the variation in
Decision by selected independent variables was explained to the extent of 78 percent
and 36 percent in FFS and Non FFS farmers. The unexplained variation to the extent of
22 percent in case of FFS farmers may be attributed to variables not included in this
study. Education contributed significantly. The computed ‘F’ Value was 15.47, Hence it
could be concluded that all variables taken for the study together explained a significant
amount of variation in Decision of FFS farmers.
Kadapa
A perusal of Table 4.51 revealed that in Kadapa district, the variation in
Decision by selected independent variables was explained to the extent of 63 percent
and 54 percent in FFS and Non FFS farmers. The unexplained variation to the extent of
37 percent in case of FFS farmers may be attributed to variables not included in this
study. Education contributed significantly. The computed ‘F’ Value was 7.60, Hence it
could be conclude that all variables taken for the study together explained a significant
amount of variation in Decision of FFS farmers.
Guntur
A perusal of Table 4.52 revealed that in Guntur district, the variation in Decision
by selected independent variables was explained to the extent of 70 percent and 39
percent in FFS and Non FFS farmers. The unexplained variation to the extent of 30
percent in case of FFS farmers may be attributed to variables not included in this study.
Age, Education, Farming experience and Risk orientation contributed significantly. The
computed ‘F’ Value was 10.67, Hence it could be conclude that all variables taken for
the study together explained a significant amount of variation in Decision of FFS
farmers.

Discussion : From the above it is clear that in Warangal (Education), in Kadapa district
(Education) and in Guntur district (Education, experience and risk orientation) were
contributed significantly for the most of variation in the Agro ecosystem management
FFS farmers about Cotton. In case of non FFS farmers Extension contact and Market
intelligence contributed significantly in decision making
It is clear that education level plays a vibrant role in analyzing the crop situation and
take appropriate decisions on Cotton FFS practices. Education helps FFS farmers to
assess the new concepts and take correct decisions. The farmers with more experience
in FFS programme take quick decisions and adopt FFS practices. Education and
experience are like modern and traditional visions of Agriculture.
4.10 Constraints and suggestions from FFS farmers and Extension officials to
formulate appropriate strategy for effective functioning of FFS Programme
Table 4.53 : Constraints expressed by FFS Farmers
N=180
S.No Problem Frequency Percentage Rank 1 Non supply of required Quality inputs on
time 148 82 1
2 Delay in soil test reports drawn for FFS programme
138 77 2
3 Short term and long term experiments are not planned and conducted regularly
129 72 3
4 Wide Publicity is lacking 125 69 4
5 Women participation is less 124 69 4
6 Effective linkages should be provided to market their produce at higher price
108 60 5
7 Conducting department meetings on FFS days disrupting FFS
92 51 6
8 Amount allotted per week is not sufficient 85 47 8

9 Non- involvement of experts in FFS sessions
82 46 9
10 Awards and incentives for best FFS is not there for motivating farmers.
80 44 10
A perusal of table 4.53 revealed that a high majority (82%) of FFS farmers
expressed ‘non supply of required Quality inputs on time as the major constraint, this
indicate that there is need to supply all the critical inputs in advance for successful
conducting of FFS programme by Department of Agriculture.
While 77.00 per cent of farmers perceived delay in soil test reports drawn for
FFS programme as the next major constraint. This calls the attention of Department
agriculture to make arrangements to test soil samples of FFS farmers and results should
be made available to use in FFS programme.
Short term and long term experiments are not planned, and conducted regularly by
72.00 per cent of FFS farmers. The major reason was lack of awareness to facilitators
and busy schedule of officers.
Wide Publicity is lacking and women participation is less by 69.00 per cent. Therefore
publicity should be given by utilizing mass media like press ,T.V and print media for
encouraging other farmers towards FFS programme. Similarly women should be
encouraged to participate in FFS as majority of agriculture operations were done by
women.
Effective linkages should be provided to market their produce at higher price (60%) ,
51 per cent expressed conducting department meetings on FFS days disrupting FFS as
constraint , 47.00 per cent revealed amount allotted per week is not sufficient as a
limitation , 46.00 percent opined non- involvement of experts in FFS sessions as yet

another constraint, while 44.00 percent of farmers viewed awards and incentives for
best FFS is not there for motivating farmers were the other constraints in FFS
programme implementation.
4.10.2 Suggestions given by farmers
Table 4.54 : Suggestions given by farmers
S.No Suggestion Frequency Percentage Rank 1 All FFS Inputs should be supplied well in
advance 146 81 1
2 Soil sample analysis and results should be communicated immediately
135 75 2
3 Short term and long term experiments should be planned and conducted regularly
123 68 3
4 Better market facilities or linkages should be created for getting remunerative returns
119 66 4
5 Wide publicity to FFS 108 60 5
6 Experts should be involved in sessions 105 58 6
7 No other meetings should be conducted on FFS days
105 58 7
8 More Women should be involved 95 53 8
9 Low cost technologies should be popularized
92 51 9
10 Upscaling of FFS should be done based on results of good FFS
88 49 10
11 Awards and incentives for best FFS should be initiated.
85 47 11
The major suggestions given by FFS farmers were, All FFS Inputs should be supplied
well in advance by (81%) , soil sample analysis and results should be communicated
immediately by (75%), short term and long term experiments should be planned and
conducted regularly by (68%), better market facilities or linkages should be created for

getting remunerative returns by (66%),, wide publicity to FFS by (60%), experts should
be involved in sessions by (58%), no other meetings should be conducted on FFS
days(58%), more Women should be involved (53%), low cost technologies should be
popularized(51%), upscaling of FFS should be done based on results of good FFS(49%)
and awards and incentives for best FFS should be initiated by (47%) of the framers..
4.10.3. Constraints expressed by officials:
Table 4.55 : Constraints expressed by officials
N= 18
S.No Problem Frequency Percentage Rank
1 No Mobility or vehicle facility to visit FFS sessions punctually
18 100 1
2 Budget and funds/ inputs are not released in time
18 100 1
3 FFS should not be purely target oriented
18 100 1
4 Insufficient funds for weekly classes 18 100 1
5 No motivation for good FFS programme to farmers and Officers
15 83 2
6 Lack experience to field staff in FFS 13 72 3
7 Lack of buyback facilities for quality produce
13 72 3
8 There is no scope to bring experts in sessions
12 66.66 4
9 Other meetings are conducted on FFS days
12 66.66 4
10 There is no revolving fund for conducting FFS at agril officer level
10 55.55 5
The officials expressed that no Mobility or vehicle facility to visit FFS sessions
punctually , budget and funds/ inputs are not released in time , FFS should not be purely
target oriented, insufficient funds for weekly classes by (100%) as a major constraints.

No motivation for good FFS programme to farmers and Officers by (83%), lack
experience to field staff in FFS by (72%) , lack of buyback facilities for quality produce
by (72%), there is no scope to bring experts in sessions by (66.66%), other meetings are
conducted on FFS days by (66.66%) and there is no revolving fund for conducting FFS
at agril.officer level by (55.55%) constraints in implementing the FFS programme.
4.10.4 Suggestions given by officials
Table 4.56 : Suggestions given by officials
S.No Suggestion Frequency Percentage Rank
1 Mobility / Vehicle should be provided to Officers for punctual work
18 100 1
2 Target and crop should be decided by Agril Officers
15 83 2
3 Funds should be released well in advance 15 83 2
4 Timely supply of critical inputs 12 67 3
5 No other Meetings should be conducted on FFS days
12 67 3
6 Season long technical training programme to newly recruited staff on FFS
12 67 3
The officials suggested that Mobility / Vehicle should be provided to Officers
for punctual work (100%), target and crop should be decided by Agril Officers by
(83%) ,funds should be released well in advance by (83 %), timely supply of critical
inputs ,no other Meetings should be conducted on FFS days and season long technical
training programme to newly recruited staff on FFS by (67%), for proper and successful
implementation of FFS programme.
Strategy for empowerment of farmers and better implementation of FFS

Farmer empowerment remains a central component for agricultural sector development
and an important pillar for a country’s overall development. The Strategy formulated for
empowering farmers and successful implementation of FFS is presented as per the
personal observation, interaction with stake holders , constraints and suggestions by the
respondents apart from findings of research.
Strategy can be broadly divided into Administrative, Technological and Extension
strategies.
Administrative
1. Package & Placement:
The study revealed that majority of farmers and extension officials expressed for supply
of critical inputs and release of funds in time for effective implementation of FFS
programme. All sorts of Govt assistance like funds placement or input placement
should be done well in advance before the onset of the season so that FFS can be
implemented in a systematic manner. It gives time to plan and execute all Pre and Post
FFS activities efficiently in time.
2. Capacity building programmes for newly recruited officers for effective
implementation of FFS
Imparting and updating necessary knowledge and skill to newly recruited officers by
conducting capacity building training programmes like Season Long Training
Programme [SLTP] is essential so that FFS can be conducted successfully. The trained
officers should not be given other duties or meetings especially on the days when they
are supposed to conduct FFS. This recalls the suggestion made by officials during their
interaction with the researcher.
3. Targets For FFS
FFS should not be target oriented. All new interventions like FFS programmes which
are proactive and change oriented and also have risk taking feature, hence FFS should
not be target oriented because their success depends on voluntary participation rather
than on demand participation.
4. Flexibility and independence should be given to local officials for effective
implementation of FFS
The study revealed that most of the interventions are designed by top to down approach,
not permitting any modification according to location specific needs. Therefore to
explore the inner potential of farmers and officers the controlling authority should
formulate flexible guidelines for FFS. All issues and factors for good productivity are
location specific and sufficient flexibility should be there for effective planning and
implementation of weekly sessions based on needs and baseline survey. Based on
critical gaps the short and long term experiments should be finalized. There should be
scope for mid- season correction by experts intervention during their monitoring.
Technological
1. Low cost and ecofriendly technologies and ITKs should be popularized in FFS
programmes

The low cost technologies especially ITK methods should be given due importance in
FFS package as these yield maximum returns with less cost and maintain ecological
balance thus protecting beneficial insects. The research finding revealed that except
neem based ITKs no other ITKs are used by FFS farmers. This calls attention of
scientific and extension officials to identify, refine, standardize the ITKs and include in
FFS package as per location specific needs.
2. Involvement of experts in FFS programs to boost the morale of farmers and
officials
FFS is field based technical activity, therefore backstopping by experts should also be
made mandatory as to build farmer’s confidence on technology by clarifying
apprehensions and the doubts. The study revealed that most of the officials and farmers
expressed that participation of scientists should be made mandatory to take forward the
FFS concept.
3. Research should be initiated and develop a crop wise package for FFS
The need based research by the university and research institutes on FFS, ITKs their
applicability and validity is the need of the hour. The findings revealed that skills like
preparation of Trichoderma viridae and its performance should be shown to farmers at
field level. Therefore a detailed study of cost of cultivation and ecosystems is highly
essential to take forward the FFS technology.
Extension strategies

1. Motivational incentives and awards should be sanctioned for best FFS villages
It can be elicited from the findings that both farmer and officials suggested to encourage
the best FFS by giving some incentive / awards as it acts as stimulating force to other
FFS groups and encourage them to perform better. Motivation is the driving force for
successful implementation of any programme. The staff and farmers should be
motivated by recognizing their services in FFS. Based on the performance indicators
officials and farmers should be awarded during field day gatherings.
2. Strengthen the farmers with training programmes
The finding revealed that there is need to give regular training programmes to newly
selected farmers by experienced FFS facilitator/ master trainers at mandal level.
Capacity building is the only way to reap fruitful results of new technology as
methodology. Identification of critical gaps and strategies to bridge will always help to
pull on the right track.
3. Monitoring team at District level
As per the study most of the farmers and officials opined that there is no proper
monitoring of FFS activities therefore a monitoring team should be formed to inspect
regularly and guide / suggest/ correct FFS implementation effectively. There should be
a team with experts and DDA cadre officer for regular monitoring of FFS. The team
must visit all the mandals at least once in season and ascertain the actual field situation.
The feedback from concurrent monitoring and evaluation will help to formulate reforms
and refinement of the technology.

4.Up scaling of FFS technologies should be done based on results of good FFS
To up scale the good FFS practices, wide publicity need to be given, critical inputs must
be supplied at right time. The findings confirmed that lack of publicity about FFS
programmes is a hurdle in taking FFS programme in a bigger way. Therefore wide
publicity should be given on FFS programmes by conducting field days, involving local
body representatives and district level officials.The success stories of FFS should be
published in all agril. farm magazines for motivating other farmers to adopt the FFS
practices and harvest rich benefits with low cost.
5. Farmer as facilitator: The successful farmers may be utilized as motivators in new
villages. Motivational strategies like awards and recognition certificates should be
given every year on Ugadi or Sankranti festival day.
6. Documentation of FFS activities.
Documentation of FFS as a necessary record of work done is an element for bringing in
transparency and in up scaling of FFS programmes. FFS registers; Photographs during
sessions, Agro Ecosystem System Analysis charts and field boards speak volumes of the
way FFS is conducted.
4.11 EMPIRICAL MODEL OF THE STUDY

Table 4.1 : Distribution of FFS and Non FFS farmers based on their age
S. No Category
Warangal Kadapa Guntur Total
FFS % Non FFS % FFS % Non
FFS % FFS % Non
FFS % FFS % Non
FFS %
1 Young [below 35 years]
24 40.00 13 21.66 6 10.00 13 21.66 20 33.33 22 36.66 50 27.77 48 26.6
2 Middle [35-58 years]
35 58.33 42 70.00 52 86.66 44 73.33 39 65.00 36 60.00 126 70.00 124 67.7
3 Old [Above 58 years]
1 1.66 3 5.00 2 3.33 3 5.0 1 1.66 2 3.33 4 2.3 8 4.6
Total 60 60 60 60 60 60 180 180 Mean 37.5 41.48 41.75 42.46 37.66 40.11
S.D 9.75 8.77 7.27 9.06 7.11 10.24

Table 4.2 : Distribution of respondents according to their education
S. No Category
Warangal Kadapa Guntur Total
FFS % Non FFS % FFS % Non
FFS % FFS % Non
FFS % FFS % Non
FFS %
1 Illiterate 11 18.33 15 25.00 1 1.66 21 35.00 4 6.66 18 30.00 16 8.8 54 30.00
2 Primary school 10 16.66 28 46.66 14 23.33 16 26.66 13 21.66 28 46.66 37 20.55 72 40.0
3 High school 19 31.66 13 21.66 26 43.33 17 28.33 24 40.00 10 16.66 69 38.33 40 22.2
4 Intermediate 14 23.33 3 5.00 11 18.33 5 8.33 15 25.00 4 6.66 40 22.22 12 6.66
5 Graduate 6 10.00 1 1.66 8 13.33 1 1.66 4 6.66 0 0 18 10 2 1.11
6 Post Graduate 0 0 0 0 0 0 0 0 0 0
Total 60 60 60 60 60 60 180 180 Mean 2.9 2.11 3.18 2.15 3.03 1.98
S.D 1.24 0.90 0.99 1.05 1.00 0.83

Table 4.3: Distribution of respondents according to their experience (In farming)
S. No Category
Warangal Kadapa Guntur Total
FFS % Non FFS % FFS % Non
FFS % FFS % Non
FFS % FFS % Non
FFS %
1 3-13 years 34 56.66 32 53.33 19 31.66 25 41.66 39 65.00 34 56.66 92 51.11 91 50.55
2 14-27 years 18 30.00 5 8.33 35 58.33 27 45.00 21 35.00 25 41.66 64 35.55 57 31.66
3 27 years and above 8 13.33 23 38.33 6 10.00 8 13.33 -- 1 1.66 14 7.77 32 17.7
Total 60 60 60 60 60 60 180 180
Mean 14.03 13.9 17.23 16.45 11.68 12.16
S.D 8.61 7.36 7.05 8.53 4.94 6.84

Table 4.4 : Distribution of respondents according to their farm size
S.No Category Warangal Kadapa Guntur Total
FFS % Non FFS % FFS % Non
FFS % FFS % Non
FFS % FFS % Non
FFS %
1 Marginal [2.5 ac] 11 18.33 19 31.66 5 8.33 23 38.33 13 21.66 18 30.00 29 16.11 60 33.33
2 Small [2.5 to 5 ac] 44 73.33 35 58.33 33 55.00 25 41.66 34 56.66 35 58.33 111 61.66 95 52.77
3 Big [Above 5 ac] 5 8.33 6 10.00 22 36.66 12 20.00 13 21.66 7 11.66 40 22.22 25 13.88
Total 60 60 60 60 60 60 180 180 Mean 3.25 3.21 4.26 3.56 3.66 3.03
S.D 1.18 1.42 1.80 1.78 1.84 1.28

Table 4.5 : Distribution of respondents according to their mass media exposure
S.No Category Warangal Kadapa Guntur Total
FFS % Non FFS % FFS % Non
FFS % FFS % Non
FFS % FFS % Non
FFS %
1 Low 12 20.00 23 38.33 16 26.66 26 43.33 13 21.66 17 28.33 41 22.77 66 36.66
2 Medium 37 61.66 23 38.33 36 60.00 17 28.33 34 56.66 28 46.66 107 59.44 68 37.77
3 High 11 18.33 14 23.33 8 13.33 17 28.33 13 21.66 15 25.00 32 17.77 46 25.55
Total 60 60 60 60 60 60 180 180 Mean 11.65 6.51 12.63 6.03 11.65 7.10
S.D 2.29 1.56 2.62 1.42 2.29 2.04

Table 4.6 : Distribution of FFS and Non FFS farmers based on their extension contact
S.No Category Warangal Kadapa Guntur Total
FFS % Non FFS % FFS % Non
FFS % FFS % Non
FFS % FFS % Non
FFS %
1 Low 10 16.66 18 30.00 6 10.00 20 33.33 22 36.66 19 31.66 38 21.11 57 31.66
2 Medium 40 66.66 29 48.33 46 76.66 35 58.33 29 48.33 30 50.00 115 63.88 94 52.22
3 High 10 16.66 13 21.66 8 13.33 5 8.33 9 15.00 11 18.33 27 15.00 29 16.11
Total 60 60 60 60 60 60 180 180 Mean 13.31 6.86 13.16 6.43 13.15 8.33
S.D 2.57 1.56 1.93 1.45 1.64 2.60

Table 4.7: Distribution of FFS and Non FFS farmers based on their group orientation
S.No Category Warangal Kadapa Guntur Total
FFS % Non FFS % FFS % Non
FFS % FFS % Non
FFS % FFS % Non
FFS %
1 Low 10 16.66 16 26.66 11 18.33 21 35.00 14 23.33 20 33.33 35 19.44 57 31.66
2 Medium 36 60.00 33 55.00 32 52.33 24 40.00 28 46.66 27 45.00 96 53.33 84 46.66
3 High 14 23.33 11 18.33 17 28.33 15 25.00 18 30.00 13 21.66 49 27.22 39 21.66
Total 60 60 60 60 60 60 180 180
Mean 15.38 8.13 13.75 6.58 13.63 7.45
S.D 2.12 1.71 1.68 1.31 1.69 1.83

Table 4.8 : Distribution of FFS and Non FFS farmers based on their market intelligence
S.No Category Warangal Kadapa Guntur Total
FFS % Non FFS % FFS % Non
FFS % FFS % Non
FFS % FFS % Non
FFS %
1 Low 13 21.66 16 26.66 12 28.33 20 33.33 12 20.00 13 21.66 37 20.55 49 27.22
2 Medium 34 56.66 31 51.66 35 58.33 22 36.66 29 48.33 36 60.00 98 54.44 89 49.44
3 High 13 21.66 13 21.66 13 13.33 18 30.00 19 31.66 11 18.33 45 25.00 42 23.33
Total 60 60 60 60 60 60 180 180
Mean 18.85 7.08 20.15 7.9 20.76 9.26
S.D 2.07 1.61 1.16 1.18 1.43 2.38

Table 4.9 : Distribution of FFS and Non FFS farmers based on their risk orientation
S.No Category Warangal Kadapa Guntur Total
FFS % Non FFS % FFS % Non
FFS % FFS % Non
FFS % FFS % Non
FFS %
1 Low 17 28.33 21 35.00 9 15.00 20 33.33 12 20.00 11 18.33 38 21.11 52 28.88
2 Medium 28 46.66 25 41.66 43 71.66 23 38.33 30 50.00 34 56.66 101 56.11 82 45.55
3 High 15 25.00 14 23.33 8 13.33 17 28.33 18 30.00 15 25.00 41 22.77 46 25.55
Total 60 60 60 60 60 60 180 180
Mean 14.86 7.38 16.01 7.61 16.7 9.61
S.D 2.14 1.48 1.56 1.69 1.67 2.63

Table 4.10 : Distribution of FFS and Non FFS farmers based on their innovativeness
S.No Category Warangal Kadapa Guntur Total
FFS % Non FFS % FFS % Non
FFS % FFS % Non
FFS % FFS % Non
FFS %
1 Low 13 21.66 22 36.66 13 21.66 18 30.00 16 26.66 18 30.00 42 23.33 58 32.22
2 Medium 32 53.33 25 41.66 33 55.00 30 50.00 25 41.66 24 40.00 90 50.00 79 43.88
3 High 15 25.00 13 21.66 14 23.33 12 20.00 19 31.66 18 30.00 48 26.66 43 23.88
Total 60 60 60 60 60 60 180 180
Mean 16.65 7.91 18.51 7.95 17.75 9.71
S.D 2.52 1.85 1.73 1.62 1.73 3.06

Table 4.11 : Distribution of FFS and Non FFS farmers based on their management orientation
S.No Category Warangal Kadapa Guntur Total
FFS % Non FFS % FFS % Non
FFS % FFS % Non
FFS % FFS % Non
FFS %
1 Low 9 15.00 17 28.33 10 16.66 12 20.00 12 20.00 13 21.66 31 17.22 42 23.33
2 Medium 39 65.00 29 48.33 36 60.00 36 60.00 34 56.66 36 60.00 109 60.55 101 56.11
3 High 12 20.00 14 23.33 14 23.33 12 20.00 14 23.33 11 18.33 40 22.22 37 20.55
Total 60 60 60 60 60 60 180 180
Mean 52.83 21.40 56.66 29.33 55.50 23.61
S.D 5.21 4.49 3.06 7.79 2.58 7.05

Table 4.12 : Distribution of FFS and Non FFS farmers respondents based on their Attitude towards FFS
S.No Category Warangal Kadapa Guntur Total
FFS % Non FFS % FFS % Non
FFS % FFS % Non
FFS % FFS % Non
FFS %
1 Less favourable 10 16.66 23 38.33 11 18.33 13 21.66 11 18.33 18 30.00 32 17.77 54 30.00
2 Moderately favourable attitude
35 58.33 28 46.66 45 75.00 39 65.00 36 60.00 33 55.55 106 58.88 100 55.55
3 More favourable attitude
15 25.00 9 15.00 14 23.33 8 13.33 13 21.66 9 15.00 42 23.33 26 14.44
Total 60 60 60 60 60 60 180 180
Mean 73.91 38.06 76.98 41.96 79.13 32.06
S.D 16.25 6.73 17.3 8.4 15.85 6.1

Table 4.13 : Difference in the attitude of FFS and Non FFS farmers towards FFS programme [District wise]
S.No. Category Size of
the sample
Warangal Kadapa Guntur
Mean S.D. Z value Mean S.D. Z value Mean S.D. Z value
1. FFS farmers 60 73.91 16.25
56.31*
76.98 17.3
51.81*
79.13 15.85
76.19* 2. Non FFS farmers 60 38.06 6.73 41.96 8.56 32.0 6.1
*- Significant at 0.05 level of probability
Table 4.14 : Distribution of FFS and Non FFS farmers respondents based on their Knowledge on ICM Cotton
S.No Category Warangal Kadapa Guntur Total
FFS % Non FFS % FFS % Non
FFS % FFS % Non
FFS % FFS % Non
FFS %
1 Low 8 13.33 21 35.00 13 21.66 20 33.33 11 18.33 24 40.00 32 17.77 65 36.11
2 Medium 38 63.33 30 50.00 32 53.33 28 46.66 34 56.66 26 43.33 104 57.77 84 46.66
3 High 14 23.33 9 15.00 15 25.00 12 20.00 15 25.00 10 16.66 44 24.44 31 17.22
Total 60 60 60 60 60 60 180 180 Mean 19.56 10.8 18.43 10.95 19.03 11.2
S.D 2.38 1.86 3.57 1.89 3.81 2.06

Table 4.15 : Response analysis of knowledge items by FFS farmers and Non FFS
Knowledge
S.No Knowledge item
FFS farmers [n=180) Non Farmers [n=180] Correct Incorrect Correct Incorrect
Frequency % Frequency % Frequency % Frequency % 1 Cotton+ Greengram intercropping ratio is
a]. 1: 3 b] 1: 6 c] 2:6 d] 1: 8 123 68 57 32 98 54 82 46
2 Neem oil is a] Insecticide b]Repellent c] Anti feedent d] All
148 82 32 118
102 57 72 43
3 Reddening of leaves from boarder is symptom of a] Zn deficiency b] Mg Deficiency c] Jassids d] Boran deficiency
132 73 48 27 56 31 124 69
4 Insecticide used for Stem application a] Endosulfan b] Chlorpyriphos c] Monocrotophos d] all the chemicals
156 87 24 13 74 41 106 59
5 Cotton should only be grown on ------------ soils for better yields. a] Black soils b] Red light soils c] Sandy soils d]Any soil
125 69 45 31 88 49 92 51
6 Pest and defender ratio in FFS is a] 4:1 b] 1:2 c] 3:1 d] 5:1
132 73 48 27 45 25 135 75
7 NPV Virus solution is sprayed against a] Heliothis b] Pink boll worm c] Stem borer c] None
145 81 35 19 72 40 108 60
8 Bt formulation should be sprayed during a] Morning b] Noon time c] Evening d] Any time
128 71 52 29 69 38 111 62
9 Stem application is done up to ----days a] 90 b] 30 c] 60 d] any time
112 62 68 38 76 42 104 58
10 Latest concept of FFS is a] ICM b] IPM c] INM d] None
126 70 44 30 62 34 118 66
11 Refugee Bt is sown in ---- rows around Bt Cotton. 105 58 75 42 45 25 135 75 12 Trap crop for Spodoptera is --------------------------- 124 69 66 31 69 44 101 56 13 Potassium fertilizer is applied for better ----------- quality 138 77 42 23 48 27 132 73

S.No Knowledge item
FFS farmers [n=180) Non Farmers [n=180] Correct Incorrect Correct Incorrect
Frequency % Frequency % Frequency % Frequency % 14 Dose of Zinc sulphate per acre is-------------- 122 68 58 32 58 38 112 62 15 Boll cracking is due to deficiency of ------------------. 118 66 62 34 32 18 148 82 16 Sticky traps are used against ------------------- 145 81 35 19 46 26 134 74 17 No. of Bird perches per acre of cotton--------------- 158 88 22 12 82 46 98 54 18 Deep summer ploughing and destruction of crop residue help to
reduce pest/ diseases. T/F 164 91 16 9 98 54 82 46
19 Selection of suitable hybrid will give good yields. T/F 158 88 22 12 105 58 75 42 20 Indiscriminate spray of insecticides is prime reason for increase in
cost of cultivation T/F 145 81
35 19 115 64 65 26
21 Timely sowing helps in overcoming pest problem T/F 124 69 56 31 78 43 102 57 22 Sowing of Cotton in light soils is risk taking T/F 136 76 44 24 85 47 95 53 23 Better drainage is required for Cotton cultivation T/F 128 71 52 29 74 41 106 59 24 Crop rotation helps in maintaining soil fertility T/F 115 64 65 36 95 53 85 47 25 Stem application conserves natural predators T/F 125 69 55 31 46 26 134 74 26 Do you know the inter crops of cotton Yes/No
If Yes please mention a few 116 64 64 36 56 31 124 69
27 Do you know the seed treatment chemical for wilt disease Yes/No If Yes name one chemical
108 60 72 40 35 19 145 81
28 Do you know about pheromone trap action Yes/No If Yes what is the use
142 79 38 21 46 26 134 74
29 Do you know the boarder crops grown in Cotton Yes/No If Yes mention few
118 66 62 34 58 32 122 68
30 Do you know about soil testing Yes/No If Yes mention the weight of Soil sample to be sent to STL
142 79 38 21 56 31 124 69

Table 4.16 : Difference in the Knowledge of FFS and Non FFS farmers on ICM Cotton [District wise]
S.No. Category Size of
the sample
Warangal Kadapa Guntur
Mean S.D. Z value Mean S.D. Z value Mean S.D. Z value
1. FFS farmers 60 19.56 2.38 29.21*
18.43 3.57 21.47*
19.03 3.81 21.88*
2. Non FFS farmers 60 10.8 1.86 10.95 1.9 11.2 2.06
*- Significant at 0.05 level of probability

Table 4.17 : Distribution of FFS and Non FFS farmers respondents based on their Skills learnt on ICM Cotton practices
S.No Category Warangal Kadapa Guntur Total
FFS % Non FFS % FFS % Non
FFS % FFS % Non
FFS % FFS % Non
FFS %
1 Low 10 16.66 12 20.00 9 15.00 22 36.66 12 20.00 17 28.33 31 17.22 51 28.33
2 Medium 38 63.33 32 53.33 36 60.00 21 35.00 30 50.00 32 53.33 104 57.77 85 47.22
3 High 12 20.00 16 26.66 15 25.00 17 28.33 18 30.00 11 18.33 45 25.00 44 24.44
Total 60 60 60 60 60 60 180 180
Mean 22.36 11.60 22.66 11.95 22.3 12.38
S.D 5.09 1.79 5.54 2.32 6.43 2.34

Table 4.18 : Response analysis skill of FFS and Non FFS farmers about Cotton ICM practices
S.No Skill
FFS Farmers Non FFS Farmers
Skilled Partially skilled unskilled Skilled Partially
skilled unskilled
F % F % F % F % F % F % 1 Collection of soil samples 118 66 34 19 28 15 35 19 28 15 117 66
2 Seed treatment 106 59 51 28 23 13 54 30 35 19 91 51
3 Stem application with Pesticide 125 69 35 19 20 11 46 26 49 27 85 47
4 Poison bait preparation 98 54 62 34 20 11 63 35 32 18 85 47
5 Seed germination test 123 68 45 25 12 9 59 33 42 23 79 44
6 Cage study 95 53 26 14 59 23 17 9 25 14 138 77
7 Water holding capacity of different soils
65 36 45 25 70 39 19 11 15 8 146 81
8 Cotton Eco System Analysis : Identification of a. Crop condition [Age of the crop, No.of Bolls etc] b. Field condition [Moisture condition] c. Pests d. Natural enemies of Pests [Spiders, Parasites, Wasps ] e. Weeds
145 81 128 71 138 77 143 79 95 53
29 16 43 24 35 19 31 17 57 32
6 3 9 5 7 4 6 3 28 15
68 38 72 40 65 37 45 25 23 13
25 14 19 11 35 19 28 16 16 9
87 48 89 49 80 44 107 59 141 78
9 Tricho cards preparation 42 23 38 21 100 56 8 5 15 8 157 87

S.No Skill
FFS Farmers Non FFS Farmers
Skilled Partially skilled unskilled Skilled Partially
skilled unskilled
F % F % F % F % F % F % 10 Identification of deficiency of
micro nutrients 125 69 43 24 12 9 23 13 29 16 128 71
11 Identification infestation of sucking pests.
132 73 35 19 13 8 42 23 38 21 100 56
12 Preparation of NPV 84 47 42 23 54 30 21 12 19 11 140 77
13 Identification of dead larvae due to Bt spray.
148 82 25 14 7 4 65 37 42 23 73 40
14 Preparation of NSKE 126 70 42 23 12 9 32 18 28 15 120 67
15 Preparation of spray fluid 115 64 28 16 37 20 42 23 25 14 113 73
16 Preparation of Green chilli and Garlic extract
72 40 46 26 62 34 24 13 32 18 124 69
17 Pit fall trap method 68 38 43 24 69 38 8 5 18 9 154 86
18 Group dynamics Nine dot game [Broad thinking] Longest line [Resource utilization] Building towers [Team work]
95 53 123 68 86 48
38 21 45 25 32 18
47 26 12 9 62 34
12 6 19 10 9 5
23 13 28 16 15 9
145 81 133 74 156 86
19 Communication skills 93 52 45 25 42 23 23 13 35 19 122 68
20 Facilitation skills 98 54 38 21 44 24 18 10 26 14 136 75

Table 4.19 . Difference in the Skill scores of FFS and Non FFS farmers in FFS on ICM Cotton [District wise]
S.No. Category Size of
the sample
Warangal Kadapa Guntur
Mean S.D. Z value Mean S.D. Z value Mean S.D. Z value
1. FFS farmers 60 22.36 5.09 28.84*
22.66 5.54 23.32*
22.3 6.43 26.81*
2. Non FFS farmers 60 11.6 1.79 11.95 2.32 12.38 2.34
*- Significant at 0.05 level of probability

Table 4.20 : Distribution of FFS and Non FFS farmers’ respondents based on their Adoption of ICM Cotton practices
S.No Category Warangal Kadapa Guntur Total
FFS % Non FFS % FFS % Non
FFS % FFS % Non
FFS % FFS % Non
FFS %
1 Low 12 20.00 15 25.00 11 18.33 24 40.00 14 23.33 20 33.33 37 20.55 59 32.77
2 Medium 35 58.33 31 51.66 35 58.33 28 46.66 30 50.00 24 40.00 100 55.55 83 46.11
3 High 13 21.66 14 23.33 14 23.33 8 13.33 16 26.66 16 26.66 43 23.88 38 21.11
Total 60 60 60 60 60 60 180 180
Mean 61.45 35.26 65.63 34.03 71.16 32.35
S.D 13.64 5.14 14.12 7.39 16.07 6.29

Table 4.21 : Extent of adoption ICM Cotton practices of FFS and Non FFS farmers about Cotton ICM practices
S.No Management Practice FFS farmers Non FFS farmers
Fully adopted Not adopted Fully adopted Not adopted Reasons for non -adoption
F % F % F % F %
1 Short term a. Soil test b. Seed treatment c. Seed germination test d. Sowing time e. Pit fall trap method f. Establishment of delta sticky for white fly g. Cage study [Defender exclusion] h. Effect of pesticide spray on defenders Long term a. No. of plants / hole b. New Hybrids c. De topping d. Removal of fruiting bodies
125 69 108 60 116 64 156 87 75 42 125 69 93 52 128 71 138 77 145 81 132 73 128 71
55 31 72 40 64 36 34 13 105 68 55 31 87 48 52 29 42 23 35 19 48 27 52 29
38 21 42 23 53 29 85 47 - --- 29 16 12 38 21 54 30 85 47 36 20 53 29
142 79 138 77 127 71 95 53 180 100 151 84 180 100 142 79 136 70 95 53 144 80 127 71
1. Lack of facilities for quick analysis
2. Unaware of chemical for seed treatment
3. Non availability of sticky traps, and other IPM kits on subsidy from Dept of Agril.
Yield may be reduced if plants are thinned. Labour intensive.
2 Adoption of principles of IPM package a. Use of Pheromone traps b. Installation of yellow sticky traps c. Installation of bird perches d. Release of Trichogramma eggs e. Seed treatment with Trichoderma viridae
118 66 105 58 126 70 38 21 65 36
62 34 75 42 54 30 142 79 115 64
42 23 63 35 48 27 5 3 8 4
138 77 117 65 134 73 145 97 142 96
Non availability of sticky traps, and other IPM kits on subsidy from Dept of Agril.
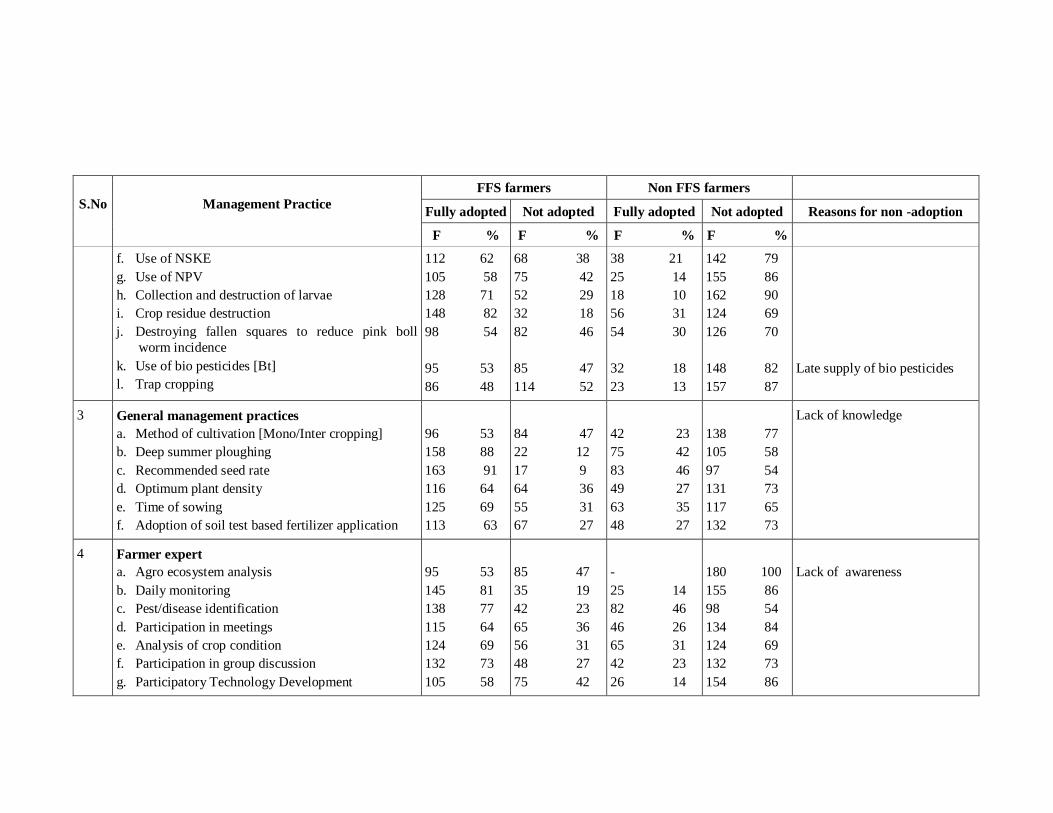
S.No Management Practice FFS farmers Non FFS farmers
Fully adopted Not adopted Fully adopted Not adopted Reasons for non -adoption
F % F % F % F % f. Use of NSKE g. Use of NPV h. Collection and destruction of larvae i. Crop residue destruction j. Destroying fallen squares to reduce pink boll
worm incidence k. Use of bio pesticides [Bt] l. Trap cropping
112 62 105 58 128 71 148 82 98 54 95 53 86 48
68 38 75 42 52 29 32 18 82 46 85 47 114 52
38 21 25 14 18 10 56 31 54 30 32 18 23 13
142 79 155 86 162 90 124 69 126 70 148 82 157 87
Late supply of bio pesticides
3 General management practices a. Method of cultivation [Mono/Inter cropping] b. Deep summer ploughing c. Recommended seed rate d. Optimum plant density e. Time of sowing f. Adoption of soil test based fertilizer application
96 53 158 88 163 91 116 64 125 69 113 63
84 47 22 12 17 9 64 36 55 31 67 27
42 23 75 42 83 46 49 27 63 35 48 27
138 77 105 58 97 54 131 73 117 65 132 73
Lack of knowledge
4 Farmer expert a. Agro ecosystem analysis b. Daily monitoring c. Pest/disease identification d. Participation in meetings e. Analysis of crop condition f. Participation in group discussion g. Participatory Technology Development
95 53 145 81 138 77 115 64 124 69 132 73 105 58
85 47 35 19 42 23 65 36 56 31 48 27 75 42
- 25 14 82 46 46 26 65 31 42 23 26 14
180 100 155 86 98 54 134 84 124 69 132 73 154 86
Lack of awareness

S.No Management Practice FFS farmers Non FFS farmers
Fully adopted Not adopted Fully adopted Not adopted Reasons for non -adoption
F % F % F % F % h. Peer group communication i. Participation in field day j. Active role in field day k. Risk management l. Developing linkages with extension functionaries m. Sharing experiences with others n. Documentation of experiences
68 38 143 79 138 77 116 64 128 71 98 54 135 75 78 43
112 62 37 21 42 23 64 36 52 29 82 46 45 25 102 57
8 4 25 14 46 26 18 10 45 25 28 16 46 26 12 7
172 96 155 86 134 74 162 90 135 75 152 84 134 74 168 93

Table 4.22 : Difference in the extent adoption scores of FFS and Non FFS farmers on ICM Cotton [District wise]
S.No. Category Size of
the sample
Warangal Kadapa Guntur
Mean S.D. Z value Mean S.D. Z value Mean S.D. Z value
1. FFS farmers 60 61.45 13.64 45.07*
65.63 14.12 61.93*
71.16 16.07 51.11*
2. Non FFS farmers 60 35.06 5.14 34.03 7.09 32.35 6.3
*- Significant at 0.05 level of probability

Table 4.23 : Distribution of FFS and Non FFS farmers respondents based on their Agro Ecosystem Management of ICM Cotton practices
S.No Category Warangal Kadapa Guntur Total
FFS % Non FFS % FFS % Non
FFS % FFS % Non
FFS % FFS % Non
FFS %
1 Low 9 15.00 15 25.00 14 23.33 20 33.33 12 20.00 17 28.33 35 19.44 52 28.88
2 Medium 39 65.00 33 55.00 30 50.00 27 45.00 33 55.00 31 51.66 102 56.66 91 50.55
3 High 12 20.00 12 20.00 16 26.66 13 21.66 15 25.00 12 20.00 43 23.88 37 20.55
Total 60 60 60 60 60 60 180 180
Mean 16.46 10.01 16.98 10.26 17.0 10.70
S.D 3.20 1.53 3.33 1.76 2.85 2.13

Table 4.24 : Response analysis of Agro ecosystem management of FFS and Non FFS farmers about Cotton ICM practices
S.No AEM item FFS farmers [n=180]
Adopted Not adopted Non Farmers [n=180] Adopted Not adopted
Frequency % Frequency % Frequency % Frequency % Pest and defender management
1 Spray of botanical pesticides will develop natural predators
153 85 27 15 68 38 112 72
2 Growing Greengram as inter crop in Cotton for developing predators’ population.
98 54 82 46 85 47 95 53
3 Adoption of IPM package for better micro climate
126 70 54 30 28 16 152 84
4 Adoption of soil test based fertilizer application to decrease pest incidence.
132 73 48 27 39 22 141 78
5 Use of NPV and Bt solution when used against pests will result in building natural predators population
163 91 17 9 54 30 126 70
6 Sowing of Border crops like Maize /Bajra/Jowar for reducing sucking pest incidence.
124 69 56 31 35 19 145 81
7 Trap crop for diverting pest from main crop 116 64 64 36 62 34 118 66
8 Input management Use of organic manures like FYM / Vermicompost improves overall fertility of soil.
152
84
28
16
98
54
82
46
9 Application of soil test based NPK fertilizers to 145 81 35 19 105 58 75 42

S.No AEM item FFS farmers [n=180]
Adopted Not adopted Non Farmers [n=180] Adopted Not adopted
Frequency % Frequency % Frequency % Frequency % reduce pest and diseases.
10 Use of PSB bio fertilizer for solubilizing insoluble P fertilizers in the soil.
85 47 95 53 42 23 138 77
11 Use of bio control agents like Tricho cards, NPV, .Bt. will reduce pest incidence
138 77 42 23 35 19 145 81
12 Use of botanicals like NSKE will helps in developing predators’ population.
162 90 18 10 86 48 94 52
13 Intercropping with Greengram will improve soil fertility
112 62 68 38 83 46 97 54
14 Use of quality seed will result in better yields 148 82 32 18 95 53 85 47
15 Bio diversity conservation Use of ICM technology under FFS has resulted in biodiversity conservation like Spiders, Coccinellid beetle [Akshinatala purugu], Dragon flies.
165
92
15
8
45
25
135
75
16 Decomposition of applied FYM in the soil leads to increased microbial activity
148 82 32 18 54 30 126 70
17 Water holding capacity of soil will increase due to increase of microbial activity.
102 57 78 43 36 20 144 80
18 Parasites and predators conservation will result in Bio diversity conservation
145 81 35 19 46 26 134 74
19 Insect Zoo/ Cage study will help in identification 136 76 44 24 32 18 148 82

S.No AEM item FFS farmers [n=180]
Adopted Not adopted Non Farmers [n=180] Adopted Not adopted
Frequency % Frequency % Frequency % Frequency % of Predators/ Parasites to enable Bio diversity conservation.
20 Diversification of crops/varieties will help in Bio diversity conservation.
112 62 68 38 59 33 121 77
21 Reduction of inorganic fertilizers usage will result in improved soil microbial activity.
108 60 72 40 28 16 152 84
22 Conservation of native plant species 95 53 85 47 32 18 148 82 23 Conservation of bird species 94 52 86 48 29 16 151 81 24 Conservation of animals 92 51 88 49 45 25 135 75 25 Use of micro irrigation system will lead to
conservation of irrigation water and improves micro climate.
142 79 38 21 63 35 117 65

Table 4.25: Difference in the AEM scores of FFS and Non FFS farmers in FFS on ICM Cotton [District wise]
S.No. Category Size of
the sample
Warangal Kadapa Guntur
Mean S.D. Z value Mean S.D. Z value Mean S.D. Z value
1. FFS farmers 60 16.46 3.20 19.41*
16.98 3.33 19.64*
17.0 2.85 18.39*
2. Non FFS farmers 60 10.1 1.53 10.26 1.76 10.7 2.13

Table 4.26 : Distribution of FFS and Non FFS farmers respondents based on their Decision making ability ICM Cotton practices
S.No Category Warangal Kadapa Guntur Total
FFS % Non FFS % FFS % Non
FFS % FFS % Non
FFS % FFS % Non
FFS %
1. Low 13 21.66 22 36.66 12 20.00 18 30.00 13 21.66 16 26.66 38 21.11 56 31.11
2. Medium 28 46.66 23 38.33 32 53.33 28 46.66 32 53.33 30 50.00 92 51.11 81 45.00
3. High 19 31.66 15 15.00 16 26.66 14 23.33 15 25.00 14 23.33 50 27.77 43 23.88
Total 60 60 60 60 60 60 180 180
Mean 21.01 17.15 23.71 15.71 24.65 15.41
S.D 5.16 4.14 5.74 3.71 5.31 3.27
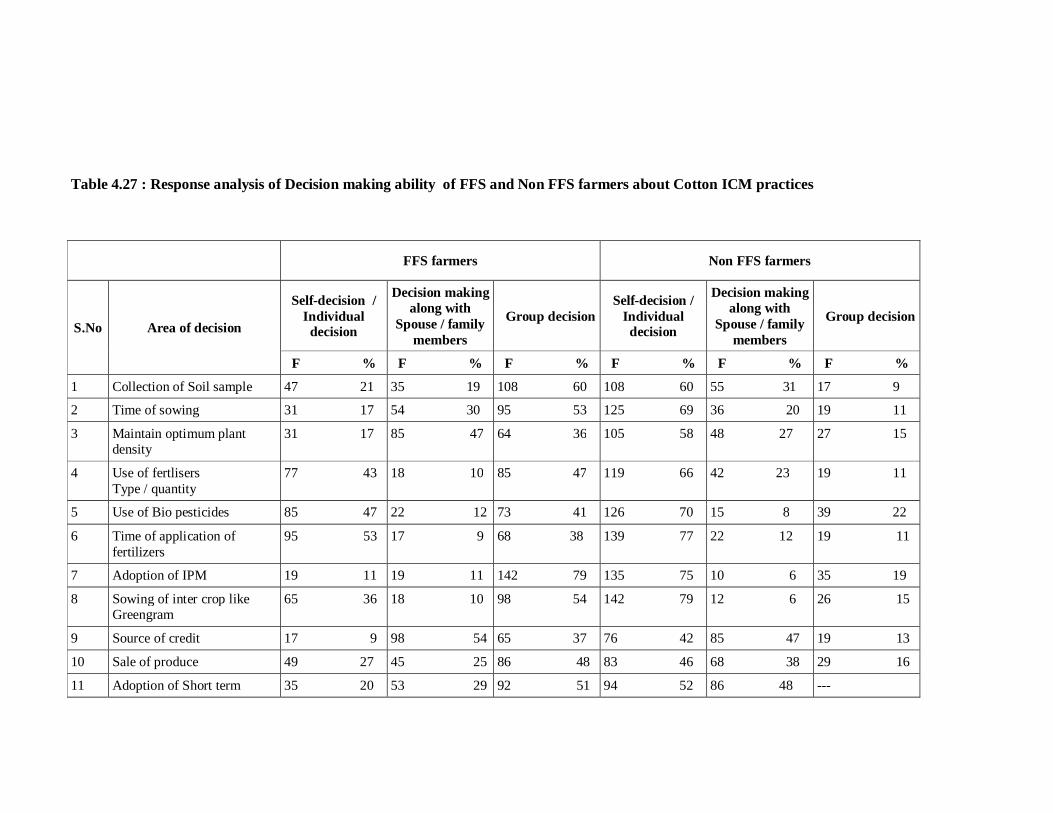
Table 4.27 : Response analysis of Decision making ability of FFS and Non FFS farmers about Cotton ICM practices
FFS farmers Non FFS farmers
S.No Area of decision
Self-decision / Individual
decision
Decision making along with
Spouse / family members
Group decision Self-decision /
Individual decision
Decision making along with
Spouse / family members
Group decision
F % F % F % F % F % F %
1 Collection of Soil sample 47 21 35 19 108 60 108 60 55 31 17 9
2 Time of sowing 31 17 54 30 95 53 125 69 36 20 19 11
3 Maintain optimum plant density
31 17 85 47 64 36 105 58 48 27 27 15
4 Use of fertlisers Type / quantity
77 43 18 10 85 47 119 66 42 23 19 11
5 Use of Bio pesticides 85 47 22 12 73 41 126 70 15 8 39 22
6 Time of application of fertilizers
95 53 17 9 68 38 139 77 22 12 19 11
7 Adoption of IPM 19 11 19 11 142 79 135 75 10 6 35 19
8 Sowing of inter crop like Greengram
65 36 18 10 98 54 142 79 12 6 26 15
9 Source of credit 17 9 98 54 65 37 76 42 85 47 19 13
10 Sale of produce 49 27 45 25 86 48 83 46 68 38 29 16
11 Adoption of Short term 35 20 53 29 92 51 94 52 86 48 ---

FFS farmers Non FFS farmers
S.No Area of decision
Self-decision / Individual
decision
Decision making along with
Spouse / family members
Group decision Self-decision /
Individual decision
Decision making along with
Spouse / family members
Group decision
F % F % F % F % F % F % experiments
12 Long term experiments 43 24 42 23 95 53 115 64 48 27 17 9
13 Maintenance of farm records 33 19 69 38 78 43 124 69 35 20 21 11
14 Purchase of inputs 42 23 63 35 75 42 115 64 63 35 2 1
15 Selection of crops 49 27 46 26 85 47 132 73 46 26 2 1
16 Selection of variety /hybrid 12 6 73 41 95 53 98 54 72 40 13 6
17 Irrigation schedule 72 40 65 37 33 23 135 75 25 14 20 11
18 Investment on crop production
19 11 86 48 75 42 85 47 92 51 3 2
19 Sowing of boarder crop 92 51 36 20 52 29 138 77 18 10 27 13
20 Use ITKs 52 29 45 25 83 46 125 70 21 11 34 19

Table 4.28 : Difference in the Decision making scores of FFS and Non FFS farmers in FFS on ICM Cotton [District wise]
S.No. Category Size of
the sample
Warangal Kadapa Guntur
Mean S.D. Z value Mean S.D. Z value Mean S.D. Z value
1. FFS farmers 60 21.01 5.16 21.47*
23.71 5.74
2.42*
24.65 5.31 32.05*
2. Non FFS farmers 60 12.23 2.72 13.83 2.21 12.35 2.71
*- Significant at 0.05 level of probability

Table 4.29 : District wise distribution of Simple Correlation analysis of independent variables with Attitude of FFS and non FFS farmers
S.No Independent variables
Correlation coefficient [r] values
Warangal Kadapa Guntur Total
FFS Non FFS FFS Non FFS FFS Non FFS FFS Non FFS
X1 Age -0.60** 0.063 -0.34** 0.304* -0.2626* 0.252 -0.219** 0.100
X2 Education 0.93** 0.42** 0.75** 0.023 0.82** 0.30 0.544** 0.253
X3 Experience in farming -0.57** 0.0456 -0.38** 0.294* -0.23NS 0.266* -0.244** 0.045
X4 Farm size 0.02NS 0.197 0.073NS 0.056 0.014NS 0.028 0.068 NS 0.009
X5 Mass Media exposure 0.25NS 0.155 0.43** 0.11 0.127NS 0.240 0.224** 0.015
X6 Extension contact 0.44** 0.209 0.14NS 0.01 0.032NS 0.255* 0.085 NS 0.063
X7 Group orientation 0.50** 0.034 0.15NS 0.022 0.017NS 0.210 0.003 NS 0.024
X8 Market intelligence 0.63** 0.018 0.07NS 0.231 0.138NS 0.154 0.179* 0.063
X9 Risk orientation 0.61** 0.099 0.08 NS 0.049 0.218NS 0.167 0.192** 0.143
X10 Innovativeness 0.65** 0.034 0.25* 0.0075 0.251NS 0.234 0.296** 0.094
X11 Management orientation 0.80** 0.047 0.11NS 0.008 0.006NS 0.010 0.151* 0.150
** --- Significant at 0.01 probability level; * --- Significant at 0.05 probability level, NS —Non significant
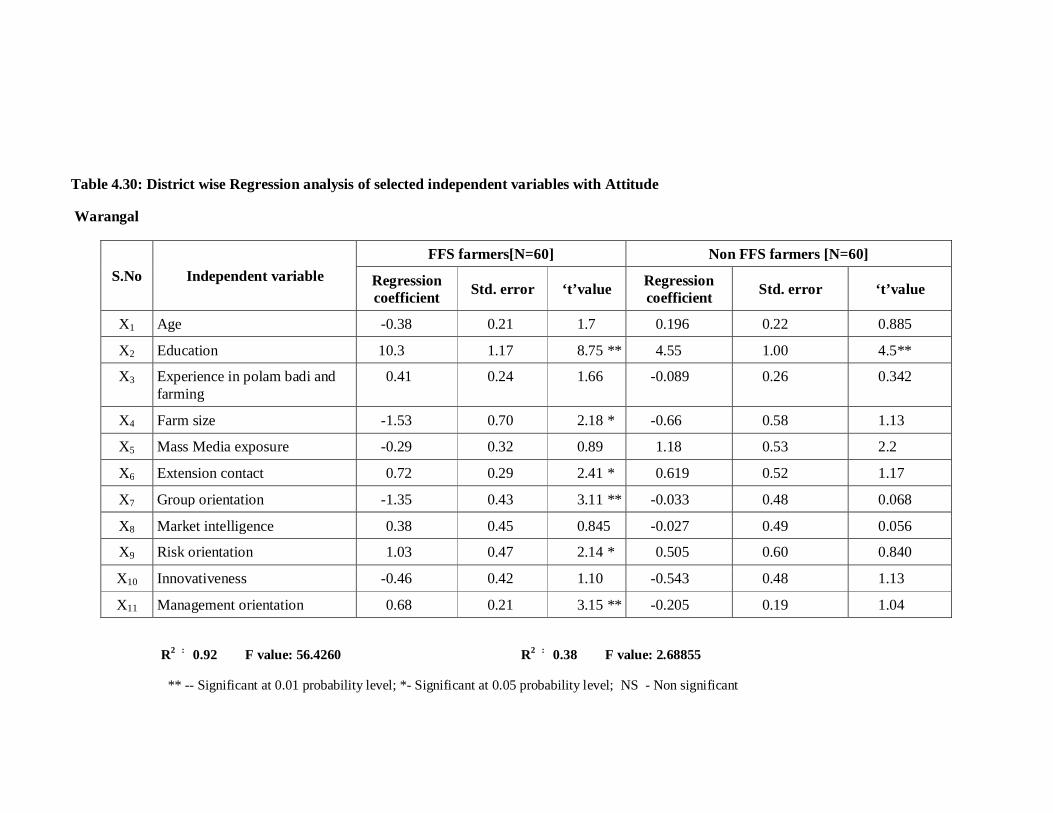
Table 4.30: District wise Regression analysis of selected independent variables with Attitude
Warangal
S.No Independent variable FFS farmers[N=60] Non FFS farmers [N=60]
Regression coefficient Std. error ‘t’value Regression
coefficient Std. error ‘t’value
X1 Age -0.38 0.21 1.7 0.196 0.22 0.885
X2 Education 10.3 1.17 8.75 ** 4.55 1.00 4.5**
X3 Experience in polam badi and farming
0.41 0.24 1.66 -0.089 0.26 0.342
X4 Farm size -1.53 0.70 2.18 * -0.66 0.58 1.13
X5 Mass Media exposure -0.29 0.32 0.89 1.18 0.53 2.2
X6 Extension contact 0.72 0.29 2.41 * 0.619 0.52 1.17
X7 Group orientation -1.35 0.43 3.11 ** -0.033 0.48 0.068
X8 Market intelligence 0.38 0.45 0.845 -0.027 0.49 0.056
X9 Risk orientation 1.03 0.47 2.14 * 0.505 0.60 0.840
X10 Innovativeness -0.46 0.42 1.10 -0.543 0.48 1.13
X11 Management orientation 0.68 0.21 3.15 ** -0.205 0.19 1.04
R2 : 0.92 F value: 56.4260 R2 : 0.38 F value: 2.68855
** -- Significant at 0.01 probability level; *- Significant at 0.05 probability level; NS - Non significant

Table 4.31: District wise Regression analysis of selected independent variables with Attitude
KADAPA
S.No Independent variable FFS farmers[N=60] Non FFS farmers [N=60]
Regression coefficient Std. error ‘t’ value Regression
coefficient Std. error ‘t’ value
X1 Age -0.307 0.53 0.58 -0.33 0.35 0.94
X2 Education 14.3 2.07 6.91** -0.52 1.29 0.40
X3 Experience in polam badi and farming
0.244 0.54 0.45 0.0001 0.37 0.00
X4 Farm size 1.01 0.86 1.16 -0.597 0.63 0.93
X5 Mass Media exposure -0.93 0.89 1.05 1.499 1.06 1.41
X6 Extension contact 0.27 0.82 0.33 -0.037 0.94 0.04
X7 Group orientation -0.42 0.97 0.43 -0.325 1.12 0.288
X8 Market intelligence 0.51 1.34 0.38 1.69 1.00 1.68
X9 Risk orientation 0.88 1.00 0.88 0.120 0.93 0.12
X10 Innovativeness 2.51 1.02 2.44* -0.822 1.01 0.810
X11 Management orientation 0.38 0.53 0.71 0.123 0.20 0.613 R2 : 0.64 F value:7.8674 R2 : 0.20 F:value:1.1119
** -- Significant at 0.01 probability level; *- Significant at 0.05 probability level; NS —Non significant

Table 4.32: District wise Regression analysis of selected independent variables with Attitude
Guntur
S.No Independent variable FFS farmers[N=60] Non FFS farmers [N=60]
Regression coefficient Std. error ‘t’value Regression
coefficient Std. error ‘t’value
X1 Age -0.286 0.369 0.776 0.019 0.26 0.074
X2 Education 13.021 1.31 9.886** 4.39 2.92 1.5
X3 Experience in polam badi and farming 0.359 0.52 0.684 -0.10 0.39 0.25
X4 Farm size -1.016 0.71 1.54 -0.61 0.67 0.90
X5 Mass Media exposure -0.230 0.62 0.371 0.32 0.65 0.49
X6 Extension contact 0.439 0.788 0.557 -0.11 0.87 0.13
X7 Group orientation 0.234 0.767 0.306 -0.16 0.63 0.025
X8 Market intelligence 0.141 0.904 0.157 -0.203 0.44 0.45
X9 Risk orientation 2.07 0.778 2.667* -0.41 0.54 0.76
X10 Innovativeness 0.888 0.803 1.106 0.24 0.34 0.70
X11 Management orientation 0.197 0.5017 0.394 -0.27 0.16 1.73 R2 : 0.73 F value: 12.3962 R2 : 0.20 F value: 1.1103 ** -- Significant at 0.01 probability level; *- Significant at 0.05 probability level; NS —Non significant

Table 4.33 : District wise distribution of Simple Correlation analysis of independent variables with Knowledge of FFS and non FFS farmers
S.No Independent variables
‘r’ values
Warangal Kadapa Guntur Total FFS Non FFS FFS Non FFS FFS Non FFS FFS Non FFS
X1 Age -0.49** 0.053 -0.29* 0.128 -0.331** 0.022 -0.226** 0.249
X2 Education 0.84** 0.436** 0.87** 0.158 0.89** 0.228 0.598** 0.022
X3 Experience in farming -0.47** 0.060 -0.35** 0.153 -0.25* 0.077 -0.217** 0.126
X4 Farm size 0.27* 0.150 0.01NS 0.133 0.164NS 0.124 0.045 0.012
X5 Mass Media exposure 0.26* 0.173 0.48** 0.206 0.041NS 0.187 0.181* 0.125
X6 Extension contact 0.48** 0.164 0.23NS 0.010 0.001NS 0.132 0.074 0.014
X7 Group orientation 0.47** 0.187 0.14NS 0.052 -0.057NS 0.185 0.028 0.030
X8 Market intelligence 0.50** 0.078 0.01NS 0.070 0.050NS 0.061 0.080 0.169
X9 Risk orientation 0.51** 0.095 0.03NS 0.067 0.163 NS 0.232 0.107 0.077
X10 Innovativeness 0.63** 0.024 0.20NS 0.133 0.167NS 0.188 0.213** 0.148
X11 Management orientation 0.61** 0.122 0.11NS 0.188 0.061NS 0.209 0.102 0.021
** --- Significant at 0.01 probability level: * --- Significant at 0.05 probability level , NS —Non significant

Table 4.34: District wise distribution of Regression analysis of selected independent variables with Knowledge on ICM Cotton
Warangal
S.No Independent variable FFS farmers[N=60] Non FFS farmers [N=60]
Regression coefficient Std. error ‘t’value Regression
coefficient Std. error ‘t’value
X1 Age -0.0.24 0.06 0.41 0.029 0.06 0.485
X2 Education 1.57 0.33 4.77 ** 1.15 0.27 4.18**
X3 Experience in polam badi and farming 0.028 0.069 0.41 0.010 0.07 0.14
X4 Farm size 0.055 0.197 0.28 0.361 0.16 2.25*
X5 Mass Media exposure 0.044 0.0919 0.48 -0.140 0.14 0.96
X6 Extension contact 0.11 0.0839 1.36 0.24 0.14 1.72
X7 Group orientation -0.064 0.1223 0.523 -0.17 0.13 1.32
X8 Market intelligence -0.042 0.129 0.328 -0.17 0.13 1.30
X9 Risk orientation 0.013 0.135 0.102 0.26 0.16 1.6
X10 Innovativeness 0.065 0.11 0.554 -0.10 0.13 0.78
X11 Management orientation -0.033 0.061 0.545 -0.04 0.05 0.889 R2 : 0.73 F value: 12.1224 R2 : 0.39
F value: 2.90 ** -- Significant at 0.01 probability level; *- Significant at 0.05 probability level; NS —Non significant

Table 4.35: District wise distribution of Regression analysis of selected independent variables with Knowledge on ICM Cotton
KADAPA
S.No Independent variable FFS farmers[N=60] Non FFS farmers [N=60]
Regression coefficient Std. error ‘t’value Regression
coefficient Std. error ‘t’value
X1 Age -0.032 0.07 0.423 0.024 0.07 0.305
X2 Education 3.53 0.29 11.80** 0.256 0.29 0.877
X3 Experience in polam badi and farming 0.09 0.07 1.61 -0.047 0.085 0.559
X4 Farm size 0.108 0.125 0.86 0.150 0.144 1.04
X5 Mass Media exposure -0.110 0.128 0.85 -0.27 0.240 1.14
X6 Extension contact 0.189 0.119 1.59 0.11 0.213 0.53
X7 Group orientation -0.199 0.141 1.4 -0.066 0.255 0.26
X8 Market intelligence -0.026 0.194 0.13 0.027 0.227 0.119
X9 Risk orientation 0.048 0.145 0.332 0.122 0.212 0.576
X10 Innovativeness 0.39 0.148 2.6* -0.232 0.229 1.01
X11 Management orientation 0.094 0.076 1.2 0.050 0.045 1.11
R2 : 0.82 F value: 20.6754 R2 : 0.177 F value: 0.94 ** -- Significant at 0.01 probability level; *- Significant at 0.05 probability level; NS —Non significant

Table 4.36 : District wise distribution of Regression analysis of selected independent variables with Knowledge on Cotton ICM
Guntur
S.No Independent variable FFS farmers[N=60] Non FFS farmers [N=60]
Regression coefficient Std. error ‘t’ value Regression
coefficient Std. error ‘t’ value
X1 Age -0.165 0.065 2.52* -0.04 0.09 0.47
X2 Education 3.459 0.233 14.79** 1.37 1.19 1.15
X3 Experience in polam badi and farming
0.185 0.093 1.98 0.13 0.133 0.99
X4 Farm size 0.025 0.127 0.20 0.026 0.23 0.112
X5 Mass Media exposure -0.108 0.1101 0.986 0.091 0.21 0.42
X6 Extension contact -0.0004 0.14 0.000 -0.40 0.29 1.37
X7 Group orientation -0.066 0.13 0.489 0.153 0.22 0.668
X8 Market intelligence -0.153 0.16 0.954 -0.096 0.15 0.618
X9 Risk orientation 0.292 0.13 2.114* 0.017 0.18 0.093
X10 Innovativeness -0.057 0.14 0.400 0.081 0.12 0.6661
X11 Management orientation 0.177 0.089 0.089 0.011 0.06 0.161
R2 : 0.85 F value: 26.2025 R2 : 0.16 F value: 0.87 ** -- Significant at 0.01 probability level; *- Significant at 0.05 probability level; NS —Non significant
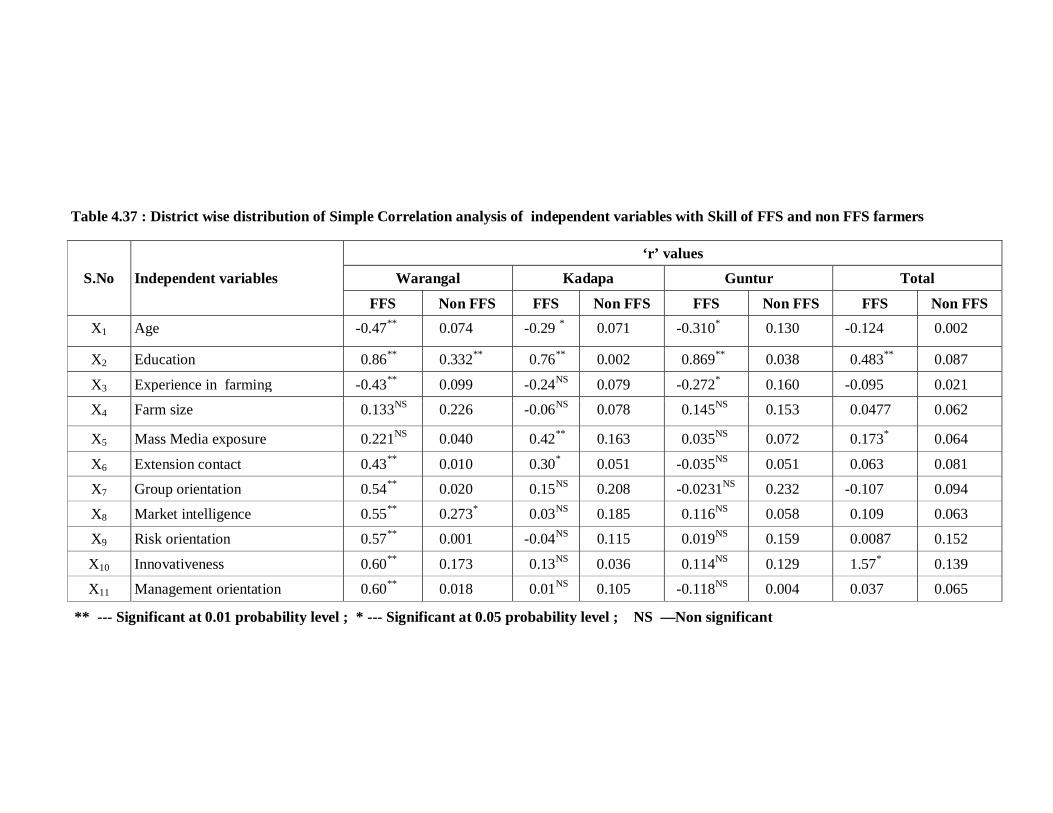
Table 4.37 : District wise distribution of Simple Correlation analysis of independent variables with Skill of FFS and non FFS farmers
S.No Independent variables ‘r’ values
Warangal Kadapa Guntur Total
FFS Non FFS FFS Non FFS FFS Non FFS FFS Non FFS X1 Age -0.47** 0.074 -0.29 * 0.071 -0.310* 0.130 -0.124 0.002
X2 Education 0.86** 0.332** 0.76** 0.002 0.869** 0.038 0.483** 0.087
X3 Experience in farming -0.43** 0.099 -0.24NS 0.079 -0.272* 0.160 -0.095 0.021
X4 Farm size 0.133NS 0.226 -0.06NS 0.078 0.145NS 0.153 0.0477 0.062
X5 Mass Media exposure 0.221NS 0.040 0.42** 0.163 0.035NS 0.072 0.173* 0.064
X6 Extension contact 0.43** 0.010 0.30* 0.051 -0.035NS 0.051 0.063 0.081
X7 Group orientation 0.54** 0.020 0.15NS 0.208 -0.0231NS 0.232 -0.107 0.094
X8 Market intelligence 0.55** 0.273* 0.03NS 0.185 0.116NS 0.058 0.109 0.063
X9 Risk orientation 0.57** 0.001 -0.04NS 0.115 0.019NS 0.159 0.0087 0.152
X10 Innovativeness 0.60** 0.173 0.13NS 0.036 0.114NS 0.129 1.57* 0.139
X11 Management orientation 0.60** 0.018 0.01NS 0.105 -0.118NS 0.004 0.037 0.065
** --- Significant at 0.01 probability level ; * --- Significant at 0.05 probability level ; NS —Non significant

Table 4.38 : District wise distribution of Regression analysis of selected independent variables with Skill on ICM Cotton
Warangal
S.No Independent variable FFS farmers[N=60] Non FFS farmers [N=60]
Regression coefficient Std. error ‘t’ value Regression
coefficient Std. error ‘t’ value
X1 Age -0.034 0.11 0.313 0.046 0.064 0.71
X2 Education 4.20 0.60 6.97 ** 2.56 0.94 2.71 **
X3 Experience in polam badi and farming 0.099 0.12 0.78 -0.080 0.07 1.06
X4 Farm size -0.94 0.35 2.64 * 0.214 0.15 1.357
X5 Mass Media exposure 0.015 0.16 0.095 -0.22 0.13 1.70
X6 Extension contact 0.247 0.15 1.62 -0.028 0.18 0.15
X7 Group orientation -0.195 0.22 0.877 -0.017 0.17 0.101
X8 Market intelligence 0.146 0.23 0.59 -0.255 0.18 1.38
X9 Risk orientation 0.32 0.24 1.32 -0.094 0.16 0.58
X10 Innovativeness -0.108 0.21 0500 -0.067 0.15 0.42
X11 Management orientation -0.169 0.11 1.52 -0.053 0.056 0.95
R2 : 0.80 F value: 18.3277 R2 : 0.24 F value: 1.40 ** -- Significant at 0.01 probability level; *- Significant at 0.05 probability level; NS —Non significant

Table 4.39: District wise distribution of Regression analysis of selected independent variables with Skill on ICM Cotton
Kadapa
S.No Independent variable FFS farmers[N=60] Non FFS farmers [N=60]
Regression coefficient Std. error ‘t’ value Regression
coefficient Std. error ‘t’value
X1 Age -0.43 0.15 2.9** 0.100 0.08 1.237
X2 Education 5.17 0.59 8.7** 2.74 1.015 2.7**
X3 Experience in polam badi and farming 0.54 0.15 3.5** -0.046 0.086 0.545
X4 Farm size 0.05 0.24 0.24 -0.057 0.161 0.356
X5 Mass Media exposure -0.32 0.25 1.2 -0.188 0.209 0.898
X6 Extension contact 0.63 0.23 2.69** 0.167 0.22 0.739
X7 Group orientation -0.22 0.27 0.79 -0.465 0.29 1.57
X8 Market intelligence 0.008 0.38 0.021 0.103 0.16 0.64
X9 Risk orientation -0.40 0.28 1.4 -0.151 0.17 0.886
X10 Innovativeness 0.50 0.29 1.71 0.116 0.17 0.680
X11 Management orientation -0.02 0.15 0.14 0.017 0.05 0.347
R2 : 0.71 F value: 11.0593 R2 : 0.59 F value: 6.4189 ** -- Significant at 0.01 probability level; *- Significant at 0.05 probability level; NS —Non significant

Table 4.40: District wise distribution of Regression analysis of selected independent variables with Skill on ICM Cotton
Guntur
S.No Independent variable FFS farmers[N=60] Non FFS farmers [N=60]
Regression coefficient Std. error ‘t’ value Regression
coefficient Std. error ‘t’value
X1 Age -0.133 0.12 10.02 -0.184 0.11 1.6
X2 Education 5.55 0.46 12.03** 1.29 1.5 0.85
X3 Experience in polam badi and farming 0.106 0.18 0.578 0.40 0.16 2.4 *
X4 Farm size 0.046 0.25 0.185 0.482 0.301 1.6
X5 Mass Media exposure -0.148 0.21 0.683 0.006 0.270 0.022
X6 Extension contact -0.123 0.27 0.447 -0.354 0.371 0.95
X7 Group orientation -0.580 0.26 2.15* 0.472 0.29 1.63
X8 Market intelligence 0.093 0.31 0.294 0.172 0.19 0.87
X9 Risk orientation -0.044 0.27 0.164 0.148 0.23 0.61
X10 Innovativeness -0.255 0.28 0.908 -0.224 0.155 1.4
X11 Management orientation -0.073 0.17 0.417 0.0012 0.08 0.014
R2 : 0.80 F value: 17.5629 R2 : 0.38 F value: 2.6924 ** -- Significant at 0.01 probability level; *- Significant at 0.05 probability level; NS —Non significant

Table 4.41.: District wise distribution of Simple Correlation analysis of independent variables with Adoption of FFS and non FFS farmers
S.No Independent variables ‘r’ values
Warangal Kadapa Guntur Total
FFS Non FFS FFS Non FFS FFS Non FFS FFS Non FFS X1 Age -0.52** 0.21 -0.21NS 0.336** -0.31* 0.130 -0.221** 0.155*
X2 Education 0.89** 0.630** 0.73** 0.134 0.821** 0.038 0.476** 0.235**
X3 Experience in farming -0.47** 0.17 -0.24NS 0.322* -0.225NS 0.160 -0.192** 0.171*
X4 Farm size 0.18NS 0.005 -0.12NS 0.138 0.104NS 0.153 -0.080 0.059
X5 Mass Media exposure 0.186NS 0.176 0.45** 0.136 0.134NS 0.072 0.182* 0.045
X6 Extension contact 0.33** 0.016 0.23NS 0.108 -0.052NS 0.051 0.055 0.019
X7 Group orientation 0.499** 0.013 0.076NS 0.242 -0.057NS 0.232 0.041 0.059
X8 Market intelligence 0.54** 0.151 -0.003NS 0.187 0.063NS 0.058 -0.009 0.118
X9 Risk orientation 0.47** 0.181 -0.008NS 0.222 0.156NS 0.159 0.009 0.011
X10 Innovativeness 0.54** 0.117 0.27* 0.145 0.222NS 0.129 0.147* 0.070
X11 Management orientation 0.60** 0.256* 0.044NS 0.146 -0.121NS 0.004 -0.057 0.095 ** --- Significant at 0.01 probability level ; * --- Significant at 0.05 probability level ; NS —Non significant

Table 4.42: District wise distribution of Regression analysis of selected independent variables with Adoption of Cotton ICM practices.
Warangal
S.No Independent variable FFS farmers[N=60] Non FFS farmers [N=60]
Regression coefficient Std. error ‘t’value Regression
coefficient Std. error ‘t’value
X1 Age -0.15 0.27 0.57 -0.11 0.15 0.74
X2 Education 13.33 1.48 8.98 ** 0.74 2.33 0.32
X3 Experience in polam badi and farming 0.26 0.31 0.855 0.076 0.18 0.40
X4 Farm size -1.02 0.88 1.15 -0.06 0.39 0.17
X5 Mass Media exposure -0.007 0.41 0.018 0.23 0.32 0.73
X6 Extension contact -0.154 0.37 0.412 0.836 0.46 1.81
X7 Group orientation -0.461 0.54 0.84 0.01 0.43 0.045
X8 Market intelligence 0.271 0.57 0.46 0.09 0.45 0.198
X9 Risk orientation -0.409 0.60 0.677 0.36 0.39 0.91
X10 Innovativeness -0.658 0.53 1.23 0.244 0.39 0.61
X11 Management orientation -0.38 0.27 1.41 -0.12 0.14 0.92
R2 : 0.83 F value: 22.5342 R2 0.51 F value: 4.59 ** -- Significant at 0.01 probability level; *- Significant at 0.05 probability level; NS —Non significant

Table 4.43 District wise distribution of Regression analysis of selected independent variables with Adoption of Cotton ICM practices.
Kadapa
S.No Independent variable FFS farmers[N=60] Non FFS farmers [N=60]
Regression coefficient Std. error ‘t’value Regression
coefficient Std. error ‘t’value
X1 Age -0.055 0.41 0.13 -0.122 0.37 0.329
X2 Education 12.01 1.61 7.4** 3.04 4.64 0.655
X3 Experience in polam badi and farming 0.48 0.42 1.15 -0.073 0.39 0.187
X4 Farm size -0.69 0.67 1.03 -0.77 0.73 1.047
X5 Mass Media exposure -0.17 0.69 0.25 0.577 0.95 0.604
X6 Extension contact 0.92 0.64 1.44 1.55 1.03 1.49
X7 Group orientation -1.06 0.76 1.39 0.206 1.34 0.153
X8 Market intelligence -0.27 1.04 0.26 0.378 0.74 0.511
X9 Risk orientation -0.38 0.78 0.49 0.211 0.78 0.27
X10 Innovativeness 2.34 0.80 2.9** -0.203 0.78 0.260
X11 Management orientation -0.116 0.41 0.28 0.0075 0.23 0.033 R2 : 0.66 F value: 8.6630 R2 : 0.26 F value: 1.5484
** -- Significant at 0.01 probability level; *- Significant at 0.05 probability level; NS —Non significant

Table 4.44: District wise distribution of Regression analysis of selected independent variables with Adoption of Cotton ICM practices.
Guntur
S.No Independent variable FFS farmers[N=60] Non FFS farmers [N=60]
Regression coefficient Std. error ‘t’value Regression
coefficient Std. error ‘t’value
X1 Age -0.86 0.36 2.341* -0.024 0.45 0.053
X2 Education 12.81 1.31 9.73** 0.162 6.01 0.027
X3 Experience in polam badi and farming 1.06 0.52 2.034* 0.024 067 0.036
X4 Farm size -0.69 0.71 0.96 -1.69 1.2 1.4
X5 Mass Media exposure 0.52 0.61 0.84 -0.388 1.07 0.36
X6 Extension contact -0.76 0.78 0.95 0.73 1.48 0.493
X7 Group orientation -0.12 0.76 0.159 -0.601 1.15 0.519
X8 Market intelligence -0.77 0.90 0.859 -0.326 0.78 0.413
X9 Risk orientation 1.12 0.77 1.45 0.998 0.95 1.04
X10 Innovativeness 0.34 0.80 0.42 -0.675 0.62 1.08
X11 Management orientation -0.43 0.50 0.87 0.621 0.35 1.77
R2 : 0.73 F value: 12.2933 R2 : 0.20. F value: 1.14 ** -- Significant at 0.01 probability level; *- Significant at 0.05 probability level; NS —Non significant

Table 4.45 : District wise distribution of Simple Correlation analysis of independent variables with AEM of FFS and non FFS farmers
S.No Independent variables
Correlation values [r]
Warangal Kadapa Guntur Total
FFS Non FFS FFS Non FFS FFS Non FFS FFS Non FFS
X1 Age -0.29* 0.07 -0.25* 0.083 -0.34** 0.140 -0.149* 0.11
X2 Education 0.59** 0.475** 0.69** 0.104 0.735** 0.083 0.383** 0.099
X3 Experience in farming -0.29* 0.070 -0.27* 0.048 -0.230NS 0.160 -0.133* 0.107
X4 Farm size 0.066NS 0.05 -0.189NS 0.058 0.095NS 0.04 -0.064 0.018
X5 Mass Media exposure 0.27* 0.181 0.43** 0.171 0.028NS 0.077 0.175* 0.060
X6 Extension contact 0.13NS 0.141 0.15NS 0.231 -0.097NS 0.107 0.055 0.185
X7 Group orientation 0.34** 0.012 0.026NS 0.009 0.131NS 0.138 -0.061 0.012
X8 Market intelligence 0.303* 0.021 0.005NS 0.011 0.186NS 0.160 0.044 0.135
X9 Risk orientation 0.364** 0.086 -0.048NS 0.238 0.186NS 0.057 0.047 0.166
X10 Innovativeness 0.50** 0.119 0.149NS 0.064 0.183NS 0.099 0.214** 0.041
X11 Management orientation 0.56** 0.111 0.07NS 0.077 -0.168NS 0.266 0.058 0.130 ** --- Significant at 0.01 probability level ; * --- Significant at 0.05 probability level ; NS —Non significant

Table 4.46: District wise distribution of Regression analysis of selected independent variables with AEM of Cotton ICM practices.
Warangal
S.No Independent variable FFS farmers[N=60] Non FFS farmers [N=60]
Regression coefficient Std. error ‘t’value Regression
coefficient Std. error ‘t’value
X1 Age 0.018 0.11 0.15 0.010 0.04 0.21
X2 Education 1.47 0.64 2.26* -1.17 0.70 1.664
X3 Experience in polam badi and farming 0.044 0.13 0.325 0.014 0.05 0.259
X4 Farm size 0.084 0.38 0.21 -0.040 0.11 0.34
X5 Mass Media exposure 0.171 0.18 0.95 0.163 0.098 1.66
X6 Extension contact -0.208 0.16 1.26 0.199 0.13 1.43
X7 Group orientation -0.013 0.24 0.056 0.377 0.13 2.89**
X8 Market intelligence -0.27 0.25 1.07 0.259 0.13 1.88
X9 Risk orientation 0.013 0.26 0.49 -0.131 0.11 1.09
X10 Innovativeness 0.043 0.23 0.18 0.006 0.11 0.05
X11 Management orientation 0.157 0.11 1.32 0.022 0.04 0.52 R2 : 0.46 F value: 3.77 R2 : 0.28 F value: 1.77
** -- Significant at 0.01 probability level; *- Significant at 0.05 probability level; NS —Non significant
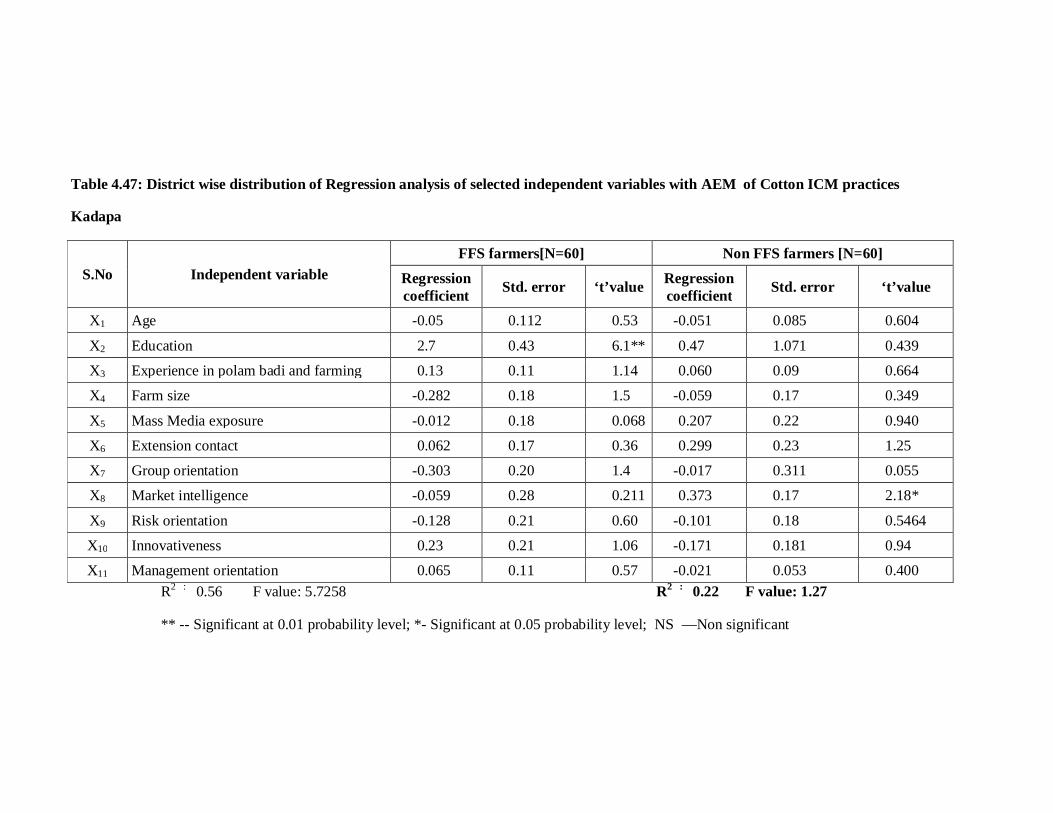
Table 4.47: District wise distribution of Regression analysis of selected independent variables with AEM of Cotton ICM practices
Kadapa
S.No Independent variable FFS farmers[N=60] Non FFS farmers [N=60]
Regression coefficient Std. error ‘t’value Regression
coefficient Std. error ‘t’value
X1 Age -0.05 0.112 0.53 -0.051 0.085 0.604
X2 Education 2.7 0.43 6.1** 0.47 1.071 0.439
X3 Experience in polam badi and farming 0.13 0.11 1.14 0.060 0.09 0.664
X4 Farm size -0.282 0.18 1.5 -0.059 0.17 0.349
X5 Mass Media exposure -0.012 0.18 0.068 0.207 0.22 0.940
X6 Extension contact 0.062 0.17 0.36 0.299 0.23 1.25
X7 Group orientation -0.303 0.20 1.4 -0.017 0.311 0.055
X8 Market intelligence -0.059 0.28 0.211 0.373 0.17 2.18*
X9 Risk orientation -0.128 0.21 0.60 -0.101 0.18 0.5464
X10 Innovativeness 0.23 0.21 1.06 -0.171 0.181 0.94
X11 Management orientation 0.065 0.11 0.57 -0.021 0.053 0.400 R2 : 0.56 F value: 5.7258 R2 : 0.22 F value: 1.27
** -- Significant at 0.01 probability level; *- Significant at 0.05 probability level; NS —Non significant
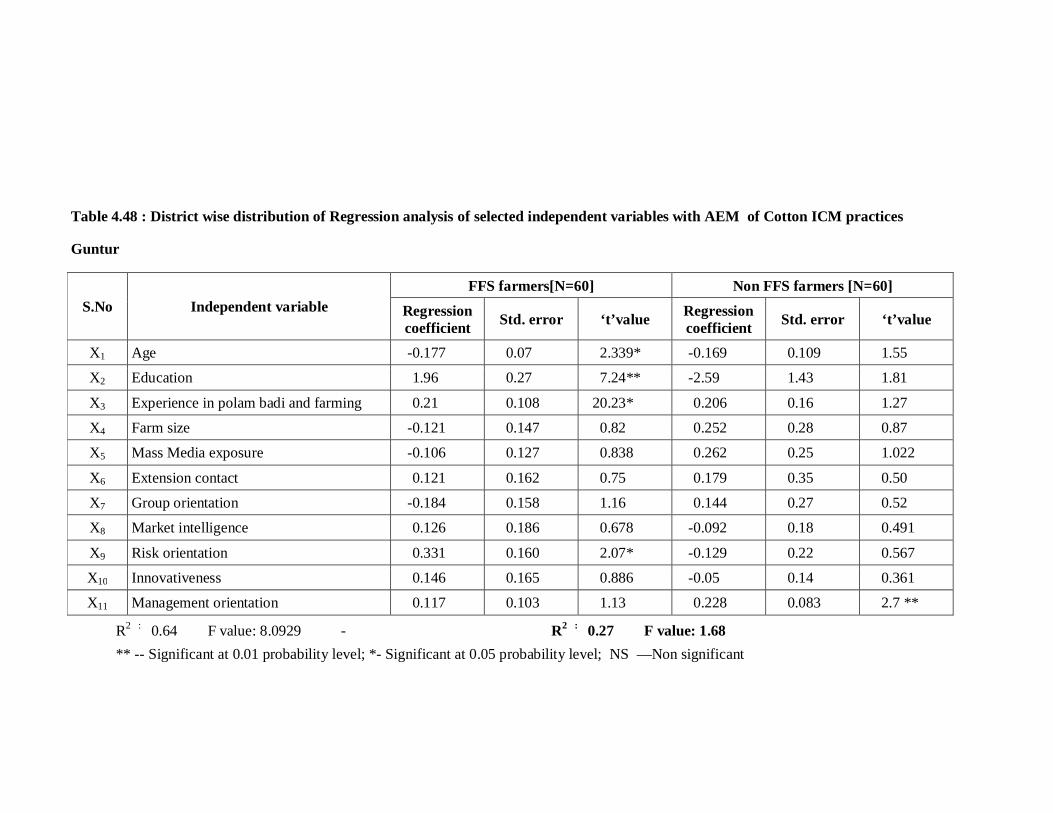
Table 4.48 : District wise distribution of Regression analysis of selected independent variables with AEM of Cotton ICM practices
Guntur
S.No Independent variable FFS farmers[N=60] Non FFS farmers [N=60]
Regression coefficient Std. error ‘t’value Regression
coefficient Std. error ‘t’value
X1 Age -0.177 0.07 2.339* -0.169 0.109 1.55
X2 Education 1.96 0.27 7.24** -2.59 1.43 1.81
X3 Experience in polam badi and farming 0.21 0.108 20.23* 0.206 0.16 1.27
X4 Farm size -0.121 0.147 0.82 0.252 0.28 0.87
X5 Mass Media exposure -0.106 0.127 0.838 0.262 0.25 1.022
X6 Extension contact 0.121 0.162 0.75 0.179 0.35 0.50
X7 Group orientation -0.184 0.158 1.16 0.144 0.27 0.52
X8 Market intelligence 0.126 0.186 0.678 -0.092 0.18 0.491
X9 Risk orientation 0.331 0.160 2.07* -0.129 0.22 0.567
X10 Innovativeness 0.146 0.165 0.886 -0.05 0.14 0.361
X11 Management orientation 0.117 0.103 1.13 0.228 0.083 2.7 **
R2 : 0.64 F value: 8.0929 - R2 : 0.27 F value: 1.68 ** -- Significant at 0.01 probability level; *- Significant at 0.05 probability level; NS —Non significant

Table 4.49. District wise distribution of Simple Correlation analysis of independent variables with Decision making of FFS and non FFS farmers
S.No Independent variables
Correlation values [r]
Warangal Kadapa Guntur Total
FFS Non FFS FFS Non FFS FFS Non FFS FFS Non FFS
X1 Age -0.51** 0.052 -0.35** 0.009 -0.37** -0.53 -0.28** 0.008
X2 Education 0.85** 0.504** 0.75** 0.107 0.758** 0.124 0.474** 0.292**
X3 Experience in farming -0.44** 0.013 -0.40** 0.071 -0.234NS 0.073 -0.241** 0.059
X4 Farm size 0.14NS 0.086 0.036NS 0.253* 0.168NS 0.261* 0.005 0.045
X5 Mass Media exposure 0.199NS 0.076 0.38** 0.157 0.040NS 0.037 0.112 0.033
X6 Extension contact 0.36** 0.082 0.18NS 0.033 0.071NS 0.062 0.115 0.020
X7 Group orientation 0.51** 0.018 0.14NS 0.080 -0.071NS 0.045 0.077 0.109
X8 Market intelligence 0.54** 0.192 0.15NS 0.012 0.039NS 0.053 0.048 0.050
X9 Risk orientation 0.52** 0.149 0.006NS 0.262* 0.205NS 0.079 0.070 0.074
X10 Innovativeness 0.52** 0.050 0.14NS 0.224 0.192NS 0.004 0.161* 0.016
X11 Management orientation 0.59** 0.333** 0.11NS 0.248 0.0115NS 0.082 0.031 0.299**
** --- Significant at 0.01 probability level ; * --- Significant at 0.05 probability level ; NS —Non significant

Table 4.50 : District wise distribution of Regression analysis of selected independent variables with Decision making of Cotton ICM practices
Warangal
S.No Independent variable FFS farmers[N=60] Non FFS farmers [N=60]
Regression coefficient Std. error ‘t’ value Regression
coefficient Std. error ‘t’ value
1 Age -0.16 0.11 1.38 -0.03 0.08 0.43
2 Education 4.43 0.65 6.77 ** 1.54 0.39 3.9**
3 Experience in polam badi and farming 0.23 0.13 1.70 0.108 0.10 1.05
4 Farm size -0.7 0.38 1.80 0.29 0.23 1.26
5 Mass Media exposure 0.066 0.18 0.36 -0.12 0.21 0.57
6 Extension contact 0.13 0.16 0.80 0.184 0.20 0.88
7 Group orientation -0.22 0.24 0.92 0.065 0.19 0.33
8 Market intelligence 0.094 0.255 0.36 -0.40 0.19 2.04*
9 Risk orientation 0.22 0.26 0.85 0.48 0.23 20.3*
10 Innovativeness -0.34 0.23 1.4 -0.12 0.18 0.67
11 Management orientation -0.099 0.12 0.82 0.065 0.077 0.856 R2 : 0.78 F value: 15.4700 R2 : 0.41 F value: 3.09

Table 4.51 : District wise distribution of Regression analysis of selected independent variables with Decision making of Cotton ICM practices
Kadapa
S.No Independent variable FFS farmers[N=60] Non FFS farmers [N=60]
Regression coefficient Std. error ‘t’ value Regression
coefficient Std. error ‘t’ value
X1 Age -0.19 0.17 1.08 0.140 0.088 1.59
X2 Education 4.9 0.688 7.12** -0.25 0.32 0.78
X3 Experience in polam badi and farming 0.13 0.17 0.76 -0.19 0.09 2.02*
X4 Farm size 0.22 0.28 0.77 -0.32 0.15 2.01*
X5 Mass Media exposure -0.474 0.29 1.6 -0.06 0.26 0.23
X6 Extension contact 0.226 0.27 0.82 -0.22 0.23 0.955
X7 Group orientation -0.140 0.32 0.43 -0.23 0.28 0.822
X8 Market intelligence 0.384 0.44 0.86 -0.020 0.25 0.083
X9 Risk orientation -0.007 0.33 0.023 0.37 0.23 1.58
X10 Innovativeness 0.47 0.34 1.3 0.33 0.25 1.3
X11 Management orientation 0.19 0.17 1.1 0.038 0.05 0.76 R2 : 0.63 F value: 7.6025 R2 : 0.26 F value: 1.56 ** -- Significant at 0.01 probability level; *- Significant at 0.05 probability level; NS —Non significant

Table 4.52 : District wise distribution of Regression analysis of selected independent variables with Decision making of Cotton ICM practices
Guntur
S.No Independent variable FFS farmers[N=60] Non FFS farmers [N=60]
Regression coefficient Std. error ‘t’value Regression
coefficient Std. error ‘t’value
X1 Age -0.42 0.12 3.32** -0.263 0.09 2.856**
X2 Education 3.82 0.46 8.2** 0.897 1.20 0.744
X3 Experience in polam badi and farming 0.501 0.18 2.7** 0.402 0.13 2.96**
X4 Farm size 0.051 0.25 0.205 0.379 0.24 1.57
X5 Mass Media exposure -0.149 0.21 0.68 0.072 0.21 0.33
X6 Extension contact 0.263 0.27 0.95 -0.036 0.29 0.123
X7 Group orientation -0.276 0.26 1.03 -0.092 0.23 0.40
X8 Market intelligence -0.065 0.31 0.206 -0.06 0.15 0.38
X9 Risk orientation 0.669 0.27 2.45* -0.11 0.19 0.57
X10 Innovativeness 0.128 0.28 0.45 -0.026 0.12 0.21
X11 Management orientation 0.239 0.17 1.36 -0.037 0.070 0.53
R2 : 0.70 F value: 10.6782 R2 : 0.23 F value: 1.30 ** -- Significant at 0.01 probability level; *- Significant at 0.05 probability level; NS —Non significant
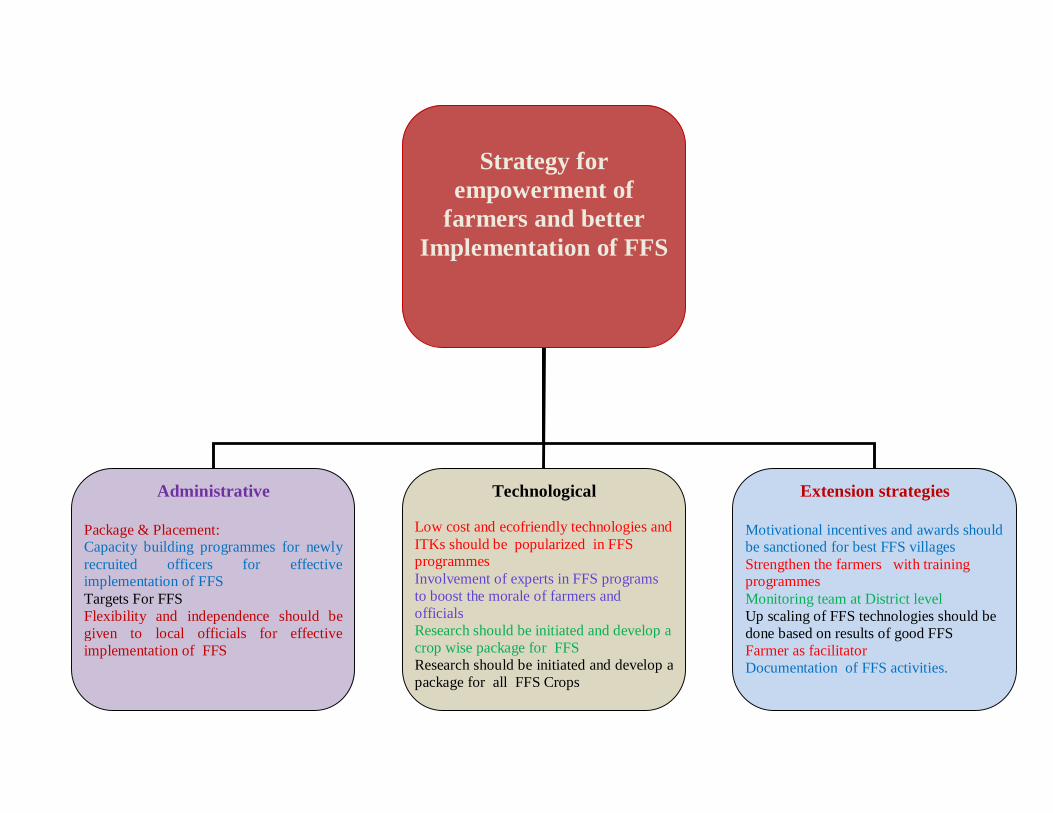
Strategy for
empowerment of farmers and better
Implementation of FFS
Administrative
Package & Placement: Capacity building programmes for newly recruited officers for effective implementation of FFS Targets For FFS Flexibility and independence should be given to local officials for effective implementation of FFS
Technological Low cost and ecofriendly technologies and ITKs should be popularized in FFS programmes Involvement of experts in FFS programs to boost the morale of farmers and officials Research should be initiated and develop a crop wise package for FFS Research should be initiated and develop a package for all FFS Crops
Extension strategies Motivational incentives and awards should be sanctioned for best FFS villages Strengthen the farmers with training programmes Monitoring team at District level Up scaling of FFS technologies should be done based on results of good FFS Farmer as facilitator Documentation of FFS activities.

Independent variables Dependent variables
Fig. 1 : CONCEPTUAL MODEL OF THE STUDY
X1 Age
X2 Education
X3 Experience in polambadi and farming
X4 Farm size
X5 Mass Media exposure
X6 Extension contact
X7 Group orientation
X8 Risk orientation
X9 Market intelligence
X10 Innovativeness
X11 Management orientation
Attitude
Knowledge
Skill
Adoption
Agro ecosystem management
Decision making ability
Empowerment of Farmers FFS FFS
EMPOWERMENT
OF FARMERS

ATTITUDE KNOWLEDGE SKILL ADOPTION AEM DECISION MAKING
FFS / Non FFS Farmers
X1* X2** X3* X4 X5** X6 X7 X8** X9*** X10** X11***
X1* X2** X3* X4 X5*** X6 X7 X8 X9 X10** X11
X1 X2** X3 X4 X5*** X6 X7 X8 X9 X10*** X11
X1* X2** X3* X4 X5*** X6 X7 X8 X9 X10*** X11
X1* X2** X3* X4 X5*** X6 X7 X8** X9 X10** X11
X1* X2** X3* X4 X5 X6 X7 X8** X9** X10 X11
X1 Age X2 Education X3 Experience in polam badi and farming X4 Farm size X5 Mass Media exposure X6 Extension contact X7 Group orientation X8 Risk orientation X9 Market intelligence X10 Innovativeness X11 Management orientation
FFS farmers * Negatively significant at 0.05 level of probability ** Positively Significant at 0.01 level of probability *** Positively Significant at 0.05 level of probability
Non FFS farmers Positively Significant at 0.01 level of probability Positively Significant at 0.05 level of probability
Fig. 9 : EMPIRICAL MODEL OF THE STUDY
Independent variables
Dependent variables
EMPOWERMENT OF FARMERS

0
10
20
30
40
50
60
70
80
90
100
Lessfavourable
Moderatelyfavourable
Morefavourable
Lessfavourable
Moderatelyfavourable
Morefavourable
Lessfavourable
Moderatelyfavourable
Morefavourable
Lessfavourable
Moderatelyfavourable
Morefavourable
Warangal Kadapa Guntur Total
Attitude
Per
cen
t
FFS Non-FFS
Fig. 2 : Distribution of FFS and Non FFS farmers based on their Attitude towards FFS

0
10
20
30
40
50
60
70
80
90
100
Low Medium High Low Medium High Low Medium High Low Medium High
Warangal Kadapa Guntur Total
Knowledge
Per
cen
t
FFS Non-FFS
Fig. 3: Distribution of FFS and Non FFS farmers based on their Knowledge on ICM Cotton practices

0
10
20
30
40
50
60
70
80
90
100
Low Medium High Low Medium High Low Medium High Low Medium High
Warangal Kadapa Guntur Total
Skills
Per c
ent
FFS Non-FFS
Fig. 4 : Distribution of FFS and Non FFS farmers based on their Skills learnt on ICM Cotton practices

0
10
20
30
40
50
60
70
80
90
100
Low Medium High Low Medium High Low Medium High Low Medium High
Warangal Kadapa Guntur Total
Adoption
Per c
ent
FFS Non-FFS
Fig. 5 : Distribution of FFS and Non FFS farmers based on their Adoption of ICM Cotton practices

0
10
20
30
40
50
60
70
80
90
100
Low Medium High Low Medium High Low Medium High Low Medium High
Warangal Kadapa Guntur Total
Agro ecosystem management
Per c
ent
FFS Non-FFS
Fig. 6 : Distribution of FFS and Non FFS farmers based on their Agro-Ecosystem Management of ICM Cotton practices

0
10
20
30
40
50
60
70
80
90
100
Low Medium High Low Medium High Low Medium High Low Medium High
Warangal Kadapa Guntur Total
Decision making ability
Per c
ent
FFS Non-FFS
Fig. 7: Distribution of FFS and Non FFS farmers based on their Decision making ability ICM Cotton practices

CHAPTER V
SUMMARY AND CONCLUSIONS
The agriculture services in the country is in the process of reorientation of their
development strategies towards supporting farmer empowerment. One method of
empowering farmers and their capacity building is through Farmers Field School (FFS).
FFS is a participatory approach to adult education adopted by Indian government since
1990 towards the achievement of ecologically sound, profitable and socially sustainable
small scale farming. FFS is based on the assumption that farming communities have a
vast body of knowledge, skills and experience on which they can build their future.
Participatory extension approaches such as farmer to farmer extension and FFS
encourage farmers to utilize their resources, own knowledge, skills while integrating
new expertise; enhance farmers position as manager of their own land and resources.
FFS empowered to build up their self- confidence and self- reliance.
The Farmer Field School (FFS) has one of the most impressive track records in
participatory community approaches with 2–3 million farmers graduated on the
agricultural subject of Integrated Pest Management (IPM) during the past 15 years,
mainly in Asia, but more recently in Africa, the Middle East and Latin America also. A
review study indicated a range of positive outcomes of IPM Farmer Field Schools such
as drastic reductions in agro-pesticide use, economic benefits and empowerment effects.
The FFS approach evolved from the need to strengthen the ecological basis of
Integrated Pest Management (IPM) to deal with the variability and complexity of agro-
ecosystems whilst reducing reliance on pesticides. The ecology of opportunist insects
(which include mosquitoes) is highly localized and dynamic, with populations

fluctuating manifold both spatially and temporally. Accordingly, most tropical
smallholder agro-ecosystems require management decisions that are tailored to local
and contemporary conditions. This implies the need to decentralize expertise to the field
level by educating local people to analyze field situations and to make appropriate
management decisions. Thus, the Field School was a school without walls that taught
basic agro-ecology and management skills.
In India the FAO Inter country programme for rice started in 1994 followed by
the FAO_EU IPM Programme for Cotton in Asia between 2000-2004 and since then
more than 8700 FFS were conducted in 28 states of India. From 2004 onwards, the state
governments modified the existing extension approach from demonstration to FFS so as
to enable farmers to evaluate technologies by themselves. In India realizing the
effectiveness of FFS and economic and social benefits to resource poor farmers the
states of A.P, Karnataka and Maharastra have taken steps to institutionalize the IPM-
FFS model for cotton and other crops in their main stream extension.
Agriculture education has moved from farmer training centres to villages by
establishing a state wide network of Polambadi (Farm Schools). Polambadi offers
practical demos and training on field for 14 weeks. The Department of Agriculture
Government of A.P has taken up promotion of FFS in large scale since Rabi-2004 to
reduce cost of cultivation, increase the productivity, and reduce pesticide usage by
adopting eco friendly alternatives to pesticides and also creating awareness among
farmers about the pesticides hazards. It also ensures empowering the farmers to take up
economic decisions in adopting practices of integrated crop management (ICM). In A.P
about 20,000 FFS s were conducted from 2001 to 2007 (Kharif) on Maize, Rice, Cotton,
Oilseed crops.
Farmer field school consists of group of people with a common interest, who get
together on a regular basis to study the “how and why” of a particular topic. The topic
covered can vary considerably form ICM (INM+ IPM), Organic agriculture, Farm
mechanization, Soil husbandry, Income generating activities such as bio-agents
production. The vow of FFS would be to produce a healthy crop in eco-friendly
approach duly considering the fundamentals of eco-system. FFS are comparable to
programmes such as study circles, religious studies at church, mosque or temple or
specialized study programmes for any skill.
The effects of FFS go beyond a reduction in input use and increase in yield. The
FFS curriculum emphasizes the development of critical analytic and communication
skills. This has triggered the further development of field experimentation by farmers,
collective action, leadership, planning and organization. Reports from Indonesia have
described how the FFS assisted by post FFS activities, have resulted in local initiatives
which have produced new structures, networks and policy change. In A.P also, the Dept.
of Agriculture has started the concept of facilitator among the group of farmers.
Facilitator will conduct one FFS by following the guidelines. It is enviable and worth to
study the empowerment of farmers though FFS as it gives clear picture of attitude of
the farmers towards FFS programme, but also give proper direction and the vision to
trainers and policy makers.
This study was mainly intended to find out the empowerment in terms of
Knowledge, Skills, Adoption, Agro ecosystem management and Decision making
ability of cotton integrated crop management practices by farmers after FFS
programme. An attempt is also made to study the agro ecosystem management and
utilization of ITKs farmers while practicing cotton FFS. The findings of the study

would help for further refinement of FFS programme for reaching more no. of farmers
with adoptable low cost technologies in Cotton. Keeping in view the importance of
farmer to farmer extension as means of empowerment, the present study is aimed to
study the empowerment of farmers through Farmer Field School in Andhra Pradesh
with the following objectives.
1.2 OBECTIVES OF THE STUDY
General objective
To assess the empowerment of farmers on ICM Cotton through Farmer Field
School (FFS) in Andhra Pradesh.
Specific objectives
1. To study the personal, socio-economic, psychological characteristics of FFS farmers
and non FFS farmers.
2. To measure the attitude of FFS Farmers and non FFS farmers towards FFS.
3. To study the extent of knowledge and adoption of FFS practices by FFS farmers and
non FFS farmers.
4. To study the Agro-ecosystem management by FFS farmers and Non Farmers ,
(groups and communities)
5. To find out the exploration and utilization of ITKs by FFS farmers and Non FFS
farmers.
6. To study the relationship between the selected personal, socio-economic,
psychological characteristics and empowerment in terms of Attitude, Knowledge,
Skill, Extent of adoption, Agro ecosystem management and Decision making.
7. To elicit the constraints and suggestions from FFS farmers and Extension officials
to formulate appropriate strategies for effective functioning.

RESEARCH DESIGN
Ex-post- facto research design was used in the study.
SAMPLING PROCEDURE
The study was conducted in Andhra Pradesh. Three districts one each from
Telangana, Rayalaseema and Andhra region i.e., Warangal, Kadapa and Gunturu were
selected purposively based on highest number of FFSs on Cotton crop during 2006-
2007. Two mandals from each district namely Hasanparthy and Nekkonda (Warangal
district), Porumamilla and Kalasapadu (Kadapa district) and Tadikonda, Amravathi
(Guntur) were selected purposively based on highest number of Cotton Farmers Field
schools organized during 2006-2007.One Farmer Field School was selected from each
mandal, thus six FFSs were selected for the study. The villages selected were
Seethampeta (Hasanparthy), Deekshakunta (Nekkonda) of Warangal district,
Rajasahebpeta (Porumamilla), Rajupalem (Kalasapadu) of Kadapa district and
Ponnekallu (Tadikonda) Daranikota (Amaravathi) were selected for the study.180 FFS
farmers (30 from one FFS) and 180 Non FFS farmers (30 from each village) and 18
Extension officers (6 from each district) were selected randomly for the study. Thus, a
total of 360 farmers (180 FFS farmers and 180 Non FFS farmers) and 18 Extension
officers from three districts of A.P formed the sample of the study.
VARIABLES SELECTED FOR THE STUDY
Dependent variables
Attitude, Knowledge, Skill, Adoption, Agro ecosystem management and
Decision making were selected as Dependent variables
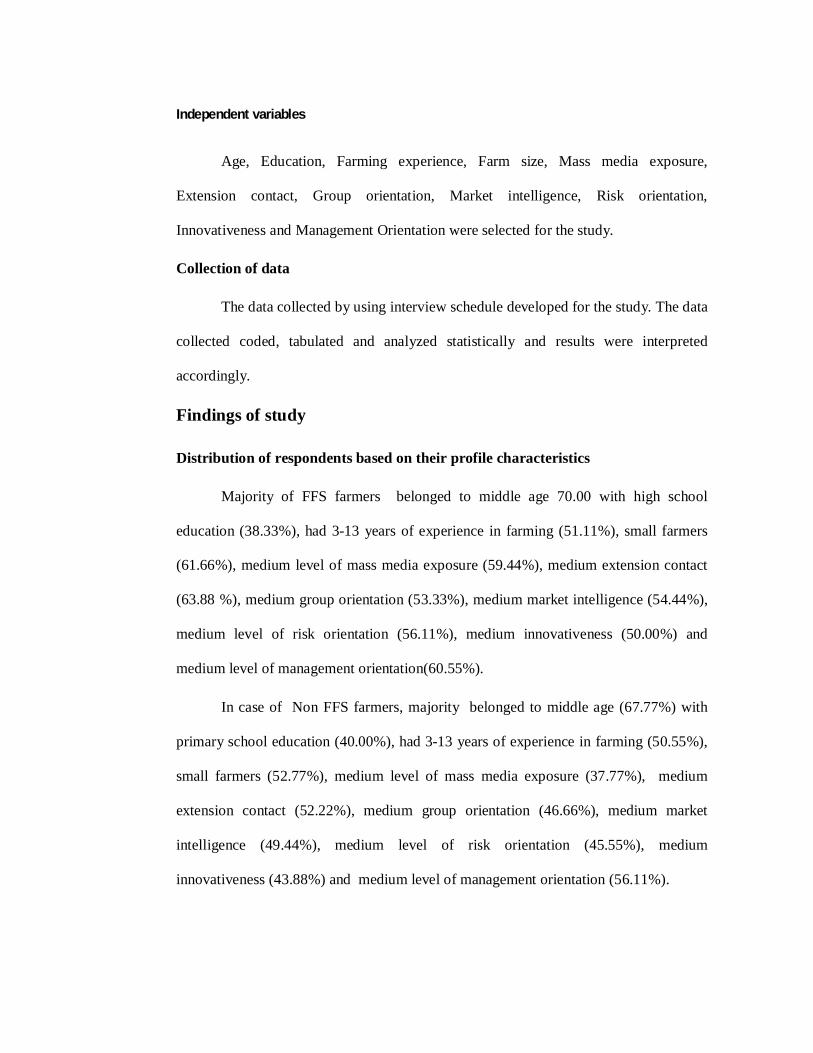
Independent variables
Age, Education, Farming experience, Farm size, Mass media exposure,
Extension contact, Group orientation, Market intelligence, Risk orientation,
Innovativeness and Management Orientation were selected for the study.
Collection of data
The data collected by using interview schedule developed for the study. The data
collected coded, tabulated and analyzed statistically and results were interpreted
accordingly.
Findings of study
Distribution of respondents based on their profile characteristics
Majority of FFS farmers belonged to middle age 70.00 with high school
education (38.33%), had 3-13 years of experience in farming (51.11%), small farmers
(61.66%), medium level of mass media exposure (59.44%), medium extension contact
(63.88 %), medium group orientation (53.33%), medium market intelligence (54.44%),
medium level of risk orientation (56.11%), medium innovativeness (50.00%) and
medium level of management orientation(60.55%).
In case of Non FFS farmers, majority belonged to middle age (67.77%) with
primary school education (40.00%), had 3-13 years of experience in farming (50.55%),
small farmers (52.77%), medium level of mass media exposure (37.77%), medium
extension contact (52.22%), medium group orientation (46.66%), medium market
intelligence (49.44%), medium level of risk orientation (45.55%), medium
innovativeness (43.88%) and medium level of management orientation (56.11%).
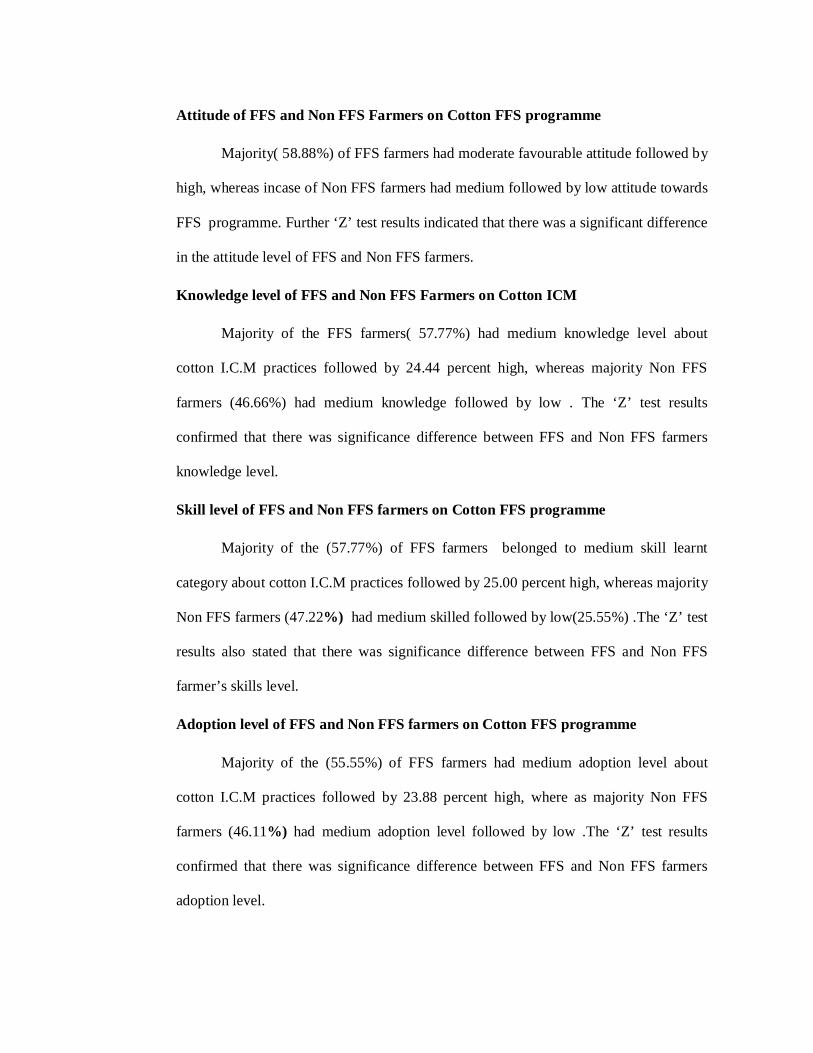
Attitude of FFS and Non FFS Farmers on Cotton FFS programme
Majority( 58.88%) of FFS farmers had moderate favourable attitude followed by
high, whereas incase of Non FFS farmers had medium followed by low attitude towards
FFS programme. Further ‘Z’ test results indicated that there was a significant difference
in the attitude level of FFS and Non FFS farmers.
Knowledge level of FFS and Non FFS Farmers on Cotton ICM
Majority of the FFS farmers( 57.77%) had medium knowledge level about
cotton I.C.M practices followed by 24.44 percent high, whereas majority Non FFS
farmers (46.66%) had medium knowledge followed by low . The ‘Z’ test results
confirmed that there was significance difference between FFS and Non FFS farmers
knowledge level.
Skill level of FFS and Non FFS farmers on Cotton FFS programme
Majority of the (57.77%) of FFS farmers belonged to medium skill learnt
category about cotton I.C.M practices followed by 25.00 percent high, whereas majority
Non FFS farmers (47.22%) had medium skilled followed by low(25.55%) .The ‘Z’ test
results also stated that there was significance difference between FFS and Non FFS
farmer’s skills level.
Adoption level of FFS and Non FFS farmers on Cotton FFS programme
Majority of the (55.55%) of FFS farmers had medium adoption level about
cotton I.C.M practices followed by 23.88 percent high, where as majority Non FFS
farmers (46.11%) had medium adoption level followed by low .The ‘Z’ test results
confirmed that there was significance difference between FFS and Non FFS farmers
adoption level.

Agro ecosystem management of FFS and Non FFS farmers on Cotton FFS
programme
Majority of the (56.66%) of FFS farmers had medium agro ecosystem
management level about cotton I.C.M practices followed by 23.88 percent high, where
as majority Non FFS farmers (50.55%) had medium agro ecosystem management level
followed by low .The ‘Z’ test results stated that there was significance difference
between FFS and Non FFS farmers Agro ecosystem management level.
Decision making ability of FFS and Non FFS farmers on Cotton FFS programme
Majority of the (51.11%) of FFS farmers had medium decision making ability
about cotton I.C.M practices followed by 27.77 percent high, whereas majority Non
FFS farmers (45.00%) had medium decision making followed by low .Further ‘Z’ test
results stated that there was significance difference between FFS and Non FFS farmers
decision making level.
Relationship between selected profile characteristics of the FFS and Non FFS
farmers and their Attitude towards Cotton FFS
Education, Mass media exposure, Market intelligence, Risk orientation,
Innovativeness and management orientation were positively significant whereas Age
and Experience in farming were found be negatively significant with Attitude level of
FFS farmers on Cotton ICM practices. Whereas in case of non FFS farmers all the
variables were non -significant.
Combined effect of all selected independent variables on Attitude of FFS and Non
FFS farmers towards Cotton FFS
All the 11 independent variables put together explained for about 76.66 percent
variation in the attitude of FFS farmers and 48.33 percent in Non FFS farmers about

Cotton FFS programme. Education,Farm size, Extension contact, Group orientation,
Risk orientation, Innovativeness and Management orientation had positively and
significantly contributed towards variation about attitude of FFS farmers. Whereas in
Non FFS farmers all the variables were non- significant.
Relationship between selected profile characteristics of the FFS and Non FFS
farmers and their Knowledge towards Cotton FFS
Education, Mass media exposure and Innovativeness were positively significant
whereas Age and Experience in farming were found be negatively significant with
Knowledge level of FFS farmers on Cotton ICM practices. Whereas in Non FFS
farmers all the variables were non- significant.
Combined effect of all selected independent variables on knowledge of FFS and
Non FFS farmers towards Cotton FFS
All the 11 independent variables put together explained for about 80.00 percent
variation in the Knowledge of FFS farmers and 44.33 percent in Non FFS farmers about
Cotton FFS programme. Age, Education, Risk orientation and Innovativeness had
positively and significantly contributed towards variation about Knowledge of FFS
farmers. Where as in Non FFS farmers Education contributed significantly towards
Knowledge.
Relationship between selected profile characteristics of the FFS and Non FFS
farmers and their Skill towards Cotton FFS
Education, Mass media exposure and Innovativeness were significant with Skill
of FFS farmers on Cotton ICM practices, whereas all the variables were found to be non
-significant with skills of non FFS farmers.

Combined effect of all selected independent variables on Skill of FFS and Non FFS farmers towards Cotton FFS
All the 11 independent variables put together explained for about 77.00 percent
variation in the Skill of FFS farmers and 42.00 percent in Non FFS farmers about
Cotton FFS programme. Education, Experience and Extension contact had positively
and significantly contributed towards variation about Skill of FFS farmers. Whereas in
Non FFS farmers Education and Experience contributed significantly towards Skill.
Relationship between selected profile characteristics of the FFS and Non FFS
farmers and their Adoption towards Cotton FFS
Education, Mass media exposure and Innovativeness were positively significant,
whereas Age and Experience in farming were found be negatively significant with
Adoption level of FFS farmers on Cotton ICM practices. Whereas incase of non FFS
farmers age, education and experience were found to be positively significant
relationship with Adoption of Cotton ICM practices.
Combined effect of all selected independent variables on Adoption of FFS and Non
FFS farmers towards Cotton FFS
All the 11 independent variables put together explained for about 74.00 percent
variation in the Adoption of FFS farmers and 46.66 percent in Non FFS farmers about
Cotton FFS programme. Age, Education and Extension contact had positively and
significantly contributed towards variation about Adoption of FFS farmers. Whereas in
Non FFS farmers Education contributed significantly towards Adoption.
Relationship between selected profile characteristics of the FFS and Non FFS
farmers and their Agro ecosystem management towards Cotton FFS
Education, Mass media exposure and Innovativeness were positively significant
whereas Age and Experience in farming were found be negatively significant with agro

ecosystem management of FFS farmers on Cotton ICM practices. Whereas incase of
non FFS farmers all the variables were found to be non- significant relationship with
agro ecosystem management of Cotton ICM practices.
Combined effect of all selected independent variables on Agro ecosystem
management of FFS and Non FFS farmers towards Cotton FFS
All the 11 independent variables put together explained for about 55.33 percent
variation in the Agro ecosystem management of FFS farmers and 37.33 percent in Non
FFS farmers about Cotton FFS programme. Education, experience and risk orientation
had positively and significantly contributed towards variation about Agro ecosystem
management of FFS farmers. Where as in case of untrained farmers Group orientation,
Market intelligence and Management orientation Education significantly contributed in
Agro ecosystem management.
Relationship between selected profile characteristics of the FFS and Non FFS
farmers and their Decision towards Cotton FFS
Education, Innovativeness were positively significant whereas Age and
Experience in farming were found be negatively significant with decision of FFS
farmers on Cotton ICM practices. Whereas incase of non FFS farmers Education and
management orientation were found to be positively significant relationship with
decision of Cotton ICM practices.
Combined effect of all selected independent variables on Decision of FFS and Non
FFS farmers towards Cotton FFS
All the 11 independent variables put together explained for about 70.33 percent
variation in the decision of FFS farmers and 43.00 percent in Non FFS farmers about
Cotton FFS programme. Age, Education, Risk orientation and Innovativeness had

positively and significantly contributed towards variation about Decision of FFS
farmers. Whereas in Non FFS farmers Extension contact, Market intelligence
significantly towards Decision.
ITKs used by FFS and non FFS farmers
Except Neem based products no other ITKS were used in FFS programme. But
in case of non FFS farmers ITKs like Putting light in Pot acts as light trap in Cotton
crop, Apply Inguva 30g/plant and then irrigate to reduce wilt incidence, Puttamannu
50g+ Cow urine 50ml+Cow dung 50 gused for treatment (acts as anti- biotic and
improves germination percentage)
Constraints faced by Farmers and Officials
Majority of FFS farmers indicated that Non supply of required Quality inputs on
time, Delay in soil test reports drawn for FFS programme , Short term and long term
experiments are not planned and conducted regularly , Wide Publicity is lacking ,
Women participation is less , Effective linkages should be provided to market their
produce at higher price , Conducting department meetings on FFS days disrupting FFS
, Amount allotted per week is not sufficient , Non- involvement of experts in FFS
sessions and Awards and incentives for best FFS is not there for motivating farmers
were the constraints in FFS programme implementation.
The officials expressed that No Mobility or vehicle facility to visit FFS sessions
punctually , Budget and funds/ inputs are not released in time , FFS should not be
purely target oriented, Insufficient funds for weekly classes, No motivation for good
FFS programme to farmers and Officers, Lack experience to field staff in FFS, Lack of
buyback facilities for quality produce, There is no scope to bring experts in sessions,
Other meetings are conducted on FFS days and There is no revolving fund for

conducting FFS at agril officer level were constraints in implementing the FFS
programme.
Suggestions made by Farmers and officials
The FFS farmers suggested that All FFS Inputs should be supplied well in
advance, Soil sample analysis and results should be communicated immediately , Short
term and long term experiments should be planned and conducted regularly , Better
market facilities or linkages should be created for getting remunerative returns, Wide
publicity to FFS , Experts should be involved in sessions, No other meetings should be
conducted on FFS days, More Women should be involved, Low cost technologies
should be popularized, Upscaling of FFS should be done based on results of good FFS
and Awards and incentives for best FFS should be initiated.
The officials suggested that Mobility / Vehicle should be provided to Officers
for punctual work, Target and crop should be decided by Agril Officers , Funds should
be released well in advance , Timely supply of critical inputs , No other Meetings
should be conducted on FFS days and Season long technical training programme to
newly recruited staff on FFS ,then only the FFS programme can be implemented
successfully.
Implications of research study
1. Results indicated that majority of old age farmers had negative feeling about FFS,
therefore during selection of Farmers young to middle age (below 45 years)
farmers should be considered.
2. Education is a catalyst for development process. Majority of FFS farmers had
primary to high school education.. Therefore the educated farmers can be utilized

for conducting the FFS programme even in other villages also, as farmer to farmer
knowledge spread is quicker than conventional TOT.
3. Farming experience is negatively correlated with all dependent variables hence,
during the selection process of FFS, low to medium experience of farmers should
be given importance.
4. From the study it was observed that majority of FFS farmers and non FFS farmers
were not using ITKs in cotton crop management. Therefore in the curriculum of
FFS, locally identified ITKS must be included and popularized.
5. The study indicated that for successful implementation of FFS programme, the staff
meant for FFS should not be given additional duties like Civil supplies grain
procurement, Housing scheme evaluation etc. during the FFS period.
6. Majority of FFS farmers did not have command on preparation and use of
Trcichoderma. Therefore Dept of Agriculture in collaboration with ANGRAU
should conduct skill oriented trainings to FFS farmers for obtaining required
knowledge and skill. After training, organizations like NABARD, ATMA etc;
should encourage the production of Trichoderma at farmer level by providing the
required financial support.
7. It was observed that there was significant impact of FFS on beneficiary farmers
with respect to knowledge, skills, adoption ,Agro ecosystem management and
decision making ability. Therefore wide publicity should be given through mass
media about success of FFS programmme and non FFS farmers should also be
involved in future programmes.

8. The findings revealed that majority of FFS farmers had medium level adoption;
hence Dept.of agriculture should provide some incentives to FFS farmers who
adopt all the FFS practices.
9. More awareness need to be created on agro ecosystem management by means of
imparting knowledge through trainings and arranging visits to successful farms.
Suggestions for future research
1. A similar research should be conducted on Agro ecosystem management and its
impact in farming.
2. FFS empowerment in terms of socio-economic development of farmers to be
standardized.
3. Exclusive study on documentation of technologies popularized through FFS in
major crops may be taken up.
LITERATURE CITED
Allport,G.W. 1935 Attitudes in C.M. Murchinson [Ed] Hand book of social psychology, Clark University Press Massachussettes.
Atchuta Raju Kappala 2002 An Analysis of Sustainability of Agriculture in Watershed Environment in Mahaboobnagar District of Andhra Pradesh. Ph.D thesis submitted to Acharya N.G. Ranga Agricultural University, Hyderabad.
Avanish Kumar Singh, Gajendra Pratap Singh and Baldeo Singh 2003 Correlates of Adoption of Improved Chickpea Technology. Indian Journal of Extension Education XXXIX 1&2.
Balappa Shivaraya and Hugar L B 2002 A Study of integration of markets for onion and potato in Karnataka State .Agril.marketing 45(2) : 30-32 3 ref.
Balasubramani N,Govindagowda V, Lalitha K C,Ranganatha A D and Lakshminarayan M T 2000 Knowledge of rubber growers about improved cultivation practices, Land Bank Journal 39910;7-12.
Baswarajaiah V 2001 Impact of Edira Watershed development programme on farm families in Mahaboobnagar district of Andhra Pradesh. M.Sc.(Ag.) Thesis submitted to Acharya N.G. Ranga Agricultural University, Hyderabad.
Bhagyalakshmi K 2002. A critical study on micro enterprise management by rural women in Ranga Reddy district of Andhra Pradesh. Ph.D Thesis submitted to Acharya N.G. Ranga Agricultural University, Hyderabad.
Bhairamkar M S, Kadam J R and Mehta P G 1998 Knowledge level of farmers about Integrated Pest Management Programme. Maharashtra Journal of Extension Education 17 : 373-376.
Bhople R S and Lakhdive B A 1998 Us of neem seed extract for control of crop pests by farmers .Agricultural Extension Review 1093):29-30
Borkar M M, Chothe G D and Lenjewer A D 2000 Characteristics of farmers influencing their knowledge about use of bio-fertilizers. Maharashtra Journal of Extension Education 19:130-131.
Byra Reddy H N 1971 A study of differential characertisitcs of adopers and non-adopters of fertilisers to rainfed ragi in Bangalore North Taluk.M.Sc(Ag) Thesis submitted to University of Agricultural Sciences ,Bangalore.

Chandra J, Subhash, Lalitha K C, Prasanna Kumar G T and Ranganath A D 2000 Attitude of farmers watershed management practices. Land Bank Journal 39(4) : 31-36.
Chandravathi,Ch V S S N 1997 Training of Women inAgriculture in Andhra Pradesh –An economic evaluation in Visakhapatnam district M.Sc (Ag0 Thesis submitted to Acharya N.G.Ranga Agricultural University ,Hyderabad.
Chatterjee R K 2000 A study on the impact of National Watershed Development Project for rainfed areas (NWDPRA) in Burdwan district of West Bengal. M.Sc.(Ag.) Thesis submitted to Acharya N.G. Ranga Agricultural University, Hyderabad.
Dayanidhi 1997 A study on managerial attributes of sericulture farmers in relation to their sericulture farming performance in Ananthapur district of Andhra Pradesh M.Sc (Ag) Thesis submitted to Acharya N.G.Ranga Agricultural University ,Hyderabad.
Devi M. Nirmala and Manoharana M 1999 Contributing characteristics of guava cultivators ,Journal of Extension Education 10(20):2431-2433.
Devi R V 2000 A critical study on ANTWA project in Prakasam district of Andhra Pradesh ,M.Sc (Ag) thesis submitted to Acharya N.G. Ranga Agricultural University, Hyderabad.
Dinesh Agarwal and Mahaveer Chowdhary 2003. Adoption of Improved Goat Keeping Practices. Indian Journal of Extension Education 39 (1&2).
Edwards A L 1957 Techniques of attitude scale construction, Application Century Crafts Incorporation ,New York.
Feaston J.G. 1968 Measurement and Determination of Innovativeness among primitive agriculturists. Rural Sociology 33:339-348.
Gattu K C 2001 Production constraints of turmeric cultivation in Karimnagar district of Andhra Pradesh M.Sc.(Ag.) Thesis submitted to Acharya N.G. Ranga Agricultural University, Hyderabad.
Ghosh P K and Pandey K N 2003 Impact of Training on Knowledge of Farmers about Improved Rice Cultivation Technologies. Indian Journal of Extension Education 39(1&2).
Gupta A K 1999 Use of Extension Methods in Dissemination of Farm Information. Maharashtra Journal of Extension 18.
Halakatti S V, SAJJAN C M, Gowda D S M and Vijayalakshmi Kamaradi Empowerment of Women Through Dairy Training Karnataka Journal of Agricultural Sciences ,20[1]:89-92:2007.

Hemanth Kumar B 2002 A study on attitude , knowledge and adoption of recommended practices by Oriental tobacco farmers in Chittor district of Andhra Pradesh M.Sc., (Ag) Thesis submitted to Acharya N.G. Ranga Agricultural University, Hyderabad.
Jain R K and Battacharya P 2000 Farmer’s involvement in bio-fertilizers demonstration and promotion campaign, Maharashtra Journal of Extension, vol.19:264-268,
Jaswinder Singh and Kuldip Kumar 2006. Knowledge level of farmers of rainfed area of Punjab state regarding soil and water management practices Annals of Biology 22(2) :197-200,4 ref.
Jayalakshmi M and Santha Govind 2008 Knowledge level of Farm Women on Sustainable Plnat Protection Technologies in Paddy Cultivation. .Mysore Journal of Agricultural Sciences 42[1]:116-120,2008.
Kalaskar A P, Chowdhary A A, Ahire R D and Bansod R S 1999 Correlates of adoption of integrated pest management in cotton. Journal of Soils and Crops 9(2):192-194.
Kalsaskar A P, Shinde P S and Bhople R S 1999 Correlates of Adoption of Integrated Pest Management Technology by Cotton Growers. Maharashtra Journal of Extension, vol.18:45-48
Kalsaskar A P, Shinde P S , Bhople R S and Geete M H 2001 Factors influencing knowledge of cotton growers about integrated pest management practices in Cotton, Maharashtra Journal of Extension, vol.20:117-119
Kappala A R 2002 An analysis of sustainability of agriculture in watershed environment in Mahaboobnagar district of Andhra Pradesh. Ph.D Thesis submitted to Acharya N.G. Ranga Agricultural University, Hyderabad.
Karthikeyan C and Chandrakandan K 2000 Strategy for Capacity Building of the Potential growers of Export Oriented Cutflowers, pp. 225-228.
Karthikeyan C, Veeraragavathatham D, Karpagam D and Firdouse S A 2006 Cow based indigenous technologies in dry farming (Special issue on traditional agricultural practices). Indian Journal of Traditional Knowledge 5(1) : 47-50.
Khan M S1999 Critical analysis of ecofriendly technologies in rice cultivation. A study in an adopted village - Kondubhotlapalem. M.Sc.(Ag.) Thesis submitted to Acharya N.G. Ranga Agricultural University, Hyderabad.
Kiran S and Sudershan Rao B V 1999 Knowledge and Attitude of Farmers Towards Cyclone Disaster Management, Maharashtra J.Extn. Educ. XVIII,
Kiran S 1996 A study on disaster preparadness and mitigation mechanisms adopted by farmers of Nellore district in Andhra Pradesh. M.Sc.(Ag.) Thesis submitted to Acharya N.G. Ranga Agricultural University, Hyderabad.
Krishna Murthy B, Veerabhadraiah V and Rajanna N 2005 Impact of Farmer Field Schools on Knowledge and Attitude of Rice Farmers and Extension Personnel towards Integrated Pest Management in Rice Cultivation. Mysore Journal of Agricultural Sciences 39[1]:122-128,2005.
Kubbe V R, Tekale V S and Bhope R S 1999 Knowledge and Adoption of Soyabean Production Technology by Farmers Maharastra Journal of Extension Education 28 : 185-188.
Kumar S D 1996 A critical analysis of the training programmes conducted by Krishi Vigyan Kendras ,Ph.D. Thesis submitted to UAS ,Bangalore.
Kumar A A, Babu B and Ramachandran U 1999 Attitude of farmers towards agroforestry programme in Kerala. Indian Journal of Forestry 22(1&2): 155-159.
Lakshmana Kella 2003 Indigenous Technical Knowledge in Agriculture in High Altitude and Tribal Area Zone of Andhra Pradesh Ph.D thesis submitted to Acharya N.G. Ranga Agricultural University, Hyderabad.
Likert R 1932 A technique for the management of Attitude , Psychol.Stud,(592): 106-107.
Likert R 1932 A technique for the measurement of Attitude ,Arch-Psychology No.140
Lipi Das, Sanjoy Saha, Mishra S K, Rath N C and Dani R C 2005 Impact assessment of OFTs on Integrated Crop Management Techniques : a holistic approach with upland rice growers Oryza,42(4) : 301-305, 7 ref.
Madhavi Latha 2002 A study on knowledge and adoption of Integrated Pest Management practices in cotton farmers by Farmers Training Centre trained farmers in Kurnool district of Andhra Pradesh. M.Sc.(Ag.)Thesis, Acharya N.G. Ranga Agricultural University, Hyderabad.
Mahitha Kiran S 2000 A study on the participation of farm women in Agriculture and allied activities in Chittoor district of Andhra Pradesh. M.Sc.(Ag.) Thesis submitted to Acharya N.G. Ranga Agricultural University, Hyderabad.
Mancini F, 2006 Impact of farmer field schools on cotton growers in Asia-Presentation for the ICAC plenary meeting -11-15 September 2006.
Mancini F,Termorshuizen AJ,Jiggins J L S,Brugeen A H C van 2006 Increasing the environmental and social sustainability of cotton farming through farmer education in Andhra Pradesh, India. Agricultural systems ,2008,96:1/3 ,16-25,44 ref.
Manjunatha B N,Lakshminarayan M T Anand T N and Prasanna Kumar G T 1999 Factors effecting adoption of sustainable sugarcane farming practices-A

Discriminant function analysis, Mysore Journal of Agricultural Sciences 33:375-378
Maraddi G N, Hirevenkanagoudar L V, Angadi J G and Kunnal L B 2007 Analysis of Framers Knowledge about Selected Sustainable Cultivation Practices in Sugarcane Karnataka Journal of Agricultural Sciences 20[3] : 555-559.
Meti S K and Sundaraswamy B 1998 Attitude of farmers towards improved farm implements and their associated characteristics. Karnakata Journal of Agricultural Sciences 11(4) : 975-979.
Motamed M K and Baldeo Singh 2003 Correlates of adoption of improved sericulture practices. . Indian Journal of Extension Education Vol.XXXIX No 1&2
Murthy B K and Veerabhadraiah V 1999 Impact of IPM farmer field schools training programme on knowledge level of rice farmers 28 (9/10) : 125-127.
Murthy V S 2000 a study on Janmabhoomi programme in Chittoor district of Andhra Pradesh. M.Sc.(Ag.) Thesis submitted to Acharya N.G. Ranga Agricultural University, Hyderabad.
Nadre, K. R 2000 A study on constraints in adoption of recommended practices of cotton in Aurangabad and Jalna district. Manage Extension Research Review 1(2) : 66-76.
Nagadeve D P 1999 Plant protection status of IPM - trained dry paddy farmers in Vidarbha region of Maharashtra State. Ph.D Thesis submitted to Acharya N.G. Ranga Agricultural University, Hyderabad.
Natarajan N 2004 Impact of Farmers Field Schools on Rice in Pondichery Region of Union Territory of Pondicherry. M.Sc.(Ag). Thesis submitted to Acharya N.G. Ranga Agricultural University, Hyderabad.
Neela Rani R 1999 Analytical study of decision making pattern of tribal women in farm and home activities in Khammam district of Andhra Pradesh. M.Sc.(Ag.) Thesis submitted to Acharya N.G. Ranga Agricultural University, Hyderabad.
Nisha Aravind and Rakesh D 2006 Study on effectiveness of farmers field school (FFS) approach in rice ecosystem for integrated pest management. International Journal of Agricultural Sciences 2:2,621-625 8 ref.
Obaiah M C 2004 A study on capacity building of rice growing farmers of Farmers Field Schools (FFS) in Krishna Godavari Zone of Andhra Pradesh. Ph.D. Thesis submitted to Acharya N.G. Ranga Agricultural University, Hyderabad.
Obaiah M C and Atchuta Raju K 2008 Attitude of Participant and Non-Participant Farmers Towards Farmers Field Schools. Mysore Journal of Agricultural Sciences 42(2) : 316-322.

Patel M C, Chauhan N B and Korat D M, Consequences of Framers ‘Attributes on their Attitude towards Integrated Pest Management Strategy. Karnataka Journal of Agricultural Sciences 20[4] : 797-799.
Patil E R, Desai B D and Gandhi R D 2000. Constraints in Adoption of Rice Technology in Kai Irrigation Project of Raigad District (M.S.). Indian Journal of Extension Education 36(1&2).
Prasad M S and Sundaraswamy B 2000 Attitude of farmers towards dryland agricultural technologies. Journal of Extension Education 11(1) : 2666-2671.
Promila Sharma 2004 Status of marketing of organic products in mountain region of Uttaranchal, India.6th IFOAM-Asia scientific conference ,Yangpyung, Korea pp. 423-435 4 ref.
Purnima K S 2004 Women Self Help Group Dynamics in the North Coastal Zone of Andhra Pradesh. Ph.D Thesis submitted to Acharya N.G. Ranga Agricultural University, Hyderabad.
Radha Krishna S G, Eswarappa G and Manjunatha B N 2008 Personal and Socio-Economic Characteristics of Members of Self Help Groups of Sujala Watershed Programme and their Association with Levels of Empowerment and Decision Making with Respect to Capacity Building. Mysore Journal of Agricultural Sciences 42(2):337-339.
Raju, S 1999 A study on the impact of Andhra Pradesh training of women in Agriculture(ANTWA) in Kurnool of Andhra Pradesh. M.Sc.(Ag.) Thesis submitted to Acharya N.G. Ranga Agricultural University, Hyderabad.
Ramakrishna Rao L and Sethu Rao M K 2007 Contribution of Socio-Psychological and Innovation Attributes in Adoption of Sunflower Cultivation Technologies. Mysore Journal of Agricultural Sciences 41(1) : 127-132.
Ramakrishnan K 1999 Impact of Tamilnadu Women in Agriculture(TANWA) in Madurai district of Tamilnadu. M.Sc.(Ag.) Thesis, Acharya N.G. Ranga Agricultural University, Hyderabad.
Ramamurthy, V. S 2000 A study on Janmabhoomi programme in Chittoor district of Andhra Pradesh. M.Sc.(Ag.) Thesis submitted to Acharya N.G. Ranga Agricultural University, Hyderabad.
Rambabu Puli, 1997 Indigenous Technologies in Cropping Systems - An Analytical Study in Guntur District of Andhra Pradesh - Ph.D thesis submitted to Acharya N.G. Ranga Agricultural University.
Ramprasad D 2004 Participation of farmers in Agricultural Research, Extension and farmer linkage mechanisms in Krishna Godavari Zone of Andhra Pradesh. Ph.D thesis submitted to Acharya N.G. Ranga Agricultural University.
Rani N R 1999 Analytical study of decision making patterns among rural families and types of participation by rural women in the selected areas of decision making M.Sc.(Ag.) Thesis, Acharya N.G. Ranga Agricultural University, Hyderabad.
Ravichandra Prasad 2002 A study on the impact of On Farm Extension Demonstrations (OFFDs) in rice in Nellore district of Andhra Pradesh. M.Sc.(Ag.) Thesis, Acharya N.G. Ranga Agricultural University, Hyderabad.
Ravishankar 2000 A comparative study of Krishi Vigyan Kendras (KVKs) of Governmental Organizations and Non Governmental Organizations in Kurnool district of Andhra Pradesh. M.Sc.(Ag.) Thesis submitted to Acharya N.G. Ranga Agricultural University, Hyderabad.
Ravishankar K 2005 Agricultural Weather Forecasting, Impact and Analysis in Andhra Pradesh. Ph.D. Thesis submitted to Acharya N.G. Ranga Agricultural University, Hyderabad.
Reddy S S 2003b A study on the extrepreneurial behaviour of sericulture farmers in Chittoor district of Andhra Pradesh. M.Sc.(Ag.) Thesis submitted to Acharya N.G. Ranga Agricultural University, Hyderabad.
Reddy T S P 2003a Differential innovation, decision and attitude of rice growing farmers towards eco-friendly technologies in Andhra Pradesh - A critical Analysis. Ph.D. Thesis submitted to Acharya N.G. Ranga Agricultural University, Hyderabad.
Samantha R.K. 1977 A study of some agro-economic and communication variable associated with repayment behavior of agricultural credit users of Nationalised banks .Ph.D Thesis ,Bidan Chandra Krishi Vidyalaya,Nadia.
Sarada O 2004 Perception of communication and feed back effectiveness among researches extensionist and farmers. Ph.D thesis submitted to Acharya N.G. Ranga Agricultural University.
Sarita Vaish ,Prakash Singh and Mishra B 2003 Correlates of Knowledge of rural women about rice production technology. Indian Journal of Extension Education Vol.XXXIX No 1&2
Satish Rahul M 2003 A study on risk perception and adoption of risk management practices by the papaya growers in Kadapa district of Andhra Pradesh M.Sc(Ag). Thesis submitted to Acharya N.G. Ranga Agricultural University, Hyderabad.
Satpal Singh, Makhija V K, Joginder S, Malik and Subhash Chander 2003. Farmer’s Knowledge and Correlates of Sunflower Production Technology. Indian Journal of Extension Education 39 (1&2).
Sengupta T 1967 A simple adoption score for selection of farmers for high yielding varieties programmes in rice. Indian Journal of Extension Education 3:109

Shinde P S, Sasane G K and Valekar R B 1999 Adoption Behaviour of Rabi Jowar Growers. Maharashtra Journal of Extension, 18.
Shinde P S, Vaidya V R and Satpute S K 2000 Identification and adoption of indigenous agricultural practices by dryland farmers. Maharashtra Journal of Extension Education 19:259-263.
Singh D R R 2000. Study of adoption of new technologies for furthering biodiversity conservation commerce and trade of medicinal and aromatic plants of India. 131 (3) : 308-315.
Singh M P, Chauhan K N K and Amtul Warris Correlates of Knowledge, Attitude and Risk Preference of Farmers towards Dry Farming Technologies Maharastra Journal of Extension Education XVIII : 145-149:1999.
Singh R K, Sureja A K and Dheeraj Singh 2006 Cultural and Agricultural dynamic of agro-biodivesity conservation, 51 : 151-157.
Sivanandan S 2002 A study on listening behaviour of the farmers towards selected farm broadcasts in Theni district of Tamil Nadu. M.Sc.(Ag.) Thesis submitted to Acharya N.G. Ranga Agricultural University, Hyderabad.
Sivasubramanian 2003 Impact of coconut development schemes among coconut farmers. M.Sc.(Ag.) Thesis submitted to Acharya N.G. Ranga Agricultural University, Hyderabad.
Sridhar K 2001 Opinion of rose cultivators towards privatization of extension services in Ranga Reddy district of Andhra Pradesh. M.Sc.(Ag.) Thesis submitted to Acharya N.G. Ranga Agricultural University, Hyderabad.
Srinivasan G 1996 Group approach to empowerment of rural women - IFAD experience in Tamil Nadu State, working paper - 5 bankers institute of rural development, Lucknow, December, 1996.
Srinu A V 1997 Attitude of farmers towards short term loans financed by Primary Agricultural Co-operative Societies (PACS) in Vizianagaram district of Andhra Pradesh. M.Sc.(Ag.). Thesis submitted to Acharya N.G. Ranga Agricultural University, Hyderabad.
Subrahmanyam I 2002 A study on the impact of agricultural market yard committee level training programmes in Nellore district of Andhra Pradesh. M.Sc.(Ag.) Thesis submitted to Acharya N.G. Ranga Agricultural University, Hyderabad.
Sumana A 1996 Participation of farm women in watershed development project in Prakasam district of Andhra Pradesh. M.Sc.(Ag.) Thesis submitted to Acharya N.G. Ranga Agricultural University, Hyderabad.

Sundar A and Raju S K 2005 Production and marketing constraints in Tamil Nadu, Agril.marketing 48(2) : 12-14.
Sunil Arya, Singh G P and Poonam Sharma 2003 Knowledge of Farmers Regarding Improved Sugarcane Production Technology. Indian Journal of Extension Education 39(1&2).
Supe S V 1969 Factors to different degrees of rationality in decision making among farmrs .Ph.D Thesis submitted to IARI,New Delhi
Thaygarajan S and Vasanthakumar J 2000 Characteristics of Rice Framers and Adoption Pattern of Recommended Rice Technologies. Indian Journal of Extension Education Vol No.XXXIV1&2
Thurstone L L 1946 Comment, American Journal of Sociology ,52:39
Vasantha R 2002 Critical analysis of Integrated Pest Management practices [IPM] in relation to innovation- decision process among cotton growing farmers of Guntur district of Andhra Pradesh, . Ph.D Thesis submitted to Acharya N.G. Ranga Agricultural University, Hyderabad.
Veeraiah A, Daivadeenam P and Pandey R N 1998 Knowledge and Adoption level of farmers trained in KVK about groundnut cultivation. Indian Journal of Extension Education 33(1&2):58-63.
Veerendranath G 2000 A critical study on flow, utilization and source credibility of agricultural information among rainfed castor growing farmers of Nalgonda district of Andhra Pradesh. Ph.D Thesis submitted to Acharya N.G. Ranga Agricultural University, Hyderabad.
Venkatesh G Prasad and Siddaramaiah B S 2000 Correlates of Plant Protection Measures. Indian Journal of Extension Education 36 (3&4).
Venkataramaiah P 1983 revised 1990 Development of a socio-economic status scale for farm families . Ph.D Thesis, University of Agricultural Sciences Bangalore
Vijayalan R 2001 A study on awareness ,knowledge and adoption of ecofriendly agricultural practices in rice .M.Sc thesis submitted to Tamil Nadu Agricultural University, Coimbatore.
Vijaya Chandrika K 1998 A study on dissemination of agricultural technology by farm women under Andhra Pradesh Training of Women in Agriculture (ANTWA) Project in Nalgonda district of Andhra Pradesh M.Sc.(Ag.) Thesis submitted to Acharya N.G. Ranga Agricultural University, Hyderabad.
Vijayalakshmi P 1995 Role of farm women in turmeric cultivation of Guntur district in Andhra Pradesh , M.Sc.(Ag.) Thesis submitted to Acharya N.G. Ranga Agricultural University, Hyderabad

Vipin Kumar V P 1994 Inter personal communication behaviour of member of group farming committees in the adoption of rice production technology. M.Sc.(Ag.) Thesis submitted to (Kerala Agricultural University). Tiruchoor.
Waman G K, Girase K A and Wagh B R 2006 Knowledge and adoption of integrated pest management practices by irrigated cotton growers. International Journal of Agricultural Sciences 2:1,1,100-103 5 ref.
Wasnik S M 2003 Impact of Technology Transfer on Sugarcane Productivity in Sugar Factory Command Area, U.P. Indian Journal of Extension Education, 39(3&4) : 2003

Appendix II
Development of Scale on attitude of farmers towards FFS
The following are the statements intended to test the attitude of farmers on Farmers Field School [FFS] .Against each statements there are five categories i.e. Strongly agree, Agree, Undecided, Disagree and Strongly disagree. You are requested to give extent of agreement on each statement [by putting tick mark] for inclusion in the final Attitude scale. Based on your responses the scale is constructed in order to select the statements for inclusion in the final Attitude scale.
S.No Statement Strongly agree Agree Undecided Disagree Strongly
Disagree
1 FFS is an innovative school of learning for farmers at field level.
2 Farmers learn latest technology in FFS.
3 Farmers need basic education to participate in FFS
4 Learning skills is not possible through FFS
5 FFS is not suitable for illiterate farmers due to more technicality
6 FFS makes farmer an expert 7 FFS can alone teach /train
research based knowledge / skills to farmers to get higher yields
8 FFS also spread the knowledge to others
9 FFS makes decision making ability of farmers on adoption
10 FFS changes attitude of farmers towards adoption of latest technology
11 FFS enhances the managerial ability of farmers in use of inputs
12 FFS increases the self-confidence to take rational decisions

S.No Statement Strongly agree Agree Undecided Disagree Strongly
Disagree
13 FFS farmers meant for safeguarding the natural resources
14 FFS is to reduce the use of chemical inputs in crop production
15 FFS is the platform of teaching of complex skills to farmers
16 FFS encourages group cohesion among the farmers
17 FFS improves the rate of adoption of latest technology
18 FFS farmers can evaluate new technology before adoption
19 FFS facilitates in increasing the crop yields
20 FFS promotes the low cost technology
21 Farmers feel difficulty to learn skill oriented knowledge through FFS
22 FFS facilitate information access by farmers to different sources
23 I have learnt record keeping of the expenditure and management practices
24 FFS improves the collective decision making process of farmers
25 FFS discourage farmers for large scale adoption of new technology
26 Impart knowledge about how to reduce the cost of production
27 FFS facilitates to overcome adverse climatic conditions
28 Standard recommendations are not available to farmers through FFS

S.No Statement Strongly agree Agree Undecided Disagree Strongly
Disagree
29 Farmers are not interested in FFS
30 Adoption of all recommended practices by FFS is not possible.
31 All pests/disease can not be controlled with knowledge /skill provided by FFS
32 FFS provides information not based on farmers needs and expectations.
33 Facilitator is not capable of providing necessary knowledge and skill
34 FFS enhances overall efficiency of farmers
35 FFS enable farmers to upgrade their knowledge from time to time
36 FFS provide solutions to all agriculture problems
37 FFS are participatory in nature 38 FFS establishes close rapport
with other farmers
39 FFS helped members to be good leaders
40 Training is must for FFS farmers to encourage social participation.
41 Participation in FFS is not worth sparing valuable time of mine.
42 Group conflict influence the user of knowledge /skill given by FFS
43 RMG/SHG can also be utilize for FFS
44 Publicity is needed to popularize

S.No Statement Strongly agree Agree Undecided Disagree Strongly
Disagree
45 Field days encourage membership by other farmers
46 FFS promote group cohesion in the village
47 Member farmers are crucial for success or failure of FFS
48 FFS encourage farmers to take up income generation activities also
49 FFS makes the group of farmers self sufficient
50 FFS encourage spread of information to non FFS farmers
51 Spread of information is mostly restricted to products only
52 Gender balance is not maintained in enrolling the farmers to FFS
53 Women participation is prerequisite in FFS
54 FFS is likely to increase disputes among farmers
55 FFS also improves the leadership qualities among farmers
56 Good facilitator is must for success of FFS.
57 FFS farmers must select the facilitator
58 FFA can also be used for creating awareness on nonagricultural activities like HIV/AIDS environmental issues
59 FFS encourages team building among public private organizations
60 Enhances social recognition to

S.No Statement Strongly agree Agree Undecided Disagree Strongly
Disagree
FFS farmers
61 Feed back mechanism is not available in FFS
62 FFS will increase the income due to higher adoption
63 FFS is boon for farmers in generating income to improve their standard of living
64 FFS is one method of reducing the cost of cultivation
65 FFS can be popularized for commercial purpose
66 FFS cam get economic returns even during the drought season
67 Bankers are ready to provide loans to FFS farmers
68 Farmers are free from money lender clutches due to awareness on bank loan provided to FFS
69 Banks increased no.of loans to FFS farmer due to assured returns
70 Repayment of loans also high in FFS farmers
71 FFS farmers consults their spouses with regard to financial matters
72 FFS farmers have significant improvement in standard of living
73 Sometimes yield is reduced by following FFS recommendations.
74 Reduced cost of cultivation allows for recovery from debt
75 FFS allows farmers for the building of physical assets
76 FFS encourage locally

S.No Statement Strongly agree Agree Undecided Disagree Strongly
Disagree
identified ITKs
77 FFS promote eco-friendly technologies
78 FFS has no relevancy to field situation
79 FFS caters to the seasonal needs of farmers
80 Sustainability in terms of production is motto of FFS
81 FFS prepares farmers to cope up with climatic risks
82 FFS minimize the use of hazardous chemicals
83 FFS can be practiced during drought conditions.
84 FFS cannot improve the soil fertility and microbial activity
85 FFS is not suitable for dry land crops
Attitude statements with t-values
S.No Statement
*1 FFS is an innovative school of learning for farmers at field level. 3.175
*2 Farmers learn latest technology in FFS. 2.756
3 Farmers need basic education to participate in FFS 1.414
4 Learning skills is not possible through FFS 1.325
*5 FFS is not suitable for illiterate farmers due to more technicality 1.955
6 FFS makes farmer an expert 1.461
7 FFS can alone teach /train research based knowledge /skills to farmers to get higher yields
1.699
*8 FFS also spread the knowledge to others 1.809
9 FFS makes decision making ability of farmers on adoption 1.495
*10 FFS changes attitude of farmers towards adoption of latest technology 1.95
11 FFS enhances the managerial ability of farmers in use of inputs 1.256
*12 FFS increases the self-confidence to take rational decisions 2.648
13 FFS farmers meant for safeguarding the natural resources 1.3
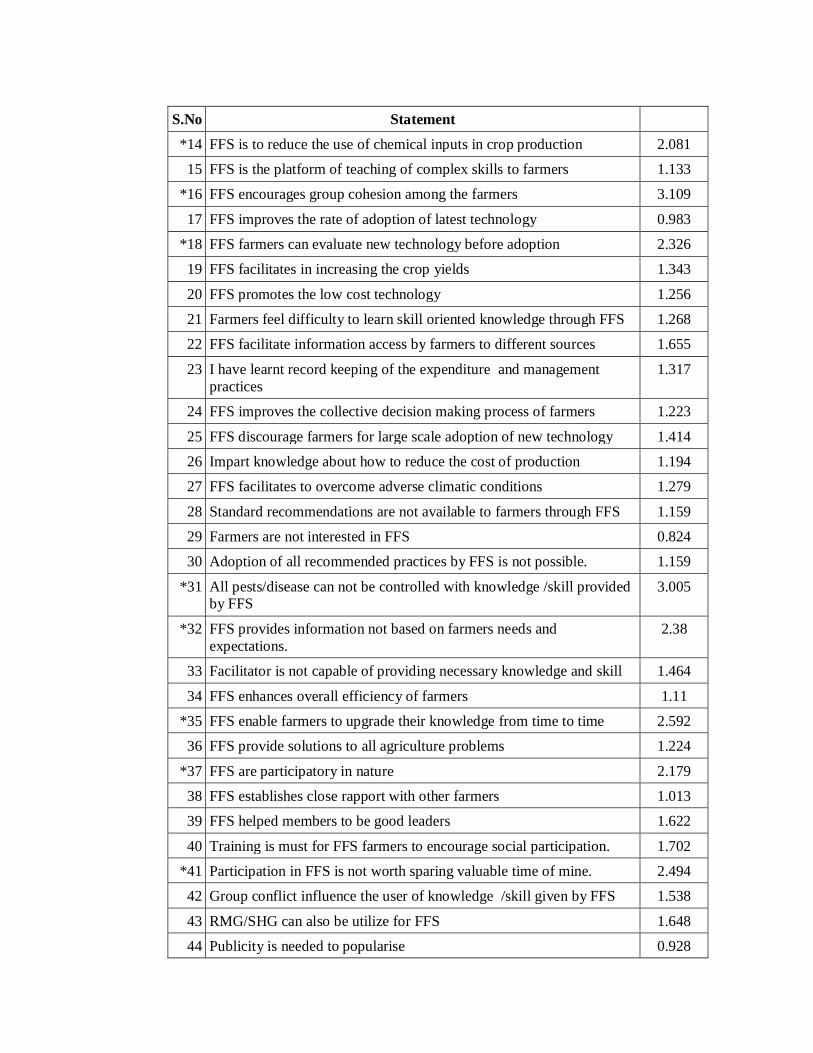
S.No Statement
*14 FFS is to reduce the use of chemical inputs in crop production 2.081
15 FFS is the platform of teaching of complex skills to farmers 1.133
*16 FFS encourages group cohesion among the farmers 3.109
17 FFS improves the rate of adoption of latest technology 0.983
*18 FFS farmers can evaluate new technology before adoption 2.326
19 FFS facilitates in increasing the crop yields 1.343
20 FFS promotes the low cost technology 1.256
21 Farmers feel difficulty to learn skill oriented knowledge through FFS 1.268
22 FFS facilitate information access by farmers to different sources 1.655
23 I have learnt record keeping of the expenditure and management practices
1.317
24 FFS improves the collective decision making process of farmers 1.223
25 FFS discourage farmers for large scale adoption of new technology 1.414
26 Impart knowledge about how to reduce the cost of production 1.194
27 FFS facilitates to overcome adverse climatic conditions 1.279
28 Standard recommendations are not available to farmers through FFS 1.159
29 Farmers are not interested in FFS 0.824
30 Adoption of all recommended practices by FFS is not possible. 1.159
*31 All pests/disease can not be controlled with knowledge /skill provided by FFS
3.005
*32 FFS provides information not based on farmers needs and expectations.
2.38
33 Facilitator is not capable of providing necessary knowledge and skill 1.464
34 FFS enhances overall efficiency of farmers 1.11
*35 FFS enable farmers to upgrade their knowledge from time to time 2.592
36 FFS provide solutions to all agriculture problems 1.224
*37 FFS are participatory in nature 2.179
38 FFS establishes close rapport with other farmers 1.013
39 FFS helped members to be good leaders 1.622
40 Training is must for FFS farmers to encourage social participation. 1.702
*41 Participation in FFS is not worth sparing valuable time of mine. 2.494
42 Group conflict influence the user of knowledge /skill given by FFS 1.538
43 RMG/SHG can also be utilize for FFS 1.648
44 Publicity is needed to popularise 0.928

S.No Statement
*45 Field days encourage membership by other farmers 3.161
46 FFS promote group cohesion in the village 0.966
*47 Member farmers are crucial for success or failure of FFS 2.816
48 FFS encourage farmers to take up income generation activities also 1.229
49 FFS makes the group of farmers self sufficient 0.951
50 FFS encourage spread of information to non FFS farmers 1.655
51 Spread of information is mostly restricted to products only 0.966
*52 Gender balance is not maintained in enrolling the farmers to FFS 2.941
53 Women participation is prerequisite in FFS 1.013
54 FFS is likely to increase disputes among farmers 1.362
55 FFS also improves the leadership qualities among farmers 1.417
*56 Good facilitator is must for success of FFS. 2.967
57 FFS farmers must select the facilitator 1.101
58 FFA can also be used for creating awareness on nonagricultural activities like HIV/AIDS environmental issues
1.688
59 FFS encourages team building among public private organizations 1.213
60 Enhances social recognition to FFS farmers 1.166
*61 Feed back mechanism is not available in FFS 3.499
62 FFS will increase the income due to higher adoption 1.132
63 FFS is boon for farmers in generating income to improve their standard of living
1.296
64 FFS is one method of reducing the cost of cultivation 1.587
65 FFS can be popularized for commercial purpose 1.337
66 FFS cam get economic returns even during the drought season 1.223
67 Bankers are ready to provide loans to FFS farmers 1.411
68 Farmers are free from money lender clutches due to awareness on bank loan provided to FFS
1.445
69 Banks increased no. of loans to FFS farmer due to assured returns 1.644
70 Repayment of loans also high in FFS farmers 1.384
71 FFS farmers consults their spouses with regard to financial matters 1.427
72 FFS farmers have significant improvement in standard of living 1.575
*73 Sometimes yield is reduced by following FFS recommendations. 4.85
74 Reduced cost of cultivation allows for recovery from debt 0.652
75 FFS allows farmers for the building of physical assets 1.06

S.No Statement
76 FFS encourage locally identified ITKs 1.195
*77 FFS promote eco-friendly technologies 4.684
*78 FFS has no relevancy to field situation 2.987
79 FFS caters to the seasonal needs of farmers 1.245
*80 Sustainability in terms of production is motto of FFS 3.381
81 FFS prepares farmers to cope up with climatic risks 1.195
82 FFS minimize the use of hazardous chemicals 1.147
*83 FFS can be practiced during drought conditions. 4.559
*84 FFS can not improve the soil fertility and microbial activity 4.157
85 FFS is not suitable for dry land crops 1.239
Scale to measure the attitude of Farmers towards FFS
S.No Statements SA A UD DA SDA 1 FFS is an innovative school of learning for farmers
at field level.
2 Farmers learn latest technology in FFS.
*3 FFS is not suitable for illiterate farmers due to more technicality
4 FFS also spread the knowledge to others
5 FFS changes the attitude of farmers towards adoption of latest technology.
6 FFS increases the self confidence to take rational decisions
7 FFS is to reduce the use of chemical inputs in crop production
8 FFS encourages group cohesion among the farmers
9 FFS farmers can evaluate new technology before adoption
*10 All pests/disease can not be controlled with knowledge /skill provided by FFS
*11 FFS provides information not based on farmers needs and expectations.
12 FFS enable farmers to upgrade their knowledge
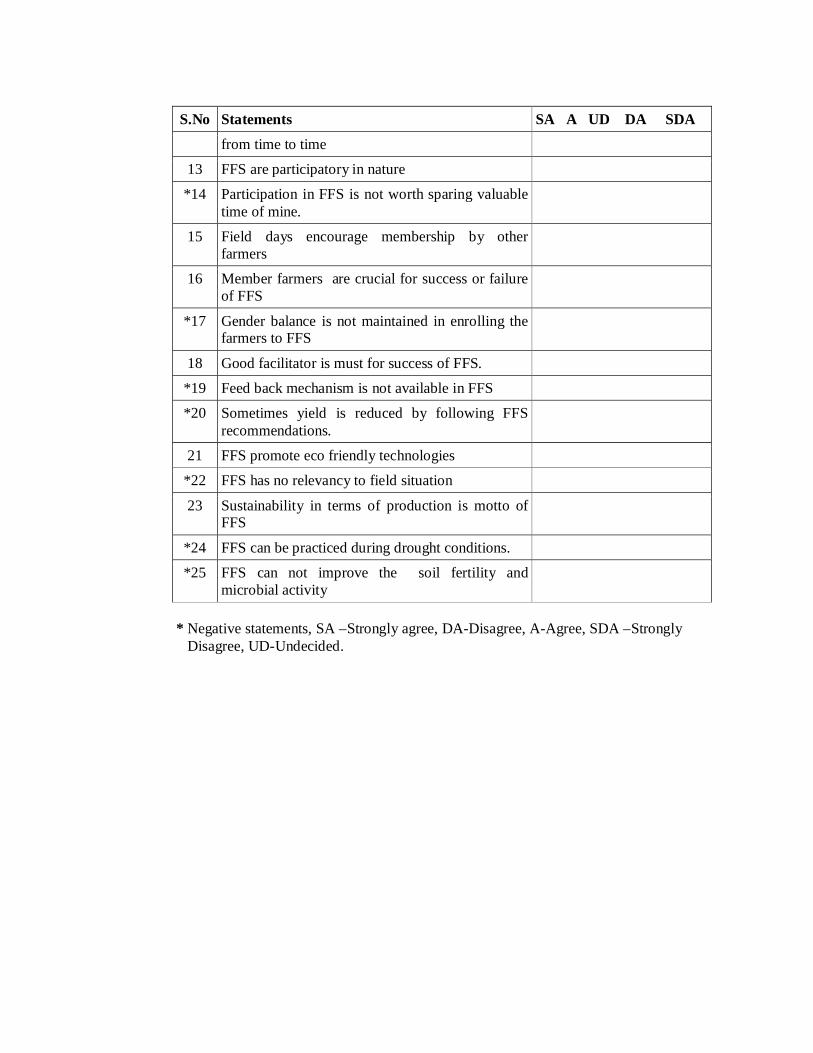
S.No Statements SA A UD DA SDA from time to time
13 FFS are participatory in nature
*14 Participation in FFS is not worth sparing valuable time of mine.
15 Field days encourage membership by other farmers
16 Member farmers are crucial for success or failure of FFS
*17 Gender balance is not maintained in enrolling the farmers to FFS
18 Good facilitator is must for success of FFS.
*19 Feed back mechanism is not available in FFS
*20 Sometimes yield is reduced by following FFS recommendations.
21 FFS promote eco friendly technologies
*22 FFS has no relevancy to field situation
23 Sustainability in terms of production is motto of FFS
*24 FFS can be practiced during drought conditions.
*25 FFS can not improve the soil fertility and microbial activity
* Negative statements, SA –Strongly agree, DA-Disagree, A-Agree, SDA –Strongly
Disagree, UD-Undecided.

Appendix I Interview Schedule
Acharya N.G.Ranga Agricultural University
Extension Education Institute Rajendranagar, Hyderabad-30
Title of the Research Problem: Empowerment of Cotton farmers through Farmer Field School in Andhra Pradesh. General Information: Respondent number: Name of the respondent: Village: Mandal: District:
Part: A Please indicate the answer by using [ ] for the statement with which you agree: Personal characters 1.Age: [In completed years] 2. Education :
a. Illiterate [1] b. Primary school [2] c. High school [3] d. Intermediate [4] e. Graduate [5] f. Post Graduate [6]
3. Experience [Completed years] Farming : Polambadi: Socio-Economic Variables
4. Farm size: Small [ Up to 2.5 acres] Medium [2.5 to 5.0 acres] Large [Above 5 acres]

5. Mass media exposure Please state the mass media utilized by you for getting farm information and the frequency of use.
S. No Source
Frequency of contact
Daily Weekly Fort nightly
Once in month Rarely Never
1 Radio
2 T.V
3 News paper
4 Agril.Magazines
5 C.D.s/ DVD on Agriculture and allied sectors
6 Internet
7 Any others 6. Extension Contact Please indicate contacts with the following personnel.
S.No Official /personal contact
Frequency of contact
Weekly Fortnightly Once
in month
Rarely Never
1 A.E.O 2 A.O/HO/VAS 3 ANGRAU scientists 4 N.G.Os 5 Polambadi members/
Master trainers
6 Adarsha rythu 7 Input dealers 8 Any others

7. Group orientation
Please your opinion on the following aspects
S.No Components of FFS group True Some what true Not true
1 Working in groups will not be useful for self development
2 Individual farmer has no identity in FFS
3 Facilitator plays major role in group, ignoring others
4 Willing to take responsibility but could not get chance due to many members in FFS
5 Ready to adopt all FFS practices but could not involved due to risk factor /financial problem
6 When working in groups one should try to excel than others in similar tasks
7 As individual one must work for achieving group goal
8 I am satisfied with FFS group approach. 8. Market intelligence
S.No Statements Response categories
Agree Undecided Disagree 1 Farmer need not watch sale prices of
Cotton in different Markets before selling the produce
2 The most successful farmer is one who makes best use of market intelligence.
3 It is difficult for every farmer to watch daily market prices on the net
4 A farmer should grow commercial crops which have more market demand
5 Though it takes time for farmer to acquaint with market intelligence but worthy
6 Farmer should use ware house facility for better market price
7 Farmer should be aware of FAQs of cotton crop for better returns
8 Standard system of quoting prices is essential.

Psychological Variables
9. Risk orientation
S.No Statements SA A UD DA SDA 1 A farmer should practice integrated
farming to overcome risks of mono cropping
2 It is good to take risks when he knows his chance of success is fairly high
3 It is better for not to try new methods unless most of the farmers have used them with success
4 Trying entirely new technology in FFS involves risk but it is worth
5 A farmer who is willing to take greater risks then the average, success is fairly high.
10. Innovativeness Please state your degree of Agreement or Disagreement with each statements pertaining to innovativeness:
S.No Statements Response categories
Agree Undecided Disagree 1 I try to keep myself up to date with
information on new farm practices but that does not mean. I tryout all new methods on my farm
2 I feel restless till I try a new farm practice that I have heard about
3 They talk of many ICM practices these days but who knows if they are better than the old ones
4 From time to time I have heard of several new farm practices and I have tried out most of them in the last few years
5 I usually wait to see that the results my neighbors obtain before I try out the new farm practice
6 Somehow, I believe that [ITKs] the traditional ways of farming are the best
7 I am cautious about trying new practices 8 After all our fore fathers were wise in their

S.No Statements Response categories
Agree Undecided Disagree farming practices and I don’t see any reason for changing these old methods
9 Often new practices are not successful, however if they are promising I would surely like to adopt them
11. Management orientation A set of statements representing planning, production , marketing orientation of farmer is given below. Please state the degree of your Agreement [A] or Undecided [UD] or Disagreement [DA] with each statement. A. Planning orientation
S.No Statements Response categories Agree Undecided Disagree
1 Every year one should think about Cotton hybrid to be cultivated in each type of land
2 It is not necessary to make prior decision about the variety/Hybrid to be cultivated
3 The amount of inputs such as resistant hybrids, chemical fertilizers, pesticides, NPV, pheromone traps, tricho-cards, neem oil etc needed for management of Cotton pests should be assessed before cultivation
4 It is not necessary to think ahead of the cost involved in raising the Cotton crop.
5 One need not consult technical experts for recommendations about cotton cultivation
6 One should prepare an advance plan for labour requirement
7 It is possible to increase returns through production plans.
B. Marketing orientation
S.No Statements Response categories
Agree Undecided Disagree 1 Market news is not so useful to farmers
2 A farmer can get good price by grading his produce

S.No Statements Response categories
Agree Undecided Disagree 3 Warehouses can help the farmer to get
better price for his produce
4 One should sell his produce to the nearest market irrespective of price
5 One should purchase inputs from nearest shop where his friends and other relatives purchase
6 One should grow cotton with good fibre quality which has more market demand
7 MSP announcement prior to beginning of season will is essential.
C. Production orientation
S.No Statements Response categories
Agree Undecided Disagree 1 Timely sowing ensures good yields
2 One should use as much fertilizers as he like
3 Determining the fertilizer dose by soil test testing saves money
4 Inter cropping should be adopted as recommended by scientists
5 One should use Bio pesticides for timely plant protection
6 One should adopt ICM practices for better yields.
7 For timely weed control one should use suitable herbicides
8 Post harvest technology is must for high profits
9 With use of less quantity of quality inputs high production is possible
10 With less expenditure one can produce sustainable yields in cotton by following ICM practices

Attitude of Farmers towards FFS
S.No Statements SA A UD DA SDA 1 FFS is an innovative school of learning for farmers
at field level.
2 Farmers learn latest technology in FFS. *3 FFS is not suitable for illiterate farmers due to
more technicality
4 FFS also spread the knowledge to others 5 FFS changes the attitude of farmers towards
adoption of latest technology.
6 FFS increases the self confidence to take rational decisions
7 FFS is to reduce the use of chemical inputs in crop production
8 FFS encourages group cohesion among the farmers
9 FFS farmers can evaluate new technology before adoption
*10 All pests/disease can not be controlled with knowledge /skill provided by FFS
*11 FFS provides information not based on farmers needs and expectations.
12 FFS enable farmers to upgrade their knowledge from time to time
13 FFS are participatory in nature *14 Participation in FFS is not worth sparing valuable
time of mine.
15 Field days encourage membership by other farmers
16 Member farmers are crucial for success or failure of FFS
*17 Gender balance is not maintained in enrolling the farmers to FFS
18 Good facilitator is must for success of FFS. *19 Feed back mechanism is not available in FFS *20 Sometimes yield is reduced by following FFS
recommendations.
21 FFS promote eco friendly technologies *22 FFS has no relevancy to field situation 23 Sustainability in terms of production is motto of
FFS

S.No Statements SA A UD DA SDA *24 FFS can be practiced during drought conditions. *25 FFS can not improve the soil fertility and
microbial activity
* Negative statements, SA –Strongly agree, DA-Disagree, A-Agree, SDA –Strongly Disagree, UD-Undecided.
Knowledge A set of statements representing Knowledge on Cotton ICM are given below, kindly indicate your agreement or disagreement with each statement a] Select correct answers from the given options 1. Cotton+ Greengram intercropping ratio is
a]. 1: 3 b] 1: 6 c] 2:6 d] 1: 8
2. Neem oil is a] Insecticide b]Repellent c] Anti feedent d] All
3.. Reddening of leaves from boarder is symptom of a] Zn deficiency b] Mg Deficiency c] Jassids d] Boran deficiency
4. Insecticide used for Stem application a] Endosulfan b] Chlorpyriphos c] Monocrotophos d] all the chemicals 5. Cotton should only be grown on ----------------soils for better yields. a] Black soils b] Red light soils c] Sandy soils d]Any soil 6. Pest and defender ratio in FFS is a] 4:1 b] 1:2 c] 3:1 d] 5:1 7. NPV Virus solution is sprayed against a] Heliothis b] Pink boll worm c] Stem borer c] None 8. Bt formulation should be sprayed during a] Morning b] Noon time c] Evening d] Any time 9. Stem application is done up to ----days a] 90 b] 30 c] 60 d] any time 10. Latest concept of FFS is a] ICM b] IPM c] INM d] None

B] Fill in the blanks 11. Refugee Bt is sown in ---- rows around Bt Cotton. 12. Trap crop for Spodoptera is --------------------------- 13. Potassium fertilizer is applied for better ----------- quality. 14. Dose of Zinc sulphate per acre is-------------- 15. Boll cracking is due to deficiency of ------------------. 16. Sticky traps are used against ------------------- 17. No. of Bird perches per acre of cotton--------------- C] True or False
18. Deep summer ploughing and destruction of crop residue help to reduce pest/
diseases. T/F 19. Selection of suitable hybrid will give good yields. T/F 20. Indiscriminate spray of insecticides is prime reason for increase in cost of
ultivation T/F 21. Timely sowing helps in overcoming pest problem T/F 22. Sowing of Cotton in light soils is risk taking T/F 23. Better drainage is required for Cotton cultivation T/F
24. Crop rotation helps in maintaining soil fertility T/F
25. Stem application conserves natural predators T/F
d. Please indicate Yes or No
26. Do you know the inter crops of cotton Yes/No If Yes please mention a few
27. Do you know the seed treatment chemical for wilt disease Yes/No If Yes name one chemical
28. Do you know about pheromone trap action Yes/No If Yes what is the use
29. Do you know the boarder crops grown in Cotton Yes/No If Yes mention few
30. Do you know about soil testing Yes/No If Yes mention the weight of Soil sample to be sent to STL

Skills Please put tick mark [/] against each item to indicate the skills learnt by you
during Cotton FFS.
S.No Skill Skilled Partially Skilled unskilled
1 Collection of soil samples
2 Seed treatment
3 Stem application with Pesticide
4 Poison bait preparation
5 Seed germination test
6 Cage study
7 Water holding capacity of different soils
8 Cotton Eco System Analysis : Identification of a. Crop condition [Age of the crop,
No.of Bolls etc] b. Field condition [ Moisture condition] c. Pests d. Natural enemies of Pests
[Spiders , Parasites, Wasps ] e. Weeds
9 Tricho cards preparation
10 Identification of deficiency of micro nutrients
11 Identification infestation of sucking pests.
12 Preparation of NPV
13 Identification of dead larvae due to Bt spray.
14 Preparation of NSKE
15 Preparation of spray fluid
16 Preparation of Green chilli and Garlic extract
17 Pit fall trap method
18 Group dynamics Nine dot game [Broad thinking] Longest line [Resource utilization]

Extent of adoption
S.No Management Practice Fully adopted
Not adopted
Reasons for non
adoption 1 Experiments adopted
Short term a. Soil test b. Seed treatment
c. Seed germination test d. Sowing time e. Pit fall trap method f. Establishment of delta sticky for
white fly g. Cage study [Defender
exclusion] h. Effect of pesticide spray on
defenders Long term experiments
i. No. of plants / hole j. New Hybrids k. Defoliation trial l. De topping m. Removal of fruiting bodies
2 Adoption of principles of IPM package a. Use of Pheromeone traps b. Installation of yellow sticky traps c. Installation of bird perches d. Release of Verticillium lachani e. Seed treatment with Trichoderma
viridae f. Use of NSKE g. Use of NPV h. De topping of plants i. Collection and destruction of larvae j. Crop residue destruction k. Destroying fallen squares to reduce
pink boll worm incidence l. Use of bio pesticides [Bt]
Building towers [Team work]
19 Communication skills
20 Facilitation skills

S.No Management Practice Fully adopted
Not adopted
Reasons for non
adoption m. Trap cropping
3 General management practices a. Method of cultivation [Mono/Inter
cropping] b. Deep summer ploughing c. Recommended seed rate d. Optimum plant density e. Time of sowing f. Type of soil g. Adoption of soil test based fertilizer
application h. Soil testing i. Kind of fertilizers applied
4 Farmer expert a. Agro ecosystem analysis b. Daily monitoring c. Pest/disease identification d. Participation in meetings e. Analysis of crop condition f. Participation in group discussion g. PTD h. Peer group communication i. Participation in field day j. Active role in field day k. Risk management l. Developing linkages with extension
functionaries m. Sharing experiences with others n. Documentation of experiences
4. Agro ecosystem management : Adopted/ not adopted a] Pest and defender management: 1. Spray of botanical pesticides will develop natural predators 2. Growing Greengram as inter crop in Cotton for developing predators population. 3. Adoption of IPM package for better micro climate 4. Adoption of soil test based fertilizer application for decrease of pest incidence.

6. Use of NPV and Bt solution when used against pests will result in building natural predators population 7. Sowing of Border crops like Maize /Bajra/Jowar for reducing sucking pest incidence. 8. Trap crop for diverting pest from main crop b] Input management Adopted/ not adopted 1. Use of organic manures like FYM / Vermicompost improves overall fertility of soil. 2. Application of soil test based NPK fertilizers to reduce pest and diseases. 3. Use of PSB bio fertilizer for solubulising insoluble P fertilizers in the soil. 4. Use of bio control agents like Tricho cards, NPV, .Bt. will reduce pest incidence 5. Use of botanicals like NSKE will helps in developing predators population. 6. Intercropping with Greengram will improve soil fertility 7. Use of quality seed will result in better yields c] Use of ITKs [Documentation] List out different ITKs / Traditional practices you follow in cotton cultivation. 1 2 3 d] Bio diversity conservation: Adopted/ not adopted 1. Use of ICM technology under FFS has resulted in biodiversity conservation like Spiders, Coccinellid beetle [Akshinatala purugu], Dragon flies. 2.Decompostion of applied FYM in the soil leads to increased microbial activity 3. Water holding capacity of soil will increase due to increase of microbial activity. 4. Parasites and predators conservation will result in Bio diversity conservation 5. Insect Zoo/ Cage study will help in identification of of Predators/ Parasites to enable Bio diversity conservation. . 6. Conservation of native plant species 7. Diversification of crop varieties will help in Bio diversity conservation.

8. Reduction of inorganic fertilizers usage will result in improved soil microbial activity. 9. Conservation of bird species 10. Conservation of animals 11. Use of micro irrigation system will lead to conservation of irrigation water and improves micro climate. 5] Decision making ability
S.No Area of decision Self decision /
Individual decision
Decision making along with Spouse /
family members
Group decision
1 Collection of Soil sample
2 Time of sowing 3 Maintain optimum plant
density
4 Use of fertlisers Type /quantity
5 Use of Bio pesticides 6 Time of application of
fertilizers
7 Adoption of IPM 8 Sowing of inter crop like
Greengram
9 Source of credit 10 Sale of produce 11 Adoption of Short term
experiments
12 Long term experiments 13 Maintenance of farm records 14 Purchase of inputs 15 Selection of crops

16 Selection of variety /hybrid 17 Irrigation schedule 18 Investment on crop production 19 Sowing of boarder crop 20 Use ITKs

ACHARYA N.G.RANGA AGRICULTURAL UNIVERSITY
Extension Education Institute Rajendranagar: Hyderabad
Dr.R.Ratnakar Professor Extension Education Institute Dear Sir /Madam I am glad to inform that Sri.M.Sreenivasulu Inservice ,Ph.D.student of this institute has undertaken a research study en titled “ Empowerment of farmers through FFS in Andhra Pradesh “ under my guidance. In this connection he is attempting to develop the following:
1. A test on Knowledge gained by Cotton FFS farmers 2. Index for Skill gained by Cotton FFS farmers 3. Index for Agro-Ecosystem management
Keeping in view of the your vast experience and expertise you have been selected as one of the experts to judge aforesaid items. You are requested to kindly go through the judgments sheets enclosed and give your valuable assessment with regard to their Knowledge, Skill and Agro-ecosystem management for inclusion in the final scale. You are free to add or delete any items listed in the judgment sheets. Sri.M.Sreenivasulu Scientist [TOT] DAATTC Mahabubnagar will personally collect the judgment sheets from you. I request your kind cooperation in this regard. Yours sincerely Encl: 1. Judgment sheets on Knowledge 2. Judgment sheets on Skill 3. Judgment sheets on Agro-Eco system management

Appendix III
Knowledge of farmers on Cotton ICM Technologies
The following are the statements intended to test the knowledge gained by the Cotton growing farmers of Farmers Field School [FFS] .Against each statements there are three response categories i.e Most relevant ,Relevant and Not relevant. You are requested to give extent of agreement on each statement [by putting tick mark] for inclusion in the final Knowledge test. Based on your responses the knowledge score will be calculated in order to select the statements for inclusion in the final knowledge test.
S.No Statement Most relevant Relevant Not
relevant 1. Deep summer ploughing and destruction of crop
residue help to reduce pest / diseases
2 Selection of suitable variety/Hybrid will give good yields
3 Timely sowing helps in overcoming pest problem
4 Seed treatment reduce soil borne diseases
5 Crop rotation helps in maintaining soil fertility
6 Intercropping of Cotton with pulses is beneficial
7 Soil test based fertilizers application reduce yield
8 Trichodermaviridae soil application best for wilt disease
9 Stem application reduces sucking pest problem
10 Soil test helps in correction of nutritional deficiencies
11 Stem application conserve natural predators and avoid environment pollution
12 Redening of leaves from boarder is symptom of Jassids
13 Cotton can only be grown in Black soils under irrigated soils
14 Neem oil spray acts as antifeedent
15 Bt solution can be sprayed at evening hours only
16 Pest defender ratio for IPM is 2:1
17 Zinc sulphate application is must for cotton
18 Adequate drainage is required for cotton
19 NPV solution is common for all type of pests
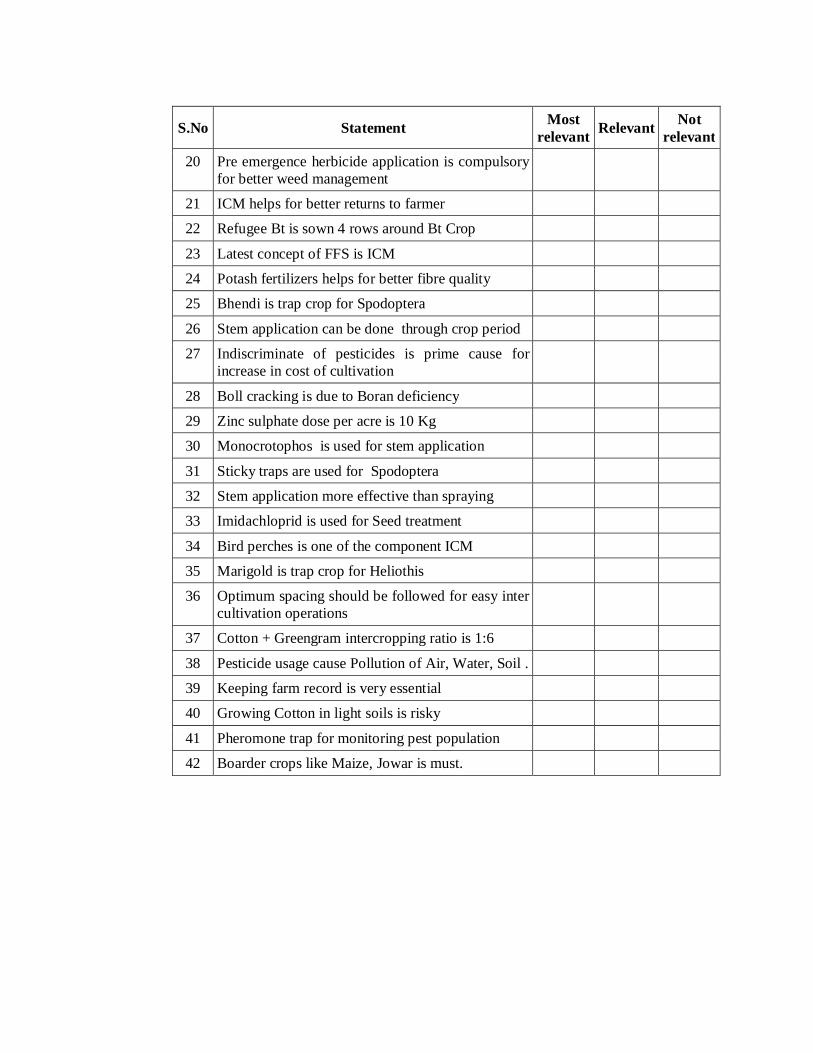
S.No Statement Most relevant Relevant Not
relevant 20 Pre emergence herbicide application is compulsory
for better weed management
21 ICM helps for better returns to farmer
22 Refugee Bt is sown 4 rows around Bt Crop
23 Latest concept of FFS is ICM
24 Potash fertilizers helps for better fibre quality
25 Bhendi is trap crop for Spodoptera
26 Stem application can be done through crop period
27 Indiscriminate of pesticides is prime cause for increase in cost of cultivation
28 Boll cracking is due to Boran deficiency
29 Zinc sulphate dose per acre is 10 Kg
30 Monocrotophos is used for stem application
31 Sticky traps are used for Spodoptera
32 Stem application more effective than spraying
33 Imidachloprid is used for Seed treatment
34 Bird perches is one of the component ICM
35 Marigold is trap crop for Heliothis
36 Optimum spacing should be followed for easy inter cultivation operations
37 Cotton + Greengram intercropping ratio is 1:6
38 Pesticide usage cause Pollution of Air, Water, Soil .
39 Keeping farm record is very essential
40 Growing Cotton in light soils is risky
41 Pheromone trap for monitoring pest population
42 Boarder crops like Maize, Jowar is must.

DIFFICULTY INDEX, DISCRIMINATIN INDEX AND POINT BISERIAL CORRELATION FOR KNOWLEDGE TEST ITEMS
Item No.
Frequencies of correct answers
Difficulty Index (P)
Discrimi- nation Index (E1/3)
Point biserial
correlation (rpbis)
S! S2 S3 S4
*1 5 4 2 3 65 0.4 0.456
*2 5 4 2 1 78 0.6 0.4817
*3 5 5 3 2 72 0.5 0.5431
4 5 5 5 4 85 0.1 N.C
*5 4 5 2 2 60 0.5 0.3683
*6 5 5 2 2 64 0.6 0.3683
7 3 3 2 1 18 0.3 N.C
*8 5 5 3 2 76 0.5 0.4190
9 5 5 5 5 92 0.0 NC
*10 4 4 2 1 48 0.5 0.3617
*11 4 5 2 1 54 0.6 0.5323
*12 4 4 2 2 45 0.4 0.3348
*13 5 5 2 1 50 0.7 0.5724
*14 4 5 2 2 48 0.5 0.4083
*15 5 2 3 3 80 0.4 0.4385
*16 5 5 2 3 69 0.5 0.4556
17 2 1 2 0 18 0.1 NC
*18 5 5 3 3 75 0.4 0.4116
*19 4 5 2 1 65 0.6 0.5323
20 2 1 2 0 19 0.1 NC
21 2 1 1 0 14 0.2 NC
*22 5 5 3 2 68 0.5 0.4190

*23 5 4 4 2 80 0.3 0.425
*24 5 5 2 3 72 0.5 0.5276
*25 4 5 2 2 69 0.5 0.4083
*26 5 5 3 1 60 0.6 0.5429
*27 5 5 3 3 80 0.4 0.4385
*28 4 5 2 1 60 0.6 0.4817
*29 5 5 2 2 73 0.6 0.5076
*30 5 5 3 2 75 0.5 0.4190
*31 4 4 2 2 58 0.4 0.3617
32 5 2 4 2 88 0.1 NC
33 5 5 4 5 95 0.1 NC
*34 5 4 3 2 62 0.4 0.5025
35 5 5 5 5 92 0.0 NC
36 5 5 3 3 85 0.4 NC
*37 4 5 2 1 68 0.6 0.4817
38 4 5 5 5 90 0.0 NC
39 5 4 4 3 73 0.2 NC
*40 5 5 2 3 70 0.5 0.5276
*41 5 4 4 2 62 0.3 0.4251
*42 5 5 3 2 66 0.5 0.4190