empowering communities how investors can support an
TRANSCRIPT

EMPOWERING COMMUNITIES
How investors can support an equitable transition to net zero

The Investor Group on Climate Change (IGCC) is a collaboration of Australian and New Zealand investors focused on the impact that climate change has on the financial value of investments. IGCC represents institutional investors with total funds under management of over $2 trillion, and others in the investment community interested in the impact of climate change. IGCC members cover over 7.5 million people in Australia and New Zealand.
www.igcc.org.au and @IGCC_Update
Acknowledgements
This report was made possible with the assistance of Aware Super, Cbus, HESTA and IFM Investors.
IGCC would like to acknowledge and thank supporting investors for reviewing drafts of this report and contributing further insights to this research. In particular, thank you to Akaash Sachdeva from HESTA, Chris Newton from IFM Investors, Liza McDonald from Aware Super and Nicole Bradford from Cbus for their contribution.
We would like to acknowledge and thank members of the stakeholder reference group convened for this project for their valuable time, expertise and feedback, including Akaash Sachdeva (HESTA), Allen Hicks (Electrical Trades Union), Chantal Travers (AGL), Chris Newton (IFM Investors), Don Henry (Melbourne Institute for a Sustainable Society, The University of Melbourne), Fiona Wild and Tristan Stanley (BHP), Karen Cain (Latrobe Valley Authority), Kate Griffiths (Australian Council of Superannuation Investors), Liza McDonald (Aware Super), Michele O’Neil and Mark Wakeham (Australian Council of Trade Unions), Nicole Bradford (Cbus), Susan Jeanes (Jeanes Holland and Associates), and Tony Maher and Peter Colley (CFMEU Mining and Energy). Participation in the stakeholder reference group is not an endorsement of the content of this report and stakeholder reference group members are not responsible for any opinions or judgments it contains.
IGCC would also like to thank the team at EY for their work in supporting workshops and engagement and preparing this report. In particular, thank you to Mathew Nelson, Dr Matthew Bell, Fiona Hancock, Miguel Castillo and David Richardson.
July 2021

TABLE OF CONTENTS
Foreword by IGCC .........................................................................................1
1 Executive summary ..........................................................................2
2 Introduction .....................................................................................7
2.1 Economies in transition ............................................................ 8
2.2 Fiduciary duties through Environmental, Social and Governance (ESG) considerations .................................... 9
2.3 Investing for a just transition ................................................. 10
2.4 Clean economy through COVID-19 ........................................ 13
3 Assessing the current state of play ..............................................16
3.1 Stocktake of fossil fuels and renewables ..............................16
3.2 The finance landscape ............................................................. 22
3.3 Climate policies ........................................................................ 23
3.4 Dynamics of the global fossil fuel sector under transition scenarios ................................................................. 26
4 Communities in transition ............................................................32
4.1 Overview of communities ....................................................... 32
4.2 Specific community analysis ................................................... 35
4.3 The need for a bespoke community resilience approach ..43
5 The role of investors in a just transition .....................................48
5.1 Focus areas for investor action .............................................. 50
5.2 Investment strategy and capital allocation ........................... 53
5.3 Disclosure ................................................................................. 56
5.4 Corporate engagement ........................................................... 61
5.5 Advocacy and partnerships .................................................... 68
5.6 Impact measurement and evaluation ..................................71
5.7 Summary of recommendations by focus area ..................... 74
6 Conclusion .......................................................................................76

1
FOREWORD BY IGCCThe drive to decarbonise and the future proofing of our communities to changing climatic conditions will completely transform the global economy. The transition to net zero emissions by 2050 is happening. It presents huge opportunities to create new jobs and boost economic growth for countries that get ahead of the curve. But governments, companies, investors and all stakeholders must act, including to minimise hardship for affected workers in fossil fuel sectors and communities where jobs are lost.
A lot has happened since IGCC published Coal, Carbon and the Community: Investing in a just transition over three years ago. The science is overwhelming that global greenhouse gas emissions must halve by 2030 and reach net zero by 2050 to limit warming to 1.5°C. Action on climate change was not disrupted or delayed by the mammoth effects of the COVID-19 virus. Instead, ambition and action on climate change is accelerating. Countries’ net zero ambitions are rising and represent nearly 60 per cent of global emissions and cover more than 70 per cent of Australia’s two-way trade.
Climate change is now widely acknowledged as a systemic risk which must be managed at the economy, portfolio, asset and investment level. Investors are working to implement climate action plans, set ambitious targets, decarbonise portfolios and re-direct capital into emerging technologies. This vital work along with other key drivers is unlocking new opportunities and driving tangible change in the real economy. Just transition principles must underpin these plans to ensure the transition is fair and inclusive. This report provides practical actions, case studies and resources investors can use to consider and support a just transition.
This work also emphasises that to be effective, a just transition must be grounded in people and communities. The analysis in this report sheds light on both common and unique challenges and opportunities for Australian communities with high concentrations of jobs linked to the fossil fuel sector. But we do not have to re-invent the wheel. We can draw on lessons from local and international examples, tapping into our natural advantages and ingenuity to navigate this transition in a way that empowers Australians to prosper in the 21st century and does not leave people behind.
While the world is changing some things remain the same. We know the transition is coming. It is foreseeable. It should, therefore, be manageable. How we act today to prioritise a just and orderly transition will determine whether Australia fulfils its potential to emerge a winner in the global race to net zero.

2
1EXECUTIVE SUMMARYInvestors, insurers, lenders and other capital providers are playing a critical role in helping Australia’s energy sector decarbonise and respond to climate risks and opportunities. Significant momentum is building around net zero emissions commitments: internationally from numerous authorities including the European Union, China, the USA, the UK, Japan and South Korea; domestically from every state and territory in Australia; and from the private sector across all industries. Australia, a large exporter and user of coal and gas, is embarking on an enormous transition as it navigates this trajectory in a way that is fair and equitable.
This report discusses opportunities and actions for investors to support a just transition for high-risk communities that are dependent on emissions-intensive energy industries. It builds on the 2017 publication Coal, Carbon and the Community: Investing in a just transition1 which called for the institutional investor community to take action on transition justice issues based on beneficiaries’ best interests. This report further builds the case, by expanding the commodity scope from thermal coal to include metallurgical coal, oil and gas, and by taking a closer look at community impacts of the transition away from fossil fuels to better understand the challenges and opportunities facing investors.
The report includes an assessment of energy markets, the climate policy landscape the increasing action from financial organisations to address climate-related risk and opportunities and the dynamics of fossil fuel sectors under different climate scenarios, including both orderly and delayed transition pathways. This informs an analysis of economic, geographic and socio-economic factors impacting specific Australian communities which are potentially exposed to high levels of risk and inequity in this transition. The report’s introduction includes a stocktake of the investor landscape on just transition and the second half of the report further examines five key areas where investors can play a role in effectively supporting a just transition in Australia.
Importantly, just transition considerations are not confined to only a few companies or sectors. Investors can consider engagement opportunities across their portfolios, for example the inclusion of just transition considerations in large retailer supply chain decisions.
Net zero ambitions: increasing momentum in the global climate agendaThe plethora of net zero commitments by other countries, state and local governments set a clear collective ambition for strong climate action. Net zero ambitions represent nearly 60 per cent of global emissions and cover more than 70 per cent of Australia’s two-way trade.2 As of May 2021, six countries have a net zero target in law, six countries have net zero targets proposed to be in legislation, and 20 countries have a net zero target in policy documents.3 The most recent announcements were made during the Leaders’ Summit on Climate hosted by US President Joe Biden, including Japan (carbon emission reductions by 46 to 50 per cent by 2030 compared to 2013 levels), the UK (reducing carbon emissions by 78 per cent by 2035 compared to 1990 levels) and the US (50-52 per cent emission reductions by 2030 from 2005 levels).

3
Australia’s key trading partners are moving away from fossil fuelsAustralia’s current primary energy production is dominated by over 97 per cent fossil fuels, 66 per cent of which is coal and 28 per cent of which is gas, with over 80 per cent of this exported.4 By value, over 70 per cent of these coal and gas exports are to China, Japan and Korea, all countries which have committed to net zero greenhouse gas (GHG) emissions by or before 2060.5 This leaves Australia’s coal and gas industries exposed to a significant decline in demand, even if carbon capture and storage (CCS) technologies can be commercially developed.
Mobilising capital towards net zero economy As of April 2021, more than 140 globally significant banks, insurers, asset managers and asset owners have announced their divestment from thermal coal, and 75 entities announced financing restrictions to oil and gas.6 The Net Zero Asset Managers initiative (NZAMI), which has a total 87 signatories as of April 2021 representing $US37 trillion in assets under management with the objective of transitioning investment portfolios to net zero greenhouse gas emissions by 2050.7 NZAMI is just one of a number of initiatives across the finance sector through which asset owners, manager, banks and insurers are making headline commitments and taking action to decarbonise their portfolios, lending and underwriting. These include the Paris Aligned Investment Initiative, New Zero Asset Owner Alliance and the Principles for Responsible Banking, among many others.
Key emerging opportunities for Australia in a net zero economyAustralia has significant advantages for domestic and export industries as part of the accelerating global transition to net zero emissions. Examples of key emerging opportunities include:
➤ Renewables: Nearly $17 billion has been committed to large scale renewable energy projects across Australia, which will support 13,500 jobs.8 The Australian Energy Market Operator (AEMO) estimated that the renewable energy industry could create 19,000 new jobs by 2025 compared to 2020 levels under the Step Change Scenario in its Integrated System Plan.9
➤ Hydrogen: Australia is uniquely positioned to produce and export hydrogen to Asian countries, particularly to Australia’s trading partners. The Federal Government estimates that under a global high-demand scenario, the Australian hydrogen industry could generate approximately 7,600 jobs and add $11 billion per year in additional GDP by 2050.10 This could mean an additional 10,000 jobs and over $26 billion per year in GDP under a fast track high-demand scenario. State and territory governments have published initial hydrogen strategies in accordance with the National Hydrogen Strategy.
➤ Critical minerals and rare earth elements (REE): The global market value of lithium, cobalt and rare earth elements was $US2.3 billion in 2017.11 In a decarbonised economy, Australia’s reserves of critical minerals and rare earth metals play an important role to meet the increasing demand. This will provide significant employment opportunities in regional areas in Western Australia, Northern Territory, South Australia and Queensland. Lithium, cobalt, graphite, nickel and REE are vital for manufacturing low-carbon technologies such as batteries, electric vehicles, wind turbines and high-end technological applications.12

4
Fiduciary duties: climate-risk management Climate change poses foreseeable, material and actionable risks that investors must address. Financial regulators in most major markets are increasingly issuing guidance to regulated entities that a failure to assess and act on climate-related risks in investment decisions and due diligence processes would likely result in breaching director or trustee fiduciary duties (or equivalent obligations).13 The Australian Prudential and Regulatory Authority (APRA), among other regulators, has recently provided guidance on the expectations for financial organisations to identify, manage and respond to climate-related risks.14 The Australian Securities and Investments Commission (ASIC) and the ASX Corporate Governance Council have also issued guidance15 and recommendations16 on climate risk expectations for companies.
Investing in a just and equitable net zero futureUnderstanding and addressing the social dimensions of the transition to a net zero economy is critical to ensure that particular communities, workers and their families are not overly disadvantaged or left behind. Commonly, taking action to address the potential community-by-community disparity in the economic and social outcomes from the inevitable transition to net zero emissions has been labelled a just or equitable transition. Globally, there is a growing recognition among institutional investors that these social considerations should form part of their broader response to the risks and opportunities inherent in the net zero transition.
To date, over 161 institutions with $US10.2 trillion in assets under management have committed to support a just transition, through capital allocation, investment strategies and policy advocacy positioning.17
The world’s largest asset manager, BlackRock, has now set expectations around what it expects companies should consider in addressing climate risks, including recognition that it is “the best interests of companies and markets that the transition is orderly and just”.18 More broadly, global initiatives, mechanisms and strategies with a focus on a just transition are emerging and gaining momentum such as the Just Transition Mechanism as part of the European Green Deal, the Climate Action 100+ Net Zero Company Benchmark, Transition Bonds led by the Climate Bonds Initiative and emerging company just transition strategies.
The need for a just transition: exposed communities in AustraliaAnalysis for this report shows the Hunter Valley, Bowen-Surat, Pilbara and Gippsland basins employ nearly 45 per cent of Australia’s total coal mining, oil and gas extraction and exploration activities workforce.19 Parts of these communities will likely be disproportionally affected by the departure from fossil fuels compared to urban centres and more diversified regional areas. Therefore, a coordinated response to promote new opportunities and alleviate adverse impacts should be implemented.
Implications of orderly and disorderly transition to a net zero economyThe transition to a net zero emissions economy is expected to progressively occur over the next 30 years. The implications for extractive companies, investors and communities are different depending on how and when coal, oil and gas operations start to ramp down. Table 1 provides a summary of these implications under two scenarios in line with data from the Network of Central Bank and Supervisors for Greening the Financial System (NGFS): Orderly scenario (aligned to limiting global warming to 1.5°C by 2100 assuming full availability of carbon dioxide removal [CDR] technologies) and Disorderly scenario (limiting global warming to 2°C by 2100 assuming limited availability of CDR technologies).

5
Table 1. Implications for extractive companies, investors and communities under Orderly and Disorderly scenarios20
Orderly scenario Disorderly scenario
➤ Collective immediate climate action – the main transition period is 2020-40
➤ Global primary energy demand: reduced by 42% from 2020 to 2040
➤ ~2.5% annual decreasing rate of primary energy demand
➤ Cumulative GDP impact: ~ -2% by 2050, and ~ -4% by 2100
➤ 66% of existing workforce in communities in transition must transition to another industry sector per decade from 2020 to 2040
➤ Delayed climate action followed by abrupt changes to the economy – the main transition 2030-50
➤ Slight decrease of global primary energy demand in 2020-30, followed by 70% reduction from 2030 to 2050
➤ ~5% annual decreasing rate of primary energy demand
➤ Cumulative GDP impact: ~ -7% by 2050, and ~ -10% by 2100
➤ 75% of existing workforce in communities in transition must transition to another industry sector per decade from 2030 to 2050
Cost of inaction While transitioning to a net zero emissions economy requires fundamental transformation in coal, oil and gas operations, the costs of inaction will be greater than any transition scenario. NGFS modelling suggests that conservatively cumulative GDP impacts from the physical impacts of climate change could be up to 25 per cent by 2100,21 including the destruction of ecosystems and biodiversity and community disruption (e.g. job losses in the agriculture and tourism sectors leading to livelihood disruption and mental health challenges).
A just transition cannot be achieved through isolated efforts Promoting fair and decent work during and after the transition to a net zero economy requires a multi-stakeholder approach and leadership. This report focuses on the role of institutional investors in a just transition, and their role in influencing other critical stakeholders such as corporates, investees and financiers. But government action and adequate policy signals are critical to reducing uncertainty in capital markets and de-risking investment opportunities. The ultimate beneficiaries of a just transition are workers, their families, customers and communities.
Investor actionInvestors can contribute to a just transition by pursuing action in five areas: (1) investment strategy and capital allocation, (2) disclosure, (3) corporate engagement, (4) advocacy and partnerships and (5) impact measurement and evaluation. These focus areas and recommendations were adapted from recent work published by the Grantham Research Institute on Climate Change and the Environment, which identified five specific focus areas for investor action.22

6
➤ Investment strategy and capital allocation – Managing climate-related risks as part of fiduciary duties is contributing to increasing investor demand for sustainable investments: capital allocation is expected to shift towards an equitable and decarbonised world.
➤ Disclosure – Increasing expectations from shareholders, regulators and stakeholders for companies and investors to utilise robust and comparable reporting frameworks that inform how they are managing climate-related financial risks and opportunities, including material social risks.
➤ Corporate engagement – Engagement as an opportunity to seek to influence companies in which investors have a stake: where investors actively engage with corporates to support long-term value (LTV) creation.
➤ Advocacy and partnerships – Advocating for an effective response and establishing partnerships to identify and facilitate investment opportunities in line with the objectives of a just transition, including building resilient communities and economies.
➤ Impact measurement and evaluation – Ensuring long-term value creation for stakeholders, which requires looking for opportunities that capture impact metrics and report social implications in addition to conventional financial reporting data.
Figure 1. Adapted focus areas for investor action in a just transition
Investment strategy and capital allocation
Impact measurement and evaluation
Corporate engagementDisclosure
Advocacy and partnerships
Investor Action in
a Just Transition

7
Recommendations for prudent investor practice in a just transition Investors should implement a considered response to understanding and supporting a just transition. Investor practice in a just transitionActions investors should consider include:
Investment strategy and capital allocation
1. Seek opportunities to allocate capital towards risk adjusted investment opportunities that support just transition outcomes.
2. In making investment decisions incorporate just transition risks and opportunities as part of ESG integration23.
3. Engage early with community stakeholders and undertake local context analysis when assessing investment opportunities in communities in transition.
Disclosure
4. Consider, implement and disclose on just transition planning, including consultation with affected and potentially affected stakeholders.
5. Disclose metrics according to the Task Force for Climate-related Financial Disclosure (TCFD) framework, including social and climate-related metrics.
Corporate engagement
6. Engage with companies to develop transition plans that include consistent and clear actions, timelines and commitments, in particular the company’s approach to implementing appropriate governance structures; engagement with workers, community, policy makers and trade associations; and planned capital allocation based on social impact assessments. This should be a priority for companies exposed to thermal coal activities and associated value chain.
7. Encourage companies to increase the depth and coverage of just transition related indicators, such as planned capital allocation for workforce or community impacts, the number and kind of job creation, access to employment opportunities, and broader community resilience and innovation.
8. Implement and embed just transition principles and protocols that promote fair and decent work in directly owned assets and ongoing asset management.
Advocacy and partnerships
9. Advocate for action towards a just transition by engaging with policy makers and supporting inclusive government initiatives that reduce uncertainty and speculation in capital markets.
10. Participate in collaborative initiatives to ensure just transition outcomes.11. Encourage mechanisms that enable the aggregation of smaller investment opportunities in
local economies to attract capital from investors.12. De-risk investments by seeking to partner with government, impact investors or other
organisations with the objective of mobilising investment capital towards just transition solutions.
Impact measurement and evaluation
13. Engage with companies and other stakeholders to adopt adequate frameworks and provide data required for investors to assess how just transition risks and opportunities are being managed.
14. Consider existing resources and frameworks such as the UN Sustainable Development Goals, human rights and labour standards, and emerging just transition guidance and benchmarks to inform measurement and evaluation metrics.
15. Assess and monitor positive and negative outcomes for workers and communities associated with the transition to net zero emissions to identify risks, opportunities and just transition priorities.
16. Monitor and evaluate your firm’s activities and outcomes related to just transition risks and opportunities.
8
INTRODUCTION The objective of this report is to build on the 2017 publication Coal, Carbon and the Community, Investing in a just transition,24 which outlined the importance of institutional investor action based on beneficiaries’ best interest. This report discusses opportunities and ways in which investors can support a just and equitable transition for high-risk communities that are dependent on emissions-intensive energy sector activities. The analysis presented in this report further builds the case for action by expanding the commodity scope from thermal coal to include metallurgical coal, oil and gas; and by taking a closer look at community impacts of the transition away from fossil fuels to better understand the challenges and opportunities facing investors. The report includes an assessment of the current state energy fuel markets, the climate policy landscape, the increasing participation from financial services in climate action and the dynamics of fossil fuel sectors under different climate scenarios, including orderly and delayed transition pathways. This informs an analysis of economic, geographic and socio-economic factors impacting specific Australian communities which are potentially exposed to high levels of risk and inequity in this transition. The last section of the report outlines the role of investors and provide examples of tangible actions investors can implement to support a just transition in Australia’s energy sector.
Key to this analysis is an understanding of the drivers of change, the context in which the transition is occurring, emerging frameworks for managing a just transition and the challenges investors face when seeking to support a just transition.
It is important to acknowledge that the discussion about investor action on a just transition has evolved in recent years from understanding and conceptualising the importance of addressing socio-economic impacts on exposed communities and industries through the transition to a net zero future to how investors can support these actors during the transition. In 2018, the Grantham Research Institute on Climate Change and the Environment (Grantham) launched a global project on investing in a just transition.25 This included preparing a guide for investor action through the lens of a just transition, which outlines five reasons for investor action on just transition and five specific focus areas for investor action, including investment strategy, corporate engagement, capital allocation, policy advocacy and partnership, and learning and review.26 This work has culminated in the recent launch of the Financing a Just Transition Alliance, which brings together banks, investors, and other financial institutions (both public and private) with universities and trade unions to translate the growing commitment to a just transition across the financial sector into real work impacts.27
Internationally there have been significant developments by governments, including Canada, the European Union, Germany, Spain and South Africa to establish just transition plans and national strategies.28 The European Commission recently implemented a Just Transition Mechanism as part of the European Green Deal, which consists of mobilising at least €150 billion over the period 2021-27 to alleviate socio-economic impacts of the transition.29
2

9
In the Australian context, the UN Global Compact Network Australia explored the potential implications of the just transition for the corporate sector, financial institutions, energy companies and the workforce in coal mining operations and coal-fired power generation.30 More broadly, Australian states have announced programs that support a just transition in potentially affected communities, such as Collie’s Just Transition Plan in Western Australia31 and the Royalties for rejuvenation: funding the future for coal mining communities in New South Wales.32
2.1 Economies in transitionIn conjunction with commitments made under the Paris Agreement, many countries have begun to take meaningful steps towards net zero emissions, with the rationale that decarbonisation will build more resilient economies, boost productivity and drive increased job creation. Country-level net zero ambitions represent nearly 60 per cent of global emissions and cover more than 70 per cent of Australia’s two-way trade.33 As of May 2021, six countries have a net zero target in law, six countries have net zero targets proposed to be in legislation, and 20 countries have a net zero target in policy documents.34
Figure 2 below summaries the key milestones and increasing momentum globally in relation to a net zero future, including recent announcements made by Japan (carbon emission reductions by 46-50 per cent by 2030 compared to 2013 levels), the UK (reducing carbon emissions by 78 per cent by 2035 compared to 1990 levels) and the US (50-52 per cent emission reductions by 2030 from 2005 levels) during the Leaders’ Summit on Climate hosted by US President Joe Biden in April 2021.
Figure 2. Net zero ambitions for G20 countries by 205035
ArgentinaFrance
ItalyUnited Kingdom
TurkeyAustralia
MexicoBrazil
South AfricaCanada
Saudi ArabiaSouth Korea
IndonesiaGermany
JapanRussia
IndiaEuropean Union
United StatesChina
Net zero by 2050 in lawNet zero by 2050 in policyNet zero by 2050 under constructionNo net zero ambition
Percentage of global emissions (2019)
NZE by 2060
0% 5% 10% 15% 20% 25% 30%

10
The transition to net zero globally, will be the largest transformation of the energy and extractive sectors in centuries. Thermal coal is at high risk of being phased out over the coming decade or two due to the uptake of renewable energy sources and commitments to meet net zero and other targets under the Paris Agreement.
Ahead of the United Nations Climate Change Conference (COP26) in November 2021, the UK and Canadian governments co-chaired the Powering Past Coal Alliance (PPCA) Global Summit in March 2021. The objective of the PPCA Summit was to increase international commitment and cooperation to shift away from coal power generation through clean energy alternatives, financial mechanisms and just transition plans for affected workers and communities.36 The PPCA consists of 123 members, including national and local governments, investors, banks, corporates and energy grid operators.37
For Australia, the significant and inevitable transition within the energy and extractive export industries is expected between 2020 and 2050. This is mainly underpinned by commitments to reach net zero emissions from Australia’s largest trading partners, including China (2060), Japan and South Korea (2050). These partners imported over 70 per cent of Australia’s coal (thermal and metallurgical) and liquified natural gas (LNG) production in 2019.38
As demand for these commodities decreases in the next decades, Australian communities that were built around extracting fossil fuels will be at a high risk of becoming stranded regional communities, which leads to the imperative to ensure a just and equitable transition to a net zero emissions economy. It is evident that the transition is already underway in Australia; for example, 12 power stations have closed in the past eight years, with an average closure notice period of four and a half months. While the closure of fossil fuel-related power stations has reduced the overall emission intensity of the electricity network, the short and abrupt closure period led to job losses with no alternative work opportunities for the local workforce.
Despite positive regulatory changes made by the Australian Energy Market Commission (AEMC) in 2018 related to power stations providing three-year notice in advance prior to ceasing operations,39 this does not avoid all social risks for workers, local businesses and communities. A longer notice period allows more time to plan for closure and disruption but in itself does not spark the investment and action needed to create alternative work and new economic opportunities. A just transition aims to minimise the impacts on the workforce and regional communities by understanding the socio-economic context and potential implications of closures in the fossil fuel sector as well as associated value chain industries and acting to create viable alternatives in industries relevant to a net zero emissions world.
2.2 Fiduciary duties through Environmental, Social and Governance (ESG) considerations While all stakeholders have an important role in a just transition - governments, corporates, individual companies, unions and communities - as allocators of capital, investors cannot take a backseat role. In this context, recent established industry practice suggests investors should discharge their fiduciary duties40 in a strategic way, with a comprehensive approach to deliver environmental and social benefits in the short, medium and long term.
Regulatory guidance has made clear that trustees are at risk of breaching their fiduciary duty if they fail to effectively integrate and act on climate-related risks in decision making, strategy, investment approach and due diligence. Regulatory guidance on climate risk issues has significantly increased in Australia, with strong statements being made by most major regulators as set out in Table 2.

11
Table 2. Statements by major Australian financial regulators on climate risk
APRA
“APRA’s mandate is to ensure that, under all reasonable circumstances, financial promises made by APRA-regulated institutions are met within a stable, efficient and competitive financial system. APRA is seeking to ensure that APRA-regulated institutions are managing the risks and opportunities that may arise from a changing climate, in line with APRA’s approach to other types of risks.”41
ASIC
“Prudent and appropriate management of issues such as climate change (be it climate risk or opportunity) begins with the core fundamentals of corporate governance – integrity, transparency, accountability and acting for a proper purpose. This must be led by directors and senior management.”42
Reserve Bank of Australia (RBA)
“Transition risk will be the greatest for banks that lend in carbon-intensive industries and to individuals or businesses that are reliant on these firms. Other financial institutions investing in carbon-intensive industries, such as superannuation and investment funds, are also exposed to the risk that climate change will diminish the value of their investments. This could occur both through direct investment in carbon-intensive industries, or indirect investments in banks that lend to these industries.”43
Investors’ mindsets and approaches towards sustainable investments and climate-related risks and opportunities are rapidly shifting from niche responsible investment offerings to mainstream whole-of-portfolio approaches.44
2.3 Investing for a just transition Investors are increasingly implementing climate-aligned strategies and roadmaps that embed ESG frameworks and climate-related risk management practices in decision making processes. With the transition to net zero emissions underway and irreversible, there are several initiatives and actions that investors, companies and governments should put in place to robustly account for the social dimensions. The role of investors and potential actions are explored in detail in Section 5.
A just transition combines the need for climate action with the consideration of social inclusion, through an economy-wide process which aligns to a sustainable future with the creation of decent work and quality jobs, net zero emissions and thriving communities.45
The 2015 Paris Agreement specifically takes into account the imperatives of a just transition and the creation of decent and quality jobs in accordance with nationally-defined development priorities and making finance flows consistent with a pathway towards low greenhouse gas emissions and climate-resilient development (Article 2)46.
The costs and benefits of climate change are unlikely to be distributed evenly; instead, less developed and lower socioeconomic regions, as well as carbon-intensive communities, are anticipated to be the most severely impacted by an unplanned and disorderly energy transition.47
Achieving a just transition for fossil fuel reliant communities with the creation of decent and quality jobs requires support from all actors in the economy, including those in capital markets who will finance the climate-led transition. Therefore, proactive engagement by key stakeholders is necessary to alleviate adverse impacts and support a just transition. Table 10 in Section 5 outlines the indicative roles that key stakeholders can play in a just transition.

12
2.3.1 Investor landscape on just transition
Investors have an important and influential role in supporting the just transition through commitments to ESG factors across operations and investments. To date, over 161 institutions with $US10.2 trillion in assets under management have committed to support a just transition, through capital allocation, investment strategies and policy advocacy positioning.48
BlackRock has recently adopted a view on a just transition by recognising that re-allocation of human capital from carbon-intensive industries to cleaner alternatives is critical to allow for a more just and equitable transition. This may include training and re-tooling labour force to preserve economic opportunities and mitigate downstream community impacts.49
There are several examples regarding emerging initiatives, mechanisms and strategies that take into account just transition needs:
➤ Climate Action 100+ Net Zero Company Benchmark – The Climate Action 100+ 2020 Progress Report50 identified that a just transition is crucial for companies and investors as it is interlinked with the systemic risk posed by delayed action on climate change. The Climate Action 100+ Net Zero Company Benchmark includes a just transition indicator as part of the ten indicators within the framework. The benchmark will assess whether the 167 focus companies engaged by signatory investors to the initiative are effectively disclosing the impacts from transitioning to a lower-carbon business model on its workers and communities.
➤ Transition Bonds – in 2020, the Climate Bonds Initiative, in conjunction with Credit Suisse, published a white paper proposing a framework for the use of transition label. The framework outlines how entities and activities can be assessed to identify if the bond meets the definition of a transition bond.51
➤ Just Transition Strategies – For example, multinational energy company SSE published its just transition strategy following investor engagement by Royal London Asset Management (RLAM). RLAM has also published its expectations for energy utilities’ just transition strategies, outlining that a just transition strategy for energy utility companies requires them to assess the social impact of their decarbonisation plans. The strategy must set out key stakeholders who energy utility companies should engage with, including workers, community, supply chain and consumers.52
➤ Financing a Just Transition Alliance – A UK focused initiative launched in 2020, bringing together banks, investors, and other financial institutions (both public and private) with universities and trade unions to translate the growing commitment to a just transition across the financial sector into real work impacts.53
➤ Just Transition Mechanism – as part of the European Green Deal, the Just Transition Mechanism provides targeted support to help mobilise at least €150 billion over the period 2021-27 in the most affected regions with the objective of alleviating socio-economic impacts of the transition and unlocking public and private investment opportunities.54
Embedding just transition considerations in net zero strategies can provide further insights to investors when assessing environmental and social impacts in the long term. Investors should implement a considered response to understanding and supporting a just transition for several reasons, including but not limited to:55
➤ Supporting the discharge of investors’ fiduciary duties to beneficiaries in the long-term through the capture of environmental and social impacts within investments (i.e. managing climate-related risks and opportunities).

➤ An ability to manage and mitigate the systemic risks of climate change through the linkage of environmental and social components of long-term performance and financial returns, as well as anticipating and capitalising on the opportunities of an investment portfolio aligned with a just transition.
➤ Future proofing capital and de-risking portfolios through understanding the impacts of climate change on economies and communities, including assessing physical and transition climate-related risks and opportunities.
➤ Utilising new performance drivers including the prioritisation of human capital resulting in higher performing investments driving value creation.
➤ Supporting the achievement of societal goals through responsible financial stewardship, prioritising the flow of capital to align with the Paris Agreement, the United Nations Sustainable Development Goals and other internationally recognised social capital standards.
To achieve a just transition all stakeholders must work together. In many instances stakeholders such as governments, companies, unions and community-focused groups will be responsible for driving the policies and actions required to ensure affected workers and communities are not left behind. Investors should take a proactive role to understand just transition considerations, integrate these into investment management and decision making and partner with key stakeholders to support a just transition.
2.3.2 Challenges for investors in supporting a just transition
There are several key challenges that investors face in supporting a just transition which cover both investment practice and the context in which decisions are being made. Based on engagement with investors, industry leaders, unions and academics, the challenges detailed in Table 3 were identified as the most material when considering the role of investors in the just transition.
13

14
Table 3. Challenges for investors in supporting a just transition
Scalability of opportunities
Investment opportunities with limited ability to be scaled up are unlikely to receive capital from large investors.
Risk-return profile of investments
Limited investor practice on how to explicitly embed just transition considerations into risk/return assessment.
Policy uncertainty Climate policy uncertainty does not provide strong capital market signals to investors and heightens risk.
Complexity and minimal leading guidance
Technical, economic and social complexity of just transition issues and lack of clear guidance creates a knowledge barrier for investors.
Unique communities
Impacted communities in transition are each unique, vary significantly and require differentiated responses.
The role of divestment in a just transition
Divestment strategies that aim to de-risk portfolios by removing exposure to carbon-intensive assets or equity classes can leave communities more at risk and inhibit access to transition capital.
Benchmarking and metrics
A lack of clear risk-related metrics and reporting frameworks for measurable just transition risks and investable just transition solutions.
Short-termism vs long term value
A prioritisation of short-term returns over long-term value can discourage investment that support a just transition.
Limited level of advocacy influence
Investors seeking to advocate for fairness in net zero discussions may have limited influence if they are not a major shareholder
The role of public vs private markets
Lack of clarity on the role of government versus the private sector creates disincentives and potential market barriers for investor action
These challenges highlight the need for innovative solutions and a multi-stakeholder approach to remove barriers from different perspectives, including leadership and cooperation between government, local communities, unions, financiers and corporates. This is broadly examined in Section 5.
2.4 Clean economy through COVID-19As a result of COVID-19, global economies have been significantly disrupted, causing a supply and demand shock, and a liquidity squeeze for many economies. In a significant market correction, such as that caused by the COVID-19 pandemic, there have been disparate approaches by companies and countries in responding to the pandemic from staying steady while maintaining current priorities compared to those who have pivoted and reprioritised.
In 2020, $US14.7 trillion global spending was recorded in response to the COVID-19 crisis. Three quarters of the global COVID-related spending was directed to immediate rescue, followed by long-term recovery measures (17 per cent). However, only 2.5 per cent of total global COVID-19 spending (or 18 per cent of long-term recovery measures) was directed towards green recovery, which was led by South Korea, Spain and Germany. The main green spending by policy area included clean transport

15
infrastructure (27 per cent), clean energy infrastructure investment (21 per cent), natural capital (18 per cent), buildings upgrades (11 per cent), and green research and development (9 per cent).56
Since the beginning of the COVID-19 pandemic, the Australian Government has provided economic stimulus as a key component of the country’s response, while the Reserve Bank of Australia has also utilised monetary policy levers to lessen the financial impacts.
While Australia did enter a technical recession in 2020, this response has demonstrated that measured and appropriate government spending is an opportunity to publicly invest in Australia’s recovery. However, there are untapped opportunities for Australia in relation to investing in green recovery packages. While Spain and South Korea dedicated 3 per cent and 3.5 per cent of their GDP towards green recovery, Australia directed less than 0.3 per cent of GDP towards green recovery.57
This represents missed opportunities related to job creation, building resilient communities and natural assets, and adopting low-carbon technologies.
Policy archetypes in Australia’s recovery plan may include investing in green energy infrastructure (smart grids, energy storage, renewable energy and hydrogen), natural capital (public parks, land management and restoration, green spaces and waterway protection and enhancement), and buildings upgrades (green retrofitting and energy efficiency incentives).58 Government support and public investment in these areas are critical to provide confidence for private investors to similarly support these activities.
The clean energy transformation in Australia has not stopped during the pandemic. Australia’s electricity generation from renewable sources increased by 3 per cent in 2020 compared to 2019, up from 24 per cent to 27 per cent. Similarly, clean energy jobs rose by 9 per cent from nearly 23,000 jobs in 2019 to 25,000 in 2020 with wind and rooftop solar leading the way.59 In addition to solar and wind farms, Australian state and territory governments have identified emerging technologies such as utility-scale battery and green hydrogen as key opportunities in the transition to a net zero future, which will provide significant job opportunities for the economy and employment. The Australian Energy Market Operator (AEMO) estimated that the renewable energy industry could employ up to 44,000 by 2025 under the Step Change Scenario in its Integrated System Plan.60
More broadly, it is important to reflect on the lessons and insights from the economic response to the COVID-19 pandemic, and how they can be utilised by all stakeholders, including investors, to prioritise a green recovery through the social lens. These include, for example:
➤ The need to take into consideration the social and environmental impacts associated with our current economic model.
➤ The importance of resilience, and the different dimensions of resilience, including business resilience, ecological resilience and community resilience.
➤ The response from Australia and New Zealand governments to contain COVID-19 based on scientific advice in a fast-paced decision-making environment and amid structural changes to the global economy.
➤ The need for global collaboration in achieving a collective objective, and the engagement between stakeholders.
➤ The importance of prioritising social responsibility and labour rights across both low and high carbon industries.

As a result of the deep disruption in the global health system and societal impacts due to the COVID-19 pandemic, the sentiment of investors has shifted towards more responsible investments. ESG and sustainability-linked funds have demonstrated to be more resilient during the pandemic and outperformed their non-sustainable counterparts.61
This is supported by results from EY’s 2020 Investor Survey that evidenced a rise in the number of institutional investors integrating ESG issues into investment decisions, and instead of COVID-19 distracting from this agenda, it has reinforced the imperative.62 Similarly, IGCC’s 2020 Net Zero Investment Survey saw investors’ sentiment rise to the forefront with nearly 70 per cent of investors signalling that the pandemic has had no negative impact on progressing climate change investments or developing climate aligned solutions.63
16

17
ASSESSING THE CURRENT STATE OF PLAYThis section outlines the current state of play for Australia’s ongoing energy transition through the lenses of market forces, climate policy and finance. This section also provides an overview of potential implications for the energy sector in Australia under different climate scenarios.
3.1 Stocktake of fossil fuels and renewablesAustralia’s energy production, consumption and exports have historically been dominated by fossil fuels. This continues to be the case despite the increasing growth of renewable electricity. However, as the global electrification transformation continues with plummeting costs from renewable energy and storage technologies, international demand is predicted to decrease significantly. This can be seen domestically in Australia through the array of historical and announced closures of coal-fired power stations, as well as several pre-closure signs, including maintenance cutbacks and longer generator down-times.
3.1.1 Australian energy production
Over 80 per cent of Australia’s coal, gas and oil production is exported with remaining volumes consumed domestically, in addition to varying levels of imports, particularly liquid fossil fuels. Domestic thermal coal consumption (22 per cent of total Australian thermal coal production) is expected to decline to near zero over the next 20 to 30 years due to the National Electricity Market’s (NEM) aging thermal generation fleet and rapid uptake of renewable energy and storage. This leaves Australia highly dependent on international demand and capital market forces at a global level for these commodities, including geopolitical factors and international trading agreements.
Figure 3. Australian 2019 fossil fuel production (Department of Industry, Science, Energy and Resources, 2020)
3
0
1000
2000
3000
4000
5000
6000
7000
8000
Domestically consumed production
Ener
gy p
rodu
ctio
n (P
J)
78%
22%
26%
2%
14%
98%74%
86%
Exports
OilGas Metallurical coalThermal Coal

18
To date, the majority of Australia’s primary energy production consists of coal and gas. This reflects both the technical and economic maturity of fossil fuel extraction, processing and use, as well as the ability of fossil fuels to be readily exported.
Natural gas production has been increasing steadily since 2015 when Australia ramped up LNG exports, whilst oil production has been decreased slowly over the last decade. In contrast to oil, renewable energy has been rapidly increasing its share of electricity generation (from 17 per cent in 2016 to 27 per cent in 2020)64, however this domestic energy consumption is dwarfed by Australia’s exports of fossil fuels.
Figure 4. Australian historic primary energy production by fuel type (Department of Industry, Science, Energy and Resources, 2020)
Australia’s black coal reserves are primarily concentrated inland from the east coast of Queensland and in the Hunter, New England and central west regions of NSW, with the key export ports situated east of these areas and connected by rail. Brown coal deposits are less common and concentrated in south east Victoria. Due to the costs associated with the transportation of coal, most of Australia’s coal-fired power stations are situated in the same locations and proximity to mines.
In comparison, Australia’s gas reserves are dispersed across the country, with basins along the coast of Western Australia, southern Victoria, north-eastern Northern Territory, Queensland (except for far north Queensland), and a connecting path from Queensland to Western Australia which tracks across central Australia, including north-eastern South Australia.
Additionally, there are shelves of gas off the north-west coast of Australia and the eastern portion of the southern coastline. LNG export terminals are positioned on the east coast of Queensland, the coast of the Northern Territory and the north-west of Western Australia.
Although new large-scale coal and gas developments are unlikely in the medium-to -long term due to the expected decreasing demand from Australia’s trading partners, Australia has reserves in in the Beetaloo sub-basin (NT), the Canning basin (WA), the Browse basin on Australia’s offshore North West Shelf (WA) and the Galilee basin (WA).
Australia’s limited crude oil reserves are mainly located in the Carnarvon basin (north-western WA), the Cooper Basin (at the border of north-east SA and south-west QLD), and the Gippsland basin (VIC).
0%
20%
40%
60%
80%
100%
20152014 201720162010 2011 20182012 2013 2019
Black coal Brown coal Oil and LPG Natural gas Renewables
Prim
ary
ener
gy p
rodu
ctio
n

19
Figure 5. 2019 Australia’s black coal, oil and gas reserves, and power stations
3.1.2 Global export markets
Australian production of LNG, metallurgical coal and thermal coal is driven by global supply and demand factors, particularly those in the Asia-Pacific (APAC) region. Japan, China (prior to the 2020 trade dispute), South Korea, India and Taiwan are the largest importers of Australian coal and gas. In 2019, Australian fossil fuels made up nearly $120 billion in exports to Japan, China, South Korea, India and Taiwan. It is important to note that Australia’s top three importers of coal and gas have already announced net zero emissions commitments, accounting for 71 per cent of total fossil fuels exports.
This leaves the future of Australian economy and communities heavily exposed to economic activity in other markets, climate policies, geo-political issues and other factors in these nations; forcing Australia to identify products that align to key trading partner’s vision or find new trading partners.
Figure 6. 2019 exports per fossil fuel type by destination country in million AUD (Department of Industry, Science, Energy and Resources, 2020)
Scale
Coal
< 2,000Mt
2,001 – 4,000 Mt
4,000 Mt
Legend
Coal-fired power stations
Gas-fired power stations
Major Australian coal deposits (Mt)
Operating coal mine (Mt)
LNG Facility (Mt per annum)
Oil resources
Gas basin
9 9
8
8
49
4
5
1716Gorgon
Wheatstone Pluto
North West Shelf
PreludeDarwin
Ichthys
Australia Pacific LNG
Queensland Curtis LNG
Gladstone LNG
WA
NT
SA
QLD
NSW
VIC
40% 60%0% 20% 80%
100%
50%
75%
25%
0%100%
13%29%
$12,
486
Other
55%
China
19%
$40,
498
31%
$8,1
03
$31,
601
52%
29%
Japan
29%40%
South Korea
90%
3%7%
India
61%
39%
32%
Taiwan
31%
20%
19%
$13,
143
$13,
492
Metal lurgical coalThermal coalLNG
37%
Total exports
42%
22%
$119
,323
Exports by country (%)

20
Analysing this market from the demand side, global capital markets appear to be shifting away from fossil fuels which will increase financing costs and decrease liquidity for Australian-based operations. For example, investors are moving away from fossil fuels to invest in emerging commodities that will play a crucial role in decarbonising the global economy, including critical minerals (lithium, graphite, tungsten, cobalt and nickel) and rare earth metals. These critical minerals and rare earth elements are crucial for manufacturing batteries, electric vehicles, wind turbines and other high-end technology.65
The global market value of lithium, cobalt and rare earth elements was $US2.3 billion in 2017.66
Australia’s main reserves are based in regional areas across Western Australia, Northern Territory, South Australia and Queensland.67
3.1.3 Australia’s National Electricity Market (NEM)
The NEM is Australia’s primary electricity network, located along the east coast of Australia from northern Queensland down to South Australia and Tasmania via New South Wales and Victoria. The South West Interconnector System (SWIS) or Wholesale Electricity Market (WEM) is the electricity network in south western WA, which is smaller than the NEM. The SWIS tends to mirror NEM’s technological advancements and considered to follow NEM’s long-term decarbonisation trends. For the purposes of this report and due to limited data availability for the SWIS, the NEM has been used to characterise Australia’s electricity industry.
Australia’s electricity mix has been dominated by coal and gas with small amounts of hydro generation. However, the future electricity mix is expected to rapidly decarbonise in the coming decades due to market pressure, retirement of ageing coal-fired power stations, consumer preferences, decreasing renewable energy costs, decentralisation of energy resources (microgrids sourced by solar rooftop systems) and uptake of virtual power plants (VPP).
AEMO provides a NEM generation outlook aligned with limiting global warming to less than 2°C.68
The key messages in relation to electricity generation include:
➤ Electricity generation from black coal power plants is expected to decrease 89 per cent by 2036.
➤ Gas-fired power stations are expected to diminish electricity generation to near zero levels in the next 20 years with the largest reductions occurring in the next 5 years.
➤ Brown coal-fired power stations are expected to decrease electricity generation by 62 per cent from now until 2028 with all brown coal generation phased out by 2037.
➤ Wind generation almost doubles from 2020 to 2030 with more than a four-fold increase from 2020 to 2040, making up 39 per cent of generation by 2040.
➤ Rooftop PV almost doubles from 2022 to 2042 while utility PV increases almost five-fold over the period, making it almost a quarter of NEM generation.
➤ By 2042, wind, solar and distributed PV will be the most significant contributors to NEM generation, accounting for 37 per cent, 26 per cent and 18 per cent of total generation respectively.

21
Figure 7. NEM generation historically and in the future under a Step Change scenario (AEMO, 2020)
Based on AEMO’s data, Figure 8 shows the end of coal and gas power stations across the NEM by 2050. The key insights from AEMO’s end of operational life data are:
➤ Over 50 per cent of the NEM’s fossil fuel generation ends its technical life between 2030 and 2037.
➤ NSW is projected to retire 27 per cent of its total fossil fuel power stations in the next decade.
➤ Gladstone and Tarong coal-fired power stations are expected to reach the end of their technical life in 2035 and 2037, respectively.
➤ SA and TAS electricity generators operate well below the fossil fuel-weighted average emissions intensity. This results in less exposure due to the absence of coal generation and high penetrations of RE (SA through PV and wind, TAS through hydro).
Figure 8. Maximum technical retirement of NEM fossil fuel generator by state and fuel source (AEMO, 2020)
Area = Capacity (MW)
0.4
0.5
0.6
0.7
0.8
0.9
1.0
1.1
1.2
1.3
1.4
1.5
20352020 2025 20502030 2040 2045
End of Technical Life
Yallourn
Torrens Island A
Liddell Mount Piper
Eraring
Gladstone
Tarong
Stanwell
Loy Yang B
Loy Yang A
2,500
0
10
20
30
40
50
60
70
80
90
100
Percentage of remaining fossil fuel capacity
Outline
Coal
Gas
SAQLDNSWTASVIC
Fossil fuel weighted average emissions intensity (FY20)
Emis
sion
s In
tens
ity
(tC0
2e/M
Wh)
-
50,000
100,000
150,000
200,000
250,000
300,000
350,000
20052007
20092011
20132015
20172019
20212023
20252027
20292031
20332035
20372039
2041
Gen
erat
ion
(GW
h)
Year
Battery storage
Distributed PV
Wind
Solar
Hydro
Gas
Brown Coal
Black Coal

22
Coal-fired generators could retire earlier than their technical life based on market pressure and potential adoption of carbon-constrained policies. For example, Loy Yang technical life ceases in 2048 in accordance with AEMO’s analysis, however AGL’s scenario analysis indicates the possibility of bringing forward its closure date into the 2030s.69 Similarly, Energy Australia announced that Yallourn is expected to cease operations in 2028 – four years earlier than its stated closure date.70
3.1.4. Gas and heavy industry
In 2019, nearly 70 per cent of total Australian gas production was exported to Asian trading partners, leaving the industry highly exposed to international markets. Projections from AEMO and feedback received from gas industry leaders suggest that LNG sector is unlikely to increase consumption significantly in the next 20 years beyond current levels under any modelled scenario.71
For the remaining 31 per cent of gas consumed domestically, the split is relatively balanced across industrial (13 per cent), residential and commercial (8 per cent) and electricity generation (10 per cent) applications.
Future gas trajectories for the east coast vary from different sources, including scenarios contained within AEMO’s GSOO to those which reflect the gradual slow decline in industry and electricity generation which has been witnessed since 2012.6
At a more aggregated level, net zero commitments by Japan, China and South Korea will increasingly put downward pressure on demand for LNG. Residential and commercial gas consumption is likely to decrease significantly as buildings and transport energy consumption is electrified. AEMO’s electricity generation scenarios depict a domestic electricity market with decreasing gas penetrations as wind, solar and other renewable installations grow rapidly, which suggests less gas demanded.
Industrial gas use in domestic markets is likely to remain steady in the next decade unless industrial facilities find alternative energy sources that meet economic viability. Possible net zero carbon alternatives include solar PV, batteries, electric heat pumps, biomass and hydrogen. Despite accounting for a minority of energy consumption, the implications of decarbonisation on heavy industries requires particular attention as it is economically and technically more challenging to decarbonise. Examples include aviation, chemical processing, metal processing (steel making, smelting) and manufacturing.
8%
13%
69%
10%
ElectricityIndustrialLNGResidential / Commercial

23
3.2 The finance landscapeAs the global transition continues shifting towards a net zero future, more capital will continue to flow towards cleaner and more sustainable investments and assets. In recent years, financial institutions have made commitments in relation to their areas of investment and financing. The Institute for Energy Economics and Financial Analysis (IEEFA) reported that in 2020 more than 100 globally significant banks, insurers and asset managers and owners have announced their divestment from fossil fuels, including coal, oil, gas and LNG.72
The transition in Australia is also underway and has moved beyond the stage of action identified in the IGCC 2017 report.73 Climate League 2030 is a private sector-focused initiative to support and act towards a goal of reducing Australia’s annual greenhouse gas emissions by at least a further 230 million tonnes of carbon dioxide (tCO₂e) from what is currently projected for 2030, which is in line with recommendations from the Intergovernmental Panel on Climate Change (IPCC) and the Climate Change Authority.74 This initiative is supported by multiple financial institutions, including superannuation funds, banks and institutional investors.
Looking at the different actors individually, there has been, and continues to be, significant and specific action from key stakeholders as detailed in Table 4.
CASE STUDY: INDUSTRIAL DECARBONISATION, HEAVY INDUSTRY LOW-CARBON TRANSITION CRCThe Heavy Industry Low-carbon Transition (HILT) Co-operative Research Centres (CRC) is a collaborative research initiative aiming to strengthen Australia’s heavy industries and de-risk their transition to a net zero economy. Under this broader aim is a series of target outcomes and goals which are underpinned by 4 research streams:
➤ Integrating alternative energy sources into industrial processes
➤ Integrated CO2 capture and use for industrial processes
➤ Development of new technology for low-carbon industrial processes
➤ Sectorial transformation and strategic planning
The HILT CRC provides an example of a government and industry funded research partnership providing options to de-risk heavy industry – a subset of the economy typically more economically and technically challenging to decarbonise.

24
Table 4. Action by stakeholders on fossil fuel transition
Banks
The need to manage material climate-related financial risk along with increasing expectations from customers is driving climate action from banks, including negative screening approaches on loans, commitments to net zero, divestments from thermal coal and management of Scope 3 ‘financed’ emissions.
The biggest four banks in Australia have introduced coal finance restrictions in line to their net zero commitments.75 This includes restrictions on new thermal coal projects, although restrictions vary from bank to bank based on certain terms and conditions (e.g. revenue thresholds, existing/new projects, etc.).
Insurers
The risk profile of physical and transition climate-related risks is starting to affect the price of insurance products for assets associated with fossil fuels, particularly thermal coal mining and coal-fired power stations. For example, QBE Insurance Group Limited’s Energy Policy indicates that by 1 January 2030, QBE will have phased out all direct insurance services for thermal coal customers, except for statutory or compulsory insurance.76
Institutional investors
A proliferation of 2050 or earlier net zero targets across Australia’s superannuation funds and asset managers is underway with Australian Super, Lendlease, Aware Super, Cbus Super, HESTA, IFM Investors and UniSuper making public commitments, among others. Several global initiatives have also emerged to help investor pledge and act towards decarbonising their portfolios including but not limited to the Net Zero Asset Managers initiative, the Paris Aligned Investment Initiative and the Net Zero Asset Owners Alliance.
Regulators
APRA, working with the Reserve Bank of Australia, is engaging banks to complete a climate change vulnerability assessment in 2021. APRA has also released draft Prudential Practice Guidance on managing climate risks for consultation, which will be finalised by the end of 2021.77 ASIC and RBA have also provided guidance on regulatory expectations for identifying, managing and responding to climate-related risks.
ConsumersChanging consumer and societal expectations are driving change across the finance sector through increasing pressure and scrutiny on financial institutions to manage for climate change.
3.3 Climate policies3.3.1 The domestic climate policy landscape
Australia’s current emissions-reductions commitments include a 2030 objective to reduce emissions by 26-28 per cent from 2005 levels. The main national climate policies comprise the Climate Solutions Fund (formerly the Emissions Reduction Fund), 2020 Renewable Energy Target, the Safeguard Mechanism and the National Energy Productivity Plan.78 These policies are supported by several national strategies set out by the Federal Government, including the National Hydrogen Strategy, Future Fuels Strategy and the Technology Investment Roadmap.79
The Federal Government is currently developing Australia’s Long-Term Emissions Reduction Strategy, which will underpin Australia’s position in the COP26 summit in Glasgow in November 2021. Whilst

25
Australia’s Nationally Determined Contribution (NDC) establishes a trajectory toward emissions reductions, a more ambitious trajectory and urgent climate action will be required before the mid-century to align with the Paris Agreement. Failing to set net zero commitments and establishing inadequate or delayed climate policies would put Australia at risk of becoming isolated in trade discussions and diplomatic relations.
The IPCC indicates that global carbon emissions need to decrease by 45 per cent from 2010 levels by 2030 and reach net zero by 2050 to have a reasonable chance of limiting mean global temperature to 1.5°C by 2100.80 Based on the assessment conducted by the Climate Change Authority on Australia’s fair contribution to meeting the objectives of the Paris Agreement, Australia’s emission reduction target should be between 40 and 60 per cent below 2010 levels (45-65 per cent from 2005 levels) by 2030.81
By establishing adequate policy signals and targets, the Federal Government could minimise the risks associated with a disorderly transition to net zero emissions, including the significant potential impacts to the financial system and communities. At the same time, clear policy signals will enable the private sector and communities to identify key opportunities in a decarbonised economy.
Australian states and territories have created some momentum for stronger climate action by setting net zero targets and undertaking transformative energy plans. Table 5. provides a summary of emission reduction targets (including interim targets) and renewable energy target by state and territory.
Table 5. Emission reduction targets and renewable energy targets by state and territory
StateNet zero emission target
Interim emission reduction targets (change from 2005 levels, except ACT)
Renewable energy targets
Victoria82
2050
➤ 28%-33% reduction by 2025 ➤ 45%-50% reduction by 2030
➤ 50% renewable energy by 2030Queensland83 ➤ 30% reduction by 2030
Northern Territory84 ➤ N/A
New South Wales85 ➤ 35% reduction by 2030 ➤ No renewable energy target –
supported former national renewable energy target (20% by 2020)Western
Australia86 ➤ N/A
South Australia87 ➤ N/A
➤ Net 100% renewable energy by 2030
Tasmania88 ➤ N/A
➤ 100% renewable energy by 2022
➤ 200% electricity generation from renewables on 2022 levels by 2040
Australian Capital Territory89
2045
(from 1990 levels): ➤ 50% - 60% by 2025 ➤ 65% - 75% by 2030 ➤ 90% - 95% by 2040
➤ 100% renewable electricity supply from 2020 (achieved)

26
State and territory government initiatives to decarbonise the electricity network provide certainty and confidence to the capital markets for unlocking new renewable energy projects and jobs. Key state government initiatives include the New South Wales’ Electricity Infrastructure Roadmap,90 Victoria’s Renewable Energy Roadmap,91 South Australia’s Energy Plan92 and Queensland’s Powering Queensland Plan,93 which incentivise the development of Renewable Energy Zones (REZs).
In addition to renewable energy sources, state and territory governments have identified hydrogen as a significant opportunity in domestic and international markets, particularly for Australia’s key trading partners such as China, Japan and South Korea. Hydrogen could support the creation of 7,600 jobs – many in regional areas – and add $11 billion per year in additional GDP by 205094. This will be through R&D, manufacturing and downstream activities, including transportation, distribution and storage95. State and territory hydrogen strategies include:
➤ New South Wales: The Hydrogen Program sets an aspirational target of up to 10 per cent hydrogen in the gas network by 2030. The Program offers grants and R&D funding for hydrogen projects.
➤ Northern Territory: The Renewable Hydrogen Strategy supports the NT Government’s aim to become an international-scale renewable hydrogen hub through R&D, production and downstream manufacturing.
➤ Queensland: The Hydrogen Industry Strategy paper focusses on being Australia’s leader in renewable hydrogen production by 2030. The Hydrogen Investor Toolkit assists investors with project planning for hydrogen developments in Queensland.
➤ South Australia: The Hydrogen Action Plan leverages existing and future renewable energy sources to produce hydrogen for the domestic and international market. The Hydrogen Action Plan aims to enable the SA Government to achieve its renewable energy target by 2030.
➤ Tasmania: The Renewable Hydrogen Action Plan outlines opportunities for the state’s consumption and exports.
3.3.2 The international climate policy landscape
As discussed in the Introduction, there is growing momentum in the international climate agenda as governments emphasise the urgency for stronger emissions reduction commitments and setting climate change at the centre of international dialogue. This accelerated international climate action will increase pressure on Australian climate policy, which is likely to result in higher costs and risks for our fossil fuel exports, particularly through the impact to trading activity with Japan, China, South Korea and the European Union.
The Biden Administration’s election victory saw a global climate landscape shift, with the United States re-joining the Paris Agreement and adopting an ambitious climate action plan investing $US1.7 trillion over the next decade, with a combined total of $US5 trillion when adding private sector and state government capital. The Biden Administration’s plan directly calls out the inequity of vulnerable communities that are disproportionally impacted by climate change, stating “we’re not going to leave any workers or communities behind”.96
In response to the urgency of climate action, the European Parliament Environment Committee has recently endorsed the Carbon Border Adjustment Mechanism (CBAM) which requires importers of industrial goods to the EU to pay a border levy on greenhouse gas emissions associated with industrial goods that matches the charges of the current EU emissions trading scheme. The border levy is

27
expected to enter into force no later than 2023, ranging from $65 - $140.97 The United States98 and Japan99 are also considering the implementation of a similar approach.
There are other international initiatives that will have an impact on the energy sector and downstream activities such as:
➤ Powering Past Coal Alliance is a collective commitment from 123 members to accelerate the transition from coal to clean energy in a sustainable and economically inclusive way. Key commitments include:
- Government members commit to phasing out existing unabated coal power generation. - Business and other non-government members commit to powering their operations without
coal. - All members commit to supporting clean power generation through their policies.
➤ Governments have set targets for phasing out all new sales of internal combustion engine (ICE) passenger cars. Norway has set the most stringent target (2025) followed by Ireland, Iceland, Sweden, Denmark, the Netherlands, Slovenia and Hainan (China) in 2030. The UK, France, Spain, Cape Verde, Canada and California (the US), will phase out ICE vehicles between 2031 and 2040.100
➤ Zero Routing Flaring by 2030 initiative, led by the World Bank, aims to ban routinely flare gas activities in new oil field developments and to end routing flaring activities in existing fields no later than 2030. 84 governments, oil companies and development institutions have endorsed this initiative.101
3.4 Dynamics of the global fossil fuel sector under transition scenariosGlobally, pathways to net zero can be analysed through different scenarios to understand the profile of key trajectories. Key inputs for scenario analysis may include fossil fuel demand, primary energy production, temperature rise, climate policies and technology advancements. It is important to note that scenarios are not forecasts which present an expected future, but rather provide an opportunity to stress test country, community and company plans against assumptions and climate trajectories.
The purpose of this section is to explore potential risks and opportunities for Australian communities and energy export industries under different market conditions, suites of policies and technology adoption. In line with the current transition to a decarbonised economy, this report considers an imminent and inevitable transition.
3.4.1 Global transition scenario analysis
The Network of Central Banks and Supervisors for Greening the Financial System (NGFS) is a coalition of over 80 central banks and supervisors established in 2017. The NGFS has developed a set of potential scenarios which are the basis of this analysis.
The NGFS has modelled different pathways to achieve global warming stabilisation outcomes by 2100 based on economic factors, technology adoption and carbon abatement options, including limiting mean global temperature to 1.5°C and 2°C. These pathways consider exposure to physical and transition risks associated with trajectories that limit mean global temperature to 1.5°C and 2°C by the end of the century, which can be translated to orderly and disorderly scenarios. Table 6. outlines key characteristics of each scenario used in this report.

28
Table 6. NGFS Scenarios, Orderly and Disorderly
Orderly Disorderly
➤ 71%102 chance to limit global warming to 1.5˚C by 2100
➤ 82% chance to limit global warming to 2˚C by 2100
➤ Immediate action to reduce GHG emissions; reaching net zero by 2050
➤ Delayed sudden action in 2030 to reduce GHG emissions; reaching net zero by 2050
➤ Assumes full availability of carbon dioxide removal (CDR) technologies such as bioenergy with carbon capture and storage (BECCS) or land related sequestration
➤ Assumes limited availability of CDR technologies due to challenges in achieving the required investment and deployment
➤ Physical risks: lower ➤ Physical risks: somewhat low but higher than the orderly scenario
➤ Transition risks: lower ➤ Transition risks: high
The analysis in this report is focused on global projections using NGFS data to obtain a better understanding of potential implications to Australian operations associated with coal, oil, gas and exploration activities under orderly and disorderly decarbonisation pathways. In particular, understanding how and when communities heavily dependent on these economic activities may be impacted, which are discussed in Section 4.
The orderly scenario represents a smooth transition that, after limited overshoot, returns warming to below 1.5°C in 2100 with full availability of CDR technologies and immediate introduction of comprehensive emission policy (see Figure 10). The availability and uptake of technological alternatives is a critical enabler of ensuring an orderly and just transition. This scenario takes a similar pathway to the International Energy Agency’s (IEA) Work Energy Outlook (WEO) NZE2050 pathway, with a difference in emissions due to the IEA not including land use, land use change and forestry (LULUCF) in their trajectories.
A disorderly pathway represents a more disorganised scenario that maintains current country pledges until 2030, before a sudden knee jerk reaction occurs through the introduction of a comprehensive emissions policy to limit global warming to 2°C in 2100, with only limited availability and uptake of CDR technologies. Greater transition risks are experienced under a disorderly trajectory due to the delay and lack of coordination in the global response which results in no clear investment pathway for greenhouse gas reduction and hence its limited adoption.
An immediate and steady emissions reduction trajectory would reach net zero emissions by early 2050, resulting in less abrupt transitional impacts on communities. A delayed 2°C trajectory (disorderly) would result in greater transition risk impacts because of more rapid and haphazard decarbonisation, creating more severe disruption in global economies, particularly on carbon-emissions-intense industry sectors.

29
Figure 10. Annual global carbon dioxide emissions under NGFS (Immediate action 1.5°C orderly scenario and Delayed action 2°C disorderly scenario) and IEA WEO NZE2050 scenario (NGFS, 2020; IEA, 2020)103
The NGFS also developed a trajectory based on current policies and limited climate action where societies fail to decarbonise the economy by continuing operating in a business-as-usual mode. This scenario is defined as Hot House World, which would result in average global temperature rise of over 3°C by the end of the century. Although, under this scenario there are no transition risks, global economy is severely impacted by augmented physical risks, including infrastructure, food and agriculture production, and terrestrial and marine ecosystems. Detailed impacts from physical risks are not included in the scope of this analysis. However, a summary of key impacts from physical risks are discussed in The cost of inaction and Future employment trends sections of this report.
3.4.2 Global fossil fuel commodity trends
The energy supply sector is set to experience significant structural changes driven by shifts in demand, changing supply-side technologies, electrification and the reclassification of risk to more appropriately include the physical and transition effects of a changing climate in investment decisions.
It is important to acknowledge that the NGFS scenarios may diverge from other climate scenarios in certain assumptions, particularly in relation to the steep rate of metallurgical coal decline and relatively conservative decline in oil and gas usage. Like any modelling approaches, NGFS climate scenarios are not forecasts or projections, but instead provide plausible possibilities to consider the related climate impacts of different futures.
It is also worth noting that technological development and market maturity can be significant sources of uncertainty in climate scenarios. Models often underestimate the speed and scale of transitions, especially when major markets and their capital pursue a technology due to cost reductions from economies of scale and technological advancement. For example, the penetration rates of renewable electricity have been consistently higher than anticipated by the IEA’s Energy Technology Perspectives and AEMO’s Electricity Statement of Opportunities (ESOO).
-20,000
-10,000
0
10,000
20,000
30,000
40,000
50,000
60,000
20302010 2020 20602040 2050 2070
Orderly Disorderly IEA NZEHot house world
Transition periodorderly scenario
Transition period–disorderly scenario
Emis
sion
s (M
tCO
2)

30
This is important in the context of the NGFS’ metallurgical coal demand pathways, which decline more rapidly than some industry leaders expect. Furthermore, the NGFS’ oil demand trajectories anticipate a modest decline out to 2050, despite the plethora of electric transport investment and forecasts which have been building momentum over many years.
Figure 11 shows global primary energy demand per commodity under an immediate 1.5°C orderly trajectory compared to a delayed 2°C disorderly scenario. The gradual and steady decarbonisation pathway under an orderly transition estimates a decline of global primary energy by 42 per cent within the next 20 years. This would require a coordinated approach to phase out thermal and metallurgical coal by 2040, including supporting and investing in cleaner alternatives.
On the other hand, a disorderly trajectory assumes an increase of global primary demand until 2030 followed by an abrupt drop, including reduced global demand for fossil fuels by nearly 70 per cent from 2030 to 2050. This would mean that the annual decreasing rate of primary energy demand from fossil fuels would be 5 per cent under a disorderly scenario, which is two times higher than the orderly transition.
Figure 11. Global primary fossil fuel demand under an orderly scenario (NGFS, 2020)
An orderly trajectory considers:
➤ Gas is expected to be initially employed as a supporting fuel to cleaner alternatives out to 2025 from where its role gradually diminishes, which is aligned to AEMO’s electricity and gas projections.
➤ Carbon capture and storage (CCS) technology does not play a critical role in the electricity market due to high capital investments and decreased competitive with cost-effective renewable energy solutions.
➤ The transport sector starts decarbonising after 2030 through renewable electrification, hydrogen and biofuels.
➤ The higher economic costs and emissions intensities of thermal coal than its alternatives sees it exit rapidly at a national and global level, as is already being witnessed through coal mine and coal-fired power plant closures (e.g. restricted capacity to attract capital to extend or commence operations). An immediate 1.5°C trajectory entails that thermal coal is expected to be phased out by 2035.
- Early retirement of Australian coal-fired power stations is aligned to AEMO’s Integrated System Plan (ISP) analysis due to a more rapid uptake of renewables, energy efficiency in commercial and
0
100
200
300
400
500
600
2020 20602030 2040 20702050
-42% Metallurgical coal
Prim
ary
ener
gy (E
J)
Oil
Thermal coal
Gas w/o CCSGas w/CCS
-67%
Total -disorderly (2⁰C)

31
industrial facilities, and potential market and policy signals (e.g. establishing more constrained energy and carbon policies).104
➤ Metallurgical coal decreases slower and more gradually compared with thermal coal, however the immediate 1.5°C scenario anticipates its decline to near zero demand levels by 2040. The NGFS scenarios do not explicitly stipulate solutions though alternative technologies include four primary options:
- Biomass: biochar or other high carbon purity biomass from waste timber or ecologically sustainable plantations can be integrated as a combustible fuel and potentially as a reducing agent in the metal making process. - Carbon capture and storage: affixing CCS technology to existing coking coal use could
drastically reduce the process emissions, although current challenges include high initial investment and economic viability when considered with the cost of alternatives and lack of adequate carbon pricing mechanisms. - Hydrogen: the electrolysis of hydrogen from renewable electricity can be used as both a fuel
source for the blast furnace and a reducing agent in the steel making process. - Recycling and reuse: increasing rates of steel recycling through new technologies and the
possible repurposing of other waste as a combustible fuel source can reduce the need for virgin steelmaking using metallurgical coal. Electric arc furnaces are currently the dominant technology for steel recycling, passing high-current electric arcs through scrap steel to liquefy it at specific chemical compositions and temperatures.
Many of these aggregated global trends are already being played out through private sector action. Examples around divestment in fossil fuels assets include BHP withdrawing from thermal coal,105 Rio Tinto selling its last thermal coal asset in 2018,106 and South32 expecting to complete the sale process of its last coal mine in South Africa before mid-2021.107
Aside from these demand-side drivers, supply-side factors such as increased technological efficiency, economies of scale, new technology development and supply chain improvements will act to reduce cost and increase scale. Technological advancements in hydrogen, renewable electrification and CCS are among some of the more favoured technologies to assist in replacing energy demand from fossil fuel commodities.
3.4.3 The cost of inaction
Failing to take meaningful action on climate change is anticipated to pose greater economic, social and environmental costs than the investment required to achieve net zero carbon emissions by 2050. These costs are mainly borne by both transition risks (i.e. caused by changes in the economy due to a transition to a low carbon economy) and physical risks (i.e. caused by acute and chronic climatic changes).
Assuming action consistent with current climate change mitigation pledges from nations, the projected global average warming at mid-century is expected to be 2-2.6°C.108 Global insurer RE Swiss estimates that global economic losses would be approximately seven to 10 per cent more than if the Paris objective of limiting global warming to well below 2°C is met. Australia would suffer losses worth approximately seven to eight per cent on the same measure.109
As per RBA’s remarks noted in Section 2.2, physical risks will only rise over time if not urgently addressed. Addressing climate-related risks early will help economies to both mitigate the transition risks and reduce the scale of the challenge that physical risks pose to financial stability in the future.110

32
NGFS modelling suggests that a cumulative global GDP impact under an orderly scenario is likely to be ~2 per cent by 2050, whereas a disorderly trajectory entails a GDP impact by nearly 7 per cent in 2050. The differential impact on cumulative GDP between both scenarios intensifies in the second half of the century – limiting GDP impact to 4 per cent under an orderly trajectory (see Figure 12).
In contrast to the differing transition cost profiles between orderly and disorderly pathways, the costs of physical risks are relatively similar (i.e. 2-10 per cent by 2100) due to the achievement of similar climate outcomes by 2100. However, global GDP losses under a Hot House World scenario will be larger than impacts under a low carbon scenario; representing up to 25 per cent of GDP by 2100.111 It is important to recognise that GDP loss estimations are based on models comprising a wide range of assumptions related to climate sensitivity and depend on the method used to estimate economic damages. As a result, the NGFS states these costs are likely to be underestimated.
The destruction of ecosystems and biodiversity, including World Heritage Sites, from physical risks can have significant environmental, social and economic impacts. Recent examples in Australia include:
➤ The Black Saturday bushfires (2009) cost an estimated $7 billion – $3.1 billion in tangibles and $3.9 billion in intangibles.112
➤ The Queensland floods (2010-11) cost an estimated $14.1 billion – $6.7 billion in tangibles and $7.4 billion in intangibles.14
➤ The 2019-20 bushfires cost more than an estimated $100 billion across tangibles and intangibles.113
Whilst not all these costs can be entirely attributed to climate change, a causal link between anthropogenic global warming and the increasing severity and frequency of extreme weather events is increasingly well documented.114 From a social lens, there is significant community disruption, livelihood loss and associated mental health challenges posed by a delayed change path. These three factors all directly and indirectly impact regional communities, as is investigated in Section 4.
-10
-8
-6
-4
-2
0
2100
Year
2030 2050
Orderly
DisorderlyCum
ulat
ive
GD
P im
pact
(%)
-30
-25
-20
-15
-10
-5
0
Cum
ulat
ive
GD
P (%
)
2020 2050
Year
20402030 2060 2070 2080 2090 2100
Range given model specification and climate uncertainty ~ 23%
Figure 12 & 13. Cumulative global GDP impact from transition risks (NGFS 2020)

33
COMMUNITIES IN TRANSITION
4.1 Overview of communitiesThis section examines coal, gas and oil’s domestic footprint within specific communities and considers what challenges and opportunities lie ahead for an orderly and just transition to net zero emissions. Australia’s fossil fuel employment varies across the different commodities, states and regions. Many of those employed in coal mining and gas extraction are concentrated in New South Wales and Queensland, with disproportionally small employment in Western Australia relative to the gas production.
4.1.1. A national production breakdown
There are several communities across Australia that will undergo a transition in the coming decades as decarbonisation diminishes the demand for coal and gas. This analysis focuses on the communities most exposed to disruption and those that have the largest workforces, which are mainly located in the main extractive hubs across Australia.
In 2020, black coal was Australia’s largest extracted commodity (65 per cent), followed by conventional gas (23 per cent) and coal seam gas (9 per cent). Queensland is the largest energy producing state, making up 45 per cent of the nation’s energy fossil fuel production, 80 per cent of which is black coal and in the remainder coal seam gas. New South Wales is the second largest producer with nearly 30 per cent of Australia’s total energy production, predominantly black coal. Western Australia made up 18 per cent of total Australian production of which 95 per cent comprises of extracting conventional gas. The rest of the states and territories collectively represented 8 per cent of Australia’s energy production.
Figure 14. Australia’s coal and gas energy production by state115
4
WA
NTQLD
NSW
VIC
SA
80%
20%
56%
44%
65%
3%
23%
9%
5%
95%
3,142 PJ
Australia17,000 PJ
43%
59%
Black coalBrown coalConventional gasCoal seam gas
496 PJ
7,714 PJ
20 PJ790 PJ
107 PJ 4,724 PJ

34
This report examines the socio-economic profiles and exposure to transitional risks in the Bowen-Surat basin (QLD), the Hunter Valley (NSW), the Pilbara (WA) and the Gippsland basin (VIC). The four communities in transition are comprised of multiple Statistical Area Level 4s (SA4s), except for the Pilbara which is formed by Local Government Areas (LGAs) as shown in Figure 15. These areas have been selected for this analysis because of the high concentration of fossil fuel industries and workers in the regions. Further details on the assessment factors and approach are provided below.
Figure 15. Geographical location of Communities in Transition
4.1.2 A national employment breakdown
As of the last Census in 2016,116 56 per cent (49,000 workers) of fossil fuel industry employment exists in coal mining, with 23 per cent (20,000 workers) working in oil and gas extraction and 22 per cent (19,000 workers) in exploration actives across all commodities.
A third of Australia’s employment in coal, gas and oil is in capital cities, positioning these workers less at risk due to a greater range of alternative economic and employment options generally presented by metropolises. Oil and gas operation and exploration activities are the main source of fossil fuel industry employment in capital cities, while coal activities are mainly located in remote areas.
The remaining majority, two thirds, is distributed regionally and rurally, leaving these workers more exposed to decarbonisation disruption due to their relative geographical isolation and potential lack of alternative opportunities – nearly 45 per cent of the existing workforce are in the communities selected for analysis in this report.
Figure 16. Estimated employment in coal, oil and gas extraction and exploration activities (REMPLAN; Australian Bureau of Statistics, 2016 Census; Australian Bureau of Statistics, 2020)
WA
NT
QLD
NSW
VIC
SA
Community in Transition
Statistical Area 4s
Pilbara Karratha, Ashburton, Port Hedland and East Pilbara (LGAs)
Bowen-Surat Central Queensland, Mackay - Isaac - Whitsunday , Darling Downs - Maranoa, Townsville and Toowoomba
Hunter Valley Hunter Valley, New England, North West, Newcastle and Lake Macquarie
Gippsland East Gippsland, Wellington, Baw Baw, Latrobe, South Gippsland, Bass Coast
4913
32
11 20
11
4 19
0
20
40
60
80
100
5
3
Capital cities Communities in transition
3
5
Other Total
21
29
38
88
Jobs
(‘00
0)
(33%) (44%) (23%)
CoalO&GExploration
Australia’s top five employment sectors (nearly 50% of total Labour forces):
➤ Health Care & Social Assistance ➤ Retail Trade ➤ Education & Training ➤ Construction ➤ Professional, Scientific &
Technical Services

35
To put these numbers in perspective, the existing workforce in coal mining, oil and gas extraction, exploration activities, and associated value chain operations represent approximately 2 per cent of Australia’s total workforce. Compared to other industry exodus, this workforce is up to approximately three times the 27,500 jobs117 estimated to have been lost by the end of 2017 from the closures of Ford, Holden and Toyota. However alternative studies have the number of job losses associated with car manufacturing as closer to 200,000 when considering indirect employment.118
The break down across the selected communities is shown in Figure 17. More than 90 per cent of the workforce is based the Bowen Surat Basin (54 per cent) and the Hunter Valley (36 per cent), followed by Gippsland Basin (6 per cent) which mainly relies on value chain operations. Value chain activities account for over 20 per cent of total jobs across the communities in transition, which include petroleum & coal product manufacturing, rail transport, electricity generation and gas supply. It is important to recognise that jobs related to thermal coal activities are the most exposed to be transitioned in the shorter term, including jobs at coal-fired power stations. Electricity generation jobs in communities in transition are 35 per cent of value chain activities (or 8 per cent of total jobs in communities in transition).
Figure 17. Estimated breakdown of employment in communities in transition by state (REMPLAN; ABS, 2016 Census; ABS, 2020)
As represented in Figure 18, jobs within the Hunter Valley, Bowen-Surat Basin and Gippsland are predominantly undertaken by local residents. In comparison, in the Pilbara region over two thirds of employees are classified as non-residents and undertake fly-in, fly-out (FIFO) work. The different dynamics in each community suggests the need for a community specific approach towards the just transition, which is supported by socio-economic profiles (e.g. education level, occupation and age) outlined in the following section.
Jobs
(‘00
0)
13
32
19
1
2
4
111
0
15
30
45
60
Hunter Valley
Pilbara
227
18
Gippsland
3 31
Bowen -Surat
5
Communities in transition
3 49
O&G
Value chainExploration
Coal
(36%) (54%) (6%)(4%)

36
Figure 18. Coal, oil and gas extraction employment distribution across communities in transition (REMPLAN; ABS, 2016 Census; ABS, 2020)
4.2 Specific community analysisThis section contains a community level deep dive of economic, geographic and socio-demographic factors within the communities in transition, especially Hunter Valley, Bowen-Surat and Pilbara. Of these communities, the Bowen-Surat and Hunter Valley communities appear to be the most at risk due to the size of population dependent on the industry that live in the region.119
The assessment of how severe the transition is likely to be on communities is based on the following factors:
➤ The number of people working in coal, gas and oil within a community.
➤ The proportion of people employed in coal, gas and oil who live in the region they work in as opposed to those that are fly-in fly-out.
➤ The age, level of education and occupation of the workers employed in coal, gas and oil.
➤ The value added by fossil fuel employees in these communities relative to other sectors in these communities.
4.2.1 Socio-economic demographics
The socio-economic demographics of workforces in coal, gas and oil extraction are broadly similar with subtle yet important differences that distinguish the transition risk that these communities are exposed to. All three of these regional workforces have very low proportions of workers aged below 25 or above 65, with an even distribution from 25-55 when compared to the remainder of their respective states. This aligns with lower regional younger populations and less need to work past the pension age in regional areas compared to the higher living costs of urban centres.
WA
NT
QLD
NSW
VIC
SA
30 May 2021
Page 11
37%
57% 3%
3%
Employment distribution by community in transition
Hunter Valley Bowen-SuratPilbara Gippsland
15
0
4
8
12
16
Residents Non-residents
Total
14 1+6%
28
0
5
10
15
20
25
30
Residents Non-residents
Total
22
6
+28%
1
0.0
0.5
1.0
1.5
Residents Non-residents
Total
1-6%
Coal
Exploration & Mining Support ServicesOil & Gas Extraction
Jobs
(‘00
0)
Jobs
(‘00
0)
Jobs
(‘00
0)
Surat-Bowen Basin
Hunter Valley5
0
1
2
3
4
5
Residents TotalNon-residents
3
1
+241%
)000‘( sboJ
Pilbara
Legend
Communities in transition
Renewable Energy Zones (REZ)
Gippsland

37
On average nearly 70 per cent of all three communities’ workers are at a Certificate level of educational achievement (lower level than Diploma), or lower, which implies further training or education may be needed to find new opportunities. Educational profiles across states are more evenly distributed with over 80 per cent of the workforce holding Certificate, Advanced Diploma and Bachelor’s degrees (36, 16 and 30 per cent, respectively); allowing employees to move across industries or occupations. This may be difficult for communities in transition without adequate opportunities in learning and development.
The occupation profile of this workforce is also highly concentrated with over 70 per cent of the Bowen-Surat, Hunter Valley and Pilbara regions’ fossil fuel workforce employed as technicians, trade workers, labourers, machinery operators or drivers. In comparison, the rest of the nation has a much more diverse occupation distribution. This specialisation homogeneity reflects the technical specialisation and concentration of the fossil fuel extraction sector in these regions and increases the need for some form of retraining due to a lack of such specialised jobs in the broader economy.
Each of these factors, particularly the lower tertiary education levels and highly concentrated occupations, increase the transition risk exposure and give impetus to the need for an orderly and planned transition to mitigate these factors.
Figure 19. Demographics of the Bowen-Surat, Hunter Valley and Pilbara regions’ coal, oil, gas and value chain workforce and QLD’s, NSW’s and WA’s (shaded) total workforce (REMPLAN; ABS, 2016 Census; ABS, 2020)
7% 7%
25%9%
27%
11%
28%
26%
12%
14%
70%
6%
43%
0%
25%
50%
75%
100%
OccupationAge Level of Education
9%6%9%
32%
14%
16%
23%
14%
21%
22%
15%
12%
32%
24%
13%
11%
14%
Demographics in the Hunter Valley region and NSW (shaded)
6%
26%
7%
28%
11%
33%
26%
10%
14%
73%
6%
42%
0%
25%
50%
75%
100%
Age OccupationLevel of Education
6%8%
7%
28%
15%
10%22%
17%
16%
22%
22%
40%
12%
20%
14%
12%
14%
10%
Demographics in the Bowen -Surat region and QLD (shaded)
7% 7%
33%
13%
30%
17%
38%
21%
13%
9%
64%7%
20%
13%
0%
25%
50%
75%
100%
Age Level of Education
Occupation
8%
9%
7%
14%
13%
23%
22%
22%
15%
16%
30%
38%
12%
21%
16%
11%
10%
Demographics in the Pilbara region and WA (shaded)

38
Despite direct employment from coal, oil, gas and exploration operations accounting for between just 5-7 per cent of employment in the three communities, they are the main gross value added (GVA) contributor to local economy (see Table 7). GVA per worker in mining is at least double that of the average across the three communities; indicating that miners generate significant more economic value to the region (see Figure 20). This may pose additional transitional challenges of income differential spawned by the fact that many workers may face lower salaries in alternative careers.
Mining jobs in coal, oil, gas and exploration
% of GVA associated with mining (coal, oil, gas and exploration)
GVA/job
Bowen-Surat 27,600 (7%) 17% $395,000
Hunter Valley 14,900 (5%) 12% $419,000
Pilbara 4,550 (7%) 12% $848,000
Table 7. Employment and Gross Value Added related to coal, oil, gas and exploration activities in each community (REMPLAN; ABS, 2016 Census; ABS, 2020)
While the GVA/job ratio in the Bowen-Surat and Hunter Valley regions are relatively similar ($395k/job and $419k/job, respectively), the GVA/job ratio in the Pilbara region equates to more than double ($848elisek/job). This is due to the significant increasing demand for commodities found in a relatively remote region, especially oil and gas, iron ore and non-ferrous metal ore mining.
In addition to potential job losses within the coal, oil, gas and exploration sectors, transition risks would have a flow-on effect in the local economy by reducing current disposal income in small businesses (e.g. hospitality, local produce) as well as business-to-business (B2B) sales that depend on mining operations (e.g. maintenance and repairment of machinery, property rentals and transport services).
While employment associated with mining and exploration activities is exposed to transition risks, a delayed action (or inaction) to decarbonise the global economy would amplify the exposure of other sectors to physical risks. Agriculture, forestry, fishing, tourism and some manufacturing120 activities are more likely to be impacted by severe extreme weather events (e.g. cyclones, droughts, flooding, bushfires) and drastic changes in climate conditions (e.g. changing rainfall patterns, more frequent and severe heatwaves).
300,000 450,0000
50
350
100
1,300
150
200
0
400
150,000
300
250
Mining (C,O&G,Exploration)Electricity, Gas, Water & Waste Services
Information Media & Telecommunications
Rental, Hiring & Real Estate Services
Rental, Hiring & Real Estate Services
Manufacturing
Construction
Agriculture, Forestry & Fishing
Public Administration & Safety
Financial & Insurance Services Education & Training
Mining (Other)
*OtherAccommodation & Food Services
Ø 155
$000
per
Job
Bowen-Surat Region
$000
per
Job
50,000 200,000 300,000 350,0000
300
100
150
200
1,400
250,000
350
250
150,000
400
50
100,0000
Mining (C,O&G,Exploration)Agriculture, Forestry & FishingFinancial & Insurance Services
Electricity, Gas, Water & Waste Services
*Other
Information Media & TelecommunicationsManufacturing
Public Administration & Safety
Rental, Hiring & Real Estate Services
ConstructionTransport, Postal & Warehousing
Education & Training
Mining (Other)
Ø 156
Accommodation & Food Services
Hunter Valley Region
200100
800
300
500
20,000
600
1,400
10,000 50,000 60,0000
400
900
700
70,00040,00030,0000
Information Media & Telecommunications
Mining (Other)Rental, Hiring & Real Estate ServicesMining (C,O&G,Exploration)
Construction
Electricity, Gas, Water & Waste Services
Manufacturing Rental, Hiring & Real Estate Services
*Other
Public Administration & SafetyAgriculture, Forestry & Fishing
Education & TrainingFinancial & Insurance Services
Accommodation & Food Services
Ø 498
$000
per
Job
Pilbara Region
Figure 20. Sectorial gross value added (GVA) of the Bowen-Surat, Hunter Valley and Pilbara regions (REMPLAN; ABS, 2016 Census;
ABS, 2020) 120

Bowen-Surat Basin
28
0
10
20
30
40
50
60
70
80
Exposure to Transition Risks
Jobs
(‘00
0)
Exposure to Physical Risks
73
0
3,000
6,000
9,000
12,000
GVA ($M
)
15
0
10
20
30
40
50
60
Jobs
(‘00
0)
52
Exposure to Transition Risks
Exposure to Physical Risks
Hunter Valley
6,000
4,000
2,000
8,000
GVA ($M
)
Pilbara
5
0
3
6
Exposure to Physical Risks
Exposure to Transition Risks
Jobs
(‘00
0) 3
0
1,500
3,000
4,500
GVA ($M
)
Mining (C, O&G, Exploration) Agriculture, Forestry & Fishing Tourism Manufacturing GVA
Mining operations generate more economic contribution than agriculture, tourism and manufacturing121 activities across the regions. Specifically, GVA from mining operations are 35 per cent and 55 per cent more in the Hunter Valley and Bowen-Surat Basin, respecitvely. However, nearly 130,000 jobs from these other sectors would be at risk and exposed to physical risks across the three communities, which is nearly three times more than mining and exploration jobs exposed to transition risks (see Figure 21). Adaptation for these sectors exposed to the physical risks are likely to be harder to overcome than the anticipated transition risks for the fossil fuel sector.
It is important to note that climate-related physical and transition risks are not mutually exclusive. A disorderly transition (i.e. delayed action scenario) could lead to compromising the viability of all sectors outlined in Figure 21.
Figure 21. Bowen-Surat, Hunter Valley and Pilbara regions job number and GVA exposure to transition and physical risks of climate change (REMPLAN; ABS, 2016 Census; ABS, 2020)
39

40
4.2.2 Bowen-Surat community
The Bowen-Surat community is a combination of many distinct communities stretching from Townsville to Toowoomba inland and on the coast. Due to the high resource intensity within this region, several Statistical Area Level 4s (shown in Figure 15) have been grouped due to similarities in their individual workforces.
Nearly 80 per cent of these workers live in these communities themselves, reducing the number of alternative opportunities available without relocation, which is emotionally and economically challenging – both to individuals and communities as a whole.
What could a mining worker in the Surat-Bowen basin look like?
Works in metallurgical coal
Employed as a mining dump truck driver Aged 35- 44
Very likely lives in the Bowen-Surat basin
Holds a Certificate II in Surface Extraction Operations from a Registered Training Organisation (RTO) such as TAFE
Faces an uncertain future due to a gradual decline in metallurgical coal which may see wages decrease and jobs dry up
May continue to work in metallurgical coal until retirement or may transition into other specific industries such as metal ore mining, construction or transportation – ideally leveraging the experience and skills of his or her career
New economic opportunities
The abundance of gas production and export opportunities in this region may help to smooth the loss of employment in this transition as gas is expected to face a slower decline in global markets. The potential repurposing of this gas export infrastructure for hydrogen export, either as hydrogen or converted into ammonia, could present an opportunity for workers to utilise their specific skill sets with strong overlap of location, skills and industry. An additional opportunity for transition, which would require varying degrees of retraining but minimal physical movement of labour, presents itself in the range of renewable energy zones (REZ) stretching up the southern, central and northern transmission corridors including the Darling Downs, Wide Bay, Fitzroy, Isaac, Barcaldine, Northern Queensland and parts of the North Queensland Clean Energy Hub.

41
4.2.3 Hunter Valley community
The Hunter Valley region is comprised of several communities stretching from Newcastle to west of Coonabarabran and north west inland of Grafton and the coastal region. Over 95 per cent of employment depends on thermal coal (excludes electricity generation and gas supply due to double up with renewable energy and other generation technologies), which is used at generators such as Liddell, Bayswater, Eraring and Mount Piper. Hence, the immediacy and speed of transition which may impact this community are likely to be greater than other communities around the country.
What could a mining worker in the Hunter Valley look like?
Works in thermal coal
Employed as a labourer Aged 35- 44 Very likely lives in the
Hunter Valley
Holds minimal formal training from an RTO or equivalent
Faces a very uncertain future with export markets likely to weaken and domestic consumption likely to diminish as coal-fired power generators reach the end of their technical or economic lives
May be able to transition into construction of renewable energy or other construction projects otherwise some form of geographic movement may be needed which could cause significant stress
New economic opportunities
There are opportunities in these communities that have been currently identified and planned by some public and private organisations. This may include the development of the Electricity Strategy and Electricity Infrastructure Roadmap by the NSW Government and AGL’s plan to shift workers from the Liddell power plant (scheduled to close in 2022) to the Bayswater power plant. Green steel and zero emissions manufacturing also present significant opportunities.

42
4.2.4 Pilbara community
The Pilbara region is comprised of four LGAs, including East Pilbara, Port Headland, Ashburton and Karratha in north west Western Australia. Only 29 per cent of the total workforce live in these communities (as opposed to the 71 per cent that reside elsewhere – mainly in Perth).
Unlike the Bowen-Surat and Hunter basins, the Pilbara region is dominated by conventional gas extraction that is exported from the LNG export terminals within this region: the North West Shelf, Pluto, Gorgon and Wheatstone. This provides the Pilbara more planning time as gas exports are unlikely to face a sharp and early decline as coal.
What could a mining worker in the Pilbara look like?
Works in conventional gas extraction
Employed as a rigger on an offshore gas rig Aged 25- 34
Very likely lives in Perth and works on a rotating two-week FIFO basis
Holds a Certificate II in Drilling Oil/Gas (Offshore) from an RTO
Faces moderate degrees of uncertainty over the next thirty years of his or her career as gas is expected to slowly decline which may see the job market weaken
May not need to change career paths or may need to consider alternative opportunities in an emerging hydrogen economy or less well skilled jobs in Perth
New economic opportunities
From a demographic perspective, there are similar trends to the Hunter and Bowen-Surat communities given the similar extractive industries. Education levels in this labour force are lower than the rest of the state with over 65 per cent of those employed in gas and oil holding a Certificate or below. However, there is a greater diversity of occupations than other fossil fuel dominant regions with just under 40 per cent of these workers acting as technicians, trades workers or machinery operators or drivers.
Additional factors that ease the difficulty of transitioning the workforce include the regional abundance of iron ore, Australia’s largest export product, and other rare earth metals for which demand is expected to increase driven by batteries and other electronics essential for a decarbonised future.
The Pilbara possess strong wind and solar resources which could be utilised for green hydrogen projects or even high voltage direct current (HVDC) cables for direct export to Asia. Exported hydrogen, particularly embodied in ammonia or green steel, would also be able to leverage existing port infrastructure.

43
4.2.5 Future employment trends
Given Australia’s fossil fuel production is driven largely by global markets, it is possible to generate indicative employment scenarios proportional to the change in global demand for each commodity. Whilst this analysis does not consider any other economic, geopolitical or technical factors, Figure 22 illustrates indicative employment trends by commodity in communities in transition under NGFS scenarios. These trends assume that Australia’s production follows global demand from 2020 to 2050 in line with NGFS data (i.e. Immediate 1.5°C Orderly Scenario and Delayed 2°C Disorderly Scenario).
The inevitable transition would occur under both scenarios for approximately 20 years. However, the timing under each scenario has a 10-year difference, which means that risks for communities in transition will be considerably different. An immediate orderly transition would occur from 2020 to 2040, whereas a delayed disorderly transition would mainly occur from 2030 to 2050.
An orderly transition implies a negative 10 per cent compound growth rate of employment over the transition, which may allow communities, industry leaders, investors and relevant stakeholders to adjust and adapt as opposed to a negative 15 per cent compound growth rate under a delayed disorderly scenario. This means that, on average, 75 per cent of existing fossil fuel jobs must transition to another industry sector per decade under a disorderly scenario, which is approximately 8 per cent faster than an orderly scenario. Timing and decreasing rates for specific communities will depend on the relative profitability of specific assets (e.g. cost of extraction/production, transportation costs, etc.).
Figure 22. Indicative employment at communities in transition under Immediate 1.5⁰C Orderly Scenario and Delayed 2⁰C Disorderly Scenario (EY analysis; NGFS, 2020)
Australia has the potential to maintain its current metallurgical coal production under an Orderly scenario, which would have a direct impact on employment projections. However, this would require increasing Australia’s share of global production from 55 per cent in 2020 to 85 per cent by 2030. It is important to note the limited likelihood of maintaining national production levels due to the complexities for individual companies associated with productivity, location of operations, product quality, consolidation of new trading partners, energy content and transportation costs.
Global demand for thermal coal is likely to rapidly shrink in the next 10 years under an Orderly scenario. Due to Australia’s thermal coal quality and robust supply chain, a portion of the jobs could be maintained. However, Australia’s current production would exceed global demand before 2030, entailing job losses across the coal mining industry.
Jobs
(‘00
0)
-96%
0
10
20
30
40
50
2020 2025 2030 2035 20452040 2050
-90%
GasExploration
Metallurgical coal
Value chain
OilThermal coal
2°C1.5°C

44
4.3 The need for a bespoke community resilience approachA general set of principles can be developed for communities in transition to understand, at a high level, the context and economic activities within the region. However, a place-based detailed and bespoke approach is required to unlock job opportunities and empower workers and the community in an equitable transition.
Although the selected communities in transition have multiple similarities with regards to socio-economic factors, each community has its own and unique profile that needs to be understood to assess, manage and minimise exposure during the transition. Figure 23 outlines an adapted framework developed by Frankenberger et al which provides six pillars that aim to assist communities in transition in building resilience and adapting to externalities. Each dimension has a dynamic causal interplay that determines community resilience and capacity over time to adapt and thrive when facing changing socio-economic or environmental context.
Figure 23. Adapted community resilience framework (USAID, 2013)122
The framework illustrates how disruptions and stressors in coal, oil and gas operations would affect tangible and intangible community assets. While disruptions in these sectors would have an impact on community interactions through bonding, bridging and linking social capital, stressors (e.g. political instability, price increases, reduction global demand, etc.) would directly affect tangible assets such as social, human, financial, natural, political and physical capital.
The community resilience framework suggests exploring a coordinated approach that identifies key community social dimensions and areas of collective action, which would enable communities to develop resilient pathways. Examples of interventions include business diversification through entrepreneurship, reskilling and building working capacity, innovation based on local opportunities (digital services, low carbon technology) and promoting community cohesion through arts and cultural events.
The nature of potential interventions would depend on the circumstances of the community and the timing of the transition. For example, the age of the workforce approaching retirement and dynamics in the region. Communities with minimal or inadequate transition pathways in place would be extensively vulnerable to any socio-economic change.
(c) Community assets(b) Exponential change
(a) Context (d) Community social dimensions
(e) Areas of collective action
(f) Reaction to disruptions
(g) Measure Social Outcomes
Social capital
Human capital
Financial capital
Natural capital
Political capital
Physical capital
Awareness
Responsiveness/Flexibility
Learning & Innovation
Self-organisation
Diversity
Inclusion
Aspirations
Improved economic resilience
Improved wellbeing
Improved social capital
Limited economic resilience
Lower wellbeing
Diminishing social capital
Resilience pathway
EXPO
SURE
EXPO
SURE
Disruptions
Stressors
Digital services
Entrepreneurship
Skills development & capacity building
Social & community based events
Social Resilience Index (SRI)
(future work, downturn in mining, etc)
Vulnerability pathway
Bonding Social capital
Bridging Social capital
Linking Social capital
Political
Demographic
Infrastructure
Socio-economic
Environmental
Timing

CASE STUDY: HAZELWOOD CLOSURE, LATROBE VALLEY AUTHORITYLatrobe Valley Authority (LVA) – The LVA aims to catalyse a place-based transition, transformation and long term sustainable prosperity in the Latrobe Valley and Gippsland through four integrated actions to advance regional strengths:
➤ Enable collaborative networks with shared intent through multi-level governance & leadership ➤ Identify and advance areas of competitive advantage ➤ Partner to develop knowledge and skills that align with regional strengths ➤ Facilitate the development and activation of places, spaces and people
This has led to a smart specialisation approach which seeks to utilise the community’s competitive advantage by prioritising innovation investment in the region’s areas of comparative advantage to define a shared strategic vision for innovation in the community. Identified regional strengths include energy, tourism, food and fibre and health and wellbeing. The LVA have created an evidence-based behaviour and system change framework to advance the staged process of program design, delivery and evaluation from which elements can be drawn when transitioning other communities.
45

46
4.3.1 Challenges for communities in transition
Achieving a just transition to a net zero carbon economy is a challenging ambition in the current socio-economic, political and technology landscape, especially in the context of fossil fuels. Through mapping and understanding the challenges for these communities, investors, government and companies can make more informed decisions on how an equitable transition can be achieved in Australia. Engagement with stakeholders including with unions and community groups is a critical part of this process.
Table 8. Key challenges facing communities in transition and the stakeholders involved
Key stakeholder/s involved
Income differential from natural resources to other sectorsThe inherently higher wages in extractive industries due to remote working conditions and high demand for the resources leads to a high likelihood that alternative employment would pay less on average, which is confronting for individuals.
Decrease in quality of working conditionsCoupled with prospective wage reductions is the potential for the casualisation and de-unionisation of workers, which could also see both working conditions and job security decrease in quality.
Lack of skills transferabilityGiven the level of technical specialisation in extractive industries, there is likely to be an inevitable mismatch between the required skills of alternative employment and those possessed by the current workforce.
Economic, emotional and time cost of retrainingA mismatch in skills can drive retraining, however this comes with its own pitfalls – namely the economic, psychological and time costs of retraining.
Employees near the end of their working life are unlikely to retrainThis is applicable to people who may not be inclined to retrain as they are nearing the end of their careers where the cost of retraining may not be justified.
Locational and employee intensity mismatch between new and old jobsEmerging industries are likely to often be in different regions, creating a hurdle for transitioning workers. Additionally, some new industries with lower costs do so through greater labour productivity which results in the need for less workers and hence leaves a human gap in many potential transitions.
Policy pathway to transitionPolicy paralysis in the transition spawns uncertainty, which prevents the correct investment signals from being sent to the private sector and slows the flow of private capital which could be utilised in the transition.
Economic and political costAlthough the long-term benefits of achieving a net zero, resource efficient and inclusive economy outweighs the cost of inaction, there are economic and political costs associated with the transition. Politically, this cost is evident through federal politics where there has been intense scrutiny and stigma around climate policy over the past 15 years.
Gov
Gov Cor
Fin
Gov Cor
ComUni
Gov Cor
ComUni
Gov Com Uni
Gov Com Uni
Gov Cor
Com Fin Uni
Gov Cor
Com Fin Uni
Gov Cor Com Fin UniGovernment Corporate Local Community UnionsFinanciers

47
4.3.2 Opportunities for communities in transition
This section outlines the potential opportunities and relevant stakeholders that are required for designing, developing and implementing adequate transition plans and promoting good job opportunities in the new economy. It is important to note that collaboration between key stakeholders is crucial for the success in the implementation of the strategy. The objective of highlighted opportunities is to diversify local economies to avoid stranded assets and communities during the transition.
Table 9. Key opportunities for communities in transition and the stakeholders involved
Primary stakeholder/s involved
Shifting workers to nearby and/or similar infrastructure owned by the same entityWhere large organisations may own multiple mines, electricity generators, gas wells, refineries, ports or other infrastructure in a similar region, the opportunity may exist for a structured movement of workers from one facility to another where the closure dates are materially different.
Transitioning to renewable electricityTransition workers towards the construction or operational phase of renewable energy generation (e.g. in Renewable Energy Zones). This may be possible where there are sufficient renewable energy resources such as wind, solar or hydro, or existing transmission infrastructure with capacity which is the case in all areas where a large thermal generator comes offline..
Switching to hydrogenAlthough nascent, there are large demand drivers for hydrogen in the longer term, such as in steel making, fertiliser and chemical manufacture, particularly in international export markets. Synergies also exist between existing LNG terminal infrastructure should the hydrogen be exported in the form of ammonia. Current challenges for this opportunity include high production costs and initial investment capital, transport technology and adequate policy signals.
Payouts to employeesFor those nearing retirement age, additional redundancy payouts that cover the remainder of their working life could be implemented. The key barrier to this solution is cost – both the magnitude and who is responsible out of the private and public sector.
Retraining and reskilling to change industriesWhere there is a partial overlap in existing skills between declining and growing industries, there may be opportunities for employers to reskill their workforce. There are various options for the implementation of this such as allowing employees to retrain while still employed in their old occupation or though government-subsidised pathways.
Gov
Cor
Com
Fin
Uni
Gov Fin
Gov Fin
Gov
Cor
Com
Fin
Uni
Gov Cor Com Fin UniGovernment Corporate Local Community UnionsFinanciers
Gov Cor
Fin Uni

48
Worker redeployment and relocationRelocation to different communities or industries can pose severe social and psychological costs or resistance. However, as an option of last resort in many cases, or where certain individuals may already have a desire to move, there is potential for employees to relocate domestically.
Acknowledging contribution of workersThe stigma associated with fossil fuels for environmental reasons can permeate through to the workers who depend on it and who are on the ground driving much of our current energy production. Acknowledging the contribution of these workers would shift the perception of the community and broader workforce, allowing them to embrace change for a green economy rather than imposing psychological stress.
Regional green manufacturing The abundance of renewable energy resources, labour and transportation infrastructure such as rail to ports in many regional communities could present a business and social case for a level of green manufacturing. Repurposing of facilities can provide employment opportunities. Examples include Ampcontrol in the Hunter Valley region, which historically produced electrical systems for mines and has since diversified into helping with road infrastructure and more recently in medical technology during the COVID-19 pandemic.
More detailed community analysisAs stated previously, each community is unique with a different workforce composition, sizes, industries and people. A plan for a fair and equitable net zero transition requires a greater granularity and depth of analysis.
Gov
Cor
Com
Fin
Uni
Com
Gov Cor
Fin
Gov Cor
Com
Gov Cor Com Fin UniGovernment Corporate Local Community UnionsFinanciers
Gov
Cor
Com
Fin
Uni

49
THE ROLE OF INVESTORS IN A JUST TRANSITIONThe call for investment into climate solutions is a unifying theme across public frameworks and corporate commitments for a net zero carbon economy. This section focuses on the role of investors supporting communities during the transition to a net zero future through equitable opportunities and decent work for employees.
Investors can discharge their fiduciary duties123 to beneficiaries by identifying investment opportunities that deliver financial returns and environmental and social benefits in the short, medium and long term. Further, Regulatory guidance from APRA and ASIC outline the risk for investors in breaching their fiduciary duties by neglecting assessment and response to climate-related risks into decision making, strategies and due diligence.
As discussed, there is a role for multiple stakeholders across the economic spectrum to help drive a just transition, including capital providers, companies, government, unions and local communities. There is also a need for strong and productive multi-stakeholder engagement and collaboration, given the evolving and complex challenges involved.
Table 10 provides an overview of indicative roles that each stakeholder can play in a just transition. A common role for all stakeholders includes raising awareness of a just transition during engagement processes with other stakeholders.124
5
Figure 24. Conceptual interconnection between stakeholders required to achieve a just transition
Companies
GovernmentInvestors & Financers
Local community, unions, universities

50
Table 10. Role of each stakeholder in a just transition
Stakeholder Role
Government
➤ Establish initiatives and mechanisms that allow communities in transition to minimise socio-economic impacts during the transition, identify opportunities in a net zero economy, and create decent work and quality jobs. For example, the Blueprint Institute proposed the introduction of the Coal-Generation Phasedown Mechanism (CPM), to be administered by the Clean Energy Regulator and linked to the Emission Reduction Fund and Safeguard Mechanism.125
➤ Provide stable policy signals and regulatory frameworks in accordance with fair and decent job opportunities during the transition, including incorporating just transition considerations in labour standards and regulatory frameworks.
➤ Promote collaboration among all levels of government (i.e. federal, state and local) in the policy development process.
➤ Integrate provisions for a just transition into national plans and policies associated with regional economic growth and social impact during the transition.
Corporates
➤ Develop transition plans based on social impact assessments that identify how and when companies will support employees, contractors and families during the transition.
➤ Engage with affected and potentially affected communities and stakeholders.
Financiers
➤ Work with national and regional authorities, clients and other partners to develop commercial financing products that support a just transition while assisting workers in accessing new opportunities.
➤ Increase the quantity and quality of capital allocated to support transitioning businesses.
Unions
➤ Provide a collective voice for workers impacted by transition policies and by physical impacts of climate change.
➤ Engage with corporates and government to enable multilateral social dialogue and play an active role in the policy design, implementation and evaluation of social outcomes.
➤ Liaise with government and companies to continue promoting fair and decent job opportunities across multiple industry sectors during the transition.
Local community
➤ Engage with government, companies and private sector to communicate challenges, needs and close specific gaps (e.g. training, financial support, relocation).
Institutional investors
➤ Collaborate with other stakeholders to mobilise capital and investments in industries and communities in transition. According to the International Labor Organization (ILO) green investments should “generate decent jobs all along the supply chain, in dynamic, high value-added sectors which stimulate the upgrading of jobs and skills, as well as job creation and improved productivity in more labour-intensive industries that offer employment opportunities on a wide scale.126,127
➤ Discharge fiduciary duties through investment opportunities that deliver financial, environmental and social returns in the long term.
➤ Use shareholder influence to advocate for companies exposed to transition-related risks to effectively assess, plan and deliver an equitable transition.
➤ Participate in local, regional and national social dialogue about decarbonisation and just transition.
➤ Table 12 provides further examples of prudent investor practice in a just transition.

51
5.1 Focus areas for investor actionThis report builds on recent work undertaken by Grantham 128in relation to investor action on a just transition. Informed by this work and supported by consultations with industry leaders, this report explores key focus areas where investors can play a critical role to enable a just transition, including:
➤ Investment strategy and capital allocation – Through their investment strategies, policies and strategic asset allocation investors are increasingly directing institutional capital towards financing a sustainable economy, inclusive of environmental and social issues.
➤ Disclosure – Increasing expectations from shareholders, regulators and stakeholders for companies and investors to utilise robust and comparable reporting frameworks that inform how they are managing climate-related financial risks and opportunities, including material social risks.
➤ Corporate engagement – A process by which investors engage with companies to minimise risk and maximise responsible returns from the companies they invest in. Many investors have engagement or stewardship policies or guidelines that guide their engagement processes which help them in identifying companies to engage with, focus issues, reporting and benchmarking.
➤ Advocacy and partnerships – Advocating for an effective response and establishing partnerships to identify and facilitate investment opportunities in line with the objectives of a just transition, including building resilient communities and economies.
➤ Impact measurement and evaluation – Ensuring long-term value creation for stakeholders, which requires looking for opportunities that capture impact metrics and report social implications, in addition to conventional financial reporting data.
Investment strategy and capital allocation
Impact measurement and evaluation
Corporate engagementDisclosure
Advocacy and partnerships
Investor Action in
a Just Transition
Rather than being siloed, the five focus areas for investor action are heavily interdependent. Investors supporting a just transition should recognise the range of opportunities available.
Several material questions for decision making were identified through the engagement with key stakeholders and investors for this report. Responding to these questions will enable investors to navigate the balance between decarbonisation strategies and community longevity.
Figure 25. Adapted focus areas for investor action to support the just transition

52
Overarching questionsOverarching questions
➤ Will the investment strategy support the creation of resilient communities during and after transitioning to a net zero economy?
➤ During your sustainability materiality assessment, was just transition a material issue at company level? If so, which stakeholders identified it?
➤ What is the firm’s governance structure for the management of just transition (e.g. which senior executive/board committee is responsible and how are they held accountable for that responsibility)?
➤ How do you intend to disclose on just transition within your reporting cycle and use of frameworks (e.g. Global Reporting Initiative, Sustainability Accounting Standards Board standards)?
➤ Does the investee company have a just transition statement or policy with clear KPIs (e.g. no forced redundancies)? What is the planned reporting cycle for this?
Questions at project/asset level
➤ Have you or investee companies established a stakeholder engagement process at community, worker, government, unions, consumers and civil society levels to inform your transition approach?
➤ Have you considered the short, medium and long-time life of this investment given the firm’s transition to net zero (incl. scope 3 emissions) and what the implications are for the workforce for this asset?
➤ Have your investee companies developed a transition approach with a timeline that includes specific aspects such as worker retention, retraining, redundancy payments or community investment? Is it possible to transition existing workforce towards a low-carbon sector?
5.1.1 Supporting communities in transition
Table 11 is a conceptual illustration of how challenges and opportunities for communities in transition correlate with investor focus areas. The ability of investors’ influence will vary from driving and leading to indirect support for addressing challenges and opportunities for the community, which reinforces the need for a multi-stakeholder approach. Further work is required to provide details on how each focus area (and investor action) can specifically support communities to overcome challenges and leverage opportunities.

53
Table 11. Alignment of investor focus areas to challenges and opportunities in communities
Investor Focus Areas
Investment strategy & capital allocation
Disclosure Corporate engagement
Advocacy & partnerships
Impact measurement & evaluation
Challenges for communities in transition
Income differential from natural resources to other sectors
üü
ü
Decrease in quality of working conditions ü ü ü
Lack of skills transferability ü ü ü
Locational and employee intensity mismatch between new and old jobs
ü ü
Policy pathway to transition ü ü ü ü
Opportunities for communities in transition
Shifting workers to nearby and/or similar infrastructure owned by the same entity
ü ü ü
Transitioning to renewable electricity ü ü ü ü ü
Switching to hydrogen ü ü ü ü ü
Payouts to employees ü ü üRetraining and reskilling to change industries
ü ü ü ü
Workforce redeployment ü ü ü
Regional green manufacturing ü ü ü ü
Key:
Direct and indirect influence from investors ü
Strong influence from investors ü

54
5.1.2 The spectrum of stakeholders required to achieve a just transition
There is a role for investors to encourage other stakeholders to act urgently, acknowledging that the degree of influence from investors across stakeholders varies, as shown in Figure 26. Current engagement from different stakeholders is insufficient to guarantee a just transition. Along with company and policy engagement, discussed below, investors have the potential to influence other stakeholders by setting incentives and design requirements to access their capital. Access to finance can include requisites around multi-stakeholder collaboration for transition planning. A harmonised approach across stakeholders will reduce risk and support with the identification of innovative ongoing economic opportunities.
5.2 Investment strategy and capital allocationThrough their investment strategies, policies and strategic asset allocation, investors are increasingly directing institutional capital towards financing a sustainable economy, inclusive of environmental and social issues.129
5.2.1 Shifting capital towards a sustainable future
Investors can proactively seek opportunities to allocate capital towards risk adjusted investment opportunities that support just transition outcomes.
Globally, the shift towards sustainable and ESG-aligned debt financing has grown significantly. For example, between 2018 and 2019 there was a 78 per cent year-on-year increase of sustainable debt issuance, with the market reaching $US465 billion. This included a range of sustainable debt classes from listed green bonds to non-listed loans.130 While this form of debt financing is increasing, there is a need for stringent criteria and taxonomies to avoid misleading information in investment portfolios. Common taxonomies include the Climate Bonds Initiative and the EU Green Taxonomy.
LowLow
High
High
Gov Government Com Local CommunityCor Corporate Fin Financiers
a ju
st t
ran
siti
on
Degree of investors’ influence
Enga
gem
ent
of e
ach
stak
hold
er in
through focus areas
GovCom
FinCor
Com
Fin
Gov
Cor
Uni Unions
Uni
Uni
Lorem ipsum
LowLow
High
High
Gov Government Com Local CommunityCor Corporate Fin Financiers
a ju
st t
ran
siti
onDegree of investors’ influence
Enga
gem
ent
of e
ach
stak
hold
er in
through focus areas
GovCom
FinCor
Com
Fin
Gov
Cor
Uni Unions
Uni
Uni
Lorem ipsum

55
Figure 27. Global debt market figures (2019) and growth of green and sustainable global bonds and loans between 2014 and 2020 (Climate Bonds Initiative)
Overall, Australia has engaged in a broad and growing range of sustainable bonds such as green bonds, social bonds, blue bonds and UN Sustainable Development Goal bonds. However, there are a range of opportunities to fast track these financing mechanisms through ambitious financing strategies towards intentionally allocating capital to achieve a just transition.131
0.0
5.0
10.0
15.0
20.0
25.0
30.0
Australian bond and loan growth
Sustainability-linked loans
Sustainability bonds
Social bonds
Green loans
Green bonds
20142015
20162017
20182019
2020H1
Num
ber
of b
onds
/loa
ns is
sued
Figure 28. Growth of green and sustainable Australian bonds and loans between 2014 and 2020 (Climate Bonds Initiative)
Current ESG and sustainability-linked investments do not explicitly have a requirement related to a just transition. However, by using adequate screening approaches, investors can identify investment opportunities aligned to a just transition. As opposed to traditional screening approaches (i.e. negative, positive, norms-based), thematic screening involves assessing investments against specific criteria to ensure the delivery of social and environmental outcomes. Thematic screening has been supported by 240 Responsible Investment Association Australasia (RIAA) members with more than $9 trillion in assets under management across Australia and New Zealand (not all of which is RIAA certified).
Advocates for implementing investment strategies through the lens of a just transition have stated that there are opportunities to design a sovereign bond focused specifically on accelerating the just transition. This could include initiatives which fund retraining, social support, retirement of workforces and environmental remediation. More specifically:
The global debt market in 2019 (AUD $B)
$598
$255,000
Green*
Total
*Green debt includes green bond and green loan issuance and the global sustainable debt market
0.0
100.0
200.0
300.0
400.0
Valu
e (A
UD
)
Global bond and loan growth
Sustainability bonds
Social bonds
Green loans
Green bonds
20142015
20162017
20182019
2020H1

56
“The next frontier for sovereign bonds is to ringfence proceeds for activities that support a Just transition. This would have a powerful signalling effect across the financial system on the importance of the Just transition…A Just transition sovereign bond would not finance any social activity, but only those linked to climate and the wider ecological transition. This could include workplace and community initiatives in areas that have already seen or will experience a decline in high-carbon sectors. In regions dependent on coal, for example, the World Bank has highlighted that substantial public spending is often needed to fund retraining, enhanced social welfare, early retirement and environmental remediation.” 132
In addition to allocating capital, investors can play an important role in engaging and partnering with government and other stakeholders to develop new financial products that support a just transition.
5.2.2 Place-based context analysis
In assessing targeted investment opportunities in communities in transition, investors should consider engaging early with community stakeholders and undertaking local context analysis to understand existing capabilities and competitive advantages in the region. This can help investors identify strengths and investment opportunities for growth in particular sectors, as well as potential risks and gaps to be addressed. For example, see the Latrobe Valley Authority’s smart specialisation approach which seeks to identify regional strengths (Box 2) and the need for bespoke community resilience approaches (Section 4.3).
The transition to next zero emissions will bring significant new economic opportunities for Australia. To support a just transition, all stakeholders including investors should seek opportunities, from early stages in the development of emerging technologies and projects, to align product and project development with regional opportunities. Including just transition considerations early in the process will also help institutional investors access more robust products at commercial scale. Place based context analysis can support this process.
5.2.3 Investment decisions and ESG integration
Strategic asset allocation (SAA) is a process by which investors allocate capital to asset classes based on their views of their possible long-term returns and build portfolios that emphasise the strongest risk-adjusted returns. SAA has been shown to be one of the key drivers of value for portfolios, particularly over the long-term (10+ years). Given that climate risks are foreseeable, material and actionable now, investors can use SAA to ensure that they are constructing portfolios that will deliver long-term value.
When considering SAA and climate related financial risks, investors typically have several options:
➤ Allocating capital to assets that face fewer climate transition and/or physical risks. This can include assets that are being managed to capitalise on the opportunities of the transition. From an equitable transition perspective, this can also lead to job creation.
➤ Engaging with companies or operators of assets to encourage a robust response to climate change risks and opportunities including emissions reduction, transition planning, and investments in decarbonisation. Engagement can also support workforce reskilling, environmental remediation and community transition planning.
➤ Removing or divesting capital from investments that have significant transition or physical risks or are failing to adequately respond to the risks and opportunities of climate change. While this can be a useful strategy to reduce portfolio level risk, it arguably does not reduce overall economy-wide risks of climate change and may do little to ensure communities have the opportunity to fairly transition.

57
A complementary strategy to SAA is using ESG integration133 as part of an investor’s approach to investment decision making. ESG integration is the process of incorporating environmental, social and governance information into investment decision making. In making investment decisions, Investors should include just transition risks and opportunities as part of ESG integration to inform a long-term view about risk-adjusted returns from different investments, asset classes and industry sectors. Investors can draw on the community assessments and other resources in this report to inform their own assessments of just transition risks and opportunities. Beyond ESG integration, investors can also consider just transition outcomes as part of impact investment approaches.
5.2.4 A mindset shift
While investors are increasingly mainstreaming ESG into whole-of-portfolio decision making, hesitancy still exists due to cognitive inertia, a lack of expertise and the uncertainty that hovers over the credibility of offerings – perceived and actual. Further efforts to update mindsets and increase understanding of the benefits of incorporating just transition factors into the investment process are needed. Accelerating this mindset shift was identified during stakeholder engagement as a challenge for investors, which can be supported in part through education in the investment community. This will help to unlock mainstream capital and increase the portion of investments that address the social dimension of a net zero transition.
5.2.5 Recommendations
➤ Seek opportunities to allocate capital towards risk adjusted investment opportunities that support just transition outcomes.
➤ In making investment decisions incorporate just transition risks and opportunities as part of ESG integration.
➤ Engage early with community stakeholders and undertake local context analysis when assessing investment opportunities in communities in transition.
5.3 DisclosureBased on stakeholder consultation, a large amount of climate-related reporting today is not seen as ‘decision-useful’ or ‘investable’ by investors. As a result, investors may not be effectively informed to make decisions in the best interests of their beneficiaries. Key characteristics of current climate-related reporting of concern to investors includes: a lack of granularity; no quantification of impacts; limited depiction of performance under different climate scenarios; no evaluation of the business model; a lack of clear targets; and no discussion of alternative strategies to mitigate transition risk impacts.134
Additionally, investors are increasingly expecting more coverage and depth from companies on their climate change disclosures. There has been an increasing degree of interest in the international investor community in relation to how companies are adequately aligned with a just transition strategy and framework. However, further work needs to be undertaken to normalise just transition disclosure for investors and companies, and investors can play an active role in this process. Recognising disclosure practice on just transition is still in early stages of development, it is useful to reflect on climate-related investment practice and disclosure examples, drawing insights into related just transition considerations and opportunities to increase coverage of the social elements of climate change.
The case study in Box 3 shows how fund managers are engaging with privately owned portfolio companies to enhance sustainability performance and disclosures, and how investors can start integrating social impact considerations into broader climate change strategies.

58
CASE STUDY: INVESTORS DRIVING SUSTAINABILITY PERFORMANCE AND REPORTING IN INFRASTRUCTURE, IFM IFM Investors’ Australian Infrastructure (AI) Sustainability Initiative aims to drive progress on climate change mitigation and elevate its portfolio companies’ sustainability performance and reporting.
Key objectives of the initiative, which commenced in 2018, are to support AI portfolio companies to advance their sustainability strategy, performance and disclosure, and develop an emissions reduction strategy and target.
With these objectives in mind, IFM hosted an Australian Infrastructure Sustainability Forum in October 2018. The forum brought together sustainability managers from the seven largest companies in its portfolio, representing approximately 90 per cent of the portfolios’ assets under management. The two-day forum aimed to support company representatives to develop sustainability strategy and reporting improvement roadmaps, as well as introduce the Science Based Targets methodology to support companies to set emissions reduction targets and strategies.
The critical public-use infrastructure assets in IFM’s AI portfolio include air and seaports and energy transmission and distribution assets, and they are privately owned. At the time this initiative commenced, sustainability performance disclosures were limited to a discrete set of shareholders and key stakeholders for the majority of the portfolio companies.
Each portfolio company participating in the initiative committed to developing an individual emissions reduction strategy, including targets and pathway projects. These emissions reduction targets were publicly announced and disclosed on IFM’s website in August 2019. Participating companies also agreed to produce a Global Reporting Initiative (GRI)-aligned public sustainability report for FY2018/19 and commit to annual reporting, if they were not doing so already.
This initiative has been the catalyst for annual sustainability data collection across IFM’s portfolio. The data helps to inform IFM’s active approach to managing ESG risks and opportunities across the portfolio.
Encouraging the assets to prepare sustainability reports has served to improve transparency on each asset’s sustainability performance, which aligns with growing stakeholder expectations. IFM will continue working closely with the portfolio companies to monitor and support their emissions reduction targets and public disclosure of their sustainability management strategies and performance.
The targets will be reviewed in 2021 as part of IFM’s work to develop a climate change strategy to give effect to its 2050 net zero commitment. As well as assessing the climate change impact on IFM’s assets, the broader strategy work plan will include some assessments of the impact on working people and their communities as the economy decarbonises to net zero emissions. IFM anticipates these assessments will help to identify opportunities for further engagement with portfolio companies on the social dimensions of climate change in addition to the environmental and economic considerations.

59
A range of climate-related disclosure frameworks, standards and metrics have been developed in recent years to support companies to demonstrate action and report on its alignment to a net zero future. While the number of disclosure opportunities and formats are increasing, it is important to note that there are several overlaps and inconsistencies between expectations of companies, as well as a clear missing link to the critical social component of the transition.
Harmonisation is starting to occur across standards such as the announced merger of the Sustainability Accounting Standards Board (SASB) and International Integrated Reporting Council (IIRC) and the growing momentum of the International Financial Reporting Standards’ (IFRS) sustainability reporting project in response to the broad demand for global sustainability standards.135.
Task Force on Climate-related Financial Disclosure
Sustainability Accounting Standards Board
Science Based Targets initiative
Climate Disclosure Standards Board
Climate Action 100+ Net Zero Benchmark (just transition indicator)
Emission reduction and/or divestment targets
Global Reporting Initiative Carbon Disclosure Project Partnership for Carbon Accounting Financials
Figure 29. Prominent climate change disclosure frameworks and initiatives
In Australia, the data across the fossil fuel industry demonstrates a steady increase in the number of companies reporting over the last few years, and the coverage and quality of their disclosures.136 Large companies have tended to set best practice while non-reporters of ESG issues are outliers.137
Yes
No
Major Oil and Gas Companies With Emissions Reduction Targets
YesNo
Major Coal Companies With Emissions Reduction Targets
0% 20% 40% 60% 80% 100%
GRI
Climate Action 100+
CDSB
SBTi
CDP
TCFD
SASB
Major Coal Companies - Climate Reporting
Companies reporting Companies not reporting
0% 20% 40% 60% 80% 100%
GRI
Climate Action 100+
CDSB
SBTi
CDP
TCFD
SASB
Major Oil and Gas Companies - Climate Reporting
Companies reporting Companies not reporting
Figure 30. Major oil, gas and coal companies’ climate reporting and emission reduction targets based on public disclosures

60
Societal impacts have been largely seen as an externality, or not a core material topic for action and reporting. For this reason, Climate Action 100+ has identified the need to develop a specific just transition measurement for companies to turn their attention to this unmet need. Climate Action 100+ is currently developing just transition indicators for the second round of assessments under its Net Zero Company Benchmark in 2022. This is an important step that can be extended to provide a comparability sense for investors to identify efforts made by companies in implementing just transition strategies.
The social dimension could be integrated in other frameworks, which would allow investors to make more informed decisions in the context of a just transition. For example, further TCFD recommendations could explicitly require this level of reporting by companies.
5.3.1 Investors’ disclosures
In addition to companies, investors and other financial institutions should disclose on just transition considerations, expectations and activities, including disclosure of consultation with affected stakeholders. This disclosure should be included in the investor’s TCFD-aligned reporting where practical, or more broadly in ESG related and sustainability reporting and disclosures.
CASE STUDY: NET ZERO COMPANY BENCHMARK AND JUST TRANSITION, CLIMATE ACTION 100+Climate Action 100+ is the world’s largest investor engagement initiative on climate with over 575 investor signatories. Climate Action 100+ engagement focuses on 167 companies that are some of the world’s largest industrial GHG emitters including emissions across the value chain, and companies which have a significant opportunity to drive a broader net zero economy transition. Investors are supported in the process by five investor networks (AIGCC, Ceres, IGCC, IIGCC, and PRI) who co-founded the initiative and a number of climate data technical experts.
The Climate Action 100+ Net Zero Company Benchmark was developed during 2020 through collaboration and feedback with almost 50 signatory investors, investor network experts, leading climate research and data NGOs and corporate stakeholders to establish indicators that are robust, fair and applicable to local markets and across sectors. The intention is the benchmark will be used to assess the focus companies engaged by the initiative and in doing so, provide signatories with a robust data set to inform engagement and encourage companies to take further steps towards the transition to net zero.
The Benchmark was launched in September 2020 with an initial set of ten indicators spanning ambition, emissions reduction, governance and disclosure. During the development process for the benchmark, the need for the development and inclusion of just transition indicators became clear. Unfortunately, because disclosure on just transition is a relatively nascent area, the initiative was unable to develop a set of robust metrics in time for the first company assessment (released in March 2021).
During late 2020 and early 2021, Climate Action 100+ has worked with global just transition advocates and experts to develop appropriate disclosure requirements and a related scoring approach to be applied during the next reporting cycle (to be assessed during 2022).

61
As discussed, investors may face challenges establishing and disclosing transition plans due to the lack of reporting frameworks on just transition. However, this should not delay investors’ commitments to ensure that just transition considerations are integrated into climate policies and disclosed on where feasible. Further, where there is a lack of data or frameworks, investors should seek opportunities to contribute to their development and implementation. Investor networks such as IGCC can help to facilitate these processes.
Existing tools and data being used by investors in relation to climate change can provide a useful starting point for exploring just transition considerations. For example, the Partnership for Carbon Accounting Financials (PCAF), established in 2015, aims to facilitate the role of the financial industry in driving forward the net zero transition through measuring and disclosing financed emissions. PCAF has developed a robust emissions accounting methodology for asset and equity classes, including listed equity and bonds, project finance, mortgages, commercial real estate, business loans and motor vehicle loans. The interest and growth of PCAF speaks directly to the role that the finance sector plays in deploying capital and aligning portfolios to the objectives of the Paris Agreement.138
Investors and other stakeholders can use this data on financed emissions (as just one example) to dig deeper into associated social risk and opportunities for workers and communities, inform investment decision making and engage with companies and other stakeholder accordingly. Impact measurement and evaluation as a focus area for investor action is explored further below.
1% 4%
52%
3%
40%
Total finance assets reported using PCAF
Africa Asia-Pacific Europe Latin America North America
97 institutionsUS$19.9 Trillion
9%
45%
16%
13%
17%
Breakdown of investor categories
Asset owner/managers Commercial bank
Financial services group Investment bank
Other
Figure 31. Finance assets reported using PCAF and associated categories (PCAF, 2021)
5.3.2 Trend towards mandatory disclosure
The United States, United Kingdom, New Zealand and Hong Kong, among others, have signalled their intention to implement or are currently legislating mandatory climate risk disclosure regimes.139 Other countries or regions are developing or introducing detailed taxonomies to tighten the definition of sustainable investing, including the European Union140 and ASEAN nations141. These approaches will promote greater transparency, increased accuracy and quality of data, assisting investors, companies and regulators to manage climate-related risks and opportunities in the long term.

62
As disclosure practices continue to evolve including through global standards and mandatory disclosure requirements, investors can play an active role in promoting best practice disclosure and ensure just transition considerations are addressed. This includes through corporate engagement on disclosure and engaging in public dialogue and open communication with policymakers and regulators. This example emphasises the interlinkages between the focus areas of investor action.
5.3.3 Recommendations
➤ Consider, implement and disclose on just transition planning, including consultation with affected and potentially affected stakeholders.
➤ Disclose metrics according to the Task Force for Climate-related Financial Disclosure (TCFD) framework, including social and climate-related metrics.
5.4 Corporate engagementOver the last two years, investor expectations have gained momentum for companies to effectively manage the transition by developing and disclosing robust transition plans for workforces and impacted communities.142 Investors expect companies to integrate just transition plans into their overarching climate transition strategy to reach net zero emissions by mid-century. As such, investors should encourage energy and other carbon intensive companies to bring workers, contractors, communities and consumers with them on the journey to net zero in a way that addresses trade-offs and maximises its benefits. This is being done individually by investors but also in groups such as the Climate Action 100+ initiative, where investors engage with listed carbon exposed firms through collaborative engagement.
Corporate engagement on climate risk is generally focused on listed companies across the energy value chain including diversified miners, utilities, oil and gas, and industrials. Investors engage with these companies to better understand how the firms are minimising their exposure to transition risk, particularly with a view to stranded assets, as well as physical and social risk. In the Australian context, given the absence of clear policy from the Australian Federal Government to achieve net zero emissions domestically, corporate engagement is even more critical so that investors can be sure that companies have a flexible, durable strategy to approach the transition under a range of policy and regulatory environments. Investors are also interested in understanding how companies are preparing to capitalise on the opportunities of the transition such as demand for new zero emissions products and services.
In the UK, Royal London Asset Management (RLAM), part of the UK’s largest mutually owned pension and investment company, has engaged with the top seven utilities companies (Centrica, E.ON, EDF, National Grid, RWE, SSE and Scottish Power) to develop just transition strategies and is now asking for formal commitments to be put in place by November 2021. SSE was the first company to announce a formal just transition strategy.143
While divestments from carbon-intensive activities, such as thermal coal mining and coal-fired power stations, are one way companies can address their financial climate risks, simply walking away from these communities is not a real solution. Investors want companies to consider the life cycle of the assets they own, even if they intend to sell them, and engage with workers and communities that will be highly vulnerable to job losses and economic disruption. While some planned asset closures are in the medium-to-long term, investors are conscious that timelines can easily change due to regulatory or policy changes, or geopolitical pressure, so are engaging with companies to ensure they are planning

63
the transition for these communities early and comprehensively. Investors engaging with companies on this topic should encourage corporates to engage with workers and key stakeholders on assessing and disclosing social impacts on the communities through their transition plans. This is also applicable to operations and assets in the domestic and international context, which may include downstream operations such as manufacturing (e.g. smelters), electricity generation and transport.
5.4.1 Investor expectation guidelines
There is an important role for investors to establish and communicate their expectations for companies in relation to addressing and managing climate-related risks. Investors are engaging in detailed engagements with companies on all aspects of the transition to net zero emissions, recognising that the risks and transition pathway differs by sector and firm, and that there will accordingly be different implications for workforces.144
Investors may consider engaging companies on the following topics related to a just transition:
Governance
➤ Acknowledgment of the need for a just transition and company’s planned approach in its disclosures. This may include the development of a just transition policy for the company.
➤ Developing clear governance frameworks for the firm in terms of executive and/or board level responsibility for managing a just transition.
Stakeholder engagement
➤ Disclosing current and planned company engagements with workers and communities as part of its strategic transition planning process. This should also include relevant federal, state and local government bodies, community groups and industry associations.
Disclosure
➤ Assessing and disclosing anticipated workforce and community impacts at asset level, for those assets expected to be closed, sold or affected due to the company’s transition plan.
➤ Conducting and disclosing scenario analysis that includes any changes to planned asset trajectories under different climate scenarios. For example, disclosing whether assets will be closed sooner under different climate scenarios.
Capital allocation
➤ Planned capital allocation in terms of workforce and community impacts. This could include assessment and disclosure of any expected positive impacts of investments in infrastructure, healthcare, education, training and other investments in the community or workers.
➤ Planned capital allocation towards low carbon initiatives in regions affected by the transition.
Advocacy
➤ Disclosure of the company’s engagement with its trade associations on equitable transition.
➤ Disclosure of the company’s engagement with policymakers and other government actors on equitable transition.

64
CASE STUDY: ROYAL LONDON ASSET MANAGEMENTRLAM has publicly stated that they care about just transition in the power sector, because without adequate considerations of the social impacts of accelerating the path to net zero, there is a risk that people will not be willing to make the hard choices needed in order to limit the impacts of climate change, leading to policy delays and uncertainty.
RLAM believes that energy utility companies should develop formal just transition strategies to manage social risk and ensure they continue to deliver good value for society and their investors. Through a stakeholder lens, RLAM identify the following components needed in just transition strategies for energy utility companies:
Workers
➤ Early engagement and ongoing dialogue with workers and unions.
➤ Workers reskilling and redeployment, considering increased roles for renewable energy, electrification and digitisation, grid flexibility and demand management, heat decarbonisation, and energy efficiency.
➤ Provision of good quality new jobs with full adherence to International Labour Organisation (ILO) Core Conventions, e.g. collective bargaining and improving diversity and inclusion.
Community
➤ Early engagement ahead of fossil fuel plant closure and community reinvestment.
➤ Fossil fuel site reuse to maximise retention of good quality jobs and utilise legacy grid infrastructure.
➤ Partnerships with local authorities and communities, including offering community ownership stakes in new renewable energy generation, and collaborations on local energy markets, demand management and efficiency.
Supply chain
➤ Place-based emphasis on suppliers and services for new infrastructure, and seek to add value to communities where they operate.
➤ Supplier standards covering labour, human rights and sustainability e.g. adherence to the UN Global Compact and ILO Core Conventions throughout the supply chain.
Consumers
➤ Energy affordability and fuel poverty alleviation, including energy efficiency and heat decarbonisation, and equitable distribution of system transition costs.
➤ Support for consumers, including vulnerable groups, to actively participate in the energy transition, including onsite generation, storage and demand management.

65
5.4.2 Transition planning
The provision of decent and fair work requires a significant amount of transition planning and engagement with companies as high-emitting activities and associated industries and communities transition. As discussed, thermal coal has the highest likelihood of being phased out in the near term, starting with domestic coal-fired power generation and extending to mining operations for coal exports as global demand declines over the next decade or two. Investors should engage with companies to urgently develop, implement and disclose just transition planning to minimise social impacts and economic disruption in communities in transition. This will also provide learning opportunities to other carbon-intensive industry sectors.
The Australian Council of Trade Unions (ACTU) has proposed a three-step approach that investors and asset managers can leverage to support a just transition: engage, plan and enact. The guidance outlines a list of fundamental elements and KPIs for an orderly closure of high-emitting activities and a just transition for workers and the community, which investors can use to inform engagement with companies,145 including:
➤ Reduce company-wide emissions in line with a commitment to net zero emissions including short- and long-term targets.
➤ Consider the risk workers and communities are exposed to over time with resources allocated to manage this risk and build company resilience.
➤ Deliver decent jobs within the company and its supply chains.
➤ Provide for retention, re-skilling and re-deployment for workers as part of the company’s transformation, rather than forced redundancies.
➤ Assess groups most at risk of unequal impact from decarbonisation including factors such as skills, age, gender and language difficulties.
➤ Drive investment in community economic diversification or renewal.
➤ Where an asset is facing divestment, disposal, closure or restructuring (DDCR) the company should leave the workforce, and the community in which it is located, in a position similar to, or better than, that preceding the DDCR.

66
CASE STUDY: ENGAGING ON TRANSITION PLANS, AWARE SUPERAware Super has been engaging with AGL Board members and executives about the ASX listed utility company’s climate strategy and transition plans for more than five years. This engagement has been direct and through Climate Action 100+.
Just transition objective: ➤ to ensure AGL plans for a just transition to support workers and the community impacted
by the closure of their coal-fired power stations. There is a particular focus on AGL’s coal-fired power station, Liddell, announced to close in 2022, with regards to redeployment and training of workers as well as rehabilitation and repurposing of the site.
This objective sits within broader objectives under Aware Super’s engagement plan to enable AGL’s transition plans, including in relation to:
➤ Governance frameworks for board accountability on climate change
➤ Emissions pathways and interim targets linking AGL’s climate strategy and transition plans to the goals of the Paris Agreement
➤ Executive remuneration plans that incentivize progress on climate-related targets
➤ Enhanced TCFD disclosure to enable testing resilience of AGL’s generation portfolio against possible climate scenarios and
➤ Meaningful investment in renewables, storage and future opportunities to transition the business towards a low carbon economy.
Outcomes: ➤ AGL commitment to not force any workers at Liddell into redundancy by transitioning
workers to its nearby Bayswater generator or offering voluntary redundancy.
➤ Introduced climate-related targets into executive remuneration.
➤ Updated and strengthened scenario analysis to include a 1.5 degree pathway and timeframe to 2050. AGL’s disclosure of additional scenario analysis, encouraged through Aware Super’s direct and collaborative engagement through Climate Action 100+, highlighted that if the energy market transitions more rapidly to limit warming to 1.5 degrees, one of AGL’s coal-fired power plants could close up to 12 years earlier than planned. While the energy market’s exact transition is unknown, this scenario analysis strongly highlights the need for AGL to consider options to transition their generation portfolio towards renewables and initiate impact studies on communities and workers significantly earlier than planned.
Questions related to just transition discussions from the investor perspective:
➤ What planning has AGL completed in terms of impact studies relating to communities and workers who could be impacted by the closure of their coal fired power plants?
➤ What initiatives are in place for workers and the community?
➤ What will be the net employee/worker implications?
➤ Given the current plans for 2035 and 2048 closures – when does the engagement commence with communities and workers to plan for a just transition?
➤ If the energy market transition occurs more rapidly than expected bringing forward the closure of coal-fired power plants, how does AGL plan for the just transition of community and workers?

67
5.4.3 Decent and fair work in clean energy
While much of the corporate engagement focus has been on carbon-intensive industries, it is also important that investors engage broadly with the clean energy sector and other companies to promote fair and decent work and sustainable outcomes in the transition. This may include engagement with companies with a breadth of coverage and influence to support positive outcomes, for example the inclusion of just transition considerations in large retailer supply chain decisions. Investors can also integrate just transition principles and protocols for directly owned assets and ongoing asset management.
There is a risk of companies deploying renewable energy projects that could provide poor employment arrangements in regional and rural areas. For example, the Electrical Trades Union in Queensland indicated that more than 300 casual workers installing solar panels at Shell’s Gangarri solar project near Wandoan in Queensland were terminated with no notification period.146 Further, employees under the new contract were to be paid less and would no longer have travelling allowance. Renewable energy projects are paramount to achieving a net zero emission economy. These projects also need to deliver decent and fair working conditions in line with a just transition.
Recently published resources that investors can utilise to understand potential issues, manage assets and engage with the clean energy sector include:
➤ Ceres guidance on practices for just, equitable and sustainable development of clean energy resources.147
➤ ACTU guidance, Sharing the benefits with workers: A decent jobs agenda for the renewable energy industry, which aims to ensure Australia’s growing renewable energy industries are built on solid employment practices as part of a just transition in the energy sector.148
CASE STUDY: AGL LIDDELL COAL-FIRED POWER STATION TRANSITION PLANAGL’s transition plan for Liddell coal-fired power station
➤ In 2019, AGL announced the closure of its Liddell coal-fired power station to AEMO despite unsuccessful market interventionist pressure from the Australian federal government – one unit in 2022 and the remaining 3 in 2023 in. AGL’s transition plan aims to replace the current four black coal fuelled units with a more diversified and less emissions intensive portfolio requiring a total capital investment of $1,360m with a levelised cost of energy of $83/MWh, which will consist of:
➤ 750MW of gas peaking generation in Newcastle or other NSW sites
➤ 1,600MW of wind and solar generation
➤ Up to 150MW of demand response
➤ 150MW of battery capacity
➤ Upgrading nearby Bayswater coal-fired power station by 100MW
➤ A NSW pumped hydro feasibility study and Liddell synchronous condensers for inertia and reactive power control
In the context of a just transition, AGL’s people plan is much more significant than its infrastructure one. AGL has committed to not force any workers at Liddell into redundancy by transitioning workers to its nearby Bayswater generator or offering generous voluntary redundancy packages for those workers close to retirement age that would rather be paid out.
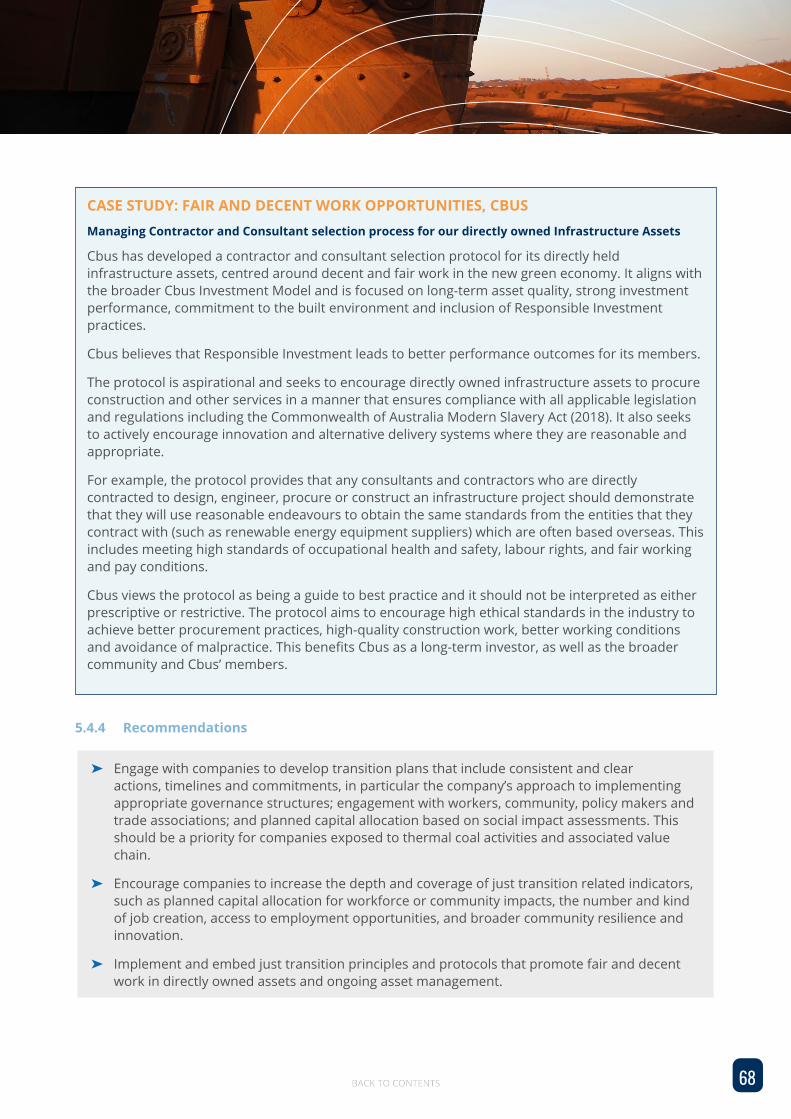
68
CASE STUDY: FAIR AND DECENT WORK OPPORTUNITIES, CBUSManaging Contractor and Consultant selection process for our directly owned Infrastructure Assets
Cbus has developed a contractor and consultant selection protocol for its directly held infrastructure assets, centred around decent and fair work in the new green economy. It aligns with the broader Cbus Investment Model and is focused on long-term asset quality, strong investment performance, commitment to the built environment and inclusion of Responsible Investment practices.
Cbus believes that Responsible Investment leads to better performance outcomes for its members.
The protocol is aspirational and seeks to encourage directly owned infrastructure assets to procure construction and other services in a manner that ensures compliance with all applicable legislation and regulations including the Commonwealth of Australia Modern Slavery Act (2018). It also seeks to actively encourage innovation and alternative delivery systems where they are reasonable and appropriate.
For example, the protocol provides that any consultants and contractors who are directly contracted to design, engineer, procure or construct an infrastructure project should demonstrate that they will use reasonable endeavours to obtain the same standards from the entities that they contract with (such as renewable energy equipment suppliers) which are often based overseas. This includes meeting high standards of occupational health and safety, labour rights, and fair working and pay conditions.
Cbus views the protocol as being a guide to best practice and it should not be interpreted as either prescriptive or restrictive. The protocol aims to encourage high ethical standards in the industry to achieve better procurement practices, high-quality construction work, better working conditions and avoidance of malpractice. This benefits Cbus as a long-term investor, as well as the broader community and Cbus’ members.
5.4.4 Recommendations
➤ Engage with companies to develop transition plans that include consistent and clear actions, timelines and commitments, in particular the company’s approach to implementing appropriate governance structures; engagement with workers, community, policy makers and trade associations; and planned capital allocation based on social impact assessments. This should be a priority for companies exposed to thermal coal activities and associated value chain.
➤ Encourage companies to increase the depth and coverage of just transition related indicators, such as planned capital allocation for workforce or community impacts, the number and kind of job creation, access to employment opportunities, and broader community resilience and innovation.
➤ Implement and embed just transition principles and protocols that promote fair and decent work in directly owned assets and ongoing asset management.

69
5.5 Advocacy and partnershipsAs outlined in previous sections, government plays a fundamental role in a just transition requiring adequate policies, regulatory frameworks, guidelines and labour standards. Targeted government action and policy positions will be necessary to ensure a just transition can be achieved for workforces and communities.
5.5.1 Advocacy for just transition policies
The inclusion of just transition considerations within government policy should be seen as an opportunity – a just net zero transition presents broader and more significant economic and social benefits compared to a net zero transition. Investors can proactively engage in and support policy positions in situations where existing markets are not able to effectively manage the disruption associated with the introduction of climate policies due to market failures and/or other barriers.
Government policy that establishes credible and investable long-term strategies for an orderly and just transition will also improve policy certainty and investors’ ability to mainstream climate solutions and opportunities for communities in transition.
There is an opportunity for investors to advocate for government to design, establish and implement appropriate policy signals in response to environmental and social risks. Investors can support stronger policy action on a just transition through:
➤ Ongoing engagement and participation in policy design processes across federal and state government agencies.
➤ Ensuring that industry associations and members are advocating for the implementation of just transition principles.
➤ Encouraging other businesses to adopt just transition policies in accordance with government policies, guidelines and labour standards.
More specifically, investors can encourage governments to incorporate just transition considerations into existing and new climate policy, especially on industry sectors that will experience rapid and disruptive change. Key elements of just transition considerations embedded in climate policies may include:149
➤ Anticipating changes in advance to enable adjustment.
➤ Empowering communities that are likely to be affected and enabling them to participate in the process.
➤ Investing in the human and social capital and capabilities needed to underpin a just transition, which may include workforce retention, reskilling and re-location to low-carbon industry sectors.
➤ Focusing on the special and place-based dimensions.
➤ Mobilising capital required from public and private investors, including government funding and institutional investors.
Advocacy and participation in the design of government-led policies and initiatives are key enablers to act on other focus areas noted above. As the investor community gains confidence through their involvement in the policy design process, investors would have the ability to make informed decisions when developing investment strategies to mobilise private capital towards opportunities that deliver environmental and social outcomes, which may include establishing Public-Private Partnerships (PPPs).

70
Opportunities at scale
Identifying investment opportunities with sufficient scale to meet the requirements of large institutional investors can be a significant barrier for institutional investment in communities in transition. Private-public partnerships and targeted government policy to aggregate and scale up opportunities in regional communities will help to unlock institutional capital.
For example, Australian state governments are increasingly focusing developing priority clean energy infrastructure and new precincts for strong job creation in regional areas (discussed in Section 3.3). Governments are also planning significant public investment to stimulate economic recovery from Covid-19. Implemented effectively, such policies have the potential to unlock significant private investment towards a just transition.
Investors should engage proactively in the development and implementation of these government policies and transition plans to maximise investment opportunities and positive outcomes for regional communities.
5.5.2 Public-Private Partnerships
The private sector (including investors) has limited capacity alone to tackle a systemic transition to a net zero economy. Partnerships among private sector, government and civil society are useful models to develop large scale projects mainly around infrastructure and technology.
PPPs have been instrumental for the uptake of renewable energy infrastructure due to the benefits of undertaking a risk-sharing approach in relation to capital investment, commercial risk, financial risk, and operations and maintenance. More importantly, public and private assets are exposed to climate-related risks which will be absorbed by local governments and ultimately citizens. Collaboration between public and private entities will help to manage, and in some cases mitigate the exposure to climate-related risks.
PPPs provide the scale and pace of transformation in the energy, transport and other sectors that is required to achieve a net zero future.150 However, investors should encourage public and private stakeholders to structure PPPs in a way that guarantee fair and decent work in the long term for potentially affected communities. The structure of PPPs should consider social outcomes for local businesses, the workforce and customers with a particular focus on improving their capabilities, skills and economic resilience. This could be achieved through accreditation and education programs.
The UN Economic Commission for Europe (UNECE) has identified that a people-first approach will ensure that PPPs underpins social benefits to communities and the workforce given that enhancing the quality of life is a central consideration.151
One of the challenges for investors to support local businesses is the limited scalability of some opportunities, especially when projects involve adoption of new technology and innovation that have not reached the commercialisation stage. There is a need for creating mechanisms that attract investment capital to the community through the aggregation of relatively small investment opportunities associated with low carbon technology or nature-based solutions, for instance. This may require the involvement of multiple investors with different risk/return profiles such as philanthropists, impact investors, government and institutional investors. Local governments and financiers will play a pivotal role in developing and promoting these mechanisms.
In additional to public-private partnerships, investors should think outside the box to identify collaboration opportunities for partnerships and investment opportunities. For example, education providers in a firm’s portfolio could help to address skills gaps in communities in transition.

71
CASE STUDY: MEDICAL FUND PARTNERSHIP, HESTAThe Medical Research Commercialisation Fund (MCRF) and Biomedical Translation Fund (BTF) have demonstrated the effectiveness of collaborative private and public investment. This combined approach has catalysed the commercialisation of biomedical research, in a more efficient way than any one single investor could produce.
HESTA’s partner, Brandon Capital, has been the beneficiary of these funding models. The input from the public sector has enhanced the scale of these investments and provided added confidence for private investors.
Brandon Capital is investing in the development and commercialisation of biomedical opportunities that can be truly life changing for patients and all humankind. These include vaccine technologies to increase the viability of wide-scale vaccination programs, as well as treatments to stop the spread of respiratory diseases, such as COVID-19.
The MRCF model created a simple structure where more than 50 Medical Research Institutions and Hospitals could be aligned with $800 million in funding from private and public venture capital. All of this was then coordinated by one specialist fund manager, Brandon Capital. This enabled all parties to focus on their core capabilities.
Existing MRCF model with Brandon Capital
Brandon Capital’s MRCF and BTF programs enables private and public capital to fund the development of cutting-edge technologies that improve health outcomes and build an innovation driven economy, while generating measurable social impact alongside financial returns.
Brandon Capital’s success by utilising the MRCF and BTF programs demonstrates that this partnership approach between government, institutional investors and private equity managers can be replicated for other purposes. The most pressing purpose now is, of course, clean technology advancement and development.
For revolutionary technologies to emerge quickly, they require a program that encourages rapid ideation, prototyping and testing. A program of this nature needs to utilise existing specialised skill sets, instead of building from the ground up; the MCRF model enables this. The MCRF model can coordinate funding, with scientific development and research, and assign the most experienced operations manager to oversee the whole project.
Combined capital investment from private, institutional and public sectors has the capacity to yield the most beneficial outcomes. These will include the government achieving its environmental and social commitments, improving the ecological health of Australia and supporting jobs, and it will enable Venture Capitalists to generate return and value creation in new sectors.
Collaboration between 50+ Medical
Research Institutes
and Hospitals
$800m+ Venture
Capital fund
ManagerBRANDON CAPITAL
PARTNERS

72
5.5.3 Recommendations
➤ A dvocate for action towards a just transition by engaging with policy makers and supporting inclusive government initiatives that reduce uncertainty and speculation in capital markets.
➤ Participate in collaborative initiatives to ensure just transition outcomes.
➤ Encourage mechanisms that enable the aggregation of smaller investment opportunities in local economies to attract capital from investors.
➤ De-risk investments by seeking to partner with government, impact investors or other organisations with the objective of mobilising investment capital towards just transition solutions.
5.6 Impact measurement and evaluation Considering social impacts is an important element of responsible investment. This is because they can affect the value of an individual investment, whether it’s a company, property, infrastructure asset or another type of investment, in turn affecting the long-term returns to beneficiaries.
Investors should build on existing impact measurement and evaluation approaches across the investment process to consider positive and negative outcomes for workers and communities in the transition to net zero emissions. For example, investors are already measuring and evaluating exposure and responses to climate risk and opportunities. Where appropriate, just transition considerations should be integrated into this. A step in this process may be looking at how the investment firm’s approach to measuring and evaluating social impacts, for example through the UN Sustainable Development Goals or other frameworks, can be integrated with the firm’s climate policy and strategy through a just transition lens.
The detailed community level assessments in this report provide useful examples of relevant challenges and opportunities for Australian communities in transition. These also emphasise the need for place-based assessments and responses to unlock opportunities and empower workers and communities. Investors can draw on these examples to inform their own assessments of just transition risks and opportunities.
This assessment process can inform priority areas of focus through investment, corporate engagement and policy, partnerships and advocacy such as those discussed in this report. After assessing exposure and priority areas, investors should monitor and evaluate activities and outcomes in relation to these just transition priorities and disclose on these activities where appropriate.
5.6.1 Impact measurement, evaluation and reporting frameworks
While impact measurement and evaluation are an increasingly prominent part of responsible investment including in relation to climate change, clear processes for applying a just transition lens are still emerging and more work is required. A lack of understanding and information on just transition issues from companies and other stakeholders is a barrier for investor’s measurement and evaluation processes.
Despite these challenges, existing resources, standards and guidelines can be used to establish processes for measuring and evaluating just transition outcomes. For example, investors are using frameworks such as the UN Principles for Responsible Investment Reporting Framework152, Investing with SDG Outcomes153 and the Sustainable Development Investing (SDI) Asset Owner Platform154 to support decision making to achieve positive outcomes.

73
The UN Sustainable Development Goals (SDGs) are widely accepted by governments and asset owners. They are useful for investors because they provide defined indicators that can be used to measure and report on the activities of asset issuers. SDG eight – decent work and economic growth – and SDG 13 – climate action – are particularly relevant for just transition outcomes, as well as several other UN SDGs (see Figure 32). Supporting the direct achievement of these two SDGs through a just transition will also indirectly support several other SDGs with similar linkages and outcomes.
It is also important to recognise that SDG 17 – partnerships for the goals – directly aligns to the need for multi-stakeholder engagement to achieve a just transition as outlined throughout this report.
More recently, the four major global accounting firms and the World Economic Forum released a set of ESG evaluation and reporting metrics organised around four key pillars – governance, planet, people and prosperity.155 The metrics aim to align with existing disclosure standards and lead to a more cohesive reporting system for ESG metrics.
Investors should consider the UN SDG indicators and other existing standards and emerging just transition resources in their approach to climate change and just transition assessment, evaluation and engagement.
Figure 32. SDGs in a just transition156

74
5.6.2 Impact investment
The impact investment market in Australia tripled from 2017 to 2019 with nine out of 10 investors believing that impact investment will become a more significant component of traditional investment within the next five years. RIAA estimates that Australian investors are anticipated to increase allocation of capital towards impact investing to $100 billion by 2025, which is a fivefold increase from current market size.157
Figure 33. Size and growth of the Australian impact investment market (Impact Investment Group, 2020)
In the context of a just transition, there is an opportunity for investors to seek market opportunities attached to specific social impacts, which interlink climate change, biodiversity protection and fair and decent work for communities in transition. While all investments may not be classified as impact investments, it is expected that demand for and issuance of social impact bonds, transition bonds and green bonds will continue to increase. Investors have a role to play in communicating to companies the objectives and investment mandates related to non-financial outcomes. This would provide guidance to companies in developing bespoke impact measurement and evaluation frameworks in accordance with what investors seek.
5.6.3 Promoting a just transition lens
Recognising further work is needed, investors should take proactive steps to address data gaps and other barriers to measurement and evaluation of just transition considerations and outcomes. For example, by engaging with companies and other stakeholders to adopt adequate frameworks and provide the data required for investors to assess how just transition priorities are being managed and to promote positive outcomes for a just transition. Investors can also contribute to public forums to build industry-wide awareness and adoption frameworks and approaches used.
The Australian impact investment market (AUD $B)
$6
$20
2017
2019

75
5.6.4 Recommendations
➤ Engage with companies and other stakeholders to adopt adequate frameworks and provide data required for investors to assess how just transition risks and opportunities are being managed.
➤ Consider existing resources and frameworks such as the UN Sustainable Development Goals, human rights and labour standards, and emerging just transition guidance and benchmarks to inform measurement and evaluation metrics.
➤ Assess and monitor positive and negative outcomes for workers and communities associated with the transition to net zero emissions to identify risks, opportunities and just transition priorities.
➤ Monitor and evaluate your firm’s activities and outcomes related to just transition risks and opportunities.
5.7 Summary of recommendations by focus areaInvestors cannot support the just transition alone – multi-stakeholder engagement and collaboration are critical to ensure that the scale of change required can be accomplished from a community perspective, government priorities, private sector actions and investor capital deployment and management.
Investors should implement a considered response to understanding and supporting a just transition. Table 12 provides a summary of practical recommendations to inform investor practice in a just transition. These recommendations are not intended to be prescriptive. Rather they are a toolkit of tangible actions investors can take to support a just transition. The guidance outlined in Section 5 provides supporting context, resources and case studies underpinning these recommendations. This resource will evolve over time to incorporate new developments and flesh out further examples of how these actions can be applied in practice.

76
Table 12. Investor practice in a just transition to a net zero economy
Investor practice in a just transitionActions investors should consider include:
Investment strategy and capital allocation
1. Seek opportunities to allocate capital towards risk adjusted investment opportunities that support just transition outcomes.
2. In making investment decisions incorporate just transition risks and opportunities as part of ESG integration.
3. Engage early with community stakeholders and undertake local context analysis when assessing investment opportunities in communities in transition.
Disclosure
4. Consider, implement and disclose on just transition planning, including consultation with affected and potentially affected stakeholders.
5. Disclose metrics according to the Task Force for Climate-related Financial Disclosure (TCFD) framework, including social and climate-related metrics.
Corporate engagement
6. Engage with companies to develop transition plans that include consistent and clear actions, timelines and commitments, in particular the company’s approach to implementing appropriate governance structures; engagement with workers, community, policy makers and trade associations; and planned capital allocation based on social impact assessments. This should be a priority for companies exposed to thermal coal activities and associated value chain.
7. Encourage companies to increase the depth and coverage of just transition related indicators, such as planned capital allocation for workforce or community impacts, planned capital allocation for workforce or community impacts, the number and kind of job creation, access to employment opportunities, and broader community resilience and innovation.
8. Implement and embed just transition principles and protocols that promote fair and decent work in directly owned assets and ongoing asset management.
Advocacy and partnerships
9. Advocate for action towards a just transition by engaging with policy makers and supporting inclusive government initiatives that reduce uncertainty and speculation in capital markets.
10. Participate in collaborative initiatives to ensure just transition outcomes.11. Encourage mechanisms that enable the aggregation of smaller investment
opportunities in local economies to attract capital from investors.12. De-risk investments by seeking to partner with government, impact investors or
other organisations with the objective of mobilising investment capital towards just transition solutions.
Impact measurement and evaluation
13. Engage with companies and other stakeholders to adopt adequate frameworks and provide data required for investors to assess how just transition risks and opportunities are being managed.
14. Consider existing resources and frameworks such as the UN Sustainable Development Goals, human rights and labour standards, and emerging just transition guidance and benchmarks to inform measurement and evaluation metrics.
15. Assess and monitor positive and negative outcomes for workers and communities associated with the transition to net zero emissions to identify risks, opportunities and just transition priorities.
16. Monitor and evaluate your firm’s activities and outcomes related to just transition risks and opportunities.

77
6 CONCLUSIONAs the world transitions to a net zero economy, Australia is at a critical juncture to reconsider climate commitments ahead of COP26 in November 2021. The climate zeitgeist, with an emphasis on a just transition, has further come to the forefront with US President Joe Biden taking a leading position on climate action and signing numerous executive orders, including one in relation to revitalising energy communities, with the objective of seeing workers in transition as veterans, not villains.
A just transition is of the upmost importance in the coming years for Australia as we face this rapidly changing world. A combination of climate action and social inclusion, which ultimately can create decent and quality jobs, net zero emissions and thriving communities, should be a priority for investors, the Federal Government and all stakeholders. The exploration of social implications relating from emission reduction pathways requires more and urgent attention, as well as leadership and action.
Australia’s energy production, consumption and exports have been historically dominated by fossil fuels and this continues to be the case despite the growing penetration of renewable energy and electrification of previously non-electric energy consumption. Moving forward, as Australia continues to transition, the fossil fuel industry faces a range of domestic and international drivers which have the potential to adversely impact some communities, especially as the world inevitably transitions toward the Paris Agreement goal of net zero emissions.
Some Australian communities will undergo a major transition in the coming decades as decarbonisation diminishes the demand for coal, oil and gas. In addition to managing economic, environmental and social risks, unlocking new opportunities in line with a net zero carbon economy is crucial to ensure a just transition where affected workers and communities are prioritised and supported.
While governments play a critical role in leading a just and equitable transition towards net zero emissions, there are numerous actions that investors should consider to support positive social impact, and avoid workers and communities being left behind.
Through undertaking the analysis of this report and engaging with key stakeholders, IGCC acknowledges that the conversation around a just transition needs to be prioritised and requires further work to support communities in transition, including:
➤ Detailed community level analysis to identify bespoke long-term opportunities for communities in transition. The results of the analysis should provide key insights to investors in relation to socio-economic implications in the context of a just transition, which would allow investors to make informed investment decisions (e.g. understanding social implications when considering divesting from fossil fuels assets).
➤ Collaborative development of a consistent impact measurement and evaluation frameworks that fully capture value creation across environmental and social aspects, including the identification of ultimate beneficiaries (e.g. workforce, local businesses and communities in transition).
➤ Extend social considerations to other industry sectors that are likely to be impacted by climate-related risks. Coal, oil, gas and associated downstream activities are likely to face transition risks related to climate policy, technology development and changes in global demand. However, other industry sectors that are key employment sources across Australia and New Zealand will be exposed to physical climate-related risks (e.g. severe weather events, ocean acidification and sea level rise) resulting in adverse social impacts in regional areas. Key sectors include agriculture, tourism, construction and transport infrastructure.
To achieve a just transition, a multi-stakeholder approach between state actors, the private sector, industry groups, communities and investors is necessary. A harmonised and coordinated approach would see Australia take significant steps forward to a just transition.

78
REFERENCES
1 IGCC, ‘Coal, Carbon and the Community, Investing in a Just transition’, https://igcc.org.au/wp-content/uploads/2020/06/Coal-Carbon-and-Community_FINAL.pdf, (2017)
2 IGCC, ‘IGCC Policy Briefing’, https://igcc.org.au/wp-content/uploads/2020/11/IGCC-Policy-brief_USelection_Nov2020_FINAL_3.pdf, (2020)
3 Energy & Climate Intelligence Unit, ‘Net Zero Tracker’, https://eciu.net/netzerotracker, (2021)
4 Department of Industry, Science, Energy and Resources, ‘Australian Energy Update 2020’ https://www.energy.gov.au/publications/australian-energy-update-2020 (2020)
5 Department of Industry, Innovation and Science, ‘Resources and Energy Quarterly’ https://publications.industry.gov.au/publications/resourcesandenergyquarterlyjune2019/index.html (2019)
6 IEEFA, ‘Over 100 and Counting’, https://ieefa.org/finance-exiting-coal/ (2020). IEEFA defines globally significant financial institutions as banks and insurers / reinsurers with AUM>US$10billion. IEEFA defines globally significant asset managers / owners as having assets under management (AuM) greater than US$50 billion.
7 Net Zero Asset Managers Initiative, https://www.netzeroassetmanagers.org/ (2020)
8 Clean Energy Council, ‘Report 2021’, https://www.cleanenergycouncil.org.au/resources/resources-hub/clean-energy-australia-report (2021)
9 Ditto
10 Australian Government, ‘Australia’s National Hydrogen Strategy’, https://www.industry.gov.au/sites/default/files/2019-11/australias-national-hydrogen-strategy.pdf (2019))
11 Australian Government, ‘Market opportunities for critical minerals’, https://www.industry.gov.au/data-and-publications/australias-critical-minerals-strategy/market-opportunities-for-critical-minerals (2018)
12 MCA, ‘Critical minerals: investment opportunities in Australia’, https://minerals.org.au/sites/default/files/Critical%20minerals_MCA_FINAL.pdf (2019)
13 Principles for Responsible Investment, ‘The modern interpretation of fiduciary duty’, https://www.unpri.org/fiduciary-duty/the-modern-interpretation-of-fiduciary-duty/6538.article (2020)
14 See APRA draft Prudential Practice Guide CPG 229 Climate Change Financial Risks (CPG 229), https://www.apra.gov.au/consultation-on-draft-prudential-practice-guide-on-climate-change-financial-risks (2021)
15 See, for example, RG 247 effective disclosure in an operating and financial review; RG 228 Prospectuses: Effective disclosure for retail investors; Report 593 Climate risk disclosure by Australia’s listed companies.
16 ASX Corporate Governance Principles and Recommendations 4th Edition (February 2019), Recommendation 7.4
17 UN PRI, ‘Statement of Investor Commitment to Support a Just transition on Climate Change’, https://www.unpri.org/download?ac=10382 (2018)
18 Blackrock, ‘Climate risk and the transition to a low-carbon economy’, https://www.blackrock.com/corporate/literature/publication/blk-commentary-climate-risk-and-energy-transition.pdf
19 REMPLAN; Australian Bureau of Statistics, 2016 Census; Australian Bureau of Statistics, 2020
20 NGFS, REMPLAN, EY analysis
21 NGFS, ‘NGFS climate scenarios for central banks and supervisors’, https://www.ngfs.net/sites/default/files/medias/documents/820184_ngfs_scenarios_final_version_v6.pdf (2020)
22 Nick Robins, Vonda Brunsting and David Wood, ‘Climate change and the just transition: A guide to investor action’, p.13, Grantham Research Institute, https://www.lse.ac.uk/granthaminstitute/wp-content/uploads/2019/02/Investing-in-a-just-transition-in-the-UK_Full-policy-report_40pp-2.pdf (2018)
23 ESG Integration is the explicit and systematic inclusion of ESG issues in investment analysis and investment decisions, including investment strategies and mandates. See further UN PRI, what is ESG integration: https://www.unpri.org/fixed-income/what-is-esg-integration/3052.article (2018)
24 IGCC, ‘Coal, Carbon and the Community, Investing in a Just transition’, https://igcc.org.au/wp-content/uploads/2020/06/Coal-Carbon-and-Community_FINAL.pdf, (2017)
25 Grantham Research Institute, ‘investing in a just transition – global project’, https://www.lse.ac.uk/granthaminstitute/investing-in-a-just-transition-global-project/

79
26 Nick Robins, Vonda Brunsting and David Wood, ‘Climate change and the just transition: A guide to investor action’, p.13, Grantham Research Institute, https://www.lse.ac.uk/granthaminstitute/wp-content/uploads/2019/02/Investing-in-a-just-transition-in-the-UK_Full-policy-report_40pp-2.pdf (2018)
27 Grantham Research Institute, ‘Dozens of banks, investors and institutions commit to financing a just transition for the UK’ https://www.lse.ac.uk/granthaminstitute/news/dozens-of-banks-investors-and-institutions-commit-to-financing-a-just-transition-for-the-uk/ (2020)
28 World Resources Institute, ‘Just transition and equitable climate action resource centre’, https://www.wri.org/just-transitions
29 European Commission, ‘The Just Transition Mechanism: making sure no one is left behind’, https://ec.europa.eu/info/strategy/priorities-2019-2024/european-green-deal/actions-being-taken-eu/just-transition-mechanism_en (2020)
30 UN Global Compact Network Australia, National Australia Bank and UTS Institute for Sustainable Futures, ‘Just transition: Implications for the Corporate Sector and Financial Institutions in Australia’, https://unglobalcompact.org.au/wp-content/uploads/2020/10/2020.10.28_Just-Transition-Report_Final.pdf (2020)
31 WA Government, ‘ Collie’s Just Transition Plan’, https://www.wa.gov.au/government/publications/collies-just-transition-plan (2020)
32 NSW Government, ‘Royalties for rejuvenation: funding the future for coal mining communities’, https://www.treasury.nsw.gov.au/sites/default/files/2021-04/John%20Barilaro%20Dominic%20Perrottet%20med%20rel%20-%20Royalties%20for%20Rejuvenation%20funding%20the%20future%20for%20coal%20mining%20communities.pdf (2021)
33 IGCC, ‘IGCC Policy Briefing’, https://igcc.org.au/wp-content/uploads/2020/11/IGCC-Policy-brief_USelection_Nov2020_FINAL_3.pdf (2020)
34 Energy & Climate Intelligence Unit, ‘Net Zero Tracker’, https://eciu.net/netzerotracker (2021)
35 World Economic Forum (2020), World Resources Institute (2020), Climate Tracker (2021)
36 Powering Past Coal Alliance, PPCA Global Summit 2021, https://www.poweringpastcoal.org/summit-2021 (2021)
37 Powering Past Coal Alliance, https://www.poweringpastcoal.org/members (2021)
38 See Figure 6. 2019 exports per fossil fuel type by destination country in million AUD 2019 (Department of Industry, Science, Energy and Resources, 2020)
39 Australian Energy Market Commission, ‘Generator three-year notice of closure’, https://www.aemc.gov.au/rule-changes/generator-three-year-notice-closure (2018)
40 Principles for Responsible Investment, ‘The modern interpretation of fiduciary duty’, https://www.unpri.org/fiduciary-duty/the-modern-interpretation-of-fiduciary-duty/6538.article (2020)
41 APRA, ‘Prudential practice guide’, Draft CPG 229 Climate Change Financial Risks (apra.gov.au) (2021)
42 ASIC, ‘Climate Change’ https://www.asic.gov.au/about-asic/news-centre/speeches/climate-change/ (2018)
43 RBA, ‘Financial Stability Risks From Climate Change’, https://www.rba.gov.au/publications/fsr/2019/oct/box-c-financial-stability-risks-from-climate-change.html (2019)
44 IGCC, ‘2020 Net zero Investment Survey’, https://igcc.org.au/wp-content/uploads/2020/10/Oct2020__Final-IGCC-Net zero-Investment-Report.pdf (2020)
45 The definition of a just transition presented in this report is aligned with definitions set out by global organisations, including United Nations Framework Convention on Climate Change, International Trade Union Confederation, International Labour Organization and the International Institute for Sustainable Development
46 UNFCCC, Paris Agreement, https://unfccc.int/sites/default/files/english_paris_agreement.pdf (2015)
47 UN Global Compact Network Australia, National Australia Bank and UTS Institute for Sustainable Futures, ‘Just transition: Implications for the Corporate Sector and Financial Institutions in Australia’, https://unglobalcompact.org.au/wp-content/uploads/2020/10/2020.10.28_Just-Transition-Report_Final.pdf (2020)
48 UN PRI, ‘Statement of Investor Commitment to Support a Just transition on Climate Change’, https://www.unpri.org/download?ac=10382 (2018)
49 BlackRock, ‘Climate risk and the transition to a low-carbon economy’, https://www.blackrock.com/corporate/literature/publication/blk-commentary-climate-risk-and-energy-transition.pdf (2021)
50 Climate Action 100+, ‘2020 Progress Report’, https://www.climateaction100.org/progress/progress-report/ (2020)
51 Climate Bond Initiative, ‘Financing Credible Transitions (White Paper)’, https://www.climatebonds.net/resources/reports/financing-credible-transitions-white-paper (2020)
52 RLAM, ‘Expectations for energy utilities’ Just transition’ strategies’, https://www.rlam.co.uk/institutional-investors/our-views/2020/expectations-for-energy-utilities-just-transition-strategies/ (2020).

80
53 Grantham Research Institute, ‘Dozens of banks, investors and institutions commit to financing a just transition for the UK’ https://www.lse.ac.uk/granthaminstitute/news/dozens-of-banks-investors-and-institutions-commit-to-financing-a-just-transition-for-the-uk/
54 European Commission, ‘The Just Transition Mechanism: making sure no one is left behind’, https://ec.europa.eu/info/strategy/priorities-2019-2024/european-green-deal/actions-being-taken-eu/just-transition-mechanism_en, (2020)
55 Robins et al., ‘Investing in a just transition in the UK’, Grantham Research Institute, https://www.lse.ac.uk/granthaminstitute/wp-content/uploads/2019/02/Investing-in-a-just-transition-in-the-UK_Full-policy-report_40pp-2.pdf (2019)
56 Global Recovery Observatory, University of Oxford, UN Environment programme, ‘Are we building back better?’, https://wedocs.unep.org/bitstream/handle/20.500.11822/35281/AWBBB.pdf (2021)
57 Ditto
58 Ditto
59 Clean Energy Council, ‘Report 2021’, https://www.cleanenergycouncil.org.au/resources/resources-hub/clean-energy-australia-report (2021)
60 Ditto
61 S&P Global, ‘ESG funds beat out S&P500 in 1st year of COVID-19; how 1 fund shot to the top’, https://www.spglobal.com/marketintelligence/en/news-insights/latest-news-headlines/esg-funds-beat-out-s-p-500-in-1st-year-of-covid-19-how-1-fund-shot-to-the-top-63224550 (2021).
62 EY, ‘How will ESG performance shape your future’, https://assets.ey.com/content/dam/ey-sites/ey-com/en_gl/topics/assurance/assurance-pdfs/ey-global-institutional-investor-survey-2020.pdf (2020)
63 IGCC, ‘2020 Net zero Investment Survey’, https://igcc.org.au/wp-content/uploads/2020/10/Oct2020__Final-IGCC-Net zero-Investment-Report.pdf (2020)
64 Clean Energy Council, ‘Report 2021’, https://www.cleanenergycouncil.org.au/resources/resources-hub/clean-energy-australia-report (2021)
65 MCA, ‘Critical minerals: investment opportunities in Australia’, https://minerals.org.au/sites/default/files/Critical%20minerals_MCA_FINAL.pdf (2019)
66 Australian Government, ‘Market opportunities for critical minerals’, https://www.industry.gov.au/data-and-publications/australias-critical-minerals-strategy/market-opportunities-for-critical-minerals (2018)
67 MCA, ‘Critical minerals: investment opportunities in Australia’, https://minerals.org.au/sites/default/files/Critical%20minerals_MCA_FINAL.pdf (2019)
68 AEMO, ‘2020 Integrated System Plan’, https://aemo.com.au/en/energy-systems/major-publications/integrated-system-plan-isp/2020-integrated-system-plan-isp (2020)
69 AGL, ‘AGL Climate Statements and Commitments’, https://www.agl.com.au/-/media/aglmedia/documents/about-agl/asx-and-media-releases/2020/climate-statement-and-commitments-300620.pdf?la=en&hash=EBDA051D480ABE11F5C5D29B96D7276F&hash=EBDA051D480ABE11F5C5D29B96D7276F (2020)
70 Energy Australia, ‘EnergyAustralia powers ahead with energy transition’ https://www.energyaustralia.com.au/about-us/media/news/energyaustralia-powers-ahead-energy-transition (2021)
71 AEMO, ‘Gas Statement of Opportunities’, https://aemo.com.au/en/energy-systems/gas/gas-forecasting-and-planning/gas-statement-of-opportunities-gsoo (2020)
72 IEEFA, ‘Over 100 and Counting’ https://ieefa.org/finance-exiting-coal/, (2020). IEEFA defines globally significant financial institutions as banks and insurers / reinsurers with AUM>US$10billion. IEEFA defines globally significant asset managers / owners as having assets under management (AuM) greater than US$50 billion.
73 GCC, ‘Coal, Carbon and the Community’ https://igcc.org.au/wp-content/uploads/2020/06/Coal-Carbon-and-Community_FINAL.pdf (2017)
74 Climate League, https://climateleague.org.au/, (2020)
75 IEFFA, ‘Finance is leaving thermal coal’, https://ieefa.org/finance-leaving-thermal-coal/, (2020)
76 QBE Insurance Group Limited, ‘Energy Policy’, https://www.qbe.com/-/media/group/sustainability/group-energy-policy.pdf
77 APRA, ‘Consultation on draft Prudential Practice Guide on Climate Change Financial Risks’, https://www.apra.gov.au/consultation-on-draft-prudential-practice-guide-on-climate-change-financial-risks (2021)
78 Australian Government, ‘Australia’s 2030 Emission Reduction Target’, https://www.pmc.gov.au/sites/default/files/publications/Summary%20Report%20Australias%202030%20Emission%20Reduction%20Target.pdf, (2017)
79 Australian Government, ‘Australia’s climate change strategies’ https://www.industry.gov.au/policies-and-initiatives/australias-climate-change-strategies, (2021)

81
80 IPCC, ‘Special report: Global warming of 1.5⁰C’, https://www.ipcc.ch/site/assets/uploads/sites/2/2019/05/SR15_SPM_version_report_LR.pdf, (2018)
81 Climate Change Authority, ‘Final report on Australia’s future emissions reduction targets’, https://www.climatechangeauthority.gov.au/news/final-report-australias-future-emissions-reduction-targets (2015)
82 VIC Government, ‘Climate plan to cut emissions and create jobs’, https://www.premier.vic.gov.au/climate-plan-cut-emissions-and-create-jobs, (2021); Victoria State Government, ‘Victoria’s renewable energy targets’, https://www.energy.vic.gov.au/renewable-energy/victorias-renewable-energy-targets (2021)
83 QLD Government, ‘Queensland Climate Transition Strategy’ https://www.qld.gov.au/__data/assets/pdf_file/0026/67283/qld-climate-transition-strategy.pdf (2017); Queensland Government, ‘Powering Queensland Plan’, https://www.epw.qld.gov.au/__data/assets/pdf_file/0014/16016/powering-queensland-plan.pdf (2017)
84 NT Government, ‘Climate change response: towards 2050’, https://depws.nt.gov.au/programs-and-strategies/climate-change-response-towards-2050 (2020); Northern Territory Government, ‘Roadmap to renewables’, https://roadmaptorenewables.nt.gov.au/implementation#:~:text=The%20Northern%20Territory%20Government%20recognises,electricity%20for%20consumers%20and%20taxpayers (2018)
85 NSW Government, ‘Net zero plan Stage 1: 2020-2030’, https://www.environment.nsw.gov.au/-/media/OEH/Corporate-Site/Documents/Climate-change/net zero-plan-2020-2030-200057.pdf?la=en&hash=D65AA226F83B8113382956470EF649A31C74AAA7 (2020)
86 Western Australian Government, ‘ WA Climate Change Policy’, https://www.wa.gov.au/service/environment/environment-information-services/western-australian-climate-change-policy (2020)
87 SA Government, ‘Climate Smart’, https://www.environment.sa.gov.au/topics/climate-change/south-australias-greenhouse-gas-emissions (2020); Clean Energy Council, ‘South Australia sets plan for 100% renewable energy’, https://www.cleanenergycouncil.org.au/news/south-australia-sets-plan-for-100-per-cent-renewable-energy (2020)
88 TAS Government, ‘Reducing emissions’, http://www.dpac.tas.gov.au/divisions/climatechange/Climate_Change_Priorities/reducing_emissions#:~:text=Climate%20Change%20Priorities%20%3E-,Reducing%20emissions,zero%20net%20emissions%20by%202050 (2020); Tasmanian Government, ‘Renewable energy target to deliver for Tasmania’, http://www.premier.tas.gov.au/site_resources_2015/additional_releases/renewable_energy_target_to_deliver_for_tasmania (2020)
89 ACT Government, ‘ACT Climate change strategy 2019-25’, https://www.environment.act.gov.au/__data/assets/pdf_file/0003/1414641/ACT-Climate-Change-Strategy-2019-2025.pdf/_recache (2020); Clean Energy Australia, ‘Clean Energy Australia Report 2020’, https://assets.cleanenergycouncil.org.au/documents/resources/reports/clean-energy-australia/clean-energy-australia-report-2020.pdf (2020)
90 NSW Government, ‘Electricity infrastructure roadmap’, https://energy.nsw.gov.au/government-and-regulation/electricity-infrastructure-roadmap, (2020)
91 VIC Government, ‘Victoria’s renewable energy roadmap’, https://www.energy.vic.gov.au/renewable-energy/victorias-renewable-energy-roadmap, (2020)
92 SA Government, ‘South Australia’s Energy Solution’, https://energymining.sa.gov.au/__data/assets/pdf_file/0009/364266/200615_Energy_Solution_Action_Plan_final_spreads_rs.pdf (2020)
93 QLD Government, ‘Queensland Renewable Energy Zones’, https://www.epw.qld.gov.au/about/initiatives/renewable-energy-zones#:~:text=The%20zones%20offer%20long%2Dterm,net%20zero%20emissions%20by%202050 (2020)
94 Australian Government, ‘Australia’s National Hydrogen Strategy’, https://www.industry.gov.au/sites/default/files/2019-11/australias-national-hydrogen-strategy.pdf (2019)
95 Australian Government, ‘Australia’s National Hydrogen Strategy’, https://www.industry.gov.au/sites/default/files/2019-11/australias-national-hydrogen-strategy.pdf (2019)
96 Joe Biden, ‘The Biden Plan for a clean energy revolution and environmental justice’, https://joebiden.com/climate-plan/ (2020)
97 RepuTex, ‘EU levy could impose carbon price of A$65-140 on Australian exports, with more climate tariffs to come’, https://www.reputex.com/research-insights/eu-border-levy-could-impose-carbon-price-of-a65-140-on-australian-companies-by-2023/ (2021)
98 Bloomberg, ‘Biden exploring border adjustment tax to fight climate change’, https://www.bloomberg.com/news/articles/2021-04-23/biden-exploring-border-adjustment-tax-to-fight-climate-change (2021)
99 Bloomberg tax, ‘Japan mulls carbon border tax for polluters’, https://news.bloombergtax.com/daily-tax-report/japan-mulls-carbon-border-tax-for-biggest-polluters-nikkei-says?context=article-related (2021)
100 The International Council on Clean Transportation, ‘Global overview of government targets for phasing out sales of new internal combustion engine vehicles’, https://theicct.org/blog/staff/global-ice-phaseout-nov2020 (2020)
101 UN Environment Program, ‘Zero Routine Flaring by 2030’, http://climateinitiativesplatform.org/index.php/Zero_Routine_Flaring_by_2030, (2019)

82
102 This differs by four absolute percentage points to the 67% probability stated in The NGFS scenario overview due to our consistent use of the REMIND-MAgPIE 1.7-3.0 climate model across all scenarios as opposed to the MESSAGEix-GLOBIOM which is used by NGFS for the orderly 2˚C. Both orderly and disorderly REMIND-MAgPIE 1.7-3.0 scenarios are available in the IPCC SR1.5 database, as stipulated in the NGFS technical documentation.
103 The IEA WEO NZE2050 CO2 emissions trajectory excludes LULUCF which causes a gap between it and the NGFS 2020 emissions as well as between the orderly NGFS scenario out to 2050.
104 AEMO, ‘2020 Integrated System Plan’, https://aemo.com.au/energy-systems/major-publications/integrated-system-plan-isp/2020-integrated-system-plan-isp (2020)
105 NS Energy, ‘BHP to ditch thermal coal assets following investor pressure’, https://www.nsenergybusiness.com/news/bhp-thermal-coal/ (2020)
106 Rio Tinto, ‘Rio Tinto completes sale of remaining coal assets’, https://www.riotinto.com/en/news/releases/Coal-assets-sale-completed (2018)
107 Reuters, ‘South32 now expects South African thermal coal exit after March quarter’, https://www.reuters.com/article/us-south32-divestiture-seriti-idUSKBN2BL0RL (2020)
108 Swiss Re Institute, ‘The economics of climate change: no action not an option’, https://www.swissre.com/dam/jcr:e73ee7c3-7f83-4c17-a2b8-8ef23a8d3312/swiss-re-institute-expertise-publication-economics-of-climate-change.pdf, (2021)
109 Ditto
110 Reserve Bank of Australia, ‘Financial Stability Review – October 2020’, https://www.rba.gov.au/publications/fsr/2020/oct/australian-financial-system.html (2020)
111 NGFS, ‘NGFS climate scenarios for central banks and supervisors’, https://www.ngfs.net/sites/default/files/medias/documents/820184_ngfs_scenarios_final_version_v6.pdf (2020)
112 Australian Business Roundtable, ‘The economic cost of the social impact of natural disasters’, http://australianbusinessroundtable.com.au/assets/documents/Report%20-%20Social%20costs/7.%20The%20cost%20of%20natural%20disasters%20-%20Australian%20experiences.pdf (2016)
113 Paul Read and Richard Denniss, ‘With costs approaching $100 billion, the fires are Australia’s costliest natural disaster’, https://theconversation.com/with-costs-approaching-100-billion-the-fires-are-australias-costliest-natural-disaster-129433#:~:text=With%20costs%20approaching%20%24100%20billion%2C%20the%20fires%20are%20Australia’s%20costliest%20natural%20disaster (2020)
114 IPCC, ‘Climate Change 2013: The Physical Science Basis’, https://www.ipcc.ch/report/ar5/wg1/ (2013)
115 Department of Industry, Science, Energy and Resources, 2020; APPEA, 2020; ABS, 2021
116 The 2016 Census conducted by the ABS is used as it contains the place of work data point of employees and covers the whole population. There is also a more regular labour force survey which covers a representative sample though lacks the required granularity of location for this analysis. It is noted that the overall employment numbers from 2019 ABS Labour Account Australia are not materially different (i.e. 5%). The main difference is in the employment distribution per sub-industries (i.e. coal mining, oil and gas extraction, and exploration and other support services)
117 ACIL Allen Consulting, ‘The transition of the Australian car manufacturing sector’, https://docs.employment.gov.au/system/files/doc/other/summary_report_-_transition_of_the_australian_car_manufacturing_sector_final_0.pdf (2019)
118 Stanwick et al., ‘The end of car manufacturing in Australia: What is the role of training?’, National Centre for Vocational Education Research, https://www.ncver.edu.au/__data/assets/file/0020/9560/end-of-car-manufacturing-synthesis.docx#:~:text=Number%20employed%20’000&text=Nationally%2C%20it%20is%20estimated%20that,Economic%20and%20Industry%20Research%202014 (2015)
119 It is important to note that the data is taken from the ABS’ 2016 Census due to the higher granularity of data as it contains the split between workers that reside in their place of work. Other data sources such as the ABS’ Labour Force Survey contain a reasonably granular sector breakdown though lack this key location data which add value to the analysis. There has been no material movement in the data over the past few years based on the alternative more recent labour force survey data.
120 Note ‘Manufacturing’ includes Food Production Manufacturing, Beverage Product Manufacturing, and Saw Mill, Wood and Paper Product Manufacturing.
121 Ditto
122 Tim Frankenberger et al., ‘Community Resilience: Conceptual Framework and Measurement Feed the Future Learning Agenda’, https://www.agrilinks.org/sites/default/files/resource/files/FTF%20Learning_Agenda_Community_Resilience_Oct%202013.pdf (2013)
123 UN PRI, ‘The modern interpretation of fiduciary duty’, https://www.unpri.org/fiduciary-duty/the-modern-interpretation-of-fiduciary-duty/6538.article (2020)
124 Roles for stakeholders are indicative and are not fixed or prescriptive. Further work and stakeholder dialogue will help to inform these roles.

83
125 B lueprint Institute, ‘Phasing down gracefully: Halving electricity emissions this decade’, https://www.blueprintinstitute.org.au/powering_the_next_boom_part_1_phasing_down_gracefully, (2020)
126 Blueprint Institute, ‘Phasing down gracefully: Halving electricity emissions this decade’, https://www.blueprintinstitute.org.au/powering_the_next_boom_part_1_phasing_down_gracefully, (2020)
127 International Labor Organization, ‘Guidelines for a just transition towards environmentally sustainable economies and societies for all’, https://www.ilo.org/wcmsp5/groups/public/---ed_emp/---emp_ent/documents/publication/wcms_432859.pdf (2015)
128 Grantham Research Institute, ‘investing in a just transition – global project’, https://www.lse.ac.uk/granthaminstitute/investing-in-a-just-transition-global-project/
129 UN PRI, ‘Strategy, policy and strategic asset allocation’, https://www.unpri.org/investment-tools/asset-owner-resources/strategy-policy-and-strategic-asset-allocation (2020)
130 IPE, ‘Private and green: Non-listed sustainable debt’, https://www.ipe.com/esg/green-finance-private-and-green/10044478.article (2020)
131 Climate Bonds Initiative, ‘Green Loans Australian and New Zealand’, https://www.climatebonds.net/system/tdf/reports/cbi-green-loans-aus-nz-final-14102020.pdf?file=1&type=node&id=54547&force=0 (2020)
132 Grantham Research Institute, ‘Why governments need to issue just transition sovereign bonds and how they could do it’ https://www.lse.ac.uk/granthaminstitute/news/why-governments-need-to-issue-just-transition-sovereign-bonds-and-how-they-could-do-it/ (2020)
133 ESG Integration is the explicit and systematic inclusion of ESG issues in investment analysis and investment decisions, including investment strategies and mandates. See further UN PRI, ‘what is ESG integration’, https://www.unpri.org/fixed-income/what-is-esg-integration/3052.article (2018)
134 IGCC, ‘Full Disclosure: Improving Corporate Reporting on Climate Risk’, https://igcc.org.au/wp-content/uploads/2020/09/IGCCReport_Full-Disclosure_FINAL.pdf (2020)
135 International Financial Reporting Standards (IFRS), ‘IFRS Foundation Trustees announce next steps in response to broad demand for global sustainability standards’, https://www.ifrs.org/news-and-events/2021/02/trustees-announce-next-steps-in-response-to-broad-demand-for-global-sustainability-standards/ (2021)
136 Oil and gas companies included in analysis include Shell, Chevron, ConocoPhillips, Glencore, Woodside, Origin, Santos, Caltex Australia, Oil Search, Beach Energy and Cooper Energy. Coal companies included in this analysis include BHP, Rio Tinto, South 32, Anglo Coal Australia, Peabody Energy Australia, New Hope, Jellinbah Resources, QCoal and Whitehaven Coal.
137 Australian Council of Superannuation Investors (ACSI), ‘ESG reporting trends in the ASX200’, https://acsi.org.au/wp-content/uploads/2020/12/ESG-Reporting-Trends-in-the-ASX200.Sep20.pdf (2020)
138 PCAF, ‘Financial institutions taking action’, https://carbonaccountingfinancials.com/financial-institutions-taking-action#overview-of-institutions (2021)
139 Australian Institute of Company Directors (AICD), ‘UK and NZ lead way on mandatory climate risk disclosures’, https://aicd.companydirectors.com.au/membership/membership-update/uk-and-nz-lead-way-on-mandatory-climate-risk-disclosures (2021)
140 European Commission, ‘EU taxonomy for sustainable activities’, https://ec.europa.eu/info/business-economy-euro/banking-and-finance/sustainable-finance/eu-taxonomy-sustainable-activities_en (2021)
141 ‘Joint Statement of the 7th ASEAN Finance Ministers and Central Bank Governors’ Meeting (AFMGM)’, https://asean.org/storage/Joint_Statement_of_the_7th_AFMGM.pdf (2021)
142 Climate Action 100+, ‘2020 Progress Report’, https://www.climateaction100.org/wp-content/uploads/2020/12/CA100-Progress-Report.pdf (2020)
143 RLAM, ‘RLAM and Friends Provident Foundation call for energy utility companies to put in place formal Just transition strategies, to address the human and economic impact of the transition towards a low carbon economy by November 2021’, https://www.royallondon.com/media/press-releases/press-releases-2020/december/risks-of-social-backlash-to-low-carbon-transition-if-energy-utility-companies-dont-address-its-human-and-economic-impact (2020)
144 See for example David Wood and Vonda Brunsting, ‘Investor Expectations on the Just Transition: Publicly Traded Energy’, Initiative for Responsible Investment, https://iri.hks.harvard.edu/files/iri/files/iri_utilities_investor_expectations_final.pdf?m=1603132197 (2020)
145 ACTU, ‘Just transition’ Securing a just transition: guidance to assist investors and asset managers support a just transition’, https://www.actu.org.au/media/1449436/securing-a-just-transition_feb2021.pdf (2021)
146 Courier Mail, ‘In-house contractor signs on for controversial Shell Solar Farm’, https://www.couriermail.com.au/subscribe/news/1/?sourceCode=CMWEB_WRE170_a_GGL&dest=https%3A%2F%2Fwww.couriermail.com.au%2Fnews%2Fqueensland%2Fchinchilla%2Finhouse-contractor-signs-on-for-controversial-shell-solar-farm%2Fnews-story%2Fb4ef603f344c57737c4d85684439407a&memtype=anonymous&mode=premium (2021)

84
147 Ceres, ‘Practices for Just, Sustainable and Equitable Development of Clean Energy’, https://www.ceres.org/resources/reports/practices-just-sustainable-and-equitable-development-clean-energy (2020)
148 ACTU, ‘Sharing the benefits with workers: A decent jobs agenda for the renewable energy industry’, https://www.actu.org.au/media/1449338/d61-renewable-energy-report.pdf (2020)149 Vivid Economics, ‘Why a just transition is crucial for effective climate action’, https://www.unpri.org/download?ac=7092 (2019)
150 World Economic Forum, ‘Public-private partnerships are the key to tackling climate change’, https://www.weforum.org/agenda/2020/01/in-the-fight-against-climate-change-public-private-partnerships-are-the-only-way-to-go/ (2020)
151 World Economic Forum, ‘How public private partnersihps must evolve to create social impact’, https://www.weforum.org/agenda/2019/11/how-public-private-partnerships-must-evolve-to-create-social-impact (2019)
152 UN PRI, ‘PRI Reporting Framework’, https://www.unpri.org/Uploads/x/a/b/strategyandgovernance2019_501247.pdf (2018)
153 UN PRI, ‘Principles for Responsible Investment releases new framework for signatories to take action on the Sustainable Development Goals’, https://www.unpri.org/news-and-press/principles-for-responsible-investment-releases-new-framework-for-signatories-to-take-action-on-the-sustainable-development-goals/5924.article (2020)
154 SDI Asset Owner Platform, https://www.sdi-aop.org/
155 WEF, ‘Measuring Stakeholder Capitalism Towards Common Metrics and Consistent Reporting of Sustainable Value Creation’ http://www3.weforum.org/docs/WEF_IBC_Measuring_Stakeholder_Capitalism_Report_2020.pdf (2020)
156 Nick Robins, Vonda Brunsting and David Wood, ‘Climate change and the just transition: A guide to investor action’, p.13, Grantham Research Institute, https://www.lse.ac.uk/granthaminstitute/wp-content/uploads/2019/02/Investing-in-a-just-transition-in-the-UK_Full-policy-report_40pp-2.pdf (2018)

igcc.org.au
@IGCC_Update