employment projections for industries and … ogata , research ... office • employment projections...
TRANSCRIPT

State of Hawaii
Employment Projections for
Industries and Occupations 2008 - 2018
September 2010
State of Hawaii Department of Labor and Industrial Relations
Research and Statistics Office

Employment Projections for Industries and Occupations 2008 - 2018 Linda Lingle, Governor State of Hawaii Pearl Imada Iboshi, Director Department of Labor and Industrial Relations Francisco Corpuz, Chief Research and Statistics Office Vicki Lau, Section Supervisor Jeri Arucan, Research Statistician Melonie Ogata, Research Statistician Labor Market Research Section 830 Punchbowl Street, Room 304 Honolulu, HI 96813 Phone: 808‐586‐9025 Email: [email protected] Website: www.hiwi.org September 2010

Introduction...................................................................................................................................... 1
Methodology .................................................................................................................................... 2
Assumptions and Limitations .......................................................................................................... 4
Highlights .......................................................................................................................................... 6
Industry Employment Trends .......................................................................................................... 7
Long‐Term Industry Projections, State of Hawaii, 2008‐2018 ...................................................... 12
Occupational Employment Trends ................................................................................................ 15
Long‐Term Occupational Projections, State of Hawaii, 2008‐2018 ............................................. 23
Appendix A: Definition of Education and Training Codes ........................................................... 40
Appendix B: Industry Definitions .................................................................................................. 41
Appendix C: Occupational Classifications ..................................................................................... 43
Table of Contents

Hawaii State Department of Labor and Industrial Relations • Research and Statistics Office • Employment Projections for Industries and Occupations 2008‐2018 1
Employment Projections for Industries and Occupations, 2008 ‐ 2018 provides long‐term industry and occupational projections for the State of Hawaii from 2008 to 2018. The first section of this report looks at employment projections by industry. Several charts illustrate what is expected to happen at an industry level in Hawaii over the next decade. A written analysis points out trends at the broad industry level as well as detailed industry sectors. Industries are classified by the North American Industry Classification System (NAICS) code. The second section of this report focuses on employment projections by occupation. The tables and graphs presented explain the future outlook of specific jobs in Hawaii over the next ten years. A written analysis covers the broad and major occupational groups and then focuses on detailed occupations. Occupations are classified by Standard Occupational Classification (SOC) code. Data on the average annual job openings are also included in this report. Job openings are either due to growth or replacement. The higher the replacements openings, the higher the turnover is for that occupation. It is recommended that both growth and replacement openings be used, therefore we have total average annual openings. This report includes the education and training level requirements for each occupation. These requirements are determined by the Bureau of Labor Statistics (BLS) and recognize the educational attainment achieved by most people in a particular occupation. Some businesses, however, may require a higher level of training before they will hire. Some jobs may also have different grades or levels that require different levels of training, but they will not be reflected in this report. The information contained in this report can be used by students and jobseekers who are making career decisions; education and training program planners who develop specific occupational training programs; job placement specialists who help people find employment; counselors who assist individuals in choosing careers; managers who design, evaluate, and direct employment and training programs; policy decision makers who develop short‐ to long‐range personnel policies; and employers who need information to help them plan the expansion or relocation of their businesses. Prior to using the employment projections in this publication, it is important to understand the methodology used and assumptions made in developing these projections, and note the limitations of the data.
Introduction

Hawaii State Department of Labor and Industrial Relations • Research and Statistics Office • Employment Projections for Industries and Occupations 2008‐2018 2
These are the general steps used to produce long‐term employment projections in Hawaii:
Industry employment is obtained from the Hawaii State Department of Labor and Industrial Relations' Quarterly Census of Employment and Wages (QCEW) and Current Employment Statistics (CES). Average annual employment for each of the industries in the State of Hawaii was compiled from 1990 through the base year of the projection period. Industry employment projections were produced using the Long‐Term Industry Projections software system. The system allows the analyst to choose from a variety of predefined, generally accepted projection models including shift‐share, simple time‐series extrapolation, and linear regression models. Some of the independent variables that may be used in the regression models were time, resident population, gross state product, total personal income, average visitor census, visitor occupancy rates, and the number of unemployed persons. After the initial projections were developed, they were reviewed for reasonableness. Adjustments to the projections were made based on current knowledge of the industries and the economy. Industry staffing patterns were obtained from the Occupational Employment Statistics (OES) survey, using Standard Occupational Classification (SOC) codes. The staffing patterns for the agricultural industries were calculated by using census data. Staffing patterns for the self‐employed and unpaid family workers were obtained from the Bureau of Labor Statistics. Occupational employment projections were produced using the MicroMatrix Occupational Projections System software. The system used the staffing patterns to transform industry projections into occupational projections. The staffing pattern divides each industry’s employment into different occupations, forming a matrix. The system then applies national change factors developed by BLS to adjust the projected pattern of each industry to account for changes brought about by new technology and changing business practices. Next, the system applies the national ratios for self‐employed and unpaid family workers to each occupation’s base and projected year employment to get self‐employed figures. These figures are then added to the appropriate occupation total to obtain occupational employment totals that include self‐employed.
Methodology

Hawaii State Department of Labor and Industrial Relations • Research and Statistics Office • Employment Projections for Industries and Occupations 2008‐2018 3
Job openings are divided into two categories: job openings due to growth and job openings due to replacement needs.
• Job openings due to growth are created by industry employment expansion. It is the
difference between projected year employment and base year employment. For occupations where employment is projected to decline, a zero is used for openings due to growth, instead of posting a negative job opening.
• Job openings due to replacement needs reflect net replacement needs and estimates the
number of workers leaving jobs that need to be replaced by other workers. Generally, this counts openings that occur when workers leave their jobs to work in another occupation, retire or permanently leave the job for other reasons, or die.
• The total job openings count is equal to the sum of job openings due to growth and job
openings due to replacements. This number estimates the number of openings for workers entering an occupation for the first time. It also may be used to assess the number of workers who will need to receive training for a particular occupation.
Methodology (continued)

Hawaii State Department of Labor and Industrial Relations • Research and Statistics Office • Employment Projections for Industries and Occupations 2008‐2018 4
The following conditions are assumed to prevail during the projection period:
1. The institutional framework of the national and local economy will not change radically.
2. Current social, technological, and scientific trends will continue, including values placed on work, education, income, and leisure.
3. No major event, such as widespread or long‐lasting energy shortages or wars, will significantly alter the industrial structure of the economy or the rate of economic growth.
4. Changes in relative wages, technological changes, or other factors will not radically alter trends in the occupational pattern of the industries.
This data in this report has the following limitations:
1. The employment outlook for the various industries and occupations are based solely on an assessment of their projected demand. The supply of workers was not presented since a viable method for determining it has not yet been developed.
2. The employment projections are based on past trends and do not take into account any economic developments that may occur after the projections are completed. Projections should be viewed as indicators of relative magnitude and probable direction rather than as predictions of absolute occupational demand. Therefore, it is more important to look at the growth rate and projected total openings rather than the projected employment estimate itself.
3. Cyclical, seasonal, and other factors, such as large plant openings or closings are considered only if the information is available.
4. Employment projections and the estimation of job openings are rounded to the nearest ten. Therefore, the data may not sum to the totals.
Assumptions and
Limitations

Hawaii State Department of Labor and Industrial Relations • Research and Statistics Office • Employment Projections for Industries and Occupations 2008‐2018 5
5. The net replacement rates used in developing job openings estimates do not count workers who change jobs but remain in the same occupation. In addition, because the number of openings due to net replacements is limited to those created by older workers leaving the job permanently, it may underestimate the openings for new entrants especially in jobs where many people permanently leave at younger ages.
6. Adjustments were not made for persons who held two or more jobs in different establishments. In the OES survey, a worker is counted in each job held at different places of work. Furthermore, no distinction is made if a worker does several jobs within one company. That employee is counted in only one occupation ‐ the one with the highest skill level. If the worker does several jobs at the same skill level, the person is reported in the occupation that he/she spends the most time doing.
Assumptions and
Limitations (continued)
Hawaii State Department of Labor and Industrial Relations • Research and Statistics Office • Employment Projections for Industries and Occupations 2008‐2018 6
Statewide employment is projected to expand by 7.1 percent from 2008 to 2018, or by 48,840 jobs. This increase improves on a projected 4.5 percent increase for the previous ten‐year period from 2006 to 2016. Although employment declined in 2008 from 2006, signs of an economic recovery in 2010 enable a more positive forecast than the last.
On the industry side…
• Education and health services is expected to lead the recovery with 15.8 percent growth as the health care and social assistance industry experiences significant job expansion. The other services sector is expected to follow with 12.4 percent growth.
• Construction is expected to hold its own with a 7.9 percent increase in jobs.
• Professional and business services and the large trade, transportation, and utilities industry are projected to expand by 6.9 and 6.2 percent, respectively, while leisure and hospitality may grow by 4.3 percent.
• Information is projected to experience the most job loss with a 1.2 percent decline. Natural resources and mining may also lose jobs with a forecasted 0.9 percent dip.
On the occupational side…
• Personal care and service occupations are expected to lead the way in terms of fastest job growth with 20.4 percent.
• Healthcare support will expand significantly by 19.0 percent. Following closely will be healthcare practitioners and technical occupations with 15.0 percent growth.
• In terms of net growth, education, training, and library occupations may be the big gainer, expanding by 5,990 jobs or 12.8 percent.
• Only two groups are anticipated to contract: legal occupations down by 0.6 percent and architecture and engineering occupations decreasing by 0.5 percent.
Highlights

Hawaii State Department of Labor and Industrial Relations • Research and Statistics Office • Employment Projections for Industries and Occupations 2008‐2018 7
Statewide employment is projected to expand by 7.1 percent from 685, 950 in 2008 to 734,790 in 2018, resulting in a gain of 48,840 jobs. Averaged over the ten‐year period, this amounts to about 0.7 percent job growth each year. This forecast improves on a projected 4.5 percent increase for the previous ten‐year period from 2006 to 2016. Although employment declined in 2008 from 2006, signs of an economic recovery in 2010 enable a more positive forecast than the last. Broad Industry Trends
Hawaii’s largest industry division, education and health services, is expected to lead the recovery with 15.8 percent growth while adding 20,220 jobs, the most of any major industry (Table 1). Health care and social assistance will be particularly strong as our population continues to age, but education will also have a hand in the job creation. The other services industry division is poised to expand by 12.4 percent, or 3,130 jobs, while construction is forecasted to grow by 7.9 percent, creating 2,970 more jobs. The building cycle may finally be near or at the bottom of the trough and will begin a gradual upswing. The effects of Federal and State stimulus plans will benefit this industry. Professional and business services is projected to gain 5,170 jobs, or 6.9 percent. Much of this boost will come from administrative and support and waste management and remediation services. The other two areas will provide minimal job creation: management of companies and enterprises; and professional, scientific, and technical services. An estimated 7,360 jobs are anticipated to bolster trade, transportation, and utilities, Hawaii’s second largest industry division, by 6.2 percent. Retail trade, which makes up almost 60 percent of this division, will provide nearly half of the job expansion. Transportation and warehousing will contribute 27 percent to this job increase, while wholesale will be responsible for another 20 percent. Utilities, the smallest component of this division, will account for a minimal number of jobs, but will have the fastest rate of growth among all the other industries. The state’s third largest industry division, leisure and hospitality, is predicted to add 4,590 jobs, increasing at a slower rate of 4.3 percent. Almost 80 percent of the job gains will arise in accommodation and food services as the visitor industry has begun to experience a turnaround in visitor arrivals and spending in 2010.
Industry Employment
Trends

Hawaii State Department of Labor and Industrial Relations • Research and Statistics Office • Employment Projections for Industries and Occupations 2008‐2018 8
Industry Employment
Trends (continued)
Government may experience moderate growth of about 2.5 percent with 1,880 jobs created. Over half of these new jobs are expected from local government payrolls with another 32 percent in state government. Federal government may contribute only 16 percent of the job gains. Financial activities and manufacturing should see very modest increases in employment. The industry division forecasted to endure the steepest decline is information with an estimated 1.2 percent drop totaling 120 positions. The only other industry division slated to contract is natural resources and mining with a 0.9 percent projected decrease involving 60 jobs.
Industry Division
2008
2018
Net Growth
Percent Growth
Avg. Ann. Growth
Total Employment, All Industry Divisions 685,950 734,790 48,840 7.1% 0.7%
Education and Health Services 128,220 148,440 20,220 15.8% 1.6%
Other Services (Except Government) 25,230 28,360 3,130 12.4% 1.2%
Construction 37,470 40,440 2,970 7.9% 0.8%
Professional and Business Services 75,340 80,510 5,170 6.9% 0.7%
Trade, Transportation, and Utilities 117,940 125,300 7,360 6.2% 0.6%
Total Self‐Employed and Unpaid Family Workers 59,590 62,380 2,790 4.7% 0.5%
Leisure and Hospitality 106,860 111,450 4,590 4.3% 0.4%
Government 74,050 75,930 1,880 2.5% 0.3%
Financial Activities 29,320 29,980 660 2.3% 0.2%
Manufacturing 14,850 15,110 260 1.8% 0.2%
Natural Resources and Mining 7,050 6,990 ‐60 ‐0.9% ‐0.1%
Information 10,040 9,920 ‐120 ‐1.2% ‐0.1%
Employment Projections by Major Industry Division, State of Hawaii, 2008‐2018
Table 1
Hawaii State Department of Labor and Industrial Relations • Research and Statistics Office • Employment Projections for Industries and Occupations 2008‐2018 9
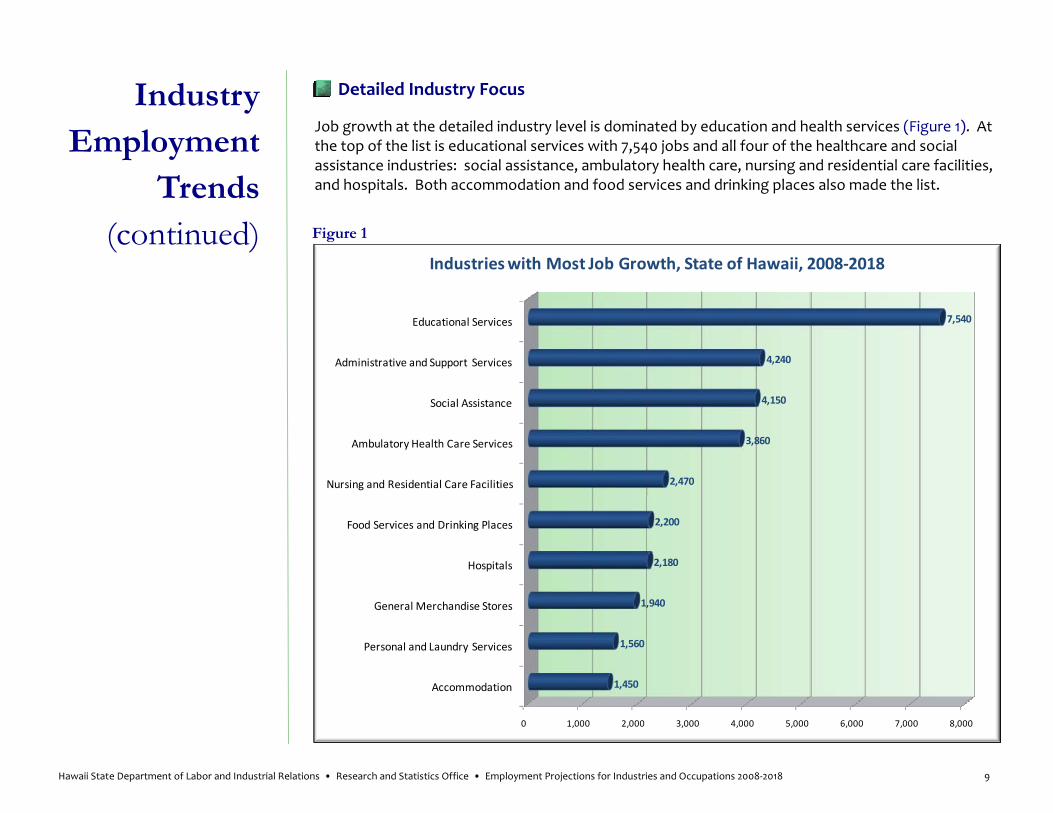
Detailed Industry Focus
Job growth at the detailed industry level is dominated by education and health services (Figure 1). At the top of the list is educational services with 7,540 jobs and all four of the healthcare and social assistance industries: social assistance, ambulatory health care, nursing and residential care facilities, and hospitals. Both accommodation and food services and drinking places also made the list.
Industry Employment
Trends (continued) Figure 1
0 1,000 2,000 3,000 4,000 5,000 6,000 7,000 8,000
Accommodation
Personal and Laundry Services
General Merchandise Stores
Hospitals
Food Services and Drinking Places
Nursing and Residential Care Facilities
Ambulatory Health Care Services
Social Assistance
Administrative and Support Services
Educational Services
1,450
1,560
1,940
2,180
2,200
2,470
3,860
4,150
4,240
7,540
Industries with Most Job Growth, State of Hawaii, 2008‐2018

Hawaii State Department of Labor and Industrial Relations • Research and Statistics Office • Employment Projections for Industries and Occupations 2008‐2018 10
Two of the healthcare and social assistance industries will not only add many jobs but grow at a very rapid pace: nursing and residential care facilities and social assistance (Figure 2). Another industry pegged to add a large number of jobs and still grow at a fast rate is personal and laundry services. Motion picture and sound recording industries, waste management and remediation service, and miscellaneous and transportation equipment manufacturing have high projected percentage growth rates. Other industries on the list are small: funds, trusts, and other financial vehicles; textile mills; and internet service providers.
Figure 2
0% 10% 20% 30% 40%
Internet Svc. Providers, Web Search Portals, Data Proc. Svcs.
Miscellaneous Manufacturing
Textile Mills
Personal and Laundry Services
Transportation Equipment Manufacturing
Motion Picture and Sound Recording Industries
Waste Management and Remediation Service
Social Assistance
Funds, Trusts, and Other Financial Vehicles
Nursing and Residential Care Facilities
17.3%
18.3%
20.0%
20.5%
20.7%
21.1%
23.0%
28.0%
33.3%
35.0%
Fastest Growing Industries, State of Hawaii, 2008‐2018
Industry Employment
Trends (continued)

Hawaii State Department of Labor and Industrial Relations • Research and Statistics Office • Employment Projections for Industries and Occupations 2008‐2018 11
Most of Hawaii’s industries are projected to grow, but there are eleven that are expected to endure employment declines (Figure 3). Telecommunications tops the list with an estimated 540 jobs to be eliminated. Four of the declining industries are in manufacturing. Retail trade has two industries projected to decline: gasoline stations and miscellaneous stores. Another two industries in agriculture, forestry, fishing, and hunting are included in the job loss list.
‐600 ‐500 ‐400 ‐300 ‐200 ‐100 0
Food Manufacturing
Chemical Manufacturing
Support Activities for Agriculture and Forestry
Merchant Wholesalers, Durable Goods
Crop Production
Publishing Industries
Apparel Manufacturing
Miscellaneous Store Retailers
Printing and Related Support Activities
Gasoline Stations
Telecommunications
‐10
‐10
‐40
‐70
‐80
‐110
‐150
‐190
‐270
‐310
‐540
Industries with Most Job Loss, State of Hawaii, 2008‐2018
Figure 3
Industry Employment
Trends (continued)

NAICS Avg. Ann.
Code Industry Title 2008 2018 Net Percent Growth
000000 TOTAL EMPLOYMENT 685,950 734,790 48,840 7.1% 0.7%
101000 Goods-Producing 59,370 62,540 3,170 5.3% 0.5%
101100 Natural Resources and Mining 7,050 6,990 -60 -0.9% -0.1%
110000 Agriculture, Forestry, Fishing and Hunting 6,720 6,620 -100 -1.5% -0.1%
111000 Crop Production 5,290 5,210 -80 -1.5% -0.2%
112000 Animal Production 650 650 0 0.0% 0.0%
114000 Fishing, Hunting and Trapping 150 160 10 6.7% 0.7%
115000 Support Activities for Agriculture and Forestry 620 580 -40 -6.5% -0.6%
210000 Mining 330 360 30 9.1% 0.9%
212000 Mining (except Oil and Gas) 330 360 30 9.1% 0.9%
101200 Construction 37,470 40,440 2,970 7.9% 0.8%
230000 Construction 37,470 40,440 2,970 7.9% 0.8%
236000 Construction of Buildings 11,700 12,810 1,110 9.5% 0.9%
237000 Heavy and Civil Engineering Construction 4,940 5,540 600 12.1% 1.2%
238000 Specialty Trade Contractors 20,830 22,090 1,260 6.0% 0.6%
101300 Manufacturing 14,850 15,110 260 1.8% 0.2%
310000 Manufacturing 14,850 15,110 260 1.8% 0.2%
311000 Food Manufacturing 6,120 6,110 -10 -0.2% 0.0%
312000 Beverage and Tobacco Product Manufacturing 910 970 60 6.6% 0.7%
313000 Textile Mills 50 60 10 20.0% 2.0%
314000 Textile Product Mills 240 260 20 8.3% 0.8%
315000 Apparel Manufacturing 580 430 -150 -25.9% -2.6%
322000 Paper Manufacturing 150 170 20 13.3% 1.3%
323000 Printing and Related Support Activities 1,080 810 -270 -25.0% -2.5%
325000 Chemical Manufacturing 350 340 -10 -2.9% -0.3%
326000 Plastics and Rubber Products Manufacturing 270 290 20 7.4% 0.7%
327000 Nonmetallic Mineral Product Manufacturing 1,150 1,180 30 2.6% 0.3%
332000 Fabricated Metal Product Manufacturing 450 480 30 6.7% 0.7%
333000 Machinery Manufacturing 50 50 0 0.0% 0.0%
334000 Computer and Electronic Product Manufacturing 130 140 10 7.7% 0.8%
336000 Transportation Equipment Manufacturing 820 990 170 20.7% 2.1%
337000 Furniture and Related Product Manufacturing 550 580 30 5.5% 0.5%
339000 Miscellaneous Manufacturing 1,090 1,290 200 18.3% 1.8%
102000 Services-Providing 566,990 609,880 42,890 7.6% 0.8%
102100 Trade, Transportation, and Utilities 117,940 125,300 7,360 6.2% 0.6%
420000 Wholesale Trade 18,740 20,220 1,480 7.9% 0.8%
423000 Merchant Wholesalers, Durable Goods 6,920 6,850 -70 -1.0% -0.1%
424000 Merchant Wholesalers, Nondurable Goods 9,940 11,300 1,360 13.7% 1.4%
425000 Wholesale Electronic Markets and Agents and Brokers 1,880 2,070 190 10.1% 1.0%
440000 Retail Trade 69,760 73,310 3,550 5.1% 0.5%
Employment Growth
Long-term Industry Projections, State of Hawaii, 2008-2018
Hawaii State Department of Labor and Industrial Relations • Research and Statistics Office • Employment Projections for Industries and Occupations 2008-2018 12

NAICS Avg. Ann.
Code Industry Title 2008 2018 Net Percent Growth
Employment Growth
Long-term Industry Projections, State of Hawaii, 2008-2018
441000 Motor Vehicle and Parts Dealers 6,850 6,860 10 0.1% 0.0%
442000 Furniture and Home Furnishings Stores 1,690 1,750 60 3.6% 0.4%
443000 Electronics and Appliance Stores 1,670 1,730 60 3.6% 0.4%
444000 Building Material and Garden Equipment and Supplies Dealers 4,690 5,120 430 9.2% 0.9%
445000 Food and Beverage Stores 13,250 13,740 490 3.7% 0.4%
446000 Health and Personal Care Stores 5,230 5,680 450 8.6% 0.9%
447000 Gasoline Stations 2,570 2,260 -310 -12.1% -1.2%
448000 Clothing and Clothing Accessories Stores 11,360 11,790 430 3.8% 0.4%
451000 Sporting Goods, Hobby, Book, and Music Stores 3,230 3,400 170 5.3% 0.5%
452000 General Merchandise Stores 13,170 15,110 1,940 14.7% 1.5%
453000 Miscellaneous Store Retailers 5,720 5,530 -190 -3.3% -0.3%
454000 Nonstore Retailers 320 360 40 12.5% 1.3%
480000 Transportation and Warehousing 26,360 28,380 2,020 7.7% 0.8%
481000 Air Transportation 7,980 8,580 600 7.5% 0.8%
483000 Water Transportation 2,850 2,920 70 2.5% 0.2%
484000 Truck Transportation 3,340 3,470 130 3.9% 0.4%
485000 Transit and Ground Passenger Transport 2,170 2,390 220 10.1% 1.0%
487000 Scenic and Sightseeing Transportation 3,620 4,060 440 12.2% 1.2%
488000 Support Activities for Transportation 4,160 4,590 430 10.3% 1.0%
492000 Couriers and Messengers 1,500 1,530 30 2.0% 0.2%
493000 Warehousing and Storage 750 840 90 12.0% 1.2%
220000 Utilities 3,080 3,400 320 10.4% 1.0%
221000 Utilities 3,080 3,400 320 10.4% 1.0%
102200 Information 10,040 9,920 -120 -1.2% -0.1%
510000 Information 10,040 9,920 -120 -1.2% -0.1%
511000 Publishing Industries 2,310 2,200 -110 -4.8% -0.5%
512000 Motion Picture and Sound Recording Industries 1,800 2,180 380 21.1% 2.1%
515000 Broadcasting (except Internet) 1,230 1,250 20 1.6% 0.2%
517000 Telecommunications 3,970 3,430 -540 -13.6% -1.4%
518000 Internet Service Providers, Web Search Portals, and Data Processing Services 520 610 90 17.3% 1.7%
519000 Other Information Services 220 250 30 13.6% 1.4%
102300 Financial Activities 29,320 29,980 660 2.3% 0.2%
520000 Finance and Insurance 16,710 16,830 120 0.7% 0.1%
522000 Credit Intermediation and Related Activities 8,690 8,720 30 0.3% 0.0%
523000 Securities, Commodity Contracts, & Other Financial Investments & Related Activities 1,220 1,280 60 4.9% 0.5%
524000 Insurance Carriers and Related Activities 6,770 6,780 10 0.1% 0.0%
525000 Funds, Trusts, and Other Financial Vehicles 30 40 10 33.3% 3.3%
530000 Real Estate and Rental and Leasing 12,610 13,150 540 4.3% 0.4%
531000 Real Estate 8,030 8,350 320 4.0% 0.4%
532000 Rental and Leasing Services 4,570 4,790 220 4.8% 0.5%
Hawaii State Department of Labor and Industrial Relations • Research and Statistics Office • Employment Projections for Industries and Occupations 2008-2018 13

NAICS Avg. Ann.
Code Industry Title 2008 2018 Net Percent Growth
Employment Growth
Long-term Industry Projections, State of Hawaii, 2008-2018
102400 Professional and Business Services 75,340 80,510 5,170 6.9% 0.7%
540000 Professional, Scientific, and Technical Services 25,010 25,170 160 0.6% 0.1%
541000 Professional, Scientific, and Technical Services 25,010 25,170 160 0.6% 0.1%
550000 Management of Companies and Enterprises 7,420 7,820 400 5.4% 0.5%
551000 Management of Companies and Enterprises 7,420 7,820 400 5.4% 0.5%
560000 Administrative and Support and Waste Management and Remediation Services 42,910 47,520 4,610 10.7% 1.1%
561000 Administrative and Support Services 41,250 45,490 4,240 10.3% 1.0%
562000 Waste Management and Remediation Service 1,650 2,030 380 23.0% 2.3%
102500 Education and Health Services 128,220 148,440 20,220 15.8% 1.6%
610000 Educational Services 63,830 71,370 7,540 11.8% 1.2%
611000 Educational Services 63,830 71,370 7,540 11.8% 1.2%
620000 Health Care and Social Assistance 64,390 77,070 12,680 19.7% 2.0%
621000 Ambulatory Health Care Services 23,440 27,300 3,860 16.5% 1.6%
622000 Hospitals 19,060 21,240 2,180 11.4% 1.1%
623000 Nursing and Residential Care Facilities 7,060 9,530 2,470 35.0% 3.5%
624000 Social Assistance 14,840 18,990 4,150 28.0% 2.8%
102600 Leisure and Hospitality 106,860 111,450 4,590 4.3% 0.4%
710000 Arts, Entertainment, and Recreation 11,580 12,510 930 8.0% 0.8%
711000 Performing Arts, Spectator Sports, and Related Industries 1,700 1,880 180 10.6% 1.1%
712000 Museums, Historical Sites, and Similar Institution 1,490 1,670 180 12.1% 1.2%
713000 Amusement, Gambling, and Recreation Industries 8,380 8,960 580 6.9% 0.7%
720000 Accommodation and Food Services 95,280 98,940 3,660 3.8% 0.4%
721000 Accommodation 37,750 39,200 1,450 3.8% 0.4%
722000 Food Services and Drinking Places 57,540 59,740 2,200 3.8% 0.4%
102700 Other Services (Except Government) 25,230 28,360 3,130 12.4% 1.2%
810000 Other Services (Except Government) 25,230 28,360 3,130 12.4% 1.2%
811000 Repair and Maintenance 4,260 4,480 220 5.2% 0.5%
812000 Personal and Laundry Services 7,610 9,170 1,560 20.5% 2.0%
813000 Religious, Grantmaking, Civic, Professional, and Similar Organizations 12,820 14,140 1,320 10.3% 1.0%
814000 Private Households 540 580 40 7.4% 0.7%
102800 Government 74,050 75,930 1,880 2.5% 0.3%
900000 Government 74,050 75,930 1,880 2.5% 0.3%
910000 Federal Government 32,220 32,520 300 0.9% 0.1%
999100 Federal Government, Excluding Post Office 29,470 29,810 340 1.2% 0.1%
491100 Postal Service 2,750 2,710 -40 -1.5% -0.1%
999200 State Government, Excluding Education and Hospitals 23,300 23,910 610 2.6% 0.3%
999300 Local Government, Excluding Education and Hospitals 18,530 19,500 970 5.2% 0.5%
000671 Total Self-Employed and Unpaid Family Workers, Primary Job 59,590 62,380 2,790 4.7% 0.5%
006010 Self-Employed Workers, Primary Job 58,130 60,420 2,290 3.9% 0.4%
007010 Unpaid Family Workers, Primary Job 1,450 1,960 510 35.2% 3.5%
Hawaii State Department of Labor and Industrial Relations • Research and Statistics Office • Employment Projections for Industries and Occupations 2008-2018 14

Hawaii State Department of Labor and Industrial Relations • Research and Statistics Office • Employment Projections for Industries and Occupations 2008‐2018 15
With employment in the State of Hawaii projected to climb 7.1 percent from 685,950 in 2008 to 734,790 in 2018, an additional 48,840 jobs will be created. Averaged over the ten‐year forecast period, annual job growth would be 0.7 percent. Twenty‐two major occupational groups are aggregated into ten broad categories, all of which are projected to experience positive growth during the 2008 to 2018 period (Table 2). In addition to the job openings created through economic expansion, there will be jobs that become available when workers leave for various reasons such as retirement. These replacement needs combined with openings due to growth means Hawaii is estimated to have an average of 21,400 job openings each year during the 2008‐2018 time period. Broad Occupational Trends
Jobs in the professional and related occupations group are projected to increase the fastest, by 10.8 percent and produce an average of 4,390 job openings each year (Figure 4). Within this group, healthcare practitioners and technical occupations will grow the most rapidly at 15.0 percent, while the most job opportunities may occur in education, training, and library with 1,630 annual openings . The service group is the largest broad group and is poised to grow by 9.1 percent over the ten‐year period, creating a total of 6,330 job openings each year. Among the subgroups, personal care and service jobs are anticipating a surge of 20.4 percent, but food preparation and serving related positions will provide the bulk of the job openings with 3,050 each year. Farming, fishing, and forestry occupations are projected to expand faster than average by 7.9 percent, but because it is a small group, the average number of job openings expected each year are marginal at 180. Likewise, the installation, maintenance, and repair group is forecasted to grow by 6.7 percent, but average annual job openings are a modest 610. The construction and extraction group may experience a buildup of 6.4 percent and about 1,030 job openings each year between 2008 and 2018. Also, sales and related positions are projected to increase by 5.5 percent and provide 2,520 job openings a year. Management, business, and financial occupations may climb by 5.4 percent and create 1,950 job openings annually. While the business and financial operations side will enjoy a 9.1 percent hike, the management side will contribute more annual job openings with 1,110.
Occupational Employment
Trends

Hawaii State Department of Labor and Industrial Relations • Research and Statistics Office • Employment Projections for Industries and Occupations 2008‐2018 16
Occupational Employment
Trends (continued)
Employment Projections by Occupational Group, State of Hawaii, 2008‐2018 Occupational Group
2008
2018
Net Growth
Percent Growth
Avg. Ann. Growth
TOTAL EMPLOYMENT 685,950 734,790 48,840 7.1% 0.7%
Professional and Related Occupations 132,060 146,270 14,210 10.8% 1.1%
Service Occupations 174,850 190,680 15,830 9.1% 0.9%
Farming, Fishing, and Forestry Occupations 5,070 5,470 400 7.9% 0.8%
Installation, Maintenance, and Repair Occupations 22,950 24,480 1,530 6.7% 0.7%
Construction and Extraction Occupations 44,080 46,880 2,800 6.4% 0.6%
Sales and Related Occupations 72,510 76,530 4,020 5.5% 0.6%
Management, Business, and Financial Occupations 73,540 77,540 4,000 5.4% 0.5%
Transportation and Material Moving Occupations 39,400 41,300 1,900 4.8% 0.5%
Production Occupations 17,620 18,440 820 4.7% 0.5%
Office and Administrative Support Occupations 103,880 107,210 3,330 3.2% 0.3%
Healthcare Practitioners and Technical 26,730 30,730 4,000 15.0% 1.5%
Arts, Design, Entertainment, Sports, & Media 14,700 15,740 1,040 7.1% 0.7%
Education, Training, and Library 46,690 52,680 5,990 12.8% 1.3%
Legal 5,260 5,230 ‐30 ‐0.6% ‐0.1%
Community and Social Services 11,750 13,400 1,650 14.0% 1.4%
Life, Physical, and Social Science 8,130 8,710 580 7.1% 0.7%
Architecture and Engineering 9,640 9,590 ‐50 ‐0.5% ‐0.1%
Computer and Mathematical 9,160 10,190 1,030 11.2% 1.1%
Healthcare Support 14,600 17,380 2,780 19.0% 1.9%
Protective Service 21,960 23,900 1,940 8.8% 0.9%
Food Preparation and Serving Related 71,690 75,380 3,690 5.1% 0.5%
Building and Grounds Cleaning and Maintenance 39,690 41,630 1,940 4.9% 0.5%
Personal Care and Service 26,910 32,390 5,480 20.4% 2.0%
Management 44,680 46,040 1,360 3.0% 0.3%
Business and Financial Operations 28,860 31,500 2,640 9.1% 0.9%
Table 2

Hawaii State Department of Labor and Industrial Relations • Research and Statistics Office • Employment Projections for Industries and Occupations 2008‐2018 17
The transportation and material moving occupational group will grow at a slower rate of 4.8 percent, but job openings will average 1,210 a year. On the other hand, production occupations will only see about 460 annual job openings as it increases by 4.7 percent. Meanwhile, office and administrative support occupations will improve at the slowest pace of 3.2 percent, but annual job openings will be an ample 2,700.
Occupational Employment
Trends (continued) Figure 4
0 1,000 2,000 3,000 4,000 5,000 6,000 7,000
Farming, Fishing, & Forestry
Production
Installation, Maintenance, & Repair
Construction & Extraction
Transportation & Material Moving
Management, Business, & Financial
Sales & Related
Office & Administrative Support
Professional & Related
Service
180
460
610
1,030
1,210
1,950
2,520
2,700
4,390
6,330
Average Annual Openings by Occupational Group, Hawaii, 2008‐2018
Due to Growth Due to Replacement

Hawaii State Department of Labor and Industrial Relations • Research and Statistics Office • Employment Projections for Industries and Occupations 2008‐2018 18
Detailed Occupational Focus
Atop the list of the top 20 fastest growing jobs in the state is personal and home care aides with 53.4 percent growth from 2008 to 2018 (Figure 5). Four occupations in the healthcare practitioner and technical major group made the list: pharmacy technicians; physician assistants; respiratory therapists; and physical therapists.
Occupational Employment
Trends (continued)
0% 10% 20% 30% 40% 50% 60%
Computer Software Engineers, Applications
Medical and Public Health Social Workers
Cargo and Freight Agents
Social and Human Service Assistants
Personal Financial Advisors
Compliance Officers, ex. Agric., Const., Health & Safety, Transp.
Water & Liquid Waste Treatment Plant & System Operators
Physical Therapists
Coaches and Scouts
Nursing Aides, Orderlies, and Attendants
Respiratory Therapists
Hairdressers, Hairstylists, and Cosmetologists
Captains, Mates, and Pilots of Water Vessels
Physician Assistants
Interpreters and Translators
Pharmacy Technicians
Skin Care Specialists
Self‐Enrichment Education Teachers
Medical Scientists, Except Epidemiologists
Personal and Home Care Aides
20.5%
22.0%
22.0%
22.0%
22.2%
22.8%
22.9%
22.9%
23.7%
23.9%
24.4%
24.4%
24.5%
25.8%
28.1%
28.6%
28.9%
29.3%
31.7%
53.4%
Fastest Growing Occupations, State of Hawaii, 2008‐2018
Figure 5

Hawaii State Department of Labor and Industrial Relations • Research and Statistics Office • Employment Projections for Industries and Occupations 2008‐2018 19
The jobs expected to have the most annual openings during the 2008 to 2018 period are some of the largest occupations in the state, and many of them require minimal education and training and are therefore low‐paying jobs (Figure 6). Topping the list are waiters and waitresses with 980 annual openings, retail salespersons averaging 940 openings, and cashiers with 740 openings each year. Oc‐cupations that require more education and training include both elementary and secondary school teachers, general and operations managers, and registered nurses.
Figure 6
Occupational Employment
Trends (continued)
0 100 200 300 400 500 600 700 800 900 1,000
Carpenters
Maids and Housekeeping Cleaners
First‐Line Supervisors/Mgrs. of Office & Admin. Support Workers
Landscaping and Groundskeeping Workers
First‐Line Supervisors/Managers of Retail Sales Workers
Stock Clerks and Order Fillers
Counter Attendants, Cafeteria, Food Concession, & Coffee Shop
Janitors & Cleaners, exc. Maids & Housekeeping Cleaners
Laborers and Freight, Stock, and Material Movers, Hand
General and Operations Managers
Food Preparation Workers
Office Clerks, General
Secondary School Teachers, exc. Special & Vocational Educ.
Customer Service Representatives
Registered Nurses
Security Guards
Personal and Home Care Aides
Elementary School Teachers, Except Special Education
Combined Food Preparation & Serving Workers, incl. Fast Food
Cashiers
Retail Salespersons
Waiters and Waitresses
200
220
220
240
250
250
290
290
290
300
310
310
320
320
330
340
340
350
410
740
940
980
Occupations with Most Openings, State of Hawaii, 2008‐2018

Hawaii State Department of Labor and Industrial Relations • Research and Statistics Office • Employment Projections for Industries and Occupations 2008‐2018 20
The list of occupations projected to lose the most jobs over the 2008 to 2018 period are dominated by office and administrative support positions (Figure 7). The first occupation on the list is all other office and administrative support workers with 360 net job loss. Although these jobs may be declining in employment and, therefore, have no projected job openings due to growth, they will all have job openings due to replacement needs.
Figure 7
Occupational Employment
Trends (continued)
‐400 ‐350 ‐300 ‐250 ‐200 ‐150 ‐100 ‐50 0
Payroll and Timekeeping Clerks
Travel Agents
Photographers
Machine Feeders and Offbearers
Packers and Packagers, Hand
Architectural and Civil Drafters
Postal Svc. Mail Sorters, Processors, & Proc. Mach. Oper.
Laborers and Freight, Stock, and Material Movers, Hand
Shipping, Receiving, and Traffic Clerks
Human Resources Assts., exc. Payroll & Timekeeping
Data Entry Keyers
Switchboard Operators, Including Answering Service
Secretaries, Except Legal, Medical, and Executive
Computer Programmers
Order Clerks
File Clerks
Word Processors and Typists
General and Operations Managers
Information and Record Clerks, All Other
Office and Administrative Support Workers, All Other
‐80
‐80
‐90
‐90
‐100
‐110
‐110
‐120
‐120
‐120
‐120
‐130
‐140
‐140
‐180
‐220
‐240
‐250
‐250
‐360
Occupations with Most Job Loss, State of Hawaii, 2008‐2018

Hawaii State Department of Labor and Industrial Relations • Research and Statistics Office • Employment Projections for Industries and Occupations 2008‐2018 21
Looking at the total job openings projected for the 2008‐2018 period by the education and training level required, we find that slightly more than one‐quarter require at least a postsecondary vocational certificate or some type of college degree (Figure 8). However, many of the openings, about 46 percent, require only short‐term on‐the‐job training. The rest of the openings require moderate– to long‐term on‐the‐job training or related work experience.
Occupational Employment
Trends (continued) Figure 8
First professional, 1% Doctoral, 1% Master's, 2%Bachelor's or higher, plus
work exper., 4%
Bachelor's, 12%
Associate, 3%
Postsec. Voc., 4%
Related work exper., 9%
Long‐term OTJ training, 7%
Moderate‐term OTJ training, 11%
Short‐term OTJ training, 46%
Job Openings by Education/Training Level, State of Hawaii, 2008‐2018
Note: Includes total annual average openings for publishable occupations.

Hawaii State Department of Labor and Industrial Relations • Research and Statistics Office • Employment Projections for Industries and Occupations 2008‐2018 22
The more you learn, the more you earn ‐ in other words, education pays. Looking at the top five occupations with the greatest demand and categorizing them by their required education and training level, it is evident that the jobs requiring more schooling or training pay better wages (Figure 9). With a degree, the job opportunities are in management, teaching, or nursing. With only minimal on‐the‐job training, there are openings in retail and food service areas. In the mid‐range of education and training, openings will occur in carpentry, maintenance, and customer service.
Figure 9
Occupational Employment
Trends (continued)
$0
$25,000
$50,000
$75,000
$100,000
Gen
eral & Ope
ratio
ns M
anagers
Registered
Nurses
Elem
entary Schoo
l Teachers
Second
ary Scho
ol Teachers
Nursing
Aides, O
rderlies, & Atten
dants
Carpen
ters
Office & Adm
in. Sup
port Sup
ervisors/M
grs.
Retail Sales Supe
rvisors/Mgrs.
Mainten
ance
& Rep
air Workers
Custom
er Svc. Rep
.
Retail Salespersons
Waiters & W
aitresses
Cashiers
Comb. Foo
d Prep
. & Serving
Workers
Person
al & Hom
e Care Aides
Postsecondary vocational or higher degree Moderate‐ to Long‐term OTJ training or related work experience
Short‐term OTJ training
Average
Ann
ual Wage (M
ay 200
9)
Jobs with Most Openings by Skill Level and Wages, Hawaii, 2008‐2018
Note: Includes only publishable occupations.

SOC Avg. Ann. Trng.
Code Occupation Title 2008 2018 Net Percent Growth Growth Replacement Total Code*
00-0000 TOTAL EMPLOYMENT 685,950 734,790 48,840 7.1% 0.7% 5,370 16,030 21,400
11-0000 Management Occupations 44,680 46,040 1,360 3.0% 0.3% 170 930 1,110
11-1000 Top Executives 12,140 11,820 -320 -2.6% -0.3% 0 350 350
11-1011 Chief Executives 1,800 1,740 -60 -3.3% -0.3% 0 50 50 4
11-1021 General and Operations Managers 10,210 9,960 -250 -2.4% -0.2% 0 300 300 4
11-1031 Legislators 130 130 0 0.0% 0.0% 0 ** ** 4
11-2000 Advertising, Marketing, Promotions, Public Relations, and Sales Managers 3,030 3,310 280 9.2% 0.9% 30 70 100
11-2011 Advertising and Promotions Managers 250 230 -20 -8.0% -0.8% 0 10 10 4
11-2021 Marketing Managers 650 680 30 4.6% 0.5% ** 10 20 4
11-2022 Sales Managers 1,870 2,120 250 13.4% 1.3% 20 40 60 4
11-2031 Public Relations Managers 260 280 20 7.7% 0.8% ** 10 10 4
11-3000 Operations Specialties Managers 5,370 5,640 270 5.0% 0.5% 30 110 140
11-3011 Administrative Services Managers 1,120 1,220 100 8.9% 0.9% 10 20 30 4
11-3021 Computer and Information Systems Managers 550 590 40 7.3% 0.7% ** 10 10 4
11-3031 Financial Managers 2,300 2,390 90 3.9% 0.4% 10 40 50 4
11-3041 Compensation and Benefits Managers 120 130 10 8.3% 0.8% ** ** ** 4
11-3042 Training and Development Managers 120 130 10 8.3% 0.8% ** ** ** 4
11-3049 Human Resources Managers, All Other 270 290 20 7.4% 0.7% ** 10 10 4
11-3051 Industrial Production Managers 190 190 0 0.0% 0.0% ** 10 10 8
11-3061 Purchasing Managers 190 200 10 5.3% 0.5% ** 10 10 4
11-3071 Transportation, Storage, and Distribution Managers 510 480 -30 -5.9% -0.6% 0 10 10 8
11-9000 Other Management Occupations 24,150 25,270 1,120 4.6% 0.5% 110 410 520
11-9012 Farmers and Ranchers 4,940 4,980 40 0.8% 0.1% ** 30 30 9
11-9021 Construction Managers 2,860 3,120 260 9.1% 0.9% 30 20 50 5
11-9031 Education Administrators, Preschool and Child Care Center/Program 190 200 10 5.3% 0.5% ** 10 10 4
11-9032 Education Administrators, Elementary and Secondary School 1,040 1,120 80 7.7% 0.8% 10 30 40 4
11-9033 Education Administrators, Postsecondary 330 330 0 0.0% 0.0% 0 10 10 4
11-9039 Education Administrators, All Other 100 120 20 20.0% 2.0% ** ** 10 4
11-9041 Engineering Managers 570 580 10 1.8% 0.2% ** 10 10 4
11-9051 Food Service Managers 2,210 2,260 50 2.3% 0.2% 10 40 50 8
11-9081 Lodging Managers 590 620 30 5.1% 0.5% ** 10 20 8
11-9111 Medical and Health Services Managers 1,070 1,200 130 12.1% 1.2% 10 20 30 4
11-9121 Natural Sciences Managers 200 200 0 0.0% 0.0% 0 10 10 4
11-9131 Postmasters and Mail Superintendents 70 70 0 0.0% 0.0% 0 ** ** 8
11-9141 Property, Real Estate, and Community Association Managers 4,880 5,120 240 4.9% 0.5% 20 80 110 5
11-9151 Social and Community Service Managers 660 730 70 10.6% 1.1% 10 20 20 5
11-9199 Managers, All Other 3,830 3,990 160 4.2% 0.4% 20 100 120 8
13-0000 Business and Financial Operations Occupations 28,860 31,500 2,640 9.1% 0.9% 280 560 840
13-1000 Business Operations Specialists 18,460 20,200 1,740 9.4% 0.9% 180 390 560
13-1022 Wholesale and Retail Buyers, Except Farm Products 1,150 1,140 -10 -0.9% -0.1% 0 30 30 9
Employment Growth Average Annual Openings
Long-term Occupational Projections, State of Hawaii, 2008-2018
Hawaii State Department of Labor and Industrial Relations • Research and Statistics Office • Employment Projections for Industries and Occupations, 2008-2018 23
SOC Avg. Ann. Trng.
Code Occupation Title 2008 2018 Net Percent Growth Growth Replacement Total Code*
Employment Growth Average Annual Openings
Long-term Occupational Projections, State of Hawaii, 2008-2018
13-1023 Purchasing Agents, Except Wholesale, Retail, and Farm Products 1,110 1,260 150 13.5% 1.4% 20 30 50 9
13-1031 Claims Adjusters, Examiners, and Investigators 1,110 1,140 30 2.7% 0.3% ** 30 30 9
13-1032 Insurance Appraisers, Auto Damage 70 60 -10 -14.3% -1.4% 0 ** ** 7
13-1041 Compliance Officers, exc. Agric., Const., Health & Safety, & Transp. 2,940 3,610 670 22.8% 2.3% 70 30 100 9
13-1051 Cost Estimators 800 960 160 20.0% 2.0% 20 20 30 5
13-1061 Emergency Management Specialists 90 110 20 22.2% 2.2% ** ** ** 8
13-1071 Employment, Recruitment, and Placement Specialists 880 1,010 130 14.8% 1.5% 10 20 40 5
13-1072 Compensation, Benefits, and Job Analysis Specialists 350 420 70 20.0% 2.0% 10 10 20 5
13-1073 Training and Development Specialists 600 710 110 18.3% 1.8% 10 20 30 5
13-1079 Human Resources, Training, &Labor Relations Specialists, All Other 660 750 90 13.6% 1.4% 10 20 30 5
13-1081 Logisticians 400 450 50 12.5% 1.3% 10 10 10 5
13-1111 Management Analysts 2,160 2,150 -10 -0.5% 0.0% 0 40 40 4
13-1121 Meeting and Convention Planners 240 250 10 4.2% 0.4% ** 10 10 5
13-1199 Business Operations Specialists, All Other 5,810 6,050 240 4.1% 0.4% 20 130 150 5
13-2000 Financial Specialists 10,400 11,300 900 8.7% 0.9% 100 180 270
13-2011 Accountants and Auditors 5,760 6,390 630 10.9% 1.1% 60 100 160 5
13-2021 Appraisers and Assessors of Real Estate 360 360 0 0.0% 0.0% 0 10 10 6
13-2031 Budget Analysts 420 460 40 9.5% 1.0% ** 10 10 5
13-2041 Credit Analysts 70 70 0 0.0% 0.0% ** ** ** 5
13-2051 Financial Analysts 470 540 70 14.9% 1.5% 10 10 20 5
13-2052 Personal Financial Advisors 540 660 120 22.2% 2.2% 10 10 20 5
13-2053 Insurance Underwriters 300 280 -20 -6.7% -0.7% 0 10 10 5
13-2061 Financial Examiners 90 120 30 33.3% 3.3% ** ** 10 5
13-2071 Loan Counselors 70 70 0 0.0% 0.0% 0 ** ** 5
13-2072 Loan Officers 1,110 1,180 70 6.3% 0.6% 10 10 20 10
13-2081 Tax Examiners, Collectors, and Revenue Agents 160 170 10 6.3% 0.6% ** 10 10 5
13-2082 Tax Preparers 330 260 -70 -21.2% -2.1% 0 10 10 10
13-2099 Financial Specialists, All Other 720 740 20 2.8% 0.3% ** 10 10 5
15-0000 Computer and Mathematical Occupations 9,160 10,190 1,030 11.2% 1.1% 120 180 290
15-1000 Computer Specialists 8,840 9,840 1,000 11.3% 1.1% 110 170 280
15-1011 Computer and Information Scientists, Research 70 70 0 0.0% 0.0% ** ** ** 2
15-1021 Computer Programmers 920 780 -140 -15.2% -1.5% 0 20 20 5
15-1031 Computer Software Engineers, Applications 880 1,060 180 20.5% 2.0% 20 10 30 5
15-1032 Computer Software Engineers, Systems Software 510 600 90 17.6% 1.8% 10 ** 10 5
15-1041 Computer Support Specialists 1,360 1,400 40 2.9% 0.3% ** 40 40 6
15-1051 Computer Systems Analysts 1,040 1,110 70 6.7% 0.7% 10 20 30 5
15-1061 Database Administrators 250 280 30 12.0% 1.2% ** ** 10 5
15-1071 Network and Computer Systems Administrators 960 1,080 120 12.5% 1.3% 10 20 30 5
15-1081 Network Systems and Data Communications Analysts 1,540 2,120 580 37.7% 3.8% 60 30 90 5
15-1099 Computer Specialists, All Other 1,330 1,340 10 0.8% 0.1% ** 30 30 6
Hawaii State Department of Labor and Industrial Relations • Research and Statistics Office • Employment Projections for Industries and Occupations, 2008-2018 24

SOC Avg. Ann. Trng.
Code Occupation Title 2008 2018 Net Percent Growth Growth Replacement Total Code*
Employment Growth Average Annual Openings
Long-term Occupational Projections, State of Hawaii, 2008-2018
15-2000 Mathematical Scientists 320 350 30 9.4% 0.9% ** 10 10
15-2011 Actuaries 40 50 10 25.0% 2.5% ** ** ** 4
15-2031 Operations Research Analysts 140 160 20 14.3% 1.4% ** ** 10 3
15-2041 Statisticians 140 140 0 0.0% 0.0% 0 ** ** 3
17-0000 Architecture and Engineering Occupations 9,640 9,590 -50 -0.5% -0.1% 20 200 220
17-1000 Architects, Surveyors, and Cartographers 1,230 1,160 -70 -5.7% -0.6% ** 20 30
17-1011 Architects, Except Landscape and Naval 770 720 -50 -6.5% -0.6% 0 10 10 5
17-1012 Landscape Architects 130 120 -10 -7.7% -0.8% 0 ** ** 5
17-1021 Cartographers and Photogrammetrists 70 80 10 14.3% 1.4% ** ** ** 5
17-1022 Surveyors 260 250 -10 -3.8% -0.4% 0 10 10 5
17-2000 Engineers 5,530 5,690 160 2.9% 0.3% 20 110 130
17-2011 Aerospace Engineers 20 20 0 0.0% 0.0% 0 0 0 5
17-2051 Civil Engineers 2,000 2,090 90 4.5% 0.5% 10 30 40 5
17-2061 Computer Hardware Engineers 150 150 0 0.0% 0.0% ** ** 10 5
17-2071 Electrical Engineers 640 640 0 0.0% 0.0% 0 20 20 5
17-2072 Electronics Engineers, Except Computer 540 530 -10 -1.9% -0.2% 0 10 10 5
17-2081 Environmental Engineers 230 240 10 4.3% 0.4% ** 10 10 5
17-2111 Health & Safety Engineers, Exc. Mining Safety Engineers & Inspectors 140 140 0 0.0% 0.0% ** ** ** 5
17-2112 Industrial Engineers 90 110 20 22.2% 2.2% ** ** ** 5
17-2121 Marine Engineers and Naval Architects 80 70 -10 -12.5% -1.3% 0 ** ** 5
17-2141 Mechanical Engineers 530 520 -10 -1.9% -0.2% 0 10 10 5
17-2199 Engineers, All Other 730 730 0 0.0% 0.0% ** 20 20 5
17-3000 Drafters, Engineering, and Mapping Technicians 2,880 2,750 -130 -4.5% -0.5% ** 60 60
17-3011 Architectural and Civil Drafters 780 670 -110 -14.1% -1.4% 0 20 20 7
17-3012 Electrical and Electronics Drafters 190 180 -10 -5.3% -0.5% 0 ** ** 7
17-3013 Mechanical Drafters 140 130 -10 -7.1% -0.7% 0 ** ** 7
17-3019 Drafters, All Other 70 70 0 0.0% 0.0% 0 ** ** 7
17-3022 Civil Engineering Technicians 150 150 0 0.0% 0.0% 0 ** ** 6
17-3023 Electrical and Electronic Engineering Technicians 540 540 0 0.0% 0.0% 0 10 10 6
17-3024 Electro-Mechanical Technicians 70 70 0 0.0% 0.0% 0 ** ** 6
17-3025 Environmental Engineering Technicians 20 20 0 0.0% 0.0% 0 0 0 6
17-3029 Engineering Technicians, Except Drafters, All Other 630 640 10 1.6% 0.2% ** 10 10 6
17-3031 Surveying and Mapping Technicians 200 200 0 0.0% 0.0% 0 ** ** 10
19-0000 Life, Physical, and Social Science Occupations 8,130 8,710 580 7.1% 0.7% 60 260 320
19-1000 Life Scientists 1,650 1,870 220 13.3% 1.3% 20 50 70
19-1013 Soil and Plant Scientists 190 200 10 5.3% 0.5% ** 10 10 5
19-1021 Biochemists and Biophysicists 30 40 10 33.3% 3.3% ** ** ** 2
19-1022 Microbiologists 100 100 0 0.0% 0.0% 0 ** ** 2
19-1023 Zoologists and Wildlife Biologists 150 160 10 6.7% 0.7% 0 10 10 5
19-1029 Biological Scientists, All Other 350 390 40 11.4% 1.1% ** 10 20 2
Hawaii State Department of Labor and Industrial Relations • Research and Statistics Office • Employment Projections for Industries and Occupations, 2008-2018 25

SOC Avg. Ann. Trng.
Code Occupation Title 2008 2018 Net Percent Growth Growth Replacement Total Code*
Employment Growth Average Annual Openings
Long-term Occupational Projections, State of Hawaii, 2008-2018
19-1031 Conservation Scientists 130 140 10 7.7% 0.8% 0 ** ** 5
19-1032 Foresters 20 20 0 0.0% 0.0% 0 0 0 5
19-1042 Medical Scientists, Except Epidemiologists 410 540 130 31.7% 3.2% 10 10 20 2
19-2000 Physical Scientists 1,620 1,710 90 5.6% 0.6% 10 50 60
19-2012 Physicists 80 90 10 12.5% 1.3% 0 ** ** 2
19-2031 Chemists 180 180 0 0.0% 0.0% 0 10 10 5
19-2041 Environmental Scientists and Specialists, Including Health 840 910 70 8.3% 0.8% 10 20 30 3
19-2042 Geoscientists, Except Hydrologists and Geographers 220 230 10 4.5% 0.5% ** 10 10 3
19-2043 Hydrologists 30 30 0 0.0% 0.0% 0 ** ** 3
19-2099 Physical Scientists, All Other 110 110 0 0.0% 0.0% 0 ** ** 5
19-3000 Social Scientists and Related Workers 2,790 3,020 230 8.2% 0.8% 20 90 110
19-3021 Market Research Analysts 370 430 60 16.2% 1.6% 10 10 20 5
19-3022 Survey Researchers 80 90 10 12.5% 1.3% ** ** ** 5
19-3031 Clinical, Counseling, and School Psychologists 1,060 1,140 80 7.5% 0.8% 10 30 40 2
19-3039 Psychologists, All Other 190 180 -10 -5.3% -0.5% 0 10 10 3
19-3051 Urban and Regional Planners 360 390 30 8.3% 0.8% ** 10 10 3
19-3091 Anthropologists and Archeologists 230 250 20 8.7% 0.9% ** 10 10 3
19-3093 Historians 30 20 -10 -33.3% -3.3% 0 ** ** 3
19-3099 Social Scientists and Related Workers, All Other 370 420 50 13.5% 1.4% 10 20 20 3
19-4000 Life, Physical, and Social Science Technicians 2,070 2,120 50 2.4% 0.2% 10 80 80
19-4011 Agricultural and Food Science Technicians 400 410 10 2.5% 0.3% ** 10 20 6
19-4021 Biological Technicians 680 680 0 0.0% 0.0% 0 20 20 5
19-4031 Chemical Technicians 90 90 0 0.0% 0.0% 0 ** ** 6
19-4091 Environmental Science and Protection Technicians, Including Health 180 200 20 11.1% 1.1% ** 10 10 6
19-4092 Forensic Science Technicians 80 90 10 12.5% 1.3% ** ** ** 5
19-4093 Forest and Conservation Technicians 140 140 0 0.0% 0.0% 0 10 10 6
19-4099 Life, Physical, and Social Science Technicians, All Other 430 430 0 0.0% 0.0% ** 20 20 6
21-0000 Community and Social Services Occupations 11,750 13,400 1,650 14.0% 1.4% 170 260 420
21-1000 Counselors, Social Workers, & Other Community & Social Service Specialists 10,660 12,210 1,550 14.5% 1.5% 160 240 390
21-1011 Substance Abuse and Behavioral Disorder Counselors 490 560 70 14.3% 1.4% 10 10 20 5
21-1012 Educational, Vocational, and School Counselors 1,590 1,770 180 11.3% 1.1% 20 30 50 3
21-1013 Marriage and Family Therapists 50 50 0 0.0% 0.0% 0 ** ** 3
21-1014 Mental Health Counselors 180 230 50 27.8% 2.8% 10 ** 10 3
21-1015 Rehabilitation Counselors 260 310 50 19.2% 1.9% 10 10 10 3
21-1019 Counselors, All Other 90 90 0 0.0% 0.0% ** ** ** 3
21-1021 Child, Family, and School Social Workers 1,660 1,770 110 6.6% 0.7% 10 40 50 5
21-1022 Medical and Public Health Social Workers 500 610 110 22.0% 2.2% 10 10 30 5
21-1023 Mental Health and Substance Abuse Social Workers 630 710 80 12.7% 1.3% 10 20 30 3
21-1029 Social Workers, All Other 390 420 30 7.7% 0.8% ** 10 10 5
21-1091 Health Educators 390 450 60 15.4% 1.5% 10 10 10 5
Hawaii State Department of Labor and Industrial Relations • Research and Statistics Office • Employment Projections for Industries and Occupations, 2008-2018 26
SOC Avg. Ann. Trng.
Code Occupation Title 2008 2018 Net Percent Growth Growth Replacement Total Code*
Employment Growth Average Annual Openings
Long-term Occupational Projections, State of Hawaii, 2008-2018
21-1092 Probation Officers and Correctional Treatment Specialists 390 440 50 12.8% 1.3% 10 10 10 5
21-1093 Social and Human Service Assistants 2,860 3,490 630 22.0% 2.2% 60 60 120 10
21-1099 Community and Social Service Specialists, All Other 1,190 1,300 110 9.2% 0.9% 10 30 40 5
21-2000 Religious Workers 1,080 1,200 120 11.1% 1.1% 10 20 30
21-2011 Clergy 750 830 80 10.7% 1.1% 10 20 20 3
21-2021 Directors, Religious Activities and Education 290 320 30 10.3% 1.0% ** 10 10 5
21-2099 Religious Workers, All Other 50 50 0 0.0% 0.0% 0 ** ** 5
23-0000 Legal Occupations 5,260 5,230 -30 -0.6% -0.1% 10 90 90
23-1000 Lawyers, Judges, and Related Workers 3,210 3,180 -30 -0.9% -0.1% 0 60 60
23-1011 Lawyers 2,970 2,950 -20 -0.7% -0.1% 0 60 60 1
23-1022 Arbitrators, Mediators, and Conciliators 30 30 0 0.0% 0.0% 0 ** ** 4
23-2000 Legal Support Workers 2,050 2,050 0 0.0% 0.0% 10 30 30
23-2011 Paralegals and Legal Assistants 1,020 1,060 40 3.9% 0.4% ** 10 20 6
23-2091 Court Reporters 40 40 0 0.0% 0.0% 0 ** ** 7
23-2092 Law Clerks 130 130 0 0.0% 0.0% 0 ** ** 5
23-2093 Title Examiners, Abstractors, and Searchers 450 400 -50 -11.1% -1.1% 0 10 10 10
23-2099 Legal Support Workers, All Other 410 420 10 2.4% 0.2% ** 10 10 10
25-0000 Education, Training, and Library Occupations 46,690 52,680 5,990 12.8% 1.3% 600 1,030 1,630
25-1000 Postsecondary Teachers 8,720 9,950 1,230 14.1% 1.4% 120 150 280
25-1011 Business Teachers, Postsecondary 290 330 40 13.8% 1.4% ** 10 10 2
25-1021 Computer Science Teachers, Postsecondary 110 120 10 9.1% 0.9% ** ** ** 2
25-1022 Mathematical Science Teachers, Postsecondary 200 230 30 15.0% 1.5% ** ** 10 2
25-1042 Biological Science Teachers, Postsecondary 600 680 80 13.3% 1.3% 10 10 20 2
25-1051 Atmospheric, Earth, Marine, & Space Sciences Teachers, Postsec. 200 230 30 15.0% 1.5% ** ** 10 2
25-1052 Chemistry Teachers, Postsecondary 60 70 10 16.7% 1.7% ** ** ** 2
25-1061 Anthropology and Archeology Teachers, Postsecondary 60 70 10 16.7% 1.7% ** ** ** 2
25-1064 Geography Teachers, Postsecondary 50 50 0 0.0% 0.0% ** ** ** 2
25-1065 Political Science Teachers, Postsecondary 60 70 10 16.7% 1.7% ** ** ** 2
25-1066 Psychology Teachers, Postsecondary 450 520 70 15.6% 1.6% 10 10 10 2
25-1067 Sociology Teachers, Postsecondary 140 150 10 7.1% 0.7% ** ** ** 2
25-1071 Health Specialties Teachers, Postsecondary 60 70 10 16.7% 1.7% ** ** ** 2
25-1072 Nursing Instructors and Teachers, Postsecondary 120 140 20 16.7% 1.7% ** ** ** 2
25-1081 Education Teachers, Postsecondary 790 900 110 13.9% 1.4% 10 10 30 2
25-1111 Criminal Justice and Law Enforcement Teachers, Postsecondary 180 210 30 16.7% 1.7% ** ** 10 2
25-1121 Art, Drama, and Music Teachers, Postsecondary 430 490 60 14.0% 1.4% 10 10 10 2
25-1122 Communications Teachers, Postsecondary 150 170 20 13.3% 1.3% ** ** 10 2
25-1123 English Language and Literature Teachers, Postsecondary 410 470 60 14.6% 1.5% 10 10 10 2
25-1124 Foreign Language and Literature Teachers, Postsecondary 340 380 40 11.8% 1.2% 10 10 10 2
25-1125 History Teachers, Postsecondary 180 200 20 11.1% 1.1% ** ** 10 2
25-1126 Philosophy and Religion Teachers, Postsecondary 180 200 20 11.1% 1.1% ** ** 10 2
Hawaii State Department of Labor and Industrial Relations • Research and Statistics Office • Employment Projections for Industries and Occupations, 2008-2018 27

SOC Avg. Ann. Trng.
Code Occupation Title 2008 2018 Net Percent Growth Growth Replacement Total Code*
Employment Growth Average Annual Openings
Long-term Occupational Projections, State of Hawaii, 2008-2018
25-1194 Vocational Education Teachers, Postsecondary 930 1,060 130 14.0% 1.4% 10 20 30 2
25-2000 Primary, Secondary, and Special Education School Teachers 24,230 27,170 2,940 12.1% 1.2% 290 610 900
25-2011 Preschool Teachers, Except Special Education 1,830 2,060 230 12.6% 1.3% 20 40 60 7
25-2012 Kindergarten Teachers, Except Special Education 140 160 20 14.3% 1.4% ** ** 10 5
25-2021 Elementary School Teachers, Except Special Education 9,450 10,840 1,390 14.7% 1.5% 140 220 350 5
25-2022 Middle School Teachers, Except Special and Vocational Education 1,370 1,570 200 14.6% 1.5% 20 30 50 5
25-2031 Secondary School Teachers, Except Special & Vocational Education 8,610 9,280 670 7.8% 0.8% 70 250 320 5
25-2041 Special Education Teachers, Preschool, Kindergarten, & Elem. School 1,440 1,680 240 16.7% 1.7% 30 40 60 5
25-2042 Special Education Teachers, Middle School 510 590 80 15.7% 1.6% 10 10 20 5
25-2043 Special Education Teachers, Secondary School 790 880 90 11.4% 1.1% 10 20 30 5
25-3000 Other Teachers and Instructors 5,370 6,400 1,030 19.2% 1.9% 100 80 190
25-3011 Adult Literacy, Remedial Education, and GED Teachers & Instructors 910 1,050 140 15.4% 1.5% 10 10 30 5
25-3021 Self-Enrichment Education Teachers 2,080 2,690 610 29.3% 2.9% 60 30 90 8
25-3099 Teachers and Instructors, All Other 2,370 2,660 290 12.2% 1.2% 30 40 70 5
25-4000 Librarians, Curators, and Archivists 1,060 1,120 60 5.7% 0.6% 10 30 40
25-4011 Archivists 20 20 0 0.0% 0.0% 0 ** ** 3
25-4012 Curators 30 40 10 33.3% 3.3% 0 ** ** 3
25-4013 Museum Technicians and Conservators 40 50 10 25.0% 2.5% ** ** ** 5
25-4021 Librarians 700 730 30 4.3% 0.4% ** 20 20 3
25-4031 Library Technicians 270 290 20 7.4% 0.7% ** 10 10 7
25-9000 Other Education, Training, and Library Occupations 7,310 8,040 730 10.0% 1.0% 70 160 230
25-9031 Instructional Coordinators 790 970 180 22.8% 2.3% 20 20 40 3
25-9041 Teacher Assistants 5,670 6,140 470 8.3% 0.8% 50 120 170 11
25-9099 Education, Training, and Library Workers, All Other 810 910 100 12.3% 1.2% 10 20 30 5
27-0000 Arts, Design, Entertainment, Sports, and Media Occupations 14,700 15,740 1,040 7.1% 0.7% 120 370 490
27-1000 Art and Design Workers 3,480 3,700 220 6.3% 0.6% 20 100 120
27-1011 Art Directors 210 210 0 0.0% 0.0% ** 10 10 4
27-1012 Craft Artists 140 140 0 0.0% 0.0% 0 ** ** 9
27-1013 Fine Artists, Including Painters, Sculptors, and Illustrators 90 90 0 0.0% 0.0% 0 ** ** 9
27-1021 Commercial and Industrial Designers 60 70 10 16.7% 1.7% ** ** ** 5
27-1023 Floral Designers 280 260 -20 -7.1% -0.7% 0 10 10 11
27-1024 Graphic Designers 740 770 30 4.1% 0.4% ** 20 30 5
27-1025 Interior Designers 160 160 0 0.0% 0.0% 0 10 10 6
27-1026 Merchandise Displayers and Window Trimmers 870 930 60 6.9% 0.7% 10 30 30 10
27-2000 Entertainers and Performers, Sports and Related Workers 4,740 5,210 470 9.9% 1.0% 50 120 170
27-2011 Actors 340 400 60 17.6% 1.8% 10 10 10 9
27-2012 Producers and Directors 380 400 20 5.3% 0.5% ** 10 20 4
27-2022 Coaches and Scouts 1,140 1,410 270 23.7% 2.4% 30 20 50 9
27-2031 Dancers 820 840 20 2.4% 0.2% ** 40 40 9
27-2041 Music Directors and Composers 180 200 20 11.1% 1.1% ** ** 10 4
Hawaii State Department of Labor and Industrial Relations • Research and Statistics Office • Employment Projections for Industries and Occupations, 2008-2018 28

SOC Avg. Ann. Trng.
Code Occupation Title 2008 2018 Net Percent Growth Growth Replacement Total Code*
Employment Growth Average Annual Openings
Long-term Occupational Projections, State of Hawaii, 2008-2018
27-2042 Musicians and Singers 1,520 1,590 70 4.6% 0.5% 10 30 40 9
27-2099 Entertainers and Performers, Sports and Related Workers, All Other 260 280 20 7.7% 0.8% ** 10 10 9
27-3000 Media and Communication Workers 3,840 4,210 370 9.6% 1.0% 40 90 130
27-3011 Radio and Television Announcers 290 270 -20 -6.9% -0.7% 0 10 10 9
27-3012 Public Address System and Other Announcers 70 70 0 0.0% 0.0% 0 ** ** 10
27-3022 Reporters and Correspondents 90 90 0 0.0% 0.0% 0 ** ** 5
27-3031 Public Relations Specialists 1,490 1,730 240 16.1% 1.6% 20 40 60 5
27-3041 Editors 350 360 10 2.9% 0.3% ** 10 10 5
27-3043 Writers and Authors 480 540 60 12.5% 1.3% 10 10 20 5
27-3091 Interpreters and Translators 320 410 90 28.1% 2.8% 10 10 20 9
27-3099 Media and Communication Workers, All Other 350 360 10 2.9% 0.3% ** 10 10 9
27-4000 Media and Communication Equipment Workers 2,650 2,620 -30 -1.1% -0.1% 10 60 70
27-4011 Audio and Video Equipment Technicians 410 430 20 4.9% 0.5% ** 10 10 7
27-4014 Sound Engineering Technicians 50 50 0 0.0% 0.0% ** ** ** 7
27-4021 Photographers 1,350 1,260 -90 -6.7% -0.7% 0 30 30 9
27-4031 Camera Operators, Television, Video, and Motion Picture 140 150 10 7.1% 0.7% ** ** ** 5
27-4032 Film and Video Editors 160 180 20 12.5% 1.3% ** ** 10 5
27-4099 Media and Communication Equipment Workers, All Other 270 280 10 3.7% 0.4% ** 10 10 10
29-0000 Healthcare Practitioners and Technical Occupations 26,730 30,730 4,000 15.0% 1.5% 400 530 930
29-1000 Health Diagnosing and Treating Practitioners 18,330 21,140 2,810 15.3% 1.5% 280 340 620
29-1011 Chiropractors 150 150 0 0.0% 0.0% ** ** ** 1
29-1021 Dentists, General 670 670 0 0.0% 0.0% 0 20 20 1
29-1029 Dentists, All Other Specialists 80 90 10 12.5% 1.3% ** ** ** 1
29-1031 Dietitians and Nutritionists 220 250 30 13.6% 1.4% ** 10 10 5
29-1041 Optometrists 390 420 30 7.7% 0.8% ** 10 20 1
29-1051 Pharmacists 950 1,080 130 13.7% 1.4% 10 20 30 1
29-1061 Anesthesiologists 350 380 30 8.6% 0.9% ** 10 10 1
29-1062 Family and General Practitioners 1,020 1,130 110 10.8% 1.1% 10 20 30 1
29-1063 Internists, General 400 430 30 7.5% 0.8% ** 10 10 1
29-1064 Obstetricians and Gynecologists 250 270 20 8.0% 0.8% ** ** 10 1
29-1065 Pediatricians, General 130 140 10 7.7% 0.8% ** ** ** 1
29-1066 Psychiatrists 180 200 20 11.1% 1.1% ** ** ** 1
29-1067 Surgeons 380 410 30 7.9% 0.8% ** 10 10 1
29-1069 Physicians and Surgeons, All Other 980 1,050 70 7.1% 0.7% 10 20 20 1
29-1071 Physician Assistants 310 390 80 25.8% 2.6% 10 10 10 3
29-1111 Registered Nurses 9,120 10,850 1,730 19.0% 1.9% 170 160 330 6
29-1122 Occupational Therapists 290 330 40 13.8% 1.4% ** 10 10 3
29-1123 Physical Therapists 1,090 1,340 250 22.9% 2.3% 30 10 40 3
29-1125 Recreational Therapists 70 90 20 28.6% 2.9% ** ** 10 5
29-1126 Respiratory Therapists 410 510 100 24.4% 2.4% 10 10 20 6
Hawaii State Department of Labor and Industrial Relations • Research and Statistics Office • Employment Projections for Industries and Occupations, 2008-2018 29

SOC Avg. Ann. Trng.
Code Occupation Title 2008 2018 Net Percent Growth Growth Replacement Total Code*
Employment Growth Average Annual Openings
Long-term Occupational Projections, State of Hawaii, 2008-2018
29-1127 Speech-Language Pathologists 400 440 40 10.0% 1.0% ** 10 10 3
29-1129 Therapists, All Other 80 90 10 12.5% 1.3% ** ** ** 5
29-1131 Veterinarians 190 200 10 5.3% 0.5% ** ** ** 1
29-1199 Health Diagnosing and Treating Practitioners, All Other 180 200 20 11.1% 1.1% ** ** 10 5
29-2000 Health Technologists and Technicians 7,780 8,910 1,130 14.5% 1.5% 110 170 290
29-2011 Medical and Clinical Laboratory Technologists 600 680 80 13.3% 1.3% 10 10 20 5
29-2012 Medical and Clinical Laboratory Technicians 780 890 110 14.1% 1.4% 10 20 30 6
29-2021 Dental Hygienists 710 840 130 18.3% 1.8% 10 20 30 6
29-2031 Cardiovascular Technologists and Technicians 120 150 30 25.0% 2.5% ** ** 10 6
29-2032 Diagnostic Medical Sonographers 170 190 20 11.8% 1.2% ** ** ** 6
29-2033 Nuclear Medicine Technologists 60 70 10 16.7% 1.7% ** ** ** 6
29-2034 Radiologic Technologists and Technicians 780 860 80 10.3% 1.0% 10 10 20 6
29-2041 Emergency Medical Technicians and Paramedics 520 520 0 0.0% 0.0% 0 10 10 7
29-2051 Dietetic Technicians 30 40 10 33.3% 3.3% ** ** ** 7
29-2052 Pharmacy Technicians 910 1,170 260 28.6% 2.9% 30 20 50 10
29-2055 Surgical Technologists 220 270 50 22.7% 2.3% ** 10 10 7
29-2056 Veterinary Technologists and Technicians 240 260 20 8.3% 0.8% ** 10 10 6
29-2061 Licensed Practical and Licensed Vocational Nurses 1,460 1,720 260 17.8% 1.8% 30 50 70 7
29-2071 Medical Records and Health Information Technicians 670 740 70 10.4% 1.0% 10 10 20 6
29-2081 Opticians, Dispensing 90 100 10 11.1% 1.1% ** ** ** 9
29-2099 Health Technologists and Technicians, All Other 300 320 20 6.7% 0.7% ** 10 10 7
29-9000 Other Healthcare Practitioners and Technical Occupations 620 690 70 11.3% 1.1% 10 20 30
29-9011 Occupational Health and Safety Specialists 370 390 20 5.4% 0.5% ** 10 10 5
29-9012 Occupational Health and Safety Technicians 20 20 0 0.0% 0.0% 0 ** ** 6
29-9091 Athletic Trainers 120 150 30 25.0% 2.5% ** ** 10 5
29-9099 Healthcare Practitioners and Technical Workers, All Other 120 120 0 0.0% 0.0% ** ** 10 5
31-0000 Healthcare Support Occupations 14,600 17,380 2,780 19.0% 1.9% 280 170 450
31-1000 Nursing, Psychiatric, and Home Health Aides 6,150 7,750 1,600 26.0% 2.6% 160 60 220
31-1011 Home Health Aides 720 1,070 350 48.6% 4.9% 40 10 40 11
31-1012 Nursing Aides, Orderlies, and Attendants 4,970 6,160 1,190 23.9% 2.4% 120 50 170 7
31-1013 Psychiatric Aides 450 520 70 15.6% 1.6% 10 10 10 11
31-2000 Occupational and Physical Therapist Assistants and Aides 450 570 120 26.7% 2.7% 10 10 20
31-2021 Physical Therapist Assistants 240 300 60 25.0% 2.5% 10 ** 10 6
31-2022 Physical Therapist Aides 100 120 20 20.0% 2.0% ** ** ** 11
31-9000 Other Healthcare Support Occupations 8,010 9,070 1,060 13.2% 1.3% 110 110 210
31-9011 Massage Therapists 1,250 1,340 90 7.2% 0.7% 10 20 30 7
31-9091 Dental Assistants 1,710 2,000 290 17.0% 1.7% 30 30 60 10
31-9092 Medical Assistants 2,790 3,340 550 19.7% 2.0% 60 30 90 10
31-9093 Medical Equipment Preparers 260 280 20 7.7% 0.8% ** ** 10 11
31-9094 Medical Transcriptionists 150 160 10 6.7% 0.7% ** ** ** 7
Hawaii State Department of Labor and Industrial Relations • Research and Statistics Office • Employment Projections for Industries and Occupations, 2008-2018 30
SOC Avg. Ann. Trng.
Code Occupation Title 2008 2018 Net Percent Growth Growth Replacement Total Code*
Employment Growth Average Annual Openings
Long-term Occupational Projections, State of Hawaii, 2008-2018
31-9095 Pharmacy Aides 220 210 -10 -4.5% -0.5% 0 ** ** 11
31-9096 Veterinary Assistants and Laboratory Animal Caretakers 280 270 -10 -3.6% -0.4% 0 ** ** 11
31-9099 Healthcare Support Workers, All Other 1,340 1,470 130 9.7% 1.0% 10 20 30 11
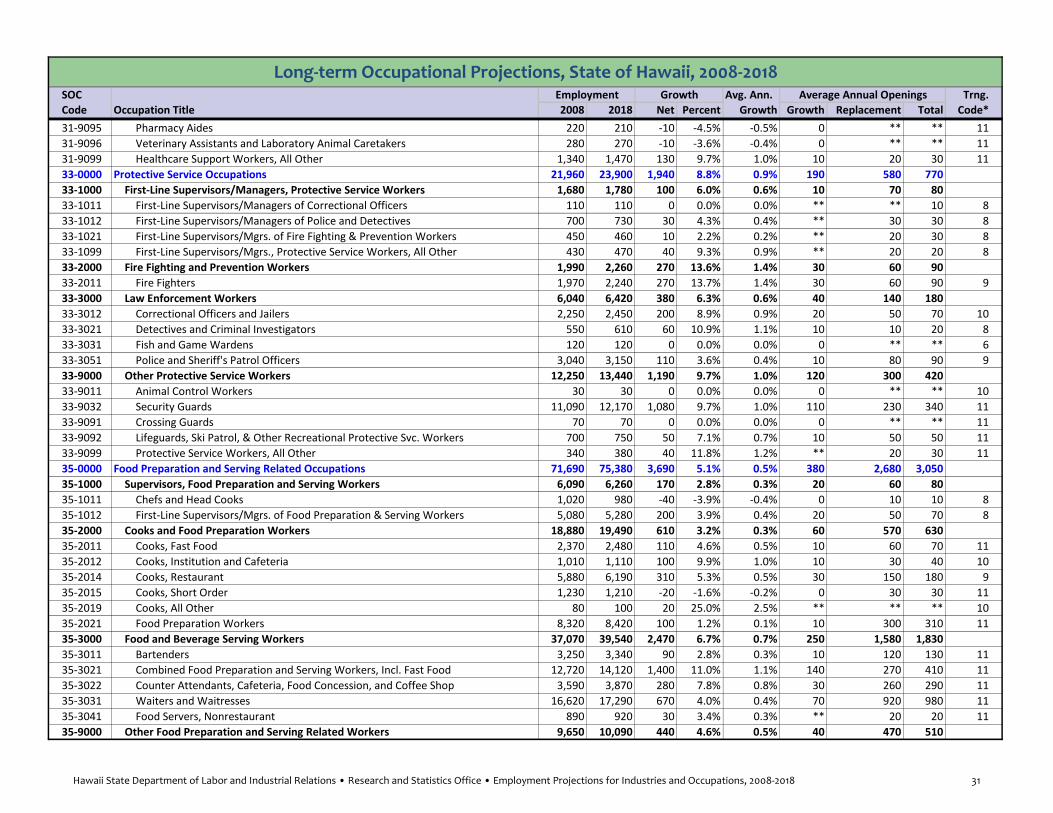
33-0000 Protective Service Occupations 21,960 23,900 1,940 8.8% 0.9% 190 580 770
33-1000 First-Line Supervisors/Managers, Protective Service Workers 1,680 1,780 100 6.0% 0.6% 10 70 80
33-1011 First-Line Supervisors/Managers of Correctional Officers 110 110 0 0.0% 0.0% ** ** 10 8
33-1012 First-Line Supervisors/Managers of Police and Detectives 700 730 30 4.3% 0.4% ** 30 30 8
33-1021 First-Line Supervisors/Mgrs. of Fire Fighting & Prevention Workers 450 460 10 2.2% 0.2% ** 20 30 8
33-1099 First-Line Supervisors/Mgrs., Protective Service Workers, All Other 430 470 40 9.3% 0.9% ** 20 20 8
33-2000 Fire Fighting and Prevention Workers 1,990 2,260 270 13.6% 1.4% 30 60 90
33-2011 Fire Fighters 1,970 2,240 270 13.7% 1.4% 30 60 90 9
33-3000 Law Enforcement Workers 6,040 6,420 380 6.3% 0.6% 40 140 180
33-3012 Correctional Officers and Jailers 2,250 2,450 200 8.9% 0.9% 20 50 70 10
33-3021 Detectives and Criminal Investigators 550 610 60 10.9% 1.1% 10 10 20 8
33-3031 Fish and Game Wardens 120 120 0 0.0% 0.0% 0 ** ** 6
33-3051 Police and Sheriff's Patrol Officers 3,040 3,150 110 3.6% 0.4% 10 80 90 9
33-9000 Other Protective Service Workers 12,250 13,440 1,190 9.7% 1.0% 120 300 420
33-9011 Animal Control Workers 30 30 0 0.0% 0.0% 0 ** ** 10
33-9032 Security Guards 11,090 12,170 1,080 9.7% 1.0% 110 230 340 11
33-9091 Crossing Guards 70 70 0 0.0% 0.0% 0 ** ** 11
33-9092 Lifeguards, Ski Patrol, & Other Recreational Protective Svc. Workers 700 750 50 7.1% 0.7% 10 50 50 11
33-9099 Protective Service Workers, All Other 340 380 40 11.8% 1.2% ** 20 30 11
35-0000 Food Preparation and Serving Related Occupations 71,690 75,380 3,690 5.1% 0.5% 380 2,680 3,050
35-1000 Supervisors, Food Preparation and Serving Workers 6,090 6,260 170 2.8% 0.3% 20 60 80
35-1011 Chefs and Head Cooks 1,020 980 -40 -3.9% -0.4% 0 10 10 8
35-1012 First-Line Supervisors/Mgrs. of Food Preparation & Serving Workers 5,080 5,280 200 3.9% 0.4% 20 50 70 8
35-2000 Cooks and Food Preparation Workers 18,880 19,490 610 3.2% 0.3% 60 570 630
35-2011 Cooks, Fast Food 2,370 2,480 110 4.6% 0.5% 10 60 70 11
35-2012 Cooks, Institution and Cafeteria 1,010 1,110 100 9.9% 1.0% 10 30 40 10
35-2014 Cooks, Restaurant 5,880 6,190 310 5.3% 0.5% 30 150 180 9
35-2015 Cooks, Short Order 1,230 1,210 -20 -1.6% -0.2% 0 30 30 11
35-2019 Cooks, All Other 80 100 20 25.0% 2.5% ** ** ** 10
35-2021 Food Preparation Workers 8,320 8,420 100 1.2% 0.1% 10 300 310 11
35-3000 Food and Beverage Serving Workers 37,070 39,540 2,470 6.7% 0.7% 250 1,580 1,830
35-3011 Bartenders 3,250 3,340 90 2.8% 0.3% 10 120 130 11
35-3021 Combined Food Preparation and Serving Workers, Incl. Fast Food 12,720 14,120 1,400 11.0% 1.1% 140 270 410 11
35-3022 Counter Attendants, Cafeteria, Food Concession, and Coffee Shop 3,590 3,870 280 7.8% 0.8% 30 260 290 11
35-3031 Waiters and Waitresses 16,620 17,290 670 4.0% 0.4% 70 920 980 11
35-3041 Food Servers, Nonrestaurant 890 920 30 3.4% 0.3% ** 20 20 11
35-9000 Other Food Preparation and Serving Related Workers 9,650 10,090 440 4.6% 0.5% 40 470 510
Hawaii State Department of Labor and Industrial Relations • Research and Statistics Office • Employment Projections for Industries and Occupations, 2008-2018 31

SOC Avg. Ann. Trng.
Code Occupation Title 2008 2018 Net Percent Growth Growth Replacement Total Code*
Employment Growth Average Annual Openings
Long-term Occupational Projections, State of Hawaii, 2008-2018
35-9011 Dining Room and Cafeteria Attendants and Bartender Helpers 3,850 3,980 130 3.4% 0.3% 10 170 180 11
35-9021 Dishwashers 3,490 3,740 250 7.2% 0.7% 30 140 170 11
35-9031 Hosts and Hostesses, Restaurant, Lounge, and Coffee Shop 2,110 2,160 50 2.4% 0.2% 10 150 150 11
35-9099 Food Preparation and Serving Related Workers, All Other 200 210 10 5.0% 0.5% ** 10 10 11
37-0000 Building and Grounds Cleaning and Maintenance Occupations 39,690 41,630 1,940 4.9% 0.5% 190 650 840
37-1000 Supervisors, Building and Grounds Cleaning and Maintenance Workers 3,210 3,380 170 5.3% 0.5% 20 30 50
37-1011 First-Line Supervisors/Mgrs. of Housekeeping & Janitorial Workers 1,680 1,720 40 2.4% 0.2% ** 20 20 8
37-1012 First-Line Suprvrs./Mgrs.of Landscpg., Lawn Svc., & Groundskpg. Wrkr. 1,530 1,660 130 8.5% 0.8% 10 20 30 8
37-2000 Building Cleaning and Pest Control Workers 25,540 26,000 460 1.8% 0.2% 50 480 530
37-2011 Janitors and Cleaners, Except Maids and Housekeeping Cleaners 14,260 14,450 190 1.3% 0.1% 20 270 290 11
37-2012 Maids and Housekeeping Cleaners 10,670 10,900 230 2.2% 0.2% 20 190 220 11
37-3000 Grounds Maintenance Workers 10,940 12,250 1,310 12.0% 1.2% 130 130 260
37-3011 Landscaping and Groundskeeping Workers 10,140 11,310 1,170 11.5% 1.2% 120 120 240 11
37-3012 Pesticide Handlers, Sprayers, and Applicators, Vegetation 80 90 10 12.5% 1.3% ** ** ** 10
37-3013 Tree Trimmers and Pruners 650 780 130 20.0% 2.0% 10 10 20 11
37-3019 Grounds Maintenance Workers, All Other 70 70 0 0.0% 0.0% 0 ** ** 11
39-0000 Personal Care and Service Occupations 26,910 32,390 5,480 20.4% 2.0% 550 670 1,220
39-1000 Supervisors, Personal Care and Service Workers 1,790 2,060 270 15.1% 1.5% 30 50 80
39-1021 First-Line Supervisors/Managers of Personal Service Workers 1,780 2,060 280 15.7% 1.6% 30 50 80 8
39-2000 Animal Care and Service Workers 650 740 90 13.8% 1.4% 10 10 20
39-2011 Animal Trainers 280 340 60 21.4% 2.1% 10 10 10 10
39-2021 Nonfarm Animal Caretakers 370 400 30 8.1% 0.8% ** 10 10 11
39-3000 Entertainment Attendants and Related Workers 2,190 2,480 290 13.2% 1.3% 30 120 150
39-3021 Motion Picture Projectionists 50 60 10 20.0% 2.0% 0 ** ** 11
39-3031 Ushers, Lobby Attendants, and Ticket Takers 460 530 70 15.2% 1.5% 10 30 40 11
39-3091 Amusement and Recreation Attendants 1,320 1,460 140 10.6% 1.1% 10 70 80 11
39-3093 Locker Room, Coatroom, and Dressing Room Attendants 220 270 50 22.7% 2.3% 10 10 20 11
39-4000 Funeral Service Workers 80 90 10 12.5% 1.3% ** ** 10
39-4011 Embalmers 40 40 0 0.0% 0.0% 0 ** ** 7
39-4021 Funeral Attendants 40 60 20 50.0% 5.0% ** ** ** 11
39-5000 Personal Appearance Workers 3,900 4,780 880 22.6% 2.3% 90 60 150
39-5012 Hairdressers, Hairstylists, and Cosmetologists 2,130 2,650 520 24.4% 2.4% 50 30 80 7
39-5093 Shampooers 160 190 30 18.8% 1.9% ** ** 10 11
39-5094 Skin Care Specialists 380 490 110 28.9% 2.9% 10 10 20 7
39-6000 Transportation, Tourism, and Lodging Attendants 6,380 6,680 300 4.7% 0.5% 30 200 230
39-6011 Baggage Porters and Bellhops 1,440 1,520 80 5.6% 0.6% 10 40 50 11
39-6012 Concierges 600 660 60 10.0% 1.0% 10 20 20 10
39-6021 Tour Guides and Escorts 2,410 2,410 0 0.0% 0.0% 0 100 100 10
39-6031 Flight Attendants 1,280 1,390 110 8.6% 0.9% 10 30 40 9
39-9000 Other Personal Care and Service Workers 11,930 15,570 3,640 30.5% 3.1% 360 230 590
Hawaii State Department of Labor and Industrial Relations • Research and Statistics Office • Employment Projections for Industries and Occupations, 2008-2018 32

SOC Avg. Ann. Trng.
Code Occupation Title 2008 2018 Net Percent Growth Growth Replacement Total Code*
Employment Growth Average Annual Openings
Long-term Occupational Projections, State of Hawaii, 2008-2018
39-9011 Child Care Workers 3,180 3,520 340 10.7% 1.1% 30 90 130 11
39-9021 Personal and Home Care Aides 5,110 7,840 2,730 53.4% 5.3% 270 60 340 11
39-9031 Fitness Trainers and Aerobics Instructors 710 880 170 23.9% 2.4% 20 10 30 7
39-9032 Recreation Workers 1,740 1,980 240 13.8% 1.4% 20 30 60 11
39-9041 Residential Advisors 120 140 20 16.7% 1.7% ** ** 10 11
39-9099 Personal Care and Service Workers, All Other 1,070 1,200 130 12.1% 1.2% 10 20 40 11
41-0000 Sales and Related Occupations 72,510 76,530 4,020 5.5% 0.6% 420 2,100 2,520
41-1000 Supervisors, Sales Workers 11,960 12,550 590 4.9% 0.5% 60 260 310
41-1011 First-Line Supervisors/Managers of Retail Sales Workers 9,630 10,100 470 4.9% 0.5% 50 210 250 8
41-1012 First-Line Supervisors/Managers of Non-Retail Sales Workers 2,330 2,460 130 5.6% 0.6% 10 50 60 8
41-2000 Retail Sales Workers 43,510 46,380 2,870 6.6% 0.7% 290 1,470 1,760
41-2011 Cashiers 14,880 15,550 670 4.5% 0.5% 70 670 740 11
41-2021 Counter and Rental Clerks 1,850 1,890 40 2.2% 0.2% ** 50 50 11
41-2022 Parts Salespersons 650 670 20 3.1% 0.3% ** 20 30 10
41-2031 Retail Salespersons 26,140 28,270 2,130 8.1% 0.8% 210 730 940 11
41-3000 Sales Representatives, Services 6,660 6,780 120 1.8% 0.2% 20 150 170
41-3011 Advertising Sales Agents 390 370 -20 -5.1% -0.5% 0 10 10 10
41-3021 Insurance Sales Agents 1,090 1,190 100 9.2% 0.9% 10 30 40 7
41-3031 Securities, Commodities, and Financial Services Sales Agents 860 900 40 4.7% 0.5% ** 30 30 5
41-3041 Travel Agents 1,100 1,020 -80 -7.3% -0.7% 0 10 10 7
41-3099 Sales Representatives, Services, All Other 3,220 3,290 70 2.2% 0.2% 10 80 90 8
41-4000 Sales Representatives, Wholesale and Manufacturing 5,880 6,320 440 7.5% 0.7% 40 140 180
41-4011 Sales Representatives, Wholesale & Mfg., Technical & Scientific Prod. 610 620 10 1.6% 0.2% ** 10 20 8
41-4012 Sales Representatives, Wholesale & Mfg., exc. Tech. & Scientific Prod. 5,280 5,700 420 8.0% 0.8% 40 120 160 8
41-9000 Other Sales and Related Workers 4,490 4,500 10 0.2% 0.0% 10 90 100
41-9011 Demonstrators and Product Promoters 630 590 -40 -6.3% -0.6% 0 20 20 10
41-9021 Real Estate Brokers 730 740 10 1.4% 0.1% ** 10 10 8
41-9022 Real Estate Sales Agents 1,410 1,520 110 7.8% 0.8% 10 20 30 7
41-9041 Telemarketers 470 410 -60 -12.8% -1.3% 0 10 10 11
41-9099 Sales and Related Workers, All Other 710 710 0 0.0% 0.0% 0 20 20 10
43-0000 Office and Administrative Support Occupations 103,880 107,210 3,330 3.2% 0.3% 580 2,130 2,700
43-1000 Supervisors, Office and Administrative Support Workers 7,410 7,900 490 6.6% 0.7% 50 170 220
43-1011 First-Line Supervisors/Managers of Office & Admin. Support Workers 7,410 7,900 490 6.6% 0.7% 50 170 220 8
43-2000 Communications Equipment Operators 930 800 -130 -14.0% -1.4% 0 20 20
43-2011 Switchboard Operators, Including Answering Service 890 760 -130 -14.6% -1.5% 0 20 20 11
43-3000 Financial Clerks 15,000 15,720 720 4.8% 0.5% 80 280 360
43-3011 Bill and Account Collectors 1,100 1,250 150 13.6% 1.4% 20 20 40 11
43-3021 Billing and Posting Clerks and Machine Operators 1,840 1,950 110 6.0% 0.6% 10 30 40 11
43-3031 Bookkeeping, Accounting, and Auditing Clerks 8,550 9,010 460 5.4% 0.5% 50 100 150 10
43-3051 Payroll and Timekeeping Clerks 730 650 -80 -11.0% -1.1% 0 20 20 10
Hawaii State Department of Labor and Industrial Relations • Research and Statistics Office • Employment Projections for Industries and Occupations, 2008-2018 33

SOC Avg. Ann. Trng.
Code Occupation Title 2008 2018 Net Percent Growth Growth Replacement Total Code*
Employment Growth Average Annual Openings
Long-term Occupational Projections, State of Hawaii, 2008-2018
43-3061 Procurement Clerks 460 470 10 2.2% 0.2% ** 10 20 10
43-3071 Tellers 2,340 2,380 40 1.7% 0.2% 10 100 100 11
43-4000 Information and Record Clerks 26,860 28,000 1,140 4.2% 0.4% 200 750 950
43-4011 Brokerage Clerks 90 80 -10 -11.1% -1.1% 0 ** ** 10
43-4031 Court, Municipal, and License Clerks 910 950 40 4.4% 0.4% ** 30 30 11
43-4041 Credit Authorizers, Checkers, and Clerks 100 90 -10 -10.0% -1.0% 0 ** ** 11
43-4051 Customer Service Representatives 7,020 8,000 980 14.0% 1.4% 100 220 320 10
43-4071 File Clerks 730 510 -220 -30.1% -3.0% 0 20 20 11
43-4081 Hotel, Motel, and Resort Desk Clerks 2,500 2,810 310 12.4% 1.2% 30 90 120 11
43-4111 Interviewers, Except Eligibility and Loan 660 670 10 1.5% 0.2% ** 20 20 11
43-4121 Library Assistants, Clerical 340 370 30 8.8% 0.9% ** 10 20 11
43-4131 Loan Interviewers and Clerks 820 810 -10 -1.2% -0.1% 0 20 20 11
43-4141 New Accounts Clerks 340 330 -10 -2.9% -0.3% 0 10 10 8
43-4151 Order Clerks 750 570 -180 -24.0% -2.4% 0 20 20 11
43-4161 Human Resources Assistants, Except Payroll and Timekeeping 1,200 1,080 -120 -10.0% -1.0% 0 30 30 11
43-4171 Receptionists and Information Clerks 4,130 4,370 240 5.8% 0.6% 20 110 140 11
43-4181 Reservation and Transportation Ticket Agents and Travel Clerks 5,060 5,350 290 5.7% 0.6% 30 110 140 11
43-4199 Information and Record Clerks, All Other 1,270 1,020 -250 -19.7% -2.0% 0 40 40 11
43-5000 Material Recording, Scheduling, Dispatching, and Distributing Workers 15,810 16,540 730 4.6% 0.5% 110 370 480
43-5011 Cargo and Freight Agents 500 610 110 22.0% 2.2% 10 10 20 10
43-5021 Couriers and Messengers 510 500 -10 -2.0% -0.2% 0 10 10 11
43-5031 Police, Fire, and Ambulance Dispatchers 260 290 30 11.5% 1.2% ** 10 10 10
43-5032 Dispatchers, Except Police, Fire, and Ambulance 1,050 1,020 -30 -2.9% -0.3% 0 20 20 10
43-5041 Meter Readers, Utilities 110 90 -20 -18.2% -1.8% 0 ** ** 11
43-5051 Postal Service Clerks 500 460 -40 -8.0% -0.8% 0 10 10 11
43-5052 Postal Service Mail Carriers 1,160 1,310 150 12.9% 1.3% 20 40 50 11
43-5053 Postal Service Mail Sorters, Processors, & Processing Machine Oper. 550 440 -110 -20.0% -2.0% 0 10 10 11
43-5061 Production, Planning, and Expediting Clerks 860 900 40 4.7% 0.5% 10 20 30 10
43-5071 Shipping, Receiving, and Traffic Clerks 2,320 2,200 -120 -5.2% -0.5% 0 60 60 11
43-5081 Stock Clerks and Order Fillers 7,770 8,530 760 9.8% 1.0% 80 180 250 11
43-5111 Weighers, Measurers, Checkers, and Samplers, Recordkeeping 220 200 -20 -9.1% -0.9% 0 10 10 11
43-6000 Secretaries and Administrative Assistants 15,130 15,490 360 2.4% 0.2% 50 200 260
43-6011 Executive Secretaries and Administrative Assistants 5,490 5,870 380 6.9% 0.7% 40 70 110 8
43-6012 Legal Secretaries 690 650 -40 -5.8% -0.6% 0 10 10 6
43-6013 Medical Secretaries 1,070 1,230 160 15.0% 1.5% 20 20 30 10
43-6014 Secretaries, Except Legal, Medical, and Executive 7,880 7,740 -140 -1.8% -0.2% 0 110 110 10
43-9000 Other Office and Administrative Support Workers 22,730 22,770 40 0.2% 0.0% 90 330 430
43-9011 Computer Operators 390 330 -60 -15.4% -1.5% 0 ** ** 10
43-9021 Data Entry Keyers 850 730 -120 -14.1% -1.4% 0 20 20 10
43-9022 Word Processors and Typists 2,140 1,900 -240 -11.2% -1.1% 0 20 20 10
Hawaii State Department of Labor and Industrial Relations • Research and Statistics Office • Employment Projections for Industries and Occupations, 2008-2018 34

SOC Avg. Ann. Trng.
Code Occupation Title 2008 2018 Net Percent Growth Growth Replacement Total Code*
Employment Growth Average Annual Openings
Long-term Occupational Projections, State of Hawaii, 2008-2018
43-9031 Desktop Publishers 70 50 -20 -28.6% -2.9% 0 ** ** 7
43-9041 Insurance Claims and Policy Processing Clerks 540 520 -20 -3.7% -0.4% 0 10 10 10
43-9051 Mail Clerks and Mail Machine Operators, Except Postal Service 300 250 -50 -16.7% -1.7% 0 10 10 11
43-9061 Office Clerks, General 15,710 16,650 940 6.0% 0.6% 90 210 310 11
43-9071 Office Machine Operators, Except Computer 190 160 -30 -15.8% -1.6% 0 10 10 11
43-9081 Proofreaders and Copy Markers 30 30 0 0.0% 0.0% 0 ** ** 11
43-9111 Statistical Assistants 80 80 0 0.0% 0.0% 0 ** ** 10
43-9199 Office and Administrative Support Workers, All Other 2,440 2,080 -360 -14.8% -1.5% 0 60 60 11
45-0000 Farming, Fishing, and Forestry Occupations 5,070 5,470 400 7.9% 0.8% 40 140 180
45-1000 Supervisors, Farming, Fishing, and Forestry Workers 360 400 40 11.1% 1.1% ** 10 10
45-2000 Agricultural Workers 4,320 4,670 350 8.1% 0.8% 40 120 150
45-2011 Agricultural Inspectors 120 120 0 0.0% 0.0% ** ** ** 8
45-2091 Agricultural Equipment Operators 130 130 0 0.0% 0.0% ** ** ** 11
45-2092 Farmworkers and Laborers, Crop, Nursery, and Greenhouse 3,430 3,770 340 9.9% 1.0% 30 90 130 11
45-2093 Farmworkers, Farm and Ranch Animals 540 530 -10 -1.9% -0.2% 0 10 10 11
47-0000 Construction and Extraction Occupations 44,080 46,880 2,800 6.4% 0.6% 300 740 1,030
47-1000 Supervisors, Construction and Extraction Workers 2,810 3,060 250 8.9% 0.9% 30 50 80
47-1011 First-Line Supervisors/Mgrs. of Const. Trades & Extraction Workers 2,810 3,060 250 8.9% 0.9% 30 50 80 8
47-2000 Construction Trades Workers 37,460 39,740 2,280 6.1% 0.6% 240 600 840
47-2021 Brickmasons and Blockmasons 480 480 0 0.0% 0.0% ** 10 10 9
47-2022 Stonemasons 130 140 10 7.7% 0.8% 0 ** ** 9
47-2031 Carpenters 10,430 11,080 650 6.2% 0.6% 70 130 200 9
47-2041 Carpet Installers 510 470 -40 -7.8% -0.8% 0 10 10 10
47-2042 Floor Layers, Except Carpet, Wood, and Hard Tiles 150 140 -10 -6.7% -0.7% 0 ** ** 10
47-2044 Tile and Marble Setters 970 1,040 70 7.2% 0.7% 10 30 30 9
47-2051 Cement Masons and Concrete Finishers 1,070 1,110 40 3.7% 0.4% ** 30 30 10
47-2061 Construction Laborers 6,510 7,420 910 14.0% 1.4% 90 40 140 10
47-2071 Paving, Surfacing, and Tamping Equipment Operators 270 300 30 11.1% 1.1% ** ** 10 10
47-2073 Operating Engineers and Other Construction Equipment Operators 2,060 2,250 190 9.2% 0.9% 20 40 50 10
47-2081 Drywall and Ceiling Tile Installers 820 850 30 3.7% 0.4% ** 10 10 10
47-2082 Tapers 420 430 10 2.4% 0.2% ** 10 10 10
47-2111 Electricians 3,360 3,500 140 4.2% 0.4% 10 80 100 9
47-2121 Glaziers 460 460 0 0.0% 0.0% ** 20 20 9
47-2141 Painters, Construction and Maintenance 3,670 3,710 40 1.1% 0.1% ** 60 70 10
47-2151 Pipelayers 110 120 10 9.1% 0.9% ** ** ** 11
47-2152 Plumbers, Pipefitters, and Steamfitters 3,200 3,380 180 5.6% 0.6% 20 70 80 9
47-2161 Plasterers and Stucco Masons 350 340 -10 -2.9% -0.3% 0 10 10 9
47-2171 Reinforcing Iron and Rebar Workers 100 100 0 0.0% 0.0% ** ** ** 9
47-2181 Roofers 740 700 -40 -5.4% -0.5% 0 10 10 10
47-2211 Sheet Metal Workers 940 930 -10 -1.1% -0.1% 0 20 20 9
Hawaii State Department of Labor and Industrial Relations • Research and Statistics Office • Employment Projections for Industries and Occupations, 2008-2018 35

SOC Avg. Ann. Trng.
Code Occupation Title 2008 2018 Net Percent Growth Growth Replacement Total Code*
Employment Growth Average Annual Openings
Long-term Occupational Projections, State of Hawaii, 2008-2018
47-2221 Structural Iron and Steel Workers 440 480 40 9.1% 0.9% ** 10 10 9
47-3000 Helpers, Construction Trades 1,910 2,060 150 7.9% 0.8% 20 40 60
47-3011 Helpers-Brickmasons, Blockmasons, Stonemasons, Tile/Marble Settr. 200 220 20 10.0% 1.0% ** ** 10 11
47-3012 Helpers--Carpenters 530 630 100 18.9% 1.9% 10 10 20 11
47-3013 Helpers--Electricians 410 470 60 14.6% 1.5% 10 10 10 11
47-3015 Helpers--Pipelayers, Plumbers, Pipefitters, and Steamfitters 280 310 30 10.7% 1.1% ** 10 10 11
47-3019 Helpers, Construction Trades, All Other 140 150 10 7.1% 0.7% ** ** ** 11
47-4000 Other Construction and Related Workers 1,590 1,660 70 4.4% 0.4% 10 40 50
47-4011 Construction and Building Inspectors 800 830 30 3.8% 0.4% ** 20 20 8
47-4021 Elevator Installers and Repairers 300 290 -10 -3.3% -0.3% 0 10 10 9
47-4031 Fence Erectors 20 30 10 50.0% 5.0% 0 0 0 10
47-4041 Hazardous Materials Removal Workers 280 300 20 7.1% 0.7% ** 10 10 10
47-4071 Septic Tank Servicers and Sewer Pipe Cleaners 30 40 10 33.3% 3.3% ** ** ** 10
47-4099 Construction and Related Workers, All Other 150 170 20 13.3% 1.3% ** 10 10 10
47-5000 Extraction Workers 330 370 40 12.1% 1.2% ** 10 10
47-5021 Earth Drillers, Except Oil and Gas 110 120 10 9.1% 0.9% ** ** ** 10
47-5081 Helpers--Extraction Workers 80 80 0 0.0% 0.0% 0 ** ** 11
49-0000 Installation, Maintenance, and Repair Occupations 22,950 24,480 1,530 6.7% 0.7% 170 450 610
49-1000 Supervisors of Installation, Maintenance, and Repair Workers 2,310 2,420 110 4.8% 0.5% 10 60 70
49-1011 First-Line Supervisors/Mgrs. of Mechanics, Installers, & Repairers 2,310 2,420 110 4.8% 0.5% 10 60 70 8
49-2000 Electrical and Electronic Equipment Mechanics, Installers, and Repairers 2,640 2,640 0 0.0% 0.0% 10 50 60
49-2011 Computer, Automated Teller, and Office Machine Repairers 580 540 -40 -6.9% -0.7% 0 10 10 7
49-2022 Telecommunications Equipment Installers & Repairers, Exc. Line Inst. 740 680 -60 -8.1% -0.8% 0 10 10 7
49-2091 Avionics Technicians 60 60 0 0.0% 0.0% 0 ** ** 7
49-2093 Electrical & Electronics Installers & Repairers, Transportation Equip. 80 80 0 0.0% 0.0% 0 ** ** 7
49-2094 Electrical & Electronics Repairers, Commercial & Industrial Equip. 430 450 20 4.7% 0.5% ** 10 10 7
49-2095 Electrical & Electronics Repairers, Powerhouse, Substation, & Relay 80 110 30 37.5% 3.8% ** ** ** 7
49-2097 Electronic Home Entertainment Equipment Installers and Repairers 170 170 0 0.0% 0.0% 0 ** ** 7
49-2098 Security and Fire Alarm Systems Installers 210 240 30 14.3% 1.4% ** ** 10 7
49-3000 Vehicle and Mobile Equipment Mechanics, Installers 5,990 6,290 300 5.0% 0.5% 30 120 150
49-3011 Aircraft Mechanics and Service Technicians 880 910 30 3.4% 0.3% ** 20 20 7
49-3021 Automotive Body and Related Repairers 540 570 30 5.6% 0.6% ** 10 20 9
49-3023 Automotive Service Technicians and Mechanics 2,930 3,080 150 5.1% 0.5% 20 60 70 7
49-3031 Bus and Truck Mechanics and Diesel Engine Specialists 750 800 50 6.7% 0.7% 10 20 20 7
49-3041 Farm Equipment Mechanics 20 20 0 0.0% 0.0% 0 0 0 9
49-3042 Mobile Heavy Equipment Mechanics, Except Engines 410 430 20 4.9% 0.5% ** 10 10 9
49-3051 Motorboat Mechanics 50 50 0 0.0% 0.0% 0 ** ** 9
49-3052 Motorcycle Mechanics 70 70 0 0.0% 0.0% ** ** ** 9
49-3053 Outdoor Power Equipment and Other Small Engine Mechanics 100 100 0 0.0% 0.0% ** ** ** 10
49-3091 Bicycle Repairers 30 40 10 33.3% 3.3% ** ** ** 10
Hawaii State Department of Labor and Industrial Relations • Research and Statistics Office • Employment Projections for Industries and Occupations, 2008-2018 36

SOC Avg. Ann. Trng.
Code Occupation Title 2008 2018 Net Percent Growth Growth Replacement Total Code*
Employment Growth Average Annual Openings
Long-term Occupational Projections, State of Hawaii, 2008-2018
49-3093 Tire Repairers and Changers 160 170 10 6.3% 0.6% ** ** ** 11
49-9000 Other Installation, Maintenance, and Repair Occupations 12,000 13,140 1,140 9.5% 1.0% 110 220 330
49-9012 Control and Valve Installers and Repairers, Except Mechanical Door 80 80 0 0.0% 0.0% 0 ** ** 10
49-9021 Heating, Air Conditioning, and Refrigeration Mechanics & Installers 900 970 70 7.8% 0.8% 10 10 20 7
49-9031 Home Appliance Repairers 140 150 10 7.1% 0.7% ** ** ** 9
49-9041 Industrial Machinery Mechanics 630 730 100 15.9% 1.6% 10 10 20 9
49-9042 Maintenance and Repair Workers, General 6,830 7,560 730 10.7% 1.1% 70 110 180 10
49-9043 Maintenance Workers, Machinery 220 250 30 13.6% 1.4% ** ** 10 10
49-9051 Electrical Power-Line Installers and Repairers 310 320 10 3.2% 0.3% ** 10 10 9
49-9052 Telecommunications Line Installers and Repairers 280 270 -10 -3.6% -0.4% 0 ** ** 9
49-9062 Medical Equipment Repairers 100 130 30 30.0% 3.0% ** ** 10 6
49-9091 Coin, Vending, and Amusement Machine Servicers and Repairers 60 80 20 33.3% 3.3% ** ** ** 10
49-9092 Commercial Divers 70 80 10 14.3% 1.4% ** ** ** 7
49-9094 Locksmiths and Safe Repairers 30 30 0 0.0% 0.0% 0 ** ** 10
49-9098 Helpers--Installation, Maintenance, and Repair Workers 750 810 60 8.0% 0.8% 10 40 40 11
49-9099 Installation, Maintenance, and Repair Workers, All Other 1,190 1,250 60 5.0% 0.5% 10 20 20 10
51-0000 Production Occupations 17,620 18,440 820 4.7% 0.5% 110 350 460
51-1000 Supervisors, Production Workers 1,450 1,500 50 3.4% 0.3% 10 20 30
51-1011 First-Line Supervisors/Managers of Production & Operating Workers 1,450 1,500 50 3.4% 0.3% 10 20 30 8
51-2000 Assemblers and Fabricators 1,490 1,640 150 10.1% 1.0% 20 30 50
51-2041 Structural Metal Fabricators and Fitters 180 190 10 5.6% 0.6% ** ** 10 10
51-2092 Team Assemblers 540 590 50 9.3% 0.9% 10 10 20 10
51-2099 Assemblers and Fabricators, All Other 620 700 80 12.9% 1.3% 10 10 20 10
51-3000 Food Processing Workers 3,320 3,540 220 6.6% 0.7% 20 90 110
51-3011 Bakers 1,550 1,580 30 1.9% 0.2% ** 40 40 9
51-3021 Butchers and Meat Cutters 510 540 30 5.9% 0.6% ** 20 20 9
51-3022 Meat, Poultry, and Fish Cutters and Trimmers 420 480 60 14.3% 1.4% 10 10 20 11
51-3092 Food Batchmakers 690 770 80 11.6% 1.2% 10 20 30 11
51-3093 Food Cooking Machine Operators and Tenders 70 70 0 0.0% 0.0% 0 ** ** 11
51-4000 Metal Workers and Plastic Workers 1,580 1,620 40 2.5% 0.3% 10 30 40
51-4031 Cutting, Punch., & Press Mach. Setters, Oper., & Tenders, Metal & Plas. 20 20 0 0.0% 0.0% 0 0 0 10
51-4041 Machinists 410 420 10 2.4% 0.2% ** 10 10 9
51-4072 Molding, Core., & Casting Mach. Setters, Oper., & Tndrs, Metal & Plas. 120 120 0 0.0% 0.0% ** ** ** 10
51-4121 Welders, Cutters, Solderers, and Brazers 610 640 30 4.9% 0.5% ** 20 20 7
51-5000 Printing Workers 720 670 -50 -6.9% -0.7% 0 10 10
51-5022 Prepress Technicians and Workers 70 60 -10 -14.3% -1.4% 0 ** ** 7
51-5023 Printing Machine Operators 540 510 -30 -5.6% -0.6% 0 10 10 10
51-6000 Textile, Apparel, and Furnishings Workers 3,020 2,980 -40 -1.3% -0.1% ** 40 40
51-6011 Laundry and Dry-Cleaning Workers 1,440 1,450 10 0.7% 0.1% ** 30 30 10
51-6021 Pressers, Textile, Garment, and Related Materials 530 500 -30 -5.7% -0.6% 0 ** ** 11
Hawaii State Department of Labor and Industrial Relations • Research and Statistics Office • Employment Projections for Industries and Occupations, 2008-2018 37

SOC Avg. Ann. Trng.
Code Occupation Title 2008 2018 Net Percent Growth Growth Replacement Total Code*
Employment Growth Average Annual Openings
Long-term Occupational Projections, State of Hawaii, 2008-2018
51-6031 Sewing Machine Operators 500 450 -50 -10.0% -1.0% 0 ** ** 10
51-6052 Tailors, Dressmakers, and Custom Sewers 230 250 20 8.7% 0.9% ** ** ** 9
51-6062 Textile Cutting Machine Setters, Operators, and Tenders 30 20 -10 -33.3% -3.3% 0 0 0 10
51-6099 Textile, Apparel, and Furnishings Workers, All Other 90 100 10 11.1% 1.1% ** ** ** 11
51-7000 Woodworkers 640 710 70 10.9% 1.1% 10 10 20
51-7011 Cabinetmakers and Bench Carpenters 330 350 20 6.1% 0.6% ** 10 10 9
51-7099 Woodworkers, All Other 190 210 20 10.5% 1.1% ** ** 10 10
51-8000 Plant and System Operators 1,120 1,290 170 15.2% 1.5% 20 30 50
51-8013 Power Plant Operators 310 370 60 19.4% 1.9% 10 10 20 9
51-8021 Stationary Engineers and Boiler Operators 110 120 10 9.1% 0.9% ** ** ** 9
51-8031 Water and Liquid Waste Treatment Plant and System Operators 350 430 80 22.9% 2.3% 10 10 20 9
51-8093 Petroleum Pump System Operators, Refinery Operators, and Gaugers 190 200 10 5.3% 0.5% 0 ** ** 9
51-9000 Other Production Occupations 4,290 4,500 210 4.9% 0.5% 30 80 110
51-9012 Sep., Filtering, Clarifying, Precip., & Still Mach. Settrs, Oper., & Tndrs. 80 100 20 25.0% 2.5% ** ** ** 10
51-9021 Crushing, Grinding, & Polishing Machine Setters, Oper., & Tenders 70 70 0 0.0% 0.0% 0 ** ** 10
51-9023 Mixing and Blending Machine Setters, Operators, and Tenders 110 130 20 18.2% 1.8% ** ** ** 10
51-9032 Cutting and Slicing Machine Setters, Operators, and Tenders 80 80 0 0.0% 0.0% 0 ** ** 10
51-9041 Extruding, Form., Press., & Compacting Mach. Setters, Oper., & Tenders 110 140 30 27.3% 2.7% ** ** 10 10
51-9061 Inspectors, Testers, Sorters, Samplers, and Weighers 600 630 30 5.0% 0.5% ** 10 10 10
51-9071 Jewelers and Precious Stone and Metal Workers 340 390 50 14.7% 1.5% 10 10 10 7
51-9081 Dental Laboratory Technicians 190 210 20 10.5% 1.1% ** ** 10 10
51-9083 Ophthalmic Laboratory Technicians 130 130 0 0.0% 0.0% 0 ** ** 10
51-9111 Packaging and Filling Machine Operators and Tenders 620 630 10 1.6% 0.2% ** 10 10 11
51-9122 Painters, Transportation Equipment 130 140 10 7.7% 0.8% ** ** 10 10
51-9123 Painting, Coating, and Decorating Workers 20 20 0 0.0% 0.0% 0 ** ** 11
51-9131 Photographic Process Workers 60 40 -20 -33.3% -3.3% 0 ** ** 11
51-9132 Photographic Processing Machine Operators 250 180 -70 -28.0% -2.8% 0 10 10 11
51-9194 Etchers and Engravers 40 50 10 25.0% 2.5% ** 0 ** 9
51-9195 Molders, Shapers, and Casters, Except Metal and Plastic 80 80 0 0.0% 0.0% 0 ** ** 10
51-9198 Helpers--Production Workers 890 940 50 5.6% 0.6% 10 20 20 11
51-9199 Production Workers, All Other 310 350 40 12.9% 1.3% ** 10 10 10
53-0000 Transportation and Material Moving Occupations 39,400 41,300 1,900 4.8% 0.5% 230 980 1,210
53-1000 Supervisors, Transportation and Material Moving Workers 1,990 2,030 40 2.0% 0.2% 10 40 40
53-1011 Aircraft Cargo Handling Supervisors 60 70 10 16.7% 1.7% ** ** ** 8
53-1021 First-Line Suprv./Mgrs. of Helpers, Laborers, & Mat. Movers, Hand 810 870 60 7.4% 0.7% 10 10 20 8
53-1031 First-Line Suprv./Mgrs. of Transp. & Mat.-Moving Mach. & Vehicle Oper. 1,120 1,090 -30 -2.7% -0.3% 0 20 20 8
53-2000 Air Transportation Workers 930 1,030 100 10.8% 1.1% 10 30 40
53-2012 Commercial Pilots 320 370 50 15.6% 1.6% 10 10 20 7
53-2021 Air Traffic Controllers 310 330 20 6.5% 0.6% ** 10 10 9
53-3000 Motor Vehicle Operators 15,320 16,810 1,490 9.7% 1.0% 150 270 420
Hawaii State Department of Labor and Industrial Relations • Research and Statistics Office • Employment Projections for Industries and Occupations, 2008-2018 38

SOC Avg. Ann. Trng.
Code Occupation Title 2008 2018 Net Percent Growth Growth Replacement Total Code*
Employment Growth Average Annual Openings
Long-term Occupational Projections, State of Hawaii, 2008-2018
53-3021 Bus Drivers, Transit and Intercity 2,670 2,880 210 7.9% 0.8% 20 50 70 10
53-3022 Bus Drivers, School 960 1,100 140 14.6% 1.5% 10 20 30 10
53-3031 Driver/Sales Workers 800 840 40 5.0% 0.5% ** 10 20 11
53-3032 Truck Drivers, Heavy and Tractor-Trailer 4,190 4,740 550 13.1% 1.3% 60 80 130 11
53-3033 Truck Drivers, Light or Delivery Services 4,750 5,080 330 6.9% 0.7% 30 90 120 11
53-3041 Taxi Drivers and Chauffeurs 1,650 1,870 220 13.3% 1.3% 20 30 50 11
53-5000 Water Transportation Workers 980 1,160 180 18.4% 1.8% 20 40 60
53-5011 Sailors and Marine Oilers 380 430 50 13.2% 1.3% 10 20 20 11
53-5021 Captains, Mates, and Pilots of Water Vessels 530 660 130 24.5% 2.5% 10 20 40 8
53-6000 Other Transportation Workers 3,480 3,630 150 4.3% 0.4% 20 130 150
53-6021 Parking Lot Attendants 1,590 1,650 60 3.8% 0.4% 10 60 60 11
53-6031 Service Station Attendants 570 530 -40 -7.0% -0.7% 0 20 20 11
53-6041 Traffic Technicians 40 40 0 0.0% 0.0% 0 ** ** 11
53-6051 Transportation Inspectors 180 210 30 16.7% 1.7% ** ** 10 8
53-6099 Transportation Workers, All Other 1,100 1,190 90 8.2% 0.8% 10 40 50 11
53-7000 Material Moving Workers 16,700 16,630 -70 -0.4% 0.0% 30 480 510
53-7011 Conveyor Operators and Tenders 110 100 -10 -9.1% -0.9% 0 ** ** 11
53-7021 Crane and Tower Operators 120 110 -10 -8.3% -0.8% 0 ** ** 9
53-7032 Excavating and Loading Machine and Dragline Operators 80 80 0 0.0% 0.0% 0 ** ** 10
53-7051 Industrial Truck and Tractor Operators 1,300 1,420 120 9.2% 0.9% 10 40 50 11
53-7061 Cleaners of Vehicles and Equipment 1,690 1,760 70 4.1% 0.4% 10 60 70 11
53-7062 Laborers and Freight, Stock, and Material Movers, Hand 9,010 8,890 -120 -1.3% -0.1% 0 290 290 11
53-7063 Machine Feeders and Offbearers 410 320 -90 -22.0% -2.2% 0 10 10 11
53-7064 Packers and Packagers, Hand 2,940 2,840 -100 -3.4% -0.3% 0 50 50 11
53-7072 Pump Operators, Except Wellhead Pumpers 60 60 0 0.0% 0.0% 0 ** ** 10
53-7081 Refuse and Recyclable Material Collectors 620 720 100 16.1% 1.6% 10 20 30 11
53-7199 Material Moving Workers, All Other 240 230 -10 -4.2% -0.4% 0 ** ** 10
*See Appendix A for Training Code definitions
**The number of openings are greater than zero but less than ten.
Hawaii State Department of Labor and Industrial Relations • Research and Statistics Office • Employment Projections for Industries and Occupations, 2008-2018 39

Hawaii State Department of Labor and Industrial Relations • Research and Statistics Office • Employment Projections for Industries and Occupations 2008‐2018 40
Appendix A Definition of Education and Training Codes
Education & Training
Code
Type of Education and Training
Definition
1 First‐professional degree Requires at least 3 years of full‐time academic study beyond a bachelor’s degree
2 Doctoral degree Requires at least 3 years of full‐time academic study beyond a bachelor’s degree
3 Master’s degree Requires 1 or 2 years of full‐time academic study beyond a bachelor’s degree
4 Bachelor’s or higher degree, plus work experience
Requires experience in a related nonmanagerial position for which a bachelor’s or higher degree is required
5 Bachelor’s degree Requires at least 4 years of full‐time academic study beyond high school
6 Associate’s degree Requires at least 2 years of full‐time academic study beyond high school
7 Postsecondary vocational award Program length ranges from several weeks to a year or more and leads to a certificate but not a degree
8 Work experience in a related occupation
Requires skills and training acquired in a related occupation
9 Long‐term on‐the‐job training Requires 12 months of on‐the‐job training or combined work experience and formal classroom instruction, such as apprenticeships and employer‐sponsored training
10 Moderate‐term on‐the‐job training Requires 1 to 12 months of combined on‐the‐job experience and informal training
11 Short‐term on‐the‐job training Requires a short demonstration of job duties or 1 month or less of on‐the‐job experience or instruction
Source: U.S. Department of Labor, Bureau of Labor Statistics.
Hawaii State Department of Labor and Industrial Relations • Research and Statistics Office • Employment Projections for Industries and Occupations 2008‐2018 41
This report contains data for eleven major industry divisions. Goods‐producing industries Natural resources and mining is made up of two parts:
• Agriculture, forestry, fishing, and hunting which is comprised of growing crops, raising animals, harvesting timber, and harvesting fish and other animals from a farm, ranch, or their natural habitats; and
• Mining activities of extracting naturally occurring mineral solids, liquid minerals, and gases. Construction is made up of establishments primarily engaged in the construction of buildings and other structures, heavy construction other than buildings, and alterations, reconstruction, installation, and maintenance and repairs. Manufacturing includes the mechanical, physical, or chemical transformation of materials, substances, or components into new products. Services‐providing industries Trade, transportation, and utilities is comprised of:
• Wholesale trade includes activities of selling or arranging for the purchase or sale of goods for resale; capital or durable non‐consumer goods; and raw and intermediate materials and supplies used in production, and providing services incidental to the sale of the merchandise;
• Retail trade includes retailing merchandise, generally in small quantities to the general public and providing services incidental to the sale of merchandise;
• Transportation and warehousing includes industries providing transportation of passengers and cargo, warehousing and storing goods, scenic and sightseeing transportation, and supporting these activities; and
• Utilities sector activities include the provision of utility services. Information includes the following activities: a) producing and distributing information and cultural products; b) providing the means to transmit or distribute these products as well as data or communications; and c) processing data.
Appendix B: Industry
Definitions

Hawaii State Department of Labor and Industrial Relations • Research and Statistics Office • Employment Projections for Industries and Occupations 2008‐2018 42
Financial activities consists of: • Finance and insurance involves the creation, liquidation, or change in ownership of financial
transactions and/or facilitating financial transactions; and • Real estate and rental and leasing includes activities such as renting, leasing, or otherwise
allowing the use of tangible or intangible assets, and establishments providing related services. Professional and business services has three sectors:
• Professional, scientific, and technical services is comprised of establishments that specialize in performing professional, scientific, and technical activities for the operations of other organizations;
• Management of companies and enterprises involve the holding of securities of companies and enterprises, for the purpose of owning controlling interest or influencing their management decisions, or administering, overseeing, and managing other establishments of the same company or enterprise and normally undertaking the strategic or organizational planning and decision‐making of the company or enterprise; and
• Administrative and support and waste management and remediation services include performing routine support activities for the day‐to‐day operations of other organizations.
Education and health services is made up of two sectors:
• Educational services involves providing instruction and training in a wide variety of subjects; and • Health care and social assistance provides health care and social assistance for individuals.
Appendix B: Industry
Definitions (continued)

Hawaii State Department of Labor and Industrial Relations • Research and Statistics Office • Employment Projections for Industries and Occupations 2008‐2018 43
The occupational classification system used in this publication corresponds to the Standard Occupational Classification (SOC) system. Four levels of occupational classifications are used in this publication: broad group, major group, minor group, broad occupation, and detailed occupation. Each lower level of detail identifies a more specific group of occupations. Each occupation is classified in one of 22 major groups. Major groups are broken into minor groups, which in turn are divided into broad occupations. Broad occupations are then divided into one or more detailed occupations. Each item in the hierarchy is designated by a six‐digit code, an SOC code. The first two digits of the SOC code represent the major group such as 11‐0000 for Management Occupations. Major groups end with “0000.” The third digit, represents the minor occupational group such as 11‐3000 for Operations Specialties Managers. Minor groups end with “000.” The fourth and fifth digits represent the broad occupation such as 11‐3040 for Human Resources Managers. Broad occupations end with “0.” And the sixth digit represents the detailed occupation, such as 11‐3041 for Compensation and Benefits Managers. Detailed occupations end with a non‐zero. An alternate hierarchy used in this publication is an intermediate aggregation of 10 broad groups. It basically recognizes the major groups as broad groups with the following aggregations of major groups into broad groups:
1) Management, business, and financial broad group consists of the following major groups: management; and business and financial operations.
2) Professional and related broad group consists of the following major groups: computer and mathematical; architecture and engineering; life, physical, and social science; community and social services; legal; education, training, and library; arts, design, entertainment, sports and media; and healthcare practitioners and technical.
3) Service broad group consists of the major groups: healthcare support; protective service; food preparation and serving related; building and grounds cleaning and maintenance; and personal care and service.
Appendix C: Occupational
Classifications

Hawaii State Department of Labor and Industrial Relations • Research and Statistics Office • Employment Projections for Industries and Occupations 2008‐2018 44
The following paragraphs provide a brief definition of each major group. Management Occupations consist of managers responsible for the policy‐making, planning, directing, or coordination of work activities of an establishment or organization. Examples include financial managers, construction managers, and engineering managers. Business and Financial Operations Occupations include business operations specialists such as business agents, buyers, claims adjusters, appraisers and examiners, compliance officers, cost estimators, emergency management specialists, human resources specialists, logisticians, management analysts, and meeting planners; and financial specialists like accountants and auditors, real estate appraisers, budget analysts, credit analysts, financial analysts, financial examiners, loan counselors, and tax examiners. Computer and Mathematical Occupations include computer specialists who perform computer research, programming, software development, provide technical assistance, database administration, and network administration. Mathematical science occupations develop and apply mathematical theory to analyze statistical data, which provides useful information that may assist in decision‐making or policy formulation. Architecture and Engineering Occupations are primarily responsible for planning and designing structures, land areas, machines, and processes. Also included are drafters and engineering and mapping technicians. Life, Physical, and Social Science Occupations are comprised of life scientists including agriculture, biological, conservation, and medical scientists; physical scientists such as astronomers and physicists, atmospheric and space scientists, chemists, and environmental scientists; and social scientists and related workers like economists, market researchers, psychologists, sociologists, and urban and regional planners. Community and Social Service Occupations provide services such as counseling, social services, and religious worship to various groups or individuals. Legal Occupations consists of lawyers, judges, arbitrators, mediators, magistrates, and legal support workers such as paralegals, law clerks, court reporters, and title examiners.
Appendix C: Occupational
Classifications (continued)
Hawaii State Department of Labor and Industrial Relations • Research and Statistics Office • Employment Projections for Industries and Occupations 2008‐2018 45
Education, Training, and Library Occupations include postsecondary, primary, secondary, and special education teachers, adult literacy instructors, librarians, curators, archivists, library technicians and teacher assistants. Arts, Design, Entertainment, Sports and Media Occupations are comprised of art and design workers such as craft and multi‐media artists, fashion, floral, graphic, and interior designers; entertainers and performers, sports and related workers, consisting of actors, athletes, dancers, and musicians; media and communication workers including announcers, reporters, public relations specialists, and writers; and media and communication equipment workers which includes broadcast technicians, radio operators, photographers and camera operators. Healthcare Practitioner and Technical Occupations includes workers directly involved in the diagnosis and treatment of health‐related matters. This occupational group includes physicians, chiropractors, dentists, pharmacists, physician assistants, registered nurses, therapists, veterinarians, and health technologists and technicians. Healthcare Support Occupations perform healthcare duties under the direct supervision of medical staff. Those classified under this category include home health aides, physical therapist assistants, dental assistants, pharmacy aides, and massage therapists. Protective Service Occupations protect people and property. Workers in this group include law enforcement workers, fire fighters, animal control workers, and security guards. Food Preparation and Serving Related Occupations prepare, clean, and serve meals and beverages to patrons. Examples of workers in this group are cooks, bartenders, waiters and waitresses, dining room attendants, and hosts and hostesses. Building and Grounds Cleaning and Maintenance Occupations consists of building cleaning and pest control workers and grounds maintenance workers who clean and maintain the interior of buildings and property grounds. First‐line supervisors are also included. Personal Care and Service Occupations include entertainment attendants, funeral service workers, personal appearance workers, transportation attendants, childcare workers, and recreation workers.
Appendix C: Occupational
Classifications (continued)

Hawaii State Department of Labor and Industrial Relations • Research and Statistics Office • Employment Projections for Industries and Occupations 2008‐2018 46
Sales and Related Occupations influence or assist customers in the purchase of merchandise, real estate, services, or investments. This category includes retail salespersons, travel agents, cashiers, and insurance brokers. Office and Administrative Support Occupations perform office and clerical tasks such as typing, filing, computer operations, record keeping, mail preparation, and distribution. Examples include tellers, hotel desk clerks, and public safety dispatchers. Farming, Fishing, and Forestry Occupations include agriculture inspectors, graders and sorters, and forest and conservation workers. Also included are the first‐line supervisors of these workers. Construction and Extraction Occupations construct, assemble, maintain, install, and perform repair work on structures and fixtures. This may involve the use of hand and power tools. Examples of jobs classified under this group include boilermakers, carpenters, electricians, painters, and construction trades helpers. Installation, Maintenance, and Repair Occupations primarily deal with electrical and electronic equipment or vehicle and mobile equipment. They repair, maintain, install, test, or make adjustments to the equipment using various power and hand tools. Examples of workers in this field include telecommunications equipment installers, aircraft mechanics, and medical equipment repairers. Production Occupations include assemblers and fabricators, food processing workers, metal and plastic workers, printing workers, textile and apparel workers, woodworkers, and plant and system operators. Workers employed as bakers, machinists, printing machine operators, and cabinetmakers would be included in this occupational group. Transportation and Material Moving Occupations consist of air transportation workers which includes aircraft pilots and air traffic controllers; motor vehicle operators such as ambulance drivers and attendants, bus drivers, and delivery drivers; water transportation workers like sailors, boat captains, and ship engineers; other transportation workers including parking lot attendants, service station attendants, traffic technicians, and transportation inspectors; and material moving workers including conveyor operators, crane operators, dredging and excavating operators, hoist and winch operators, laborers, pumping station operators, refuse collectors, and truck and ship loaders.
Appendix C: Occupational
Classifications (continued)