employment integration of refugees: the influence of …ftp.iza.org/dp2551.pdf · employment...
TRANSCRIPT

IZA DP No. 2551
Employment Integration of Refugees:The Influence of Local Factors onRefugee Job Opportunities in Sweden
Pieter BevelanderChrister Lundh
DI
SC
US
SI
ON
PA
PE
R S
ER
IE
S
Forschungsinstitutzur Zukunft der ArbeitInstitute for the Studyof Labor
January 2007

Employment Integration of Refugees:
The Influence of Local Factors on Refugee Job Opportunities in Sweden
Pieter Bevelander IMER, Malmö University
and IZA Bonn
Christer Lundh Göteborg University
Discussion Paper No. 2551 January 2007
IZA
P.O. Box 7240 53072 Bonn
Germany
Phone: +49-228-3894-0 Fax: +49-228-3894-180
E-mail: [email protected]
Any opinions expressed here are those of the author(s) and not those of the institute. Research disseminated by IZA may include views on policy, but the institute itself takes no institutional policy positions. The Institute for the Study of Labor (IZA) in Bonn is a local and virtual international research center and a place of communication between science, politics and business. IZA is an independent nonprofit company supported by Deutsche Post World Net. The center is associated with the University of Bonn and offers a stimulating research environment through its research networks, research support, and visitors and doctoral programs. IZA engages in (i) original and internationally competitive research in all fields of labor economics, (ii) development of policy concepts, and (iii) dissemination of research results and concepts to the interested public. IZA Discussion Papers often represent preliminary work and are circulated to encourage discussion. Citation of such a paper should account for its provisional character. A revised version may be available directly from the author.

IZA Discussion Paper No. 2551 January 2007
ABSTRACT
Employment Integration of Refugees: The Influence of Local Factors on Refugee Job Opportunities in Sweden
This article studies the importance of local conditions for the employment integration of refugees in Sweden, this in contrast to most studies on immigrant economic integration primarily conducted on the national level or for the larger cities. The data used in the analysis is on male and female natives and twelve refugee groups for the year 2003. Besides monitoring the regional variation in employment integration of twelve refugee groups, this paper, with the use of logistic regressions, estimates the effect of individual and human capital characteristics, internal migration, municipality, local labour market and economic sector factors on the refugees’ odds of being employed. The local variations of refugees’ integration into the labour market were partly a result of internal migration, in most cases from less to more populated municipalities. The job opportunities were better in Stockholm than in other big cities like Malmö and Göteborg. The local unemployment and employment rates, a proxy for the local supply of jobs, significantly affected the individual refugees’ chances to obtain employment. This also applies to the size of the labour market through increased diversification in the supply of job openings. We also find that the structure of the local economy affected the refugees’ probability of obtaining employment. Areas with lower general education and skill levels were positively related, whereas, for example, university localities were negatively related to refugees’ employment chances. Refugees had higher probabilities of being employed in industry in less population-dense areas and in the private service sector in larger cities. JEL Classification: F22, J61, J68 Keywords: refugees, employment integration, local labor markets Corresponding author: Pieter Bevelander IMER Malmö University 205 06 Malmö Sweden E-mail: [email protected]

Introduction1
Like in many other Western European countries, most immigrant groups in Sweden have
lower employment levels than natives. However, there are large differences among
different immigrant groups. In particular, refugees are poorly integrated into the Swedish
labour market integration. In most studies, conducted primarily on the national level, the
weaker labour market integration of refugees is explained by differences in human
capital, discrimination in the labour market, changing composition of sender countries,
economic transformation or institutional conditions. Also for Sweden, most studies on
immigrant economic integration have been conducted on the national level or for the
larger cities. The few studies on the regional level show large differences in economic
integration for different groups and regions, thereby supporting the approach of studying
the economic integration of refugees on the regional and local levels more systematically.
In this study the employment integration of refugees in a local and regional perspective is
in focus. The aim is to analyze the importance of local labour market conditions for the
probability of obtaining refugees’ employment in Sweden. The questions at hand are:
(a) is there a regional variation in the employment chances of refugees, and if so
(b) what factors explain this variation (individual and human capital
characteristics, size and features of the municipality of residence, characteristics of the
local labour market and the local economy)?
This article proceeds with an outline of the background followed by earlier
research on employment integration in general and regional variations in particular. After
this we describe the data and method used in the analysis. We proceed with the results of
the analysis and end with a conclusion.
1 Earlier versions of this study were presented at a guest lecture at the School of Economics and Commercial Law, Göteborg University, 1 December 2005 and to the IMER seminar, 6 December 2006, Malmö University. Comments of the participants at these events are gratefully acknowledged.
2

Background
Besides the import of capital (Marshall program) and technological know-how from the
US, the renewal and economic growth of Western Europe, after the Second World War,
was also based on the availability of labour. When the internal labour reserve from the
agricultural sector and among married women no longer matched the labour demand, an
extensive labour migration from less developed areas in Europe (Finland, Ireland and the
Mediterranean) to the industrial centers in Western Europe took place between 1945 and
1973. In the beginning, the organized labour migration import often had the character of
the so-called ‘guest worker system’ in which the foreign labour was viewed as temporary
and did not have the right to bring in family members. However, to a large extent this
labour migration led to permanent residence and in the 1950s family reunion became
possible. Apart from the organized recruitment of foreign labour, migration was
facilitated by various multilateral agreements. For example, migration of Nordic citizens
was free from 1954 and labour migration within the EEC was free from 1968. The lower
rate of economic growth and increased unemployment in the early 1970s, diminished the
demand for foreign labour. As a consequence, migration policy became harsher in many
European countries, among them Sweden (Castles & Miller 2003).
Labour migration to Sweden was primarily from the Nordic countries, but also
from other Western European countries (1950s) and the Balkans (1960s) (Lundh &
Ohlsson 1999). These labour migrants typically had no difficulties in finding employment
and settling down in Sweden with their families. According to earlier studies (Wadensjö
1973; Ohlsson, 1975) foreign-born men and women had higher employment rates than
natives in 1970 (see figure 1). A gradual decrease in the employment rate of foreign-born
men is noticeable from the 1970s and onwards. For foreign-born women we see an
increase in employment up to the middle of the 1980s, but this increase is not in parity
with the increase in employment of native women. Both natives and foreign-borns were
negatively affected by the economic crisis of the early 1990s, but the relative decline of
the immigrant employment rate was larger. The employment gap between natives and
foreign-borns has narrowed since the middle of the 1990s. The lower employment
3

integration of immigrants who arrived in the 1970s caused the average immigrant
employment rate to decrease in the 1990s and early 2000s (Bevelander 2000).
Figure 1
As was earlier mentioned, immigration to Sweden during the 1950s and 1960s consisted
primarily of labour migrants from the Nordic and European countries. Since the early
1970s, refugees and tied-movers have dominated the migration inflow, coming primarily
from Eastern Europe and other non-European parts of the world. Over the last fifty years
the immigrant population of Sweden has grown to over one million people, which was
about 12 percent of the total population in 2003.
A snapshot of today’s employment integration by country of birth shows us that
almost all foreign-born groups and in particular newly arrived groups of refugees, have
lower employment rates than natives. The general pattern is that natives have the highest
employment rate, followed by Europeans and thereafter non-Europeans. There is,
however, a large variation in employment integration of the various countries in these
geographical categories. New research has shown persistence of this hierarchy for the so
called second generation (Lundh et al 2002).
Earlier research
In economic migration studies, neo-classical human capital theory is the most common
starting point for explaining differences in the economic integration of immigrants. The
migration decision by the individual is seen as a rational choice in which the potential
immigrant, given individual characteristics and migration barriers, calculates thecosts and
benefits of migration. If the discounted value of future income exceeds the costs, i.e. if
the net benefit is positive, the individual will choose to migrate. Thus, in the human
capital approach migration is seen as an investment, expected to yield a positive return in
employment opportunities or relative income in the future. The home country human
capital of the individual is often not perfectly transferable between countries though, and
individuals will adjust to the new labour market by investing in modifying skills and
4
acquiring new skills (for example language skills). During this time it is expected that
immigrants, in the early years, are less productive, and have higher labour market
turnover and lower employment rates than one would expect given their formal
educational level. With time and increasing destination human capital, immigrants make
careers and catch up with native income levels.
In Chiswick (1978) it is shown that immigrants from English-speaking countries
had a higher mean income than natives after eight years in the country, and that this fast
adaptation to the US labour market was due to the positive selection of immigrants by
their human capital. Differences in the ‘quality’ of the human capital of different
immigrant groups, which affect their economic integration, have also been emphasized
by others (Borjas 1985). Later studies have stressed the importance of investments in
education and language proficiency of the migrant after arrival (Chiswick & Miller 1994,
1995; Dustman 1994; Lindley 2002). This is also the case for Sweden, where such
investments have been shown to be important factors explaining immigrants chances to
obtain employment (Larsson 1999; Bevelander 2000).
In a number of studies the unexplained difference in the employment gap between
groups has been interpreted as measure of discrimination (Arai, Regner & Schröder 1999;
Le Grand & Szulkin 2000). In a study of the employment integration of the adopted
children of Swedish parents, Rooth (2001) found that children who looked ‘non-Swedish’
had lower probabilities of obtaining employment than those who looked ‘Swedish’. The
discrimination hypothesis is also supported by qualitative studies on discrimination
perceived by immigrants (Paulson 1994; Lange 1999).
As far back as the 1980s, the effect of an increasing globalization and moving out
of traditional industry jobs on employment was discussed in the US. Sassen (1988), for
example, showed that the economic transformation involved an increased polarization
among the remaining jobs. More qualified service jobs gradually were filled by new
higher educated individuals, at the same time as more unqualified service work
opportunities were filled by unqualified immigrants. Earlier, industrial workers were the
ones who had severe difficulties finding and keeping employment (Wilson 1996). In line
with these international studies, which emphasise the demand side of the labour market as
an important factor in deterring the employment integration of immigrants, a Swedish
5

variation on this theme is that the structural change of the economy, with a relatively
decreasing industrial sector and an increasing service sector during the last few decades,
has implied a long-term change to more information and communication-intense working
processes. The development from the late 1970s and during the 1980s and 1990s
involved on the one hand an ever-increasing increased demand for employees with a
proportionately higher general competence, while unskilled labour was made redundant
by efficiency improvements. On the other hand, the change during the 1980s and 1990s
towards flexible work organisations led to a strong increase in teamwork and computer-
based production. Without reducing the importance of formal education and skill, this
process led to an increase in the importance of informal competence, which includes, for
instance, Swedish-specific proficiency, language skills and the understanding of different
patterns of behaviour in teamwork and in relations with authorities and labour market
organisations (Lundh & Ohlsson 1994, Bevelander 2000 and Scott 1999).
Sociologically orientated research on international migration and economic
integration of immigrants emphasises not only human capital but also social capital
(Putnam, Leonardi & Nanetti 1992; Putnam 2000) and group characteristics which cause
neighbourhood and network effects (Portes 1995). Group characteristics are primarily
based on different types of social capital and the capacity of individuals, by means of
membership in networks or larger social relationships to use scarce resources. It is this
social capital, combined with individual characteristics, that affects the individual’s
finding work or making a career in the labour market. Immigrants have in general a
weaker destination-country-specific social capital and use their own ethnic network to
find their way in a new country. Hence, it is not unexpected that in many countries we
find concentrations of individuals with the same ethnic background. This is even so in
countries like Sweden where the housing policy has aimed at the opposite effect.
Segregation and difficulties integrating in the labour market, for example due to
discrimination, can correspond with the idea of a labour market consisting of two queues:
a job queue and a labour queue in which immigrants are more or less at the end of the
labour queue (Thurow 1975; Waldinger 2001) or, as an alternative, to the creation of
ethnic labour markets (Piore 1979). In some cases the concentration of an ethnic group to
certain areas, enclaves, has had positive effects on the labour market integration of this
6

particular ethnic group, for example through knowledge transfer, ethnic trade or by
overrepresentation in a particular sector of the economy (Portes & Bach 1985; Lazaer
1990; Waldinger & Lichter 2003). In other cases negative enclave effects have been
measured (Portes & Senesenbrenner 1993; Borjas 1998). For Sweden, Edin, Fredriksson
& Åslund (2003) find positive effects of neighbourhood on the employment of
immigrants, partly due to self selection through internal migration.
Institutional factors are also seen as having an important effect on the labour market
integration of immigrants. The rules and regulations on the Swedish labour market may
induce a stronger insider/outsider situation for immigrants in comparison to, for example,
the US labour market. In the US, immigrants end up in lower paid jobs than natives,
whereas in Sweden immigrants are overrepresented as non-employed but when employed
little difference is measured in payment (Lundh et al 2002; Bengtsson, Lundh & Scott
2005). The effect of a compulsory dispersal policy between 1985 and 1994 on newly
arrived refugees, who obtained a residence permit, was also subject to economic analysis.
Comparing immigrants arriving before and after the implementation of the policy, Edin et
al. (2000) suggest that earnings were 25 percent lower eight years after arrival because of
the new policy. Idleness had also increased by about six percent for those groups that
came during the reform (from 1985), relative to immigrants that came between 1982 and
1983. Franzén (1997) discusses the same problems but refers to how refugees were
treated by local labour market authorities. In a follow-up study, she finds that the
implemented integration strategy by the employment offices did not have the expected
results. Seeing the refugees as a homogenous group instead of a diverse population, the
various authorities’ lack of interest in earlier labour market experience, together with a
generally negative attitude towards the skills of the immigrants, led to a destructive
pattern of clientisation of refugees to the social security system.
An immigrant’s incentive to move internally is large and has consequences for the
population structure and increases pressure on the infrastructure and welfare sector (Frey
1996). Swedish studies indicate a high internal movement of immigrants not followed by
an upward social movement, which could be expected (Ekberg 1993; Andersson 1996;
Åslund 2000).
7

Without denying the importance of several of the explanations mentioned earlier,
this paper is more in line with those explanations that have shown the importance of a
change in economic structural factors for the weaker employment integration of
immigrants. In this case we will use the regional variation in the explanatory variables to
test several earlier hypotheses.
Regional studies
Most of the studies mentioned earlier on the employment integration of immigrants are
about the country as a whole. Some studies show, on the other hand, that there exist large
differences in employment integration among geographical areas. There are for example
large differences in economic integration in the larger Swedish cities, Stockholm,
Göteborg and Malmö (Bevelander, Carlson & Rojas 1997). Andersson (1996) showed
that low-educated immigrants had an easier time integrating economically in Stockholm,
with its higher demand for low-educated workers in the private service sector, compared
to regions outside the city. For high-educated immigrants it was the other way around. In
a study by Ekberg and Ohlsson (2000) on the labour market integration of immigrants
from Bosnia-Hercegovina in four regions of Sweden, a correlation was found between
the speed of integration and the situation of the regional labour market. For example, in
one region (Gnosjö-Gislaved) 62 percent of the male Bosnia-Hercegovina population
were employed, as compared to only 27 percent for Sweden as a whole. For women these
proportions were basically the same. Compared to the other regions and the country as a
whole, the employment rate was higher and a very large share of the employed had jobs
in manufacturing.
Lundh et al. (2002) also found large regional variation in employment for
immigrants from developing countries. The employment rate in the Stockholm region as
well as the counties of Jönköping and Kronoberg was higher compared to the mean for
the country as a whole for both natives and African, Asian and Latin-American
immigrants. For many counties the opposite situation was measured, a lower employment
rate for both natives and immigrants relative to the mean employment rate for the country
as a whole. The impression from this study is that the regional labour market is of
8
importance for the employment integration of immigrants. Besides, this study shows that
in many counties the native employment level differs largely from the level measured for
the various immigrant groups. The situation sketched for the late 1990s and early years of
the new millennium stands in contrast to the situation in 1978, when the employment
integration for immigrants measured in different regions showed little variation (Ekberg
1983).
In an earlier study on the employment integration of immigrants in the year 2002
we showed that the employment for immigrant males was connected to the local labour
market conditions (Bevelander & Lundh 2004). In line with the regional studies
mentioned earlier we now focus on refugee immigrants to Sweden from 1973 onwards
and to what extent the local conditions influenced the employment integration in the
Swedish municipalities for the year 2003. Besides distinguishing individual
characteristics, we separate the effects of the labour market and industrial sector of the
municipality. We also integrate the selection of internal movement of immigrants into the
models.
Data and method
As mentioned earlier, the general aim of this study is to monitor and analyze regional
aspects of the employment integration of refugees in Sweden for the year 2003. The
general hypothesis we test is that the probability of obtaining employment is dependent
on individual characteristics, conditions that characterize the municipality in which the
individual is living and the labour market conditions of the municipality.
The data used in this study comes from individual registers held by Statistics
Sweden for the year 2003. The sample and core group under study are individuals,
native- and foreign-born, who are 25-60 years old and immigrated to Sweden primarily as
refugees or related to refugees from 1973 onwards, the year in which labour migration
from outside the Nordic countries to Sweden virtually stopped. The lower-age boundary
is chosen mainly because of the presumption that individuals older than 24 have finished
their studies and are supposed to participate in the labour market. The upper-age
9

demarcation is chosen because many individuals older than 60 actually leave the labour
market as a consequence of early retirement schemes. The dependent variable in the
logistic regressions is ‘being employed or having obtained employment’ compared to not
being employed at the time of measurement, in November in 2003.
Table 1
The explanatory variables in the analysis, see table 1, can be divided into the
following groups: individual variables, municipality variables, labour market variables
and economy variables.
The variables ‘age’ and ‘age squared’ are used to control for employment
variation between age groups. ‘Marital status’ distinguishes between those who are
married/living together and those who are not. The variable ‘children’ is a dichotomous
variable splitting males with and without children. For females this variable is
categorized into those without children, one child, two children and three or more
children. The immigrant-specific variable ‘year of arrival’ makes it possible to infer
something about the different cohorts of the various refugee groups.
The key variable in the human capital model of labour market integration, the
‘educational level’, is included to study the effect of education on the job chances of the
various refugee groups.
In this study the concept of ‘refugee’ is larger than in a strictly juridical sense and
includes all immigrants from refugee countries, irrespective of whether they have refugee
status or residence permits based on humanitarian reasons or family reunion. The
countries that have been classified like this are: Yugoslavia, Bosnia-Herzegovina, Poland,
Rumania, Hungary, Turkey, Lebanon, Syria, Chile, Iran, Iraq and Ethiopia.2
2 From 1993 onwards 'Yugoslavia' refers to individuals born in Serbia Montenegro and 'Bosnia- Herzegovina' to individuals born in Bosnia-Herzegovina. Since the former Yugoslavia was split into four separate countries in the early 1990s, it was made possible for individual immigrants who had arrived earlier to change the record of their country of birth in the database of Sweden Statistics. For nationalistic reasons many immigrants have done so, in particular Bosnians. Nevertheless, we believe that some Bosnians who immigrated 1974-1993 are still categorized as Yugoslavian in our data, and that Yugoslavians in this period also include some Croatians and Slovenes.
10

Regarding the individual variables in the model, these are well established in
human capital theory and the expected effects have been confirmed in many studies. We
expect that the chance to be employed is larger for individuals with higher education, and
increases with higher labour market experience (age) and with increased adaptation time
(years in a new country). We also know that for married males the probability of being
employed is higher compared to unmarried males. Having under-aged children in the
household is expected to have a negative effect on the labour supply of women but not of
men, depending on the gender role patterns in the family, which in turn can be seen as a
result of a rational economic decision (Becker 1991) or as social construction (Stanfors
2003).
The variable ‘internal migration’ is dichotomous and split, on the one hand, into
individuals that in 2003 lived in a municipality of the same type in which they settled
upon having obtained residence permits in Sweden, and on the other hand, into
individuals that in 2003 lived in a municipality type other than in which they settled upon
having obtained residence permits. In other words, they moved internally in Sweden
between different municipality types. Based on theory and earlier studies, we expect that
labour migration is directed towards regions with better labour market conditions, but
know that short distance movements are not especially labour market related. When it
comes to refugee immigrants there are no a priori expectations that internal migration is
more or less labour market related or based on other factors like living closer to fellow
countrymen and family. Here we are interested in the effect of internal migration on
refugees’ employment chances per se, but we also control for internal migration in the
regressions in order to get more precise estimates of the effects of local factors.
Table 2
The aim of including municipality variables in the study is to capture other effects
at the local level, which cannot directly be measured in terms of labour market and
economy structure (see below). The variable ‘municipality type’, is based on an own
categorization by population size and density (see table 2). The variable is included in the
11

model based on the hypothetical thought that it captures differences in employment due
to population size and density in the municipality.
The variable ‘municipality contribution’ includes all cost and equalization
contributions from the government to the municipality. The variable ‘municipality tax
level’ is a percentage. Together these variables are intended to mirror the economic
stability of the municipality. A small municipality contribution and a low tax level are
assumed to indicate a good municipality economy. The presence of a university or
university college is expected to reduce the employment chance of refugees. First, we
expect that some will move to municipalities with universities to study in the first place.
Second, we may assume that a fair number of students (native and immigrants) look for
short-term unskilled jobs, thus competing with refugees. Third, it is more likely that the
general educational and skill level is higher in cities with universities.
The labour market variables are assumed to reflect the condition of the local
labour market. The ‘unemployment level’ in the municipality is the share of the male and
female labour force in the ages 20-64 that are unemployed or in labour market policy
programs. In line with this, the employment level in the municipality is based on the
share employed of the total population in the ages 25-60. The unemployment level is
assumed to express the business cycle of the specific municipality as well as to some
extent a more structural unemployment situation. The employment level in the
municipality is assumed to express the labour market situation in a somewhat longer
term, as it is dependent on the local sectors of the economy, the direction of the local
population’s education and occupational structure and risk of early retirement. In both
cases we expect that a low unemployment level and high employment level increase the
probability of obtaining employment for the individual refugee. The variable ‘size of
local labour market’ is the logged number of employed in the local labour market in
which the municipality of the individual is situated.3 The hypothesis is here that the larger
the labour market the higher the chances of work, this for example through a higher
diversification of jobs and higher turnover rate.
3 The local labour market is based on a division of Sweden into 81 different local labour markets and done by Nutek (www.nutek.se). See appendix 3 in Bevelander and Lundh 2004.
12
The economy variables are included to measure the geographical differences in
the economic structure and the prerequisites for economic activity. The variable ‘relative
size public sector’ is the share employed in the public sector. In the same way we
construct the variables relative size of the manufacturing sector and relative size of the
private sector. Since these variables are heavily correlated they are not used in the same
models.
The variable ‘entrepreneurial climate’ is based on data from a study conducted by
the Confederation of Swedish Enterprise (Svenskt Näringsliv) in 2003, in which answers
in a questionnaire were weighted 67 percent and basic statistical facts on the municipality
33 percent.4 The higher the value obtained by a municipality, the higher the rank it
received.
The variables ‘educational level’ and ‘occupational level’ concern mean levels in
the municipality. The educational level is classified into three sub-levels: 1= primary
education, 2= secondary education and 3= university education. Based on this
classification the mean educational level in the municipality is calculated for both males
and females in the ages 25-60. The occupational level is created by categorizing a branch
of occupation (1 digit level) in accordance with SSYK (Standard for Swedish
Occupational Classification)5. In this way we have four levels of occupation 1= without
demand for education, 2= demand for secondary education, 3= demand for secondary
education with additional education or shorter university education and 4= demand for
longer university education or higher. Based on this classification the mean occupational
level in the municipality is calculated for both males and females in the ages 25-60.
These variables are highly correlated (Pearsons R=0.88).
Regarding the economy variables our expectations are partly different for males
and females. Today no formal barriers exist between male and female jobs, but to a large
extent males and females are working in different industries and occupations. It would
not be surprising if path dependency in the Swedish labour market affected the search
behaviour of refugees. Since the supply of male jobs is much larger in the private sector,
4 The database ’Local Entrepreneurial Climate’ (Lokalt företagsklimat) is constructed by the Confederation of Swedish Enterprise and contains data and a total ranking of municipalities from 2002 onwards (http://www.kfakta.se/). 5 Standard för svensk yrkesklassificering.
13

we expect the size of the local private sector to have a positive effect on the probability of
obtaining employment for refugee males. Since the supply of female jobs is more equally
distributed between the private and public sector, our expectation in this case is less
strong. Thus, the private sector may accordingly represent more potential employment for
refugees, especially males. In line with this, the entrepreneurial climate in the
municipality that mirrors the optimism of local employers in the private sector should
affect refugees’ employment chances. We expect higher employment possibilities for
refugees in municipalities with employers that are positive about the economic climate in
the municipality.
The hypothesis that a transformed economy has made it more difficult for
refugees to obtain employment, with unskilled assembly line jobs being replaced by jobs
in the service sector, often with a higher educational level, is tested by the variables
‘educational level’ and ‘occupational level’ in the municipality. The variables ‘relative
size of manufacturing sector’ and ‘relative size of private sector’ are also likely to support
this hypothetical explanation. If the hypothesis that refugees have difficulties entering the
labour market is explained by changes in the structure of the economy, which in turn had
effects on the work content, generally higher educational and occupational levels in the
municipality should have a negative effect on refugees’ chances to obtain employment.
Since this transformation is different in different parts of the country, it is plausible that it
is easier to find unqualified work in the industrial sector outside the larger cities. In the
larger cities, on the other hand, we can expect that the private service sector, with a larger
diversification of jobs, has unqualified jobs that are less frequently found in smaller cities
and municipalities.
The statistical analysis consists of logistic regressions to predict the effects of the
various variables on the odds of an individual obtaining work.6
Results
6 The odds are defined as p/(1-p), in which p= the probability. When analyzing a phenomenon with a small probability of occurrance, the calculated odds ratio is close to the relative probability. In the text though, we will use less exact formulations, for example: the chance or probability of having or obtaining employment. Statistically strictly we calculate the effect of various factors on the odds of having employment.
14

Regional variation
Before we analyze the main issue of this study, this section monitors the differences in
employment levels between natives and the various refugee groups as well as the regional
variation in employment levels. Compared to native males and females the employment
rate for all the studied refugee groups is lower, at the same time as the differences among
the groups are very large (see table 3).
Table 3
The table shows that 71 percent of the men from Bosnia-Herzegovina were employed as
compared to only 39 percent for the Iraqi men. For women the difference was even
larger; 65 percent of Bosnian women were employed compared to only 29 percent of the
Iraqi women. Even if we control for differences in age, education, marital status,
household composition and years since migration, refugees from Bosnia-Herzegovina,
Chile and Rumania more successful than refugees from the Middle East and Africa (see
table 4). All the refugee groups still had a considerable lower probability of being
employed than natives.
Table 4
Besides large differences in employment levels between natives and refugee groups and
among refugee groups there are, as mentioned earlier, large regional differences in
employment levels. Table 5 shows that the employment rate for natives in 2003 was
highest in the municipalities of Gnosjö (men) and Värnamo (women) and lowest in the
municipalities of Övertorneå (men) and Ljusnarsberg (women). The difference between
the ‘best’ and ‘worse’ municipality was thus between 17-25 percentage points for natives.
The table also shows that various refugee groups had a local ‘best’ employment level
close to or even over the general employment rate for natives, for example: refugee men
and women from Bosnia-Herzegovina and Chile as well as men from Yugoslavia and
Iran. Likewise, refugee groups that had a generally low employment level could have
15

high levels in certain municipalities, for example Ethiopian and Iraqi men in the
municipality of Järfälla.
Table 5 Table 5 also shows that the difference between the ‘best’ and ‘worse’ municipality for
refugee groups was larger than for natives. In many cases this measured difference could
be up to 40-50 percentage points. As mentioned earlier, this situation was relatively new
for the Swedish labour market – during the 1970s the regional differences in employment
levels for natives and immigrants were more similar (Ekberg 1983). In this regard it is
important to mention that the difference between the ‘best’ and ‘worse’ employment
levels within each every refugee group to a large extent was larger than the mean
difference among the different groups.
These results underpin the importance of studying to what extent these regional
differences in employment depend on different local conditions, for example the size or
the economy of the municipality, the local labour market or the type of economy of the
municipality. In this context it is also important to study to what extent the regional
differences in employment integration for the various refugee groups are due to selection
by internal migration.
Internal migration
The importance of human capital and other individual characteristics for career and
income has been shown in many studies. Even labour-market-related migration can bbe
interpreted in human capital terms in which the individual invests for higher future labour
market integration, better work or income. Since we know that a large part of the internal
migrations is not labour market related, it is interesting to investigate the dimension and
pattern of internal migration by refugees.
Table 6
16

Table 6 shows how the studied refugee groups were distributed by municipality type at
the moment they were nationally registered for the first time and in 2003. The table tells
us that a majority of the refugees were settled in the big cities or other larger cities in the
beginning but that, on the other hand, a net-immigration to these municipalities also came
about. In 2003, 75 percent of the refugee population was settled in the big cities and other
larger cities. Equally apparent is the net-emigration from the three last mentioned
municipality types in the table. The same direction is observed for the native population
but the concentration to the big cities and other larger cities was considerably lower than
for the studied refugee groups.
When we study the various refugee groups in the same way as we pictured the
refugee population in table 6, we see large differences among the various groups both by
municipality of first settlement and municipality in 2003 (see appendix). A relatively
large number of refugees from Poland and Hungary had already, as their first settlement,
ended up in the big cities, and the internal migration of individuals of these groups was
fairly low. The same can be said for refugees from Turkey, with the difference that their
first municipality to a larger extent was the municipality category ‘other larger cities’
(50,000-200,000). Refugees from Bosnia-Herzegovina first settled to much lesser degree
in the big cities (11 percent) and, on the other hand, were spread over all municipality
types. To a large extent this may be explained by the fact that the number of Bosnian
refugees increased heavily in the early 1990s at the same time as the ‘Sweden-wide-
strategy’ was used in the refugee settlement policy by the Swedish authorities.
When it comes to type of municipality in 2003 the refugee groups again showed
large differences. Bosnians and Yugoslavs had a smaller part of their population settled in
big cities and larger cities (60-65 percent), whereas more than 80 percent of the refugees
from Turkey, Iran, Iraq, Chile and Ethiopia were settled in these kinds of agglomerations.
This could have been due to differences in preferences, but presumably also mirrors
differences in the possibility of influencing the choice of type of municipality, for
example the time a refugee had been in the country and the settlement policy that was in
prevalence when the refugee arrived in Sweden. Large refugee groups from former
Yugoslavia came primarily during the 1990s, while other groups like refugees from
17
Turkey, Iran, Chile and Ethiopia came before this period. Refugees from Iraq, as a
relatively ‘late’ refugee group, showed a high internal migration to the big cities.
From the tables in the appendix it is evident that only a small part of the refugee
population lived in municipalities with less than 20,000 inhabitants, including
countryside municipalities. For some groups this is only a few percentage points. This is
of course important when validating the high employment level of refugees in small
municipalities, for example Gnossjö municipality (<10,000) or Värnamo, Vetlanda,
Tingsryd and Alvesta municipality (larger municipality, 10,000-20,000) (see also table
5). A policy implication of these results could be that in the future labour market policy
measures should be prioritized to the larger agglomerations in Sweden so a larger share
of the refugee population can be reached. On the other hand, this should not interfere
with learning from how local conditions in other parts of the country contribute to
alleviate the difficulties of refugees in finding jobs, and it is not an argument to stop
refugee settlement outside the larger cities either.
Table 7
Table 7 shows that individual characteristics and human capital affect the probability of
being employed for refugee men and women in Sweden. The results for these variables
are in agreement with earlier studies and will not be commented on further.7
We discussed earlier the extent of selection by refugees by means of internal
migration. The question that arises is whether refugees moved from unemployment to
work, or whether the internal migration was determined by other factors, for example to
live with family or fellow countrymen. This question can not be conclusively answered
by cross-sectional data, but some observations could shed some light over this problem.
Therefore, the models shown in table 7 include a variable for internal migration and
internal migration interacted with country of birth.
The table shows that there is a general positive effect of internal migration on the
odds of being employed (model A).8 There are visible differences visible among the
7 In the following regressions these variables will be included in the model but not presented. (Available on request). 8 Not significant for males.
18
various refugee groups (model B). For men from Bosnia-Herzegovina, Iran and Iraq the
movement is associated with a higher chance of being employed. For refugees from
Rumania, Lebanon, and Ethiopia we found the opposite. For women a positive effect is
found for refugees from Yugoslavia, Bosnia, Turkey, Syria, Iran and Iraq and a negative
effect for refugees from Poland, Hungary and Ethiopia.
Our conclusion from this is that there was a general positive effect of internal
migration on the odds of being employed for refugees and that the direction of the
migration was from lesser municipalities to larger agglomerations. To a large extent this
indicates that a selective emigration from smaller municipalities contributed to the fact
that the employment level in these municipalities was higher than it would have been
without this migration.
Municipality types
In the earlier sections it became clear that human capital and other individual factors
affected the ability of refugees to integrate into the Swedish labour market. Internal
migration could have had an effect on this. In this section we add factors to the model
that mirror the features of the municipality as a residential unit.
Table 8
Table 8 shows the effects of different municipality variables on the probability of
refuges’ obtaining employment. As expected, refugees had a lower probability of getting
work in municipalities that had a university. This in turn was due to several factors that
we cannot separate in this study. First, some refugees studied and did not work. Second,
native students competed with refugees for unqualified jobs. Third: the general level of
education of the workforce in these municipalities was higher. This latter effect can also
be seen as an economic structural feature (see below).
The measured effects that are supposed to mirror the municipality economy are
not totally as expected. The probability for a refugee to be employed, was, as expected,
higher in municipalities with a lower contribution from the government and through the
municipality equalization system. In other words, the probability was higher in
19
municipalities that were not favoured by the system. Contrary to our expectations the
analysis shows that the probability of being employed was larger in municipalities with
higher tax levels. This applied to both men and women.
The employment chances of refugees were different in different types of
municipalities. Compared to big cities (together) the probability was higher in all other
types of municipalities. Especially the smaller municipalities and those in the countryside
stand out as advantageous for refugees’ labour market integration (Model A). When we
instead distinguish between the three big cities (Stockholm, Göteborg and Malmö), we
find a partly different result (Model B). The earlier types of municipalities were still
advantageous for integration but the difference in employment chances in the three big
cities were very large. The probability of being employed was clearly higher in
Stockholm than in the other two cities. The probability for refugees to be employed in
Malmö, especially for men, was the lowest compared to all other types of municipalities
and big cities. The fact that less than 10 percent of the refugee population was settled in
the three smallest municipality types (<20,000) in 2003 has to be taken into consideration
when evaluating the higher odds ratios for these municipality types.
Local labour market
The effect of local labour market variables on the probability of having employment for
refugees is presented in table 9. As expected the local unemployment level had a negative
effect on the probability of being employed for refugees. The unemployment level
mirrors how the business cycle situation affected the local labour market, but also to
some extent the structural situation of the local labour market. In the table we also find a
positive effect for the variable the local employment level, which is assumed to reflect
the long-term labour market conditions such as the structure of the labour market and the
education- and occupational choices by the local population.
Table 9
20

Table 9 shows as well that the size of the local labour market had a positive effect on the
probability of being employed for refugees. So, even if the number of individuals
competing for jobs is larger, a larger labour market involves a larger variation in then
umber of potential jobs than a smaller labour market. Again, no measurable difference is
visible between men and women in this respect and all coefficients are significant at the 1
percent level. If in one or more refugee groups, women are more expected than men to
have a preference for domestic work, this does not affect the main result.
Economic sectors
The structure of the local economy also had an effect on the work possibilities of the
refugees. In tables 10 (men) and 11 (women), it is evident that the entrepreneurial climate
had a positive effect on the refugees’ probability of being employed (Model A).
Presumably it was the manufacturers’ positive attitude to the world around and optimism
for the future that affected the willingness to hire.
The hypothetical explanation that the weaker labour market position for refugees
was due to the economic transformation also finds some support in the tables. If the
economic transformation led to the effect that unskilled and low-skilled jobs disappeared
and were replaced by more qualified work that needed higher education and more
‘Sweden specific’ skills, is it possible that this was influenced by general the
occupational level in the municipality. In municipalities with a higher transformation
pace it is expected that the mean educational and occupational levels were higher and that
this had a negative effect on the chances for refugees to obtain employment than in
municipalities with lower educational and occupational levels. As can be seen from
Model A, the tables show a negative effect of both the general educational and
occupational levels on the chances to be employed by refugees. Consequently, a larger
share of unqualified jobs increased the refugees’ employment chances. The effects are
visible for both men and women, but not significant for women.
Table 10
21

Table 11
From model B in tables 10 and 11 we infer that there was a general positive effect of the
relative size of the manufacturing and private service sectors in the municipality for
refugees. This is the opposite of what we find in model A in the same tables, that is that
the relative size of the public service sector had a negative effect on the probability of
being employed for refugees. In other words, the chance of work was higher in
municipalities with larger manufacturing and private service sectors compared to
municipalities dominated by a public service sector. These effects were dependant on the
fact that the majority of ‘male’ jobs were in the private sector. The general chance to
obtain employment was therefore smaller in municipalities with a large public sector. For
women we do not have the same expectations since the supply of ‘female’ jobs were
more equally distributed between the public and private sector. Notwithstanding this fact,
we observe the same effects of the sectors for both women and men. An illustration of
this is found in table 12 in which we see that the share employed in the public sector was
less for the refugee groups as a whole compared to natives.
Table 12
Models C and D show that there were differences between types of municipality
according to how different sectors affected employment for refugees. In the big cities, the
relative size of the manufacturing sector had a negative effect on refugees’ employment
chances, while the opposite can be observed for the private service sector. The relatively
bad employment situation for the former traditional industrial city of Malmö compared to
the better employment situation in Stockholm can be taken as an example of this
situation. In smaller sized municipalities and cities the size of the manufacturing sector
had a positive effect on the probability of being employed for refugees. The relative size
of the private service sector had a positive effect on the refugees’ employment chances in
most of the municipality types (not in smaller municipalities and the rural area).
Conclusion
22
Immigrant and refugee economic integration in general is predominantly studied using
national data. Furthermore, studies focus to a larger degree on geographical areas, mainly
larger cities, in which immigrants and refugees are overrepresented in the population.
This study instead has its focus on the employment integration of refugees in a local and
regional perspective. The main aim is to analyze the importance of local labour market
conditions on the probability of obtaining employment for refugees in Sweden. Besides
monitoring the regional variation in the employment level of refugees, it also uses several
factors at the local level to explain the variation in the employment integration of
refugees. The factors included in the analysis are, apart from individual and human
capital characteristics, factors connected to the structure of the municipality the
individual was living in, factors associated with the local labour market and factors
related to the economic structural conditions of the municipality.
The analysis shows a large variation in local employment integration for natives
and the various refugee groups. The measured difference in the employment rate for
various refugee groups between municipalities was in many cases up to 40-50 percentage
points. Moreover, the difference between the lowest and highest employment rate for
every refugee group in many cases was larger than the mean difference among the
different refugee groups. This result underlines the significance of analyzing to what
degree these regional or local differences in employment rate were due to conditions at
the local level.
With the use of logistic regressions we model to what extent various local factors
affected the odds of being employed for refugee men and women. The results indicate
that a selection on the labour market, i.e. a move within the country to another local
labour market increased the chances to be employed.
When it comes to difference between municipality types and its effects on the
employment situation of refugees, the analysis shows that smaller municipalities and
municipalities with no university increased the probability of being employed for
refugees. From this we understand that refugees had an easier time integrating into the
labour market in more economic ‘traditional’ parts of Sweden.
23
Labour market factors included in the analysis indicate that these factors also
affected the employment integration of refugees. Both employment and unemployment
levels as well as the size of the local labour market show significant effects on the odds
of being employed for refugee men and women. To us this means that both business
cycle variations and more long-term labour market factors affected the employment
integration of refugees.
The economic structure of the local labour market also affected the probability of
obtaining employment for refugees. Refugees also had a higher probability of being
employed in the manufacturing and private sectors. Furthermore, areas with lower
general education and skill levels were positively related to refugees’ employment
chances. Finally, refugees had higher probabilities of being employed in industry in less
population-dense areas and in the private service sector in larger cities. So, municipalities
with either a large private service or manufacturing sector were the ones in which
refugees had larger chances to be employed.
To conclude, the effects of local municipalities, labour markets and economic
structure are not random but systematic. This means that we infer something on how
various local factors affected the labour market integration of refugees. Additionally, is it
encouraging that studying the variation in local conditions can shed some new light over
the existing hypothetical explanations of the labour market integration of refugees.
24
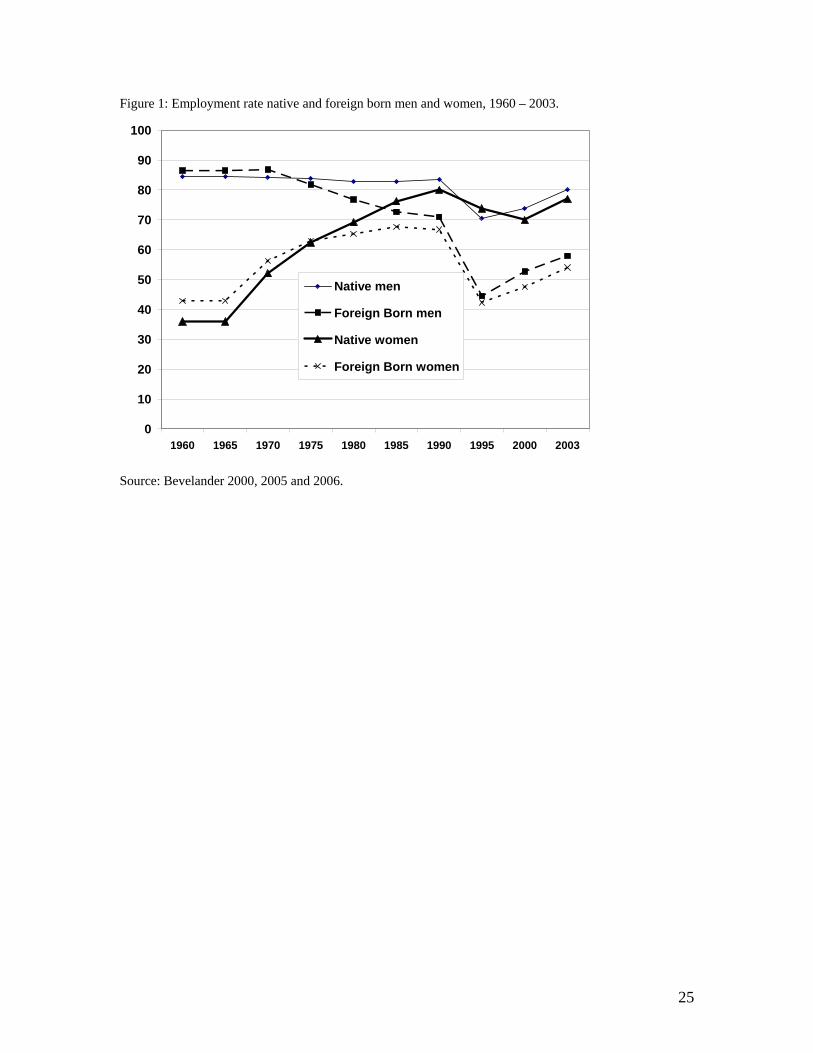
Figure 1: Employment rate native and foreign born men and women, 1960 – 2003.
0
10
20
30
40
50
60
70
80
90
100
1960 1965 1970 1975 1980 1985 1990 1995 2000 2003
Native men
Foreign Born men
Native women
Foreign Born women
Source: Bevelander 2000, 2005 and 2006.
25
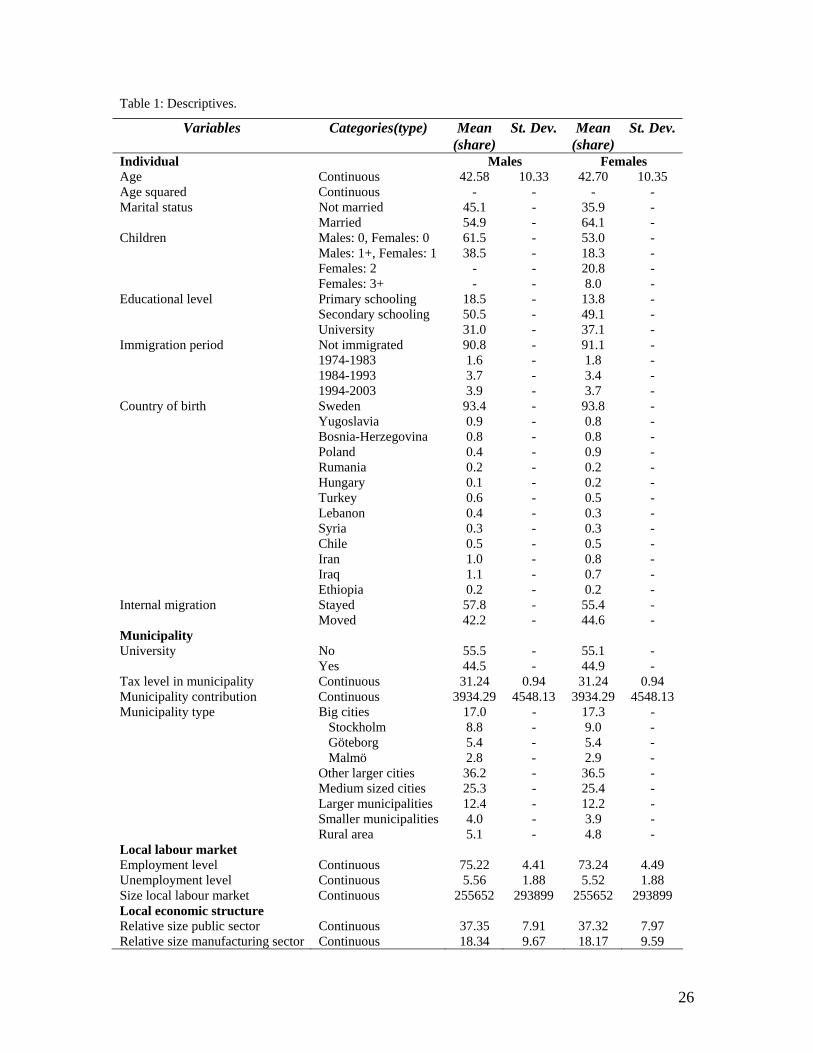
Table 1: Descriptives.
Variables Categories(type) Mean (share)
St. Dev. Mean (share)
St. Dev.
Individual Males Females Age Continuous 42.58 10.33 42.70 10.35 Age squared Continuous - - - - Marital status Not married 45.1 - 35.9 - Married 54.9 - 64.1 - Children Males: 0, Females: 0 61.5 - 53.0 - Males: 1+, Females: 1 38.5 - 18.3 - Females: 2 - - 20.8 - Females: 3+ - - 8.0 - Educational level Primary schooling 18.5 - 13.8 - Secondary schooling 50.5 - 49.1 - University 31.0 - 37.1 - Immigration period Not immigrated 90.8 - 91.1 - 1974-1983 1.6 - 1.8 - 1984-1993 3.7 - 3.4 - 1994-2003 3.9 - 3.7 - Country of birth Sweden 93.4 - 93.8 - Yugoslavia 0.9 - 0.8 - Bosnia-Herzegovina 0.8 - 0.8 - Poland 0.4 - 0.9 - Rumania 0.2 - 0.2 - Hungary 0.1 - 0.2 - Turkey 0.6 - 0.5 - Lebanon 0.4 - 0.3 - Syria 0.3 - 0.3 - Chile 0.5 - 0.5 - Iran 1.0 - 0.8 - Iraq 1.1 - 0.7 - Ethiopia 0.2 - 0.2 - Internal migration Stayed 57.8 - 55.4 - Moved 42.2 - 44.6 - Municipality University No 55.5 - 55.1 - Yes 44.5 - 44.9 - Tax level in municipality Continuous 31.24 0.94 31.24 0.94 Municipality contribution Continuous 3934.29 4548.13 3934.29 4548.13 Municipality type Big cities 17.0 - 17.3 - Stockholm 8.8 - 9.0 - Göteborg 5.4 - 5.4 - Malmö 2.8 - 2.9 - Other larger cities 36.2 - 36.5 - Medium sized cities 25.3 - 25.4 - Larger municipalities 12.4 - 12.2 - Smaller municipalities 4.0 - 3.9 - Rural area 5.1 - 4.8 - Local labour market Employment level Continuous 75.22 4.41 73.24 4.49 Unemployment level Continuous 5.56 1.88 5.52 1.88 Size local labour market Continuous 255652 293899 255652 293899 Local economic structure Relative size public sector Continuous 37.35 7.91 37.32 7.97 Relative size manufacturing sector Continuous 18.34 9.67 18.17 9.59
26

Relative size private sector Continuous 44.04 10.90 44.21 10.88 Entrepreneurial climate Continuous 68.95 12.81 68.95 12.81 Educational level Continuous 2.17 0.15 2.17 0.15 Occupational level Continuous 2.50 0.16 2.27 0.18 Source: Statistics Sweden.
27

Table 2. Municipality types.
Municipality type Number of municipalities Population Definition Big cities 3 1,502,751 >200,000 Other larger cities 39 3,237,288 50,000-200,000 Medium sized cities 73 2,274,339 20,000-50,000 Larger municipalities 83 1,143,816 10,000-20,000 Smaller municipalities 44 344,842 <10,000 Rural area 48 455,334 < 7 individuals per km2
Source: Statistics Sweden.
28

Table 3. Employment rates of 2003 for men and women in ages 25-60 by country of birth.
Country of birth Men Women Percent Number Percent Number Sweden 85 1,887,296 82 1,799,901 Yugoslavia 61 17,626 52 15,359 Bosnia-Herzegovina 71 16,470 65 15,300 Poland 64 7,882 64 16,942 Rumania 68 3,431 65 4,330 Hungary 61 2,307 63 2,958 Turkey 60 12,584 45 9,667 Lebanon 52 8,431 36 5,944 Syria 57 5,701 41 5,131 Chile 69 10,021 64 9,512 Iran 59 20,864 52 16,012 Iraq 39 22,0812 29 14,364 Ethiopia 59 4,452 62 3,696 Source: Statistics Sweden.
29
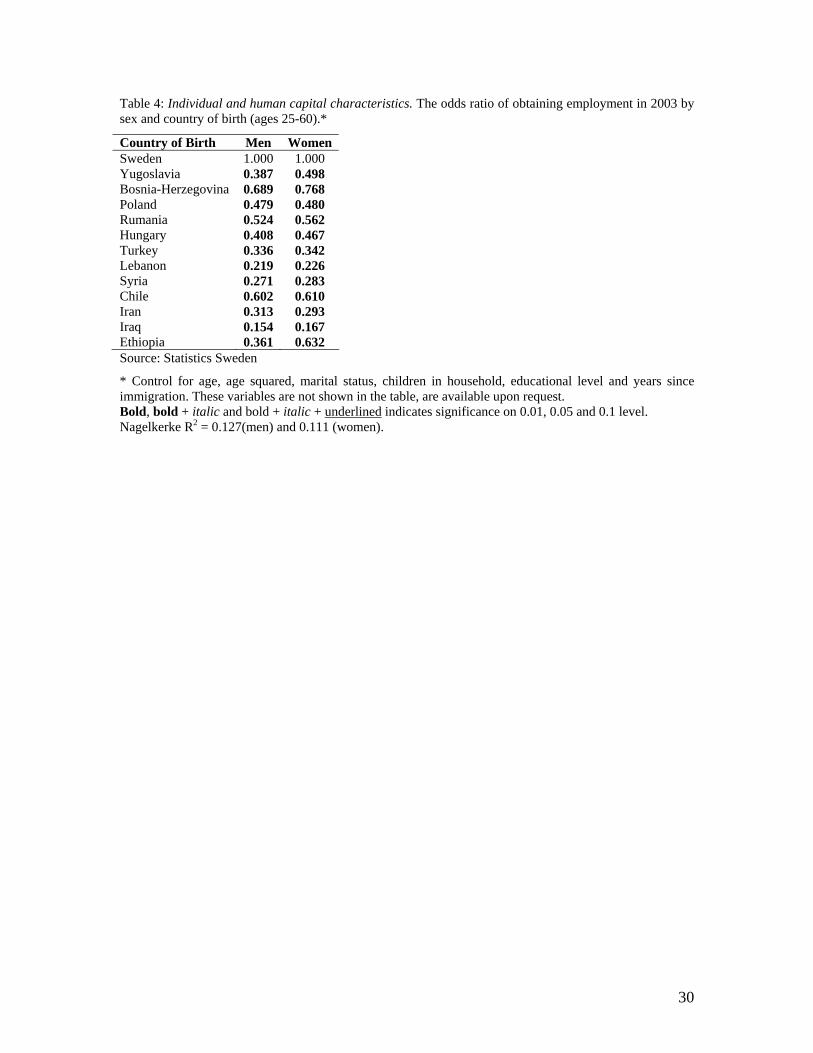
Table 4: Individual and human capital characteristics. The odds ratio of obtaining employment in 2003 by sex and country of birth (ages 25-60).*
Country of Birth Men Women Sweden 1.000 1.000 Yugoslavia 0.387 0.498 Bosnia-Herzegovina 0.689 0.768 Poland 0.479 0.480 Rumania 0.524 0.562 Hungary 0.408 0.467 Turkey 0.336 0.342 Lebanon 0.219 0.226 Syria 0.271 0.283 Chile 0.602 0.610 Iran 0.313 0.293 Iraq 0.154 0.167 Ethiopia 0.361 0.632 Source: Statistics Sweden
* Control for age, age squared, marital status, children in household, educational level and years since immigration. These variables are not shown in the table, are available upon request. Bold, bold + italic and bold + italic + underlined indicates significance on 0.01, 0.05 and 0.1 level. Nagelkerke R2 = 0.127(men) and 0.111 (women).
30

Table 5: Employment rates of 2003 for ‘best’ and ‘worse’ municipality. Selected refugee group (ages 25-60).*
Country of birth Municipality Men Women Municipality Percent Municipality Percent Sweden ‘best’
‘worse’ Gnosjö Övertorneå
93 68
Värnamo Ljusnarsberg
90 73
Yugoslavia ‘best’ ‘worse’
Vetlanda Hörby
94 41
Alingsås Mellerud
77 24
Bosnia-Herzegovina ‘best’ ‘worse’
Tingsryd Karlshamn
94 48
Sigtuna Landskrona
94 40
Poland ‘best’ ‘worse’
Kävlinge Ronneby
82 46
Alvesta Gävle
84 53
Rumania ‘best’ ‘worse’
Alvesta Trelleborg
85 54
Sundbyberg Åstorp
87 34
Hungary ‘best’ ‘worse’
Uppsala Malmö
80 40
Jönköping Helsingborg
82 39
Turkey ‘best’ ‘worse’
Kungälv Lund
77 40
Nacka Borlänge
59 15
Lebanon ‘best’ ‘worse’
Nässjö Kalmar
73 30
Norrköping Halmstad
57 13
Syria ‘best’ ‘worse’
Upplands Väsby Västerås
76 48
Sandviken Trollhättan
58 26
Chile ‘best’ ‘worse’
Gnosjö Partille
93 43
Mark Kristianstad
85 36
Iran ‘best’ ‘worse’
Kungsbacka Härnosand
88 34
Stenungsund Karlskrona
74 26
Iraq ‘best’ ‘worse’
Järfälla Sandviken
69 13
Sollentuna Sandviken
54 5
Ethiopia ‘best’ ‘worse’
Järfälla Malmö
84 37
Järfälla Malmö
77 38
Source: Statistics Sweden * N>29.
31
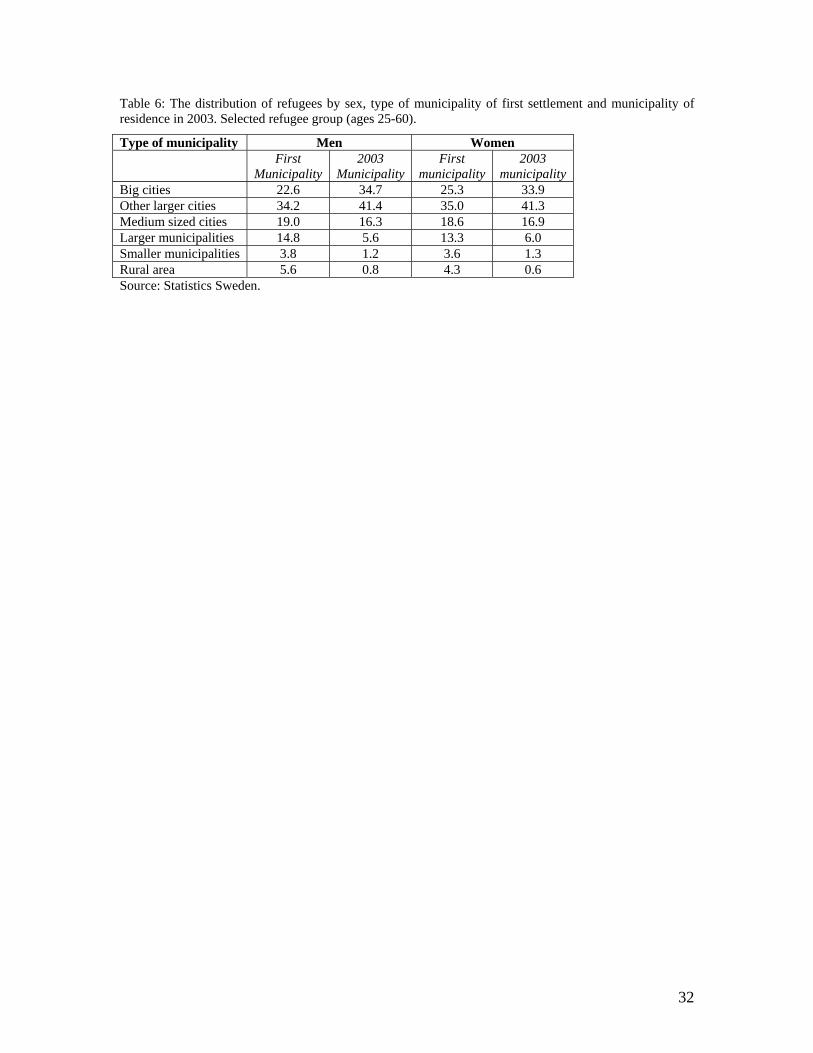
Table 6: The distribution of refugees by sex, type of municipality of first settlement and municipality of residence in 2003. Selected refugee group (ages 25-60).
Type of municipality Men Women First
Municipality 2003
Municipality First
municipality 2003
municipality Big cities 22.6 34.7 25.3 33.9 Other larger cities 34.2 41.4 35.0 41.3 Medium sized cities 19.0 16.3 18.6 16.9 Larger municipalities 14.8 5.6 13.3 6.0 Smaller municipalities 3.8 1.2 3.6 1.3 Rural area 5.6 0.8 4.3 0.6 Source: Statistics Sweden.
32
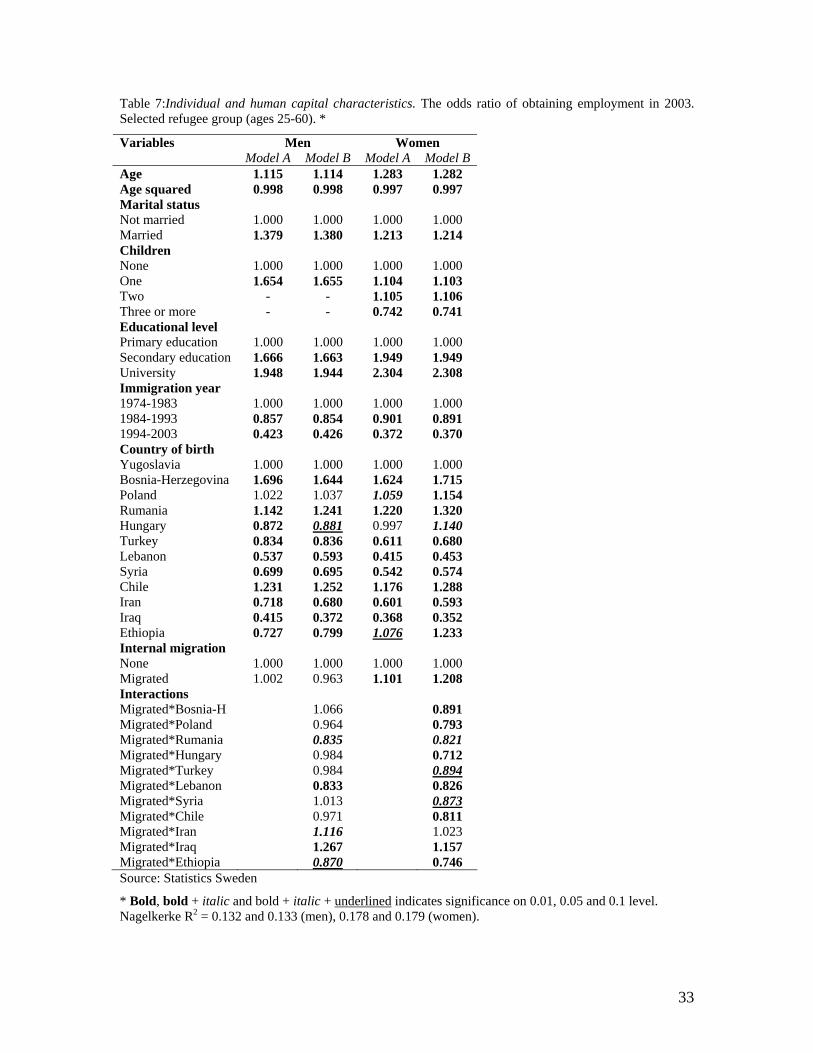
Table 7:Individual and human capital characteristics. The odds ratio of obtaining employment in 2003. Selected refugee group (ages 25-60). *
Men Women Variables Model A Model B Model A Model B
Age 1.115 1.114 1.283 1.282 Age squared 0.998 0.998 0.997 0.997 Marital status Not married 1.000 1.000 1.000 1.000 Married 1.379 1.380 1.213 1.214 Children None 1.000 1.000 1.000 1.000 One 1.654 1.655 1.104 1.103 Two - - 1.105 1.106 Three or more - - 0.742 0.741 Educational level Primary education 1.000 1.000 1.000 1.000 Secondary education 1.666 1.663 1.949 1.949 University 1.948 1.944 2.304 2.308 Immigration year 1974-1983 1.000 1.000 1.000 1.000 1984-1993 0.857 0.854 0.901 0.891 1994-2003 0.423 0.426 0.372 0.370 Country of birth Yugoslavia 1.000 1.000 1.000 1.000 Bosnia-Herzegovina 1.696 1.644 1.624 1.715 Poland 1.022 1.037 1.059 1.154 Rumania 1.142 1.241 1.220 1.320 Hungary 0.872 0.881 0.997 1.140 Turkey 0.834 0.836 0.611 0.680 Lebanon 0.537 0.593 0.415 0.453 Syria 0.699 0.695 0.542 0.574 Chile 1.231 1.252 1.176 1.288 Iran 0.718 0.680 0.601 0.593 Iraq 0.415 0.372 0.368 0.352 Ethiopia 0.727 0.799 1.076 1.233 Internal migration None 1.000 1.000 1.000 1.000 Migrated 1.002 0.963 1.101 1.208 Interactions Migrated*Bosnia-H 1.066 0.891 Migrated*Poland 0.964 0.793 Migrated*Rumania 0.835 0.821 Migrated*Hungary 0.984 0.712 Migrated*Turkey 0.984 0.894Migrated*Lebanon 0.833 0.826 Migrated*Syria 1.013 0.873Migrated*Chile 0.971 0.811 Migrated*Iran 1.116 1.023 Migrated*Iraq 1.267 1.157 Migrated*Ethiopia 0.870 0.746 Source: Statistics Sweden
* Bold, bold + italic and bold + italic + underlined indicates significance on 0.01, 0.05 and 0.1 level. Nagelkerke R2 = 0.132 and 0.133 (men), 0.178 and 0.179 (women).
33

Table 8: Municipality types. The odds ratio of obtaining employment in 2003. Selected refugee group (ages 25-60).*
Variables Men Women Model A Model B Model A Model B University No 1.000 1.000 1.000 1.000 Yes 0.846 0.777 0.888 0.838 Tax level 1.020 1.044 1.004 1.048 Contribution 0.996 0.997 0.996 0.997 Type of municipality Big cities 1.000 1.000 Stockholm 1.000 1.000 Göteborg 0.831 0.773 Malmö 0.615 0.722 Other larger cities 1.141 0.921 1.129 0.929 Medium sized cities 1.147 0.860 1.171 0.918 Larger municipalities 1.424 0.999 1.288 0.968 Smaller municipalities 1.813 1.231 1.520 1.124 Rural area 1.914 1.184 1.861 1.265 Source: Statistics Sweden
* Control for age, age squared, marital status, children in household, educational level and years since immigration, country of birth and internal migration. These variables are not shown in the table, but are available upon request. Bold, bold + italic and bold + italic + underlined indicates significance on 0.01, 0.05 and 0.1 level. Nagelkerke R2 = 0.145 and 0.146(men) and 0.187 and 0.188 (women).
34

Table 9: Local labour markets. The odds ratio of obtaining employment in 2003. Selected refugee group (ages 25-60).*
Variables Men Women Employment level 1.028 1.020 Unemployment level 0.920 0.932 Size local labour market 1.020 1.020 Source: Statistics Sweden
* Control for age, age squared, marital status, children in household, educational level and years since immigration, country of birth and internal migration. These variables are not shown in the table, but are available upon request. Bold, bold + italic and bold + italic + underlined indicates significance on 0.01, 0.05 and 0.1 level. Nagelkerke R2 = 0.150(men) and 0.190 (women).
35
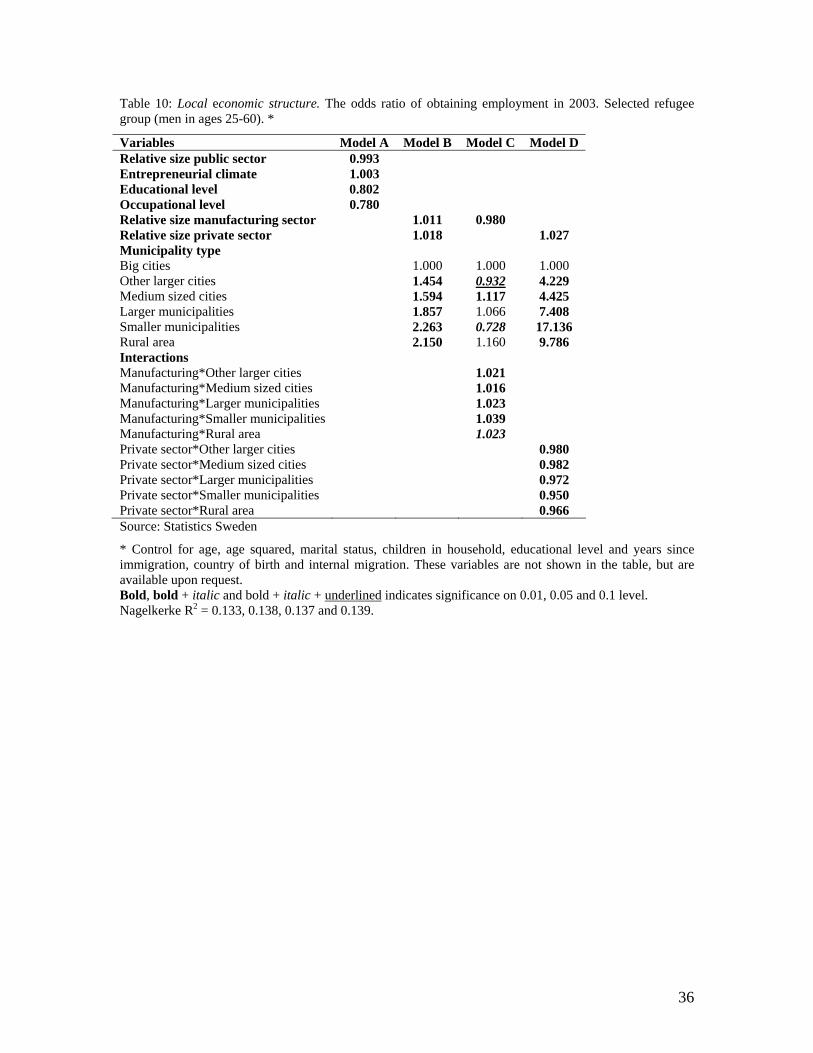
Table 10: Local economic structure. The odds ratio of obtaining employment in 2003. Selected refugee group (men in ages 25-60). *
Variables Model A Model B Model C Model D Relative size public sector 0.993 Entrepreneurial climate 1.003 Educational level 0.802 Occupational level 0.780 Relative size manufacturing sector 1.011 0.980 Relative size private sector 1.018 1.027 Municipality type Big cities 1.000 1.000 1.000 Other larger cities 1.454 0.932 4.229 Medium sized cities 1.594 1.117 4.425 Larger municipalities 1.857 1.066 7.408 Smaller municipalities 2.263 0.728 17.136 Rural area 2.150 1.160 9.786 Interactions Manufacturing*Other larger cities 1.021 Manufacturing*Medium sized cities 1.016 Manufacturing*Larger municipalities 1.023 Manufacturing*Smaller municipalities 1.039 Manufacturing*Rural area 1.023 Private sector*Other larger cities 0.980 Private sector*Medium sized cities 0.982 Private sector*Larger municipalities 0.972 Private sector*Smaller municipalities 0.950 Private sector*Rural area 0.966 Source: Statistics Sweden
* Control for age, age squared, marital status, children in household, educational level and years since immigration, country of birth and internal migration. These variables are not shown in the table, but are available upon request. Bold, bold + italic and bold + italic + underlined indicates significance on 0.01, 0.05 and 0.1 level. Nagelkerke R2 = 0.133, 0.138, 0.137 and 0.139.
36

Table 11: Local economic structure. The odds ratio of obtaining employment in 2003. Selected refugee group (women in ages 25-60).*
Variables Model A Model B Model C Model D Relative size public sector 0.961 Entrepreneurial climate 1.004 Educational level 0.879 Occupational level 0.860 Relative size manufacturing sector 1.007 0.971 Relative size private sector 1.014 1.030 Municipality type Big cities 1.000 1.000 1.000 Other larger cities 1.386 0.824 5.151 Medium sized cities 1.537 1.001 5.113 Larger municipalities 1.618 0.933 6.826 Smaller municipalities 1.881 0.631 15.153 Rural area 1.998 1.167 9.848 Interactions Manufacturing*Other larger cities 1.030 Manufacturing*Medium sized cities 1.025 Manufacturing*Larger municipalities 1.029 Manufacturing*Smaller municipalities 1.043 Manufacturing*Rural area 1.024 Private sector*Other larger cities 0.976 Private sector*Medium sized cities 0.979 Private sector*Larger municipalities 0.973 Private sector*Smaller municipalities 0.951 Private sector*Rural area 0.967 Source: Statistics Sweden
* Control for age, age squared, marital status, children in household, educational level and years since immigration, country of birth and internal migration. These variables are not shown in the table, but are available upon request. Bold, bold + italic and bold + italic + underlined indicates significance on 0.01, 0.05 and 0.1 level. Nagelkerke R2 = 0.179, 0.183, 0.182 and 0.184.
37

Table 12: Distribution by sex and sector of employment. Selected refugee groups and natives (ages 25-60). Country of birth Men Women Public
sector Private sector
Self employed
Public sector
Private sector
Self employed
Sweden 22.2 67.6 10.3 55.1 40.3 4.6 Yugoslavia 17.0 74.6 8.3 45.8 50.2 4.0 Bosnia-Herzegovina
14.9 81.4 3.7 45.3 52.9 1.8
Poland 20.1 68.0 11.9 48.7 44.9 6.5 Rumania 19.4 73.0 7.6 47.7 47.9 4.4 Hungary 20.6 67.1 12.2 46.6 45.4 7.9 Turkey 13.7 50.8 35.4 46.4 41.9 11.7 Lebanon 14.9 54.1 31.0 42.1 41.9 16.0 Syria 16.6 48.0 35.4 46.8 41.1 12.1 Chile 26.7 68.7 4.6 54.3 43.8 2.0 Iran 29.2 50.2 20.6 59.3 32.0 8.7 Iraq 23.2 58.3 18.5 54.0 38.7 7.3 Ethiopia 36.7 58.0 5.3 61.4 37.2 1.4 All Refugees 20.8 63.6 15.7 50.0 44.0 6.0 Source: Statistics Sweden.
38

Appendix
Selected refugee groups by type of municipality of first settlement and municipality of residence in 2003.
Males (percent)
Country of birth
Municipality Big cities
Larger cities
Medium sized cities
Larger munici-pallities
Smaller munici-palities
Rural area
Yugoslavia First 2003
21.4 27.7
26.8 35.5
22.3 23.8
17.3 9.9
6.2 2.3
6.1 0.8
Bosnia-Herzegovina
First 2003
11.1 26.3
22.8 33.2
25.4 25.0
24.0 11.5
7.6 3.1
9.1 0.7
Poland First 2003
41.4 41.6
33.1 35.6
13.8 14.8
9.6 6.3
1.0 1.0
1.1 0.8
Rumania First 2003
23.9 32.1
28.7 35.7
19.2 17.2
24.3 12.6
3.1 2.3
0.9 0.3
Hungary First 2003
41.2 45.8
29.2 30.6
13.2 14.5
14.1 7.6
2.0 1.3
0.3 0.2
Turkey First 2003
29.4 30.8
48.2 53.7
13.6 11.1
4.6 2.4
1.7 0.7
2.5 1.3
Lebanon First 2003
15.7 32.7
33.0 42.3
23.9 18.9
15.9 4.5
2.7 0.6
8.7 1.1
Syria First 2003
17.0 23.0
48.3 59.1
16.4 13.8
11.5 3.1
2.4 0.4
4.4 0.6
Chile First 2003
25.1 33.2
37.3 44.9
15.6 15.2
17.2 4.7
3.0 1.4
1.8 0.6
Iran First 2003
17.6 41.3
35.4 41.7
19.9 13.3
15.5 2.4
3.4 0.7
8.3 0.6
Iraq First 2003
26.1 39.0
35.3 42.6
17.3 13.3
12.4 3.7
3.1 0.6
5.8 0.7
Ethiopia First 2003
22.0 52.7
34.3 35.8
17.9 8.7
12.1 2.1
6.6 0.3
7.1 0.4
Source: Statistics sweden
Selected refugee groups by type of municipality of first settlement and municipality of residence in 2003. Females (Percent)
Country of birth
Municipality Big cities
Larger cities
Medium sized cities
Larger munici-pallities
Smaller munici-palities
Rural area
Yugoslavia First 2003
20.8 29.0
26.4 35.7
23.2 23.2
17.3 9.3
6.7 2.3
5.6 0.5
Bosnia-Herzegovina
First 2003
10.5 25.3
22.6 33.9
25.3 25.6
24.8 11.5
7.8 3.0
8.9 0.7
Poland First 2003
37.1 36.4
32.8 34.6
17.4 18.3
9.4 8.2
1.5 1.4
1.7 1.2
Rumania First 2003
25.9 31.3
31.2 36.8
19.6 17.4
19.0 11.8
3.3 2.1
1.0 0.7
Hungary First 2003
39.5 42.4
33.1 32.0
14.7 16.4
10.0 7.3
2.2 1.7
0.5 0.3
Turkey First 2003
28.8 31.4
50.6 55.7
12.6 9.8
4.0 1.8
2.1 0.4
2.0 0.8
39

Lebanon First 2003
18.0 31.8
35.6 44.2
22.6 18.7
15.3 4.2
1.7 0.5
6.7 0.6
Syria First 2003
19.8 23.7
50.8 60.2
15.2 12.2
8.8 3.1
1.7 0.4
3.7 0.4
Chile First 2003
24.5 31.0
37.5 45.4
15.6 16.1
17.6 5.5
3.0 1.4
1.7 0.5
Iran First 2003
24.8 41.2
36.2 43.0
17.5 13.0
11.8 1.9
3.3 0.4
6.5 0.4
Iraq First 2003
29.6 38.3
39.2 44.1
17.0 13.4
9.1 3.3
1.9 0.6
3.3 0.3
Ethiopia First 2003
30.1 51.2
37.8 35.7
15.1 10.0
7.6 2.0
4.8 0.7
4.7 0.1
Source: Statistics Sweden
40

References
Andersson, Rune (1996), ‘The Geographical and Social Mobility of Immigrants: Escalator Regions in Sweden from an Etnic Perspective’, Geografiska Annaler B, 1996:1.
Arai, Mahmood, Regner, Håkan & Schröder, Lena (1999), Är arbetsmarknaden öppen för alla?, bilaga 6 till Långtidsutredningen 1999, Finansdepartementet.
Becker, Garry S. (1991) A Treatise on the family. Cambridge, MA:Harvard Univeristy Press.
Bengtsson, Tommy, Lundh, Christer & Scott, Kirk (2005), ‘From Boom to Bust. The Economic Integration of Immigrants in Post War Sweden’, i Klaus E. Zimmermann (red.), European Migration: What Do We Know? Oxford University Press.
Bevelander, Pieter (2000), Immigrant Employment Integration and Structural Change in Sweden, 1970-1995. Lund: Univ. & Södertälje: Almqvist & Wiksell International.
Bevelander, Pieter. (2005), ‘The Employment Status of Immigrant Women: The case of Sweden’, i International Migration Review, Vol. 39, 149, Spring.
Bevelander, Pieter (2006), ‘Invandring och ekonomisk integration: Stockholm’ in ‘Vägen till arbete’, (Eds. Daniel Rauhut), Stockholm Stad.
Bevelander, Pieter, Carlson, Benny & Rojas, Mauricio (1997), I krusbärslandets storstäder. Om invandrare i Stockholm, Göteborg och Malmö. Stockholm: SNS Förlag.
Bevelander, Pieter & Lundh, Christer (2004), ‘Regionala variationer i sysselsättning för män’, i Jan Ekberg (red.), Egenförsörjning eller bidragsförsörjning? Invandrarna, arbetsmarknaden och välfärdsstaten. Rapport från Integrationspolitiska maktutredningen. SOU 2004:21.
Borjas, George J. (1985), ‘Assimilation, Changes in Cohort Quality, and the Earnings of Immigrants’, Journal of Labour Economics, vol. 3, s. 463-489.
Borjas, George J. (1998), ‘To Ghetto or Not to Ghetto: Ethnicity and Residential Segregation’, Journal of Urban Economics, vol. 44, nr. 2, s. 228-253.
Castles, Stephen & Miller, Mark J., The Age of Migration. International Population Movements in the Modern World. (3:e uppl.) Basingstoke: Palgrave 2003.
Chiswick, Barry R. (1978), ‘The Effects of Americanization of the Earnings of Foreign-born Men’, Journal of Political Economy, vol 86, s. 897-921.
Chiswick, Barry R. & Miller, Paul W. (1994), ‘The Determinants of Post-Immigration Investment in Education’, Economics of Education Review, vol. 13, nr. 2, s. 163-177.
Chiswick, Barry R. & Miller, Paul W. (1995), ‘The Endogeneity between Language and Earnings: International Analyses’, Journal of Labor Economics, vol. 13, s. 246-288.
Dustman, Christian (1994), ‘Speaking Fluency, Writing Fluency and Earnings of Migrants’, Journal of Population Economics, vol. 7, s. 133-156.
Edin, Per-Anders, Fredriksson, Peter & Åslund, Olof, (2000), ‘Settlement Policies and the Economic Success of Immigrants’, i Olof Åslund, Health, Immigration, and Settlement Policies. Uppsala: Dept. Of Economics, Uppsala University, 2000.
Edin, Per-Anders, Fredriksson, Peter & Åslund, Olof (2003), ‘Ethnic Enclaves and the Economic Success of Immigrants. Evidence from a Natural Experiment’, The Quarterly Journal of Economics, vol. 118, nr. 1, s. 329-357.
41

Ekberg, Jan & Ohlsson, M (2000), ‘Flyktingars arbetsmarknad är inte alltid nattsvart’, Ekonomisk Debatt, vol. 28, nr. 5.
Ekberg, Jan (1983), Inkomstomsteffekter av invandring. Lund Economic Studies, No. 27. Lund.
Franzén, Elsie. (1997) Invandring och arbetslöshet, Lund: Studentlitteratur Frey, William H. (1996), Immigration, Domestic Migration, and Demographic
Balkanization in America. New Evidence for the 1990s’, Population and Development Review, vol. 22, nr. 4, s. 741-763.
Lange, Anders (1999), Invandrare om diskriminering. En enkät- och intervjuundersökning om etnisk diskriminering på uppdrag av Diskrimineringsombudsmannen (DO). Stockholm: Centrum för invandringsforskning (CEIFO).
Larsson, Torun (1999) ‘Språkets roll som en ekonomisk integrationsfaktor’. Bilaga 2 in SoS-rapport 1999:9, Social och Ekonomisk förankring bland invandrare från Chile, Iran, Polen och Turkiet. Stockholm: Socialstyrelsen.
Lazaer, E P (1990), ‘Culture and Language’, Journal of Political Economy, vol 107, s. 95-126.
Le Grand, Carl & Szulkin, Ryszard (2000), Permanent Disadvantage or Gradual Integration: Explaining the Immigrant-native Earnings Gap in Sweden. Stockholm: Swedish Institute for Social Research.
Lindley, Joanne (2002), ‘The English language fluency and earnings of ethnic minorities in Britain’, Scottish Journal of Political Economy, vol. 49, nr. 4, s. 467-487.
Lundh, Christer & Ohlsson, Rolf (1994), ‘Immigration and Economic Change’, i T. Bengtsson (red), Population, Economy and Welfare in Sweden, Berlin: Springer-Verlag.
Lundh, Christer & Ohlsson, Rolf (1999), Från arbetskraftimport till flyktinginvandring. Andra reviderade upplagan. Stockholm: SNS Förlag.
Lundh, Christer, Bennich-Björkman, Li, Ohlsson, Rolf, Pedersen, Peder J. & Rooth, Dan-Olof, Arbete? Vad god dröj! Invandrare i välfärdssamhället. Stockholm: SNS Förlag 2002.
Ohlsson, Rolf (1975), Invandrarna på arbetsmarknaden. Lund: Ekonomisk-historiska föreningen.
Paulson, Sven (1994), Personalrekrytering - en nyckelfråga’, i Carl-Ulrik Schierup & Sven Paulson (red), Arbetets etniska delning. Stockholm: Carlssons 1994.
Piore, M.J. (1979), Birds of Passage: Migrant Labor and Industrial Societies. Cambridge: Cambridge University Press.
Portes, A (red.) (1995), The Economic Sociology of Immigration, Essays on Networks, Ethnicity and Entrepreneurship. New York: Russel Sage Foundation.
Portes, A & Sensenbrenner, J. (1993), ‘Embeddedness and Immigration: notes on the social determinants of economic action’, American Journal of Sociology, vol. 98, s. 1320-1350.
Portes, A. & Bach, R. (1985), Latin Journey. Berkeley and Los Angeles: University of California Press.
Putnam, Robert D. Leonardi, Robert & Nanetti, Raffaella Y. (1992), Making Democracy Work. Civic Traditions in Modern Italy. Princeton, N.J.: Princeton University Press.
42
Putnam, Robert D. (2000), Bowling Alone. The Collapse and Revival of American Community. New York: Simon & Schuster.
Rooth, Dan-Olof (2001), ‘Etnisk diskriminering och ’Sverige-specifik’ kunskap – vad kan vi lära från studier av adopterade och andra generationens invandrare?’, Ekonomisk Debatt, vol.29. No. 8.
Sassen, S. (1988), The Mobility of Labor and Capital. Cambridge: Cambridge University Press.
Scott, Kirk (1999), The Immigrant Experience. Changing Employment and Income Patterns in Sweden, 1970-1993. Lund: Lund University Press.
Stanfors, Maria. (2003) Thurow, L. (1975), Generating Inequality, Mechanisms of Distribution in the U.S.
Economy. New York: Basic Books. Wadensjö, Eskil, Immigration och samhällsekonomi. Lund 1973. Waldinger, R & Lichter, M.I. (2003), How the Other Half Works. Immigration and the
Social Organiztion of Labor. Berkeley, Los Angeles, London: University of California Press.
Waldinger, R. (red.) (2001), Strangers at the Gates. New Immigrants in Urban America. Berkeley, Los Angeles, London: University of California Press.
Wilson, W.J., (1996), When Work Disappears. The World of the New Urban Poor. New York: Vintage Books.
Åslund, Olof (2000), ‘Immigrant Settlement Policies and Subsequent Migration’, i Olof Åslund, Health, Immigration, and Settlement Policies. Uppsala: Dept. Of Economics, Uppsala University.
43