employment, government revenue, and .../media/files/oil-and-natural-gas/...these are the central...
TRANSCRIPT

1
January 2012
EMPLOYMENT, GOVERNMENT REVENUE, AND ENERGY SECURITY
IMPACTS OF CURRENT FEDERAL LANDS POLICY
IN THE WESTERN U.S.
Prepared for American Petroleum Institute by
1055 Main Street | Grand Junction, CO 81501 | (970) 241-3008
January 2012

2
January 2012
CONTENTS
EXECUTIVE SUMMARY ............................................................................................................................................ 4
1. OIL AND NATURAL GAS IN THE WEST: Understanding the Role of Federal Lands ...................................... 7
1.1 New Federal Drilling Leases Issued: Down 44% ................................................................................. 10
1.2 Permits to Drill: Down 39% ................................................................................................................ 12
1.3 New Wells Drilled on Federal Land: Down 39% .................................................................................. 14
2. ADVERSE FEDERAL LAND POLICY ........................................................................................................ 16
3. ECONOmIC PROjECTIONS FOR WESTERN U.S. OIL AND NATURAL GAS DEVELOPmENT ............................ 18
3.1 Overview of Baseline and Alternative Trends ....................................................................................... 20
3.2 Increased Leasing and Permitting Would Lead to Increased Production .............................................. 20
3.3 Increased Production Would Lead to Increased Employment .............................................................. 24
3.4 Increased Production Would Lead to Increased Tax Revenues for Cash Strapped States ..................... 29
3.5 Federal Royalties ............................................................................................................................... 31
4. CONCLUSION ...................................................................................................................................... 32
4.1 Sources ............................................................................................................................................ 33
5. APPENDIX: DATA AND mETHODOLOGY .................................................................................................. 34
5.1 Data ................................................................................................................................................. 34
5.2 Production and Drilling ...................................................................................................................... 35
5.3 Employment ...................................................................................................................................... 38
5.4 State Severance and Ad Valorem Taxes .............................................................................................. 40
5.5 Federal Royalties ............................................................................................................................... 40
5.6 Supplemental Tables ......................................................................................................................... 41
3
January 2012
TAbLES AND FIGURES
Table E-1: Leasing and Permitting Activity on Federal Land ............................................................................................... 5
Table E-2: Impact of Return to 2007/2008 Levels of Leases and Permits ......................................................................... 6
Table 1: Historical Oil and Natural Gas Production in Western States ................................................................................ 9
Table 2: Net Natural Gas Production ............................................................................................................................... 21
Table 3: Net Natural Gas Liquids Production ................................................................................................................... 22
Table 4: Net Oil Production ............................................................................................................................................. 23
Table 5: Net Number of Wells Started (Spud) on Federal Lands ...................................................................................... 25
Table 6: Average Actual Wells Started on Federal Lands 2000–2010 .............................................................................. 25
Table 7: Net Employment-Direct Effect ............................................................................................................................ 27
Table 8: Net Employment-Total Effect .............................................................................................................................. 27
Table 9: Net Severance and Ad Valorem Taxes ................................................................................................................. 30
Table 10: Net Federal Royalties of Production of Oil, Natural Gas and NGLS ................................................................... 31
Table 11: Baseline and Alternative Leasing and Permitting Scenarios ............................................................................. 36
Table 12: Regression Results .......................................................................................................................................... 37
Table 13: Projected Drilling and Completion Cost Per Well .............................................................................................. 38
Table 14: Projected Drilling and Completion Cost Total ................................................................................................... 39
Figure E-1: Number of New Leases Issued ........................................................................................................................ 5
Figure 1: Natural Gas Production, Total ............................................................................................................................. 8
Figure 2: Example of Federal and Non-Federal Ownership Patterns ................................................................................... 8
Figure 3: Western States Oil Production, Total ................................................................................................................... 8
Figure 4: Number of Leases Sold on BLM Land .............................................................................................................. 10
Figure 5: Relationship Between Leases in Effect and Oil Production ................................................................................ 11
Figure 6: Number of Permits Issued During the Year on Federal Lands ............................................................................ 12
Figure 7: Total Permits on Western Lands ........................................................................................................................ 13
Figure 8: Number of New Wells Started During the Year on Federal Lands ....................................................................... 14
Figure 9: Number of Leases, Permits Issued and Wells Started During the Year on Federal Lands .................................... 15
Figure 10: Relationship Between Drilling Activity and Employment, 1985–2010 ............................................................. 18
Figure 11: Natural Gas Production From Leases on BLM Lands ...................................................................................... 20
Figure 12: Natural Gas Liquids Production From Leases on BLM Lands .......................................................................... 21
Figure 13: Oil Production From Leases on BLM Lands .................................................................................................... 22
Figure 14: Relationship Between Permitting and Drilling Activity, 1985–2010 ................................................................. 24
Figure 15: Number of Wells Started During the Year on Federal Lands ............................................................................ 25
Figure 16: Relationship Between Drilling Activity and Employment .................................................................................. 26
Figure 17: Total Employment Supported by Oil and Gas Development on Federal Land in Western States ....................... 28
Figure 18: Oil and Gas Severance Taxes by State ............................................................................................................ 29
Figure 19: State Severance Tax and Ad Valorem Revenues .............................................................................................. 30
Figure 20: Federal Mineral Royalties in Western States ................................................................................................... 31

4
January 2012
Prepared for American Petroleum Institute
January 2012
EXECUTIVE SUMMARY
The decline in oil and gas leasing, permitting, and new drilling on the nation’s public lands since 2009 have come at a high cost to America – namely, a significant loss of domestically produced oil and natural gas, thousands of jobs in the energy-rich western United States, and the forfeit of hundreds of millions of dollars in state and federal tax revenues, royalties, and lease payments to western states and the U.S. Treasury.
These are the central findings of this Report: Employment, Government Revenue, and Energy Security Impacts of Current Federal Lands Policy in the Western U.S. The Report analyzes oil and natural gas leasing, permitting, and drilling trends on lands managed by the Bureau of Land Management (BLM) in the energy-producing western states of Colorado, Montana, New Mexico, North Dakota, Utah, and Wyoming. The balance of the evidence suggests a systematic decline of energy production activities on the nation’s federal lands in the last two years.
Specifically, according to BLM data, the number of new federal oil and gas leases issued by the BLM is down 44% from an average of 1,874 leases in 2007/2008 to 1,053 in 2009/2010; the number of new permits to drill issued by the BLM is down 39%, from an average of 6,444 permits to an average of 3,962; and the number of new wells drilled on federal land have declined, 39%, from an average of 4,890 wells to 2,973 (Table E-1).
The BLM released new fiscal year 2011 oil and natural gas statistics on January 10, 2012. The trend in reduced leasing, permitting, and drilling on western lands appears to be continuing. Although the 2011 total of 1,461 federal leases issued for western states appears to be higher than the 2009/2010 average of 1,053, closer review of the BLM data shows that the majority of leases that the BLM characterizes as “issued” in 2011 were actually backlog leases that were sold in previous years but had been mired in challenges since. An estimated 860 of the 1,461 leases issued in 2011 were not new leases at all; they are leases secured in previous years that were stranded, in most cases, pending resolution of legal challenges in court. In 2011, only 601 new leases were actually sold, which is an all-time low (since 1984) when backlogged leases are accounted for. New drilling permits and wells drilled issued in 2011 were 3,851 and 2,783 respectively, both below the 2009/2010 averages and significantly below the 2007/2008 averages.
EMPLOYMENT, GOVERNMENT REVENUE, AND ENERGY SECURITY
IMPACTS OF CURRENT FEDERAL LANDS POLICY
IN THE WESTERN U.S.

5
January 2012
2007-08 Average
2009-10 Average
Percent Change
Leases
1,874
1,053
-44%
Permits
6,444
3,962
-39%
Wells
4,890
2,973
-39%
Table E-1: Leasing and Permitting Activity on Federal Land
Source: BLM Oil & Gas Statistics (2010)* Leases on federal land in FY 2011 – 601 Non-federal permits are down
less than their federal counterparts over the last two years at 20%. Non-federal permits have rebounded in 2010, up 31%.
Clearly the economic downturn starting in 2007 is a factor contributing to these results. However, if market factors were the sole driver of the federal lands permitting slowdown, it would be reasonable to assume that non-federal drilling permits would generally track the trends occurring with their federal counterpart. But this is not the case.
Indeed, the number of new permits to drill on federal lands in the West is down by a significantly greater amount (-39%) than new permits to drill on non-federal lands (-20%) over the last 2 years. In 2010 alone, non-federal permits across the West actually increased by 31%, even as federal drilling permits dropped 13%. The Report shows that non-federal oil and gas production has increased in 2009/2010, even as federal oil production has plateaued and federal natural gas production has declined in the same time frame. The 2011 federal oil and natural gas production statistics recently released by the BLM had significant accounting adjustments and therefore current year production levels could not be determined. It is reported that the BLM may release 2011 production estimates in February 2012.
Even when viewed through a wider historical lens, including other recent recessionary periods, the downturn in federal energy activities is of a greater magnitude than any experienced in recent times. This is particularly the case when evaluating the number of new onshore federal oil and gas leases issued in the last two years. While federal leasing numbers have gone up and down due to a range of economic and regulatory considerations through the years, at no time in the last 25 years has the number of new onshore federal oil and gas leases been lower than the number of new leases issued in 2009 and 2010 (BLM Oil & Gas Statistics, 2010). As figure E-1 illustrates, new leases are significantly lower than at a period during the Clinton Administration, or during the George W. Bush Administration.
*Western States (Includes Colorado, Montana, New
Mexico, North Dakota, Utah and Wyoming)
Source: BLM Oil & Gas Statistics (2010)
Figure E-1: Number of New Leases Issued

6
January 2012
These facts strongly suggest that the downturn in oil and natural gas activity on the nation’s federal lands is due to something beyond the nation’s difficult economic circumstances. A host of new rules, policies and administrative actions that are not conducive to oil and natural gas production on federal land are a culprit. The slowdown in new leases, permits and wells drilled on BLM lands is, in real part attributable to the direction of current federal land energy policy. The Report characterizes these new regulatory barriers.
Finally, in addition to quantifying the magnitude of the leasing, permitting, and drilling slowdown, and describing the regulatory barriers that have contributed to this slowdown, the Report also demonstrates the substantial opportunity cost of current BLM policies on America’s energy supplies and the economy.
Using economic modeling, the Report shows that a simple return to permitting, leasing and drilling levels experienced in 2007 and 2008 would benefit the nation’s economic and domestic energy future. Specifically, a return to 2007/2008 federal leasing and permitting levels would result in:
A projected increase of 7 million to 13 million barrels per year of domestic oil production from federal lands in the western U.S. over the next four years.
An annual average projected increase of 620 billion cubic feet of natural gas from federal lands in the western U.S. over the 2012 to 2015 time period. The increases range from 103 billion cubic feet to 818 billion cubic feet per year.
Projected direct employment increases in the oil and gas industry in energy producing western states of 4,085 jobs in 2011, 6,914 jobs in 2012, 9,937 jobs in 2013, 9,713 in 2014, and 9,032 in 2015.
A projected total increase in jobs supported throughout the economy of between 12,656 to 30,163 in energy producing western states over the next four years.
Projected severance and ad valorem tax revenues increases between $59 million and $362 million per year over the 2011 to 2015 time period, totaling over $1.2 billion in five years.
Projected federal royalty increases ranging from $106 million to $670 million per year through 2015, totaling over $2.1 billion in five years.
In as much as a return to 2007/2008 leasing, permitting and drilling levels would boost the economic and domestic energy fortunes of America, the reverse is also unfortunately true – the loss of oil and gas production that will result from current BLM oil and gas permitting processes and practices will cost American jobs and increase our dependence on foreign sources of energy. For a nation enduring slow economic growth and increasing dependence on foreign sources of energy, the costs of this domestic drilling slowdown are profound indeed.
Table E-2:Impact of Return to 2007/2008 Levels of Leases and Permits*(Change from Baseline Case)
Year
2011
2012
2013
2014
2015
Annual Oil Production (mmbbls)
7.1
8.5
12.0
13.2
8.9
Annual Gas Production
(bcf)
103
447
517
696
818
Annual NGL Production (mmbbls)
1.0
4.3
5.0
6.7
7.8
New Wells
610
880
1,140
1,070
940
Direct Employment
4,085
6,914
9,937
9,713
9,032
Total Employment
12,656
21,315
30,163
29,715
27,642
Annual Severance & Ad Valorem
Taxes ($millions)
$59
$183
$236
$319
$362
Annual Federal
Royalties ($millions)
$106
$337
$432
$585
$670
* Western States (Includes: Colorado, Montana, New Mexico, North Dakota, Utah and Wyoming)Source: Economics International Corp., BLM Oil & Gas Statistics (2010)
7
January 2012
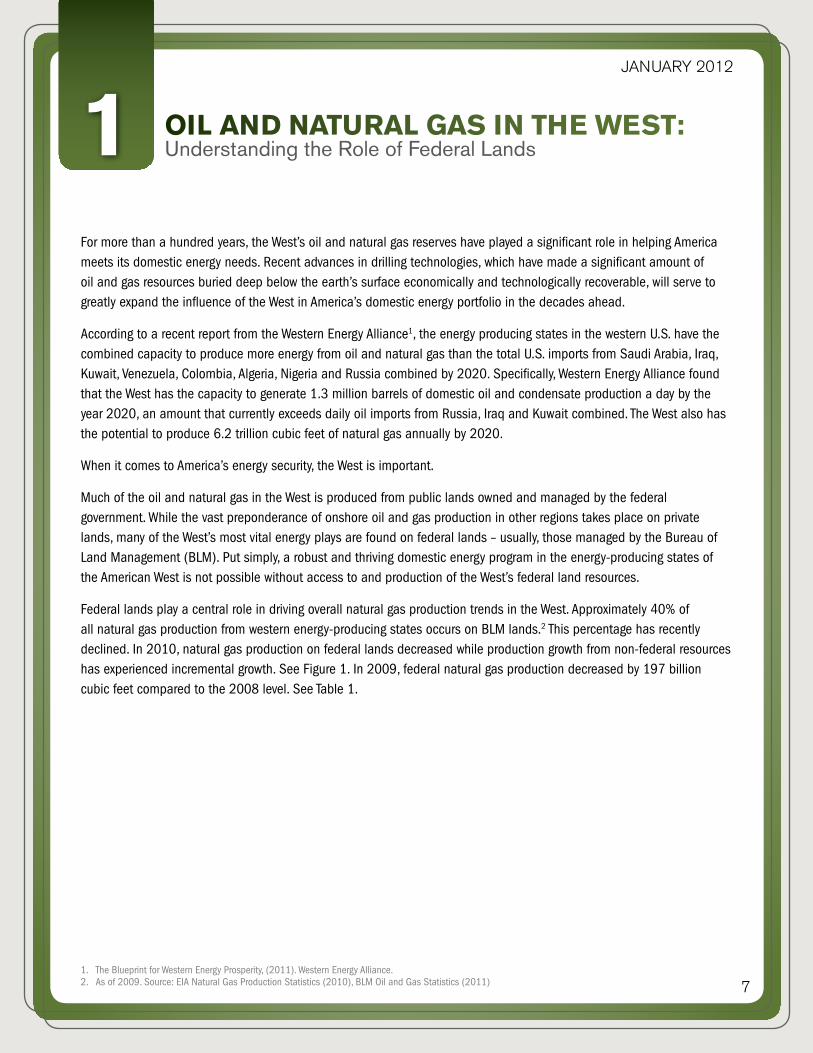
For more than a hundred years, the West’s oil and natural gas reserves have played a significant role in helping America meets its domestic energy needs. Recent advances in drilling technologies, which have made a significant amount of oil and gas resources buried deep below the earth’s surface economically and technologically recoverable, will serve to greatly expand the influence of the West in America’s domestic energy portfolio in the decades ahead.
According to a recent report from the Western Energy Alliance1, the energy producing states in the western U.S. have the combined capacity to produce more energy from oil and natural gas than the total U.S. imports from Saudi Arabia, Iraq, Kuwait, Venezuela, Colombia, Algeria, Nigeria and Russia combined by 2020. Specifically, Western Energy Alliance found that the West has the capacity to generate 1.3 million barrels of domestic oil and condensate production a day by the year 2020, an amount that currently exceeds daily oil imports from Russia, Iraq and Kuwait combined. The West also has the potential to produce 6.2 trillion cubic feet of natural gas annually by 2020.
When it comes to America’s energy security, the West is important.
Much of the oil and natural gas in the West is produced from public lands owned and managed by the federal government. While the vast preponderance of onshore oil and gas production in other regions takes place on private lands, many of the West’s most vital energy plays are found on federal lands – usually, those managed by the Bureau of Land Management (BLM). Put simply, a robust and thriving domestic energy program in the energy-producing states of the American West is not possible without access to and production of the West’s federal land resources.
Federal lands play a central role in driving overall natural gas production trends in the West. Approximately 40% of all natural gas production from western energy-producing states occurs on BLM lands.2 This percentage has recently declined. In 2010, natural gas production on federal lands decreased while production growth from non-federal resources has experienced incremental growth. See Figure 1. In 2009, federal natural gas production decreased by 197 billion cubic feet compared to the 2008 level. See Table 1.
OIL AND NATURAL GAS IN THE WEST: Understanding the Role of Federal Lands1
1. The Blueprint for Western Energy Prosperity, (2011). Western Energy Alliance.2. As of 2009. Source: EIA Natural Gas Production Statistics (2010), BLM Oil and Gas Statistics (2011)

8
January 2012
It is also important to note that a simple “federal vs. non-federal” comparison understates the impact of federal land production in the overall mix of western energy. Figure 2 demonstrates a sample ownership pattern, with federally owned lands in orange, and non-federal in white. Because federal lands are so commonly interspersed, adjacent or co-mingled with non-federal lands, many non-federal oil and gas plays in the West would be less desirable without the associated production of nearby federal lands. Therefore access to federal lands plays a more important role in energy production in the West than 40% of overall production number alone suggests. The loss of access to federal land can and will encumber access to some non-federal energy production opportunities as well.
Figure 3: Western States Oil Production, Total*
Western States (Includes Colorado, Montana, New Mexico, North Dakota, Utah and Wyoming) Source: BLM Oil & Gas Statistics (2010)
Energy Information Administration (2011)
Figure 2: Example of Federal and Non-Federal Ownership Patterns
Source: BLM Ownership Maps, 2011. BLM Public Lands and Administrative Jurisdictions
Figure 1: Natural Gas Production, Total*
*Western States (Includes Colorado, Montana, New Mexico, North Dakota, Utah and Wyoming)Source: BLM Oil & Gas Statistics (2010) Energy Information Administration (2011)

9
*Western States (Includes Colorado, Montana, New Mexico,
North Dakota, Utah and Wyoming)Source: BLM Oil & Gas Statistics (2010) U.S. Energy Information Administration Statistics (2011)
2009 Wyoming and 2010 Montana federal natural gas production numbers
contained accounting errors and adjustments. The federal
production above is based on an average of the State’s previous
and following year’s production. Wyoming –average of 2008 and
2010. Montana- average of 2009 and 2011.
Table 1: Historical Oil and Natural Gas Production in Western States*
Oil Production (million barrels)
2009
28.3
4.1
24.2
27.7
3.5
24.2
61.1
26.9
34.2
79.7
7.6
72.1
22.9
11.2
11.7
51.3
33.9
17.4
87.3
183.9
2008
24.1
5.1
19.0
31.5
3.8
27.7
59.4
24.8
34.6
62.8
8.4
54.3
22.0
9.3
12.7
52.9
34.7
18.3
86.1
166.6
2007
23.2
4.9
18.4
34.8
3.8
31.0
58.8
24.6
34.2
45.1
7.6
37.5
19.5
8.6
10.9
54.1
34.4
19.7
83.9
151.7
2006
23.4
5.6
17.7
36.3
3.9
32.4
59.8
24.3
35.5
39.9
7.0
32.9
17.9
7.3
10.6
52.9
33.2
19.7
81.4
148.8
2005
22.8
4.9
17.9
32.9
3.7
29.1
60.7
26.0
34.6
35.7
6.2
29.4
16.7
5.9
10.8
51.6
32.4
19.2
79.1
141.1
2004
22.1
4.1
18.0
24.7
3.8
20.9
64.2
29.8
34.5
31.2
5.6
25.5
14.6
4.7
9.9
51.6
32.1
19.2
80.0
128.4
2003
21.1
4.3
16.8
19.3
3.5
15.8
66.1
31.0
35.2
29.4
5.8
23.6
13.1
4.3
8.8
52.4
32.4
20.0
81.2
120.2
2002
17.7
5.2
12.5
16.9
3.2
13.6
67.0
30.9
36.2
31.0
5.8
25.2
13.7
3.9
9.8
54.7
33.6
21.1
82.7
118.4
2000
18.5
4.7
13.8
15.4
2.9
12.5
67.2
28.1
39.1
32.7
6.0
26.7
15.6
3.6
12.1
60.7
35.8
24.9
81.1
129.1
CO Total
CO Federal
Non- federal
MT Total
MT Federal
Non- federal
NM Total
NM Federal
Non- federal
ND Total
ND Federal
Non- federal
UT Total
UT Federal
Non- federal
WY Total
WY Federal
Non- federal
Total Federal
Total Non- federal
2001
16.5
4.5
12.0
15.9
2.9
13.1
68.0
28.6
39.4
31.7
5.9
25.8
15.3
3.1
12.1
57.4
32.9
24.5
77.8
127.0
2010
30.9
3.8
27.0
25.3
3.8
21.5
65.1
29.9
35.2
113.0
8.2
104.8
24.7
11.7
13.0
53.1
34.9
18.2
92.3
219.8
Bottom line:energy production
in the West, home to
more than 3 billion
barrels of proved oil
reserves (Western
Energy Alliance, 2011),
is vital to America’s
overall domestic energy
portfolio, and federal
lands are a key driver
of energy production
in the West. Recent
oil and natural gas
production on federal
lands is lagging
production growth on
non-federal resources
in the West.
Natural Gas Production (billion cubic feet)
2009
1,499.7
269.9
1,229.5
102.6
70.9
31.7
1,409.0
780.1
628.9
54.9
7.5
47.4
450.8
285.9
164.9
2,335.5
1,610.0
725.5
3,024.3
2,827.8
2010
1,540.5
279.2
1,261.3
89.3
46.3
43.1
1,303.6
673.7
629.9
76.5
8.0
68.4
430.9
271.0
160.0
2,337.2
1,631.1
706.0
2,909.3
2,868.7
2008
1,339.7
243.7
1,096.0
114.9
33.5
8146
1,456.5
843.4
613.1
54.5
9.8
44.7
410.7
250.9
159.8
2,210.5
1,590.2
620.4
2,971.4
2,615.4
2007
1,234.9
208.6
1,026.3
116.2
32.2
84.0
1,547.3
867.0
680.3
60.4
10.3
50.0
378.9
223.9
155.0
2,010.5
1,356.5
654.0
2,698.5
2,649.7
2006
1,183.4
201.6
981.9
112.4
31.8
80.6
1,616.8
989.4
627.4
53.8
10.3
43.5
335.3
193.4
141.9
1,750.2
1,295.4
454.8
2,721.9
2,330.1
2005
1,121.0
188.1
932.9
105.3
28.7
76.5
1,647.4
926.3
721.1
53.3
8.9
44.4
294.4
170.8
123.6
1,612.8
1,048.4
564.3
2,371.3
2,462.9
2004
1,063.4
141.6
921.8
93.3
24.1
69.2
1,620.9
936.7
684.3
55.7
7.7
48.0
271.6
134.9
136.7
1,585.1
972.5
612.6
2,217.4
2,472.5
2003
1,006.1
117.4
888.7
85.8
20.6
65.2
1,611.5
938.0
673.58
55.2
7.9
47.4
270.9
123.4
147.5
1,536.2
931.0
605.1
2,138.3
2,427.4
2002
904.3
92.0
812.3
84.9
19.1
65.8
1,646.9
1,002.0
644.9
56.8
7.1
49.7
276.3
107.8
168.5
1,411.9
784.5
627.3
2,012.5
2,368.5
2000
750.3
73.4
676.8
67.4
15.8
52.0
1,647.2
1,105.7
541.6
53.1
6.1
46.9
262.7
80.6
182.1
1,065.2
718.6
346.6
2,000.2
1,846.0
CO Total
CO Federal
Non- federal
MT Total
MT Federal
Non- federal
NM Total
NM Federal
Non- federal
ND Total
ND Federal
Non- federal
UT Total
UT Federal
Non- federal
WY Total
WY Federal
Non- federal
Total Federal
Total Non- federal
2001
789.2
85.2
704.0
78.4
17.8
60.6
1,689.6
1,030.5
659.1
53.9
5.3
48.6
283.3
86.4
196.9
1,294.5
723.3
571.2
1,948.5
2,240.3

10
January 2012
New Federal Drilling Leases Issued: Down 44%1.1
Energy exploration and development on federally owned land is a multi-layered process, beginning first with a bid by an energy producer to obtain a lease from the relevant BLM state office. To obtain a federal lease, a company nominates a parcel it is interested in developing to the BLM state office, which then reviews the parcel for availability, lease stipulations, and conformance with a land use plan. Lease stipulations are determined and attached to the parcel prior to it being made available for bidding during the lease sale process. Once issued, these leases are “available” until they are produced, extended or expire.
A critical determinant of total available leases available for production is the number of new leases an Administration sells in a given year. New leases represent a real-time snap shot of how a given administration’s policies translate into tangible action when it comes to domestic energy production on federal lands. What’s more, the number of leases sold is also one of the key indicators of how private companies perceive the level of federal encouragement and commitment to oil and natural gas development.
Today new oil and natural gas leases issued for federal land are at their lowest level since 2000 (Figure 4). During 2009 and 2010, the number of new federal oil and gas leases issued has averaged 44% less compared to their 2007 and 2008 levels.3 Indeed, while leasing numbers have gone up and down due to a range of economic and regulatory considerations through the years, at no time in the last 25 years has the number of new onshore federal oil and gas leases been lower than the number of new leases issued in 2009 and 2010 (BLM Oil & Gas Statistics, 2010).
3. According to BLM lease sale data compiled by Western Energy Alliance, leases sold in 2011 decreased to 601. The reported number of leases issued by the BLM in 2011 was 1,461. However, an estimated 860 of the leases issued were backlog leases sold in previous years mostly in Wyoming and Utah and released in 2011 due to resolutions of challenges to these leases in the courts. Source: BLM FY 2005 - 2011 oil and gas leasing statistics.
*Western States (Includes Colorado, Montana, New Mexico, North Dakota, Utah and Wyoming)Source: BLM Oil & Gas Statistics (2010)
Figure 4: Number of Leases Sold on BLM Land*

11
January 2012
Historically, the relationship between the number of leases in effect and future oil production in the western states shows a strong positive correlation: the more leases that are available, the greater the domestic oil production that occurs on federal lands. As Figure 5 shows, since 1984, oil production from federal lands has consistently been at its highest levels when the number of total drilling leases available was at its highest. The reverse has also been true through the years – fewer available leases have resulted in a curtailment of oil production from the nation’s federal lands.
*Western States (Includes Colorado, Montana, New Mexico, North Dakota, Utah and Wyoming) Source: BLM Oil & Gas Statistics (2010)
Figure 5: Relationship Between Leases in Effect and Oil Production
Recently released BLM figures for leases issued for 2011 were not available at the time this analysis was undertaken. However if used, they would most likely not have significantly impacted the model results of the relationship between leases and production.

12
January 2012
Permits to Drill: Down 39%1.2
Under federal law, once a federal lease has been issued, the next step in the administrative process for an energy producer is to obtain a permit to drill. The permit to drill is one of the administrative clearances necessary before an energy company can develop an oil and gas lease; thus, the number of permits issued in a given year is an illustrative metric of the relative priority an administration places on producing energy from public lands from one year to the next.
The most recent BLM data on drilling permits for federal leases indicates a relatively steep decline during the 2009/2010 time period. The number of permits issued from 2006 to 2008 increased significantly, but there has been a steep decline since then (Figure 6). Permits to drill are down by 39%, from an average of 6,444 in 2007/2008 to an average of 3,962 in 2009/2010. Reduced permitting trends appear to be continuing with 3,815 drilling permits recently reported for 2011.
*Western States (Includes Colorado, Montana, New Mexico, North Dakota, Utah and Wyoming) Source: BLM Oil & Gas Statistics (2010)
Figure 6: Number of Permits Issued During the Year on Federal Lands*
* In 2005, natural gas production in many parts of the Rockies began to have difficulty reaching markets due to limited availability of pipeline capacity. However, as sections of the Rockies Express and other pipelines began to be built and put into service, pipeline constraints out of the Rockies were alleviated. There are currently no significant consistent pipeline constraints out of the Rockies.

13
January 2012
The slowdown in federal permits issued between 2007/2008 and 2009/2010 cannot be attributed solely to the recession and the reduction in demand for energy. If market factors were the principal driver of the federal lands permitting slowdown, it would be reasonable to assume that non-federal drilling permits would generally track the trends occurring with their federal counterpart. Although all permitting declined in 2009, permitting on nonfederal land rebounded somewhat in 2010. A similar permitting rebound did not occur on federal leases (Figure 7). The number of new permits to drill on federal lands is down by a significantly greater amount (-43%) than the decline in new permits on non-federal lands (-20%). In 2010, the difference in permitting between federal and non-federal lands is especially large. Non-federal permits across the West actually increased by 31%, even as federal drilling permits dropped 13%.
*Western States (Includes Colorado, Montana, New Mexico, North Dakota, Utah and Wyoming)Source: BLM Oil & Gas Statistics (2010), State Oil and Gas Commissions
Figure 7: Total Permits on Western Lands*

14
January 2012
New Wells Drilled on Federal Land: Down 39%1.3
The slowdown in federal leasing and permitting has led to a decline in the number of new oil and gas wells drilled on federal land between 2008 and 2010. Following a period of general growth in the number of wells started over the previous 8 years, new wells drilled on federal lands declined in 2009 and 2010. More permits are associated with more drilling activity (Figure 8). As the number of permits has declined in 2009 and 2010, the number of new wells drilled on federal lands has declined as well; down 39% from an average of 4,890 in 2007/2008 to 2,973 in 2009/2010. The reduced level drilling appears to be continuing. The BLM recently reported 2,783 wells were drilled in the western states in 2011.
*Western States (Includes Colorado, Montana, New Mexico, North Dakota, Utah and Wyoming) Source: BLM Oil & Gas Statistics (2010)
Figure 8: Number Of New Wells Started During the Year on Federal Lands*

15
January 2012
Figure 9 summarizes, in the cumulative, current trends of oil and gas development on federal lands. Comparing the two year period of 2007/2008 to 2009/2010, the number of new oil and gas leases issued by the BLM is down 44%, the number of new permits to drill issued by the BLM is down 39%, and the number new federal wells drilled on BLM lands is also down 39%.
Western States (Includes Colorado, Montana, New Mexico, North Dakota, Utah and Wyoming) Source: BLM Oil & Gas Statistics (2010)
Figure 9: Number of Leases, Permits Issued and Wells Started During the Year on Federal Lands*

16
January 2012
ADVERSE FEDERAL LAND POLICY2The slowdown in new leases, permits and wells drilled on BLM lands is, in real part, attributable to the direction of current federal land energy policy. The Department of Interior (DOI) and the BLM have refused to follow the federal requirements that require timely action on important oil and gas decisions, and, what’s more, DOI and BLM have established a host of new rules, policies and administrative actions that are adversarial to energy production on federal lands. Among those adversarial actions and decisions:
From the very beginning, the current administration has failed to issue onshore oil and gas leases within the legally required 60-day timeline. Such unreasonable delays also have the effect of chasing away future investment from federal permitting, and the federal leases that are their pre-condition. Specifically, the GAO found that the administration failed to issue 91% of leases on federal land within the time frame required under federal law, without releasing or refunding more than a hundred million dollars in lease and bonus payments (U.S. GAO, 2010). In June of 2011 the BLM lost a lawsuit with independent energy producers for failure to meet this 60-day requirement, a judicial affirmation that the administration is causing unreasonable delay in federal oil and gas permitting.
In 2009, the BLM rescinded 77 oil and gas leases issued in Utah, and in 2010, the BLM did the same, canceling 91,000 acres of oil and natural gas leases in Montana, North Dakota and South Dakota. This action, in addition to limiting energy production opportunities in these specific areas, also cast a pall of uncertainty around scores of other BLM oil and gas leases.
In February 2009, BLM refused to issue oil-shale research and development leases in Colorado and Utah, a move that injected considerable uncertainty into the marketplace of energy producers investing significant resources into oil-shale R&D eforts. (Johnson, 2009).
In January 2010, the DOI announced a slew of new administrative requirements to the onshore leasing process. While leasing regulations already involve land use planning and extensive reviews of parcel conformance with the land use plan and environmental and disturbance measures, new leasing regulations extend the analysis and lengthen the leasing process. The 2010 changes add entire environmental review documents for each revision or new stipulation, mandate public involvement from outside groups for comment and extend the interdisciplinary review of lease sale parcels. According to the Western Energy Alliance, “DOI created new policies in 2010 that will add three additional layers of regulation to the exploration and development of oil and natural gas on public lands. These regulations are in addition to the existing five levels of regulation and analysis that for decades have made development on federal lands more time-consuming and difficult than on private lands. All this redundant analysis has led to anemic lease sales-just a few parcels in many cases-cancelled lease sales, indeterminate deferrals, and indefinite delays from nomination to sale.” (Western Energy Alliance, 2011). Here again, these new requirements cast an additional cloud of uncertainty around a leasing process that is already heavily regulated.

17
January 2012
In May 2010, BLM suspended 61 leases that were issued in Montana (U.S. DOI, 2010).
In December 2010, the DOI announced a new “Wild Lands” policy, a new federal lands categorization that critics contend will force land managers to treat the lands as de facto wilderness (U.S. DOI, 2010). After Congress inserted a rider that prohibited the Wild Lands policy from proceeding in the current fiscal year, the DOI was forced to withdraw the plan, though the practical availability of these lands for energy production still remains uncertain.
In March 2011, BLM placed new bureaucratic barriers in the way of commercial oil-shale development as part of a settlement with environmental groups (Proctor, 2011). This new rulemaking will make it difficult, if not impossible, to turn R&D oil shale leases into a commercial oil shale production program, at the point in time technological advancement allows.
In June 2011, the head of the Environmental Protection Agency was reported saying that, at the end a 2-year study on hydraulic fracturing, EPA would promulgate new federal restrictions on hydraulic fracturing (Travers, 2011). Currently, hydraulic fracturing is regulated by the States, and many States have added new regulatory requirements to the practice in recent years. Still, new federal regulatory restrictions surrounding the practice of hydraulic fracturing, and the inevitable barrage of anti-development litigation such rules would invite, is of widespread concern, since hydraulic fracturing is the key to accessing billions of barrels of oil and trillions of cubic feet of natural gas in “unconventional” oil and gas plays across the western U.S. Various departments and agencies are considering new hydraulic rules and regulations.
In May of 2010 the DOI issued a policy that would require redundant environmental reviews in drilling locations where a review had already recently been conducted. In years past, an expedited procedure would have minimized additional reviews for already analyzed drilling locations- ultimately allowing operators to move forward in a more timely fashion. In August of 2011, a judge ruled against the government’s new policy, stating that western oil and gas companies had been harmed, and placed a nationwide injunction against the new redundant requirements promulgated by DOI earlier in 2011 (Western Energy Alliance vs. Ken Salazar et al.).
On a practical level, the current regulatory environment has not only resulted in fewer leases being issued by the BLM, but when leases are issued, these new restrictions make it more difficult, expensive and time-consuming to translate those leases into actual drilling permits, new drilling activity, and eventual production. Some have attempted to deflect blame for a decline in new federal production by attributing it to energy companies that have not developed existing federal oil and gas leases. But according to one industry survey, more than 50% of all federal lands that have been leased but not produced are hindered by post-leasing, pre-permitting, pre-drilling administrative processes (Western Energy Alliance, 2011).
Taken together, these recent policy decisions seem to have created an atmosphere which directly hinders future oil and natural gas production on federal land. Increased regulatory uncertainty – while harmful to business in general – is detrimental to an industry that depends on long-term investments for developing resources and technology necessary for energy production.
Beyond just the impact on domestic energy production, this regulatory environment has the potential to encourage energy producers to invest more of their resources in foreign nations and foreign energy reserves.

18
January 2012
Economic Projections for Western U.S. Oil and Natural Gas Development 3
4. The Western Energy Alliance estimate includes all downstream employment impacts in the industry, ranging from pipeline transportation to gas station attendants; therefore this number reflects the total impact on the industry. Our analysis deals with upstream exploration and production related job categories, mapped to the following NAICS codes, and explained further in this Report. NAICS codes: 211- Oil and gas extraction, 213111- Drilling oil and gas wells, 213112- Support activities for oil and gas operations.
Oil and gas exploration and development is key to the economic vitality of the regional economy, and the number of new leases, permits and federal wells drilled will have economic and energy security impacts. Currently, the Western Energy Alliance estimates that oil and natural gas exploration and development supports 488,000 total jobs4 in the western states; employment in the industry accounts for 8.1 percent of total regional employment; and oil and gas employees in the western states earn more than $27 billion in annual labor income, accounting for 10.3 percent of total regional labor income (Western Energy Alliance, 2010). For the purposes of this report, we will only narrowly focus on the direct “upstream” job implications of federal energy policy.
Figure 10 demonstrates the role that leasing and permitting plays in maintaining and expanding western states’ employment. It shows that increased drilling activity is associated with increased employment in the western U.S.
*Western States (Includes Colorado, Montana, New Mexico, North Dakota, Utah and Wyoming) Source: BLM Oil & Gas Statistics (2010)
Figure 10: Relationship Between Drilling Activity and Employment, 1985–2010*

19
January 2012
Energy production on federal lands also has the capacity to contribute large sums of severance and ad valorem taxes to state and local governments, and substantial revenues to the federal government in the form of federal royalties, bonuses and leasing payments. Therefore, policy decisions that impact oil and natural gas development on federal lands will also impact jobs and government revenues. For the purposes of this Report, future projections of oil and natural gas development and the associated economic impacts are framed by the following two cases: what would happen to domestic energy production, job growth and state and federal tax revenues if federal leasing and permitting levels returned to their 2007/2008 levels as compared to a continuation of 2009/2010 levels into the future?
We use regression analysis to measure the relationship between the number of energy leases and permits issued in a given year and the subsequent production of oil and natural gas from the leases on federal land in succeeding years. The results quantify the economic consequences of more leasing/permitting/drilling and less of the same. The estimated statistical relationship can be applied to various policy cases to evaluate how prospective policies would affect future production.
Two different cases are analyzed in the modeling exercise: a Baseline Case, which demonstrates the projected effects of continuing the levels of leasing, permitting and new drilling as seen in 2009/2010; and an Alternative Case, which shows the energy production, economic, and revenue impacts of returning to the level of leasing, permitting, and new federal drilling experienced in 2007/2008. The Baseline and Alternative Cases are useful in demonstrating the difference that policy changes can have on future energy production, employment and government tax revenues. The compelling feature of the model is in highlighting the difference, or delta, between a regulatory environment that encourages more leasing, permitting and new drilling versus the current regulatory climate which is more restrictive.
The relevant data in the regression analysis includes information from the BLM regarding the number of leases, permits, and production on federal lands. Functional form and statistics results are discussed further in the appendix.
Forecasts of production were developed under a “Baseline” and an “Alternative” Case using the following assumptions.
Baseline Case represents the average annual number of leases and permits issued in 2009 and 2010, (1,060 leases a year and 3,970 permits a year).
Alternative Case represents the average annual total number of leases and permits issued in 2007 and 2008, (1,880 leases a year and 6,450 permits a year).
Projections of future production were pivoted off of 2010 actual production. That is, actual values for dependent variables (oil production, natural gas production, and number of new wells drilled) for 2010 were used as the basis on which the projected percent changes were applied. This provided a Baseline and an Alternative estimate of production and drilling for each of the years 2011 through 2015. The Baseline value was subtracted from the Alternative value to provide the estimated impact, or delta, associated with increased leasing and permitting activity.

20
January 2012
Overview of baseline and Alternative Trends
Increased Leasing and Permitting Would Lead to Increased Production
3.1
3.2
The models show that domestic oil and gas production, and the jobs and revenues that accompany such production, would experience a meaningful rebound under the Alternative Case, where a return to the 2007/2008 leasing, permitting, and drilling activities are assumed. Under the Baseline Case, where a continuation of the current slowdown is assumed going forward, natural gas production on federal lands stagnates, and oil production on federal lands would enter a period of year over year decline through the year 2015.
The models show that the effect of returning to 2007/2008 leasing and permitting levels is an increase of new domestic oil and natural gas supply for American consumers.
The impact of returning to 2007/2008 permitting and leasing levels is substantial when it comes to natural gas production, with a 516 billion cubic feet a year average increase in western states production over the next five years (Table 2). In natural gas production, the biggest winners would be Wyoming, New Mexico and Colorado, where natural gas production would increase on average by 262 billion cubic feet, 133 billion cubic feet, and 54 billion cubic feet, respectively, each year over the 2011-2015 time period.
*Western States (Includes Colorado, Montana, New Mexico, North Dakota, Utah and Wyoming) Source: Economics International Corp. calculations based on information from BLM Oil & Gas Statistics (2010) and
ICF International Rocky Mountain Forecasts (2011)
Figure 11: Natural Gas Production From Leases on BLM Lands*

21
January 2012
For natural gas liquids, returning to the 2007/2008 level of leases and permits issued would be associated with a 25 million barrel a year average increase in production between now and 2015 (Table 3). Given New Mexico and Wyoming’s history of greater natural gas production on federal lands, those two states would also benefit from a return in this category as well. New Mexico would average an annual increase of 2.6 million barrels of natural gas liquids over the next five years, and Wyoming would average an annual 1.6 million barrel increase.
TABLE 2 – NET (Alternative Minus Baseline)Natural Gas Production, billion cubic feet
Increase in production relative to amount associated with baseline number of leases and permits issued
Year
2011
2012
2013
2014
2015
Average
Colorado
11
45
53
72
87
54
Montana
2
8
9
12
14
9
New Mexico
24
110
132
183
215
133
North Dakota
0
1
1
2
2
1
Utah
11
50
58
76
89
57
Wyoming
54
232
263
351
410
262
Total
103
447
517
696
818
516
Source: Economics International Corp. calculations based on information from BLM Oil & Gas Statistics (2010) andICF International Rocky Mountain Forecasts (2011)
*Western States (Includes Colorado, Montana, New Mexico, North Dakota, Utah and Wyoming) Source: Economics International Corp. calculations based on information from BLM Oil & Gas
Statistics (2010) and ICF International Rocky Mountain Forecasts (2011)
Figure 12: Natural Gas Liquids Production From Leases on BLM Lands*

22
January 2012
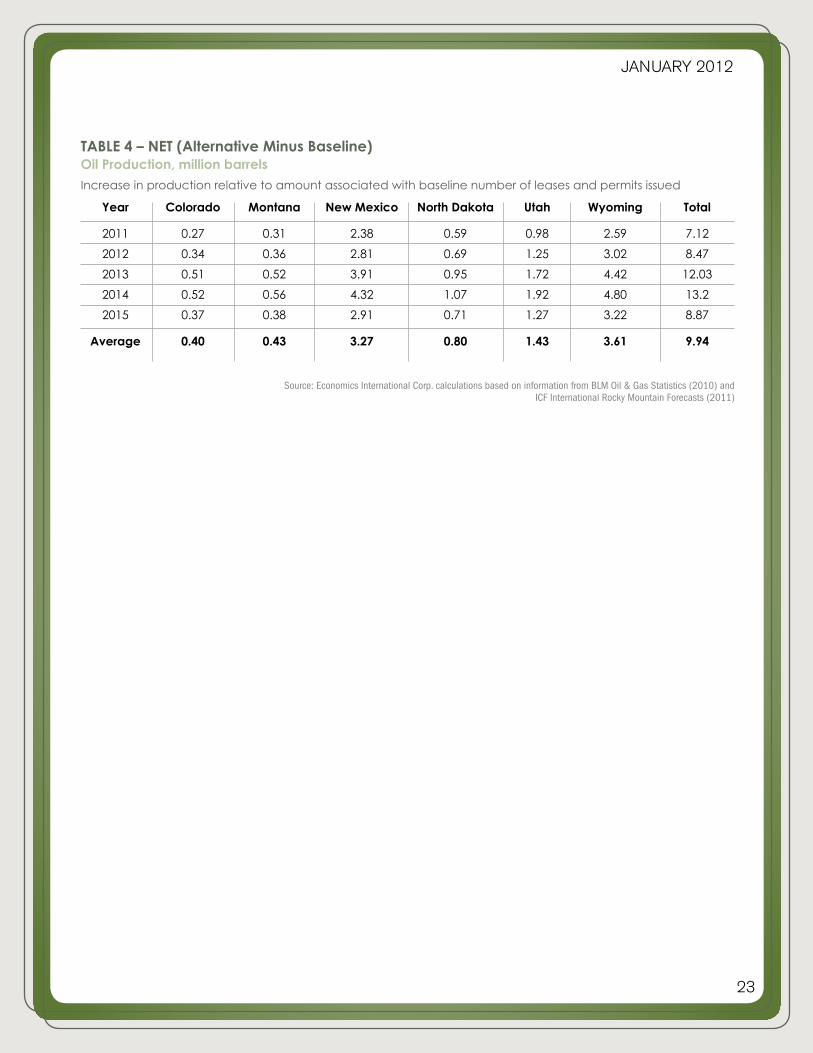
When it comes to oil production, (Table 4), returning to the 2007/2008 average level of leases and permits issued would result in a 9.9 million barrel a year average increase on federal lands in western states oil production over the 2011-2015 period relative to the production that would occur under 2009/2010 average leasing and permitting levels.
A return to 2007/2008 federal leasing, permitting and new drilling levels would generate a projected average of 3.6 million additional barrels of oil each year over the next 5 years from the state of Wyoming alone. In Utah, oil production would grow by an average of 1.4 million barrels each year over the next 5 years under a return to 2007/2008 federal land productivity measures. And North Dakota would experience an average 800,000 barrel per year jump each year over the projected horizon.
Source: Economics International Corp. calculations based on information from BLM Oil & Gas Statistics (2010) and ICF International Rocky Mountain Forecasts (2011)
TABLE 3 – NET (Alternative Minus Baseline)Natural Gas Liquids Production, million barrels
Increase in production relative to amount associated with baseline number of leases and permits issued
Year
2011
2012
2013
2014
2015
Average
Colorado
0.1
0.3
0.3
0.4
0.5
0.3
Montana
0.0
0.0
0.0
0.0
0.0
0.0
New Mexico
0.5
2.2
2.6
3.5
4.1
2.6
North Dakota
0.0
0.0
0.0
0.0
0.0
0.0
Utah
0.1
0.4
0.5
0.6
0.7
0.5
Wyoming
0.3
1.4
1.6
2.1
2.4
1.6
Total
1.0
4.3
5.0
6.7
7.8
5.0
*Western States (Includes Colorado, Montana, New Mexico, North Dakota, Utah and Wyoming) Source: Economics International Corp. calculations based on information from BLM Oil & Gas
Statistics (2010) and ICF International Rocky Mountain Forecasts (2011)
Figure 13: Oil Production From Leases on BLM Lands*
23
January 2012
TABLE 4 – NET (Alternative Minus Baseline)Oil Production, million barrels
Increase in production relative to amount associated with baseline number of leases and permits issued
Year
2011
2012
2013
2014
2015
Average
Colorado
0.27
0.34
0.51
0.52
0.37
0.40
Montana
0.31
0.36
0.52
0.56
0.38
0.43
New Mexico
2.38
2.81
3.91
4.32
2.91
3.27
North Dakota
0.59
0.69
0.95
1.07
0.71
0.80
Utah
0.98
1.25
1.72
1.92
1.27
1.43
Wyoming
2.59
3.02
4.42
4.80
3.22
3.61
Total
7.12
8.47
12.03
13.2
8.87
9.94
Source: Economics International Corp. calculations based on information from BLM Oil & Gas Statistics (2010) andICF International Rocky Mountain Forecasts (2011)

24
January 2012
Increased Production Would Lead to Increased Employment3.3
Oil and gas exploration and development is an important part of the regional economy. Freeing up federal lands for that purpose would be a boon to the western states by paving the way for job creation. Expanding the energy productivity of federal lands would drive increased drilling activity—which in turn would mean more jobs. There is a clear relationship between increased permitting and drilling activity, as seen in Figure 14.
Based on this type of relationship, we can quantify the effect of the number of new permits issued on the number of new wells started. For instance, returning to the 2007/2008 levels of new permitting would be associated with an increase in drilling activity (Table 5). The western states stand to gain an average of 928 new wells drilled a year over the next five years. Colorado and Utah will gain on average over 100 new wells each year, relative to their 2000-2010 average (Table 6). New Mexico and Wyoming will also more than double that gain, averaging 236 and 378 new wells each year, respectively.
*Western States (Includes Colorado, Montana, New Mexico, North Dakota, Utah and Wyoming) Source: BLM Oil & Gas Statistics (2010) and ICF International Rocky Mountain Forecasts (2011)
Figure 14: Relationship Between Permitting and Drilling Activity, 1985–2010*

25
January 2012
TABLE 5 – NET (Alternative Minus Baseline)Number of Wells Started (Spud) on Federal Lands
Increase in wells relative to amount associated with baseline number of leases and permits issued
Year
2011
2012
2013
2014
2015
Average
Colorado
70
120
140
120
120
114
Montana
20
20
40
30
20
26
New Mexico
150
220
280
280
250
236
North Dakota
30
30
40
50
40
38
Utah
100
130
160
160
130
136
Wyoming
240
360
480
430
380
378
Total
610
880
1,140
1,070
940
928
Source: Economics International Corp. calculations based on information from BLM Oil & Gas Statistics (2010) andICF International Rocky Mountain Forecasts (2011)
TABLE 6 – Average Actual Wells Started on Federal Lands 2000-2010
Colorado
282
Montana
103
New Mexico
841
North Dakota
66
Utah
330
Wyoming
1,640
Source: BLM Oil & Gas Statistics (2010)
*Western States (Includes Colorado, Montana, New Mexico, North Dakota, Utah and Wyoming)Source: Economics International Corp. calculations based on information from BLM Oil & Gas Statistics (2010) and
ICF International Rocky Mountain Forecasts (2011)
2010 well numbers and the Alternative and Base scenarios were adjusted using the latest 2010 estimate from the BLM. See page 44 for more detail.
Figure 15: Number of Wells Started During the Year on Federal Lands*

26
January 2012
The number of new wells is also an indicator of drilling activity, which in turn is a good indicator of increased employment in the industry, as shown in Figure 16.
5. IMPLAN is an economic impact assessment modeling system that allows the construction of economic models which estimate the impacts of changes in the economies of states, counties and communities.
6. ICF International. (2011) Rocky Mountain Forecasts. 7. Indirect employment includes the impact of local industries buying goods and services from other local industries.
Employment impacts were modeled using IMPLAN.5 Drilling and completion expenditures were from forecasts provided by ICF.6 Projections of the number of new wells drilled from the regression analysis (Table 5) were used in conjunction with drilling and completion expenditures to project total drilling and completion expenditures. The expenditures were mapped to IMPLAN sector 28 (drilling oil and gas wells) and sector 29 (support activities for oil and gas operations). The dollar value of production was mapped to IMPLAN sector 20 (oil and gas extraction). Dollar denominated results are not adjusted for inflation. For employment impacts, input expenditures were adjusted for inflation. Employment impacts are reported as the number of full- and part-time jobs. Impacts can be separated into: 1) direct impacts and 2) indirect and 3) induced impacts. Direct impacts are those immediately associated with a particular activity, such as employment directly associated with drilling and completion. Indirect employment includes the impact of local oil and gas companies buying goods and services from other local industries. Induced employment is created when spending increases due to additional household income from higher production in the direct and indirect industries.7
*Western States (Includes Colorado, Montana, New Mexico, North Dakota, Utah and Wyoming)Source: Economics International Corp. calculations based on information from BLM Oil & Gas Statistics (2010) and
ICF International Rocky Mountain Forecasts (2011)
Figure 16: Relationship Between Drilling Activity and Employment

27
January 2012
TABLE 7 – NET Employment – Direct Effect
Year
2011
2012
2013
2014
2015
Colorado
463
931
1,127
1,085
1,156
Montana
176
208
453
347
258
New Mexico
738
1,352
1,793
1,958
1,822
North Dakota
330
349
487
597
508
Utah
588
855
1,097
1,154
985
Wyoming
1,790
3,219
4,979
4,572
4,301
Total
4,085
6,914
9,937
9,713
9,032
TABLE 8 – NET Employment – Total Effect
Year
2011
2012
2013
2014
2015
Colorado
1,840
3,748
4,536
4,419
4,728
Montana
636
751
1,635
1,253
931
New Mexico
2,194
4,014
5,325
5,806
5,400
North Dakota
966
1,021
1,427
1,749
1,488
Utah
2,515
3,653
4,689
4,934
4,211
Wyoming
4,505
8,129
12,550
11,553
10,887
Total
12,656
21,315
30,163
29,715
27,642
Source: Economics International Corp. calculations based on information from BLM Oil & Gas Statistics (2010) andICF International Rocky Mountain Forecasts (2011)
Table 7 outlines the number of direct oil and gas industry related jobs the western states stand to gain by returning to the 2007/2008 level of permitting. Employment in this sector would be expected to be more than five percent higher with the additional leases and permits. As spending on drilling activity works its way through the economy, the employment impacts for the state/regional economies grow too.
28
January 2012
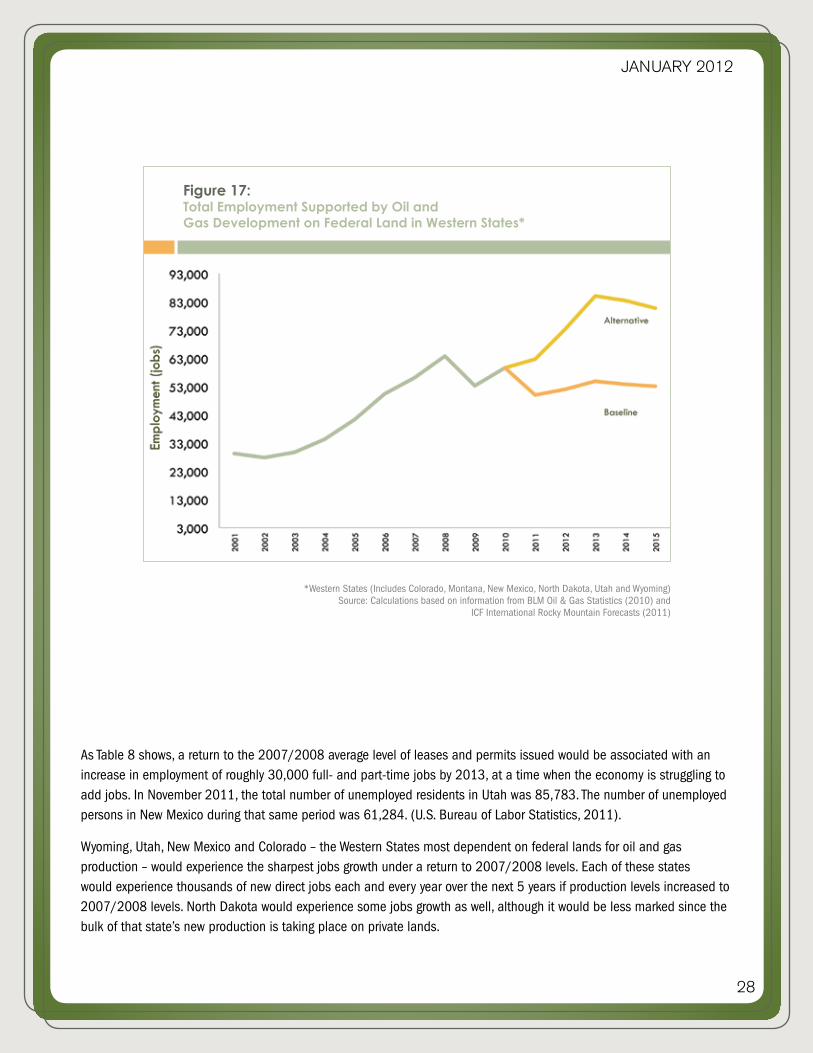
As Table 8 shows, a return to the 2007/2008 average level of leases and permits issued would be associated with an increase in employment of roughly 30,000 full- and part-time jobs by 2013, at a time when the economy is struggling to add jobs. In November 2011, the total number of unemployed residents in Utah was 85,783. The number of unemployed persons in New Mexico during that same period was 61,284. (U.S. Bureau of Labor Statistics, 2011).
Wyoming, Utah, New Mexico and Colorado – the Western States most dependent on federal lands for oil and gas production – would experience the sharpest jobs growth under a return to 2007/2008 levels. Each of these states would experience thousands of new direct jobs each and every year over the next 5 years if production levels increased to 2007/2008 levels. North Dakota would experience some jobs growth as well, although it would be less marked since the bulk of that state’s new production is taking place on private lands.
*Western States (Includes Colorado, Montana, New Mexico, North Dakota, Utah and Wyoming)Source: Calculations based on information from BLM Oil & Gas Statistics (2010) and
ICF International Rocky Mountain Forecasts (2011)
Figure 17: Total Employment Supported by Oil and Gas Development on Federal Land in Western States*

29
January 2012
Increased Production Would Lead to Increased Tax Revenues for Cash Strapped States3.4
Increased domestic energy production brings benefits in the form of increased tax revenues. Western Energy Alliance calculates, for example, that every dollar appropriated for BLM’s onshore oil and gas management program generates over $40 in royalty, rent, and bonus revenue for the federal government (Western Energy Alliance, 2010).8 State governments too depend on revenues collected through severance and ad valorem taxes, which is assessed based on the value of the oil or natural gas produced. Figure 18 shows the degree to which the western states depend on oil and gas tax revenues—totaling billions every year.
Source: ICF International Rocky Mountain Forecasts (2011)
Figure 18: Oil and Gas Severance Taxes by State
8. Western Energy Alliance’s estimate compares the $69.3 million FY2010 Onshore BLM budget request and the $2.78 billion reported Department of Interior, Office of Natural Resources Revenue, Total Federal Onshore Federal Royalties Revenue in order to calculate the impact per dollar spent.

30
January 2012
TABLE 9 – NET (Alternative Minus Baseline)Severance and Ad Valorem Taxes, $ millions
Increase in revenues relative to amount associated with baseline number of leases and permits issued
Year
2011
2012
2013
2014
2015
Total
Colorado
$ 2$ 8
$ 11$ 15$ 19
$ 54
Montana
$ 3$ 7$ 9
$ 11$ 11
$ 40
New Mexico
$ 26$ 78
$ 103$ 140$ 159
$ 506
North Dakota
$ 3$ 5$ 7$ 8$ 6
$ 29
Utah
$ 3$ 9
$ 12$ 15$ 17
$ 56
Wyoming
$ 22$ 75$ 95
$ 130$ 151
$ 473
Total
$ 59$ 183$ 236$ 319$ 362
$ 1,158
Source: Economics International Corp. calculations based on information from BLM Oil & Gas Statistics (2010) andICF International Rocky Mountain Forecasts (2011)
Table 9 shows what the western states stand to gain with increased leasing and permitting. An increase to the 2007/2008 average level of leases and permits issued would be associated with an average increase in severance and ad valorem taxes of $232 million per year for the time period 2011 to 2015. Importantly, this revenue boost to the western states would occur without the imposition of higher tax rates, and the negative implications associated with such a tax increase.
Here again, the big winners under a return to 2007/2008 levels are those states that rely most heavily on federal lands for oil and natural gas production. New Mexico would, on average, see more than a $100 million increase in severance tax revenue each year over the next 5 under a return to 2007/2008 levels. Meanwhile, Wyoming would see an average increase of severance tax equaling $95 million over the next 5 years.
*Western States (Includes Colorado, Montana, New Mexico, North Dakota, Utah and Wyoming) Source: Economics International Corp. calculations based on information from BLM Oil & Gas
Statistics (2010) and ICF International Rocky Mountain Forecasts (2011)
Figure 19: State Severance Tax and Ad Valorem Revenues*

31
January 2012
Source: Economics International Corp. calculations based on information from BLM Oil & Gas Statistics (2010) andICF International Rocky Mountain Forecasts (2011)
9. Under current federal law, just less than half of all federal mineral lease royalties are directed back to the states, which means the states themselves will experience significant revenue gain as result of increasing federal mineral lease dollars.
Oil and natural gas production on federal lands is taxed at the local and state level, and also by the federal government. These levies are known as Federal Mineral Lease payments and, upon receipt, they are divided between the federal government and the states from which the royalties are derived on a near 50/50 basis.
A return to 2007/2008 oil and natural gas leasing, permitting and drilling levels would result in more than $2.1 billion to the federal treasury over the next 5 years in the form of increased Federal Mineral Royalties.9 Wyoming would generate an additional $981 million dollars combined to the federal treasury over the next 5 years under a return to 2007/2008 levels.
*Western States (Includes Colorado, Montana, New Mexico, North Dakota, Utah and Wyoming) Source: Economics International Corp. calculations based on information from BLM Oil & Gas
Statistics (2010) and ICF International Rocky Mountain Forecasts (2011)
Figure 20: Federal Mineral Royalties in Western States*
Federal Royalties
TABLE 10 – NET (Alternative Minus Baseline)Federal Royalties Of Production Of Oil, Natural Gas And NGLs, $ million
Year
2011
2012
2013
2014
2015
Total
Colorado
7.3
27.9
36.4
51.0
63.4
186.1
Montana
3.2
7.6
9.9
11.9
12.3
45.0
New Mexico
31.9
97.9
127.9
175.3
198.6
631.7
North Dakota
4.6
7.2
9.6
10.7
7.7
39.9
Utah
12.8
40.2
51.4
67.6
74.5
246.5
Wyoming
45.6
156.3
197.4
268.6
313.0
980.9
Total
105.5
337.1
432.6
585.2
669.6
2,129.9
3.5

32
January 2012
CONCLUSION4The Western U.S. experienced a decline in oil and natural gas leasing, permitting, and new drilling on federal lands during 2009 and 2010 relative to previous years. Preliminary leasing data suggests that the downward trend has continued into 2011. This is expected to result in a reduction of domestically produced oil and natural gas, a loss of thousands of jobs in both energy and non-energy sectors of the economy, and the surrender of hundreds of millions of dollars in state and federal tax revenues, royalties, and lease payments to western states and the U.S. Treasury.
In sum, returning to permitting and leasing levels experienced in 2007 and 2008 would:
Increase Western U.S. natural gas production by an average of 516 billion cubic feet per year 2012 to 2015.
Increase Western U.S. oil production by an average of 9.9 million barrels per year 2012 to 2015.
Direct employment increases in the oil and gas industry in energy producing western states of 4,085 jobs in 2011, 6,914 jobs in 2012, 9,937 jobs in 2013, 9,713 in 2014, and 9,032 in 2015.
Increase total employment in energy producing western states over the next four years by an annual average increase of 24,298 total jobs.
Severance and ad valorem taxes would increase by over $1.2 billion from 2011 to 2015.
Federal royalty would increase ranging from $106 million to $670 million per year through 2015, totaling over $2.1 billion in five years.
For policymakers seeking to expand domestic energy production and stimulate economic growth, the public policy choice is clear. Federal lands energy policy needs to change in order to encourage development of oil and natural gas resources in a sensible, orderly and balanced way.

33
January 2012
Davidson, P. (2011, March 10). USA Today. Retrieved 2011, from What’s Libya’s impact on oil?: http://www.usatoday.com/money/industries/energy/2011-03-10-libyaoil10_ST_N.htm
Goode, D. (2011, March 11). Bill Clinton: Drilling delays ‘ridiculous’. Retrieved 2011, from Politico: http://www.politico.com/news/stories/0311/51150.html
Johnson, W. (2009, February 4). KSL Utah. BLM cancels 77 oil and gas leases in Utah. Retrieved 2011 from http://www.ksl.com/?nid=148&sid=5504421
Proctor, C. (2011, March 15). Denver Business Journal. Salazar: Feds to review oil-shale rules challenged by environmentalists. Retrieved 2011 from http://www.bizjournals.com/denver/news/2011/02/15/salazar-feds-to-review-oil-shale.html
Travers, A. (2011, June 29). Aspen Daily News. EPA chief promises action on air pollution from gas drilling. Retrieved 2011 from http://www.aspendailynews.com/section/home/147664
U.S. Bureau of Labor Statistics. (2011). Local Area Unemployment Statistics. Retrieved from http://www.bls.gov/lau/
U.S Department of the Interior. (2010). BLM Lifts Oil and Gas Lease Suspensions. Retrieved 2011 from http://www.blm.gov/mt/st/en/info/newsroom/2010/december/suspendedleases.html
U.S. Department of the Interior. (2010). Order No. 3310. Subject: Protecting Wilderness
Characteristics on Lands Managed by the Bureau of Land Management. Retrieved 2011 from U.S. Bureau of Land Management http://www.blm.gov/pgdata/etc/medialib/blm/wo/Communications_Directorate/public_affairs/news_release_attachments.Par.26564.File.dat/sec_order_3310.pdf
U.S Government Accountability Office. (2010, July 30). Report: Onshore Oil and Gas: BLM’s Management of Public Protests to Its Lease Sales Needs Improvement. Retrieved 2011, from http://www.gao.gov/products/GAO-10-670
Western Energy Alliance. (2010, December 9). Western Energy Alliance Releases “Dashboard” Showing Trends in Western Oil and Natural Gas Development. Retrieved 2011, from Western Energy Alliance: http://westernenergyalliance.org/wp-content/uploads/2009/05/News-Release-%E2%80%9CDashboard%E2%80%9D-Showing-Trends-in-Western-Oil-and-Natural-Gas-Development.pdf
Western Energy Alliance. (2011, March 15). Western Energy Alliance: Non-producing Leases the Result of Bureaucratic Red Tape. Retrieved 2011, from Western Energy Alliance: http://westernenergyalliance.org/wp-content/uploads/2009/05/News-Release-Non-producing-Leases-the-Result-of-Bureaucratic-Red-Tape1.pdf
Western Energy Alliance vs. Ken Salazar, Secretary of the Interior, United States Bureau of Land Management, Roberts V. Abbey, Director of the Bureau of Land Management, United States Forest Service and Thomas Tidwell, Chief of the United States Forest Service, 2011 U.S. District Court for the District of Wyoming, (August 12, 2011)
Sources4.1

34
January 2012
10. Throughout this appendix, current dollars refers to dollar amounts that have not be adjusted for inflation.
This study quantifies the relationship between the number of energy leases and drilling permits issued in a given year and the subsequent production of oil and natural gas from the leases on federal land in several western states. Projections of the impacts on production are used to forecast impacts on employment and severance and ad valorem taxes. Results from the econometric analysis were used to forecast future energy production under several scenarios.
This appendix describes the data and methodology employed in the empirical analysis. The analysis is focused on the states of Colorado, Montana, New Mexico, North Dakota, Utah, and Wyoming, which for convenience will be referred to as the “Western States.” Unless stated otherwise, the analysis and findings pertain only to these Western States. The analysis is based on the information available at the time the analysis is conducted. As such, the approach and conclusions may change in future studies as new or additional information is obtained.
This empirical analysis used the following data. BLM data used is from the FY2010 Oil and Gas Statistics.
Number of new leases issued during the year, by state (BLM);
Applications for Permit to Drill (APDs) on federal lands (BLM);
Oil production on federal lands, barrels (BLM);
Gas production on federal lands, mcf (BLM);
NGL production associated with federal lands, gallons converted to barrels in this Report (BLM);
Number of wells started (spud) during the year on federal lands (BLM);
Well drilling and completion costs, current dollars (ICF);10
Employment and output multipliers (IMPLAN);
Oil price forecasts, current dollars per barrel, WTI (Economist Intelligence Unit);
Natural gas price forecasts, current dollars per mcf (Economist Intelligence Unit);
Severance and ad valorem taxes, current dollars (ICF);
Royalties collected, current dollars (BLM).
Data5.1
APPENDIX: Data and Methodology5

35
January 2012
Estimates of the impacts of leasing and permitting on oil, gas, and NGL production were produced using a log-log panel regression for oil and gas producing states over the period 1985 through 2010. Independent variables included a constant; cross-sectional fixed effects; a trend; dummy variables for regulatory changes (where appropriate) in 1997, 1992, 2000, and 2005; the number of new leases issued each year (including lags); and the number of permits issued each year (including lags). The analysis employs a lag structure of five lags to quantify the effects over time. Regressions were performed using the EViews econometric package for each of the following dependent variables:
Oil production on BLM lands (14 states, 1985-2010, 149 observations),
Gas production on BLM lands (14 states, 1985-2009, 137 observations),
NGL production associated with BLM lands (12 states, 2000-2010, 76 observations), and
Number of new wells begun (spud) on BLM lands (14 states, 1985-2010, 145 observations),
Dummy variables for regulatory changes include the following:
992: Energy Policy Act, competitive and noncompetitive leases are valid for a minimum of 10 years, and remain valid as long the lease is producing. Prior to the 1992 Act, competitive leases were valid for only five years if not producing.
2000: Prior to the year 2000, excess capacity meant that natural gas well production swung as wells were shut on and off to meet market conditions. Much of the excess capacity eroded by 2000 and well production did not swing with price.
2005: Energy Policy Act, Maguire (2010) indicates the Act has a small impact on leasing.
Forecasts of production were produced under a “Baseline” and an “Alternative” Case in EViews under the following assumptions. The Baseline represents the average annual number of leases and permits issued in 2009 and 2010 (1,060 leases a year and 3,970 permits a year). The Alternative represents the average annual total number of leases and permits issued in 2007 and 2008 (1,880 leases a year and 6,450 permits a year). The following table provides the assumed number of leases and permits issued under the Baseline and Alternative Case.
Production and Drilling5.2

36
January 2012
Under the assumption of ceteris paribus, all the other independent variables are assumed to remained fixed over the forecast period. Thus, the Baseline and Alternative projections should not be viewed as predictions of future production. Instead, this approach measures the difference between policy cases to evaluate the impact of policy differences.
VARIABLES USED:OILPROD: total oil production (bbl)GASPROD: total natural gas production (mcf)NGLPROD: total natural gas liquids production (gallons)LISSUED: number of new leases issued during the yearAPD: number of APDs permitted during the year federal landsSPUD: number of wells started (spud) during the year on federal lands
In the regression equations, the natural logarithms of the above variables are used.1992: Dummy variable equal to 1 if year is 1992 or later and equal to 0 otherwise2000: Dummy variable equal to 1 if year is 2000 or later and equal to 0 otherwise2005: Dummy variable equal to 1 if year is 2005 or later and equal to 0 otherwise
REGRESSION EQUATIONS:Oil production equation:
OILPROD = b0 C + b1 TREND + b2 LISSUED + b3 LISSUED(-1) + b4 LISSUED(-2) + b5 LISSUED(-3) + b6 LISSUED(-4) + b7 LISSUED(-5) + b8 APD + b9 APD(-1) + b10 APD(-2) + b11 APD(-3) + b12 APD(-4) + b13 APD(-5)
Gas production equation:GASPROD = b0 C + b1 TREND + b2 1992 + b3 2000 + b4 2005 + b5 LISSUED + b6 LISSUED(-1)
+ b7 LISSUED(-2) + b8 LISSUED(-3) + b9 LISSUED(-4) + b10 LISSUED(-5) + b11 APD + b12 APD(-1) + b13 APD(-2) + b14 APD(-3) + b15 APD(-4) + b16 APD(-5)
NGL production equation:NGLPROD = b0 C + b1 GASPROD
New wells spud equation:SPUD = b0 C + b1 TREND + b2 LISSUED + b3 LISSUED(-1) + b4 LISSUED(-2) + b5 LISSUED(-3) + b6 LISSUED(-4)
+ b7 LISSUED(-5) + b8 APD + b9 APD(-1) + b10 APD(-2) + b11 APD(-3) + b12 APD(-4) + b13 APD(-5) + b10 APD(-2) + b11 APD(-3) + b12 APD(-4) + b13 APD(-5)
TABLE 11 – Baseline and Alternative Leasing and Permitting Scenarios
Leases Issued
Baseline
Alternatives
Permits Issued
Baseline
Alternatives
Colorado
120
210
530
870
Montana
130
230
60
100
New Mexico
200
360
1,030
1,670
North Dakota
140
250
110
170
Utah
120
210
480
780
Wyoming
350
620
1,760
2,860

37
January 2012
As a log-log model, estimated coefficient results are interpreted as elasticities, or percent changes. For example, in the oil production coefficient, the coefficient on one-year lagged number of permits issued is 0.20. In other words, all other things held constant, a 10 percent increase in the number permits issued the year-before-last would be associated with a two percent increase in oil production this year.11
Projections of future projection were pivoted off of 2010 actual production. That is, actual values for dependent variables for 2010 were used as the basis on which the projected percent changes were applied. This provided a Baseline and an Alternative estimate of production and drilling for each of the years 2011 through 2015. The Baseline value was subtracted from the Alternative value to provide the estimated impact, or delta, associated with increased leasing and permitting activity. The analysis evaluates the differences between a “Baseline” level of permits and leases, and an “Alternative” level of permits and leases. The regression uses a panel data set and measures cross-sectional fixed effects.
The results are presented in Table 2, 3, 4 and 5 for gas production, NGL production, oil production and new wells respectively.
TABLE 12 – Regression Results
NDL Production
0.97
14.4
1.14
Wells Spud
0.95
-1.90
.87
Gas Production
0.99
14.38
0.69
Oil Production
0.99
14.36
0.063
R-Squared
Coefficient
Std. Error
11. Natural gas liquids production is modeled as a function of natural gas production; regression results indicate an elasticity of 0.5.

38
January 2012
Employment impacts were modeled using IMPLAN. Drilling and completion expenditures were projected from forecasts provided by ICF, and presented in the following table. Total projected drilling and completion expenditures are provided in the following table were mapped to IMPLAN sector 28 (drilling oil and gas wells) and sector 29 (support activities for oil and gas operations). The dollar value of production was mapped to IMPLAN sector 20 (oil and gas extraction). Dollar denominated results are not adjusted for inflation. For employment impacts, input expenditures were adjusted for inflation. Employment impacts are reported as the number of full- and part-time jobs.
The costs per well were applied to projections of the number of new wells drilled provided by the regression analysis (Table 5). Total projected drilling and completion expenditures are provided in the following table.
Employment5.3
The costs per well were applied to projections of the number of new wells drilled provided by the regression analysis (Table 5). Total projected drilling and completion expenditures are provided in the following table.
TABLE 13 – Projected Drilling and Completion CostPer well, current dollars (not adjusted for inflation)
Year
2011
2012
2013
2014
2015
Colorado
3,319,000
3,603,000
3,727,000
3,860,000
4,017,000
Montana
4,226,000
4,815,000
5,445,000
5,408,000
5,881,000
New Mexico
1,832,000
2,099,000
2,230,000
2,295,000
2,285,000
North Dakota
5,515,000
5,816,000
6,101,000
5,986,000
6,379,000
Utah
2,669,000
2,803,000
2,944,000
3,017,000
3,071,000
Wyoming
3,574,000
4,125,000
4,900,000
4,866,000
5,099,000
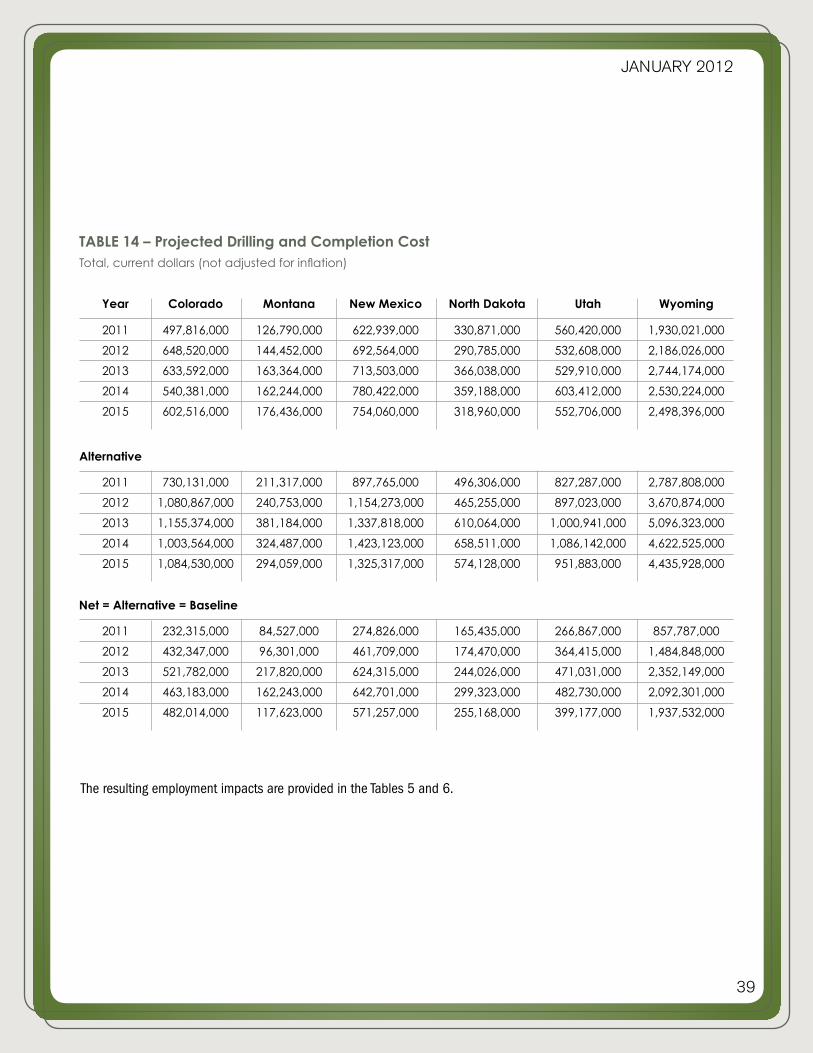
39
January 2012
TABLE 14 – Projected Drilling and Completion CostTotal, current dollars (not adjusted for inflation)
Year
2011
2012
2013
2014
2015
Colorado
497,816,000
648,520,000
633,592,000
540,381,000
602,516,000
Montana
126,790,000
144,452,000
163,364,000
162,244,000
176,436,000
New Mexico
622,939,000
692,564,000
713,503,000
780,422,000
754,060,000
North Dakota
330,871,000
290,785,000
366,038,000
359,188,000
318,960,000
Utah
560,420,000
532,608,000
529,910,000
603,412,000
552,706,000
Wyoming
1,930,021,000
2,186,026,000
2,744,174,000
2,530,224,000
2,498,396,000
2011
2012
2013
2014
2015
Alternative
730,131,000
1,080,867,000
1,155,374,000
1,003,564,000
1,084,530,000
211,317,000
240,753,000
381,184,000
324,487,000
294,059,000
897,765,000
1,154,273,000
1,337,818,000
1,423,123,000
1,325,317,000
496,306,000
465,255,000
610,064,000
658,511,000
574,128,000
827,287,000
897,023,000
1,000,941,000
1,086,142,000
951,883,000
2,787,808,000
3,670,874,000
5,096,323,000
4,622,525,000
4,435,928,000
Net = Alternative = Baseline
232,315,000
432,347,000
521,782,000
463,183,000
482,014,000
2011
2012
2013
2014
2015
84,527,000
96,301,000
217,820,000
162,243,000
117,623,000
274,826,000
461,709,000
624,315,000
642,701,000
571,257,000
165,435,000
174,470,000
244,026,000
299,323,000
255,168,000
266,867,000
364,415,000
471,031,000
482,730,000
399,177,000
857,787,000
1,484,848,000
2,352,149,000
2,092,301,000
1,937,532,000
The resulting employment impacts are provided in the Tables 5 and 6.

40
January 2012
Oil and gas production values were calculated by applying price projections provided by the Economist Intelligence Unit to the production forecasts in Tables 1, 2, and 3.
NGL price projections use 2010 propane prices as a baseline and are assumed to change from year to year at the same rate as natural gas prices.
Severance and ad valorem taxes are calculated by applying these values to the severance and ad valorem tax rates reported by ICF and shown below.
The results are presented in Table 9.
Severance and Ad Valorem Rate (IFC)
Colorado
2.85 %
Montana
8.61 %
New Mexico
7.89 %
North Dakota
7.07 %
Utah
2.20 %
Wyoming
4.70 %
Severance and Ad Valorem Rate (IFC)
Oil(US $ / bbl)
Natural Gas(US $ / mcf)
2011
98.70
4.54
2012
95.40
5.26
2013
90.90
5.70
2014
85.90
6.18
2015
83.80
6.69
State Severance and Ad Valorem Taxes5.4
Federal Royalties5.5
Oil and gas production values were calculated in the same way as for state severance and ad valorem taxes. The following royalty rates were applied, based on the 2008/2009 royalty rate calculated from information provided by the Bureau of Land Management.
Oil
11.7 %
Gas
12.4 %
NGLs
9.7 %

41
January 2012
Supplemental Tables5.6
Net (Alternative Minus Baseline)Increase in production relative to amount associated with baseline number of leases and permits issued
Year
2011
2012
2013
2014
2015
Average
Colorado Montana New Mexico North Dakota Utah Wyoming Total
0.271 0.307 2.377 0.592 0.979 2.586 7.112
0.341 0.358 2.810 0.687 1.251 3.022 8.469
0.508 0.522 3.912 0.949 1.723 4.417 12.031
0.524 0.561 4.321 1.073 1.922 4.802 13.203
0.374 0.383 2.908 0.714 1.268 3.219 8.866
0.404 0.426 3.266 0.803 1.429 3.609 9.936
AlternativeProduction associated with same total number new leases and permits – Average 2007/2008
Year
2011
2012
2013
2014
2015
Average
Colorado Montana New Mexico North Dakota Utah Wyoming Total
3.749 4.142 33.132 8.894 13.757 36.170 99.844
3.836 3.920 32.169 8.615 14.333 34.555 97.428
4.092 4.085 31.954 8.456 14.106 36.059 98.752
3.765 3.924 31.564 8.567 14.051 35.033 96.904
3.593 3.565 28.795 7.887 12.429 31.629 87.898
3.807 3.927 31.523 8.484 13.735 34.689 96.165
BaselineProduction associated with same total number new leases and permits – Average 2009/2010
Year
2011
2012
2013
2014
2015
Average
Colorado Montana New Mexico North Dakota Utah Wyoming Total
3.478 3.835 30.755 8.302 12.778 33.584 92.732
3.495 3.562 29.359 7.928 13.082 31.533 88.959
3.584 3.563 28.042 7.507 12.383 31.642 86.721
3.241 3.363 27.243 7.494 12.129 30.231 83.701
3.219 3.182 25.887 7.173 11.161 28.410 79.032
3.403 3.501 28.257 7.681 12.307 31.080 86.229
Oil Production, million barrels

42
January 2012
BaselineProduction associated with same total number new leases and permits – Average 2009/2010
AlternativeProduction associated with same total number new leases and permits – Average 2007/2008
Net (Alternative Minus Baseline)Increase in production relative to amount associated with baseline number of leases and permits issued
Year
2011
2012
2013
2014
2015
Average
Colorado Montana New Mexico North Dakota Utah Wyoming Total
11 2 24 0 11 54 103
45 8 110 1 50 232 447
53 9 132 1 58 263 517
72 12 183 2 76 351 696
87 14 215 2 89 410 818
54 9 133 1 57 262 516
Year
2011
2012
2013
2014
2015
Average
Colorado Montana New Mexico North Dakota Utah Wyoming Total
313 53 743 8 312 1,616 3,046
331 58 836 9 375 1,747 3,356
340 56 863 10 375 1,712 3,356
356 56 920 10 383 1,760 3,485
380 60 960 12 396 1,825 3,632
344 57 864 10 368 1,732 3,375
Year
2011
2012
2013
2014
2015
Average
Colorado Montana New Mexico North Dakota Utah Wyoming Total
302 51 718 8 301 1,562 2,943
286 50 725 8 325 1,515 2,909
286 47 731 8 317 1,448 2,839
283 44 737 8 306 1,409 2,789
293 46 745 9 307 1,414 2,814
290 48 731 8 312 1,470 2,859
Natural Gas Production, billion cubic feet
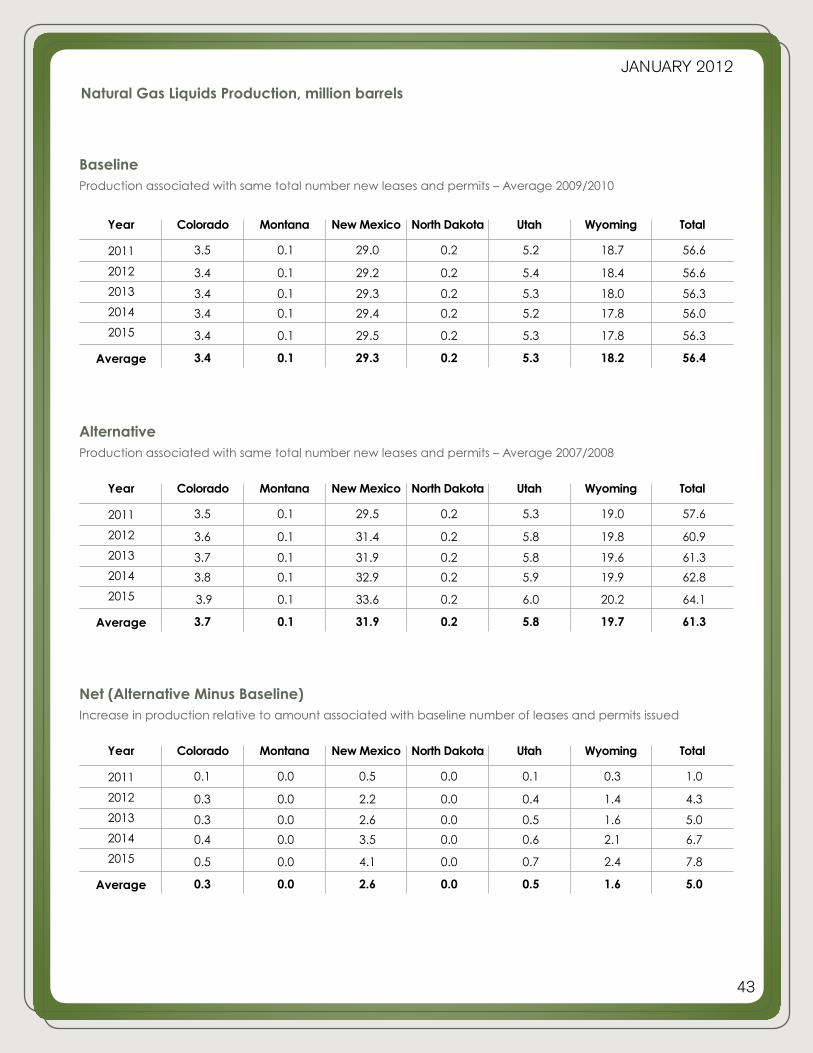
43
January 2012
BaselineProduction associated with same total number new leases and permits – Average 2009/2010
AlternativeProduction associated with same total number new leases and permits – Average 2007/2008
Net (Alternative Minus Baseline)Increase in production relative to amount associated with baseline number of leases and permits issued
Year
2011
2012
2013
2014
2015
Average
Colorado Montana New Mexico North Dakota Utah Wyoming Total
0.1 0.0 0.5 0.0 0.1 0.3 1.0
0.3 0.0 2.2 0.0 0.4 1.4 4.3
0.3 0.0 2.6 0.0 0.5 1.6 5.0
0.4 0.0 3.5 0.0 0.6 2.1 6.7
0.5 0.0 4.1 0.0 0.7 2.4 7.8
0.3 0.0 2.6 0.0 0.5 1.6 5.0
Year
2011
2012
2013
2014
2015
Average
Colorado Montana New Mexico North Dakota Utah Wyoming Total
3.5 0.1 29.5 0.2 5.3 19.0 57.6
3.6 0.1 31.4 0.2 5.8 19.8 60.9
3.7 0.1 31.9 0.2 5.8 19.6 61.3
3.8 0.1 32.9 0.2 5.9 19.9 62.8
3.9 0.1 33.6 0.2 6.0 20.2 64.1
3.7 0.1 31.9 0.2 5.8 19.7 61.3
Year
2011
2012
2013
2014
2015
Average
Colorado Montana New Mexico North Dakota Utah Wyoming Total
3.5 0.1 29.0 0.2 5.2 18.7 56.6
3.4 0.1 29.2 0.2 5.4 18.4 56.6
3.4 0.1 29.3 0.2 5.3 18.0 56.3
3.4 0.1 29.4 0.2 5.2 17.8 56.0
3.4 0.1 29.5 0.2 5.3 17.8 56.3
3.4 0.1 29.3 0.2 5.3 18.2 56.4
Natural Gas Liquids Production, million barrels

44
January 2012
Alternative*Production associated with same total number new leases and permits – Average 2007/2008
Net (Alternative Minus Baseline)Increase in wells relative to amount associated with baseline number of leases and permits issued
Year
2011
2012
2013
2014
2015
Average
Colorado Montana New Mexico North Dakota Utah Wyoming Total
70 20 150 30 100 240 610
120 20 220 30 130 360 880
140 40 280 40 160 480 1,140
120 30 280 50 160 430 1,070
120 20 250 40 130 380 940
114 26 236 38 136 378 928
Year
2011
2012
2013
2014
2015
Average
Colorado Montana New Mexico North Dakota Utah Wyoming Total
340 66 698 106 382 1,148 2,740
420 66 758 96 392 1,258 2,190
430 86 808 116 412 1,408 2,460
380 76 828 126 432 1,318 2,360
390 66 788 106 382 1,238 2,170
392 72 776 110 400 1,274 3,024
Baseline*Production associated with same total number new leases and permits – Average 2009/2010
Year
2011
2012
2013
2014
2015
Average
Colorado Montana New Mexico North Dakota Utah Wyoming Total
270 46 548 76 282 908 2,130
300 46 538 66 262 898 2,110
290 46 528 76 252 928 2,120
260 46 548 76 272 888 2,090
270 46 538 66 252 858 2,030
278 46 540 72 264 896 2,096
Number of Wells Started (Spud) on Federal Lands
*The BLM reissued the estimated number of wells started in 2010 after the completion of this analysis. The new estimate was used to adjust the 2010 number of wells as well as the Baseline and Alternative forecasts.
In both scenarios, the Net (Alternative minus Baseline) remained the same.
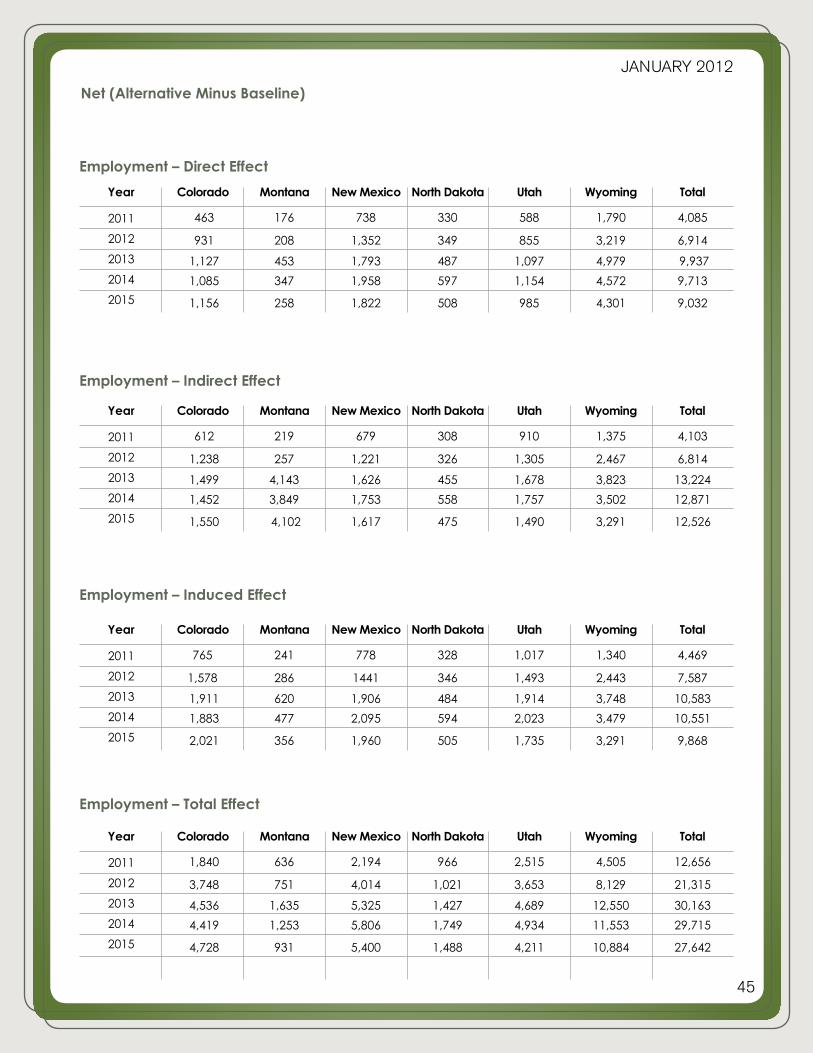
45
January 2012
Employment – Direct Effect
Year
2011
2012
2013
2014
2015
Colorado Montana New Mexico North Dakota Utah Wyoming Total
463 176 738 330 588 1,790 4,085
931 208 1,352 349 855 3,219 6,914
1,127 453 1,793 487 1,097 4,979 9,937
1,085 347 1,958 597 1,154 4,572 9,713
1,156 258 1,822 508 985 4,301 9,032
Employment – Indirect Effect
Year
2011
2012
2013
2014
2015
Colorado Montana New Mexico North Dakota Utah Wyoming Total
612 219 679 308 910 1,375 4,103
1,238 257 1,221 326 1,305 2,467 6,814
1,499 4,143 1,626 455 1,678 3,823 13,224
1,452 3,849 1,753 558 1,757 3,502 12,871
1,550 4,102 1,617 475 1,490 3,291 12,526
Employment – Induced Effect
Year
2011
2012
2013
2014
2015
Colorado Montana New Mexico North Dakota Utah Wyoming Total
765 241 778 328 1,017 1,340 4,469
1,578 286 1441 346 1,493 2,443 7,587
1,911 620 1,906 484 1,914 3,748 10,583
1,883 477 2,095 594 2,023 3,479 10,551
2,021 356 1,960 505 1,735 3,291 9,868
Employment – Total Effect
Year
2011
2012
2013
2014
2015
Colorado Montana New Mexico North Dakota Utah Wyoming Total
1,840 636 2,194 966 2,515 4,505 12,656
3,748 751 4,014 1,021 3,653 8,129 21,315
4,536 1,635 5,325 1,427 4,689 12,550 30,163
4,419 1,253 5,806 1,749 4,934 11,553 29,715
4,728 931 5,400 1,488 4,211 10,884 27,642
Net (Alternative Minus Baseline)

46
January 2012
Labor Income $ millions – Direct Effect
Year
2011
2012
2013
2014
2015
Colorado Montana New Mexico North Dakota Utah Wyoming Total
52.6 16.2 62.6 29.8 51.6 165.5 378.3
118.4 19.9 127.6 31.6 81.2 315.1 693.8
146.8 42.4 170.3 44.1 104.7 480.6 988.9
157.4 33.3 197.5 54.0 114.3 462.0 1,018.5
178.7 25.5 197.1 45.9 103.3 451.6 1,002.1
Labor Income $ millions – Indirect Effect
Year
2011
2012
2013
2014
2015
Colorado Montana New Mexico North Dakota Utah Wyoming Total
49.6 11.6 38.0 18.0 52.9 80.5 250.6
103.2 13.7 70.6 19.1 77.0 147.2 430.8
126.7 30.1 94.8 26.7 99.4 228.1 605.8
126.9 23.0 104.3 32.7 105.0 212.3 604.2
140.1 17.2 99.3 27.8 90.7 203.1 578.2
Labor Income $ millions – Induced Effect
Year
2011
2012
2013
2014
2015
Colorado Montana New Mexico North Dakota Utah Wyoming Total
36.9 8.9 29.0 12.3 39.6 50.6 177.3
78.7 10.7 56.3 13.1 59.3 93.9 312.0
96.9 23.2 75.4 18.3 76.5 144.6 434.9
175.9 32.4 154.9 38.7 143.6 270.1 815.6
110.3 13.6 82.9 19.0 72.1 131.5 429.4
Labor Income $ millions – Total Effect
Year
2011
2012
2013
2014
2015
Colorado Montana New Mexico North Dakota Utah Wyoming Total
139.1 36.7 129.6 60.1 144.1 296.6 806.2
300.3 44.3 254.5 63.8 217.5 556.2 1,436.6
370.4 95.7 340.5 89.1 280.6 853.3 2,029.6
383.4 74.3 386.9 109.1 301.2 810.6 2,065.5
429.1 56.3 379.3 92.7 266.1 786.2 2,009.7
Net (Alternative Minus Baseline)

47
January 2012
Value Added $ millions – Direct Effect
Year
2011
2012
2013
2014
2015
Colorado Montana New Mexico North Dakota Utah Wyoming Total
153.8 47.6 185.9 87.4 153.5 491.1 1,119.3
344.4 58.3 376.3 92.7 240.1 931.9 2,043.7
426.8 124.2 502.4 129.5 309.5 1,423.2 2,915.6
455.2 97.3 580.3 158.6 337.2 1,364.4 2,993.0
515.9 74.4 577.3 134.9 303.6 1,331.4 2,937.5
Value Added $ millions – Indirect Effect
Year
2011
2012
2013
2014
2015
Colorado Montana New Mexico North Dakota Utah Wyoming Total
75.5 18.2 56.4 28.2 79.4 129.2 386.9
160.7 21.8 105.2 29.9 116.4 236.5 670.5
197.9 47.4 141.2 41.8 150.2 366.4 944.9
202.3 36.5 155.7 51.2 159.2 341.3 946.2
225.3 27.4 148.4 43.5 138.1 326.7 909.4
Value Added $ millions – Induced
Year
2011
2012
2013
2014
2015
Colorado Montana New Mexico North Dakota Utah Wyoming Total
65.1 16.1 52.5 21.4 69.1 99.9 324.1
139.1 19.4 102.3 22.6 103.9 185.9 573.2
171.4 41.8 136.9 31.6 134.0 286.0 801.7
175.9 32.4 154.9 38.7 143.6 270.1 815.6
196.1 24.5 151.2 33.0 126.5 261.0 792.3
Value Added $ millions – Total Effect
Year
2011
2012
2013
2014
2015
Colorado Montana New Mexico North Dakota Utah Wyoming Total
294.4 81.9 294.8 137.0 302.0 720.2 1,830.3
644.2 99.5 583.8 145.2 460.4 1,354.3 3,287.4
796.1 213.4 780.5 202.9 593.7 2,075.6 4,662.2
833.4 166.2 890.9 248.5 640.0 1,975.8 4,754.8
937.3 126.3 876.9 211.4 568.2 1,919.1 4,639.2
Net (Alternative Minus Baseline)

48
January 2012
Output – Direct Effect
Year
2011
2012
2013
2014
2015
Colorado Montana New Mexico North Dakota Utah Wyoming Total
307.7 117.9 601.0 213.6 398.2 1,327.2 2,965.6
718.7 174.6 1,456.5 248.7 777.2 3,089.6 6,465.3
895.4 320.0 1,924.4 343.1 997.8 4,380.0 8,860.7
986.8 285.6 2,421.9 409.9 1,175.9 4,850.3 10,130.4
1,133.0 245.2 2,582.1 334.7 1,162.1 5,149.3 10,606.4
Output – Indirect Effect
Year
2011
2012
2013
2014
2015
Colorado Montana New Mexico North Dakota Utah Wyoming Total
132.7 36.1 99.8 57.0 159.9 243.0 728.5
247.0 41.1 167.7 60.1 218.3 420.7 1,154.9
298.1 93.1 226.8 84.1 282.2 666.4 1,650.7
264.7 69.3 233.5 103.1 289.2 592.7 1,552.5
275.4 50.3 207.5 87.9 239.2 548.9 1,409.2
Output – Induced Effect
Year
2011
2012
2013
2014
2015
Colorado Montana New Mexico North Dakota Utah Wyoming Total
100.9 27.4 76.0 39.0 118.9 160.0 522.2
187.8 31.2 127.6 41.1 162.4 276.9 827.0
226.7 70.6 172.6 57.5 209.9 438.7 1,176.0
201.2 52.6 177.7 70.6 215.1 390.2 1,107.4
209.4 38.1 157.9 60.1 177.9 361.3 1,004.7
Output – Total Effect
Year
2011
2012
2013
2014
2015
Colorado Montana New Mexico North Dakota Utah Wyoming Total
541.3 181.4 776.8 309.6 677.0 1,730.2 4,216.3
1,153.5 246.9 1,751.8 349.9 1,157.9 3,787.2 8,447.2
1,420.2 483.7 2,323.8 484.7 1,489.9 5,485.1 11,687.4
1,452.7 407.5 2,833.1 583.6 1,680.2 5,833.2 12,790.3
1,617.8 333.6 2,947.5 482.7 1,579.2 6,059.5 13,020.3
Net (Alternative Minus Baseline)

49
January 2012
Net (Alternative Minus Baseline)Increase in production relative to amount associated with baseline number of leases and permits issued
Year
2011
2012
2013
2014
2015
Average
Colorado Montana New Mexico North Dakota Utah Wyoming Total
$ 2 $ 3 $ 26 $ 3 $ 3 $ 22 $ 59
$ 8 $ 7 $ 78 $ 5 $ 9 $ 75 $ 183
$ 11 $ 9 $ 103 $ 7 $ 12 $ 95 $ 236
$ 15 $ 11 $ 140 $ 8 $ 15 $ 130 $ 319
$ 19 $ 11 $ 159 $ 6 $ 17 $ 151 $ 362
$ 11 $ 8 $ 101 $ 6 $ 11 $ 95 $ 232
AlternativeProduction associated with same total number new leases and permits – Average 2007/2008
Year
2011
2012
2013
2014
2015
Average
Colorado Montana New Mexico North Dakota Utah Wyoming Total
$54 $49 $598 $53 $61 $527 $1,344
67 60 750 64 82 650 1,673
73 62 797 62 85 682 1,761
80 61 863 61 90 729 1,883
90 61 910 55 92 776 1,984
$73 $59 $784 $59 $82 $673 $1,729
BaselineProduction associated with same total number new leases and permits – Average 2009/2010
Year
2011
2012
2013
2014
2015
Average
Colorado Montana New Mexico North Dakota Utah Wyoming Total
$52 $47 $572 $50 $59 $505 $1,284
59 53 672 59 73 574 1,490
63 53 694 55 74 586 1,525
65 50 723 53 74 599 1,565
71 50 751 49 75 625 1,623
$62 $51 $682 $53 $71 $578 $1,497
Severance and Ad Valorem Taxes, $ millions
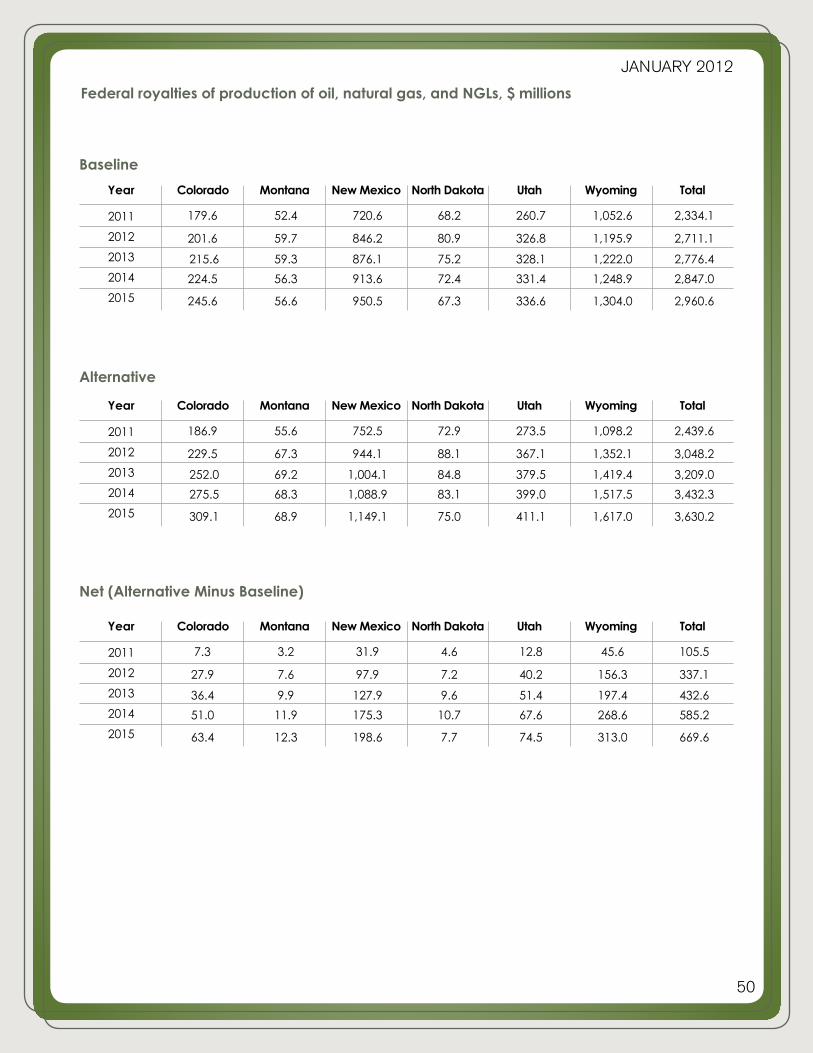
50
January 2012
Baseline
Year
2011
2012
2013
2014
2015
Colorado Montana New Mexico North Dakota Utah Wyoming Total
179.6 52.4 720.6 68.2 260.7 1,052.6 2,334.1
201.6 59.7 846.2 80.9 326.8 1,195.9 2,711.1
215.6 59.3 876.1 75.2 328.1 1,222.0 2,776.4
224.5 56.3 913.6 72.4 331.4 1,248.9 2,847.0
245.6 56.6 950.5 67.3 336.6 1,304.0 2,960.6
Alternative
Year
2011
2012
2013
2014
2015
Colorado Montana New Mexico North Dakota Utah Wyoming Total
186.9 55.6 752.5 72.9 273.5 1,098.2 2,439.6
229.5 67.3 944.1 88.1 367.1 1,352.1 3,048.2
252.0 69.2 1,004.1 84.8 379.5 1,419.4 3,209.0
275.5 68.3 1,088.9 83.1 399.0 1,517.5 3,432.3
309.1 68.9 1,149.1 75.0 411.1 1,617.0 3,630.2
Net (Alternative Minus Baseline)
Year
2011
2012
2013
2014
2015
Colorado Montana New Mexico North Dakota Utah Wyoming Total
7.3 3.2 31.9 4.6 12.8 45.6 105.5
27.9 7.6 97.9 7.2 40.2 156.3 337.1
36.4 9.9 127.9 9.6 51.4 197.4 432.6
51.0 11.9 175.3 10.7 67.6 268.6 585.2
63.4 12.3 198.6 7.7 74.5 313.0 669.6
Federal royalties of production of oil, natural gas, and NGLs, $ millions

51
January 2012
Prepared for American Petroleum Institute by
1055 Main Street | Grand Junction, CO 81501 | (970) 241-3008
January 2012