employment - files.eric.ed.gov · pdf fileia research report. ... an analysis, of...
TRANSCRIPT
ED 109 414
'''AUTHORTITLE
PUB DATE'NOTE
EDRS PRICEDESCURTORS
-IDENTIFIERS
ABSTRACT
DWUMENT RESUME ; aP
Harris, Robert C.; Hodgson, Carol A.aAssessment of Cooperative Education by FormerStudents and Participating Employers.,[Indiana]74-15p.; Presented at the American Vocational
ociation Convention (New Orleans, Lohisiana,I
Cooperative Education; *Cooperative Programs; ? iEducational Programs; *Employer Attitudes; Empl ymentExperience; Employment Patterns; Employment Tr4 ds;High School Graduates; Instructor Coordinators;
,*Participant Satisfaction; Personnel Evaluation*Program Evaluation; School Industry Relationship;Secondary Edudation;State Shrveys; ,Wages; WorkExperience ProgramsICE; Indiana; Interdiscipainary Cybperative'Education
4)
MF-$0.76 HC-$1.58.PLUS POSTAGE
The 'study evaluates theginterdisciplinar CooperatOe . -\
Education.(ICE) Approach to cooperative education in .54 chools in'Indiana. Data for, the study were obtained by, means of o mailedr" 1
instruments: one administered to 1,1532 cooperative progrKm graduates,in May 1974, and the,other to 677 employers in June 10473. Therespective returns were 59.1% and 75.9%. Graduate information-wascalculated andtaiated with respect to employment staius;.mobilityand migration; employment profile, wages,_'preparation for employment,:most beneficial contribution of the program, teahef-Coordinator,characteristics, and recommendability of the prdvgiam to others forthe program areas of agribhsiness, office, distribution, health, homeeconomics, trade.andInAustry, and interdiscipiAnary. Employerinformation was likewise calculated and tabulated With respect to'employment setting:, assessment of student trainee, preparedness of '
student trainee, cooperative education process4'4.6mployer'svie*s of-O coordinatorls expertise, and employer's assessid,of programs. The
data emphasize the important. role of the coorcli4ator in the ,
cooperative prograd and the exceptionally high 1.evel of acCeptan'cethe cooperative education method. (JR)
.4
. ,
. - L:4..
. **********************************************4*****4;********tk, :,:,* Documents acquired by" ERIC include many informal unpUbliheaf; ** materials not available from other sources. ERIC makes every effOrt"*, :---
* to obtain-the4est copy available. nevertheless, items of arqing: * ''
,% 6 : ?'*-rpprod4q1b111-6
f ,-often enco-unterpd and this affects the quality-.,,*. .,
*-OT thdi-iicro410144-14ad404roducti7 ons ERIC makes available,- io,"
. * via-,:the,,tgc Do'cumOtilebtod4diolv.ServiC,! (EDRS).,EDRS is not %.,,!'
* responsi6ie fo rt h qi&lity:!610tW ttigkpal dpcument.' aeyroductias*.* suOltedbY,, E15R5.a.te the bes, :t'hat8can be_m#de from_ the-originaU .. .*,;
. , ,
Ic*A***********44,***********04tc******1**0***************4** ..,
f''
./ /.t ''
j
!J , . ,i .1
,;:, .
\ ,,.,
.
.," i
0 1 .
./. ;'... . . /11'

1.
APE 2 5 1975 \
ASSESSMENT OF COOPERATIVE EDUCATION BY FORMERSTUDENTS AND PARTICIPATING EMPLOYERS-
fi
IA RESEARCH REPORT
PRESENTED TO
RESEARCH AND EVALUATION DEPARTMENTFIRST GENERAL SESSION.
4.
- Robert C. Harris
7
Indiana UniversityBloomington, Indiana,
4
BY
Carol Hodgson
Planning & Human Systems,Washington, D.C. k
c
04
U S DEPARTMENT OF HEALTH,EDUCATION% WELFARENATIONAL INSTITUTE OF
EDUCATIONTHIS bOCUMENT HAS BEEN REPRO,DUCED EXACTLY AS RECEIVED FROM/THE PERSON OR ORGANIZATION ORIGINATING IT POINTS OF VIEW OR OPINIONSSTATED DO NOT NECESSARILY REPRE"SENT OFFICIAL-NATIONAL INSTITUTE OFEDUCATION POSITION OR POLICY
.AFRICAN VOCATIONAL ASSOCIATION CONVENTION.NEW ORLEANS, LOUISIANA 1974,
1.
2

6
ASSESSMENT OF COOPERATIVE EDUCATION 6Y FORMER
STUDENTS AND PARTICIPATING 'EMPLOYERS
OAMERICAN VOCATIONAL ASSOCIATION COYFNTLON
ew Orleans, Loujsiana" 1974:
,In 1971 the State of I .iana expanded its traditional array ?4'cAoperative education pro-
,i ,
./
grams to include the Int rdisciplinary Cooperative Education (ICE) approach. This approach wps
designed to serve sma ler, more rural communities where school .offerings were limited, student. 0
4
needs and interests diverse, and community resources limited but varied.
7/
Since accountability is a high priority and evaluation essential, it was appropriate to
7review,the ICE program and determine its role among cooperativ evocational education programs
.
in the, State of Indiana. It was upon this basis that the Indiana State' Board pf Vocational
Technical Education funded a project to evaluate cooperative education,'particOarly theICE
program.
Data obtained from two phases of the study are summarzed: a cooperative,-employer follOw-
,
one year graduate follow-up. Other phases of'the study will be available in the finalup and a
repdrt.
.
.
The discussion of data will cover co4inlfregardin findings, sPeCffic data by program
area and conclusions. The discussion will'focuS' on 'hej ooperative employer's information ob-.
tamed immediately following part.t
assessment one year after graduation :"
S
n in ttflprogram and the programAgraduates' profile and
74:
PROCEDURES
Population''/P. r
z.s1'
The Indiana Cooperative Education Study investigated schools locateCln rural or suburban
communities withincthe state. Programs in fifty-f6c.schools were includ in thd;.sample.. , ,
::
.%.
Oghty-nine percent (89%) ofhe 1156 operative t ents were in their Inior year.. 1
.. 4
IIndicated on the Indiana map are t
factors are indicated by the radiating
he major* populatiOn.and economic regions. COMmuting
ircles. The sample cooperate programs are depicted by
dots. The majority of programs are loc ted outside of the regional center. ApprdxImately half
of the programs are located in cities of less fhani
5,000 population and only Aye programs mere
cated in cities of more than 20,000.
l'
f:.
.
, .
1..
. ta. or'

t
- L1
'2'
Instruments. ;;.4,f
'..
Two instruments were develipe51 to obtain data for employers and graduates. The instruments
were designed to be forced Tespo ,-easy to ark and score brief to rid, colorful, published
quality and inexpensive to mail., CoriTidentiality was designed trif&Ahe instrument.
The graduate instrument's purpose was to ob in factual employment information and opinion
of the cooperative program. Factors for assessing he cooperative prOgraM were identified and
translated into iteMs. A careful naview of'Qther fol ow-up studies contributed considerably to
the instrument's design and bat'ery of items. The fina' instrument contained'twenty'it6s. To
simplify the reading process, k 'words in the'stem of ea h item were italicized. After pilot °
testing, theinstrument was printed. -:
.
Employer reactions wete obtained ,by a maiiO instrument. The instrument focuSed on:' 1)Employer
facts'ahout the firm, 2) assessment of the student trainee, 3) ssessments of the program,,61
4) implementation of processes viewed by authors (4 cooperative1.
terial and"cOnsultants a.i" 'iM-. '
.
por.taitt_to program operation. The six processes-werd%jdentified.b theDelphi technique as most
,, .,,,.,' -,f-'''
important from a base of 6 factors. The items consisted'Rrimarily if forced choice with a,.
,., .
46 ,.
modest number of open -end d options. The instrument included the nap and career objective of
r
. .
the trainee employq 6 the responding firm. The instrument was pilo tested and printed..
'Administration. bf Instruments)
. .l 10
Both instruments were administered by mail. 'The time schedule was s milar for each mailing
i
sequence. Th primary mailing4dstfollowed in two Weeks by a second maili g. The data collection, .
. . ./ .
"phase was,concluded five week after the initiafmaili*g.
The student follow-up wa6 conducted in May 1974. Materials were sent t" a census'..of gridu-
I
, --1
ates(1032). The total return was 610 (59.1%). The level of return ranged fr m 47.5 (Home
Economics) to 73.1 (Office).
A ,sample of employers (677) was surveyed in 6uhe 197: The returned total] d 514 (75.9%).
The .level-ofigreturn ranged from 56.1 (Agribus'iness) tp 87.6. (ICE).
'-The. .rather substantial number of graduate and modest number of employer non-respondants
dictateAa cautious interpretation of the data., However, the employer returns a higher than
most mailed investigation of the business and industrial4,,/communities.
. 4.
s, .

a
a
pd
Employpent Status. -. Table 1
40*
GRADUATE INFORMATION
Employment status one year.after program completion was examined. Depailment of Labor
classifications were used. These classifications are employed full time: 35 or more hours per'
week, employed part -time: lesS than 35 hours pe.4' week, unemployed and looking fbr work, and .
...
,r
unemployed and not looktngfor work.
The unemployment figure is slightly higher than' National and
late'averages for that time,
, ` ' .1. . .
- ,
--but less than National and State averages for the samerage group. Slightly under th,pee quarters
. .
of the population, had entered full-time employTent with slightly more than one in ten employed
.1
pact time or a .total of 84% working.
Employment status differs signifi antly by program area.. A notable contribuition to the
difference is the area of health'Ifeee 'only slightly more than foul- of ten trainees entered the6
labOr market. This occupational group had both the highest level entry into education programs
42.
(not looking for employment) and the highest level of current unemployment. The lowest level
of unemployment occurredA4 home economics occupations. 4igh-levels of full time employment'.1(
were reported in agribusiness and hbme economics.
Cooperative programs are designed to provide occupational preparation for-high school stu-.
d'Ats. 'Approximately,9I0% of the Indiana sample were in the labor force,, indicating'a high level -'
; -1.of agreement with the program objective; z'
I t.
.. --.-
Mobility and Migration - Table 2 .'. . .
rTwo types of information were obtained relative to mobility in each program area. "Changed
Address" defines any type of move, and migration resultsif the change is beyond county lines.(3
Forty-Wee percent of those surveyed hacithanged address since high school* The rgmaining
4
percent continued to,live at, the same residence. Approximately seventeen percentlbf all address.,
or
changing was the result of an "out-of- ounty" move.1
Health and home economics wei.e.pe_areas experiencing the highest incidence of mIlity.
i4. ....
Again, the concentration of health.pepple furthering theAr training may be'associated,with the
'T. N..... / t
.high percent of, address changing, although most moves occurred within county bdundries. In home..
economics, only,about 15% made a majorsmoye outside the cp-Nty. It is suspected that thep-,
4rk4
4 .
with,
dominance of men in,these two areas may be associated wi1h the high mobility,level. v1
0 .
4

414
.
a ,.
.
. . .
, The lowest percent change of address occurred among the interdisciplinary and agribusinessal. .
stud nts. However, these groups experienced the highest percentage of out-of-county moves, Two.. c .
.
. -
Are s where a high level of migration occurred were in the distributive and office occupations:.
/.In view of the geographic 1pfation of the training schools, essentially rural and small
-7
,to n, a large percentage of students had not made a major move to an economic center one year
after the program was completed.,-
... i
Employment. Profile ; 'Table 3, .A°
9 . . .4/TwQ pi.pfiles.are presented: length ofunemPloyment befOrd.Securing firStabb and number
.. ..
of different employers within the tear -following graduation. It shouldbe recognized that a, .
relationShip may exist among- =these factors. . c7-, ,
S --Overthree-jourths of the trainees have had only one Or two employers, with 44 percent
hAvihg.remained at their cooperative training` facility after graduation with the first employer.t
,. AP. .
.. I * About.five percent have had four or more employers indicating a liitited level of instability.
Approximately four perctont fia e no,t* worked% These persons may be Tn educational programs,,---,-- :
married and not working as well as those whO have not held a job since graduation due to
. . .unemployment.
.
s' 1,i,'
-, Besides those who stayed with their cooperative employer, an ;Aitibnal one quarter found
employment in less tha'n two weeks after Ig'raduation. For,over 70%, the frustration of unemploy-
ment
......
%
ment was not severe. However, up to one-third secured employment two weeks to a inonth..after
graduation% Six percent took from five weeks to four Months. An additional '2.6 percent have. .
,.: r . -
0
takent longer than fouronths. ,
1
t appears that slfightTy over eight percqnt of the traines may have experienced considerable ,
unemployment. ,However,' cautioning againsCsuch a conclusZn.is theinfluence of summer vacatioq.,
.
7..e. VAgik - Table 4 A \f '' :''4 '1
An analysis, of beginninglull-time employment wages4and wagesoneyear after, graduation
provides some interesting information. However, it should be noted that the minimum wage had
.-N
..
a'increased during the course of this investigation.t
,
Almost 30 percent of the ,graduates movedfromiess than $2.00 per hour to a higher malt x -
diving the first year of employment. Almost forty,percent of the employees were making $3.00
0'-per hour or more one ylar after graduation
IA
A
5
While initial wages of health and home economics graduates were low, they made extensive..-4,
tfianges ,Ouring,the first year of employment, although the peak levels bf these pregrams along! .
. ..
, . . le .
Withefice'education are not competitive to other occupational fields." . o
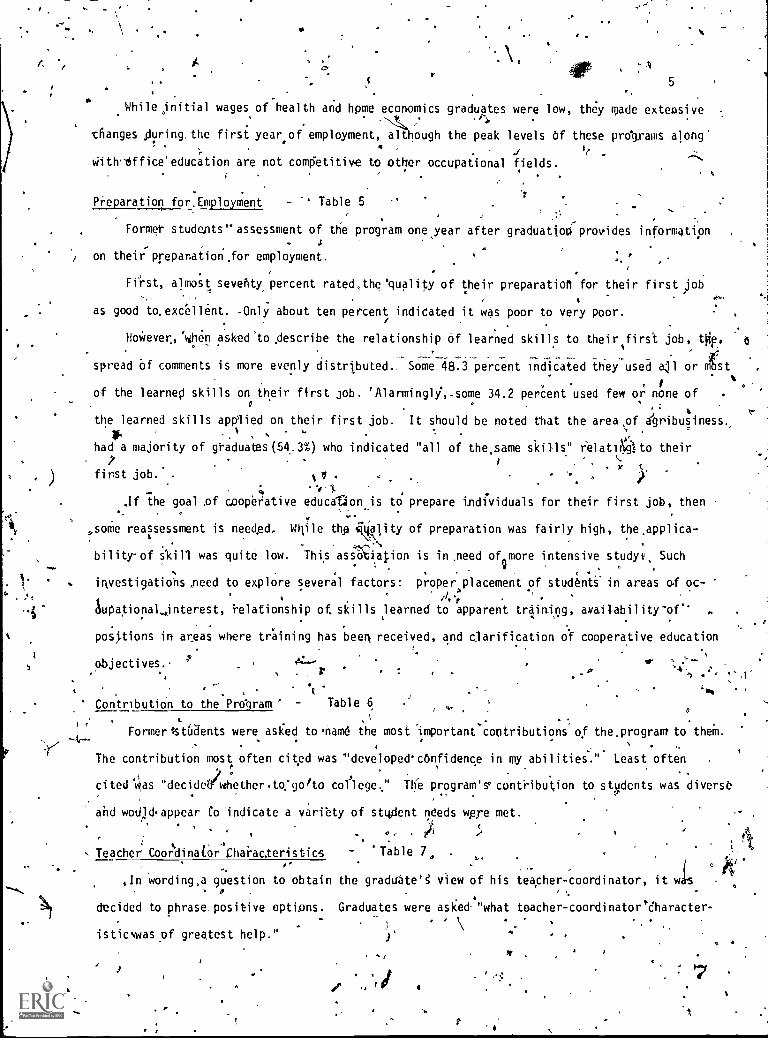
Preparation for,Employment - '4 Table 5
Former students" assessment of the program one year after graduation information
on their preparation, for employment.,
First, almost seventy, percent ratedthe 'quality of their preparatioR for their first job
as good to. excellent. -Only about ten percent indiCated it was poor to very poor.
HoWeverAnen asked describe the relationship of learned skills to their first job, tie,
spread Of comments is more evenly distributed. Some 48.3 percent indicated they used ajl or st
of the learned skills on their first job. 'Alarmingly,-some 34.2 percent used few or none of
the learned skills applied on their first job. It should be noted that the area of abribusiness,
had a majority of graduates (54..3%) who indicated "all of the,same skills" relatiOto their
first job. I4.1
If the goal of cooperative educataon is to prepare individuals for their first job, then
some reassessment is needed. Willie thp owlity of preparation was fairly high, the,applica-o
bility-of was quite low. This association is in,need of0more intensive studyi, Such
1
/
investigations ,need to explore several factors: proper placement of students in areas of oc-
Lpational,interest, relationship of, skills learned to apparent trAining,
posjtions in areas where training has been received, and clarification of cooperative education
objectives:,
4--. r 1 A
ir'...4%
-, -et . 1...4
./
Contribution to the Program Table 6r ',* 0
Formerist2ents were asked to'namd the most important contributions of the.program to theM.
The contribution most often cited was "idevelopedconfidence in my abilities." Least often .
.
i
cited Was "decidO/Whther.to:gotto coi'lege," The progra'' contribution to students was diverst1
,i1
and woUjdappear Co indicate a variety of student needs were met.',4
C
.°. .
4
, Teacher CoordinaI. tOr,
Charac1eristics - Table 7. .
4,
,In Wording,a question to obtain the graduate'S' view of his teacher-coordinator, it wasp
4
decided to phrase positive options. Graduates were asked "what teacher-coordinator'eharacter-. , .
isticwasof greatest help."
40' ,
o
7 .
,
.40
6
,:
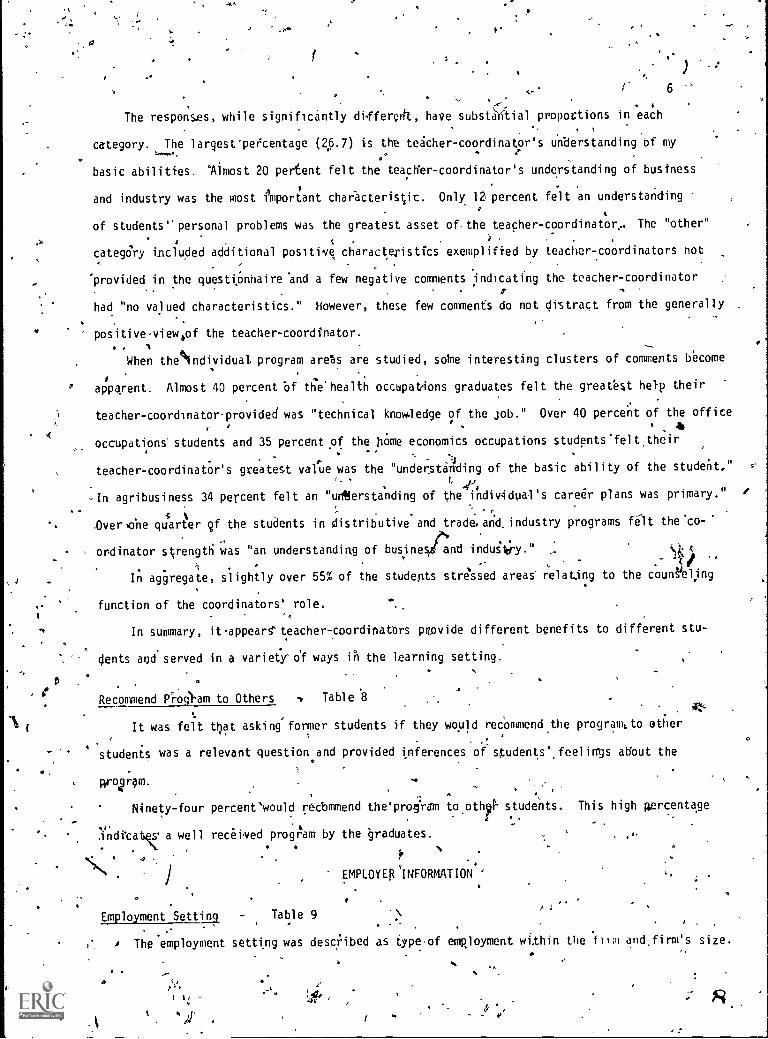
The responses, while significantly differeA, have substantial proportions in each
category. The largest'peecentage (26.7) is the teacher-coordinator's understanding Of my
basic abilities. °Almost 20 perEent felt the teacher- coordinator's understanding of business
and industry was the most i4 mportant characteristic. Only 12, percent felt an understanding
of students'' personal problems was the greatest asset of. the teacher-coordinator. The "-other"
I.
categOry included additional positive characteristics exemplified by teacher- coordinators not
provided in the questionnaire and a few negative comments indicating the teacher-coordinator
had "no valued characteristics." However, these few comments do not distract from the generally
positiveviewof the teacher-coordinator., A
When thel4ndividuat program areas are studied, some interesting clusters of comments become
apparent. Almost 40 percent Of th'health occupatrions graduates felt the greatest help their
teacher-coordinator-provided was "technical knowledge of the job." Over 40 percent of the office111
occupations' students and 35 percent of the home economics occupations students'felt.their
teacher-coordinator's greatest value was the "understanding of the basic ability of the studeAt."
.In agribusiness 34 percent felt an " understanding of the indiv.idual's career plans was primary."
Sr
1)veriolie quarter 9f the students in distributive and trade.and.industry programs felt the'co-
ordinator strength was "an understanding of businestand indutt!y."
In aggregate, slightly over 55% of the stUdepts stressed areas' relating to the count` el,ing
function of the coordinators' role.
In summary, itaPpears" teacher7coordinatOrs prtovide different benefits to different stu-
dents aod served in a variety-cif ways in the learning setting.
Recommend Prro4hm to Others Table '8
It was felt that asking former students if they would recOmmendthe programsto other
students was a relevant question.and provided inferences of sKudents'.feelins about the
prov-am.
Ninety-four percent'would recommend the'pro4ram to oth94. students. This high percentaged .
f. .4ndiCatoks a well received program by the graduates.
4 .
1
EMPLOYER NFORMAT ION
Employment Setting Table 9.\ A
,
A The employment setting was descibed as type of employment within the firm andfirm's size.
O

I
. 6a
; . 7
With an N of 513 almost half the employment assignments Were indistributive and trade,
,and induStrial occdpafions. The smallest area was agribusihess. Approximately 2.7% of the
positions were-not indicated and could not be classified,
The proportion of employees distributed by size of the firm was unexpected in view6
of the
geographic Vocation of the schools, since the sample was drawn from predomiiittely rural and small
cities within Indiana. ?;,,k
Almosttone-quarter oftthe employing firms employed 4-10 persons. However, fiftepepercent. .
of the firms had 201 or mare employees. The distribution sFklitis at about 50% for firms with
20 employees or.less.1.
Student trainees were employed in.a wide variety of occupational fields in diversemploy-
ment settings. .
Assessment of Student Table 10 '''
. -,,.
,..,
As a conclUding assessment of the cooperative student'OerfOrmanCe, employers were askedx
to state the nature of a hypothetical lettecsi, recommendation. Slightly more. than three-
.quarters of the cooperative employers indicated they would write a favorable to exceptiorially
favo-rable letter. Only 5.5 percent opted for the two negative alternatives: "aniunfavorable
letter" or "would choose not to write."
0
Preparedness of Student Trainee, Table 11
The initial.competency4level,of, the student-trainee at the time he/she began the cooperativ,e
program was estimated by the employer. A distinction bttween technical skills and employee.
human relations skills was not made. 1. .
eOnly one percent of the emplbyers responding indicated the students entered the cooperative
training program unskilled., Les'S than 20 percent entered with limited or'no skill.
A little over half were fairly skilled and approximately thirty percent -of the tusdents'
entered the. program at.a high skill Finally, almost five prcent had exceptional skills
Cias they began their program..If
This profile of sludee preparedness seems lo indicate that employers felt st dents were
x
ready to benefit from the program and contribute to the firm. However, the nature f the. skill,
and training contribution made by the firms needs to be clarified,-
,
4

Cooperative clucatidn Rrocesses Tab,le 12
Certain processes were. identified as critical to the operatio Of thi prqyram: 'training
agreements, raining plans, employer evaluations of students, a coordinator visitation to
the firm. These processes were. supported by state consultants as important to cooperative edu-
cation program quality. "`
Training agreements wereysed in about three-quarters of-all codpOrative programs. It
should be,noted that agreements are, mandatory by law even though it appears that total compll4nce
is not adherred to.° Training plans -were developed in approximately two - thirds O'fthe
'Student evaluations were made by nearly 95%.of the employers. '1/4
While variation.appears to exist iS the application of the processes among program areas,
only employer visitations were significantly different among program areas. The information
provided reOesents a collapsed table for employer visitations. The percent of firms visited.
more than once a month for a four month period is indicated by the figure. The only' prograw
area with more than 50% 'exceeding the criterion level was health occupations. Several figures
not presented ar4 interestiti 467% of firms not visited at all; 28% no more pidn twice, and,
1V% with 9 or more 'visits. If the criterion is valid, concern is expreSsed for the lbw pro-
portion of visitation.
In summary we have listed the percentage of visits made on an averabe of once a month by
prograN areas. An exceptionally high iiercentage of health and-home economics employer visita-
dens were made. Two loer visiCatiOp areas Were interdisciplinary and agribusiness.,
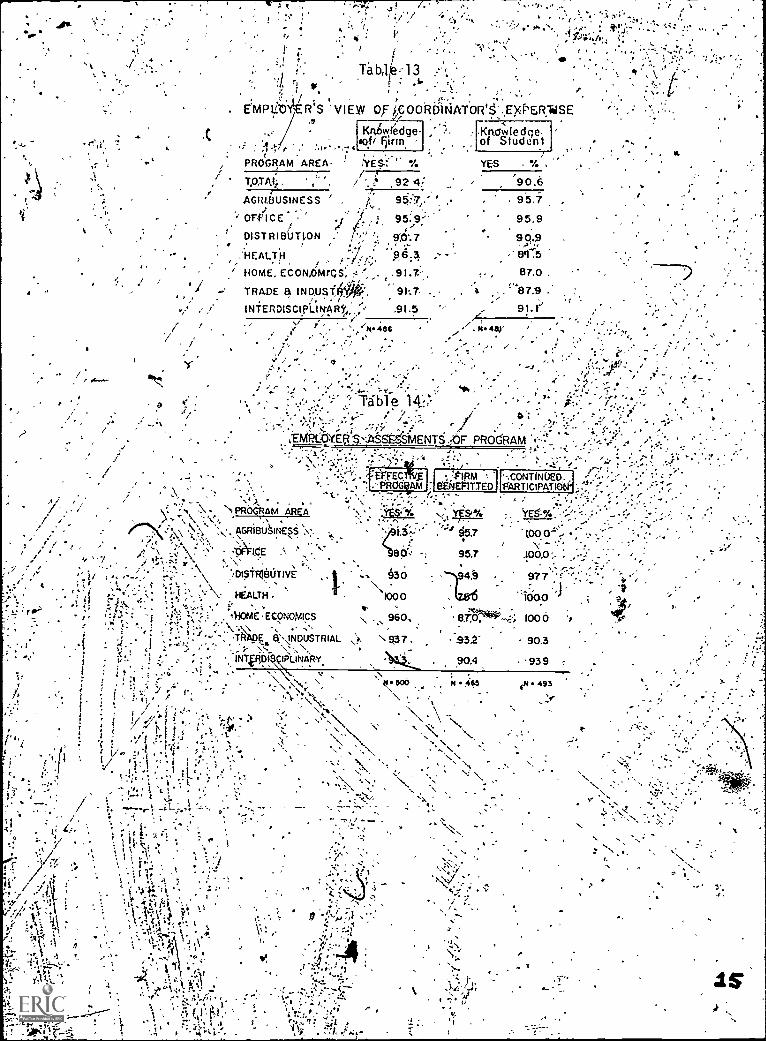
EM4lOyer's View of Coordinator's Expertise . Table 13
Often, cooperative teachers are critizied foi- their latk of knowledge of the student and
of the cooperative firm with whom he must associate. Howgdo employers-view the coordinator on
-. .these factors?.. ..
.(...
The employer's view of the teacher-coordinator is most positive. More than,ntne out
of ten employers were impressed by the coordinator's knowledge of the firm's product or service
and his ability to relate effectively. Corvistency existed across program area6.
'While rated only-slightly lower,,the coordinator's knowledge of the stodentsWas held in
hiyh respect by employersy':
t--1
*
*°'
a
10`t

. ,0.
4'
. , 9
Employers' Assessment4of Pr:hrams "- Table 14
.«,
An emplRyers'Oftessment of the.coOperatii6 program was attained, by thefactors:. f) is
4the program an effective kean of providing vocational education? 2) did the firm belefit
by participating in the program?,:and 3) is the employer intereste in continued participation.
. What are reasonable criteria ievels.for judging these factors? 4 ,
.
t. - ,* .4. . . .
Iii no program area did the employers' view drop below 90,percent Iwo in their pelf of> . -,
!«
of the effectiveness of the program. Fn no program did the desire to colciatie participation, .
dip below the 90 percent level. Four of,seven program areas had expressions of 100 percent,de-. r.- / r
sire tp continue. In only two program areas did the benefit to the firm 'dip beloW 9.0 percent
sand in both areas continued RarticApation was 100 prercent.. .1
. .., 8
, Clearly, participating employers, With few exceptions, are strong advocates of at coopera-41
tive education approach: . q
''..
,
Cooperative Rrocesses, Snd Employer Assessments
Finally, select 1-ctors or processes areassociated with the three employer assessments'.
6
Statistic41 tests were conducted to explo re potential relationships. The tests related eight
factors or proc4ses: l) size of firm, 2) initial competency421evel of the stude0t, 31-training'8«
,
agreement, 4) 'training plans, 5) employer evaluation of students, 6) number ofvisitations,
17) teacher knowledge of the student, and 8) teacher's knowledge of the firm. These 'factors
were related to "effectiv. e means of providing vocational education " and "benefit to the firm."
4
Significant relationships did not exist among any factors and the criterion "effective 8
means of providing vocational education." How6er, four significant positive associatiops .1
existed among the factorS' and the criterion "firm-benefjtted." These factor's includt initial
competency level, number of visits by the coordinator, coordinator's knowledge-of student and\_.
firm. The important role the coordinatorIpossesses in the cooperative program is clearly
4cated by the da,i
!,e
Implications
Data provided by the graduate and employer follow-up phases4of theIndiana Cooperative., - , ,
Education Study are generally consistent in support of the cooperative education method.'
' Graduates of programs in pvcrominately-small communities have been provided a8Veath ofo
educational opportunity through the cooperative method.
1.

p
With few exceptions, there Is similia'rity ratings on Most factors across program areas.
While limited instances of variatidn would normally occur due to a number of factors such as`
preparation and experience of the teacher-coordinator, location of the school, and preparedness
of the tudentssfor the program, major deviations among programs simply do not exist, '
This investigation touched'on several processes thought to be important to the cooperative
education method, Clearly, several of the factors appear to be associated critically witht .
benefit derived by the firm from its participation in the cooperative program. These factors
indicate the key role of the teacher-do6r4iPator. Investigations needs to be under.taken in
.more controlled settings to accesssthe.effectiveness of the cooperative processes to the attain-
mentof other program objectives.
The sensitivity of the cooperative education methotb labor market needs will continue
to be botlia Soon and a bane to the program. While the market.was beginning to decline slightly,
in Indiana in 1973 a high percentage oftWIperative graduites entered the,labor ma,rkee with.%0.41 1e r
relative ease. .
0.4
t., . .. ,
4-,..
Most information indicaiestn,exceptionally0high leyel of acceptarice of the cooperative
, .
education method. AcceRtance,at or near the%ninety percent:level was consistent among students,
and employers. This provides the cooperative educator with.a unique opportunity. The task of
-bringing most of the final ten percent into the fold would not appear to be a-major undertakin§.
.
4
3
f a
r
12

A.
PROGRAM' AREA
TOTAL
. Table 1..
EN;I;DLOYMENT STATUS
[FULL 119 1 -.117i TiAftErunFC EMPLOYE E
`'ES % YES %
73 e 10.9
NOT 1 MI'LCOOKING
K
NOT EMI'LNOT LKNG
YES % S %
6.3 9.6
AGRIBUSINESS
OFFICE
DISTRIBUTIVE
HEALTH
HOME ECONOMIC S
73670 5
42.9
05.2
TRODE?13 INDUSTRY £10.0-
`1NTERDISCIPLINARY- 74.6 '
5.7 -5.7 p.910.4 . _- 5.6 10.4
7.7.: 7.7
.6.1 12.2 38.8
7
I4.7
.
.5;3,451: .7;1. 5.6 -5,1_
N.,:586
"r..,
Table 3
EMPLOYMENT PROFILES
,gli1PLOYMENT ,LONGEVITY
NUMBER OF EMPLOYERS:
ONE
TWO
THREEYOUR OR MORE
HAVE NOT WORKEDv 4
50.428. 7 ,
11.75.4
,3. 7
'N- 589
LENGTH OF UNEMPLOYMENT'
(TIME'
STAZEDON COOP JOB 44.7LESS THAN TWO WEEKS 26.4
TWO TO FOUR WEEKS 7. 6FIVE WEEKS TO FOUR Mos 5 9MORE THAN FOUR MONTHS 2. 6
N472
Table 5'
. .
STUDENT ASSES;;MENT Cr PROQIMM.,OUAt. IT OF PREPARATION FOR FIRST 'JOB (N549)EXCELLENT 2 7 9 IIMOIMINIMINEll9000FAIR
POOR
VERY'
40 0 ,rilimpoliSaimill101120 9 lesmommli44 MNGO Fs
RELATIONSII OF LEARNT() SKILLS TO FIRST JOB. (N 546)ALL, Or THE SAME SKILLS 31.5 =111111=110110111111 -
MOST (. "0 16.8 1111=11=111
SOME:. a., .17.4 11111111.111M11
FEW . :12 6 IMMONONE 2I.6\_
:.
.
PROGRAM
_ TOTAL
6: 2.
MIGRigON40iitilfry:C iiitged
!eitess, Coufkty
AREA ' i'ESi;.- % YES
AGRIBUSINESS, .
OFFICE
DIST41,1B.UTION
HEALTH "
HOME ECONOMICS
TRADE -1k INDUSTRY' --A"
INTERDISCIPLINARY ---
..
LESS
PROGF1.AM AREA
43. 166
35.
4641,
57 .
66
33 -1.N 60.6 40;-
16.2
21.6
23.3
18.-14.8"
16.3
Table 4
,,DELOYEE WAGES
BEGINNINGWAGE
$ 300 orMOtE
:1.S.2 00-29
ThlANS.20701 LESS
%. %
AGRIBUSINESS
OFFICE
DISTRIBUTION,
HEALTH
HOME ECONOMICS
TRADE 6 INDUSTRY
INTERDISCIPLINARY
23 66
51
30 5066 32
64 36 t 0
22, 47 31
40 38 2E
I I
3
202
TOTAL 39 45 16
*AGE 'ATONE YEAR
$ipOorMORE
T2 0;2
HA1 $2
% ,
48 461
10 76 14
1;1:1 43 46119,.- 81 ol
74 22*
5 29 66
I2 42 461
(9, 51 *39..
Table 6
CONTRIBUTION OF PROGRAM TO STUDENTS
CONTRi8uTioN
DCVELOPI CONE IDE NCE IN MY ABILITIES
LEARNED TO GET ALONG WITH OTHER PEOPLE
LEARNED' TO BE AN EFFECTIVE WORKER
IDENTIFIED PERSONAL STRENGTHS 8 WEAKNESSESr-DEVELOPED OCCUPATIONAL SKILLS
,FIRMED LIP CAREER PLANS
DkCIDED ON COLLEGE PLANS _
N 609
*TRAiNEES 0 NAME ONE CA TwO FACTORS
A .
!-^320
29/
28.2
4.3
21:3
21.0
13'.0
,'",

.
CHARACTERISTICS OF THE TEACHER-COORDINATOR
MOST VALUED CHARACTERISTICS OF THE TEACHER - COORDINATOR)
DIE TEACHER - COORDINATOR'S
UNDERSTANDING OF
PERSONAL PROBLEMS 12.1 *NM=COOP JOB 16.0 11111111111MM ,
BASIC ABILITIES 26.7
CAREER PLANS 16.5 11.11111BUSINESS a INDUSTRY 19.9
OTHER 6.6
N569
Table'9
ASSESSMENT OF STUDENT 4-.TRikllilEE"
"NATURE-_ 0P-1:ETTER- OF RECOMMENDATION
-EXCEPTIOttpth -FAVORABLE Wet:
VERY FAVORABLE. 288%
FAVORABLE,. 33.9
CAUTIOUSLY FAVORABLE 15.5
UNFAVORABLE 2.77.
WOULDN'T WRITE 2.7%
ti
0
N 510
Ta'bl e
PREPAREDNESS_ OF THE S1UDENT TRAINEE ;`..
AT COOPERATIVE. PROGRAM ENTRY
[INITIAL COMPETENCY LEVEL: EMPLOYER'S, ASSESiMiNil
UNSKILLED
LIMITED SKILL
FAIRLY SKILLED
HIGHLY SKILLED
EXCEPTIONALLYSKILLED
N508
1.9
I 7 1 '
51.2
26.2
45
Table 8
FORMER STUDENT'S ASSESSMENT
' I RECOMMEND PROGRAM TO OTHER STUDENTS
, ,PROGRAM AREA
TOTAL
AGRIBUSINESS
OFFICE
DISTRIBUTIVE
HEALTH
HOME ECONOMICS
TRADE Ei INDUSTRY
INTERDISCIPLINARY
N 590
Table l(r1
EMPLOYMENT SETTING: PROFILES
942
'1000
960
91.0
1000 ,
963 '958
904
Type of Employment % Firm's Size)OCCUPATIONAL FIELD. NUMBER OF EMPLOYEE'S %
1:3
17.3
AGRIBUSINESS
0F F
DISTFtt8UTIVE 'HEALTH
HOME ECONOMICS
TRADE a INDUSTRY
NON-CLASSIFIED
N5I3
4-10
12.3
24.6
24.0 - 11-20 .13,7
lap 21-50 15.3
12 _. 51160 10.7- I .
20.7, 101-200 8.3
- 2.7 201 00405 "/ -15.1
y-.(496 ,/./'
/ . /,' zTtibl e 12, ,
. . ,-=.COOFIERATiVE: E
13-
PROGRAEA,TOTAL
'AGRIBUSINESS
OFFICE
DISTRIBUTION
HEALTH
HOME ECONOMICS
TRADE a INDUSTRY
INTERDISCIPLINA9'
1;,44-6.(.1A 110(.111.11V. 0111 1.401111;Str Af0.0 4110PS
xrf4.
" Yc //.17...7 Zir 6X:6
r 2'B %"750
, 825
60.9
826
70 2 ,
76371
67.5
61.5
9
590'690
=
. .
98 O
96.3 .
88 0 4P4',
100 0 .279933 98,
N479 N.490 N500 N494
, 4
. ,
S.
e.
-
...** PROGRAM AREA
1,1 5 .4 .
461
7 ..
f
c
Ta bil,1 3 ..' ,..
E'MPLE-0 R'S -VIEW Of e/C0613610ATOR1S'.EXPERWSE
mfrwtrmfedge,- TKnOwledne.
of Student. -
'YES
, .90.6
PROGRAM ARE A %
TPTA.1 92 41
AGRIBUSINESS .95;9OFFICE
DIST R 18'1.11,0N 9;0 .7
'HEALTil 96:31
HOME, ECONtiMrQS.; .91.7:,TRADE 8 IND,UST:4*.
INTERDISCIPLINARY .91.5 91.1";. /, 7 /N 486 . N 49)"
. 95.7
95.990.9847'5
87.0 .
"87.9 .
*iir
RI.",6
VAR ,L-WERSs:ASSL<SMENTS PROGRAM
-Er.FECt,-;
.'PROGRAM!SIAM
BENE1TTED1I
,,,:,AG11181.19111ESS 1.3 . 95.7
80 95,7. .
930 4.9DISTRIBUTIVE
:It1 , c ,i
!i i "*. i /- : . -,
. i., / , .1 .., -
11 i . 1 .../ 11'1 '.` I :'-'i I : r 1/ ;If 3 . 4 4 '.; ...
I.;- *,, I .1.1 :. ., ... it,' ,, - , . ---,,,.': 1 , 1. ,..,.'--', / ... % :1 -. ,, -.--r - --." .:..*1-- `
t tI :.'
. 1 .i _"" ; I. . ,.I
/."/ . '. 1 l'i . ,% 1 t ' '.t
't
.
,HEALTH' 1000
4i0ME ECONOMICS 960, 8,7,0;
N 937. 932-
'i ,'4,,,
\ \
\\A,D -: 'TA, 13\INOUSTRIAL\
; INTRDIScIPLINARY,,';. v
fr
:1tt .t .
t* ,I4'
1'1 1. 41
`o *-1.`
is2
v :' f.,1;. ,
,s..
V: .t.
. 90.4
'- CONTINUED.
1.000:%-
.100.0,- ,,:*
977 . :7 -`:'1000 .1
1006
90.3
'939 f
000\ -
-.N
-
4. 7.
....4:\;. 7,1
.
10, 1'. ,j
- 4-,"
N 493
7 --
fk 493
N