employment and wages survey
TRANSCRIPT

Reports
Employment and Wages Survey
2017
Employment and Wages Survey 2017
Contents
S/N Subject Page No.
1 Contents 2
2 Introduction 3
3 Main Features of the Survey 4
4 Glossary of Terms 6
5 Survey Methodology 7
6 Survey Form 9
7 Survey Results 14
Employment and Wages Survey 2017
1
Introduction
By virtue of Royal Decree No. (23) of 7/12/1379A.H., the General Authority for Statistics (GAStat)
is entitled to collect economic, social and demographic data in the Kingdom to be published
periodically. Acting under this right, GAStat has developed statistical research programs to
boost its economic database. Among these programs conducted by GAStat is the economic
survey program.
Employment and wages statistics is highly important as it is one of the necessary means to assess
wages and work conditions for workers in public and private establishments. General Authority
for Statistics (GAStat) has started this survey as early as 1395A.H.
On this occasion, GAStat extents special thanks and profound gratitude to all those who
contributed to the accomplishment of this project, particularly the establishments included in
the sample of this survey for their cooperation in providing the required data. As GAStat hopes
that the results of this survey will contribute to enhancing the statistical economic database, it
welcomes all suggestions that may improve this survey.
May Allah grant success,
General Authority for Statistics (GAStat)
General Administration of Industry and Business Statistics

Employment and Wages Survey 2017
2
Main Features of the Survey
First: Survey Objectives
1. Provide economic and social data on workers in public and private sector establishments
2. Measuring the total number of workers in public and private sectors based on economic
activity, sex and nationality.
3. Measuring average monthly wage by occupation and economic activity.
4. Measuring average monthly wage according to main professions.
5. Evaluating wage levels and work conditions for workers in public and private sector
establishments.
6. Giving indicators on average working hours according to economic activity.
7. Comparing average wages for all workers over various periods
8. Studying wages orientations and its changes over time
9. Providing the needed statistical data and information on all economic activities for
government bodies and agencies as well as researchers; and
10. Using such data to make local, regional and international comparisons and carry out studies
and analyses.
Employment and Wages Survey 2017
3
Second: Aspects of benefit:
The results of the employment and wages survey serves to support labor the Saudi market decision-
makers and planners, as indicators of the survey help in drafting programs and plans that aim to
provide economic and social database workers in public and private sector establishments.
As well, regional and international organizations, researchers, academics and those interested in
the labor market can make use of the survey results in publishing their reports, studies and
researches.
Third: Survey Sample
stratified random sampling has been utilized in taking samples of selected establishments. Given
the importance of such samples, Probability Proportional to Size (PPS) is used to ensure choosing
the most important establishments accordingly.

Employment and Wages Survey 2017
4
Definitions
1. Worker:
Refers to the Saudi or non-Saudi performing a certain work in the establishment, including
Establishment Owner full-time or part-time employee, permanent or on-contract, male or
female.
2. Economic activity:
All activities performed or services provided by the establishment in return for
consideration. The economic activity classification of establishments is based on
International Standard Industrial Classification of All Economic Activities, Rev.4(ISIC 4).
3. Profession:
The main work of the worker in which he or she spends most of his or her time during the
said time reference
4. Worked Hours:
The total number of official hours that the worker spent at the establishment during the
time reference
5. Average working hours:
An indicator that measures the average actual and ordinary average working hours met by
the employed population, i.e. total working hours to total employed population.
6. Monthly salary:
The wage a worker receives including any additions, allowances, deductions, or discounts
for the official working hours during the time reference.
7. Average Salary:
An indicator that measures the average salary of the employed persons with paid jobs, i.e.
total salary to total employed persons with paid jobs

Employment and Wages Survey 2017
5
8. Nationality:
Refers to the legal accountability of the worker as for his belonging to a given country

Employment and Wages Survey 2017
6
Survey methodology
Exploring the Needs
GAStat, represented by the General Administration of Industry and Business Statistics, has
communicated and held meetings with the most important beneficiaries and has taken their
needs and opinions about the data into consideration while designing the survey form.
Survey Form Design
The employment and wages survey is one of the tools used to collect detailed data on
workers, their education level, profession, working hours, due monthly salary and monthly
benefits according to economic activities, which in turn meet the needs of public and private
partners and individuals.
Sample Collection and Selection
It covers all the kingdom's administrative districts with giving a greater importance to cities
given that they have nearly 84% of all Establishment in the kingdom and are inhabited by
nearly 91% of all workers in the kingdom.
The survey also covered capitals of administrative districts with varied economic, social and
service activities, as well as varying surface areas and sizes.
Data Collection Method
Survey data are collected through face-to-face interviews by qualified and well-trained
researchers under the direct supervision of the General Authority for Statistics (GAStat) staff
to cover every region and city of the Kingdom; using the form designed for this purpose or
using the Tablet.
Data Collection Tools
Field Data collection was utilized the e-form or Tablet device designed for this purpose which
includes all households’ data.
Loading and archiving aggregated metadata on databases
Field researchers in all districts in the Kingdom have use the synchronization feature on
tablets to transfer the survey data directly to the database in GAStat main premise to be
stored for reviewing and processing.
Employment and Wages Survey 2017
7
Data evaluation and quality
The main lines for quality application are summarized as follows:
o To develop and prepare different programs for checking data and making sure of its
integrity and accuracy.
o To make sure of the researcher's arrival at the required location and commitment to the
specified time.
o A team of specialists at GAStat made repeated regular visits to each city of the surveyed
cities in accordance with a set timeframe.
o A quality sample is taken automatically at the level of the city and researcher.
o Special follow-up by quality controller during field work and after surveys are done.
o Monitor and consider all feedback and suggestions by clients
o Assess work periodically and follow-up international developments in this regard.
o Take the necessary measures and steps to implement data quality improvement.

Employment and Wages Survey 2017
8
RESULTS OF Employment and Wages Survey
Employment and Wages Survey 2017
9
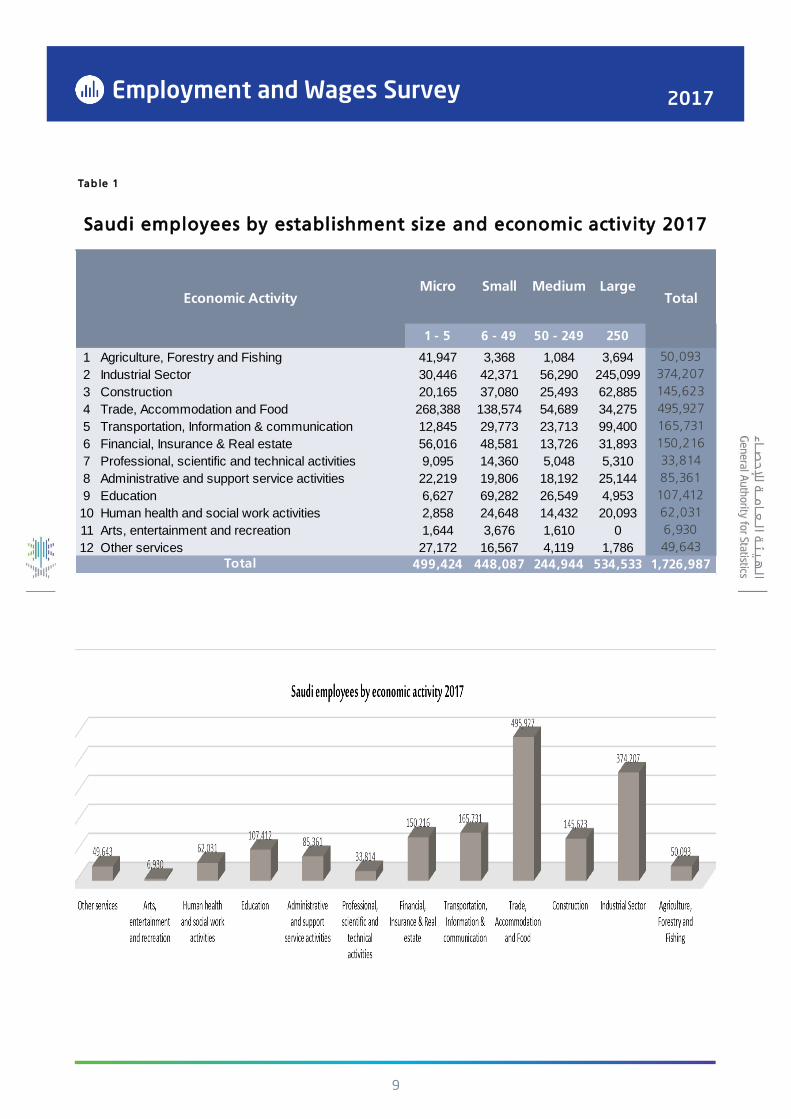
1 - 5 6 - 49 50 - 249 250
1 Agriculture, Forestry and Fishing 41,947 3,368 1,084 3,694 50,093
2 Industrial Sector 30,446 42,371 56,290 245,099 374,207
3 Construction 20,165 37,080 25,493 62,885 145,623
4 Trade, Accommodation and Food 268,388 138,574 54,689 34,275 495,927
5 Transportation, Information & communication 12,845 29,773 23,713 99,400 165,731
6 Financial, Insurance & Real estate 56,016 48,581 13,726 31,893 150,216
7 Professional, scientific and technical activities 9,095 14,360 5,048 5,310 33,814
8 Administrative and support service activities 22,219 19,806 18,192 25,144 85,361
9 Education 6,627 69,282 26,549 4,953 107,412
10 Human health and social work activities 2,858 24,648 14,432 20,093 62,031
11 Arts, entertainment and recreation 1,644 3,676 1,610 0 6,930
12 Other services 27,172 16,567 4,119 1,786 49,643
499,424 448,087 244,944 534,533 1,726,987
Saudi employees by establishment size and economic activity 2017
Tab le 1
Total
Economic ActivityLargeMediumSmallMicro
Total

Employment and Wages Survey 2017
10

Employment and Wages Survey 2017
11
1 - 5 6 - 49 50 - 249 250 - -
1 Agriculture, Forestry and Fishing 191,056 54,595 14,195 38,252 298,097
2 Industrial Sector 237,532 194,458 206,368 315,944 954,302
3 Construction 51,947 152,288 151,179 646,158 1,001,571
4 Trade, Accommodation and Food 1,111,356 574,944 142,882 104,238 1,933,420
5 Transportation, Information & communication 31,009 67,830 52,333 72,404 223,576
6 Financial, Insurance & Real estate 25,712 30,724 16,401 32,425 105,263
7 Professional, scientific and technical activities 19,108 29,384 20,183 18,185 86,860
8 Administrative and support service activities 26,732 34,986 34,127 119,319 215,165
9 Education 3,713 58,996 34,604 2,923 100,236
10 Human health and social work activities 2,226 41,405 41,398 60,654 145,683
11 Arts, entertainment and recreation 5,803 16,986 6,298 0 29,087
12 Other services 133,280 23,520 8,199 4,981 169,979
1,839,475 1,280,116 728,167 1,415,482 5,263,239
Table 2
Total
TotalEconomic Activity
LargeMediumSmallMicro
Non-Saudi employees by establishment size and economic activity 2017

Employment and Wages Survey 2017
12

Employment and Wages Survey 2017
13
5-1 49-6 249-6 250
1 Agriculture, Forestry and Fishing 233,004 57,963 15,279 41,945 348,191
2 Industrial Sector 267,978 236,829 262,658 561,043 1,328,508
3 Construction 72,112 189,368 176,671 709,043 1,147,194
4 Trade, Accommodation and Food 1,379,744 713,518 197,571 138,513 2,429,347
5 Transportation, Information & communication 43,854 97,603 76,045 171,804 389,307
6 Financial, Insurance & Real estate 81,728 79,305 30,127 64,318 255,479
7 Professional, scientific and technical activities 28,204 43,744 25,231 23,495 120,674
8 Administrative and support service activities 48,951 54,792 52,319 144,463 300,526
9 Education 10,341 128,278 61,153 7,876 207,648
10 Human health and social work activities 5,084 66,053 55,830 80,747 207,715
11 Arts, entertainment and recreation 7,447 20,662 7,908 0 36,017
12 Other services 160,451 40,086 12,317 6,767 219,622
2,338,898 1,728,203 973,110 1,950,015 6,990,226
Table 3
Total
Total
Economic ActivityLargeMediumSmallMicro
Number of employees by establishment size and economic activity 2017

Employment and Wages Survey 2017
14

Employment and Wages Survey 2017
15
1 Lawmakers, managers and executive directors 101,515 39,695 141,210
2 Specialists in Professional, Technical and Humanitarian Fields 96,056 43,860 139,916
3 Technicians in Professional, Technical and Humanitarian Fields 119,282 66,543 185,825
4 Occupations of Clerical work 281,321 199,309 480,630
5 Sales 111,601 96,624 208,225
6 Services 289,861 46,351 336,212
7 Occupations of Agriculture, Animal Husbandry & Fishing 3,497 525 4,022
8 Occupations of Industrial , Chemical Operations and Food 22,169 6,761 28,930
9 Occupations of Supporting Basic Engineering 185,462 16,555 202,017
1,210,765 516,222 1,726,987
Tab le 4
Saudi employees by Main occupation groups 2017
Main Occupation Groups
Total
Total Female Male

Employment and Wages Survey 2017
16
1 Lawmakers, managers and executive directors 43,257 1,356 44,614
2 Specialists in Professional, Technical and Humanitarian Fields 183,218 15,127 198,345
3 Technicians in Professional, Technical and Humanitarian Fields 302,807 35,806 338,613
4 Clerical work 48,873 5,706 54,579
5 Sales 196,284 4,802 201,086
6 Services 2,546,690 63,889 2,610,579
7 Occupations of Agriculture, Animal Husbandry & Fishing 62,443 67 62,510
8 Occupations of Industrial , Chemical Operations and Food 121,226 4,289 125,516
9 Occupations of Supporting Basic Engineering 1,625,588 1,809 1,627,397
5,130,387 132,852 5,263,239
Table 5
Saudi employees by main occupation groups 2017
Total
Main Occupation Groups Total FemaleMale
Employment and Wages Survey 2017
17
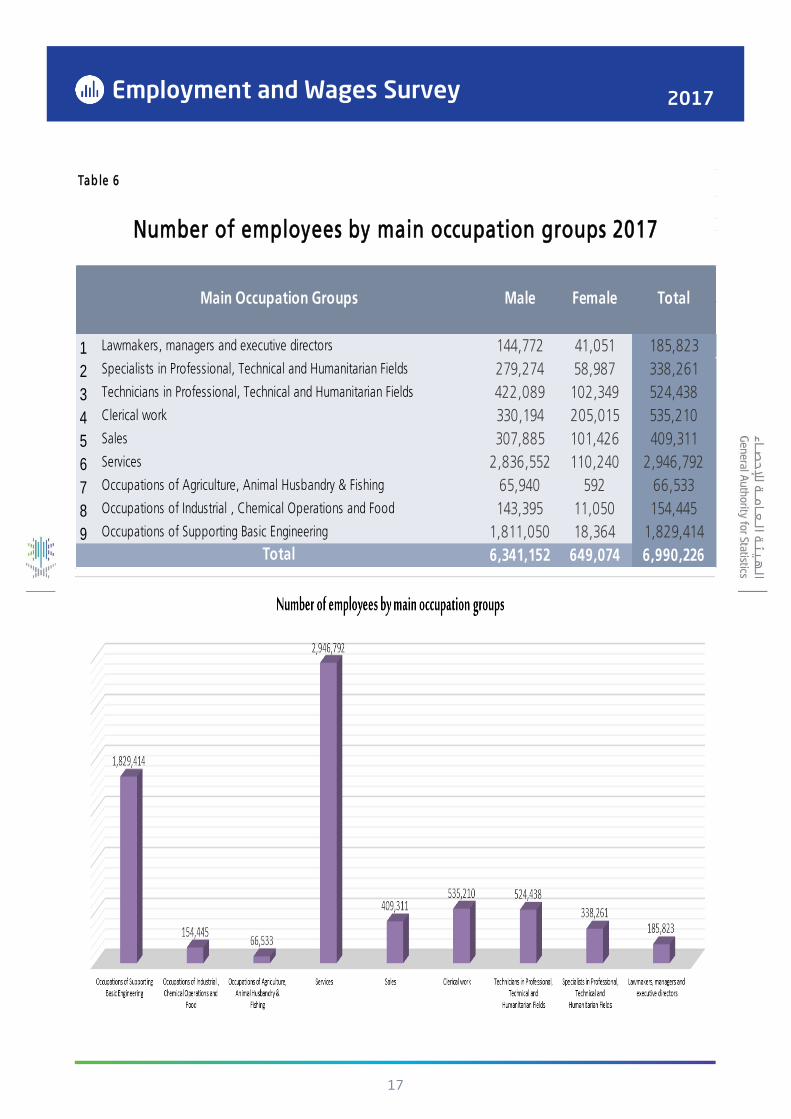
1 Lawmakers, managers and executive directors 144,772 41,051 185,823
2 Specialists in Professional, Technical and Humanitarian Fields 279,274 58,987 338,261
3 Technicians in Professional, Technical and Humanitarian Fields 422,089 102,349 524,438
4 Clerical work 330,194 205,015 535,210
5 Sales 307,885 101,426 409,311
6 Services 2,836,552 110,240 2,946,792
7 Occupations of Agriculture, Animal Husbandry & Fishing 65,940 592 66,533
8 Occupations of Industrial , Chemical Operations and Food 143,395 11,050 154,445
9 Occupations of Supporting Basic Engineering 1,811,050 18,364 1,829,414
6,341,152 649,074 6,990,226Total
Main Occupation Groups Total Female Male
Tab le 6
Number of employees by main occupation groups 2017

Employment and Wages Survey 2017
18
1 - 5 6 - 49 50 - 249 250
1 Agriculture, Forestry and Fishing 3,610 4,244 4,194 4,056 3,776
2 Industrial Sector 24,224 24,151 22,227 16,003 16,988
3 Construction 5,044 5,912 6,390 6,943 6,522
4 Trade, Accommodation and Food 4,768 4,768 4,391 4,247 4,707
5 Transportation, Information & communication 11,984 11,383 11,306 8,636 9,845
6 Financial, Insurance & Real estate 13,950 13,017 14,785 14,347 13,099
7 Professional, scientific and technical activities 7,544 7,571 8,592 8,648 7,944
8 Administrative and support service activities 4,141 4,386 4,446 5,989 5,014
9 Education 4,062 4,429 5,110 4,109 4,585
10 Human health and social work activities 4,466 5,675 6,127 6,493 6,042
11 Arts, entertainment and recreation 4,743 4,817 4,732 4,780 4,780
12 Other services 4,190 2,996 3,098 3,587 3,835
5,359 6,861 7,623 9,897 7,372
Table 7
Average
Economic ActivityLargeMediumSmallMicro
Average salary for Saudi employees by establishment size and
economic activity 2017
Average

Employment and Wages Survey 2017
19
1 - 5 6 - 49 50 - 249 250
1 Agriculture, Forestry and Fishing 1,337 1,572 1,553 1,502 1,399
2 Industrial Sector 8,972 8,945 8,232 5,927 6,292
3 Construction 1,868 2,190 2,367 2,572 2,415
4 Trade, Accommodation and Food 1,766 1,766 1,626 1,573 1,743
5 Transportation, Information & communication 4,439 4,216 4,188 3,199 3,646
6 Financial, Insurance & Real estate 5,167 4,821 5,476 5,314 4,852
7 Professional, scientific and technical activities 2,794 2,804 3,182 3,203 2,942
8 Administrative and support service activities 1,534 1,624 1,647 2,218 1,857
9 Education 1,504 1,640 1,893 1,522 1,698
10 Human health and social work activities 1,654 2,102 2,269 2,405 2,238
11 Arts, entertainment and recreation 1,757 1,784 1,752 1,770 1,770
12 Other services 1,552 1,110 1,147 1,329 1,420
1,985 2,541 2,823 3,665 2,731
Table 8
Average
Economic ActivityLargeMediumSmallMicro
Average salary for non-Saudi employees by establishment size and
economic activity 2017
Average
Employment and Wages Survey 2017
20
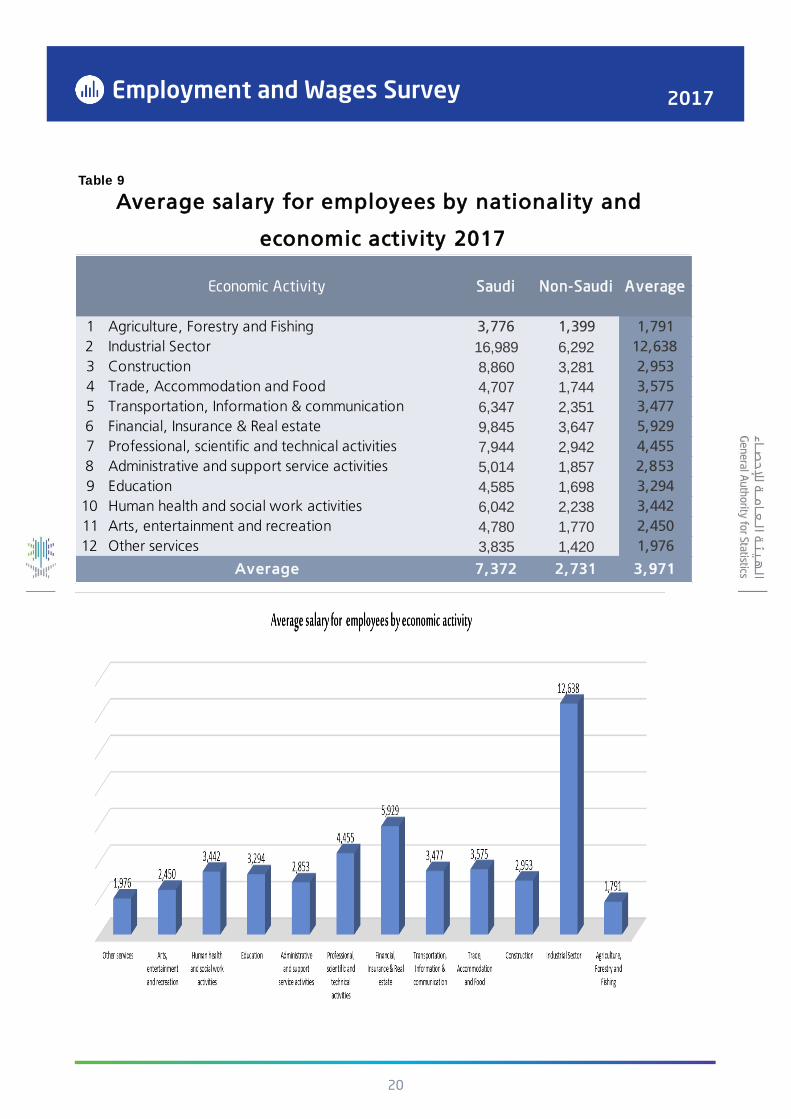
1 Agriculture, Forestry and Fishing 3,776 1,399 1,791
2 Industrial Sector 16,989 6,292 12,638
3 Construction 8,860 3,281 2,953
4 Trade, Accommodation and Food 4,707 1,744 3,575
5 Transportation, Information & communication 6,347 2,351 3,477
6 Financial, Insurance & Real estate 9,845 3,647 5,929
7 Professional, scientific and technical activities 7,944 2,942 4,455
8 Administrative and support service activities 5,014 1,857 2,853
9 Education 4,585 1,698 3,294
10 Human health and social work activities 6,042 2,238 3,442
11 Arts, entertainment and recreation 4,780 1,770 2,450
12 Other services 3,835 1,420 1,976
7,372 2,731 3,971
Table 9
Average
Economic Activity AverageNon-SaudiSaudi
Average salary for employees by nationality and
economic activity 2017

Employment and Wages Survey 2017
21
1 Lawmakers, managers and executive directors 13,762 5,246 11,368
2 Specialists in Professional, Technical and Humanitarian Fields 15,983 8,479 13,631
3 Technicians in Professional, Technical and Humanitarian Fields 8,720 6,053 7,765
4 Clerical work 7,734 4,490 6,389
5 Sales 4,946 3,761 4,396
6 Services 6,221 4,334 5,961
7 Occupations of Agriculture, Animal Husbandry & Fishing 5,369 3,648 5,145
8 Occupations of Industrial , Chemical Operations and Food 9,470 4,023 8,197
9 Occupations of Supporting Basic Engineering 6,745 4,006 6,520
8,388 4,939 7,372
Table 10
Average salary for Saudi employees by sex and main occupation
groups 2017
Main Occupation Groups
Total
Total Female Male

Employment and Wages Survey 2017
22
Employment and Wages Survey 2017
23
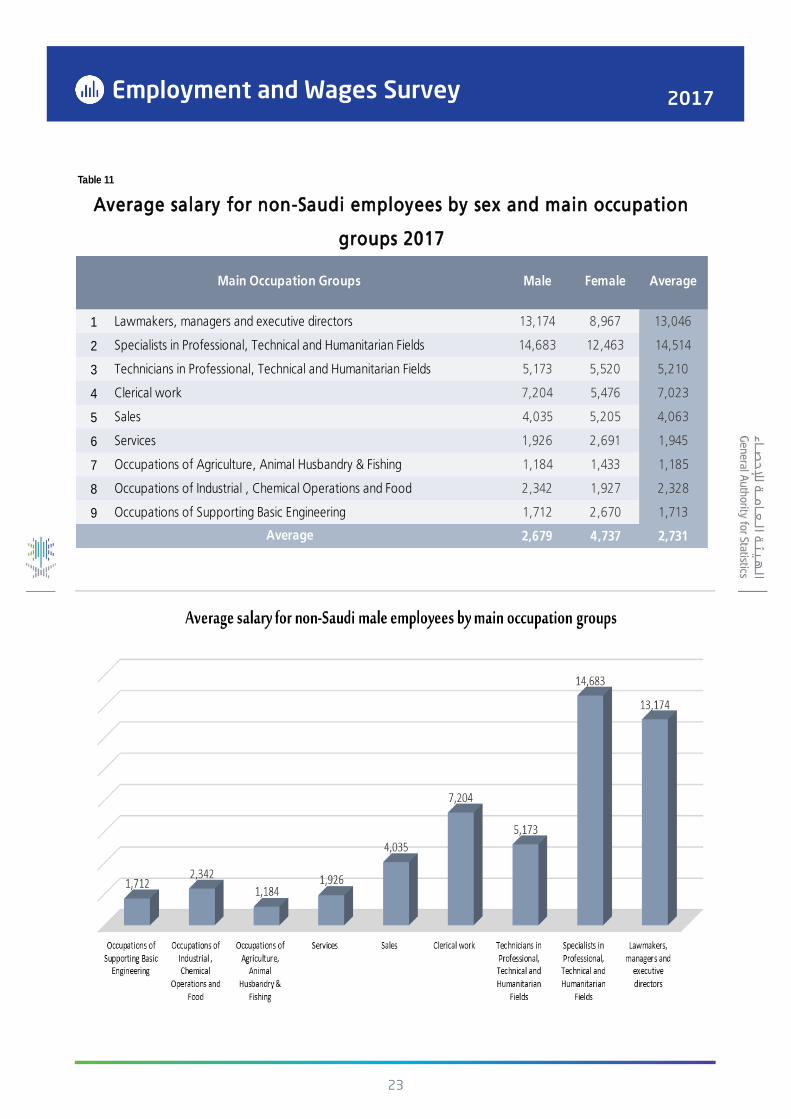
1 Lawmakers, managers and executive directors 13,174 8,967 13,046
2 Specialists in Professional, Technical and Humanitarian Fields 14,683 12,463 14,514
3 Technicians in Professional, Technical and Humanitarian Fields 5,173 5,520 5,210
4 Clerical work 7,204 5,476 7,023
5 Sales 4,035 5,205 4,063
6 Services 1,926 2,691 1,945
7 Occupations of Agriculture, Animal Husbandry & Fishing 1,184 1,433 1,185
8 Occupations of Industrial , Chemical Operations and Food 2,342 1,927 2,328
9 Occupations of Supporting Basic Engineering 1,712 2,670 1,713
2,679 4,737 2,731
Table 11
Average salary for non-Saudi employees by sex and main occupation
groups 2017
Main Occupation Groups
Average
AverageFemale Male

Employment and Wages Survey 2017
24
Employment and Wages Survey 2017
25
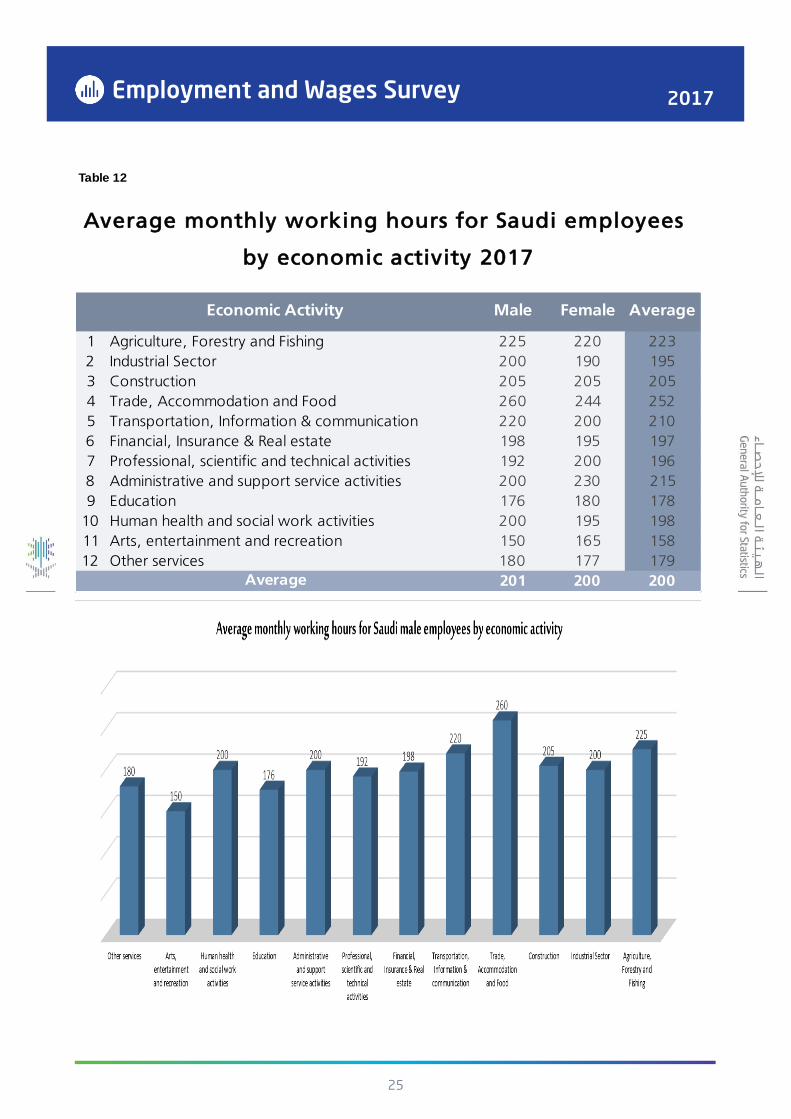
1 Agriculture, Forestry and Fishing 225 220 223
2 Industrial Sector 200 190 195
3 Construction 205 205 205
4 Trade, Accommodation and Food 260 244 252
5 Transportation, Information & communication 220 200 210
6 Financial, Insurance & Real estate 198 195 197
7 Professional, scientific and technical activities 192 200 196
8 Administrative and support service activities 200 230 215
9 Education 176 180 178
10 Human health and social work activities 200 195 198
11 Arts, entertainment and recreation 150 165 158
12 Other services 180 177 179
201 200 200
Table 12
Average monthly working hours for Saudi employees
by economic activity 2017
Average
Economic Activity AverageFemale Male

Employment and Wages Survey 2017
26

Employment and Wages Survey 2017
27
1 Agriculture, Forestry and Fishing 280 200 240
2 Industrial Sector 265 266 266
3 Construction 270 200 235
4 Trade, Accommodation and Food 250 255 253
5 Transportation, Information & communication 220 210 215
6 Financial, Insurance & Real estate 205 201 203
7 Professional, scientific and technical activities 200 206 203
8 Administrative and support service activities 209 150 180
9 Education 188 178 183
10 Human health and social work activities 220 209 215
11 Arts, entertainment and recreation 180 165 173
12 Other services 199 198 199
224 203 214
Table 13
Economic Activity
Average
AverageFemaleMale
Average monthly working hours for non-Saudi
employees by economic activity 2017

Employment and Wages Survey 2017
28

Employment and Wages Survey 2017
29
1 Agriculture, Forestry and Fishing 253 210 231
2 Industrial Sector 233 228 230
3 Construction 238 203 220
4 Trade, Accommodation and Food 255 250 252
5 Transportation, Information & communication 220 205 213
6 Financial, Insurance & Real estate 202 198 200
7 Professional, scientific and technical activities 196 203 200
8 Administrative and support service activities 205 190 197
9 Education 182 179 181
10 Human health and social work activities 210 202 206
11 Arts, entertainment and recreation 165 165 165
12 Other services 190 188 189
212 202 207
Table 14
Economic Activity
Average
AverageFemale Male
Average monthly working hours for total employees
by economic activity 2017

Employment and Wages Survey 2017
30
Employment and Wages Survey 2017
31
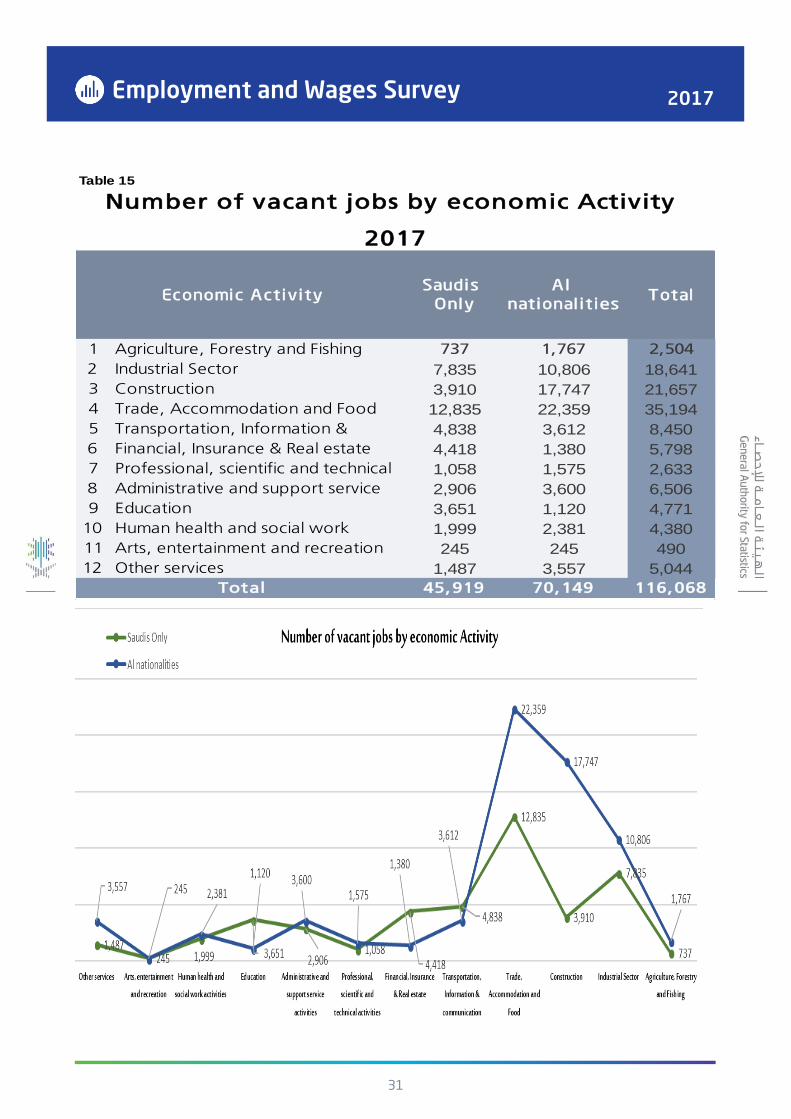
1 Agriculture, Forestry and Fishing 737 1,767 2,504
2 Industrial Sector 7,835 10,806 18,641
3 Construction 3,910 17,747 21,657
4 Trade, Accommodation and Food 12,835 22,359 35,194
5 Transportation, Information & 4,838 3,612 8,450
6 Financial, Insurance & Real estate 4,418 1,380 5,798
7 Professional, scientific and technical 1,058 1,575 2,633
8 Administrative and support service 2,906 3,600 6,506
9 Education 3,651 1,120 4,771
10 Human health and social work 1,999 2,381 4,380
11 Arts, entertainment and recreation 245 245 490
12 Other services 1,487 3,557 5,044
45,919 70,149 116,068
Table 15
Total
Economic Activity TotalAl
nationalities
Saudis
Only
Number of vacant jobs by economic Activity
2017
Employment and Wages Survey 2017
32
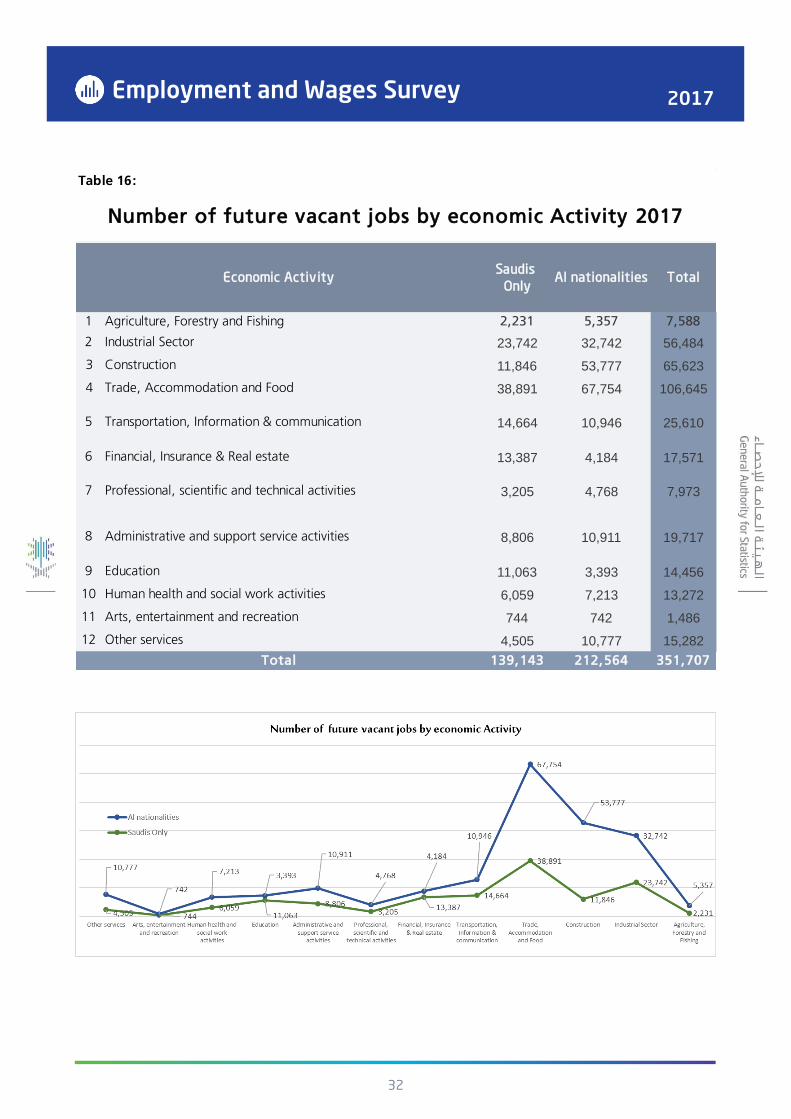
Table 16:
1 Agriculture, Forestry and Fishing 2,231 5,357 7,588
2 Industrial Sector 23,742 32,742 56,484
3 Construction 11,846 53,777 65,623
4 Trade, Accommodation and Food 38,891 67,754 106,645
5 Transportation, Information & communication 14,664 10,946 25,610
6 Financial, Insurance & Real estate 13,387 4,184 17,571
7 Professional, scientific and technical activities 3,205 4,768 7,973
8 Administrative and support service activities 8,806 10,911 19,717
9 Education 11,063 3,393 14,456
10 Human health and social work activities 6,059 7,213 13,272
11 Arts, entertainment and recreation 744 742 1,486
12 Other services 4,505 10,777 15,282
139,143 212,564 351,707Total
Economic Activity TotalAl nationalities Saudis
Only
Number of future vacant jobs by economic Activity 2017
stats.gov.sa