employer survey highlights from six low- and middle …
TRANSCRIPT

EMPLOYER SURVEY
Snapshot–2016
Highlights from Six Low- and Middle-Income Countries
1700961_STEP_Snapshot_Cover.indd 3 9/8/16 1:01 PM
Pub
lic D
iscl
osur
e A
utho
rized
Pub
lic D
iscl
osur
e A
utho
rized
Pub
lic D
iscl
osur
e A
utho
rized
Pub
lic D
iscl
osur
e A
utho
rized

EMPLOYER SURVEYSNAPSHOT—2016
THE WORLD BANKwww.worldbank.org
1700961_STEP_Snapshot.indd 1 9/8/16 3:04 PM

This snapshot was prepared by a team comprising Maria Laura Sanchez Puerta, Alexandria Valerio, Margo Hoftijzer, Anam Rizvi and Johanna Avato. The team appreciates the leadership and technical support pro-vided by Luis Benveniste, David Robalino and Mary Hallward-Driemeier. Helpful peer review comments were received from Halil Dundar, Johannes Koettl and Michael Weber.
World Bank regional teams were led by Meskerem Mulatu (Armenia, Azerbaijan and Georgia), Johannes Koettl and Indhira Santos (Macedonia), Halil Dundar (Sri Lanka), and Xiaoyan Liang (Yunnan Province, China).
The program received technical support from Emanuela DiGropello, John Earle, David Margolis and Gaelle Pierre. Financial support to implement the STEP skills measurement surveys was received from the Multi Donor Trust Fund for Labor Markets, Job Creation and Economic Growth (MDTF).
1700961_STEP_Snapshot.indd 2 9/8/16 3:04 PM
3
Measuring Skills for Employment and Productivity
How does skills mismatch affect employers in the modern economy?
This snapshot features a descriptive analysis of the data collected during the STEP Employer Survey. The issues highlighted here can be further investigated by researchers and policy-makers interested in using survey tools to discuss skills availability and needs in the labor and education policy contexts. Patterns are provided from the six countries where the sur-vey was deployed—namely, Armenia, Azerbaijan, Georgia, Sri Lanka, Vietnam and China (Yunnan Province only). Detail on each individual country is available in reports featured online. The following sections will discuss how employers view jobs mis-match, identify skills employers’ value in their work-ers, provide insights into innovative employers and, finally, illustrate training provision by employers.
Economic growth depends on skills being put to productive use. In recent years, research on labor outcomes and education has converged on the unanimous conclusion that there is a substan-tial mismatch between the supply of and demand for skills around the world (Cappelli, 2014: McIn-tosh and Vignoles, 2001). This mismatch affects more than just wages or individual job satisfaction. Skill mismatches have an impact on productivity and growth at both the firm level and the macro- economic levels (Quintini, 2014). Reports show that firms around the world consider skill challenges to be an impediment to the operation and develop-ment of their business. A cause for further concern is that this constraint seems to be disproportion-ately affecting the more dynamic and innovative employers, signifying a potentially negative impact on job creation and technological progress (World Bank, 2012).
It is essential to provide employers with a voice in the skills mismatch debate. The debate over the “skills gap” (a deficiency in basic skills inherent in the flow of workers entering the workforce), the “skills shortage” (a lack of technical skills in the stock of workers available for specific occupations)
and the “skills mismatch” (a case of under-supply or over-supply of qualified workers) has thus far been primarily focused on improving individual well- being (Cappelli, 2014). However, in order to make the most of investing in the skill set of a workforce, there is a need to understand how these skills will be put to use in the current labor market (Quin-tini, 2014). The potential contribution of skills to improving productivity and employment outcomes needs to be fully exploited, and this depends largely on understanding the ‘demand’ side of skills. Most attempts to measure this disparity have been focused on measuring the level of ‘education’ of workers in various occupations (Quintini, 2014) or comparing earnings across these occupations (Pot-ter, 2002). However, as the focus shifts to the skills-shortage, there is a growing need to separately identify the role of ‘skills’ in this mismatch and, especially, to collect evidence on the labor market value of any particular skills-profile (McIntosh and Vignoles, 2001).
Identifying the most relevant competencies and employable skills will help inform labor force and education policy. Current data measuring skill demands are argely posited on the ‘stated prefer-ences’ of the employers surveyed. However, this approach does not provide enough evidence to show what skill set is actually valued or utilized by the workers in a role (Cunningham, Villasenor, and World Bank, 2014). This exposes the need to cap-ture data that could suggest the ‘revealed prefer-ence’ employers have for a certain skill, for example, when deciding to retain an employee beyond the probation period, and also exposes the need to identify the skills that existing employees use most regularly. This information could be used to guide policies targeted at skill development for the cur-rent workforce, re-employment strategies, prepara-tion of workers entering the job market, and so on (Peterson et al., 2001).
1700961_STEP_Snapshot.indd 3 9/8/16 3:04 PM

4 Measuring Skills for Employment and Productivity
The Skills Towards Employment and Productivity (STEP) Skills Measurement Program aims to con-tribute to the knowledge base and inform policies targeted at improving the alignment between skill supply and demand. Tools developed for the STEP
Program comprise an Employer Survey (designed to identify skill demand and constraints using data from employers) and a Household Survey (devel-oped to measure the generic skills of the working- age population).
1700961_STEP_Snapshot.indd 4 9/8/16 3:04 PM

5
STEP Skills Measurement Program— Snapshot 2016
Skills Towards Employment and Productivity (STEP)—Employer Survey
The STEP Employer Survey (STEP ES) is designed to enable us to better understand how employers view the skills and characteristics of their work-ers and the challenges employers face in recruit-ing workers with the desired skills. The survey collects information on the skills that employers look for when they recruit staff, the skills that staff most often apply, the skills-related constraints that employers face, and the way employers attempt to mitigate skill constraints, such as through training and exchanges with education and training provid-ers. The survey also captures firm characteristics, the environment in which employers operate, and the structure of their workforce.1
Several innovations have been applied to the sur-vey design as compared to traditional enterprise surveys. Firstly, the information about skill use, skill demand, training, and remuneration is gathered concerning two randomly selected types of work-ers from among the types of workers each firm employs. The STEP ES identifies the two workers types, as follows:
1. Type A or white-collar workers: Workers whose job profiles which generally require higher skill levels, including managers, professionals, and technicians.
2. Type B or blue-collar workers: Workers whose job profiles which tend to require medium or low skill levels; this type includes clerical sup-port workers, service workers, sales workers, skilled agricultural workers, craft and related trade workers, plant and machine operators, and elementary occupations.
Secondly, the survey identifies and assesses three main skill domains:
(1) cognitive skills, (2) job-related technical skills (both of which are categorized under job-related skills) and (3) socio-emotional skills (categorized under personality traits). In addition to this, per-sonal characteristics of hired employees are also assessed.
Thirdly, in addition to generating data on the hiring process, the survey collects information on skills used by experienced workers by asking questions on the day-to-day activities of randomly selected occupations. This allows for an identification of the actual importance of particular skill types across dif-ferent occupations. Finally, the survey questionnaire has been designed with straight-forward questions, applicable to employers of all sizes.
In order to determine whether an employer can be categorized as innovative, questions related to research and development (R&D) have been added to the survey’s background characteristics module. Innovative employers are defined as those who have, in the past three years, introduced any new or significantly improved products, services, manu-facturing or logistical processes, management prac-tices, or other similar innovations and have spent on R&D.
The findings included in this snapshot are based on the first two waves of the STEP Employer Sur-veys carried out in six countries: Armenia, Azer-baijan, China (Yunnan Province only), Georgia, Sri Lanka, and Vietnam. The information presented is
1. For further information on the methodology for the ES, see G. Pierre, M. L. Sanchez Puerta, A. Valeria and T. Rajadel. STEP Skills Measurement Survey—Innovative Tools for Assessing Skills. World Bank Social Protection and Labor Discussion Paper No. 1421 (July, 2014) (Washington, D.C: World Bank).
1700961_STEP_Snapshot.indd 5 9/8/16 3:04 PM

6 STEP Skills Measurement Program—Snapshot 2016
not meant to be exhaustive or definitive, but rather serves to illustrate the scope and depth of policy- relevant information that may be derived from the STEP ES. While differences in the applied sampling methodology across surveys imply that findings are not fully comparable across countries, the report-ing of results for the different surveys nonetheless allows an identification of broad patterns that occur across countries.3
Step Employer Survey Coverage, by Country
CountrySurvey Year
Sample Size
Economic Sectors
Wav
e 1
Azerbaijan 2013 300 firms Non-public Secondary and Tertiary sector enterprises2
Sri Lanka 2012 600 firms
Vietnam 2012 300 firms
Yunnan Province, China
2012 300 firms
Wav
e 2 Armenia 2013 400 firms
Georgia 2013 400 firms
2. Sri Lanka excludes real estate. Azerbaijan excludes land, water and air transportation; wood processing, pulp and paper; tobacco manufacturing; and recycling. Georgia only includes tourism; construction; IT; and telecommunication. Armenia only includes food processing; fishing; mining; manufacturing; electricity, gas and waterworks; construction; wholesale; retail trade; repair of motor vehicles, motorcycles and household goods; hotels and restaurants; transporta-tion; financial services; and real estate. 3. See Annex 2—Technical Supplement and Tables for further information on sampling design and results.
Category Skills
Job-Related Skills ► Reading and writing ► Numeracy ► Reading and writing in English/
other foreign language ► Job-specific technical skills ► Communication ► Leadership ► Team work ► Creative and critical thinking ► Problem solving ► Working independently ► Time management
Personality Traits ► Conscientiousness (does a thorough job, is hard-working, does things efficiently)
► Emotional stability (is relaxed and handles stress well, doesn’t worry or get nervous easily)
► Agreeableness (forgives other people easily, is considerate and kind, is polite)
► Extraversion (is talkative, assertive outgoing, and sociable)
► Openness to experience (is original and comes up with new ideas, has an active imagination)
Personal Characteristics
► Age ► Appearance ► Ethnicity ► Gender ► Family relations or personal ties
1700961_STEP_Snapshot.indd 6 9/9/16 10:23 AM

STEP Skills Measurement Program—Snapshot 2016 7
Key Findings:
► Substantial shares of employers face diffi-culties when trying to recruit new staff due to a “lack of required skills in candidates.” Interestingly, employers tend to be some-what more positive about the qualifications of white collar workers rather than blue col-lar workers. Other constraints include wage expectations, low applicant numbers and dis-satisfaction with working conditions.
► Large shares of employers find that the gen-eral education and TVET system does not pro-vide individuals with the required ‘practical’ skills and consider the general education and, especially, the TVET of their workers as a con-straint on the operation and growth of their business.
► Employers in all countries tend to attach the most value to job-specific technical skills of their workers.
► White collar workers apply more skills in their day-to-day activities than blue collar work-ers. The incidence and level of complexity of computer use is also comparatively higher for white collar workers.
► Significantly, innovative firms tend to experi-ence problems in recruiting staff much more than traditional firms and are more critical of the current skill-levels of workers. Innova-tive employers also report a higher provision of training and skill intensity for both worker types across all countries.
► In most countries, relatively few firms have regular interactions with education and train-ing institutions. These interactions are primar-ily focused on serving employers’ short-term needs, e.g. recruiting.
► Employers rely to a large extent on in-firm training rather than external training to upgrade the skills of their current employees.
1700961_STEP_Snapshot.indd 7 9/8/16 3:04 PM

8
Learning How Employers View Job Mismatch in the Economy
Visualizing the Gaps in Skill Demand and Supply
The debate over the “skills gap” (a deficiency in basic skills inherent in the flow of workers entering the workforce), “skills shortage” (a lack of techni-cal skills in the stock of workers available for spe-cific occupations) and “skills mismatch” (a case of under-supply or over-supply of qualified workers) has become an essential component of labor market discussions (Cappelli 2014). The STEP Employer Sur-veys are designed to provide employers with a voice in this debate, specifically in assessing the level of skills prevalent among job applicants and typical workers at these firms.
Employers report a lack of sufficiently skilled job candidates. The lack of sufficiently skilled candi-dates poses the greatest constraint on recruitment, according to employers. Across most countries sur-veyed, employers also report that their firms face a greater challenge hiring adequately skilled white- collar workers than blue-collar workers. The excep-tion is Yunnan Province (China) where employers
reported a slightly higher challenge recruiting blue collar workers with required skill sets.
Hiring difficulties in general are reported by sub-stantial shares of employers across all the countries surveyed—with the highest share being 95% of sampled firms in Yunnan Province (China) in regard to both white- and blue-collar workers. A notable exception is Georgia, where fewer firms, sampled from the tourism, construction, IT, and telecommu-nication industries, found hiring to be a challenge.
Substantial shares of employers across all coun-tries surveyed consider their employees to be “not fully-qualified.” These shares range from one-third to two-thirds of reporting firms. It is interesting to note that, in contrast to the recruiting concerns noted above, when asked about their current work-ers employers are more critical about the qualifica-tions of their blue collar workers.4
Employers have a negative attitude toward the general education and TVET systems, primarily
Figure 1: Applicants Lacking Required Skills as the Greatest Recruitment Challenge, Armenia and Vietnam
0
20
40
60
80
100
White-Collar Blue-Collar White-Collar Blue-Collar
Armenia Vietnam
Per
cent
age
of E
mpl
oyer
s (%
)
Applicant Lacked Skills
Wage Expectations
Number of Applicants
Working Conditions
Challenges for Recruitment Figure 2: Substantial Recruiting Problems Reported Across All Countries Surveyed
0
20
40
60
80
100
Armenia
Vietnam
Per
cent
age
of E
mpl
oyer
s (%
)
White-Collar Blue-Collar
Georgia
Azerbaijan
Sri Lanka
Yunnan
Employers Reporting Hiring Difficulties
4. See Annex 1 Figure 1A, “Perceptions of blue collar worker qualifications across all countries surveyed.”
1700961_STEP_Snapshot.indd 8 9/8/16 3:04 PM

Learning How Employers View Job Mismatch in the Economy 9
Figure 3: Employers Perception of Shares of Workers Not Fully-Qualified, Vietnam and Yunnan Province
0
10
20
30
40
50
60
Per
cent
age
of E
mpl
oyer
s (%
)
White-Collar Blue-Collar White-Collar Blue-Collar
Vietnam Yunnan Province
100% Qualified
80–99% Qualified
51–79% Qualified
1–50% Qualified
Level of Worker QualificationFigure 4: Employer Perceptions of Where General Education and TVET Systems Fall Short, Armenia
Practical Skills
Updated Knowledge
Level of Skills
Kind of Skills
Good Attitude
General EducationTVET
0 20 40 60 80
Percentage of Employers (%)
Deficiencies in the General Education and TVET
5. See Annex 1 Figure 1B, “Share of employers reporting both recruiting constraints and negative perceptions of the gen-eral education and TVET, Georgia.”6. See Annex 1 Figure 1C “Employers considering general education and TVET as a constraint on firm operation and growth across all countries.”
because they believe these institutions are unable to produce candidates with the requisite ‘prac-tical skills.’ There is also concern regarding a lack of up-to-date knowledge and the general level of skills imparted. It is worth noting, however, that few employers feel that these systems produce gradu-ates lacking ‘good attitudes’; the focus of their criti-cism is on job-specific technical skills.
Both employers reporting hiring constraints and those more critical of their workers’ qualifications are both more likely than other employers to con-sider the general education and TVET system as ‘problematic.’5 This holds true across all countries surveyed.
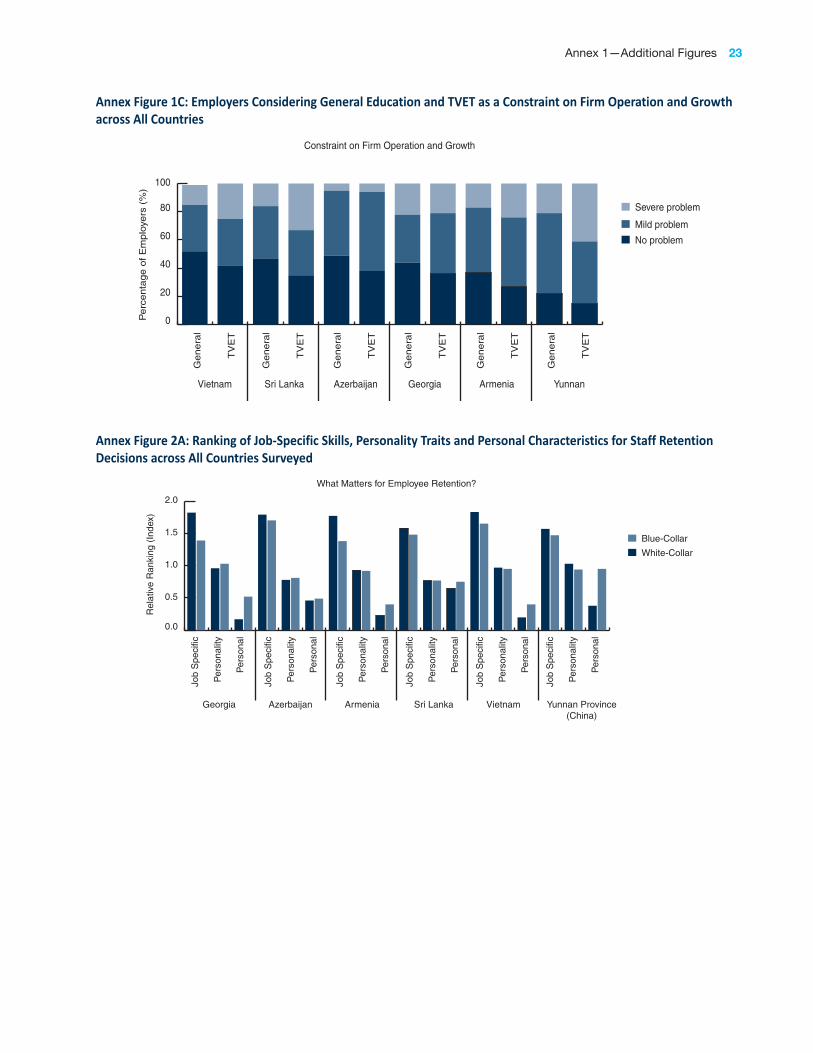
A substantial share of employers across countries feel that the general education and the TVET sys-tem (in particular) pose a constraint to the opera-tion and growth of their firms.6 The lowest share of
Figure 5: Lack of Previous Experience and Various Labor Constraints to Business Operation and Growth, Sri Lanka, Vietnam and Armenia
Previous Work Experience
High Job Turnover
TVET
Labor Availability
General Education
Payroll Taxes
Overall Wage Level
Employment Protection
Minimum Wage
Index (4 = highest)
0 1 2 3 4
Sri Lanka
Vietnam
Armenia
Importance of Labor Constraints
1700961_STEP_Snapshot.indd 9 9/8/16 3:04 PM

10 Learning How Employers View Job Mismatch in the Economy
employers holding this view is in Vietnam, but even there as much as 48% and 58% of surveyed employ-ers regard general education and TVET, respectively, as posing constraints. Compared to other labor con-straints however, the general education and TVET systems vary in significance.
Finding workers with previous experience is a sig-nificant labor constraint on business operation and growth. This difficulty in finding experienced work-ers features as the top constraint in all countries
except Armenia, where payroll taxes are considered a greater deterrent. This may also suggest further dissatisfaction with the level of skills the workforce currently possesses as well as indicate a potential unwillingness to provide employees with training upon hiring.
Among other constraints to doing business, such as tax rates and political uncertainty, the perceived impacts of labor constraints vary substantially among the countries surveyed.
1700961_STEP_Snapshot.indd 10 9/8/16 3:04 PM

11
Identifying Skills Valued by Employers: The Right Skills for the Job
Understanding the Demand
Current data measuring skill demands are posited on employers’ ‘stated preferences,’ yet this is often considered as a shortcoming when attempting to identify the skill-profiles valued by employers (Cun-ningham, Villasenor, and World Bank, 2014). To avoid this, the STEP Employer Survey module on new hiring attempts to uncover possible ‘revealed pref-erence’ in skills, by determining what skills employ-ers look for when deciding to retain an employee beyond the probation period. The survey module further reviews those skills that are used most regu-larly by the existing workforce.
Job-specific technical skills are prioritized by employers when they make retention decisions for both white- and blue-collar workers. The sec-ondary criteria for retaining new hires vary among worker types. Across all countries, leadership skills and numeracy skills are ranked as most important to
retaining white-collar workers. For blue-collar work-ers, communication skills and the ability to work independently are most valued.
When asked to compare job-relevant skills against per-sonality traits and personal characteristics,7 employ-ers place job-relevant skills such as communication and problem-solving on the job relatively higher. This result has been the same across all countries surveyed. An interesting difference is that although preferences follow the same ranking pattern for the two types of workers, personal characteristics play a more pivotal role than personality traits for blue collar workers.8
White collar workers use a larger number of skills and apply them more regularly in their jobs. This holds true across almost all countries with the excep-tion of Yunnan Province, where blue collar workers are reported to require the use of an equally high
Figure 6: The Importance of Job Specific Skills for the Retention of White- and Blue-Collar Workers, Vietnam
Literacy
NumeracyForeign Language
Technical SkillsCommunication
Leadership
TeamworkCritical Thinking
Problem Solving
Working Independently
Time Management
Blue-CollarWhite-Collar
Relative Ranking (Index)
0 1 2 3 4
Ranking Skills for Retention
7. The personality traits identified in the STEP ES are conscientiousness, agreeableness, emotional stability, extraversion and openness to experience. Personal characteristics included are age, appearance, gender, and family relations/personal ties. 8. See Annex 1 Figure 2A, “Ranking job-specific skills, personality traits and personal characteristics for staff retention decisions across all countries surveyed.”
Figure 7: Skill Usage on the Job by White- and Blue-Collar Workers, Armenia
Foreign language
Writing
Presentations
Problem Solving
Reading
Mathematics
Teamwork
Blue-CollarWhite-Collar
Share of Workers (%)
0 20 40 60 80 100
Skills Used Regularly on the Job
1700961_STEP_Snapshot.indd 11 9/8/16 3:04 PM

12 Identifying Skills Valued by Employers: The Right Skills for the Job
number of skills in their roles.9 A ranking of skills most used on the job reveals the top skills to be teamwork, numeracy, and, to a lesser extent, read-ing. This holds true for both types of workers.
The survey goes further to determine if these pat-terns exist in firms of different sizes. It finds that whereas for white-collar workers skill usage for
each identified skill typically increases as firm size increases, for blue-collar workers the patterns of skill intensity and firm sizes vary across countries. For example, in Vietnam the use of mathematics by blue-collar workers is higher in smaller firms (47%) than in larger firms (25%). This pattern varies with each identified skill and by country.
9. See Annex 1 Figure 2B, “Number of different skills that workers regularly use in Azerbaijan and Yunnan, share of workers.”
Figures 8a and 8b: Skill Usage by Firm Size for Each Worker Type, Sri Lanka and Vietnam
Rea
ding
Writ
ing
Mat
h
Pro
blem
Sol
ving
Fore
ign
Lang
uage
Pre
sent
atio
ns
Team
wor
k
MediumLarge Small
0
20
40
60
80
100
Sha
re o
f Wor
kers
(%
)
Sri Lanka
Rea
ding
Writ
ing
Mat
h
Pro
blem
Sol
ving
Fore
ign
Lang
uage
Pre
sent
atio
ns
Team
wor
k
0
20
40
60
80
100
Sha
re o
f Wor
kers
(%
)
Vietnam
White-Collar Workers
Rea
ding
Writ
ing
Mat
h
Pro
blem
Sol
ving
Fore
ign
Lang
uage
Pre
sent
atio
ns
Team
wor
k
MediumLarge Small
0
20
40
60
80
100
Sha
re o
f Wor
kers
(%
)
Sri Lanka
Rea
ding
Writ
ing
Mat
h
Pro
blem
Sol
ving
Fore
ign
Lang
uage
Pre
sent
atio
ns
Team
wor
k
0
20
40
60
80
100
Sha
re o
f Wor
kers
(%
)
Vietnam
Blue-Collar Workers
1700961_STEP_Snapshot.indd 12 9/8/16 3:04 PM

Identifying Skills Valued by Employers: The Right Skills for the Job 13
Figures 9a and 9b: Incidence of Computer Use and Level of Complexity for Each Worker Type in Large, Medium and Small Firms, Sri Lanka
Blue-CollarWhite-Collar
MediumLarge Small
0
20
40
60
80
100S
hare
of W
orke
rs (
%)
Incidence of Computer Use
Complex
Specialized
Straightforward
Moderate
MediumLarge Small MediumLarge Small
Sha
re o
f Wor
kers
(%
)
Complexity of Computer Use
0
10
20
30
40
50
White-Collar Blue-Collar
Both the incidence and the level of complexity of computer use are higher for white-collar workers across all countries. The complexity of computer use also increases with firm size in all countries with the exception of Armenia and Yunnan Province,
where it is relatively higher in medium-sized firms. (Both of these patterns are captured for the share of workers who are required to use a computer as part of their daily role.)
1700961_STEP_Snapshot.indd 13 9/8/16 3:04 PM
14
Capturing Requirements for Innovative Firms
Factoring in the Potential
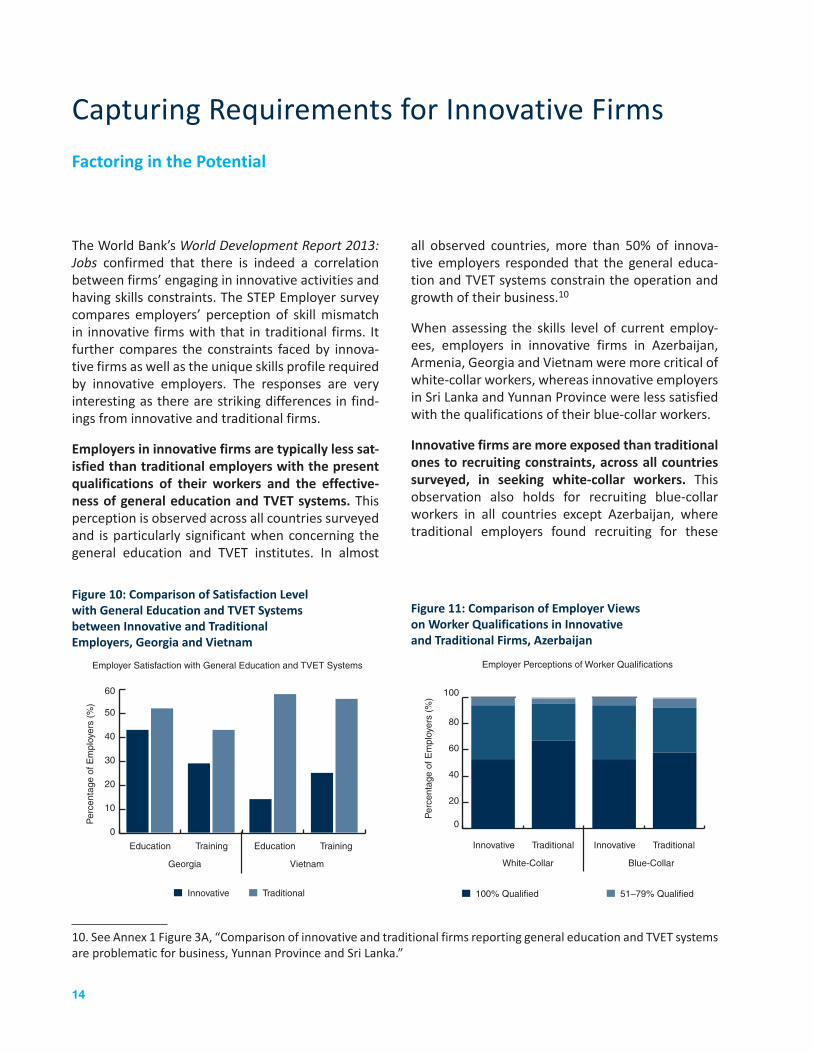
The World Bank’s World Development Report 2013: Jobs confirmed that there is indeed a correlation between firms’ engaging in innovative activities and having skills constraints. The STEP Employer survey compares employers’ perception of skill mismatch in innovative firms with that in traditional firms. It further compares the constraints faced by innova-tive firms as well as the unique skills profile required by innovative employers. The responses are very interesting as there are striking differences in find-ings from innovative and traditional firms.
Employers in innovative firms are typically less sat-isfied than traditional employers with the present qualifications of their workers and the effective-ness of general education and TVET systems. This perception is observed across all countries surveyed and is particularly significant when concerning the general education and TVET institutes. In almost
all observed countries, more than 50% of innova-tive employers responded that the general educa-tion and TVET systems constrain the operation and growth of their business.10
When assessing the skills level of current employ-ees, employers in innovative firms in Azerbaijan, Armenia, Georgia and Vietnam were more critical of white-collar workers, whereas innovative employers in Sri Lanka and Yunnan Province were less satisfied with the qualifications of their blue-collar workers.
Innovative firms are more exposed than traditional ones to recruiting constraints, across all countries surveyed, in seeking white-collar workers. This observation also holds for recruiting blue-collar workers in all countries except Azerbaijan, where traditional employers found recruiting for these
Figure 10: Comparison of Satisfaction Level with General Education and TVET Systems between Innovative and Traditional Employers, Georgia and Vietnam
TraditionalInnovative
TrainingEducation Education Training
Per
cent
age
of E
mpl
oyer
s (%
)
Employer Satisfaction with General Education and TVET Systems
0
10
20
30
40
50
60
Georgia Vietnam
Figure 11: Comparison of Employer Views on Worker Qualifications in Innovative and Traditional Firms, Azerbaijan
TraditionalInnovative TraditionalInnovative
Per
cent
age
of E
mpl
oyer
s (%
)
Employer Perceptions of Worker Qualifications
White-Collar Blue-Collar
0
20
40
60
80
100
100% Qualified
80–99% Qualified
51–79% Qualified
1–50% Qualified
10. See Annex 1 Figure 3A, “Comparison of innovative and traditional firms reporting general education and TVET systems are problematic for business, Yunnan Province and Sri Lanka.”
1700961_STEP_Snapshot.indd 14 9/8/16 3:04 PM

Capturing Requirements for Innovative Firms 15
Figure 12: Comparison of Innovative and Traditional Firms Reporting Recruitment Problems Across All Countries
Yunn
an
Vie
tnam
Sri
Lank
a
Aze
rbai
jan
Arm
enia
Geo
rgia
TraditionalInnovative
0
20
40
60
80
100P
erce
ntag
e of
Em
ploy
ers
(%)
White-Collar
Yunn
an
Vie
tnam
Sri
Lank
a
Aze
rbai
jan
Arm
enia
Geo
rgia
0
20
40
60
80
100
Per
cent
age
of E
mpl
oyer
s (%
)
Blue-Collar
Employers Reporting Recruitment Problems
Figure 14a: The Level of Computer Usage by Workers in Innovative and Traditional Firms, Yunnan Province
TraditionalInnovative
White-Collar Blue-Collar
0
20
40
60
80
100
Per
cent
age
of E
mpl
oyer
s (%
)
Level of Computer Use by Workers
Figure 13: Skill Intensity for Workers in Innovative and Traditional Firms, Georgia Skill Intensity in Innovative and Traditional Firms
Teamwork
Presentations
Foreign Language
Problem Solving
Math
Writing
Reading
Teamwork
Presentations
Foreign Language
Problem Solving
Math
Writing
Reading
TraditionalInnovative
Percentage of Employers (%)
0 20 40 60 80 100
Whi
te-C
olla
rB
lue-
Col
lar
Skills Intensity in Innovative and Traditional Firms Figure 14b: The Level of Complexity of Computer Use by Workers in Innovative and Traditional Firms, Yunnan Province
TraditionalInnovative TraditionalInnovative
Per
cent
age
of E
mpl
oyer
s (%
)
Complexity of Computer Use by Workers
White-Collar Blue-Collar
0
20
40
60
80
100
Straightforward
Moderate
Complex
Specialized
positions a greater constraint. In the case of Azer-baijan, this observation is determined for all enter-prises except those in the following sectors: land, water and air transportation; wood processing; pulp and paper; tobacco manufacturing; and recycling.
Skill intensity is higher for both worker types in innovative firms across all countries surveyed. The share of workers applying skills regularly is reported to be higher in innovative firms. However, a few specific skills are exceptions, such as writing skills
1700961_STEP_Snapshot.indd 15 9/8/16 3:04 PM
16 Capturing Requirements for Innovative Firms
among white-collar workers and team work and use of foreign languages among blue-collar workers, which are reportedly used more often in traditional firms.
The same is the case with the level and complexity of computer use. Workers tend to use computers more regularly in innovative firms and more of the use is typically for specialized and complex tasks, as compared with traditional firms, where usage is reported to be more straightforward or only moder-ately complex.
‘Critical thinking’ is a unique skill that is valued more highly by innovative firms than by traditional firms for both white- and blue-collar workers. This value is revealed when making retention decisions for new hires. For white-collar workers, innovative firms attach importance to technical skills, team work, and critical thinking. Similarly, for blue-collar work-ers, the skills these firms generally value more are critical thinking and leadership.
1700961_STEP_Snapshot.indd 16 9/8/16 3:04 PM

17
Learning If and How Employers Are Supplementing Their Training Needs
Accounting for All Tools and Resource
Recent literature points to a growing trend of employers spending fewer resources on training either new hires or existing workers and choosing instead to recruit employees already possessing the required skill sets (Cappelli, 2014). The STEP Employer Survey explores the propensity of firms to provide internal and external trainings to their employees in an effort to highlight any attempts being made to meet skill requirements.
White-collar workers receive more external train-ing and blue-collar workers receive more internal training, across all countries surveyed. External training refers to any training organized by the firm outside the workplace including but not limited to vocational training by public or private technical institutes, via equipment suppliers, or NGOs and international organizations. Internal training refers to training received on the premises of the work-place, such as on-the-job training or training by managers, other employees, dedicated firm trainers or even external consultants. Firms are found to rely
more on internal than external training to upgrade the skills of either type of worker. Larger firms pro-vide more training opportunities to their workers than smaller firms do.
Innovative firms provide significantly more inter-nal and external training to their employees than traditional firms. This difference between inno-vative and traditional firms is most pronounced concerning external training opportunities. An interesting exception is Yunnan Province, where internal training for both types of workers is approximately equally common in traditional and innovative firms.
Across most countries surveyed, less than 25% of employers have regular interactions with educa-tion and training providers. The only exception is Yunnan Province, where close to 60% of employers have linkages with such institutes. Effective interac-tions with education and training providers is con-sidered essential for improving the alignment of the
Figure 15: Incidence of Internal and External Training for Both Worker Types in Large, Medium, and Small Firms, Sri Lanka and Armenia
Per
cent
age
of E
mpl
oyer
s (%
)
White-Collar
Blue-Collar
White-Collar
Blue-Collar
White-Collar
Blue-Collar
White-Collar
Blue-Collar
Internal External Internal External
ArmeniaSri Lanka
0
10
20
30
40
50
60
70
80
MediumLarge Small
Incidence of Internal and External Training by Firm Size
100
1700961_STEP_Snapshot.indd 17 9/8/16 3:04 PM

18 Learning If and How Employers Are Supplementing Their Training Needs
Figure 17: Share of Employers Regularly Interacting with General Education and TVET Institutes, across All Countries Surveyed
0
10
20
30
40
50
60
Armenia
Vietnam
Per
cent
age
of E
mpl
oyer
s (%
)
White-Collar Blue-Collar
Georgia
Azerbaijan
Sri Lanka
Yunnan
Province
80
Employers Contacting General Education and TVET Institutes Regularly
Figure 18: Share of Innovative and Traditional Employers Regularly Contacting General Education and TVET Institutes, Georgia and Azerbaijan
TraditionalInnovative
Blue-CollarWhite-Collar White-Collar Blue-Collar
Per
cent
age
of E
mpl
oyer
s (%
)
0
5
10
15
20
Georgia Azerbaijan
Employers Contacting General Education and TVET Institutes Regularly
Figure 16: Incidence of Internal and External Training in Innovative and Traditional Firms, Azerbaijan and Yunnan Province
Per
cent
age
of E
mpl
oyer
s (%
)
White-Collar
Blue-Collar
White-Collar
Blue-Collar
White-Collar
Blue-Collar
White-Collar
Blue-Collar
Internal External Internal External
Yunnan ProvinceAzerbaijan
0
20
40
60
80
100
TraditionalInnovative
Incidence of Training in Innovative and Traditional Firms
1700961_STEP_Snapshot.indd 18 9/8/16 3:04 PM

Learning If and How Employers Are Supplementing Their Training Needs 19
Figure 19: Reasons behind Firms Contacting General Education and TVET Institutes, Yunnan Province and Armenia
Work PlacementRecruitment Training of Staff
Student TestingCurriculum Development
Blue-CollarWhite-Collar White-Collar Blue-Collar
Per
cent
age
of E
mpl
oyer
s (%
)
0
20
40
60
80
100
Yunnan Province Armenia
Purpose of Firm Interactions with General Education and TVET Institutes
demand and supply of skills. However, in most coun-tries the share of employers engaging with these institutes ranges from 4% to 22% and the engage-ment is most often related to white-collar workers.
Compared to traditional employers, innovative employers have more regular interactions with training institutes. In Georgia, innovative employers are four times as likely as traditional ones to have this contact.
These interactions are primarily focused on serving employers’ short-term needs, such as recruiting, work placements, and employee training. Far fewer firms engage in curriculum development or student testing, that is, in efforts to structurally improve the quality and relevance of skill supply.
1700961_STEP_Snapshot.indd 19 9/8/16 3:04 PM

20
References
Burrus, Jeremy, Teresa Jackson, Nuo Xi, and Jonathan Steinberg. 2013. “Identifying the Most Impor-tant 21st Century Workforce Competencies: An Analysis of the Occupational Information Net-work (O*NET)”. ETS Research Report Series.
Cappelli, Peter. 2014. “Skill Gaps, Skill Shortages and Skill Mismatches: Evidence for the US.” Working Paper no. 20382. Cambridge, Mass.: National Bureau of Economic Research.
Carnevale, Anthony P., Nicole Smith, Jeff Strohl, and Georgetown University. 2010. “Help Wanted: Projections of Jobs and Education Require-ments Through 2018.” Washington, DC: George-town University Center on Education and the Workforce.
Cunningham, Wendy, Paula Villasenor, and World Bank. 2014. “Employer Voices, Employer Demands, and Implications for Public Skills Development Policy.” Washington, DC: World Bank.
Liang, Xiaoyan, and Shuang Chen. 2013. “Developing Skills for Economic Transformation and Social Harmony in China: Study of Yunnan Province.” Directions in Development Series—Human Development. Washington, DC: World Bank.
McIntosh, Steven, and Anna Vignoles. 2001. “Mea-suring and Assessing the Impact of Basic Skills on Labour Market Outcomes.” Oxford Economic Papers 53(3): 453–81. Retrieved from http://www.jstor.org/stable/3488628
Pellizzari, Michele, and Anne Fichen. 2013. “A New Measure of Skills Mismatch: Theory and
Evidence from the Survey of Adult Skills (PIAAC).” OECD Social, Employment and Migration Work-ing Paper no. 153. Paris: OECD Publishing.
Peterson, Norman G., Michael D. Mumford, Wal-ter C. Borman, P. Richard Jeanneret, Edwin A. Fleishman, Kerry Y. Levin, Michael A. Campion, Melinda S. Mayfield, Frederick P. Morgeson, Kenneth Pearlman, Marilyn K. Gowing, Anita R. Lancaster, Marilyn B. Silver, and Donna M. Dye. 2001. “Understanding Work Using the Occu-pational Information Network (O*NET): Impli-cations for Practice and Research.” Personnel Psychology 54: 451–92.
Pierre, Gaëlle, Maria Laura Sanchez Puerta, Alex-andria Valerio, and Tania Rajadel. 2014. “STEP Skills Measurement Surveys – Innovative Tools for Assessing Skills.” World Bank Social Protec-tion and Labor Discussion Paper No. 1421 (July, 2014). Washington, DC: World Bank.
Potter, Edward E. 2002. “Improving Skills and Employability in the 21st Century.” Industrial and Labor Relations Review 55(4): 739–745. doi:1. Retrieved from http://www.jstor.org/stable/ 3270637 doi:1
Quintini, Glenda. 2014. “Skills at Work: How Skills and their Use Matter in the Labour Market.” OECD Social, Employment and Migration Work-ing Paper no. 158. Paris: OECD Publishing. http://dx.doi.org/10.1787/5jz44fdfjm7j-en
World Bank. 2012. World Development Report 2013: Jobs. Washington, DC. DOI: 10.1596/978-0-8213-9575-
1700961_STEP_Snapshot.indd 20 9/8/16 3:04 PM

21
Resources
The STEP Skills Measurement Data
The STEP Skills Measurement datasets are available in the World Bank’s Microdata Catalog (link provided below), including relevant background and imple-mentation documents for the surveys conducted in each country. The Microdata Catalog is regularly updated as new findings and materials related to STEP are made available.
Country Reports
In addition to the STEP Methodology Note (Pierre et al.,2014) and the STEP Snapshot 2014 the follow-ing country reports have also been published and are available online:
SRI LANKA • Dundar, Halil, Benoit Millot, Yevgeniya Savchenko, Harsha Anturupane, and Tilkaratne A Piyasiri. Building the Skills for Economic Growth and Competitiveness in Sri Lanka. Washington, DC, USA: The World Bank, 2014.
VIETNAM • Bodewig, Christian, and Reena Badiani-Magnusson. Vietnam Development Report 2014—Skilling up Vietnam: Preparing the Workforce for a Modern Market Economy. Washington, DC, USA: The World Bank, 2013.
YUNNAN PROVINCE (CHINA) • Liang, Xiaoyan, and Shuang Chen. Developing Skills for Economic Trans-formation and Social Harmony in China: Study of Yunnan Province. Washington, DC, USA: The World Bank, 2013.
ARMENIA • Valerio, Alexandria, Katia Herrera-Sosa, Sebastian Monroy-Taborda, and Dandan Chen. Georgia: Skills Toward Employment and Productivity (STEP) Survey Findings (Urban areas). Washington, DC: World Bank, 2015.
GEORGIA • Valerio, Alexandria, Katia Herrera-Sosa, Sebastian Monroy-Taborda, and Dandan Chen. Georgia: Skills Toward Employment and Productivity (STEP) Survey Findings (Urban areas). Washington, DC: World Bank, 2015.
Links
The STEP Skills Measurement Program: http://microdata.worldbank.org/index.php/catalog/step/about
Country Reports: http://microdata.worldbank.org/index.php/citations/?collection=step
1700961_STEP_Snapshot.indd 21 9/8/16 3:04 PM

22
Annex 1—Additional Figures
Annex Figure 1A: Perceptions of Blue-Collar Worker qualifications across All Countries Surveyed
Sri Lanka
Yunnan
Vietnam
Azerbaijan
Armenia
Georgia
Percentage of Employers (%)
0 20 40 60 80 100
51–79% Qualified
All are Qualified
1–50% Qualified
80–99% Qualified
Share of Qualified Blue-Collar Workers
Annex Figure 1B: Share of Employers Reporting Recruiting Constraints and Also Having Negative Perceptions of the General Education and TVET Systems, Georgia
Per
cent
age
of E
mpl
oyer
s (%
)
No Yes No Yes No Yes No Yes
Hiring Problems:White-Collar
Hiring Problems:Blue-Collar
Hiring Problems:White-Collar
Hiring Problems:Blue-Collar
How problematic is TVETfor operation and growth?
How problematic is general educationfor operation and growth?
0
20
40
60
80
100
Mild problem
No problem
Severe problem
Occurrence of Recruiting Constraints with Negative Perception of General Education and TVET
1700961_STEP_Snapshot.indd 22 9/8/16 3:04 PM
Annex 1—Additional Figures 23
Annex Figure 1C: Employers Considering General Education and TVET as a Constraint on Firm Operation and Growth across All Countries
Pe
rce
nta
ge
of
Em
plo
yers
(%
)
Ge
ne
ral
TV
ET
Ge
ne
ral
TV
ET
Ge
ne
ral
TV
ET
Ge
ne
ral
TV
ET
Ge
ne
ral
TV
ET
Ge
ne
ral
TV
ET
0
20
40
60
80
100
Mild problem
No problem
Severe problem
Constraint on Firm Operation and Growth
Vietnam Sri Lanka Azerbaijan Georgia Armenia Yunnan
Annex Figure 2A: Ranking of Job-Specific Skills, Personality Traits and Personal Characteristics for Staff Retention Decisions across All Countries Surveyed
Rel
ativ
e R
anki
ng (
Inde
x)
Job
Spe
cific
Per
sona
lity
Per
sona
l
Job
Spe
cific
Per
sona
lity
Per
sona
l
Job
Spe
cific
Per
sona
lity
Per
sona
l
Job
Spe
cific
Per
sona
lity
Per
sona
l
Job
Spe
cific
Per
sona
lity
Per
sona
l
Job
Spe
cific
Per
sona
lity
Per
sona
l
0.0
0.5
1.0
1.5
2.0
Blue-Collar
White-Collar
What Matters for Employee Retention?
VietnamSri LankaAzerbaijanGeorgia Armenia Yunnan Province(China)
1700961_STEP_Snapshot.indd 23 9/8/16 3:04 PM

24 Annex 1—Additional Figures
Annex Figure 2B: Comparison of the Number of Different Skills White- and Blue-Collar Workers Regularly Use in Azerbaijan and Yunnan, Share of Workers
1
2
3
4
5
6
7
White-CollarBlue-Collar
Percentage of Employers (%)
Azerbaijan
0 10 20 30 40 50
Num
ber
of S
kills
Use
d
1
2
3
4
5
6
7
White-CollarBlue-Collar
Percentage of Employers (%)
Yunnan Province
0 10 20 30 40 50
Num
ber
of S
kills
Use
dAnnex Figure 3A: Comparison of Innovative and Traditional Firms Reporting General Education and TVET Systems Are Problematic for Business, Yunnan Province and Sri Lanka
Per
cent
age
of E
mpl
oyer
s (%
)
Inno
vativ
e
Trad
ition
al
Inno
vativ
e
Trad
ition
al
Inno
vativ
e
Trad
ition
al
Inno
vativ
e
Trad
ition
al
0
20
40
60
80
100
No problemMild problemSevere problem
General Education and TVET as Constraint on Business
TVET General Education
General Education
TVET
Yunnan Sri Lanka
1700961_STEP_Snapshot.indd 24 9/8/16 3:04 PM

25
Annex 2—Technical Supplement and Tables
Overview of the Questionnaire:
Firm
Information & workforce
characteristics
Skills used by current workforce
Hiring practicesTraining &
compensationBackground
characteristics
• Information on respondent and workplace
• Questions on composition of the workforce for each type of occupation
• Information on skills used, hiring practices, training and compensation
• Question on quality of education and training institutions and firms’ interaction with these institutions
Random selection of 2 occupations
• Financial performance
• Clients and innovation
• Investment climate constraints
• Financial information on the firm
45–60 MINUTES
Skills Used by the Current Workforce (Module 2)
This module starts with the random selection of two occupations, which the questionnaire will then focus on. The respondent is asked to select one occupation from Type A (managers, professionals, and technicians), and another from Type B (clerical support workers, service workers, sales workers, skilled agricultural, craft and related trades work-ers, plant and machine operators, and elementary occupations) through a random sticker method. The module goes on to ask a series of questions about specific skills that workers in these two types of occupations are currently using.
Information on New Hires (Module 3)
To understand skills needs at the firm, this module focuses on new hires in the two selected occupation types. It asks respondents to rank skills in order of
The STEP Employer Survey—Modules
The Employer Survey is designed to better under-stand the demand for skills emanating from the private sector. It is divided into the following five modules.
Information and Workforce Characteristics (Module 1)
This module helps interviewers establish whether or not they are talking to a person knowledgeable about the recruiting practices and skills develop-ment processes in a firm. It seeks information on the firm being surveyed in order to determine its type and the economic sector in which it operates. The module then goes into details about the workforce of the firm, in particular requesting details on the share of females, the share of foreign workers, and changes in the workforce.
1700961_STEP_Snapshot.indd 25 9/8/16 3:04 PM

26 Annex 2—Technical Supplement and Tables
importance when they are deciding to keep a worker beyond the probation period. Skills are grouped under three categories: (i) personal characteristics (age, appearance, gender, networks); (ii) cognitive and job-relevant skills (reading, writing, mathemat-ics, English, foreign language, technical skills, com-munication skills, leadership skills, team work skills, creative and critical thinking, problem solving, abil-ity to work independently, time management); and (iii) personality traits (Conscientiousness, Emotional stability, Agreeableness, Extraversion, Openness to experience). The module also asks for the education level of the most recent hire.
In addition to obtaining information on the skills that are valued by the firm, the module seeks to obtain information on the firm’s recruitment strategies and any difficulties it might be experiencing when hir-ing. Subsequent questions collect more information on how the firm recruits: the places from which it recruits, the time and number of offers it takes to fill a vacancy, whether salary is negotiable at entry, and the remuneration offered to the most recent hire.
Training and Compensation (Module 4)
This module collects information on training pro-vided by the firm, both on the premises and outside the workplace. It asks for the share of workers who benefited from such training programs, the number of days such training involved, and the costs and type of training provided.
The module also contains questions to assess the overall quality of the formal education system (tech-nical and vocational as well as general). It asks a series of questions aimed at determining whether the firm feels that the education system provides adequate skills and whether it has direct contacts with the education system and why.
Firm Background (Module 5)
Given the length of the survey and the usual diffi-culties in collecting financial information from firms, the fifth and last module features only two simpli-fied questions with respect to the firm’s accounts asking about the current financial performance of the company and prospects in the coming three years. Furthermore, the module includes detailed
questions about the various ways in which labor market constraints could impair business, as well as questions that situate labor market constraints with respect to the other investment-climate constraints.
Methodology and Technical Standards
Sampling Strategy and Weighting Procedure
The units of observation were workplaces, and the target populations were low- and medium-income countries. The sectors covered varied by country depending on the core-sector composition of the respective national economy (see Annex Table A1, below). Geographic coverage primarily included the respective capitals and other urban areas and, for some countries, a wider range of provinces, some-times including rural areas.
The sampling frames in the surveys were derived from national firm registries. This had the advan-tage of being cost and time-effective compared with other methods. However, since firm registries are not always updated, a substantial share of reg-istered firms did not exist by the time of the survey, leading to resampling and potentially biased results in some countries. Nevertheless, the survey teams collected the intended number of observations, and sample sizes ranged from 300 to 640 units.
The stratification was undertaken using firm size and geographical strata (for most but not all surveys). As explicit strata the sampling distinguished among large, medium and small workplaces and firms within the capital and other urban areas. Some coun-tries also included provinces as geographical strata. Moreover, the samples were further stratified by sectors and geographic subareas to ensure a higher level of representativeness. In most countries, firms with fewer than five workers were excluded.
The data was weighted using post-stratification weights. The population weights were derived from the firm registries and adjusted to account for non-response. All surveys, except the one in Sri Lanka, were weighted. The latter was not weighted because it simultaneously used two different firm registries that were not similar in their structure. The weights for data from Yunnan Province appear to be unad-justed for nonresponse.
1700961_STEP_Snapshot.indd 26 9/8/16 3:04 PM

Georgia Azerbaijan Armenia Sri Lanka Vietnam Yunnan
Target Population
Non-government workplace
Non-agriculture private workplaces
Non-government workplaces
Workplaces Workplaces Non-state owned enterprises
Sampling Frame
List of businesses from the State Department of Statistics including approx. 3735 firms
List from Azeri Statistical Office which was updated by WB team in 2013 including approx. 3365 firms
List of registered businesses with the Social Security State Agency from 2012 including approx. 9100 firms
Department of Census and Statistics (DCS) and Associations list for tourism sector including approx. 46524 firms
GSO’s dataset of the enterprise census 2009 including approx. 29914 firms
List of basic units of Kunming in 2010 including 32245 firms
Geographic Coverage
Capital (Tbilisi) and other urban regions (Abkhazia and South Ossetia excluded)
Capital (Baku) and other urban regions
Capital(Yerevan) and other urban
All regions Hanoi, Hochiminh and 9 provinces
Urban area of Kunming (including 4 administrative districts: Wuhua, Panlong, Guandu and Xishan)
Size of Workplaces
Large: >100 workers, Medium: 20–100 workers, Small: < 20 workers
Large: >100 workers, Medium: 20–99 workers, Small: < 20 workers
Large: >51 workers, Medium: 11–50 workers, Small: < 10 workers
Large: >100 workers, Medium: 20–99 workers, Small: 5–20 workers
Large: >51 workers, Medium: 11–50 workers, Small: < 10 workers
Large: >100/50 workers, Medium: 11–50/100 workers, Small: < 10 workers
Sample Dize 354 316 384 640 330 300
Sampling Details
Initial sample of 400 firms followed by 3 replacement rounds out of reserve sample of another 430 firms. 45% of attempted firms completed the interview. Response rate based on activated eligible firms is 53.6%.
Initial sample of 402 firms and reserve sample of another 1200 firms, 19.7% of attempted firms completed the interview. Response rate based on activated eligible firms only is about 20.3%
Initial sample of 400 firms and 2 reserve samples of 400 and 304 firms respectively 36% of attempted firms completed the interview. Response rate based on activated eligible firms is 44%
The target sample was 600 firms, resampling took place 3 times. The size of the reserve sample is unclear, ranging from approx. 1100-1400 firms. Sectors came from different source frames and were recorded separately or not at all leading to some inconsistency.
Initial sample of 330 firms and the two reserve samples of together 130 firms, 56% of attempted firms completed the interview. Response rate based on activated eligible firms is 64%
Initial target sample was 300 and a reserve sample of 68 firms, attempted). 91% of attempted firms completed the interview. Response rate 91%,
Sector Details Only includes: Tourism, Construction, IT & Telecommunication
Excludes: Land, water and air transportation, Wood processing, Pulp and Paper, Tobacco Manufacturing & Recycling
Only includes: Food processing, Fishing, Mining, Manufacturing, Electricity gas and waterworks, Constructions, Wholesale, Retail trade, Repair of motorcycles, motor vehicles and household goods, Hotels and restaurants, Transportation, Financial services & Real estate.
Excludes: Real estate
Notes Sampling weight follows stratification and is adjusted for non response
Sampling weight follows stratification and is adjusted for non response
Sampling weight follows stratification and is adjusted for non response Wholesale and retail trade are under-represented likely because firms tend to be small and are not included in the sample per definition (no firm below 5 employees)
No (basic) weights calculated: The sampling frame provided by the DCS was outdated (from 2002) and contained only few cases for the tourism sector thus a different frame was used. It was not possible to sample using a similar stratification for all sectors, also the sizes of the target population by stratum were not consistent.
Sampling weight follows stratification and is adjusted for non response. A more detailed Sector list is available. Has a country report Also sampled 22 informal but they are excluded from the dataset.
The strata is not entirely clear as documentation is vague. There is no information about the number of firms that were not eligible Weight is not adjusted for non-response, its construction follows the sampling sectors
27
Annex Table A1:
1700961_STEP_Snapshot.indd 27 9/9/16 10:23 AM
28 Annex 2—Technical Supplement and Tables
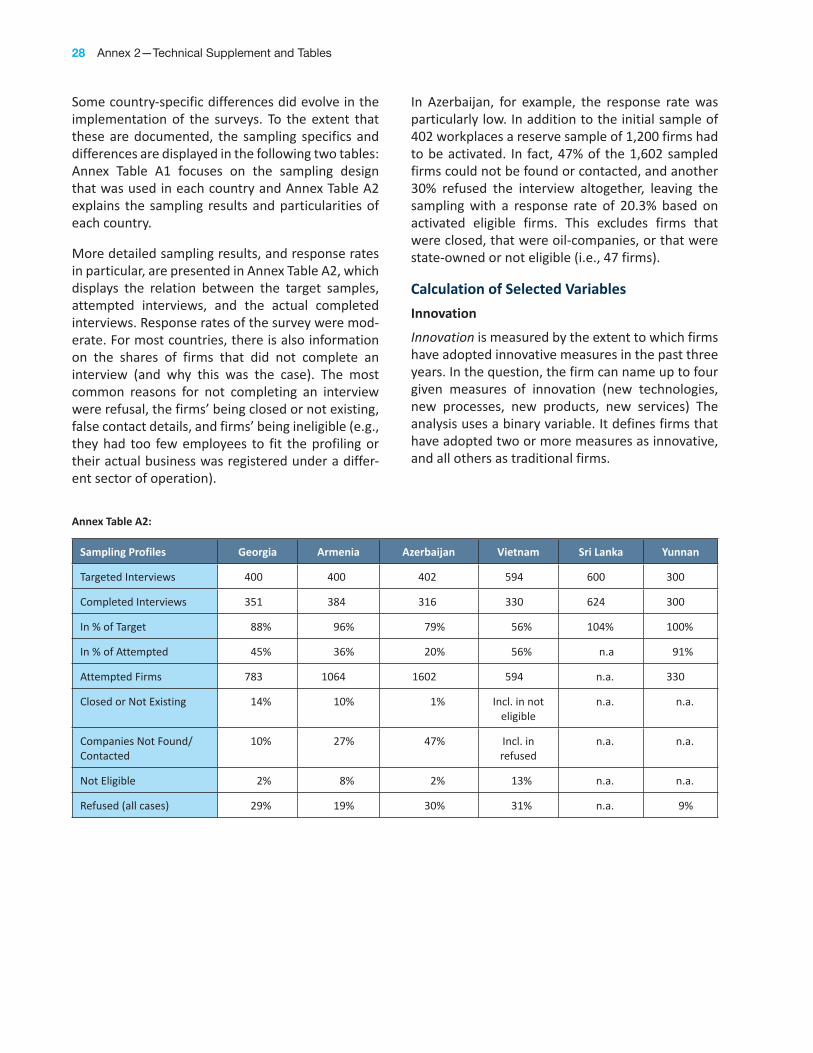
Some country-specific differences did evolve in the implementation of the surveys. To the extent that these are documented, the sampling specifics and differences are displayed in the following two tables: Annex Table A1 focuses on the sampling design that was used in each country and Annex Table A2 explains the sampling results and particularities of each country.
More detailed sampling results, and response rates in particular, are presented in Annex Table A2, which displays the relation between the target samples, attempted interviews, and the actual completed interviews. Response rates of the survey were mod-erate. For most countries, there is also information on the shares of firms that did not complete an interview (and why this was the case). The most common reasons for not completing an interview were refusal, the firms’ being closed or not existing, false contact details, and firms’ being ineligible (e.g., they had too few employees to fit the profiling or their actual business was registered under a differ-ent sector of operation).
In Azerbaijan, for example, the response rate was particularly low. In addition to the initial sample of 402 workplaces a reserve sample of 1,200 firms had to be activated. In fact, 47% of the 1,602 sampled firms could not be found or contacted, and another 30% refused the interview altogether, leaving the sampling with a response rate of 20.3% based on activated eligible firms. This excludes firms that were closed, that were oil-companies, or that were state-owned or not eligible (i.e., 47 firms).
Calculation of Selected Variables
Innovation
Innovation is measured by the extent to which firms have adopted innovative measures in the past three years. In the question, the firm can name up to four given measures of innovation (new technologies, new processes, new products, new services) The analysis uses a binary variable. It defines firms that have adopted two or more measures as innovative, and all others as traditional firms.
Annex Table A2:
Sampling Profiles Georgia Armenia Azerbaijan Vietnam Sri Lanka Yunnan
Targeted Interviews 400 400 402 594 600 300
Completed Interviews 351 384 316 330 624 300
In % of Target 88% 96% 79% 56% 104% 100%
In % of Attempted 45% 36% 20% 56% n.a 91%
Attempted Firms 783 1064 1602 594 n.a. 330
Closed or Not Existing 14% 10% 1% Incl. in not eligible
n.a. n.a.
Companies Not Found/Contacted
10% 27% 47% Incl. in refused
n.a. n.a.
Not Eligible 2% 8% 2% 13% n.a. n.a.
Refused (all cases) 29% 19% 30% 31% n.a. 9%
1700961_STEP_Snapshot.indd 28 9/8/16 3:04 PM

Annex 2—Technical Supplement and Tables 29
Firm Size
The variable firm size, used for disaggregation, is defined as follows:
‘Firms with 10 or less workers are small; firms with 11 to 100 workers are medium; and firms with more than 100 workers are defined as large.’
It should be noted that this variable is based on the questionnaire’s responses and differs from the firm-size stratum.
Indexes on Importance of Skills
The analysis of the skills that employers look for when retaining their workers is based on indexes. They are calculated as follows:
1. The question asks the employers to rank a defined set of skills as “most important,” “sec-ond most important,” and so on; for example, for job-related skills this goes on until “fifth most important.” At least one or more skills from the list are not selected by employers.
2. For each skill, the weighted percentage shares of how important it was rated to be is listed.
3. Each share is then “weighted” as follows: 0 for (all) skills not mentioned; the highest number for the “most important” category (5 in the case of most important job-related skill); the second highest number for the “second most impor-tant” category (4 in the example); and so on.
4. The index results from the sum of the weighted shares for each skill.
Example:
Literacy
ShareIndex-Weight
Index Value
(1) (2) (1)*(2)
Most Important 24% 5 1.2
2nd Most Important 6% 4 0.24
3rd Most Important 4% 3 0.12
4th Most Important 5% 2 0.1
5th Most Important 3% 1 0.03
Not Mentioned 59% 0 0
Total 100% SUM 1.69%
The variable for how important or problematic the various labor constraints are to business operations and growth is calculated similarly.
Regular Use of Skills
The variable of the number of regularly used skills is computed as follows:
1. The employer is asked if the job of the respec-tive Type A and B worker regularly involves a set of seven skills.
2. Each firm is assigned a value from 0 to 7 depend-ing on the number of skills that the workers reg-ularly use, which results in two variables; that is, one variable for Type A workers and one for Type B workers.
1700961_STEP_Snapshot.indd 29 9/8/16 3:04 PM

1700961_STEP_Snapshot_Cover.indd 2 9/8/16 1:01 PM