employees’ commitment and organizational performance in...
TRANSCRIPT

1
Employees’ commitment and organizational performance in Nepal: A typological framework
Prof. Dev Raj Adhikari, PhDTribhuvan University
Dhruba Kumar Gautam, PhDTribhuvan University
AbstractThis paper presents typological framework showing compliance-commitment matrix. Based on this framework a number of new HR mandates recommended for the improvement in the situation of low degree of commitment and compliance affecting level of performance in Nepalese workplaces. Hard and soft HRM perspectives are incorporated to analyse the issues and develop theories. Typological framework showing commitment- compliance matrix is the main contribution of this paper.
Keywords: Typological framework; commitment; compliance; hard HR; soft HR
1. BackgroundIn the process of managing people in organisations a great deal of change has witnessed in the last two decades. One of the fundamental changes is that the traditional personnel management which largely devoted to the “compliance of rules and regulations” transforming into “employees’ commitment” towards work (Beer et al. (1984) Walton and Lawrence (1985)). This kind of shift is based on the perspective that people represent the important asset of organisations and difficult to manage and engage themselves at work (Storey (2001); Ulrich (1998)). Realising it, a number of human resource perspectives have been evolved including “soft vs. hard” dichotomy which is based on the theory “X and Y” (McGregor (1960)). The issue of organisational compliance and commitment becoming most prominent to address the workplace related human resource (HR) problems. Anglo-Saxon HR literature clearly states that one of the distinctive features of traditional personnel management and human resource management (HRM) is that the former is more concerned to the compliance with rules and regulations and the latter to enhance employee commitment at work (Storey (1995); Tyson (1995)). To relate this idea with traditional theory X and Y, the theory X is more associated with “compliance” value whereas the theory Y represents “commitment” value of managers at the workplaces. In

2
organisations compliance is generally made by externally supported bureaucratic control system to react in a given situation whereas commitment is a proactive attitude represents an internalised employee belief associates with soft HRM (Shepherd and Mathews (2000)). The rationale for the study of the degree of compliance and commitment is that there are consequences of poor compliance and commitment attitude of employees. In order to address these problems authors including Ulrich (1998), Pfeffer (1998), Lawler (1996) and Cranet (2004) recommended few ideas could be useful as the new HR mandate for workplace improvements.
Turning to the specific issues related to the Nepalese workplace, a number of papers in the past indicated that organisations unable to complying provisions of labour Acts, the role of personnel department is negligible in different HR related matters such as recruitment and selection, training and development and performance evaluation and its implication for career development of employees is not properly understood (Adhikari and Gautam (2010); CONCERN (2005, 2007); GEOFONT (2001)). In almost 17 percent of organisations there is no formal performance appraisal system, there is lesser use of performance based system and people are highly dissatisfied at work and with pay (Adhikari and Gautam (2009); Adhikari, (1992)). Furthermore, the main barriers prevailing in the employee relations systems are, for example, over centralisation of power, lack of trustful relations of top management with line management, feeling of seniority and status, increasing dissatisfaction from work, lack of budget for training and development and the lack of performance management systems (Adhikari (2008)). With these caveats in mind, this study aims to identify and address compliance and commitment related issues in Nepalese organisations and to prescribe the new mandate with a view to increase organisational performance. To work on this objective, the issues identified include: what is the status of hard and soft HR practices at Nepalese workplaces? What could be the possible impact of HR practices on organisational performance? What are the new mandates for HR professionals with a view to enhance the degree of compliance and commitment at workplaces? What could be the typology framework to address low-high degree of compliance and commitment related issues for improving organisational performance? To-date, no author has attempted to address these issues in a logical framework. This paper attempts to develop a typology framework that could be helpful to analyse and understand commitment-compliance issues of Nepalese workplaces and suggest the new mandate for HR department.
D.R. Adhikari / D. K. Gautam | SEBON Journal - V (2011) 1-17
3
2. MethodologyThis is a descriptive cum explorative study. As stated earlier, research questions are set to examine the given objective. The first research question is answered on the basis of published research work over the past two decades. The hard HR issues mainly include readiness of firms to comply labour legislations, relations between business and HRM strategy and integration among HR functions. The soft HR issues comprise employees’ commitment to participate and contribute at work for organisational performance. Increased commitment not only indicates employees’ loyalty for performance but also their self-worth, dignity, psychological involvement and identity with work (Beer et al. (1984)). The second and third research questions are answered with the review of literature. Finally, the fourth research question is concentrated to develop a typology framework to discuss new HR mandate in order to resolve commitment vs. compliance related issues normally occurs in the absence of required hard and soft practices at work. Attempt is made to define concepts and constructs, establish relations, reviewing new HR mandates and to identify difficulties to implement change process. Most of the information used in this paper is collected from the secondary source. For the sake of this paper, the concept of commitment and compliance is taken as supplementing rather than mutually exclusive.
Regarding limitations of this paper, first, there are number of commitment types such as, normative, affective, continuance and the like. In this paper commitment is understood in terms of overall organisational commitment as described earlier in this section. Second, only published literature and findings of previous research works are taken as reference to work on commitment-compliance related issue. Finally, although hard and soft HRM perspective seems opposing, both of these are incorporated to analyse the issues and develop theories.
3. Literature reviewResearch conducted in different sectors including manufacturing and service reveals the fact that HR practices have critical role in the success of organisations (Becker et al. (2001)). In case the organisations fail to implement HR practice for commitment and compliance negative consequences occur. In such situation organisations face the real performance related problems such as, low profits, high costs, poor customer service and low stock prices (Pfeffer (1998)). On the part of employees, layoffs increases, hiring and promotion restrict, organisation have to make greater use of part time and contract employees and investment in training and development will reduce (Burke (2002)). The lack of proper HR practices in organisations employees show lower job involvement, exhibit dissatisfaction in jobs, decrease effort, the number of accidents and turnover rises. Thus poor HR practice is associated with a number of negative work and
D.R. Adhikari / D. K. Gautam | SEBON Journal - V (2011) 1-17

4
health related consequences harming both employees and organisations.The interest of managing human resource is based around the notion
that people at work are the key source of sustained competitive advantages. We all believe that in this century organisations are not competing on the basis of product they produce rather the quality of the people they employ. This belief is based on the expectation that people can make the difference because of their capabilities and commitment which are rare, non-substitutable, valuable, and inimitable (Barney (1991)); managing human resource is the matter of truly strategic importance which distinguishes successful organisations from the others (Huselid (1995)); managing human resource is too important because it is recognising an activity which is owned by all managers (Cunningham & Hyman (1999)); and once HR practices integrated internally and externally support to achieve its bottom line objective- performance (Mabey, et al. (1998)). This clearly exhibits that human resources can contribute a lot to make organisations more competing and raising value of the firm by making changes at the workplace.
It is believed that the bottom line result of managing human resource is the performance. Therefore the main concern of managing people in organisations is to raise performance of employees and subsequently performance of the organisation. Few authors argued (Schuler (1986); Tsui (1987); Schuler and Jackson (1987) that there is a kind of bundle and synergetic effect of HR practice such as recruitment and selection, performance evaluation, training and development and many other to raise performance. Furthermore there is also a strong influence of social, cultural, economic and political factors will be on HRM policies and practices (Budhwar and Khatri, (2001)). Many researches, therefore, also have exerted their concerted effort to examine impact of contextual factors on HR practices (Budhwar and Sparrow (1997) Sparrow and Budhwar (1997)).
There is no universally applicable HR practice (Pieper (1990)). Not surprisingly, countries that are geographically and culturally closer to each other have similar HRM practices (Dany and torchy (1994); Ryan et al. (1999)). On the contrary, a number of authors have described about HR best practices (Pfeffer (1998); Becker and Gehart (1996); Huselid (1995)) that are mostly granted as culture free. Moreover, few authors have argued that many organisations fails to use innovative and best HR practices due to little considerations given to the behavioural factors (Rynes et al. (2001); Adams, (2003)). Thus, contextual and behavioural considerations are imperative to implement a number of HR practices instead of direct use of context and culture free HR.
One of distinctive features of the traditional personnel administration was to make people complying with rules and regulations. As the time changed, HR (the improved version of personnel administration) focusing on commitment of people at work together with compliance part. Managing human resource
D.R. Adhikari / D. K. Gautam | SEBON Journal - V (2011) 1-17

5
is the science and practice that deals with the nature, decisions, actions, and issues relating to the employment relationship. In practice, it involves an organisation’s acquisition, development and utilization of employees as well as employee’s relation to organisation and its performance (Ferris et al. (1984)), and concerns with the broader range of important company function including the recruitment, selection, training and development, compensation, retention, evaluation, and promotion of personnel within the organisation (Bernardin and Russell (1998); Guthrie (2001)). These all focus on the compliance aspect of HR where organisations have to ensure that they have enough number of people to work with required capability and competence. Now-a-days, HR literature is more concerned with the proper management of people. People in organisations want to get more and put less effort (Ulrich (1987)). This clearly exhibits the need for enhancing commitment of people to make them engaged at work.
Hard and soft HRM perspectives go beyond the technical HR issues and interpreting HRM as incorporating soft developmental humanist approach and hard situational contingent approaches (Price (1997); Boxall (1993)). Hard HR practices basically focus on the compliance part where as soft HR more concerns to enhance employees commitment at work. Soft HRM is associated with human relations, utilisation of talents and equated with the concept of a high commitment work system (Walton (1985)). Hard HRM focuses on the quantitative, calculative and business-strategic aspects of managing the headcount resources in as rational a way as for any other factor of production (Storey (1992); Legge (1995)). Although hard and soft perspectives of HRM are opposing view Guest (1997) and Storey (1992) have incorporated both perspectives in the process of HRM model and theory building.
Few researchers have recommended the new mandate to address increasing HR related issues. In this paper these mandates are taken as reference to address workplace related issues. Some important mandates are exhibited in the table 1.
In order to implement the aforesaid mandates the HR department and professionals have to play the key role. However, there are difficulties to implement new mandates. Some of the difficulties are: short term focus on HR practices by the CEOs, unproductive human relations activities, lack of trust, cooperation and self-management and resistant to an cynical from the side of management to implement new HRM practices (Pfeffer (1998)). Few other resisting forces are; the fear of loosing jobs, status and pay through the removal of hierarchy, the cost-benefit ratio and uncertainty of change, inadequate measures of the benefits of change and hiring managers from outside who do not understand ways to obtain competitive advantage through people in their companies (Burke (2002)).
D.R. Adhikari / D. K. Gautam | SEBON Journal - V (2011) 1-17

6
Table 1Important mandates
Authors (date) New HR mandatesUlrich (1998) HR professionals have to become partner in implementing business
strategy (HR should identify model of doing business; must be accountable for conducting an organisational audit; should work as a strategic partner; should take stock of its own work and set clear priorities)HR professionals have to become administrative experts in improving the efficiency of both their own function and the entire organisations.HR professionals have to become employee champions (must be held accountable for ensuring that employees are engaged- that they feel committed to the organisation and contribute full. HR professionals have to play the role of change agents (at the time of globalisation, technological innovation.)
Pfeffer (1998) Employment securitySelective hiringSelf-managed teams and decentralisationHigh compensation contingent on performanceTrainingReduction of status differencesSharing of information
Lawler (1996) Attracting and retaining right peopleHiring people who fit to organisational values, core competencies an strategic goals.Train employees continuously to do their jobs and offer them opportunities to grow and develop.Design work meaningfully to provide feedback, responsibility and autonomy to among the employees.Organisations must have clear and specific mission, goal, strategies and values that employees can understand, support and believe in.There must be proper reward system that reinforces their design, core values and strategy.Organisations must develop leaders to create commitment, success and a motivating work environment.
Cranet, Nepal (2004)
Develop interpersonal and communication skills.Provide vocational and professional type trainings.Increase leadership skills.
According to Ulrich (1997) organisation fails to implement effective HR practice and change organisation because of not tiding HR practice with strategy, seen as a fad or quick fix, short term perspective, political realities undermine change, inflexible designs, lack of leadership, lack of measurable and tangible
D.R. Adhikari / D. K. Gautam | SEBON Journal - V (2011) 1-17

7
results, afraid of unknown and unable to mobilise commitment to sustain change. Apart from these, there are number of external factors such as national culture, institutions and business environment related forces inhibiting implementation of HR practices at the firm level (Budhwar and Debrah (2001)). Kane, Crawford and Grant (1999) cited three barriers to implement effective HRM programmes and practices such as, lack of senior management commitment, the level of knowledge and skills necessary to implement credible HRM practice and lack of knowledge about the long-term impact of practices.
HR practices are essential for raising performance. However, in order to achieve performance related objectives it is essential to deal with issues relating to commitment and compliance. Although there are number of new HR practices emerging in the form of the new mandate, in the lack of support from inside and outside organisation it is difficult to implement it to realise bottom-line goal of the organisation.
In Nepal, personnel management is still believed to be pre-occupied with record keeping and operational issues rather than managerial ones (Adhikari (2008)). Majority of organisations are either family owned or run by private sector initiatives. Few organisations engaged in business sector are partially or fully owned by the government known as public enterprises. In the last 22 years Nepal faced number of political turbulences especially, the end of single-party Panchayat system and the beginning of multi-party democracy, the 10-year Maoist led people’s war, signing of the Comprehensive Peach Agreement in November 2006 between the Seven Party Alliance (SPA) and Communist Party of Nepal (Maoist), election of constitutional assembly and declaration country as Republic. Prior to 1990, human resource management practices were not satisfactory in the majority of the organisations because of the reasons such as not so precisely defined strategies in public enterprises, poor state of employee participation, distorted communication system between employees and managers due to hierarchic nature of organisations and thus feeling of status and prestige was high among the top level managers and lacked systematic HR planning (Upadhyaya (1981); Koirala (1989); Agrawal (1983); Tiwari (1984)). Employees believed that nepotism and favouritism were widespread in the recruitment and selection process, decision making practice was highly centralised even to deal with minor HR responsibilities, jobs were not so challenging for managers and the reward system was not properly linked with performance (Shrestha (1991); Paudel (1992); Adhikari (1992)).
With the establishment of joint venture and private banks after 1990, salary of employees became competitive in this sector; employee’s performance started to be valued in the organization, need for staff training assessed and management development programmes were highly welcome as means to
D.R. Adhikari / D. K. Gautam | SEBON Journal - V (2011) 1-17

8
develop skills and knowledge of employees (Adhikari (2000)). In order to fulfil the need of skilled manpower in corporations, higher education in business administration and management has been widely proliferated (Adhikari (2004)). More recently, some developments have been seen in the use of computerised HR information, recruitment of qualified and skilled manpower, interest in the training and development of employees and the like. However, in Nepalese workplaces most prominent HR related issues and problems are: unproductive staff, lack of corporate culture, lack of mechanism to implement labour legislations, low degree of integration and coordination of different business functions, lack of performance based system, distorted flow of communication and information, low level of pay and rising absenteeism, proliferating union activities (Adhikari (2010)). At the national level, there is lack of job opportunities for university graduates on the one hand and in the lack of requisite skills to work on newly created jobs on the other hand (Pant (1993)). Majority of the manufacturing sector organisations fail to implement provisions of labour legislations. This is also because of the lack of proper mechanism to implement such provisions. The average capacity utilisation of manufacturing companies is 60 percent. Organisations are less aware about the impact of HR practices on such low capacity utilisation and company performance. In majority of the organisations, there is no proper integration of business strategy and HR practices. Organisations indicated that they have challenges to develop strategies to improve productivity levels. They feel that they are having unproductive staff and therefore it is difficult to use them cost effectively. Different HR functions in organisations are not properly integrated and coordinated. There is no clear linkage between the corporate plan and the manpower plan, especially in public enterprises. Only 34 percent organisations are using computerised based information system in staffing decisions.
In future, as indicated by organisations, they are having problems relating to management of change, quality management and customer care. Moreover, they are expecting to face challenges relating to recruitment of quality staff and retaining them in the future. Managing pay and benefits is another crucial problem they are facing in the next 3 years. Nepalese employees need developing their potential through training, competency, career development. They are seeking training with specific reference to new technology and opportunity for further education. Furthermore, organisations specifically indicated the challenges relating to development of managerial and senior managerial staff and identification of training needs. Training is still regarded as the cost factor. Very few organisations allocated the fund for employee training and development. Training programmes in government owned banks are not so effective. In the public enterprises, the result of performance evaluation is not so linked
D.R. Adhikari / D. K. Gautam | SEBON Journal - V (2011) 1-17

9
with other HR activities such as reward, career and growth and training and development. With the exception of few joint venture banks, no performance based system is in practice in the family-run business.
In Nepalese workplaces challenges are there to motivate employees and make them feel that they are safe and secured in jobs. Except few joint venture banks jobs in Nepalese organisations are not so challenging, interesting and motivating to enhance quality of work life. Employee relations are distorted in the public and private sector undertakings because of the lack of a free flow of communication and information and due to high feeling of status and prestige of the top management. Many organisations indicated that they require social skills such as communication and interpersonal skills. Such skills are required to develop social relations in organisations, managing conflicts and personality development. Majority of the employees believe that their leaders have poor leadership competencies. The situation of employee relations is not encouraging. The main barriers prevailing in the employee relations system is, for example, over-centralisation of power and lack of trustful relation of top management with the line management. There are cases of conflicts due to poor level of employee relations resulting from communication breakdown, personality clashes, and role inconsistencies. There are lack of HR measures at the work floor to uplift morale and motivation of employees at the organisational level. Employees, working in shop floor jobs of the manufacturing sector staying in their job because of economic necessity alone. All it shows that both hard and soft HR practices are not satisfactorily implemented.
Business organisations are performance seekers; thus the selection of HR practice depends on past experience and future expectation of results or performance. Workplace compliance and commitment are the function of better HR practices. Regarding compliance issue, the matching model (also known as a hard HR model) initiated the debate and warned that if organisations fail to follow appropriate HR activities, they will be beset by inefficiencies (Fombrun et al. (1984)). This model strongly recommends academicians and managers to integrate business strategies and HR practices in order to get high performance outcomes. Many authors have desperately attempted to examine HR-performance issues and attempted to establish relations between HR practices and organisational efficiency and effectiveness in the last decade (Baker and Gerhart (1996); Guest (1997); Guest (2001); Ulrich (1997); Kaplan and Norton (1992); Huslid (1995)). A large number of articles have been published on the subject to examine the relations between HR practices- recruitment and selection, performance evaluation, reward and training to firm performance (e.g. lower employee turnover and greater productivity and corporate financial performance) (Backer and Gerhard (1996)). It is observed that firms that
D.R. Adhikari / D. K. Gautam | SEBON Journal - V (2011) 1-17

10
engaged in a strategy formulation process that systematically and reciprocally considers human resources and competitive strategy will perform better than the others (Lengnick-Hall and Lengnick-Hall (1988)). There is also an implicit but untested hypothesis that a good fit will be associated with superior performance (Guest (1997)).
The Harvard model developed by Beer et al (1984) also known as soft HR model, argues that historical problems of personnel management can be solved only if general managers develop a philosophy or viewpoint about how they wish to see employees involved in and developed by the organisation. So involving employees at work is a real challenge which can be addressed by creating working environment favourable for engagement and commitment. Taking into account both hard and soft HR related issues, MacDuffie and Krafcik (1992) argued that the success of a lean production system depends on high commitment human resource policy, broad job classification, multi-skilling practices, profit/gain sharing, a reciprocal psychological commitment between a firm and employees, employment security and reduction of status barrier. Arthur (1994) finds two types of HR configurations that include control and commitment systems. Whereas control systems aim at reducing direct costs, or improving efficiency by enforcing compliance and basing the employee rewards, commitment systems aim to share desired employee behaviours and attitudes by forging psychological links between organisational and employee goals. In a study by Cunha et al. (2003) it is indicated that when organisations can make more cost-effective use of their labour, whilst meeting employee needs, they are more likely to be successful.
From this discussion one can infer that both soft and hard factors are closely associated to organisational performance. Turning to the situation of Nepal, there is dearth of research findings showing relations between specific HR practices and performance. Regarding compliance Adhikari and Gautam (2010) argue the government and employers have failed to follow and implement proper mechanism for implementing labour legislations at the organisational level. They have presented sufficient evidences about negligence from the part of these two parties to comply provisions of labour legislations. Employers have been indulging workers that instead of being involved and committed employees are engaged in petty politics at work places (Adhikari (2008)). Unions and their leaders believe that strike is the only way to deal with rights of working people instead of following provisions of labour legislations. Another study by Gautam (2008) revealed that majority of the companies integrating HR and business strategy have increasing return on investment. This clearly illustrates that how the hard HR practice have impact on the financial performance.
In a research on human resource management and organisational
D.R. Adhikari / D. K. Gautam | SEBON Journal - V (2011) 1-17

11
performance-an evidence from Nepalese banking industry, it was indicated that performance evaluation and reward system variable has positive correlation with return on equity (ROE) (Shrestha (2006)). At the same time the study reported that ROE is significantly and positively correlated with effective and continuous commitment and employee satisfaction is closely related with all the HR practices components where more specifically, work related satisfaction is highly correlated with the work environment and climate. In another study by Pandey (2008) employees in Nepalese banks still perceive a significant positive relationship among the components such as, personal benefits, career benefits and job-related benefits of training and components of commitment.
We never believe that there is a complete absence of compliance and commitment factors at Nepalese workplaces. Organisations have HR related policies, rules regulations guiding HR departments and HR practices. But there is a kind of low trust work environment so that employers and employees always doubt their actions and reactions. Regarding commitment, as revealed earlier, certain HR practices are there for enhancing the level of employees’ commitment at work. As far as, impact of this on overall performance is concerned no hard data available to link such relations. However, companies in Nepal are not utilising their full capacity, they have very less competing capability and except carpet and garment products there is no international markets for Nepalese products. The market value of share (especially in the secondary market) is basically decided by the vested interest of few brokers and speculators instead of actual organisational performance. In sum, a number of literature show the impact of HR practices on commitment and compliance and thus on organisational performance.
4. Mandate for raising employees’ compliance and commitmentKeeping in view of the low degree of compliance and commitment at Nepalese workplaces it is imperative to search for the new HR mandate for our HR professionals and department to raise organisational performance. Study undertaken by Cranet, Nepal (2004) clearly stated that three mandates for improving HR practices and thus enhancing commitment and compliance. They are: 1) increase interpersonal and communication skills of employees; 2) increase professional and vocational skills of employees; and 3) enhance leadership skills of the managers. In fact, these three mandates clearly support to achieve performance goal of the organisation through enhancing commitment and compliance. Evidences show that in the lack of interpersonal and communication skills it is difficult to communicate policies and expectations of the companies (Adhikari (1992)). There is a mismatch between job requirements and current level of employees’ skill making it difficult in performing the given jobs. Finally,
D.R. Adhikari / D. K. Gautam | SEBON Journal - V (2011) 1-17

12
in case of leadership development, there is a poor record of succession planning in Nepalese organisations. The role of larders is not trustful especially in the case of hiring, promotion, performance evaluation and in making compensation policies. The wide spread feelings of prestige and status are prevailing because of hierarchic nature of the organisations. As discussed earlier, companies are failing in complying labour legislations on the one hand and motivating employees for engaging them at work on the other hand. Both hard and soft HR dimension are not fully in practice.
5. Typological frameworkA typology framework could be helpful to analyse and understand the degree of commitment-and associated hard-soft HR issues. In addition, it also supports to suggest the new HR mandates to improve performance. In the framework below, based of McGregor’s (1960) work, four X, Y zones are created. Zone X represents the hard HR issue and zone Y represents the soft HR issue. High commitment denotes the presence of high degree soft HR dimensions whereas high compliance denotes presence of high hard HR dimensions at work places. Below presented table 2 is the typological framework showing commitment-compliance matrix.
Table 2 Typological framework
Presence of high soft and low hard HR practices
Presence of high soft and hard HR practices
High Commitment
Low commitment
Low presence of hard and soft HR practices
High presence of hard and low presence of soft HR practices
Low compliance High compliance
Theoretically, high application of both soft and hard HR practices will certainly result high degree of compliance and commitment at work. Below presented the short description of matrix: a) Presence of high soft and low hard HR practices (Low X zone and high Y zone): In this situation employees will remain motivated and committed at work. The lack of hard HR practices indicates poor integration of HR strategy and business strategy, less compliance of rules and regulations, lack of opportunity for work based training and development and the like at our workplace. In this situation HR department and professionals have to play role to develop model of doing business, enhance professional and vocational skills of employees,
D.R. Adhikari / D. K. Gautam | SEBON Journal - V (2011) 1-17

13
play as change agent in order to adopt with changing technology and develop performance based measures such as, compensation based on performance.b) Presence of high soft and high hard practices (high X and Y zone): This represents an ideal stage of commitment and compliance at work. At this stage company have proper mechanism for implementing rules and regulations, relations with unions will be better, employee motivation and morale will remain high. This situation can have positive impact on organisational performance. However, it is always necessary to maintain this ideal situation due to change in external and internal environmental forces. At this situation, HR professionals have to work actively as change agent thinking on how to keep employees engaged at work. c) Low presence of hard and soft HR dimensions (Low X and Y zone): This represents the situation where there is low degree of commitment and compliance at the workplace. In such workplace employees are less motivated and committed at workplace and at the same time, in the lack of proper integration of strategy and HR practices and low degree of compliance of labour legislation organisations fails to achieve its performance objectives.d) High presence of hard and low presence of soft HR dimensions (High X zone and low Y zone): In this situation the degree of compliance will be higher and commitment will be lower. Although rules and regulations are in practice and HR department is committed to implement its hard HR policies and practices in organisations employees may not be interested to work because of poor human relations, uninteresting jobs and not recognition of the job done. Proper leadership and job design is inevitable in this situation. The role of leadership is prominent in this situation to make the work environment motivating and interesting.
6. DiscussionThe hard and soft HR practices are important to enhance degree of compliance and commitment at work. They, in fact, reciprocate each other to advance at workplace. Examining the degree of compliance and commitment situation in Nepalese workplaces, it seems poor status of the implementation of hard and soft HR practices. Organisations fail to comply given provisions of labour legislation, business and HR strategies are not sufficiently integrated and even there is lesser integration among the HR practices such as result of performance evaluation and its implication for employees’ career development. In fact, very few organisations have practicing performance based HR practices. Regarding commitment, employees are less engaged in given works in the lack of interesting, challenging and motivating jobs. The Human relation is distorted due to poor communication practices and leadership development. In some organisations,
D.R. Adhikari / D. K. Gautam | SEBON Journal - V (2011) 1-17
14
among the top level managers feeling of status and prestige is high. At the work place conflicts are on rise and there are no proper measures to uplift employee morale and motivation.
Many Western authors agree that there are evidences of impact HR practices on bottom line performance. But in case of Nepal still we have to come forward with enough evidences on how HR practices enhance compliance and commitment and thus increase the organizational performance. This is essential because very few employers are convincing with the specific impact of HR practice on organizational performance (Adhikari and muller (2001)). A number of evidences presented in this paper on how HR practices will have impact on performance. In case of Nepalese organisations there is evidence that firms integrating HR and business strategy are doing better in terms of raising ROI (Gautam (2008)).
Looking at deteriorating performance of organisations, there is a need to reconsider role of HR professionals and departments especially that are helpful to integrate HR and business strategies, making people engaged at work, motivating employees for commitment and compliance, reducing feeling of status differences. Moreover, to practice HR dimensions efficiency information technology should be used. The culture of selective hiring, performance based systems, information sharing and continues learning and training is required at workplaces. However, while adopting these mandates and playing new role professionals may face risk factors such as lack of budget, reluctance from the side of employees and unions, budgetary provisions and others. Nevertheless, the practices of information sharing, training and development, convincing message from leaders and counselling can help to minimising the effect of these risk factors associated with implementing these roles.
There is an implication of typology framework for the HR professionals are order to understand the degree of compliance and commitment at the workplace. Based on this framework, HR professional can adopt or create a number of mandates to improve the situation of compliance and commitment and thus to increase organisational performance.
References Adams, A. M., 2003, Mitigating risks, visible hands, inevitable disasters, and soft variables:
management research that matters to mangers, Academy of Management Executive, 17, 46-61
Adhikari Dev Raj and D. K. Gautam, 2006, Human resource management in Nepal: integration and organizational performance, Banijya Sansar, 12, 31-37.
_____, 1992, Human resource management for public enterprises a model for designing jobs in Nepalese factories, Nomos Wirtschaft, Germany.
D.R. Adhikari / D. K. Gautam | SEBON Journal - V (2011) 1-17

15
_____, 2000, Development in the management of human resources in Nepal, Leopold-Franzens-University, Innsbruck, Austria.
_____, 2004, Human resource environment in Nepal, paper presented at the 5th international industrial relation association congress, Seoul.
_____, 2005, Labour legislation and quality of work life in Nepal, proceedings of the 8th Asian regional congress of labour and social security law, Taiwan.
_____, 2008, Human resource management, Buddha Publication, Kathmandu._____, 2010, Human resource development for performance management, International
Journal of Productivity and Performance Management, 49, 4, 306-324.Adhikari, Dev Raj, and M. Mueller, 2001, Human resource management in Nepal’, In P. S.
Budhwar and Y. A. Debrah (eds.), Human Resource Management in Developing Countries, London: Routledge.
Adhikari, Dev Raj and D,K. Gautam, 2010, Labour legislations for improving quality of work life in Nepal, International Journal of Law and Management, 52, 1, 40-53.
Agrawal, G. R., 1983, Innovative human resource management: case studies of Nepal, CEDA, Kathmandu.
Arthur, J. B., 1994, Effects of human resource systems on manufacturing performance and turnover, Academy of Management Journal, 37, 3, 670-687.
Barney, J., 1991, Firm resources and sustained competitive advantages, Journal of Management, 17, 1, 99-120.
Becker, B. E. and B. Gerhart, 1996, The impact of human resource management on organizational performance: progress and prospects, Academy of Management Journal, 39, 4, 779-801.
Becker, B. E., M.A. Huselid, and D. Ulrich, 2001, The HR scorecard: linking people, strategy and performance, Boston, MA: Harvard Business School Press.
Beer, M., B. Spector, P.R. Lawrence, Q. Mills and R. Walton, 1984, Managing human resources, Free Press, New York
Bernardin, H. and J. Russell, 1998, Human resource management: an experimental approach, Singapore: McGraw-Hill.
Boxall, P. F., 1993, The significance of human resource management: a reconsideration of the evidence, International Journal of Human Resource Management, 4, 3, 645-64.
Budhwar, P. and Y. Debrah, 2001, Rethinking comparative and cross national human resource management research, International Journal of Human Resource Management, 12, 3, 497-515.
Budhwar, P. and N. Khatri, 2001, A comparative study of HR practices in Britain and India, International Journal of Human Resource Management, 12, 5, 800-26.
Budhwar, P. and P. Sparrow, 1997, Evaluating levels of strategic integration and devolvement of human resource management in India, International Journal of Human Resource Management, 8, 4, 476-494.
Burke, R. J., 2002, Human resources as a competitive advantage: new directions in human resource management, Routledge.
CONCERN, 2005, Child labor working in brick industry, CONCERN, Kathmandu._____, 2007, Child labor working in brick industry, CONCERN, Kathmandu.Cranet, 2004, Cranet survey on comparative human resource management, international
executive report, Cranet, UK, available at: http://www.cranet.org Cunha, R. C. E, M.P. Cunha, A. Morgado and C. Brewster, 2003, Market forces, strategic
management, HRM practices and organizational performance: a model based in a European sample Management Research, 1, 1, 79-91.
Cunningham, I. and J. Hyman, 1999, Devolving human resource responsibilities to the line, Personnel Review, 28, 1/2, 9-27.
D.R. Adhikari / D. K. Gautam | SEBON Journal - V (2011) 1-17

16
Dany, F. And V. Torchy, 1994, Recruitment and selection in Europe: Policies, practices and methods, In C. Brewster and A. Hegewisch (eds.) Policy and practice in European Human Resource Mangement: The Price Waterhouse Cranfield Surey, London: Routledge, 68-88.
Ferris, G.; D. A. Schellenberg, and P.E. Zammuto, 1984, Human resource management strategies in declining Industries, Human Resource Management, 23, 381-94.
Fombrun, C. J.; N. M. Tichy, and M. A. Devanna, 1984, Strategic human resource management, John Wiley, New York.
Gautam D. K. and A. J. Davis, 2007, Integration and devolvement of human resource practices in Nepal, Employee Relations, 29, 6, 711-26.
_____, 2007, Sharing human resource management responsibilities in Nepalese banks, Management Dynamics, 12, 1, 47-54.
_____, 2008, Strategic human resource management in Nepal, an unpublished Ph. D. thesis submitted to the Faculty of Management, Tribhuvan University, Kathmandu, Nepal.
_____, 2010, Human resource management and its linkage to business strategy: the reality in Nepalese organizations, Nepalese Economic Review, 2, 3, 132-139.
GEOFNT, 2001, available at: www.Gefont.org/studydoc/turights/html/cfiding.htmlGuest, D., 1997, Human resource management and performance: A review and research
agenda, International Journal of Human Resource Management, 8, 3, 263-275.Guthrie, J. P., 2001, High involvement work practices, turnover, and productivity: evidence
from New Zealand, Academy of Management Journal, 44, 1, 180-90. Huselid, M. A., 1995, The impact of human resource management practices on turnover,
productivity and corporate financial performance, Academy of Management Journal, 38, 3, 635-672.
Kane, B., J. Crawford, and D. Grant, 1999, Barriers to effective HRM, International Journal of Manpower, 20, 8, 494-515.
Kaplan, R. S. and D. P. Norton, 1992, The balanced scorecard measuring that drive performance, Harvard Business Review, Jan. - Feb. 75-89.
Koirala, U., 1989, Workers participation in management, Unpublished Ph. D. Thesis, Panjab University, India.
Lawler, E.E. III, 1996, From the ground up: six principles for creating new logic organisations, Sanfrancisco, CA:Jossey-Bass.
Legge, K., 1995, Human resource management: rhetoric and realities, Macmillan, London.Lengnick – Hall, C. A. and Lengnick – Hall, M. L., 1988, Strategic human resource
management: a review of the literature and proposed typology, Academy of Management Review, 13, 3, 454-470.
Mabey, C., G. Salaman, J. Storey, 1998, Human resource management: a strategic introduction, Blackwell Publishers, Boston, MA.
MacDuffie, J. P. and J. F. Krafcik, 1992, Integrating technology and human resource for high performance manufacturing: evidence from the international auto Industry, In T. A. Kochan, and M. Useem. (eds.) Transforming Organizations, New York: Oxford University Press.
McGregor, D., 1960, The human side of enterprise, New York: McGraw-Hill.Pandey, D. L., 2008, Expected training benefit and organizational commitment: a study of
Nepalese service sector, unpublished M. Phil thesis. This submitted to Faculty of Management, Tribhuvan Universality, Nepal.
Pant, P. R., 1993, Survey report: Nepal in Asian dynamism through human resource development, Asian Productivity Organization, Tokyo.
D.R. Adhikari / D. K. Gautam | SEBON Journal - V (2011) 1-17

17
Paudel, S. P., 1992, A study of decision making in Nepalese Enterprises, Unpublished Ph. D. Thesis, University of Delhi, India.
Pfeffer, J., 1998, The human equation: building profits by putting people first, Boston, Harvard Business School Press.
Pieper, R., 1990, Human resource management: an international comparison, Berlin, Walter De Gruyten.
Price, J. L., 1997, Hand Book of Organizational Management, International Journal of Manpower, 18, 4/5/6, 314-537.
Ryan, A. M., J. M. Bartunek and R. L. Daft, 2001, Across the great divide: knowledge creation and transfer between practitioners and academics, Academy of Management Journal, 44, 340-356
_____, L. Mc Farland, H. Baron and R. Page, 1999, An international book at selection practices: national and culture as explanations for variability in practice, Personnel Psychology, 52, 359-391.
Schuler, R. S., 1986, Fostering and facilitating entrepreneurship in organizations: implications for origination structure and human resource practices, Human resource management, 25, 607-629.
_____, and S. E. Jackson, 1987, Linking competitive strategies with human resource management practices. Academy of management Executive, 1, 207-219.
Shepherd, J. L and P. Mathews, 2000, Employee commitment: academic vs. practitioner perspectives, Employee Relations, 22, 6, 555-575.
Shrestha, R. P., 1991, Personnel management in private industrial enterprises in Nepal, Unpublished Ph. D. Thesis, Tribhuvan University, Nepal.
Shrestha, Y. K. 2006, Human resource management and organisational performance: evidence from Nepalese banking industry, unpublished thesis, M.Phil. in Management, Tribhuvan University, Kathmandu.
Sparrow, P. and P. Budhwar, 1997, Competition and change: mapping the Indian HRM recipe against worldwide patterns, Journal of World Business, 32, 3, 224-42.
Storey, J., 1992, Developments in the management of human resources, Oxford: Blackwell, London.
_____, 1995, Human resource management: a critical text, London, Routledge._____, 2001, Human resource management today: an assessment in J. Storey (ed.), Human
Resource Management: A Critical Text, Thomson, London.Tiwari, M. N., 1984, Personnel administration in manufacturing public enterprises of Nepal,
Unpublished Ph. D. Thesis, Panjab University, India. Tsui, A. S., 1987, Defining the activities and effectiveness of the human resource department: a
multiple constituency approach, Human resource management 26, 35-69Tyson, S., 1995, Human resource strategy, Pitman, London.Ulrich, D., 1987, Organizational capability as a competitive advantage: human resource
professionals as strategic partners, Human Resource Planning, 10, 4, 169-84. _____, 1997, Human resource champions, Boston, MA; Harvard Business School Press._____, 1998, A new Mandate for human resource, Harvard Business Review, 124-134.Upadhyaya, N. P., 1981, Personnel management in manufacturing public enterprises of Nepal,
unpublished Ph. D. Thesis, Panjab University, India.Walton, R. E., 1985, From control to commitment in the workplace, Harvard Business Review,
63,2,77-84._____, and P. R. Lawrence, 1985, HRM trends and challenges, (eds.) Boston: Harvard Business
School Press.
D.R. Adhikari / D. K. Gautam | SEBON Journal - V (2011) 1-17

18
The pending global crisis : A dark future ahead1
Petr Teplý, PhDCharles University, Prague
Liběna Černohorská, PhDFaculty, University of Pardubice, Czech Republic
AbstractWhile the details of financial crises may change over time, their essence remains the same; these crises are recognized by a cycle of abundant liquidity, rapid credit growth, and a low-inflation environment followed by an asset-price bubble implosion. Understanding the underlying weaknesses inherent in these bubbles has been a hard lesson for market participants to learn, but the most important lesson is how to prevent crises from repeating. The current market turbulence began in the mid-2000s when the US economy shifted to an unbalanced macroeconomic position. By 2007, mounting defaults in the US sub-prime mortgage market led to US market instability, unleashing a global fiscal contagion that spread around the world, roiling markets and causing world economic upheaval. This contagion led to, for example, the nationalization of big financial institutions, bank failures, the end of an era in investment banking, increased federal insurance on banking deposits, government bailouts and opportunistic investments by sovereign wealth funds. This paper, discusses the history, macroeconomic conditions, and milestones of the US mortgage crisis that later resulted in the global liquidity and credit shortages and provide an ethics-based platform for deriving preventative strategies. In addition, the paper present an ethics-based platform for students, academics and professionals to progress into the necessary ethical and judgment-oriented didactic models that will ultimately serve to impede many of these crises from arising in the future.
Keywords: Global crisis, corporate governance, exit strategy, financial markets, ethics
1. IntroductionIn 2007, the sub-prime mortgage crisis undermined the stability of the US financial market, resulting in global credit and liquidity shortages and impacting the world financial market. In this paper, we discuss the history, macroeconomic conditions, and milestones of the US mortgage crisis. We also describe key investment banking and risk management practices that exacerbated the impact of this crisis, such as the industry’s reliance on ratings assessments, an originate-
1 This paper is submitted in the 1st international conference on Management “Changing Perspectives of Manage-ment: Revisit the Existing and Explore the Novel Ideas” organized by Nepalese Academy of Management (www.nam.org.np) at March 10-12, 2011 in Kathmandu, Nepal.
19
to-distribute model, risk-shifting, securitization techniques, and the use of off-balance sheet vehicles. Moreover, we address key lessons for risk management derived from the current global market turbulence and recommend policies that should help diminish the negative impact of future potential crises.
This paper is organized as follows: after a brief introduction, we describe the background of the 2007 crisis (history of the US mortgage market, milestones of the crisis and key principles of securitization). In section three, we define key market players, risks and relevant risk management issues. The fourth section presents both negative and positive lessons emerged from current financial problems, and discuss the role of ethics in preventing a future crisis. The fifth section reviews how troubles of a virtual economy might affect a real economy in the US and subsequently spill over to the rest of the world. Finally, in conclusion we summarize the main points of the paper and state final remarks.
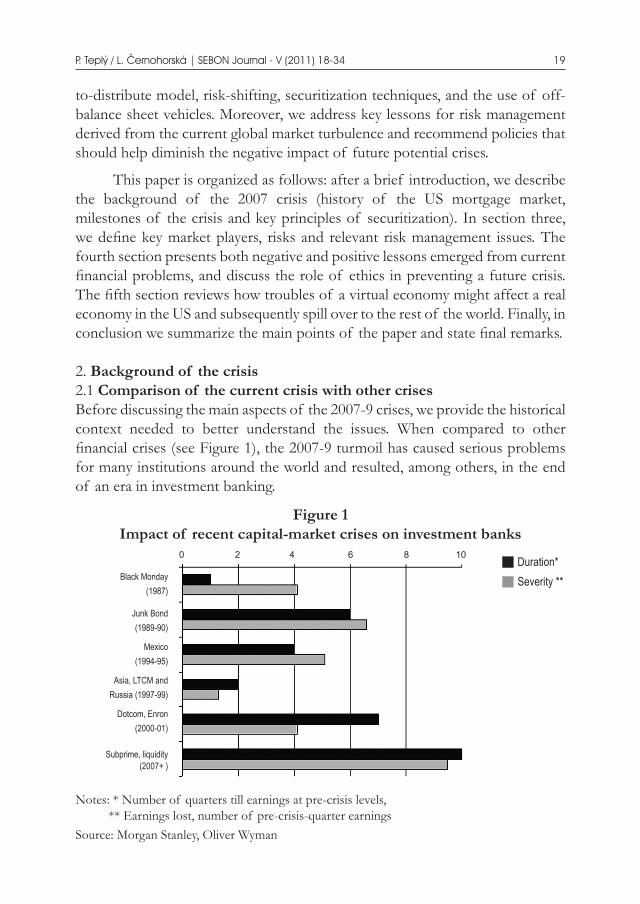
2. Background of the crisis 2.1 Comparison of the current crisis with other crisesBefore discussing the main aspects of the 2007-9 crises, we provide the historical context needed to better understand the issues. When compared to other financial crises (see Figure 1), the 2007-9 turmoil has caused serious problems for many institutions around the world and resulted, among others, in the end of an era in investment banking.
Figure 1Impact of recent capital-market crises on investment banks
Notes: * Number of quarters till earnings at pre-crisis levels, ** Earnings lost, number of pre-crisis-quarter earningsSource: Morgan Stanley, Oliver Wyman
P. Teplý / L. Černohorská | SEBON Journal - V (2011) 18-34
Duration* Severity **
0 2 4 6 8 10
Black Monday(1987)
Junk Bond(1989-90)
Mexico(1994-95)
Asia, LTCM andRussia (1997-99)
Dotcom, Enron(2000-01)
Subprime, liquidity(2007+ )

20
When comparing the dot.com bubble implosion in late 1999 and the 2007-9 crisis, it is evident that both crises accounted only for relatively-low market shares in US market capitalization (6% of US equities market capitalization in 1999) and securitized mortgage debt outstanding in the US respectively (14% share in 2007). However, the consequences of these crises affected the whole economy and world financial markets significantly, in addition to eroding assets. Specifically, the dot.com bubble was followed by a 49% fall in the S&P 500 index over the next two and a half years (and a recession), while the latter crisis caused a US market crash and roiled world financial markets, initiating a recession and threatening the US with a full-scale economic depression (Teply, 2010).
2.2 Macroeconomic imbalances in the USNo economy can live perpetually beyond its means and the case with the
US proves this theorem. Both an increasing current deficit, as well as growing consumption (spurred by outsized US consumer demand and reliance on credit), led to negative consequences such as low savings, hazards in the financial markets and unrealistic goals of consumption and home ownership for low-income borrowers leading to an increased demand for mortgages and credit in the US. Last but not least, the Federal Reserve’s (FED) monetary policy supported this imbalance by maintaining low interest rates that fostered excessive borrowing, as discussed below.
First, in the period from 1995-2006, the US current account deficit jumped from 1.5% of GDP to 6% and was financed through foreign market lenders who hold dollars as the world’s reserve currency2. The question remains if such unrestrained borrowing is sustainable.
Second, in the mid-1990s, the shift in US consumers’ preferences caused another problem – the consumers started to prefer asset-based savings (e.g. home equity) to income-based savings. As a result, US personal consumption rose by 3.5% p.a. in the real terms in the period from 1994 to 2007, becoming the highest increase in a protracted period for any economy in modern history (Roach, 2008). Between the years of 1997 to 2007, household sector indebtedness jumped from 90% to 133% of disposable personal income. Moreover, the ratio of personal consumption on the US GDP grew from 67% in 1997 to 71% in 2007. However, the decline in the US household consumption might cause problems to Asia’s export-led growth dynamic, which is highly-dependant on continued exports to the US.
2 Some researchers were talking about a new “Bretton Woods II” arrangement, whereby “surplus savers such as China could forever recycle excess dollars into US assets in order to keep their currencies competitive and their export-led growth models humming“ (Roach, 2008).
P. Teplý / L. Černohorská | SEBON Journal - V (2011) 18-34

21
2.3 The history of US mortgage market Although the problems in the US mortgage market first surfaced in 2005, the underlying problems really started earlier, for example, in 1977, when the US Government enacted a new federal law called the Community Reinvestment Act (CRA) (see Table 1). The CRA changed credit standards for the US commercial banks and savings associations since it now required the provision of loans for the whole market, specifically encouraging low - and moderate-income loan applicants. In 1995, the credit standards were further eased as new US regulation required banks to provide more loans to low-income borrowers (in terms both the number and aggregate dollar amount) or risk serious sanctions. These government regulations fuelled further risky lending which later resulted in massive balance sheet write downs on the lenders’ financials as the borrowers faced default.
Table 1Background milestones of the mortgage crisis based Zeleny (2008)
and ECB (2007)
Year Event Short description
1977 Community Reinvestment Act (CRA) Relaxing lending standards -> mortgages for “everyone”
1995 Introduction of systematic ratings of banks in terms of CRA compliancePermission of securitization of CRA loans containing subprime mortgages
Loosing credit standards for banks -> more loans to low-income borrowers
1997 First securitization between Union Bank (later taken over by Wachovia) and Bear Stearns (later taken over by JPMorgan)
This securitization started a wave of similar transactions/ investment structures
2003 Guarantees from US government to Federal National Mortgage Association (Fannie Mae) and Federal Home Loan Mortgage Corporation (Freddie Mac)
Explicit guarantees -> lower risk -> issuance of debt with lower rates than competitors
Mid 2005
Surging delinquencies on US sub-prime adjustable-rate mortgages (ARM)
Delinquency rates are good harbingers of future foreclosure rates
Mid 2006
Falling house prices in the US
Homeowners’ equity started declining
Higher loan-to-value ratio (best predictor of future defaults) Higher delinquency rates on both sub-prime and prime mortgages
P. Teplý / L. Černohorská | SEBON Journal - V (2011) 18-34

22
By mid-2005, the US market saw increasing delinquency rates on sub - prime adjustable-rate mortgages (ARM), which historically has been a good predictor of future foreclosure rates. Consequently, in mid-2006, the situation deteriorated as the US housing prices started to fall (see Figure 3) and delinquency rates surged on sub-prime mortgages (see Figure 4) and later also on prime mortgages (to a lesser extent).
Figure 2US house prices in 1998-June 2008
Source: S&P/Case Shiller
Figure 3The US subprime mortgage delinquency rate in 1998-2007
Source: ADL (2008)
20%16%12%10%
8%4%0%
-4%-8%
-10%-12%-16%
1988 1990 1992 1994 1996 1998 2000 2002 2004 2006 2008Year
18.00
17.00
16.00
15.00
14.00
13.00
12.00
11.00
10.00
1998
2000
2002
2004
Q205
Q405
Q206
Q406
Q207
Q407
15.00
13.00
11.00
9.00
7.00
5.00
3.00
1.00
Total
past
dues
90 day + past dues
P. Teplý / L. Černohorská | SEBON Journal - V (2011) 18-34

23
By mid-2005, the US market saw increasing delinquency rates on sub - prime adjustable-rate mortgages (ARM), which historically has been a good predictor of future foreclosure rates. Consequently, in mid-2006, the situation deteriorated as the US housing prices started to fall (see Figure 3) and delinquency rates surged on sub-prime mortgages (see Figure 4) and later also on prime mortgages (to a lesser extent).
Figure 2US house prices in 1998-June 2008
Source: S&P/Case Shiller
Figure 3The US subprime mortgage delinquency rate in 1998-2007
Source: ADL (2008)
2.4 Securitization Securitization is a modern financial process whereby cash flows from traditional bank assets (for example, mortgages or receivables from credit cards) are pooled and repackaged into securities that are then sold to investors. An example of securitization is the asset-backed securities (ABS) markets, which in 2007 exceeded $2.4 trillion (see Figure 5). With securitization, a bank can issue a bond with pooled assets serving as collateral, but the credit rating assigned to the new security is based on the reserve requirements, often leading to AAA rated securities. Meanwhile, the assets are included in any computation of the bank’s capital ratio. However, the essence of securitization is that banks can avoid these constraints if a separate entity is established (special purpose vehicle or SPV). The bank sells then the asset pool to the SPV, which pays for the assets from the proceeds of the sale of securities3.
Figure 4 explains main principles of securitization and implicates that, among others, mezzanine structured-finance CDOs (Collateralized debt obligation) with AAA rating were backed by subprime mortgage bonds below BBB rating.
Figure 4Matryoshka - Russian Doll: multi-layered structured credit products
based on Fabozzi et al. (2008) and IMF (2008a)
3 For more details about securitization see Fabozzi, Kothari (2008) or Mejstrik, Pecena, Teply (2008).
Subprime mortgege loans
Subprime mortgage bonds High-grade structured - finance CDO
AAA 80%
11%
4%
3%
2%
AA
A
BBB
BB-unrated
Senior AAA 88%
Junior AAA 5%
AA 3%
A 2%
1%BBB
1%Untrated
Mezzanine structured - finance CDO CDO - squared
Senior AAA 62%
Junior AAA 14%
AA 8%
A 6%
6%BBB
4%Untrated
Senior AAA 60%
Junior AAA 27%
AA 4%
A 3%
3%BBB
2%Untrated
P. Teplý / L. Černohorská | SEBON Journal - V (2011) 18-34

24
Figure 5 demonstrates that the global issuance of bonds backed by mortgages saw a rapid annual growth until the year 2005. However, not only mortgages have been securitized; Figure 6 depicts how securitized credit card receivables amounted 14 percent (USD 346 billion) of total ABS outstanding in the US in 2007, while securitized auto loan receivables reached 8 percent (USD 198 billion).
Figure 5Global issuance of bonds backed mortgages in 1995-2008
$ (billions)
2,500
2,000
1,500
1,000
500
01995 1996 1997 1998 1999 2000 2001 2002 2003 2004 2005 2006 2007 2008
YearResidential mortgages Sub - prime mortgage Commercial mortgages
Other asset - backed securities (includes car, credit card and student loans)
Source: Bank of England
Figure 6ABS outstanding by collateral in the US as of the end of 2007 based on
SIGMA (total = USD 2,472 billion)
Source: Bank of England
Other 5% Student Loan
10%
Auto8%
Credit Cards14%
Equip.2%
Home Equity24%
CDOs37%
P. Teplý / L. Černohorská | SEBON Journal - V (2011) 18-34

25
3. Risk management during the crisis3.1 Key market playersBefore presenting risk management lessons, the key players during the 2007-9 global financial turmoil need to be identified. We have divided these players into six groups: mortgage originators, risk shifters/transformers, investors, insurers, rescuers and others (see table 2).
Table 2Key players during the crisis
* ABCP = asset-backed commercial paper, SIV = structured investment vehicle
3.2 Main risks involvedAs figure 12 indicates, the pending crisis started as a credit crisis (from mid-2007 until August 2008) and later became a liquidity crisis (since September 2008). Although this figure is simplified (e.g. only CDOs and general SPV structures are considered), it shows the main money flows during the crises. We should note that the existence of US government guarantees on behalf of government-sponsored (GSE) - Fannie Mae and Freddie Mac - have distorted the CDO market significantly. As a result of these state guarantees, market players considered CDOs as safe financial instruments, although they were actually backed by low-quality underlying assets such as subprime mortgages.
1. Mortgage originators • Lenders • Commercial banks2. Risk shifters/ transformers • Commercial banks • Investment banks/prime brokers • Government-sponsored enterprises • SPVs (ABCP/SIV/conduits)*3. Investors • Commercial banks • Investment banks • Hedge funds • Pension funds • Insurance companies • Investment funds • Private investors
4. Insurers • Insurance companies • Monoline insurers • Reinsurence companies 5. Rescuers • Central banks • Governmental institutions • Sovereign wealth funds • International Monetary Fund • Private investors6. Others • Rating agencies • US government • Regulatory bodies
P. Teplý / L. Černohorská | SEBON Journal - V (2011) 18-34

26
Figure 7The credit and liquidity risk during the pending crisis.
Other than credit and liquidity risks, risks such as operational, market, off-balance sheet, contagion, systematic, regulatory and globalization risk have materialized concurrently (table 3). We should note that only credit, market and operational risks are covered in Basel II requirements, while the others are not.
Table 3Risk typology
Risk Short description ExampleCredit Risk to a financial institution of losses resulting from
the failure of a counterparty to meet its obligations in accordance with the terms of a contract under which a financial institution has become a creditor of the counterparty
Default of mortgage borrowers
Bankruptcy of Lehman Brothers
Liquidity The probability of a situation when a financial institution cannot meet its proper (both cash and payment) obligations as they become due.
Overall lack of liquidity in inter-bank markets
Operational Risk to a bank of loss resulting from inadequate or failed internal processes, people and systems, or the risk to a bank of loss resulting from external events, including the legal risk
Mortgage frauds by dealers
Misconduct of managers
Market Risk to a financial institution of losses resulting from changes in prices, exchange rates and interest rates on the financial markets
Sudden increase in interest rates
Credit risk Liquidity risk
Borrower
Lender/Bank GSE
USGovernment
Reinsurer
Insurancecompany
SPV
Central bank
InternationalInstitutions
GovernmentInstitutions
Commercialback
Hedgefunds
SovereignWealth funds
$$$Mortgage
$$$Mortgage
Guarantees
CDO$$$
Investors
$$$CDO
Insurance
$$$ST debt
$$$
$$$
$$$
$$$
ST debt$$$
$$$ST debt
$$$$$$
$$$
$$$
$$$
P. Teplý / L. Černohorská | SEBON Journal - V (2011) 18-34

27
Off-balance sheet
Risk that off-balance assets/liabilities appear on a balance sheet of a financial institution
Off-balance sheet SPVs became balance-sheet items
Contagion Risk of a negative indirect impact of other financial institutions on a financial institution itself the transmission of an idiosyncratic shock affecting one bank or a group of banks to other banks or other banking sectors
Mistrust in inter-bank/short-term markets
Systematic Risk that cannot be diversified through portfolio diversification
Worldwide market crash
Regulatory The risk of potential loss due to the violation or a sudden change of the regulatory framework
Change in regulatory framework of credit derivatives/OTC market
Globalization The risk of worldwide contagion - increasingly correlated markets and a decoupling of markets
Worldwide global turmoil
4. Lessons from the crisis The current global financial upheaval raises more than a few issues related risk management tools, processes and techniques, which collectively reveal several lessons for the future development of the financial markets. Although they may be difficult for the market as a whole to appreciate, we find both negative and positive lessons from this crisis.
4.1 Negative lessonsThe negative lessons can be divided into three groups: financial products and valuation, processes and business models, and strategic issues (see table 4).
Table 4Negative lessons
Issue Description Who failed Lesson
Financial products and valuation
Adjustable-rate-mortgage (ARM)
Lack of information about ARMs for borrowers
Mortgage originators, regulators, GSE
More publicly-available information for consumers
Credit default swaps
Unregulated credit default swaps/OTC market
Regulators, risk managers
Sensitive regulation of OTC markets
P. Teplý / L. Černohorská | SEBON Journal - V (2011) 18-34

28
Financial innovations
Financial innovators were one step before regulators
Regulators, rating agencies
Sensitive regulation of new products
Structure product valuation
Nobody understood risk inherent in structured products
Rating agencies, internal auditors, risk managers, regulators, GSE, investment banks
Better both external and internal regulation of structure products
Processes and business models
Basel II requirements
Reliance on ratingRWA concept failed
Regulators Failed rating assessment
Broker-dealer had low RWAs but higher leverage
Mortgage frauds High fees for dealers/low lending standards
Mortgage dealers, mortgage originators, GSE
NINJA /stealth loans
Originate-to-distribute model
Banks with no incentives to assess borrower’s creditworthiness
Regulators, internal auditors
Better regulation of risk management processes
Rating agencies RAs did not evaluation true risk of securitized products
RAs, investors, regulators, risk managers, internal auditors
RAs should evaluate credit + liquidity + systematic risk
Reliance on rating
Strong reliance on incorrect rating assessment
Investors, regulators, risk managers, internal auditors
Investors should do own valuation of investments
Risk management process
Inadequate process, weak supervision
Internal auditors, regulators, top and risk managers
Better regulation of processes
Use of OBS vehicles
Banks used OBS vehicles to avoid capital requirements
Top and risk managers, regulators
Better regulation of OBS vehicles (e.g. Basel II)
Wholesale funding
Reliance on wholesale funding possible in good times
Risk managers Liquidity risk might be stress-tested
Strategic issues
Corporate governance (principal-agent problem)
Top managers preferred own interest to company’s interest
Top managers, regulators, shareholders
Motivation of managers on long-term goals of a company
P. Teplý / L. Černohorská | SEBON Journal - V (2011) 18-34

29
Fair-value accounting
Fair-value accounting caused further price falls (fire-sale prices)
Risk/finance managers
Fair-value accounting is a good concept
Government guarantees
US government guarantees to GSEs totally distorted the financial market
US government “Careful” state guarantees
Moral hazard State bailouts/support of private financial institutions
Governments “Careful” state intervention
Too-big-too-fail doctrine
State rescues of AIG, GSEs, Icelandic and UK banks etc.
Governments, international institutions
“Careful” state intervention
Too-connected-too-fail doctrine
State rescues of AIG, GSEs etc.
Governments, international institutions
“Careful” state intervention
Transparency Lack of transparency in securitization process, blurred structures of SPVs
Regulators, securitization originators (investment banks, GSEs)
Encouragement of self-discipline of market players
Notes: ARM = adjustable-rate-mortgage, GSE = Government-sponsored enterprises, OTC = over-the-counter, OBS = off-balance sheet, RA = rating agency, RWA = risk-weighted assets, SPV = special purpose vehicles
4.2 Positive lessons and winnersDespite the above-mentioned negatives, we can find several positive lessons and winners from the current situation (table 5).
Table 5Positives and winners of the crisis
Positives Winners
1. Governments were not the only buyer 1. Politicians (takes power over nationalized companies)
2. Central banks provided liquidity support to banks/insurers
2. Institutional investors (JPMorgan, Nomura etc.)
3. Investments from sovereign wealth funds (now decreasing, though)
3. Private investors (Warren Buffet etc.)
P. Teplý / L. Černohorská | SEBON Journal - V (2011) 18-34

30
4. Valuation techniques worked (some investors bought distressed assets)
4. The International Monetary Fund (will justify its existence)
5. Proper regulation/new prudence rules are expected (Basel II revision4)
5. Bankruptcy lawyers/advisors (will assist to companies in trouble)
6. Falling (speculative) oil prices; assets more realistically priced
6. Academics (will write about the crisis and produce future outlook)
7. World-wide inflation threat receded.
4.3 The role of ethics in decision-makingDerived from moral philosophy, ethics are the study of moral values and guidelines that focus on defining concepts such as right and wrong or justice versus criminal. There are many applications of moral philosophy that have filtered into the structure of how entire industries operate. For example, doctors swear the Hippocratic Oath, lawyers adhere to rigid standards or face disbarment and accountants are required to follow ethical standards. As other industries have acknowledged the need for addressing conflicts of interest as new technologies arise, such as the field of bio-ethics, the field of finance has somehow eluded this age-old consideration.
The recent scandals and crises attest to the need for some kind of standard or value to be added to the purely capitalistic profit motive so that short-terms profit goals do not disrupt or destroy entire firms or economies in the long-term. The question of how to accomplish this has been posed in board rooms, government forums and in the media. Cohan (2010) raises the question that if the incentives on Wall Street had been arranged to punish excessive risk-takers by causing the executives in charge to lose their jobs and homes if they were undertaking excessive or dangerous risk, wouldn’t that have averted the crises from the last 25 years? Cohan (2010) also points out that in the partnership business model, partners shared in the profits of the firm but also were also responsible for covering for the financial losses of the partnership during an unprofitable period. Cohan’s point is that “Rewarding prudent risk-taking on Wall Street while punishing recklessness would result in a new ethic on Wall Street, one not solely driven by generating as much revenue as possible in a given fiscal year with no regard to the long term.”
Moreover, Lew.is (2000) and Cohan (2010) have suggested that aligning incentives on Wall Street, specifically compensation and other rewards, with a longer-term, financial stability-oriented perspective would provide the guideline that would prevent crises. Others have suggested that government oversight
4 For more details about Basell II requirements see Teply et al. (2007) , Mejstrik et al. (2008) or Teply (2010)
P. Teplý / L. Černohorská | SEBON Journal - V (2011) 18-34

31
needs to be strengthened. “The cozy relationship between FINRA and the securities industry has resulted in pervasive conflicts of interest, and ought to raise doubts about whether FINRA can ever be an effective regulator,” wrote the nonprofit group, Project On Government Oversight (POGO) in the latest salvo on the ineffectiveness of a self-regulating authority to protect Wall Street from Ponzi schemes to outright theft and excessive risk-taking. The POGO is requesting government oversight of the business sector, which appears to fly in the face of the capitalist creed, but given the pervasiveness of certain aspects of human nature, there may be a need for independent oversight.
Certainly, eliminating conflicts of interest, adding transparency and the separation of duties are basic ethical standards that need to be reinforced in throughout the finance industry. Regardless of the method, by changing incentives or creating new government authorities, encouraging a value-driven perspective to compete against the drive to garner short-term profits at the expense of the whole makes sense. We suggest that an ethics-based didactic needs to be introduced both at the academic level (theory) and in the daily operations (praxis) of financial firms. Since the tone of operating comes from the top, it is incumbent on academics and senior corporate managers to promote a standard of right from wrong, to support business models and processes that are in alignment with ethical concepts and to provide a method for correction when necessary. As an example, the Financial Executives International, an independent organization for business executives specifically outlines in its code of ethics that all members will act with honesty, integrity and will avoid actual or apparent conflicts of interest and will also report members who violate this standard to the organizations’ board for resolution according to the rules of procedure. In this case, the authors are focusing on the fact that there is a built-in method for addressing and resolving ethics issues. Currently, on Wall Street, while each member firm can claim to operate within accepted legal standards, relying on Sarbanes-Oxley (2001) or the willingness of employees to come forward to report violations is apparently an insufficient resource.
In summary, the discussion of ethics can revolve around definitions of auditing, competence, diligence, prudent man standards versus fiduciary care and other care standards. What is not in debate however is the standard of professionalism, where the integrity of the investment and banking profession is upheld and is not in conflict with putting the interests of the clients above Wall Street’s interests. Ultimately, by introducing an ethics-based didactic model and a professional standard for industry participants, the long-term integrity of the market as a whole can be protected and financial crises may be averted without sacrificing growth or development.
P. Teplý / L. Černohorská | SEBON Journal - V (2011) 18-34

32
5. Future outlook As we noted earlier, the US sub-prime crisis had roots in the macroeconomic imbalances of the US economy and Federal government policies. On a related note, the credit crisis has spread over the global financial markets and negatively effected global macroeconomic situation. We believe that the 2007 credit crisis was the first phase of the overall global crisis (Table 6). In the first phase, the virtual or “intangible” economy–encompassing paper losses in financial institutions´ books– was affected through the subprime meltdown (cross-product contagion from mortgage-backed securities to credit derivatives markets, inter-bank markets, leverage lending markets etc.) and the accounting requirement to mark assets to market, resulting in asset price write-downs that often reflected illiquid markets but not actual value on a cash flow basis.
During the second phase starting in 2008, the real (or more tangible) side of the US economy was affected. Household consumption fell, foreclosures on home-equities are rising and higher unemployment resulted in lower disposable personal income. The US households had less money to repay their debts (mortgages, auto loans, credit cards) and aggregate demand will fall deeper. Responsible individuals are cutting spending and putting off investments (e.g. home improvement) as a response to the economic instability, leading to spiraling down economies for many local US areas.
Finally, during the third phases, due to economic inter-dependence the US troubles spread cross-border and would negatively affect foreign trade and global capital flows. Consequently, export-dependant economies would see a decline in their export, what would further harm a global economic situation. Further, the inter-dependence of the global economy has been demonstrated by the recent instability of the Greek economy affecting the US and other world markets. Consequently, if the US market falters, then the impact on other economies is thus correspondingly more destabilizing.
Table 6Taxonomy of a crisis
Impacts Transmission mechanism Outcome Period
First-orderCross-product contagion:
derivatives and structured productsVIRTUAL ECONOMY
De-riskingDe-leveraging 2007-2010
Second-order
Asset-dependent real economiesREAL ECONOMY
Consolidation of consumption and
homebuilding2008-2013
Third-order
Cross-border linkages trade and capital flows
REAL ECONOMYExport and vendor
financing risks 2009-2015
Source: Teply (2010)
P. Teplý / L. Černohorská | SEBON Journal - V (2011) 18-34

33
6. ConclusionWhile the form of crises may change, their essence remains the same – repeating cycles of abundant liquidity, low interest rates, rapid credit growth, and a low-inflation environment followed by an asset-price bubble. The current market turbulence began in mid-2000s when the US economy shifted to an imbalanced macroeconomic position. By 2007, mounting defaults in the US sub-prime mortgage market led to US market instability, unleashing a global fiscal contagion that spread around the world, roiling markets and causing world economic upheaval. This contagion led to, for example, the nationalization of big financial institutions, bank failures, the end of an era in investment banking, increased federal insurance on banking deposits, government bailouts and opportunistic investments by sovereign wealth funds.
The 2007-2009 global financial upheaval has taught risk management lessons that will be crucial for future financial markets development. We have extrapolated both negative and positive lessons deriving from these crises. The negative lessons are divided into three groups: financial products and valuation (e.g. failure of rating agencies when valuating structured products), processes and business models (e.g. the failed originate-to-distribute model), and strategic issues (e.g. moral hazard or principle-agent problem). The positive lessons suggest that some parties can benefit from upheaval. Moreover, the recent crises ended the decoupling myth by heralding an emphasis on globalization risk as a function of increasingly correlated and contagious market performance, limited (discontinuous) exits and illiquidity.
The discussion of ethics can revolve around definitions of auditing, competence, diligence, prudent man standards versus fiduciary care and other care standards. What is not in debate however is the standard of professionalism, where the integrity of the investment and banking profession is upheld and does not conflict with putting the interests of the clients above Wall Street’s interests. Ultimately, by introducing an ethics-based didactic model and a professional standard for industry participants, the long-term integrity of the market as a whole can be protected and financial crises may be averted without sacrificing growth or development.
The pending global market turbulence negatively affected financial institutions’ performance. To offset this drop in profits, pressure on lower costs and related cost-cutting initiatives might be expected in financial institutions during coming months. Moreover, we recommend the following four policies to protect against repeating these errors and limiting future risk exposure: internationally-coordinated policy when funding private financial institutions, tighter regulation and a higher level of transparency for financial markets, revision of Basel II requirements, and a change in financing rating agencies.
P. Teplý / L. Černohorská | SEBON Journal - V (2011) 18-34

34
These steps should help diminish the negative impact of future potential crises by adding higher credibility, accountability, transparency and risk diversification of the world financial markets.
ReferencesChalupka, R., P. Teply, 2008, Operational risk management and implications for bank’s
economic capital – a case study, IES Working Paper Series, 17, IES FSV, Charles University.
Cohen, W., 2010, Lehman’s demise, dissected, retrieved 29 March 2010 from http://opinionator.blogs.nytimes.com/2010/03/18/lehmans-demise-dissected/ECB (2007). EU Banking Sector Stability, November 2007.
Fabozzi, F. J., V. Kothari, 2008, Introduction to securitization, Wiley.Fabozzi, F. J. et al., 2008, Subprime mortgage credit derivatives, Wiley.FEI, 2010, Code of ethics, retrieved 29 March 2010 from https://
www.financialexecutives.org/eweb/DynamicPage.aspx?Site=_fei&WebKey=296ab9ff-d4d9-42ab-bd45-41637fc8baab
IMF, April 2008a, Global Financial Stability Report._____, October 2008b, Global Financial Stability Report.Lewis, D., 2000, Papers in ethics and social philosophy, Cambridge University Press,
United Kingdom.Mejstřík, M., M. Pečená, P. Teply, 2008, Basic principles of banking, Karolinum press,
Czech RepublicRippel, M., P. Teply, 2008, Operational risk - scenario analysis, IES Working Paper 15,
IES FSV, Charles University.Roach, S.S., August 2008, Pitfalls in a post-bubble World, Morgan Stanley Research. Teply, P., K. Diviš, L. Černohorská, 2007, Implications of the new basel capital
accord for European banks, E+M Journal, Czech Republic, 1.Teply, P., 2010, The Truth About The 2008-2009 Crisis: A hard lesson for the global
markets. VDM Verlag, Germany.Zeleny, M., 2008, World financial crisis has long roots, Czech Business Weekly, 39.
P. Teplý / L. Černohorská | SEBON Journal - V (2011) 18-34

35
Problems and prospects of stock market in Nepal
Pradip Kumar MainaliFreelance researcher
AbstractThis study aims to examine the problems and prospects of stock market in Nepal. Correlation and regression analysis are used to analyse the secondary data and chi-square test is performed to analyse survey responses. Various measures of stock market development indicate that the stock market in Nepal is creeping and unable to show significant positive impact in the economy. Minimum participation of real sector and high concentration ratio, especially banking sector dominance indicate that the stock market is risky and illiquid. The findings based on primary data suggest that coordination among authorities and political stability are necessary for the sustainable development of stock market in Nepal.
Keywords: Market capitalization; liquidity; concentration; price volatility; stock market
1. IntroductionStock market is an important institutional mechanism that plays a crucial role in the economy by channelling investment where it is needed. The activities of buying and selling securities in the stock market are extremely important for the efficient allocation of capital within economies (Adhikari (2011)). If the financial transmitting mechanism, such as stock markets, is inefficient, the flow of funds to real investment will be impeded, and the level of activities will fall below the potential (Ritter and Silber (1993)). Stock market and banks are two competing mechanism to channel savings into investment. However, the stock markets exceed banks in allocation efficiency. It allocates the funds to investment which have potential to yield higher return. The well-functioning stock market promotes economic development by fuelling engine of growth through faster capital accumulation and tuning it through better resource allocation (Carporale, Howells, and Soliman (2004)). An organised stock market stimulate opportunities by recognising and financing productive projects that lead to diversify risk and facilitate exchange of goods and services (Mishkin (2001)). Similarly, the importance of stock market lies in raising capital for business, mobilising saving for investment, facilitating company growth, redistribution of wealth, development of corporate governance, creating investment opportunities for small investors, raising capital for development projects, and working as barometer of the economy (http://www.nccur.lib.nccu.edu.tw). It is necessary to find if Nepalese stock market contains such importance.
In 12th century, France the Courratiers de Change were concerned with managing and regulating the debts of agriculture communities on behalf of

36
the banks. They could be called the first brokers because these men were the first who traded with debts. In the middle of 13th century, Venetian bankers began to trade in government securities. Bankers in Pisa, Verona, Geneva, and Florence also began trading in government securities during the 14th century. The Dutch later started joint stock companies, which late shareholders invest in business ventures and get a share of their profit or losses. In 1602, Dutch East India Company issued the first share on the Amsterdam Stock Exchange. It was the first company to issue stock and bonds (Bhattarai (2010)). However, the historical background of stock market in Nepal starts with the establishment of Biratnagar Jute Mill in1936 AD and Nepal Bank Ltd. in 1937AD. Securities Exchange Centre was established in 1976 with an objective of facilitating and promoting the growth of capital market, before conversion into Nepal Stock Exchange Ltd. (NEPSE). It was the only stock market institution undertaking the job of brokering, underwriting, managing public issues, market making for government bonds and other financial services. NEPSE opened its trading floor for its members first on January 13, 1994, which could only accommodate 50 members adopting an open out-cry system, which later on replaced by the partial automation system for the transaction of securities (http//www.nepalstock.com). The economic size of Nepal is increasing rapidly along with her population growth. In the first nine months of the fiscal year 2010, NEPSE made necessary arrangement for conducting securities transaction in major cities such as Biratnagar, Pokhara and Narayanghat through expansion of Kathmandu centred broker’ services (Ministry of Finance (2010)).The NEPSE index is considered as the measure to show the economic phenomena of Nepal. Stock market index and economic performance should have positive relationship but in Nepalese context, it seems that the NEPSE index is guided by political factors and fraudulent practices including pooling, warehouse, organized runs, ramping, wash sale, matching, and insider trading. Wang, Winton, and Yu (2010) found that investor beliefs on corporate fraud and suggested regulators and auditors to work as vigilant for fraud. The Nepalese stock market is characterised by a low trading volume, absence of professional brokers, early stage of growth, limited movement of share prices, and limited information available to investors (Pradhan (2006)). Similarly, Paudyal (2010) stated that the demand side has suffered due to the volatile macroeconomic environment as investors are investing more in securities with the short term perspective. Small investors are not resistant to hold stocks for long term perspective (Sullivan (2011)). Most of the Nepalese stock investors are involved in hunch. Stock market is dominated by mandatory issue of financial institutions as per the provisions of Bank and financial institution Act, 2006 and directives of Nepal Rastra Bank. Securities issues of other than bank and financial institution are negligible. In one side, people seem interested
P. K. Mainali | SEBON Journal - V (2011) 35-58

37
to invest only on limited kinds of companies and another; most of them even do not have sufficient knowledge. It all shows that the development of Nepalese stock market is still in initial phase. With all these gaps and rationale in mind this study aims to examine the problems and prospects of stock market in Nepal.
The rest of this paper is organised as follows. Section 2 presents review of literature. Section 3 describes research methodology employed in this study. It includes nature and sources of data; and method of analysis. Section 4 provides analysis of data. Finally, conclusion is presented in section 5.
2. Literature review Well-developed stock market enhances efficiency of market for corporate control by mitigating the agency problem between the stock owner and managers in countries where stock market discipline is effective (Diamond and Verrechio (1982)). A stable macroeconomic environment is a pre-requisite for the development of stock market. An unstable macroeconomic environment creates the problems of informational asymmetries and makes the financial system vulnerable (K.C. (2010)). The fortune of Nepalese stock market partly depends on the positive role of the government in supporting the efforts of Securities Board of Nepal (SEBON) for regulatory and institutional strengthening and partly on the will-power and ability of SEBON leadership to translate the dreams into proactive plan and policies and their effective implementation. It is crystal clear that the current filthy political situation of the country is largely responsible for the continuous slide of stock market index though it is because of corrective reason to some extent (Paudyal (2010)). The political instability and lack of conscious policies hurts the stock market development. Budgetary policy is a tool that brings the changes on stock market behaviour (Sing and Kansal (2010)). Real factors such as the weather, political instability, political decisions, war, terrorist threats, boycotts and strikes, economic trends and international trade or even company scandals are also the factors affecting stock market development (www.enotes.com). Important challenges are going forward to establish the close coordination among regulators (Hoshi (2011)). The dispute on controversial policies among NRB, Insurance Board (Bima Samiti) and SEBON, the requirement of central securities depository, privatization of NEPSE, requirement of mutual fund/trust act, instrument diversification, and strong commitment of authorities are some of the current issues for the development of stock market (Paudyal (2010)). It shows that the Nepalese stock market development is on turmoil and still in developing stage; hence rigorous steps are to be taken for its development.
As country become richer, wealthier household and corporation have more complicated financial needs, and financial markets emerge to meet this
P. K. Mainali | SEBON Journal - V (2011) 35-58

38
demand. But this is not the whole story. India has a highly emerging stock market while other low income countries find it so difficult to develop. There are many examples of failed efforts to develop stock markets. In the early- to mid- 1990s, attempts to develop stock markets in the Gambia and Zambia did not prove successful. These countries’ stock exchanges could not generate the fees to be self-sustaining. Besides differences in income, some of the differences in experience can be explained by differences in legal systems, the availability, and quality of information, and corruption. Hiring Management consultants for small and poor performance companies can be costly endeavour and problem in some extent (Berg and Gibbons (2011)). Poor management and poor performance of companies is detraction for stockholders (Colpan, Yoshikawa, Hikino and Brio (2011)). Little participation on stock investment is the phenomena of developing countries (Chironga, Leke, Wamelen, and Lund (2011)). Low income, inadequate laws and regulations, information problems, corruption and lack of enforcement all play a role in deterring stock market development (KC (2010)). So, it is felt necessary to find whether the small market size and other stock market problems deterring for the development of Nepalese stock market.
The impact of stock market on GDP is studied with saving, investment, and stock market variables together (Demurguc-Kunt and Levine (1996)). Saving is income not consumed which is one of the most important sources of investment (Eatwell (1987)). Pardy (1992) noted the importance of stock market to mobilise the domestic saving into investment. The mobilization of saving to investment increases the financial intermediaries (Pradhan (2006)). Investment is the expenditure made for the formation of the fixed capital which increases the GDP. The theories in finance suggest that stock market promote long term economic growth (KC (2010)). Increase in economic growth increases the market size i.e. market capitalisation (MC); and increase in liquidity, i.e., traded value (TV) and turnover (TO) lead to increase the economic growth. The stock market indicators such as MC, TV, and TO are subsidiaries of development as well as indicators of economic growth. Volatility (V) occurs due to fluctuation in economic performance and peoples’ expectation (www.sharemarketworld.com). Hence, it is felt necessary to find whether stock market variables along with saving and investment have causal relationship in the context of Nepalese stock market.
The market size measured by MC, liquidity measured by TV, TO, and V are positively related to GDP (Demurguc-Kunt and Levine (1995)). Kunt and Levine (1996) studied the correlation among stock market indicators and GDP. Market size, liquidity measured by total value traded ratio, turnover, concentration, and average institution development indicator is significantly positively correlated with the total value traded ratio. And the average institutional development indicator is significantly negatively correlated with pricing error and volatility.
P. K. Mainali | SEBON Journal - V (2011) 35-58

39
Countries with big stock market have less volatile and more efficient stock market and high volume of trading relative to GDP. Countries with highly concentrated markets have under developed stock markets. Market concentration is significantly negatively correlated with market size and market liquidity and significantly positively correlated with pricing error and the countries with well-developed regulatory and institutional system; tend to have large liquid stock markets. The study by Levine and Zervos (1998) found the causal relationship of stock market variables to GDP. Ahmed, Shahbaz, and Ali (2008) investigated the relationship between stock market development and economic growth in the case of developing countries. The study with annual time series data of Pakistan from 1971 to 2006, have shown strong positive relationship of stock market development with economic growth. The findings indicate that stock market plays a vital role for resource mobilisation, employment generation, and economic growth. Gurung (2004) analysed the trend and performance of Nepalese stock market using data for the year mid-July 1994 to mid-July 2003 and concluded that the stock market in Nepal is poor and unstable. G.C. and Neupane (2006) examined the causal relationship between economic growth and stock market based on time series data from the year 1988 to 2005 and found that the stock market growth and economic growth have long run stable and causal relationship. Similarly, Joshi (2010) found that the stock market variables and economic growth are correlated. The study of stock market relation to national economy, its issues, and challenges is obviously necessary for formulation and implementation of the national plans and policies.
Based on the aforementioned perspective of stock market, this study seeks to address the trend of stock market variables, the relationship of stock market variables with GDP, and a brief sketch regarding the problems and prospects of stock market in Nepal.
3. Data and methodologyTo carry out the study, secondary as well as primary sources of information are used. In the process of secondary data analysis correlation and regression analysis have been used. Correlation analysis is applied to find the relationship of one variable with another, and regression analyses used to show the causal relationship of GDP with stock market variables. The primary data are the responses regarding various problems and prospects of stock market; provided by investors, stockbrokers, and NEPSE/SEBON officials on the questionnaire. Chi-square test is applied to find whether there are difference in views of stockbrokers, investors, and NEPSE/SEBON officials.
The relevant data are collected from secondary sources covering the study period mid-July1994 to mid-July 2009. The data on the variables like gross
P. K. Mainali | SEBON Journal - V (2011) 35-58
40
domestic saving, gross domestic investment, turnover, market capitalization, values of traded shares are collected from the following sources: (a) NEPSE (b) SEBON (c) Central Bureau of Statistics, and (d) Ministry of Finance.
Investors, stockbrokers, and NEPSE / SEBON officials were considered as total population of this study. A total of 86 investors, who were met in the display room of different stockbrokers were provided with the questionnaires, out of which only 27 responses were obtained. The questionnaires were provided to all 23 stockbrokers but only 20 of them responded. There were four senior officers and eight officers in NEPSE. Assuming that the officer level staffs of NEPSE are well informed about the stock market, hence, the questionnaires were provided to all of them. Only four of them returned the questionnaires. There were eight persons in the management committee of SEBON, who were considered best informed persons about the stock market. The questionnaires were provided to all of them and out of which only three responses were obtained.
In this study, correlation analysis and regression analysis are used to draw the inferences from the results based on the data collected from secondary sources. The results of sample survey are presented in table. Ranking, percentage, and hypothesis testing (X2-test), are applied according to the nature of the questions asked.
Trend analysis is used in this study to explore the current status of Nepalese stock market, by analysing and comparing the time series data of relevant economic and stock market variables of period of 16 years.
Correlation analysis is a statistical tool which measures the degree of relationship between the variables under consideration. Correlation analysis is applied to find the relationship between the following variables: real gross domestic product (GDP), MC, TV, TO and volatility of NEPSE price index (V).
Regression equations are estimated to show the casual relationship between GDP growth variables and stock market variables. In regression equations, GDP is used as dependent variable. Market capitalization, traded value, turnover, and volatility are used as determinant variables. Since GDP growth is not only determined by stock market variables but also it is determined by other variables like saving, investment, hence, they are also used in regression analysis. The regression equations that are used in this study are as follows:
Log GDP = a + b1 log S + b2 log I + b3 log MC ……………….. (1)Log GDP = a + b1 log S + b2 log I + b3 log TV ……………….. (2)Log GDP = a + b1 log S + b2 log I + b3 log TO ……..………..... (3)Log GDP = a + b1 log S + b2 log I + b3 log V ……………....... (4)
P. K. Mainali | SEBON Journal - V (2011) 35-58

41
Where, dependent variable ‘GDP’ is gross domestic product and independent variables are: ‘S’ (saving), ‘I’ (investment), ‘MC’ (market capitalization), ‘TV’ (traded value), ‘TO’ (turnover), ‘V’ (volatility), and a, b1, b2, b3, regression parameters.
In this study, X2-test is used to find the independence of attributes among the different groups of respondents, i.e., investors, stock brokers, and NEPSE/SEBON.
4. Analysis of dataTable 1 presents the trend of stock market development in Nepal during the period of 1994 to 2009. The average number of companies offering public issues (IPOs) is nearly 21 during the observation periods. The number of companies offering public issues was 17 in 1994, whereas in 2009 the number of companies’ offerings IPOs is 64, which is around a little less than four times more than that of 1994. It shows that more companies are going on public. Increase in public companies means increase in size of stock market, thereby, increasing liquidity and economic growth (Oskooe, (2010)). In the Nepalese context too, the increasing public companies signify that the size of Nepalese stock, market, liquidity as well as its economic growth is increasing.
Table 1Trend of stock market development
This table shows the trend of stock market development. The trend of stock market development can be analysed by different stock market indicators, its size, and liquidity. Although there are various measures; the number of listed companies, market capitalization, traded value, turnover, volatility, and concentration are the main measures which are analysed in this study. Market capitalization ratio (MCR) is the ratio of aggregate market value of listed shares to GDP. Traded values (TV) means the total values of traded shares. Turnover ratio (TOR) is the traded value of listed share to market capitalization (MC). Volatility (V) is the fluctuation of stock prices. Concentration (C) is the traded value covered by few large companies.
(Rs. in million)
Fiscal year No-minal GDP
Public issues IPOs
Listed com-
paniesMCR
Traded value/GDP
TOR V C
Mid-July 1994 191596 17 66 0.07 0.002 0.03 68.87 NA
Mid-July 1995 209976 12 79 0.06 0.005 0.08 18.86 NA
Mid-July 1996 239388 12 89 0.05 0.0009 0.02 11.11 0.72
Mid-July 1997 269570 5 95 0.05 0.001 0.03 3.48 0.68
P. K. Mainali | SEBON Journal - V (2011) 35-58

42
Mid-July 1998 289798 12 101 0.05 0.006 0.01 6.98 0.66
Mid-July 1999 330018 5 107 0.07 0.004 0.06 16.18 0.65
Mid-July 2000 366251 9 110 0.12 0.003 0.03 51.16 0.69
Mid-July 2001 413429 9 115 0.11 0.006 0.05 60.34 0.66
Mid-July 2002 430397 16 96 0.08 0.003 0.04 40.27 0.68
Mid-July 2003 460325 17 108 0.08 0.001 0.02 7.69 0.61
Mid-July 2004 500699 16 114 0.08 0.004 0.05 5.80 NA
Mid-July 2005 548485 14 125 0.11 0.008 0.07 24.46 0.61
Mid-July 2006 611118 29 135 0.12 0.006 0.04 35.33 0.67
Mid-July 2007 675859 34 135 0.28 0.012 0.04 83.92 0.66
Mid-July 2008 755262 64 142 0.48 0.030 0.06 104.54 0.52
Mid-July 2009 910160 64 159 0.56 0.023 0.04 146.91 0.37
Average 20.94 - 0.15 0.007 0.04 42.87 0.63Source: Appendix I and appendix II
The size of stock market can also be measured in terms of number of listed companies. Securities related Act, 2007 prohibits securities trading without listing in NEPSE. The number of listed companies was 66 in 1994, which increased to 159 in 2009. The total number of listed companies increased to 192 at the end of 2010 (www.nepalstock.com). The number of listed companies on New York Stock Exchange is 3657 at September 2010 (www.nyse.com). Similarly, at the end of 2010, the number of listed companies on National Association of Securities Dealers of Automated Quotation is 4338 (www.nasdaq.com). The number of listed companies on Hong Kong stock exchange is 3999 (www.hkex.com), Tokyo Stock Exchange is 2414 (www.tse.or.jp), and London stock exchange is 2713 (www.londonstockexchange.com). Comparing the number of listed companies of developed stock markets, NEPSE has a very few listed companies. So, one of the reasons behind a few listed companies, is the underdeveloped stock market and backward industrialisation.
The market capitalization ratio is around 0.15 in an average during the study period. This shows that the size of market capitalization is 15 percent of GDP for the study period. Demiurgic-Kunt and Levine (1996) shows that countries such as South Africa, Hong Kong, Malaysia, Japan, and Singapore had market capitalization ratio close to one and this ratio was about 0.10 in underdeveloped stock markets such as Colombia, Nigeria, Venezuela, and Zimbabwe from 1986 to1993. MCR has increased to 0.56 in 2009. It shows that there is significant
P. K. Mainali | SEBON Journal - V (2011) 35-58

43
growth in market capitalization. The increase in MCR is caused by the increase in listed companies and increase in stock price too. The increasing trend if MCR shows that the Nepalese economy is moving forward along with stock market development. The liquidity of market is measured in terms of ratio of traded value with GDP and turnover ratio. During the study period, the average traded value is 0.007 of GDP. In developed stock market the ratio of traded value with GDP is as high as 0.4 and in developing countries it varies in the range of 0.001 to 0.01 of GDP (K.C. (2004)). In 2007, 2008, and 2009 the ratio of traded value with GDP, are 0.012, 0.030, and 0.023 respectively. It shows that the ratio of traded value is increasing as comparison to the other observation periods, but it is still less than that of developed stock market. This result clearly shows that the Nepalese stock market is similar to that of a developing country. The reason behind is the small size of listed companies, small number of issued shares and in other words a small amount of traded shares, and its price.
The average turnover ratio (TOR) during study period is 0.04 which show a very low liquidity of stocks. A low turnover ratio indicates high transaction cost and relative difficulty in buying and selling of securities. In the study period, the highest turnover ratio is in 1995 and lowest is in 1998. The TOR closer to one signifies higher liquidity of stocks and vice-versa. The above data shows that the Nepalese stock market is highly illiquid. According to KC, “liquid stock markets make investment less risky because they allow investors to buy and sell financial assets they hold cheaply and quickly and change their portfolios anytime according to their risk-return performance” (KC (2010)). If few shares are traded out of total shares then liquidity problem will arise in stock market.
During the study period, the lowest volatility is 3.48 in 1997 and highest volatility is 146.9 in 2009. Higher volatility in stock prices indicates higher instability in economic performance and political situation. Volatility is a normal phenomenon in stock market and it does not necessarily mean underdeveloped stock market but high volatility denotes risk in equity investment (Bhatta (2010 )). The higher volatility in 2009 indicates a high risk in equity investment for that year.
Table 1 shows that the average market concentration ratio is 0.63 which indicates that the market values of shares of ten largest companies is 66 percent of the total market capitalization. The countries with developed stock market have concentration ratio of 0.2 of the market value. The findings of the study by Demiurgic-Kunt and Levine shows that the countries in the developed stock market such as Japan, U.K., and U.S.A. have concentration ratio 0.19, 0.24 and 0.14 respectively; and in underdeveloped countries such as Colombia, Nigeria and Venezuela have these ratios to be 0.74, 0.51and 0.63 respectively from 1986 to1993 (Demiurgic-Kunt and Levine (1996)). According to above results,
P. K. Mainali | SEBON Journal - V (2011) 35-58

44
Nepalese stock market is highly concentrated in comparison to concentration of developed stock market and more or less similar to most of the stock markets of underdeveloped countries. This high concentration ratio adversely affects the liquidity. It is to be noted that out of 10 largest companies almost every year eight of them are banks.
The correlation between overall stock market development and economic growth is economically important. Levine and Zervos (1998) shown that the measures of stock market development are positively correlated with economic growth. The present study examines the extent of relationship between four stock market variables (MC,TV,TO,V) and three economic growth variables (GDP,S,I) from the year 1994 to 2009. The correlation matrix is shown in table 2.
Table 2Correlation matrix
This table shows the correlation between economic growth and stock market development. Market capitalization (MC) is the market share price times the number of shares outstanding. Traded values (TV) means the total values of traded shares to GDP. Turnover (TO) signify the total value of traded shares. Volatility (V) is the fluctuation of stock prices.
GDP S I MC TV TO V
GDP Pearson Correlation sig (2-tailed) 1
S Pearson Correlation sig (2-tailed)
0.095 0.726 1
I Pearson Correlation sig (2-tailed)
0.925(**) 0.000
0.199 0.460 1
MC Pearson Correlation sig (2-tailed)
0.814(**) 0.000
0.087 0.750
0.796(**) 0.000 1
TV Pearson Correlation sig (2-tailed)
0.730(**) 0.001
0.323 0.222
0.750(**) 0.001
0.759(**) 0.001 1
TO Pearson Correlation sig (2-tailed)
0.256 0.339
0.399 0.126
0.232 0.386
0.310 0.243
0.735(**) 0.001 1
V Pearson Correlation sig (2-tailed)
0.608(*) 0.013
0.143 0.596
0.623(**) 0.010
0.678(**) 0.004
0.806(**) 0.000
0.387 0.139 1
Correlation is significant at the 0.05 level **Correlation is significant at the 0.01 level
P. K. Mainali | SEBON Journal - V (2011) 35-58

45
Table 2 shows that there is a positive correlation between stock market development indicator and economic growth indicator. The correlation coefficient between MC and GDP is 0.814 and is highly significant. The correlation coefficients of traded value with GDP and MC are 0.730 and 0.759 respectively and are significant at 1 percent level of significance. The positive and significant relation of TV with GDP and MC is meaningful because traded value measures the liquidity and size of the stock market. Higher traded value is regarded as the good indicator of stock market development which means maximum participation of investors in stock market. If large number of investors is involved in the stock market; market capitalization and GDP are likely to increase. The coefficients of turnover with GDP and MC are 0.256 and 0.310 respectively. This result indicates the insignificant relationship of turnover with GDP and MC. The correlation coefficients of volatility with GDP, MC, and TV are 0.608, 0.678, and 0.806 respectively. Volatility is a strong measure to check liquidity and development of stock market, however, its correlation with other variables are seldom studied.
Table 3 presents the details of regression analysis. The regression coefficient of market capitalisation is 0.036 which shows that the MC has positive but very low impact on GDP. Thus, we can conclude that there is no significant relationship between market capitalization and GDP. The unexpected result may have driven by other factors like small size of market capitalization relative to GDP. In the second equation the regression coefficients of S, I, and TV are -0.200, 0.603, and 0.025 respectively. The results indicate that there is no significant relationship between traded value and GDP. The stock market variable turnover shows its positive relationship with GDP but insignificant at 5 percent level of significance. The regression coefficient of volatility is 0.010 shows the positive but insignificant relationship with GDP. According to the economic principle, the volatility on stock markets occurs because of fluctuation on performance of public companies. But there are so many other factors like political instability, increase in peoples’ participation on equity investment, changes in board committee, people’s expectation, legislative and technological changes and so on which affect the share prices. If the price volatility is not caused by economic factors, it is normal to have insignificant relationship of volatility with GDP. In other words, it can be said that the stock prices in Nepal is not guided by economic factors.
The regression results presented in table 3 indicate that the stock market indicators have positive relationship with GDP but not significant at 5 percent level of significance. As the results are derived with the limited observations, the inferences drawn from these results have to be used very cautiously. In order to
P. K. Mainali | SEBON Journal - V (2011) 35-58

46
substantiate the findings based on secondary sources of information, a survey is conducted by administering the questionnaires to investors, stockbrokers, and SEBON/NEPSE officials.
Table 3Regression results
This table shows the causal relationship of saving, investment, and stock market variables with GDP; which are estimated (by taking logarithms of real GDP, real saving, real investment, MC.TV, TO, and V). Four different regression equations are estimated to show the causal relationship between stock market indicators and economic growth indicators. The dependent variable is GDP and the independent variables are S, I, MC, TV, TO, and V. Market capitalization (MC) is the market share price times the number of shares outstanding. Traded values (TV) means the total values of traded shares to GDP. Turnover (TO) signify the total value of traded shares. Volatility (V) is the fluctuation of stock prices.
Estimated coefficient Standard error t-statistics R2 F-statistics
1
S -0.135 0.179 -0.753
0.878 28.82*I 0.556* 0.121 4.606
MC 0.036 0.031 1.162
2
S -0.200 0.189 -1.055
0.871 27.03*I 0.603* 0.111 5.424
TV 0.025 0.032 0.788
3
S -0.217 0.196 -1.104
0.871 27.02*I 0.658* 0.076 8.658
TO 0.036 0.045 0.786
4
S -0.162 0.186 -0.869
0.866 25.89*I 0.645* 0.096 6.676
V 0.010 0.026 0.398* Significant at the 0.01 level
The coordination among SEBON, NEPSE, NRB, and Insurance Board is necessary for good governance and transparent stock market. The respondents were asked whether the poor co-ordination among these institutions is a problem for the development for stock market development. Table 4 presents that out of 7 respondents of NEPSE/SEBON officials; 86 percent of them replied that the poor coordination among institutions is a problem for the development of stock market. Similarly, 90 percent stockbroker out of 20, and 49 percent investors
P. K. Mainali | SEBON Journal - V (2011) 35-58

47
Respondent
Responses
out of 27 replied that the poor coordination among institutions is a problem regarding development of stock market. The majority of respondents replied that the poor co-ordination among institutions is a problem.
Table 4Responses regarding coordination among institutions
SEBON &
NEPSE% Stock-
broker % Inv-estor %
Degree of
freedom
Chi-square value
Level of sign-ificance
at 5%
Yes 6 86 18 90 25 92
4 1.7 9.49No 1 14 1 5 1 4
Don’t know 0 0 1 5 1 4
Total 7 100 20 100 27 100
Source: The questionnaire survey, 2010
The chi-square test is applied to check whether there are similar views among the different groups of respondents. The tabulated value of chi-square for 4 degree of freedom at 5 percent level of significance is 9.49 and the calculated value of chi-square is 1.7, which indicates that the opinions of responding groups are similar. The result signifies that the poor coordination among institutions is one of the problems for the development of stock market. Since these institutions are the policy makers and regulators, it is necessary to have sound coordination among them.
Mal-practices are the illegal activities of buying and selling of stocks that affect price volatility and in turn overall stock market. Mal-practices lead to fulfil vested interest of stockbrokers’ and investors’. KC (2010) says that the development of Nepalese stock market is hindered by the absence of transparent and accountable institutions and good government on one hand and other mal-practices on stock transactions. The respondents were asked whether the mal-practices are the problems in Nepalese stock market. Table 5 shows that out of 7 respondents of NEPSE/SEBON, 72 percent of them replied the mal-practices are the major problems of Nepalese stock market. Similarly, out of 20 respondents of stockbrokers, 35 percent of them and out of 27 respondents of investors, 89 percent of them also replied that the mal-practices are problems in Nepal.
P. K. Mainali | SEBON Journal - V (2011) 35-58

48
Table 5Responses regarding the mal-practices as the problem of Nepalese
stock market
SEBON &
NEPSE% Stock-
broker % Inv-estor %
Degree of
freedom
Chi-square value
Level of sign-ificance at 5%
Yes 5 72 7 35 24 89
4 16.17 9.49No 1 14 10 50 3 11
Don’t know 1 14 3 15 0 0
Column total 7 100 20 100 27 100
Source: The questionnaire survey, 2010
Chi-square test is applied to find whether there are differences on opinions regarding mal-practices among the different groups of respondents. The calculated value of chi-square 16.17 is greater than tabulated value of chi-square 9.49 at 5 percent significance level. It signifies that the responding groups are not similar in their opinions with respect to mal-practices as problem of Nepalese stock market.
Sufficient information of stock market is necessary not only to regulators and policy makers but also to stockbrokers and investors. So, the question was intended to know if the sufficient information about stock market is available. Eighty six percent out of 7 respondents from the group of NEPSE/SEBON officials, 90 percent out of 20 respondents from the group of stockbrokers, and 82 percent out of 27 respondents from the group of investors responded that the sufficient information of stock market is not available as presented in table 6.
Table 6Responses regarding insufficient information affecting on stock market
SEBON &
NEPSE% Stock-
broker % Inv-estor %
Degree of
freedom
Chi-square value
Level of sign-ificance at 5%
Yes 6 86 18 90 22 82
4 1.18 9.49No 1 14 1 5 3 11
Don’t know 0 0 1 5 2 7
Total 7 100 20 100 27 100
Source: The questionnaire survey, 2010
Respondent
Responses
Respondent
Responses
P. K. Mainali | SEBON Journal - V (2011) 35-58

49
To test whether the difference in the opinion exists among the group of respondents, chi-square value is computed. The tabulated value of chi-square for 4 degree of freedom at 5 percent level of significance is 9.49. It is greater than the calculated value of chi-square 1.18 which means that there are similar opinions among the groups of respondents regarding insufficient information of stock market. If there is lack of sufficient information, investors can be misguided. They invest in haunch which is risky in stock investment. In the context of Nepalese stock market, most of the stock investors were not well informed about overall activities of stock market. If the investors are well informed, they can properly manage investment portfolio, which helps to minimize risk in stock investment.
The rumour about frequent changes on policies is one of the causes of stock market crises. The respondents were asked if the changes on policies affect the stock market. Table 7 presents the responses in this regard.
Table 7Responses on the frequent changes in policies affecting the stock market
SEBON &
NEPSE% Stock-
broker % Inv-estor %
Degree of
freedom
Chi-square value
Level of sign ificance at 5%
Yes 6 86 19 95 27 100
4 7.38 9.49No 1 14 1 5 0 0
Don’t know 0 0 0 0 0 0
Column total 7 100 20 100 27 100Source: The questionnaire survey, 2010
Out of 7 respondents of NEPSE/SEBON officials, 86 percent of them have replied that the frequent changes in policies affect the stock market. Similarly, out of 20 respondents of stockbrokers, 95 percent of them; and out of 27 respondents of investors, 100 percent of them also replied that the frequent changes in policies affect the stock market. Majority of the respondents replied that the policies affect the stock market. Chi-square test is applied to find the independent of attributes among the groups of respondents. The tabulated value of chi-square for 4 degree of freedom at 5 percent level of significant is 9.49.The calculated value of chi-square is 7.3 which is less than tabulated value of chi-square 9.49. It reveals that the responding groups have similar opinions with respect to frequent changes in policies. The monetary policy, such as changes in capital gain tax, changes in margin-lending, property declaration, changes in
Respondent
Responses
P. K. Mainali | SEBON Journal - V (2011) 35-58

50
the policies formulated by SEBON such as the criteria for listing of companies, criteria for the stockbroker license, institutional strengthening are some of the factors which affect the stock market.
In developed countries, there are different forms of markets such as commodity market, derivative market, bullion market, stock market, etc. Such different forms of market are practiced for efficient portfolio diversification. But, diversification of instrument is poor in Nepal. The respondents were asked to rank with respect to various causes of poor instrument diversification. They gave the first priority to ‘No effective policy from the side of government’. ‘Insufficient knowledge about the other forms of market’, ‘insufficient instrument diversification’, and ‘poor demand in the other forms of market’ are given respective priorities regarding the poor instrument diversification. The tabulated value of chi-square for 6 degrees of freedom at 5 percent significance level is 12.59 and the calculated value is 3.02 (Appendix III). It indicates there are similar views among the different groups of respondents with respect to the poor diversification of instrument in Nepal.
The respondents were asked to rank the various problems of Nepalese stock market. The respondents gave first priority to ‘unavailability of Central Securities Depository (CSD) service’(Appendix IV). Since, there are variations in tendencies of responses; other problems are not expressed in order. Anyway, ‘restriction to foreign investors in stock investment’, ‘unavailability of mutual fund’, ‘low attention of government for the promotion and development of stock market’ are other problems. The tabulated value of chi-square for 14 degrees of freedom at 5 percent level of significance is 23.68.The calculated value of chi-square 43.76 is greater than tabulated value of chi-square 23.68 (Appendix IV) which reveals that the views of responding groups are not similar regarding the problems of Nepalese stock market.
With respect to the prospects of Nepalese stock market, the respondents were asked to rank various options. They gave the first priority to ‘political stability’; second priority to ‘attractive returns of companies’; the third priority to ‘instrument diversification’; the fourth priority to ‘keen interest of investors in securities investment’; the fifth priority to ‘availability of maximum securities’; and the last priority to ‘higher amount of transaction per day’(Appendix V). The tabulated value of chi-square for 10 degree of freedom at 5 percent level of significance is 18.31 and which is greater than the calculated value of chi-square 6.96 (Appendix V) which indicates that there are similar views among the groups of respondents, regarding the prospects of Nepalese stock market. KC (2010) stated that the vested political factors and political instability affects overall economic activities. Hence, political stability is necessary for the development of Nepalese stock market.
P. K. Mainali | SEBON Journal - V (2011) 35-58

51
5. ConclusionThe major conclusion of this study is that stock market development is unable to show significant positive impact on the national economy. Nepalese stock market is characterised by small number of listed companies, low market capitalisation ratio, low value traded ratio, low turnover ratio, high volatility, high concentration, illiquid and risky market. The correlation results indicate that there is positive relationship of GDP with stock market. Regression results show the positive but insignificant relationship of stock market variables with GDP. The finding based on regression analysis is not consistent with the findings of Demurguc-Kunt and Levine (1995), and Levine and Zervos (1998). The inconsistent findings may be due to the factor like small size of market relative to GDP. The increasing number of listed companies, market capitalisation ratio, turnover ratio, and value-traded ratio indicate that the stock market is developing steadily. The results of primary data analysis indicate that the poor co-ordination among SEBON, NEPSE, NRB and Insurance Board; insufficient information of stock market; unavailability of CSD service; poor institutional strengthening of SEBON; low instrument diversification; mal-practices on stock transaction; frequent changes on policies; poor attention of government for its development are the major problems of Nepalese stock market. Furthermore, the survey results underscore the importance of political stability in the development of stock market in Nepal.
ReferencesAdhikari, Nabaraj, March 2011, Stock market development in Nepal, The Nepalese Management
Review16, 1, 59-67.Ahmed, N, M. Shahbvaz, and L. Ali, 2008, Stock market development and economic growth,
ArdL causality in Pakistan, International Research Journal of Finance, and Economics 14, 182-194.
Berg, D. Donald, and Gibbons, Patrick, May 2011, The stock market reaction to the hiring of management consultants: A signalling theory approach, Journal of Management Studies, 48, 3, 544-563.
Bhatta, Gopal Prasad, June 2010, “Does Nepalese stock market follow random walk?” SEBON Journal, 4, 18-58.
Bhattarai, Bidya Nath, June, 2010, Behavior of international trade, monetary policy, and stock market: An application to Nepalese economy, SEBON Journal, 4, 59-69.
Carporale, G.M., P.G. Howells, and A. M. Soliman, 2004, Stock market development and economic growth: a causal linkage, Journal of Economic Development 129, 1, 33-50.
Chironga, Musta, Leke, Acha, Wamelen, Arenvan, and Lund, Susan, May 2011, Cracking the next growth market: Africa, Harvard Business Review, 117-122.
Colpan, Asli, M. Yoshikawa, Toru, Hikino, Takasi, and Del Brio, B. Esther, May 2011, shareholder heterogeneity and conflicting goals: strategic investment in the Japanese electronics industry, Journal of Management Studies, 3, 48, 591-614.
P. K. Mainali | SEBON Journal - V (2011) 35-58

52
Demiurgic-Kunt, Asli, and Levine, Ross, 1995, Stock market development and financial intermediaries: Policy Research Working Paper, World Bank, 1462.
May 1996, Stock market development and financial intermediaries: stylized facts, The World Bank Economic Review 10, 2, 291-321.
Diamond, Douglas, and R. E. Verrecchia, May1982, Optimal managerial contracts and equilibrium security prices, Journal of Finance, 37, 275-280.
Eatwell, J et al, (1987), The Palgrave, A dictionary of economics, The Macmillan Press Ltd., London.
G.C., S.B., and S. Neupane, 2006, Stock market and economic development: A causality test, The Journal of Nepalese Business Study, 3, 36-44.
Gurung, J.B., 2004, Growth and performance of securities market in Nepal, Journal of Nepalese Business Study, 1, 32-35.
Hoshi, Takeo, March 2011, Financial regulation: lessons from the recent financial crises, Journal of Economic Literature 1, 49, 120-127.
Joshi, Lokraj, May 2010, Stock market development, and economic growth: a case of Nepal, SEBONJournal, 4, 70-74.
KC, Bijay, July 2004, Development of stock market and economic growth: a case of Nepal, SEBON Journal, 1, 25-37,
_____, June 2010, Stock market development in Nepal: issues and challenges for reform, SEBON Journal volume, 4, 92- 93.Levine, Ross, and S. Zervos, June1998, Stock markets, banks, and economic growth, American
Economic Review 88, 3, 537-558.Levine, Ross, March 1996, Stock market: a spur to economic growth, finance and development,
A Quarterly Publication of the IMF and WB, 4, 36-42.Mahat, Ramsaran, 1981, Capital Market, Financial Flows, and Industrial Finance in Nepal, First
edition, Kathmandu: Sajha Prakasan, Kathmandu, Nepal, 60-65.Ministry of Finance, 2010, Economic Survey, fiscal year 2009/10, Government of Nepal
Ministry of Finance, Kathmandu, Nepal, 74-81.Mishkin, F.S., 2001, The economics of money banking and financing markets, New York,
Addison Wesley Longman.Oskooe, Seyyed Ali Paytakhti, 2010, Emerging stock market performance and economic growth,
American Journal of Applied Science, 265-269.Paudyal, Surbir, June 2010, Nepalese stock market: development impediments and challenges,
SEBON Journal, 4, 95-103.Pardy, R., 1992, Intuitional reform in emerging securities market, Policy Research Working Paper,
The World Bank, 907.Pope, G Devin, and Schweitzer, E Maurice, February 2011, Is tiger woods loss averse? Persistent
bias in the face of experience, competition, and high stakes, The American Economic Review 1, 101, 129-155.
Pradhan, Radhe S., 2006, Stock market behavior in a small capital market: A case in Nepal, Research in Nepalese Finance, Second edition, 106-135.
_____, 2006, Role of saving, investment, and capital formation in economic development: A case of Nepal, Research in Nepalese Finance, Second edition, 194-209.Ritter, L. S., and W. L. Silber, 1993, Principles of Money, Banking and Financial Market, United
States.Sing, Gauchan, and Kansal Salony, April 2010, Impacts of Unions budgets on Indian stock
market, Indian Management Studies, Punjabi University, 97-106.
P. K. Mainali | SEBON Journal - V (2011) 35-58

53
Sullivan, Paul, 30 May 2011, For small investors lure of private deals is hard to resist, International Herald Tribune, 9.
Victor, O., 2005, Does stock market matter in Ghana? A Granger causality analysis, Bank of Ghana, WP/ BOG-05113.
Wang, Yue, Tracy, Winton, Andrew, and Yu, Xiaoyun, December 2010, Corporate fraud and business conditions: Evidence from IPOs, The Journal of Finance, American Finance Association 6, 65, 2255-2290.
Websites: http//www.hkex.com
http//www.londonstockexchange.comhttp//www.nasdaq.comhttp//www.nepalstock.comhttp//www.nyse.comhttp//www.enotes.comhttp//www.sharemarketworld.comhttp//www.tse.or.jphttp://www.nccur.lib.nccu.edu.tw
Appendix IData relating to stock market development indicator such as Market
Capitalization (MC), Traded Value (TV), Turnover (TO), and Volatility (V) from year mid-July 1994 to mid-July 2009
(Rs. in million)Fiscal year MC TV TO V
Mid-July1994 13,872.00 0.230 3.183 68.87Mid-July 1995 12,963.00 0.502 8.132 18.86Mid-July 1996 12,295.00 0.090 1.753 11.11Mid-July 1997 12,698.00 0.154 3.277 3.48Mid-July 1998 14,289.00 0.069 1.418 6.98Mid-July 1999 23,508.00 0.454 6.380 16.18Mid-July 2000 43,123.32 0.315 2.680 51.16Mid-July 2001 46,349.40 0.567 5.057 60.34Mid-July 2002 34,703.90 0.358 4.439 40.27Mid-July 2003 35,240.40 0.125 1.633 7.69Mid-July 2004 41,424.70 0.428 5.176 5.80Mid-July 2005 61,365.90 0.821 7.345 24.46Mid-July 2006 96,763.70 0.565 3.559 35.33Mid-July 2007 186,301.30 1.236 4.487 83.92Mid-July 2008 366,247.50 3.021 6.231 104.54Mid-July 2009 512,939.07 2.382 4.227 146.91
Source: Various annual reports of SEBON and trading reports of NEPSE
P. K. Mainali | SEBON Journal - V (2011) 35-58

54
App
endi
x II
Dat
a re
latin
g to
eco
nom
ic g
row
th in
dica
tors
such
as G
ross
Dom
estic
Prod
uct (
GD
P), S
avin
g (S
), an
d In
vest
men
t (I)
(R
s. in
mill
ion)
Fisc
al y
ear
Nom
inal
GD
P
GD
P de
flect
or
(bas
e ye
ar 1
994=
10
0)R
eal G
DP
Savi
ng in
curr
ent p
rice
Inve
stm
ent i
n cu
rren
t pric
e
CPI
(bas
e ye
ar
1994
=10
0)
Rea
l sa
ving
Rea
l in
vest
men
t
Mid
-July1
994
191,
596
100
1915
96.0
029
,220
44,6
4410
029
,220
.044
644.
00
Mid
-July
1995
209,
976
106.
7019
6791
.00
32,4
6555
,231
107.
7030
,143
.951
282.
30
Mid
-July
1996
239,
388
115.
1020
7982
.60
34,4
2668
,017
116.
4029
,575
.658
433.
80
Mid
-July
1997
269,
570
123.
4021
8452
.10
39,1
6271
,084
125.
8031
,130
.456
505.
600
Mid
-July
1998
289,
798
128.
3022
5875
.30
41,4
3874
,728
136.
3030
,402
.054
826.
10
Mid
-July
1999
330,
018
139.
8023
6064
.40
46,5
6370
,061
151.
8030
,673
.946
153.
50
Mid
-July
2000
366,
251
146.
2025
0513
.70
57,5
7792
,272
156.
9036
,696
.658
809.
40
Mid
-July
2001
413,
429
150.
1027
5435
.70
51,5
0198
,649
160.
7032
,047
.961
387.
10
Mid
-July
2002
430,
397
155.
9027
6072
.50
43,6
0093
,020
165.
4026
,360
.356
239.
40
Mid
-July
2003
460,
325
160.
7028
6449
.90
42,1
4110
5,38
417
3.30
24,3
16.8
6081
0.20
Mid
-July
2004
500,
699
167.
5029
8924
.80
63,0
6413
1,67
018
0.20
34,9
96.7
7306
8.80
Mid
-July
2005
548,
485
177.
1030
9703
.50
68,1
1015
5,90
718
8.30
36,1
71.0
8279
7.10
Mid
-July
2006
611,
118
189.
4032
2660
.00
58,7
5717
5,63
320
3.30
28,9
01.6
8639
1.00
Mid
-July
2007
675,
859
203.
2033
2607
.80
71,4
5320
8,79
921
6.40
33,0
18.9
9647
8.30
Mid
-July
2008
755,
262
214.
5035
2103
.50
80,1
9324
7,27
723
3.10
34,4
02.8
1060
81.9
0
Mid
-July
2009
91
0,16
024
8.40
3664
09.0
096
,298
316,
097
263.
9026
,490
.311
9779
.10
Sour
ce:
Eco
nom
ic su
rvey
, 200
9/10
P. K. Mainali | SEBON Journal - V (2011) 35-58

55
Appendix IIIResponses on the causes of poor instrument diversification
Option SectorsRank wise number of
responses Total responses
Overall rank
1 2 3 4
A
SEBON/NEPSE 1 3 1 2 7 2
Stock Broker 2 7 3 8 20 3
Investor 3 5 4 15 27 4
Total 6 15 8 25 54 4
B
SEBON/NEPSE 4 1 1 1 7 1
Stock Broker 14 1 3 2 20 1
Investor 17 4 3 3 27 1
Total 35 6 7 6 54 1
C
SEBON/NEPSE 1 1 4 1 7 3
Stock Broker 3 10 4 3 20 2
Investor 3 10 8 6 27 3
Total 7 21 16 10 54 2
D
SEBON/NEPSE 1 2 1 3 7 4
Stock Broker 1 2 10 7 20 4
Investor 4 8 12 3 27 2
Total 6 12 23 13 54 3
Ranking options:
A Poor demand in the market B No effective policy from the side of government C Insufficient information about its market D Some of its forms are yet to come in Nepal 1, 2, 3, and 4 refers to first, second, third, and fourth priority (rank) respectively.
Source: The questionnaire survey, 2010
P. K. Mainali | SEBON Journal - V (2011) 35-58

56
Appendix IVResponses on problems of stock market in Nepal
Opt
ion
SectorsRank wise number of responses Total res-
ponsesOverall
rank1 2 3 4 5 6 7 8
A
SEBON/NEPSE 0 1 4 1 1 0 0 0 7 2
Stock Broker 1 5 3 5 3 1 2 0 20 2Investor 4 1 1 2 5 6 7 1 27 6
Total 5 7 8 8 9 7 9 1 54 4
B
SEBON/NEPSE 0 0 0 1 1 0 1 4 7 8Stock Broker 1 2 2 2 5 3 4 1 20 5
Investor 1 3 2 4 5 7 4 1 27 5Total 2 5 4 7 11 10 9 6 54 6
C
SEBON/NEPSE 1 1 0 1 1 0 1 2 7 6Stock Broker 0 0 3 0 3 9 3 2 20 8
Investor 0 1 1 7 5 6 5 2 27 7Total 1 2 4 8 9 15 9 6 54 7
D
SEBON/NEPSE 0 0 1 1 0 3 1 1 7 7Stock Broker 1 3 1 1 1 3 3 7 20 7
Investor 1 0 1 1 1 0 2 21 27 8Total 2 3 3 3 2 6 6 29 54 8
E
SEBON/NEPSE 1 1 1 0 1 1 2 0 7 4Stock Broker 2 1 7 3 3 0 3 1 20 3
Investor 0 5 7 4 4 2 4 1 27 4Total 3 7 15 7 8 3 9 2 54 3
F
SEBON/NEPSE 4 3 0 0 0 0 0 0 7 1Stock Broker 9 5 2 3 1 0 0 0 20 1
Investor 5 13 1 3 2 1 2 0 27 1Total 18 21 3 6 3 1 2 0 54 1
G
SEBON/NEPSE 0 1 1 2 1 0 2 0 7 4Stock Broker 1 3 2 3 4 2 3 2 20 5
Investor 7 1 8 2 2 3 3 1 27 2Total 8 5 11 7 7 5 8 3 54 3
H
SEBON/NEPSE 1 0 0 1 2 3 - 0 7 5Stock Broker 5 1 0 3 0 2 2 7 20 6
Investor 9 3 6 4 3 2 0 0 27 2Total 15 4 6 8 5 7 2 7 54 3
P. K. Mainali | SEBON Journal - V (2011) 35-58

57
Ranking options:
A Insufficient knowledge of investors about stock market B Risk in stock investment C Shortcomings on existing securities rules and regulation D Only one securities market i.e. NEPSE E Restriction to foreign investors F Unavailability of CSD service G Unavailability of mutual fund H Low attention of government for the promotion and development of stock market
1, 2, 3, 4, 5, 6, 7, and 8 refers to first, second, third, fourth, fifth, sixth, seventh, and eighth priority (rank) respectively.
Source: The questionnaire survey, 2010
Appendix VResponses on prospects of Nepalese stock market
Opt
ion
SectorsRank wise number of
responses Total responses
Overall rank
1 2 3 4 5 6
A
SEBON, NEPSE 6 1 0 0 0 0 7 1Stock Broker 17 1 1 0 0 1 20 1Investor 19 2 5 1 0 0 27 1Total 42 4 6 1 0 1 54 1
B
SEBON, NEPSE 0 0 1 5 0 1 7 4Stock Broker 0 2 3 1 4 10 20 6Investor 2 1 6 3 1 14 27 5Total 2 3 10 9 5 25 54 5
C
SEBON, NEPSE 0 0 3 1 1 2 7 5Stock Broker 1 1 6 6 5 1 20 4Investor 1 2 5 9 9 1 27 4Total 2 3 14 16 15 4 54 4
D
SEBON, NEPSE 0 1 3 0 3 0 7 3Stock Broker 0 11 4 2 1 2 20 2Investor 3 11 4 5 3 1 27 2Total 3 23 11 7 7 3 54 2
P. K. Mainali | SEBON Journal - V (2011) 35-58

58
E
SEBON, NEPSE 0 0 0 1 2 4 7 6Stock Broker 1 0 2 6 7 4 20 5Investor 0 3 1 6 8 9 27 6Total 1 3 3 13 17 17 54 6
F
SEBON, NEPSE 1 5 0 0 1 0 7 2Stock Broker 1 5 4 5 3 2 20 3Investor 2 8 6 3 6 2 27 3Total 4 18 10 8 10 4 54 3
Ranking options:
A Political stability B Availability of maximum securities in the market C Keen interest of investors in securities investment D Attractive returns of companies E Higher amount of transaction prices per day F Instrument diversification 1, 2, 3, 4, 5, and 6 refers to first, second, third, fourth, fifth, and sixth priority (rank) respectively.
Source: The questionnaire survey, 2010
Opt
ion
SectorsRank wise number of
responses Total res-ponses
Overall rank
1 2 3 4 5 6
P. K. Mainali | SEBON Journal - V (2011) 35-58

59
Enhancing Nepal’s tax revenue collection through an innovative policy measure1
John Koirala Zhejiang Gongshang University, PR China
Ernesto Fuentes Bulayog Visayas State University, Philippines
AbstractNepal’s continuing budget deficit is exacerbated by the country’s poor tax revenue collection. The authors found a significant positive correlation between GDP growth and tax revenue collection, but the actual tax effort has consistently faltered that resulted to the widening budgetary gap. This paper suggests an innovative solution to the problem. The solution involves a contract that is democratically designed by both the government and its tax collection agency and one that protects the interests of both principal (government or society) and agent (ministry of finance).
Keywords: Tax revenue; tax effort; principal-agent theory; Hu theory; poor tax collection
1. IntroductionBalanced budgeting in the third world has always been a difficult task confronting policy makers every year. More often than not, a sizeable portion of a country’s national budget is financed by borrowings and aids from foreign sources. Obviously, such dependence is not sustainable knowing that, despite huge efforts exerted by multinational organizations to reduce world poverty, there still remains a big number of poor countries competing for limited financial resources granted by donor countries and international organizations. Therefore external funds remain hard to find, particularly if the recipient countries have no resources or business environment attractive enough for donors to levy, as implicit collaterals, their interests (principal loans or grants-in-aid).
In addition, today’s global economic crisis has put immense pressure not only to third world countries but also to donor countries, whose capacity to extend loans has deflated in the face of their own dwindling economic growth. Toward this end, loan- or aid-recipient governments must increasingly rely on their own efforts to generate enough income to provide the necessary social services and avoid conflicts resulting from unmet basic social needs. There have been published and unpublished stories of such social crisis emanating from
1 This paper is submitted in the 1st international conference on Management “Changing Perspectives of Manage-ment: Revisit the Existing and Explore the Novel Ideas” organized by Nepalese Academy of Management (www.nam.org.np) at March 10-12, 2011 in Kathmandu, Nepal.

60
lack or absence of the basic human freedom – the freedom from hunger.Nepal, in South Asia, is a small, land-locked country that has been relying
on financial aids from external sources. It's tumultuous past political history and present sorry state is but a symptom of the many failures of past and present administrations to meet the growing needs of its populace. The attempt to embrace a Maoist system of government to propel the country’s development has failed and resulted to the institution of a democratic system in 2008. In spite of the vagaries and problems inherent to democracy, as experienced by its South Asian neighbors, the country seems to have been left with no other option but to try this system and, hopefully, free its people from the bondage of poverty. But such shift in governance from Monarchy to Maoism to mainstream democratic-capitalism requires adjustments, if not an overhaul, in civil service machinery and capitalist environment. Such changes are necessary for the government to harness the advantages of democracy and market economy, and the expected result of which must be a noticeable improvement in the delivery of basic social services.
Such promotion and improvement of the country’s social welfare is, no doubt, dependent on the financial resources of the government. Since Nepal is obviously young in terms of democratic and market reforms, its income generation mechanisms are expected to be inefficient, with old laws ripe for revisions and/or the implementation of any new laws still in transition. Not to be ignored is the fact that the knowledge and skills of the government’s human resources also require improvement, including human factors like attitudinal or behavioral adjustments, in order to successfully carry out the numerous responsibilities that come with change. All these changes and adjustments require sufficient financial resources in order for the government to realize the desired level of social welfare and development. Being the lifeblood of the nation, taxation or tax collection is the most significant factor to consider in analyzing the capacity of a country to finance its development goals, sans external support.
The general objective of this paper is to examine Nepal’s capacity to finance its development goals from the tax income generated by the country’s economy, and to suggest measures and recommend policies to ensure a sustainable national development and social welfare funds. Specifically, this paper (i) examines Nepal’s performance in tax revenue collection in proportion to the country’s expenditure needs, (ii) measures the tax efforts, (iii) and analyzes its dependence on external funds. The paper suggests the innovative Hu Theory of Compensation, in the context of the Principal-Agent (PA) problem, to improve tax revenue collection of the country.
J. Koirala / E.F.Bulayog | SEBON Journal - V (2011) 59-69

61
2. Nepal’s tax revenue and budget deficitThe country has been on deficit spending for a long time. Data made available to the authors include those of fiscal years 1988 – 2008, which are used in this paper for illustration. The graph below shows tax revenue and deficit (in million Rupees) that Nepal recorded from 1988 – 2008.
It can be noted that the deficit had been on an increasing trend since 1988/89,
a trend generally supported by foreign borrowings and grants data (see annex). This is, of course, expected when the government has to meet its planned expenditure each year. The graph shows a sharp increase in expenditure, yet tax revenue collection is not increasing as much.
Earlier we have implied an assumption of an inefficient and ineffective tax collection system that contributed to the growing deficit spending and increasing external borrowings. Annex 2 shows the efforts spent by the tax collection agents (government units) as measured by tax effort, which is defined as the ratio of tax revenue to gross domestic product (GDP). This set of data is illustrated by the following graph.
Figure 1Expenditure, revenue and budget gap of Nepal, 1988-2008.
Rs in million
300000
250000
200000
150000
100000
5000089 91 93 95 97 99 01 03 05 07 08
Expenditure
Deficit
Revenue
Fiscal year (20-year series)
Figure 2GDP, tax revenue and tax effort in Nepal, 1988-2008.
1000000
800000
600000
400000
200000
0
Rs in million
Fiscal year (20-year series)
GPD
Tax Revenue
Tax Effort89 91 93 95 97 99 01 03 05 07 08
J. Koirala / E.F.Bulayog | SEBON Journal - V (2011) 59-69

62
In spite of the sharp increase in GDP, tax revenue remains generally the same. This means that the effort of the tax collecting agents is low, hence poor tax collection performance, and an ever increasing budget deficit. It is important to determine the extent of such relationship, because if the relationship is statistically significant, then there is a strong evidence and motivation to mount a massive campaign to increase the tax effort. This means that there should be policy measures to mitigate the poor collection performance. As written elsewhere in this paper, one such measure is anchored on the principal-agent problem, particularly the use of an innovative solution known as the Hu Theory of Compensation, the application of which herein is more of political economics (budget management) than of product marketing or sales.
3. Income elasticity of tax revenue generationTo provide an idea of the extent of GDP–Tax Revenue (TR) relationship, we computed a regression equation as given in table 1.
TR = f (GDP)that is TR = α + β GDP + ε
where, ∂TR/∂GDP > 0.
Table 1Income elasticity of tax revenue generation
Variable Coefficient Std. error t-statistic Prob.
C 4.094744 0.173414 23.61259 0.0000LNGDP 0.835990 0.017075 48.96075 0.0000
R-squared 0.992547 Mean dependent variable 12.56177Adjusted R-squared 0.992133 S.D. dependent variable 0.649167S.E. of regression 0.057579 Akaike info criterion -2.776693Sum squared resid 0.059675 Schwarz criterion -2.677120Log likelihood 29.76693 F-statistic 2397.155Durbin-Watson stat 0.822793 Prob(F-statistic) 0.000000
Source: Annexure 2
Thus the hypothesis that ∂TR/∂GDP > 0 is proven correct. Given the significant test statistics, with a coefficient of the explanatory
variable (GDP) at 0.836, we can deduce that for every percentage increase in GDP, tax revenue will increase by more than 0.8 percent.
The result shows that there is a relationship between GDP and tax revenue
J. Koirala / E.F.Bulayog | SEBON Journal - V (2011) 59-69

63
generation, and yet the actual amount collected always fell short of expectations. One of the reasons is the poor tax effort. Should there be incentives for the collecting agents/bureaucrats if the collection is high? There is but how much is “high”? Who decides how much the revenue target must be? The government (principal), the agents (collecting agencies), or both? These questions are within the purview of the principal-agent theory, with optimum solution provided for by the Hu Theory of Compensation.
4. Principal-agent theoryA number of problems within the enterprise are characterized by interactions between managers and employers in which there is asymmetry of information. This is part of the more general agency problem, in which one group is unable to fully monitor the efforts of another and so needs to align as much as possible the incentives of both groups. A whole body of work, principal-agent theory, has evolved in order to deal with these problems. This theory examines relationships in which one party -the principal - determines the work, which another party - the agent - undertakes. The theory argues that under conditions of incomplete information and uncertainty, two agency problems arise: adverse selection and moral hazard. Adverse selection is the condition under which the principal cannot ascertain if the agent accurately represents his ability to do the work for which he is being paid. And moral hazard is the situation under which the principal cannot be sure if the agent exerts maximal effort (Chen, et al. in http://www.hpl.hp.com/research/idl/papers/agency).
Although the works of Laffont and Martimort (2002), Bolton and Dewatripont (2005) have theoretically addressed the issue of truthful reporting and proper incentives needed to induce optimal effort levels in many environments, the theories maintain the assumption that the principal is unaware of the type and effort of the agents (a case of information asymmetry), but is knowledgeable about the functional form of the outcome as a function of the agents’ type and effort level, that is, the principal knows that agents maximize their expected utility while the principal designs the contracts according to that assumption. Many other earlier works provide literatures that widen the scope and understanding of the seminal agency problem. As cited by Bulayog (2008), these include the works of Camerer et al, 1995; Kagel & Roth, 1995; Berg et al, 1992; Epstein, 1992; Keser and Willinger, 2000 (on the principles of appropriateness, loss avoidance and power sharing) and 2002 (on moral hazards and incentives) as well as the works of Anderhub et al, 2002 and Cabrales and Charness, 2003. A number of works included models that were thought to be optimal solution to agency problems.
J. Koirala / E.F.Bulayog | SEBON Journal - V (2011) 59-69

64
The earlier work of Bulayog (2008) considers tax collection problem in the context of management control theory. Management control theory deals in part with the principal-agent problem viewed as a control problem. Control may be after-the-fact or before-the-fact, that is, the government sets up control measures after the consequences of the agent's actions are known, or prior to the agent taking action. The latter is, of course, traditional budgeting and regulation. As cited by Bulayog (2008), principal-agent problems are common in budgeting (Smith and Bertozzi, 1998). Control theory, however, suggests that where consequences are homogenous and therefore are easily monitored, after-the-fact controls are more effective. Where consequences are unique and hard to monitor, before-the-fact control is appropriate. By implication, public administrators should employ traditional before-the-fact regulation only in a relatively small subset of activities, but should implement after-the-fact controls in many areas, typically through contractual arrangements which specify consequences desired by the principal and attach related after-the-fact rewards and penalties to the agent. As Thompson (1998) noted, before-the-fact and after-the-fact controls both ultimately rely on incentives and sanctions for their effectiveness. However, after-the-fact controls are demand-revealing mechanisms in that they make incentives clear to the agent and allow the agent to determine how best to satisfy the demand schedule that is presented openly. In contrast, before-the-fact controls often are demand-concealing. Often before-the-fact controls do not allow the agent -- governmental or private -- to gain a full view of the demand schedule, without which information efficient mobilization of resources is impossible, and even more so when before-the-fact controls impose constraints on the type, manner of use, time of use, etc., of resources. In short, after-the-fact controls lay down necessary information about the desired outcome and, as in the case of governmental budgeting and spending, support before-the-fact controls. The question that comes to mind is that, with a clearer view of the control process, would it not be vulnerable to ill-meaning manipulations and illegal dealings between the agents, i.e., tax collectors, and the clients, i.e., tax payers? As Bulayog (2008) aptly asked: Are not these unethical actions implying corruption, which is obviously disadvantageous to the principal (government or society)? Perhaps an equally relevant question vis a vis the theories cited is: Aren’t these theories so rigged with assumptions that the solution to the problem remains illusive? After all, human behavior does not always match theoretical modeling because such models often assume unrealistic levels of rationality on the part of its players (Camerer et al, 1995 and Kagel & Roth, 1995). In this case, the problem is exacerbated by the fact that, in reality, the principal has more limited information, i.e., the relationship between types of agents, their effort levels and outcomes. To this end, Bulayog (2008) used the Hu Theory of Compensation to
J. Koirala / E.F.Bulayog | SEBON Journal - V (2011) 59-69
65
mitigate the problem of tax revenue collection in the Philippines.
5. The Hu theory as applied to tax revenue collectionThe core modification of the Hu theory in the work of Bulayog (2008) is that the final tax revenue target is jointly decided by the government (or its representatives, referred to as the principal) and the tax revenue collecting departments (referred to as the agent). For convenience, the revenue target is fixed as an arithmetic average of the target demanded by the principal and the target offered by the agent. This average target will then be the final tax revenue target for the year. Since the principal and the agent independently and separately computed their targets beforehand, no bargaining is required upon meeting to set the target, that is, by simply averaging the two targets, the issue is settled instantaneously. Of course, in the context of PA theory, when the agent exceeds the final revenue target, a certain percentage of the extra revenue will be given as bonus. However, the agent can also be penalized if the offered target is less than the actual tax revenue, implying that the much lower target was intentionally offered in order to ensure surplus revenue and get a big bonus! This is the strong appeal of the Hu theory. Although the agent will get a certain amount of bonus for the extra revenue, the agent will also be penalized for having offered lower revenue than what can be achieved. This effectively catches scheming tax collection agents! From their experiences, they will eventually offer a target closest, if not exactly equal, to what they can actually realize in the subsequent years. How is this solution put into action? Let us now consider the tax revenue collection in Nepal.
6. Carrot-and-stick approachBased on the Hu Theory of Compensation, Bulayog (2008) puts forward the following mechanism to encourage the tax collection agents to increase their efforts without any feeling of remorse or, alternatively, to prod the agents to be honest and reveal the information they have with regards to the maximum possible level of tax revenue that can be collected. Similarly, the principal will not have to bear irrational assumptions about the utility level (or risk aversion) of the agents. In either case, both principal and agents will arrive at an optimum level of outcome.
The carrot. In the context of PA theory, when the agent exceeds the final collection target, a certain percentage of the extra collection will be given as incentive. We may generalize the final collection target by assigning weights (w) of the targets set by the government (G) as the principal and offered by the agent (A) as follows:
J. Koirala / E.F.Bulayog | SEBON Journal - V (2011) 59-69

66
Final Collection Target = w Principal Target + (1- w) Agent’s Offer.....(1)
With w < 1. If w = 1, then the agent has no chance to make an offer. Conversely, if w = 0, then the government will not set any target, allowing the agent to freely set the target. But inherent to the PA theory, the principal will always demand a higher target while the agent will offer a lower target to maximize his incentive, which means conflict of interest as both will try to protect their own interests.
The stick. In the Hu Theory of Compensation, the agent will be penalized if his offered target is less than the actual collection, implying that the much lower target was intentionally offered in order to ensure surplus collection and get a big incentive. This penalty component of the model is the strong appeal of the Hu theory. Although the agent will get a certain amount of incentive for surpassed collection target, he will also be penalized for having offered a lower target than what he can truly achieve. Thus, from the experiences of the agent, he will eventually offer a target closest, if not exactly equal, to what he can actually realize in the subsequent years.
Incorporating the penalty clause of the agreement (contract), let K be the actual collection, A be the agent’s target, T be the final collection target, and R be the manager’s reward/bonus. This means that if the incentive is set at a certain coefficient (i ), the reward will be
R = i (K – T)............................................................................(2)
where i < 1 and K > T, giving incentive to the agent, when actual collection is greater than the agreed collection target. On the other hand, the Hu theory’s punishment (for a lower agent’s target than the actual collection) implies a penalty (P) at coefficient q, hence,
P = q (K – A)............................................................................(3)
where q < 1 and K > A, establishing fines for offering “too low”.Thus, the manager’s net incentive (N) would then be N = R – P, that is
N = [i (K – T)] – [q (K – A)]..................................................(4)
But if A > K, that is, agent’s offered target is more than the actual collection, there will be no penalty. This implies that the agent is honest and shows his resolve to do his best for the country (Bulayog, 2008).
J. Koirala / E.F.Bulayog | SEBON Journal - V (2011) 59-69
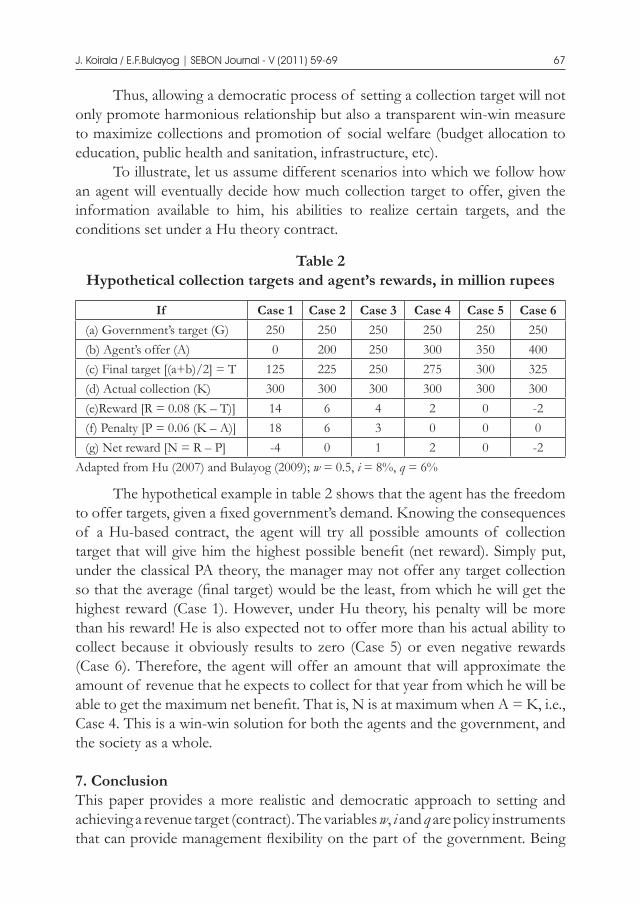
67
Thus, allowing a democratic process of setting a collection target will not only promote harmonious relationship but also a transparent win-win measure to maximize collections and promotion of social welfare (budget allocation to education, public health and sanitation, infrastructure, etc).
To illustrate, let us assume different scenarios into which we follow how an agent will eventually decide how much collection target to offer, given the information available to him, his abilities to realize certain targets, and the conditions set under a Hu theory contract.
Table 2Hypothetical collection targets and agent’s rewards, in million rupees
If Case 1 Case 2 Case 3 Case 4 Case 5 Case 6(a) Government’s target (G) 250 250 250 250 250 250(b) Agent’s offer (A) 0 200 250 300 350 400(c) Final target [(a+b)/2] = T 125 225 250 275 300 325(d) Actual collection (K) 300 300 300 300 300 300(e)Reward [R = 0.08 (K – T)] 14 6 4 2 0 -2(f) Penalty [P = 0.06 (K – A)] 18 6 3 0 0 0(g) Net reward [N = R – P] -4 0 1 2 0 -2
Adapted from Hu (2007) and Bulayog (2009); w = 0.5, i = 8%, q = 6%
The hypothetical example in table 2 shows that the agent has the freedom to offer targets, given a fixed government’s demand. Knowing the consequences of a Hu-based contract, the agent will try all possible amounts of collection target that will give him the highest possible benefit (net reward). Simply put, under the classical PA theory, the manager may not offer any target collection so that the average (final target) would be the least, from which he will get the highest reward (Case 1). However, under Hu theory, his penalty will be more than his reward! He is also expected not to offer more than his actual ability to collect because it obviously results to zero (Case 5) or even negative rewards (Case 6). Therefore, the agent will offer an amount that will approximate the amount of revenue that he expects to collect for that year from which he will be able to get the maximum net benefit. That is, N is at maximum when A = K, i.e., Case 4. This is a win-win solution for both the agents and the government, and the society as a whole.
7. ConclusionThis paper provides a more realistic and democratic approach to setting and achieving a revenue target (contract). The variables w, i and q are policy instruments that can provide management flexibility on the part of the government. Being
J. Koirala / E.F.Bulayog | SEBON Journal - V (2011) 59-69

68
both ex ante and ex post measure, all parties involved in the contract will be able to learn, adjust and revise the contract vis a vis actual experiences with the policy measure as well as economic realities in each year of implementation. Needless to say, supporting directives should accompany the implementation of this measure to totally arrest the problem of poor tax collection performance and its ill effects – continuing budget deficit and deepening dependence on foreign borrowings.
References Bulayog, E.F., December 2008, An innovative application of the principal-agent theory in tax
collection in the Philippines, in proceedings of the international conference in business and economics research, held in Bangkok, Thailand.
Chen, K.Y., February 2010, Does principal-agent theory work in real life? Electronic copy available at: http://www.hpl.hp.com/idl/papers/agency.
Hu, Zuguang, 2007, An innovative applied theory on principal-agent problem, mimeographed English translation, Zhejiang Gongshang University, Hangzhou, PR China.
Jensen, Michael C., and William H.Meckling, 1976, Theory of the firm: managerial behavior, agency costs and ownership structure, Journal of Financial Economics, 3,303-360.
Ross, Steven, 1973, The economic theory of agency: the principal’s problem. American Economic review, 63, 2, 134-139.
Smith, R.& M. Bertozzi, 1998, Principals and agents: an explanatory model for public budgeting. Journal of Public Budgeting, Accounting, & Financial Management 10, 3, 325-352.
Harris, M. and A. Raviv, 1978, Some results on incentive contracts with application to education and employment, health insurance, and law enforcement, American Economic Review, 68, 20-30.
Spence, M. and R. Zeckhauser, 1971, Insurance, information and individual action, American Economic Review, 61, 2, 380-387.
Thompson, Fred, 1998, Public economics and public administration, in Rabin, Hildreth, & Miller, eds., Handbook of Public Administration, (second edition), New York: Marcel Dekker, Inc. also available online at http://www.willametter.edu/~fthomso/pubfin/ECON&PA.html.
Annexures 1Tax revenue, budget deficit, and foreign borrowings of Nepal,
1988- 2008(Rs. in million)
Fiscal year Tax revenue Deficit External loans Foreign grants
1988 – 1989 6,287.1 8,547.5 5,666.4 1,478.21989 – 1990 7,283.9 8,406.4 5,959.6 1,798.81990 – 1991 8,175.8 10,655.1 62,567.0 1,630.01991 – 1992 9,875.6 11,261.7 6,816.9 1,531.01992 – 1993 11,662.5 11,956.0 6,920.9 3,273.91993 – 1994 15,371.5 11,623.0 9,163.6 2,393.61994 – 1995 19,660.0 10,547.7 7,312.3 3,937.1
J. Koirala / E.F.Bulayog | SEBON Journal - V (2011) 59-69

69
1995 – 1996 21,668.0 13,824.2 9,463.9 4,825.11996 – 1997 24,424.2 14,361.9 9,043.6 5,988.31997 – 1998 25,939.8 17,777.8 11,054.5 5,402.61998– 1999 28,753.0 17,991.0 11,852.4 4,336.61999– 2000 33,152.0 17,667.0 11,812.2 5,711.72000– 2001 38,865.0 24,188.1 12,044.0 6,753.42001– 2002 39,331.0 22,940.6 7,679.0 6,686.22002– 2003 42,587.0 16,437.2 4,546.4 11,339.12003– 2004 48,173.0 15,828.2 7,629.0 11,283.42004– 2005 54,105.0 18,046.5 9,266.1 14,391.22005– 2006 57,427.0 24,779.6 8,214.3 13,828.02006– 2007 71,127.0 30,091.7 10,054.0 15,801.02007– 2008 85,025.0 37,867.4 11,326.0 22,735.0
Source: Ministry of Finance; Nepal Rasta Bank.
Annexure 2 Tax efforts of Nepal, 1988 – 2008
Fiscal year Tax revenue GDP Tax effort1988 – 1989 6,287 85,831 7.321989 – 1990 7,284 99,702 7.311990 – 1991 8,176 116,127 7.041991 – 1992 9,876 144,933 6.811992 – 1993 11,662 165,350 7.051993 – 1994 15,371 191,596 8.021994 – 1995 19,660 209,976 9.361995 – 1996 21,668 239,388 9.051996 – 1997 24,424 269,570 9.061997 – 1998 25,940 289,798 8.951998– 1999 28,753 330,018 8.711999– 2000 33,152 366,251 9.052000– 2001 38,865 394,052 10.612001– 2002 39,331 406,138 9.682002– 2003 42,587 437,546 9.732003– 2004 48,173 474,919 10.142004– 2005 53,827 508,651 10.582005– 2006 57,427 589,412 9.742006– 2007 70,046 727,089 9.632007– 2008 80,962 820,814 9.86
Note: Tax effort in percent.Source: Ministry of Finance; Nepal Rasta Bank.
J. Koirala / E.F.Bulayog | SEBON Journal - V (2011) 59-69

70
Lunar effect in Nepalese stock returns
Parameshwar PantTribhuvan University
Abstract This paper uses the NEPSE return data during mid-July 1997 to mid-July 2010 to explore the daily stock returns variations due to lunar calendar effect. With an application of linear models, evidences of lunar calendar effect especially lower returns during Aswin Krishna Pakchha are documented. These pre-Dashain period lower stock returns are clearly traceable with Nepalese culture and festive preparation pattern.
Keywords: Lunar effect; stock return; calendar effect; cyclical pattern; stock market
1. Introduction An efficient market is one where all unexploited returns are eliminated by arbitrage (Fama(1965)). In case of equity returns several seasonal effects that create higher or lower returns depending on the time have been noted. The tendency of stocks to perform differently at different times of the year is called calendar effect. Such effects are called anomalies because they cannot be explained by traditional asset pricing models. Examples of such patterns include the January effect, turn-of-the-month effect, week-of-the-month effects, Day-of-the-week effect, lunar effect, temperature effect, fall effect, Mark Twin effect and so on (Haggard and Witte (2008), Balaban, (1995b)).
The calendar effect based on Gregorian year may not be applicable to all stock markets since many countries and societies in the world follow their own calendar, which are based on religion. Many societies follow lunar calendar and moon phases regulate mood; this belief dates back to ancient times, which is now supported anecdotally, as well as empirically through psychological research (Yuan, Zheng, Zhu (2001)). Studies focus on lunar effect on stock returns and found evidences in the favor include the study by Yuan, Zheng, Zhu (2001), Saunders (1993), Hirshleifer and Shumway (2001), Kamastra, Karmer and Levi (2001), Dichev and Janes (2001). In the contrary, study by Campbell and Beets (1978), Rotton and Kelly (1985) and Rotton and Rosenberg (1984) concluded that there is no moon cycle effect on human mood and more importantly on stock returns. The lesson learnt hear is that; the research door of lunar effect is just open-up.
Moon and mood relation is documented by the studies (Kamsta, Kramer and Levi (2000 and 2001)) including evidences of lunar effect on stock market

71
activities like stock return (Dichev and Janes (2001), and Mitchell and Ong (2006)). Rotton and Kelly (1985) found no relation of lunar phases on stock returns. But the same study report a significant lunar effect on stock returns using a different sample of countries and a different time period. Yuan, Zheng, Zhu (2001) document return differences between the full moon and the new moon phases and a cyclical pattern in stock returns that corresponds to lunar phases. Leinss (2005) found the evidence that the stocks show upward movement in the auspicious days. The study found the stock return in Japan increasing in “Buddha’s Entering [Nirvana]” day. It poses the question that whether or not there is festival and auspicious day effect in the other stock market. Though Nepalese society follow lunar calendar in conduction of the rituals and to celeberate feasts and festivals, no one study has been conducted to measure the lunar effects on stock returns in Nepalse context.
The rest part of the study is organized as follows. In subsequent section, some available studies devoted to stock return anomalies due to lunar effect are reviewed. The research methodology and data used for the study are highlighted in next section followed by data analysis and conclusion sections.
2. Review of literature Considerable evidences are documented by studies on seasonal anomalies based on Gregorian calendar but different countries and societies follow their own calendar, which are based on religion. The seasonality of the stock return is largely related with human behaviour and which is the outcome of their religion, feasts, festivals, and other social activities. Hence, the calendar effect based on Gregorian year may not be applicable to all stock markets.
Testing whether psychological biases and sentiments affect investor trading behaviour and asset prices is difficult because finding a proxy variable for sentiment or mood is just impossible. Nonetheless, there are several ingenious attempts. For example, in their respective studies of the relation between mood and stock returns, Saunders (1993) and Hirshleifer and Shumway (2001), drawing on psychological evidence that sunny weather is associated with an upbeat mood; find that sunshine is strongly positively correlated with stock returns. Likewise, in the study of the seasonal time-variation of risk premia in stock market returns, Kamsta, Kramer and Levi (2000 and 2001) draw on a documented medical phenomenon, Seasonal Affective Disorder (SAD), and use yearly daylight fluctuations to proxy for differences in mood. They find a statistical significant relationship between SAD and stock market returns.
Studies also find a lunar effect on fertility (Criss and Marcum, (1981)) and a lunar rhythm of the meal and alcohol intake of humans (De Castro and Pearcey (1995)). Given the extensive documentation of the correlation between
P. Pant | SEBON Journal - V (2011) 70-78

72
lunar phases and human feelings, thoughts, and behaviours, it is hypothesized that investors may value financial assets differently during full moon periods than during new moon periods due to the changes in mood associated with lunar conditions. Overall, the effect of the moon has been studied informally and formally for years. However, it must be noted that, despite the attention this effect has received, psychological evidence for the lunar hypothesis in general is not conclusive even though biological evidence is strong. Campbell and Beets (1978) conclude that lunar phases have no effect on psychiatric hospital admissions, suicides, or homicides. On the other hand, this lack of relation does not preclude a lunar effect. It may simply mean that the effect has not been adequately tested due to small sample sizes and short sample time periods (Cyr and Kaplan (1987); Garzino (1982)).
Rotton and Kelly (1985) cite a working paper by Rotton and Rosenberg (1984) that investigates the relation between lunar phases and Dow-Jones closing averages. The study finds no relation when data is differenced and corrected for first-order autocorrelations. Dichev and Janes (2001) also examine the effect of lunar phases on stock returns. The study reports a significant lunar effect on stock returns using a different sample of countries and a different time period. Yuan, Zheng, Zhu (2001) document return differences between the full moon and the new moon phases and a cyclical pattern in stock returns that corresponds to lunar phases. Mitchell and Ong (2006) examine returns in the Chinese A and B stock markets for evidence of calendar anomalies and found some evidence of a February turn-of-the-year effect, partly owing to the timing of the Chinese Lunar New Year (CNY).
Despite having a number of studies in mature stock markets, very little has been done so far regarding emerging stock markets, like Nepal. Furthermore, the anomalies are analysed from the view point of Gregorian calendar, which is completely based on Christian culture. The people in different countries and different societies follow their own calendar based on their culture. Human behaviour is determined largely by the culture they follow, the feasts and festivals they celebrate, the natural atmosphere in which they are grown up, the legal and political environment to which they are accustomed. Stock trading behaviour can not be aloof from this phenomenon. This clearly indicates that there is a need to consider local and cultural calendars of the society in which the stock market is situated while analysing calendar anomalies.
3. Data and methodologyData consist of closing values of the general index of the Nepal Stock Exchange (NEPSE) which is the main index for the Nepal Stock Exchange and has been compounded since 1995 and it reliably portrays the stock market situation. At
P. Pant | SEBON Journal - V (2011) 70-78

73
the moment it covers more than 150 biggest and most traded companies in the market. Others are the sub-indices that represent the stock price of securities listed from that particular sector. At the very beginning, there was only NEPSE to represent the stock price. This study covers a period of mid-July 1997 to mid-July 2010 with 2915 observations.
While computing the stock return, there are two concepts, viz. without dividend and inclusion of dividend. The ‘close to close’ data does not contain information about the payment of dividends on stocks. However, the exclusion of dividend payments should not necessarily invalidate the results. Many studies have observed that their conclusions remain essentially unchanged whether they adjusted their data for dividends or not (e.g., Lakonishok and Smidt (1988), Fishe et al., (1993)). Hence, it is suggested that any dividend bias, which occurs from not employing dividend adjusted returns, is relatively small and is not sufficient to eliminate the calendar effects or to have any impact on their statistical significance. Based on this fact, the stock returns are calculated based on price changes, ignoring dividends. The daily stock returns for day t (Rt) are calculated as percent change in stock prices on the day to the previous day the market was open. Symbolically,
Rt = ln[Pt/Pt-1] .................................................................(1)
Where Rt is the return NEPSE at day t and Pt and Pt-1 are the closing values at day t and day t-1(previous day) for the same index.
The lunar cycle is defined by astronomers with the period beginning and ending with the conjunction of the sun and the moon. The two bodies are conjunct when they are zero degrees apart. The faster moon then races ahead of the sun, makes a 360-degree arc, and then conjoins the sun again, completing a cycle. This process takes a mean time of 29 days, 12 hours, 44 minutes, and 2.78 seconds. This period may vary by as much as 13 hours. The average days in a lunar month contain only 29.53 days. Hence the lunar year is 11 days shorter then the solar year.
There are 24 specific Packhhas (12 Sukla and 12 Krishna) in a lunar year. So as to test the existence of effect of specific Packhha, the daily stock return is regressed on 24 Pakchha dummies. The model applied for this purpose is:
Rt = a0i+a1i S1t + a2i S2t + a3i 33t +.... +a11i S11t + a12i K1t + a13i K2t + a14i K3t +....+ a12i K23t + εit ...... (2)
Where Rt is the daily return on NEPSE as defined in equation 1, S1 through S11 are dummy variables for 11 Sukla Pakchhas (Jestha through Chaitra) such that S1 takes a value of 1 for all Jestha Sukla Packhha observations and zero
P. Pant | SEBON Journal - V (2011) 70-78

74
otherwise and so on. Baisakh Sukla Pakchha dummy variable is excluded from the equation to avoid the dummy variable trap. As the result, the constant term represents the coefficient for Baisakh Sukla Pakchha. The coefficients from a1 through a11 are estimates of the return for each Sukla Pakchhas from Jestha through Chaitra.
Similarly K1 through K12 are dummy variables for 12 Krishna Pakchhas (Baisakh through Chaitra) such that K1 takes a value of 1 for all Baisakh Krishna Packhha observations and zero otherwise and so on. The coefficients from a1 through a23 are estimates of the return for each Krishn a Pakchhas from Baisakh through Chaitra. εt is the disturbance term.
In an alternative model, a dummy variable is introduced for Aswin Krishna Pakchha which takes value 1 for stock returns for those periods otherwise 0. Symbolically, the model is:
Rt = a0 + a1AKPt + εt ….. ………….. …………. (3)
Where Rt is the daily return of NEPSE index at time t, AKPt is dummy variable for Aswin Sukla Pakchha. The intercept a0 indicates the average return for Remaining ‘Pakchhas’. The a0 and a1 are parameters to indicate the difference between ‘Aswin Krishna Pakchha’ and other ‘Pakchhas’. If a NEPSE returns do not exhibit a lunar phase effect, then a0 = at1= 0.
4. Analysis of data4.1 Descriptive statistics Descriptive statistics for NEPSE daily returns based on 24 Krishna and Sukla Pakchhas and its standard deviation is presented in table 1.
Table 1Pakchha-wise daily returns on NEPSE
Daily returns are calculated for different Sukla Pakchhas and Krishna Pakchhas in a lunar year.
Lunar Pakchha Number Mean Std. deviationBaisakh Krishna Pakchha 115 0.0010 0.0187Baisakh Sukla Pakchha 115 0.0028 0.0166Jestha Krishna Pakchha 149 0.0022 0.0200Jestha Sukla Pakchha 152 0.0029 0.0156Ashad Krishna Pakchha 115 0.0028 0.0179Ashad Sukla Pakchha 123 0.0021 0.0145Srawan Krishna Pakchha 140 0.0044 0.0143
P. Pant | SEBON Journal - V (2011) 70-78

75
Srawan Sukla Pakchha 138 0.0024 0.0591Bhadra Krishna Pakchha 113 0.0028 0.0136Bhadra Sukla Pakchha 130 0.0007 0.0234Aswain Krishna Pakchha 146 -0.0079 0.0786Aswain Sukla Pakchha 77 0.0013 0.0090Kartik Krishna Pakchha 119 0.0026 0.0093Kartik Sukla Pakchha 116 0.0021 0.0203Marga Krishna Pakchha 134 0.0013 0.0174Marga Sukla Pakchha 128 0.0012 0.0208Paush Krishna Pakchha 120 -0.0017 0.0155Paush Sukla Pakchha 126 -0.0029 0.0160Magha Krishna Pakchha 115 -0.0029 0.0187Magha Sukla Pakchha 106 0.0001 0.0231Phalgun Krishna Pakchha 108 0.0016 0.0340Phalgun Sukla Pakchha 107 -0.0010 0.0286Chaitra Krishna Pakchha 119 -0.0004 0.0155Chaitra Sukla Pakchha 104 0.0000 0.0179Total 2915 0.0007 0.0224
As shown in table 1, the number of observations is significantly below the average number of observations per Pakchha of 121 for Aswin Sukla Pakchha at 77. Regarding stock returns, mean return is lowest at -0.0079 for Aswin Krishna Pakchha where as it is highest at 0.0029 for Jestha Sukla Pakchha. The mean return is negative for 6 Pakchhas out of 24, positive for 17 and for Chaitra Sukla Pakchha it is approximately 0. Standard deviation is lowest for Aswin Sukla Pakchha at 0.009 where as it is highest for Aswin Krishna Pakchha. It reveals that Aswin Krishna Pakchha is accompanying by a lowest return along with high risk.
4.2 Regression resultsThere may be existence of specific effect of some particular ‘Pakchha’ in between 12 lunar months. In this ground, the daily stock returns are regressed on 24 Pakchhas of lunar calendar based on model 2. Table 2 provides the regression result based on model 2 for daily return of Sukla Pakchha and Sukla Pakchha under lunar calendar.
P. Pant | SEBON Journal - V (2011) 70-78

76
Table 2Daily stock returns on pakchha
Stock returns are calculated for Sukla Pakchhas and Krishna Pakchhas on lunar year. The regression is made for overall stock return (NEPSE return) only.
Lunar months α t Significant percentBaisakh Krishna Pakchha 0.0010 0.3522 72.47 percent Baisakh Sukla Pakchha 0.0019 0.4794 63.17 percent Jestha Krishna Pakchha 0.0012 0.3351 73.76 percentJestha Sukla Pakchha 0.0020 0.5424 58.76 percentAshad Krishna Pakchha 0.0018 0.4712 63.76 percentAshad Sukla Pakchha 0.0011 0.2834 77.69 percentSrawan Krishna Pakchha 0.0034 0.9147 36.04 percentSrawan Sukla Pakchha 0.0014 0.3731 70.91 percentBhadra Krishna Pakchha 0.0018 0.4532 65.05 percentBhadra Sukla Pakchha -0.0002 -0.0605 95.18 percentAswin Krishna Pakchha -0.0089 -2.4170 1.57 percentAswin Sukla Pakchha 0.0003 0.0725 94.22 percentKartik Krishna Pakchha 0.0017 0.4319 66.58 percentKartik Sukla Pakchha 0.0012 0.2968 76.66 percentMarga Krishna Pakchha 0.0003 0.0807 93.57 percentMarga Sukla Pakchha 0.0002 0.0538 95.71 percentPaush Krishna Pakchha -0.0027 -0.7024 48.25 percentPaush Sukla Pakchha -0.0038 -1.0035 31.57 percentMagha Krishna Pakchha -0.0038 -0.9907 32.19 percentMagha Sukla Pakchha -0.0009 -0.2185 82.71 percentPhalgun Krishna Pakchha 0.0007 0.1683 86.64 percentPhalgun Sukla Pakchha -0.0020 -0.4965 61.96 percentChaitra Krishna Pakchha -0.0014 -0.3646 71.55 percentChaitra Sukla Pakchha -0.0009 -0.2378 81.21 percent
As shown in table 3, the coefficients for 6 Pakchhas are negative revealing that the return is low for respective Pakchhas. Whereas the 18 positive coefficients indicate the high returns for these Pakchhas. But the notable point here is the negative coefficient for Aswin Krishna Pakchha. This coefficient is significant at 5 percent level of significance.
So as to test the consistency of the results, the daily stock returns are regressed on Aswin Krishna Pakchha dummy based on model 3. The model is estimated for total period, 1st half (before 17 March 2004) and 2nd half (for
P. Pant | SEBON Journal - V (2011) 70-78

77
remaning period) separately. The regression results are presented in table 3:
Table 3Daily stock returns on Aswin sukla pakchha
Lunar months 1st Half 2nd Half Total periodConstant (for other Pakchhas) 0.000 0.002 0.001Coefficient (for Aswain Krishna Pakchha) -0.014 -0.003 -0.009T Value -3.248 -1.237 -3.653P Value 0.001 0.216 0.000F Value 10.547 1.53 13.344
As shown in table 3, the returns on Aswain Sukla Pakchha periods are significantly lower than that of other pakchhas. Despite having weak indicators of second half, the results are in similar line. Strong and statistatically positive constant for second half confirms that the returns are positive and more for other pakchhas than the Aswin Sukla Pakchha.
It can be traced with Nepalese culture and festival celebration pattern as follows.
• Nepalese major festival ‘Dashain’ is observed during Aswain Sukla Pakchha. Aswin Krishna Pakchha is pre-Dashain 15 days period. These 15 days periods are called “Shorha Sharddha” (sixteen days devoted to remember and pray the late forefathers).
• Nepalese spent relatively more to celebrate “Dashain”. The investors are not aloof from this social phenomenon. Hence many investors sell their holdings to provide funds for the celebration of up-coming “Dashain”. This results into supply pressure in the stock market and thereby reduction in the stock returns.
• Another version of explanation is related with holding periods. If one purchases stocks during this period then he/she has to hold it for next 15 or more days because a longer stock market vacation observed next to this period.
5. Concluding remarksThere is an evidence of existence of seasonal pattern in stock returns. At the pre-Dashain period a significant decrease in stock return is observed. This study considered only lunar effect, there may be other calander effects as well. There are different Tithis in lunar calendar, i.e., Ekadashi, Duadashi. A study considering the Tithi effect may be fruitful in showing lunar calendar effect.
P. Pant | SEBON Journal - V (2011) 70-78

78
References Balaban, Ercan, 1995, January effects yes! What about Mark Twin effect? Working Paper, The
Central Bank of the Republic of Turkey, Research Department, 9509Campbell, J., 1987, Stock returns and the term structure. Journal of Financial Economics, 18,
pp. 373-399.Criss, Thomas B. and John Marcum, P. 1981, A lunar effect on fertility, Social Biology, 28, 75-80.Cyr, J.J., and R. A Kaplan, 1987, The lunar-lunacy relationship: a poorly evaluated hypothesis.
Psychological Reports, 62, 683-710.De Castro, John M. and Sharon M Pearcey, 1995, Lunar rhythms of the mean and alcohol intake
of humans, Physiology & Behaviour, 57, 439-444.Dichev, Ilia D. and D. Janes Troy, 2001, Lunar cycle effects in stock returns. Working paper,
University of Michigan.Fama, Eugene F., 1965, Random walks in stock market prices. Financial Analysts Journal,
September/October 1965Fishe, R.P.H., T. F. Gosnell, D. J. Lasser, 1993, Good news, bad news, volume and the Monday
effect, Journal of Business Finance and Accounting, 20, 881-92Garzino, S.J., 1982, Lunar effects on mental behaviour: a dense of the empirical research.
Environment and Behaviour, 14, 395-417.Hirshleifer, David and Tyler Shumway, 2001, Good day sunshine: stock returns and the weather.
Working paper, University of Michigan.Kamastra, Mark J., Lisa Karmar A., and Marice D. Levi, 2001, Winter blues: seasonal affective
disorder (SAD) and stock market return, Working paper, University of British Columbia.
Lakonishok, J., and S.Smidt, 1988, Are seasonal anomalies real? A ninety year perspective, Review of Financial Studies, 1, 403-25.
Leinss Gerhard, Pliezhausen, 2005, Auspicious days in the Japanese stock market predictions examined by a Cultural Historian, Japonica Humboldtiana, 9.
Mitchell, Jason D. and Li Lian Ong, 2006, Seasonalities in China’s stock markets: cultural or structural? IMF Working Paper, International Monetary Fund WP/06/4
Pant, Parameshwar, 2010, Anomalies in stock returns: evidences from Nepalese stock market. Unpublished M. Phil. Thisis, FOM, Tribhuvan University
Rotton, James and I. W Kelly, 1985, Much ado about the full moon: a meta-analysis of lunar-lunacy research, Psychological Bulletin, 97, 286-306.
Rozeff, M.S. and W.R Kinney, 1976, Capital market seasonality: the case of stock returns. Journal of Financial Economics, 3, 379-402.
Saunders, E.M.J., 1993, Stock prices and Wall Street weather, American Economic Review, 83, 1337- 1345.
Yua, Kathy. Zheng, Lu and Q. Zhu, 2001, Are investors moonstruck? Lunar phase and stock return, Working paper, University of Michigan.
P. Pant | SEBON Journal - V (2011) 70-78

79
Stock returns and trading volume in Nepal
Shiva Ram ShresthaCouncil for Technical Education and Vocational Training
AbstractThis paper aims at providing empirical evidence for the relationship between stock returns and trading volume using daily data for the period of 2001 to 2009 with 55 sample firms' stocks listed in NEPSE. The study analysed the contemporaneous relationship between stock returns and trading volume. There are two competing hypotheses that explain the relation between stock returns and trading volume: the mixture of distribution models, and the sequential arrival of information models. The study found a positive relationship between stock returns and trading volume. In addition, there is an asymmetric V-shaped contemporaneous relationship between positive and negative stock returns and trading volume. The finding contradicts with distributions hypothesis and supports the sequential information arrival hypothesis. Keywords: Stock returns; trading volume; Nepal; contemporaneous relationship
1. IntroductionThe relationship between trading volume and stock returns has been studied in various financial markets. A number of studies have been conducted on the relation between trading volume and stock returns in developed and big capital markets at the aggregate level (Kocagil and Shachmurove (1998)), t`heir relevance is yet to be seen in the context of smaller and under developed capital markets. The study of stock returns and trading volume relationship provides insight into the structure of the market, as stock price and trading volume relationship depend on the rate of information flow to the market, how information is disseminated, and other market conditions. Furthermore, a proper understanding of stock returns and trading volume relationship is also helpful to conduct various event studies and draw inferences.
Trading volume and stock returns are two important indicators of trading activity in a stock market that are jointly determined by the same market dynamics and may contain valuable information about a security (Lo and Wang (2001)). Trading volume reflects the cumulative response of investors to news, whereas price fluctuations capture the impact of that news on the average change in investors’ expectations. Study of relation between the stock returns and low volume in the NEPSE will help to uncover whether NEPSE exhibits a positive price-volume relations as found in mature markets. This study also helps to understand the empirical distribution of speculative prices, stock returns, and

80
trading volume association, which has significant implications for research on futures market.
The association between stock returns and trading volume is a subject of considerable interest among academics, policy makers and economists around the world. There have been attempts empirically to assess the dynamic relation between trading volume and stock returns. The link between stock returns and trading volume is varied in methods and results.
There are two competing hypotheses that explained the relation between stock returns and trading volume: Mixture-of-Distributions Hypothesis (MDH) was pioneered by Clark (1973) and the sequential arrival of information models, a premier work of Copeland (1976) and Jennings, Starks and Fellingham (1981).
Karpoff (1987) claimed that the MDH is consistent with the empirical distribution of price changes and the difference in the correlation between volume-absolute returns over different frequencies. However, the sequential information arrival hypothesis was supported by Smirlock and Starks (1985) on stock markets and McCarthy and Najand (1993) on currency futures markets.
Morgan (1976), Epps and Epps (1976), Westerfield (1977) and Rogalski (1978) found a positive correlation between volume and price changes for individual stocks by employing daily or monthly data. Granger and Morgenstern (1963), Godfrey, Granger and Morgenstern (1964) and Basic, Ozyildirim and Aydogan (1996) used weekly data, Crouch (1970) used daily volume and absolute values of daily price changes for both market indexes and individual stocks, to examine the relation between price changes and volume and find price changes follow a random walk.
Despite of alternative views, empirical works continue to show largely some degree of positive relationship between stock returns and trading volume. Though there are studies largely based on developed countries, only few studies have been conducted in the context of Nepalese stock market. These studies do not show clear conclusion regarding relationship between stock returns and trading volume. So there is a gap in the context of relation between trading volume and stock price of Nepalese stock market. Considering these rationale, this study specifically aims to:
• Investigate the contemporaneous association between trading volume and stock returns.
• analyses the link based on absolute stock returns, signed (i.e. positive and negative) stock returns and trading volume, and
• Test the stationary of trading volume and stock returns series of Nepalese stock market.The rest of the paper is organised as follows. In the next section,
S. R. Shrestha | SEBON Journal - V (2011) 79-95
81
review of literature on relationship between stock returns and trading volume is presented. The data and methodology are presented in section 3. Section 4 contains the analysis of data and results. Finally, a discussion over the results is presented in section 5.
2. Review of literature Osborne (1959) made an early attempt to study the price volume relationship. This implies a positive correlation between volume and price change. Ying (1966) studied SandP 500 index return and total volume of NYSE and found some very interesting results like; large increase in volumes is usually accompanied by large rise or fall in the prices, a large volume is followed by a rise in prices, if volume has been increasing/decreasing for a consecutive five trading days, and then there will be a rise/fall in the prices for next four trading days. But findings of Ying has been questioned on the ground that two series under his studies are not comparable. Tauchen and Pitts (1983) provided further insights into price-volume relationship. The study used daily data from the Treasury bill futures market, and argued that initially a market is very thin, trading volume starts to increase when more investors become aware of the market viability. Jain and Joh (1986) investigated the joint relationship between the hourly common stock trading volume and absolute returns for the NYSE stocks and the SandP 500 stock index from 1979 to 1983. The study found strong contemporaneous relation between trading volume and returns, lead-lag relationship between trading volumes and returns lagged up to four hours. The study also found that this relationship is steeper for positive returns than for negative returns.
Moosa and Al-Loughani (1995) examined the price-volume relation for four Asian stock markets. Using monthly aggregate price and volume data, the study found that, there is a strong evidence for causality running from volume to absolute price changes and from price changes to volume in the case of Malaysia, Singapore, and Thailand.
Fan, Groenewold and Wu (2003) examined the relation between trading volume and stock returns for two Chinese A-share markets and ten individual stocks in the energy sector. Using daily data covering the period from January 1, 1997 to December 31, 2002, the study found that the relationship between trading volume and return is asymmetrically V-shaped with the response of trading volume to a rising return being stronger than that to a falling return.
Gurgul, Majdosz and Mestel (2005) investigated the relationship between stock returns and trading volume. The study used daily stock data of the Polish companies included in the wig 20 segment covering the period from January 1995 to April 2005. The study tested whether volume data provide only a description of trading activities or whether they convey unique information that can be
S. R. Shrestha | SEBON Journal - V (2011) 79-95

82
exploited for modeling stock returns or return volatilities. These relationships are investigated by the use of abnormal stock returns and excess trading volume data. The study reported that there is no evidence of a contemporaneous relationship between market adjusted stock returns and mean adjusted trading volume.
Kamath, Sharma and Chusanachoti (2005) investigated the return-volume relation on the primary stock market indices of Indonesia, Malaysia, South Korea, and Thailand during the entire decade of the 1990. In all four emerging markets, they found significantly positive correlations between volumes and magnitudes of returns. In Malaysia, South Korea, and Thailand, they also found significantly positive correlations between volumes and returns.
Tambi (2005) analyzed return-volume relationship in Indian context, both in contemporaneous as well as lead-lag using daily individual stock data for the period of April 2000 to March 2005 for NSE Nifty Fifty companies are collected from CMIE Prowess database and cross checked from NSE database. The study found a strong positive contemporaneous as well as lead-lag relationship between trading volume and stock returns exist in Indian market.
Kamath and Wang (2006) examined the Price-Volume relation in six Asian equity markets over the January 2003 to October 2005 period. The study provided support for the notion that trading volume induces price movements in five of the six markets. Moreover, the study presented an evidence of significantly positive relation between volume and returns even though this relation was found to be asymmetric with respect to the market direction.
Kamath (2008) examined the econometric relations between daily returns and daily trading volume changes on the Santiago Stock Exchange of Chile. The study utilized the data of the Selective Stock Price Index, IPSA, from January, 2003 through October, 2006. A significant contemporaneous relation was found between volume and returns. The evidence also indicated that the said relation is asymmetric.
As a summary, a majority of the empirical studies established to the relationship between trading volume and stock returns. Some of the studies found positive relationship between trading volume and stock returns (e.g. (Deo, Srinivasan and Devanadhen, 2008) and some of them could not show such relationship between trading volume and stock returns (e.g., (Otavio and Bernardus, 2006), (Mestel Gurgul and Majdosz, 2003)). The stock returns and trading volume relationship in Nepal is not yet known.
3. Data and methodologyThis section describes (i) Nature and sources of data (ii) Selection of enterprises, (iii) The variables, (iv) Methods of analysis and (v) The limitations of the study.
S. R. Shrestha | SEBON Journal - V (2011) 79-95

83
3.1 Nature and sources of dataThe relationship between trading volume and stock returns are examined by using secondary sources of trading volume and return data series. The number of firms selected for the study along with number of observations is presented in table 1.
Table 1Historical background and representation of sample firms at pooled
trading data in NEPSE selected for the study
This table describes the historical background of listed company and representation of sample firms with number of observation. The sector wise representation are Commercial Bank (CB), Development Bank (DB), Finance Company (FC), Insurance Company (IC), Hotel (H), Manufacturing and Processing Company(MP), Trading Company(TC), Other company including Hydropower Company ( OC).
Year CB DB FC IC H MP TC OC Total2001 12 0 30 11 4 28 8 3 962002 11 4 35 13 4 29 8 4 1082003 11 4 41 13 4 29 8 4 1142004 14 7 44 14 4 29 8 5 1252005 15 8 50 15 4 29 8 6 1352006 15 16 53 16 4 21 5 5 1352007 17 23 55 17 4 18 4 4 1422008 21 29 61 17 4 18 4 5 1592009 23 32 62 17 4 18 4 6 166
Sample Firm 13 1 23 12 2 1 1 2 55Percent of Proportion
(based on 2009)56.52 3.13 37.10 70.59 50.00 5.56 25.00 33.33 33.13
No.of Obs. 20503 1131 10929 6380 1217 303 249 1131 41843
Most of the data related to maximum price, minimum price, opening price, average price, closing price, number of shares traded, number of trade and amount of trading volume were collected from annual reports and official reports of Securities Board of Nepal (SEBON), official website of Nepal stock exchange (NEPSE). The data set used in this study comprises daily closing prices and trading volume on NEPSE. The study period covers the time period of nine years from 2001 to 2009, thereby making 2112 trading days. Both series are expressed in the local currency.
S. R. Shrestha | SEBON Journal - V (2011) 79-95

84
3.2 Selection of enterprisesThe study consists of 55 listed firms as sample firms and daily trading data during 2001 to 2009. Table 2 describes the filter to construct the sample enterprises.
Table 2Selection of sample for the study
This table describes the sample firms. The study begins with all firms that and listed on the Nepalese Stock Exchange at the end of 2009. The final sample size consists of 55 firms.
Total Securities listed in NEPSE 238
Less: Promoter Shares, Government securities, Preference shares and Mutual Fund 72
Total Listed firms for Ordinary shares 166Less: Firms that have par value less than Rs.100 and HQ outside valley and listed after 2005 74
Firms listed before 2005 92
Less: Firms' trading less than 200 days during 9 years period 37
Sample firms 55
3.3 Specification of variablesThe total number of shares traded were used to measure trading volume for the study of aggregate trading activities e.g., Epps and Epps, (1976), Gallant, Rossi, and Tauchen, (1992), Hiemstra and Jones (1994) and Ying (1966). Other studies used the total number of shares traded divided by the total number of shares outstanding-as a measure of trading volume, e.g., Campbell, Grossman, Wang (1993), and LeBaron (1992). Individual share volume is often used in the analysis of price/volume and volatility/volume relations, e.g., Andersen (1996), Epps and Epps (1976), and Lamoureux and Lastrapes (1990, 1994). Alternatively, even the total number of trades used by Conrad, Hameed, and Niden, (1994) and James and Edmister, (1983) have been used the number of trading days per year as measures of trading activity. This study uses the total value traded of the shares as the measure of trading volume because it takes into account of the relative market value of shares while other measures mentioned above do not. The volume series at the time t noted as LOG( Vt ) is expressed as:
LOG (Vt ) = LOG (Volumet )
Where, Vt is the NPR value of the shares traded at time t. and LOG (.) is the logarithm operator.
The study considered day to day price change as stock returns. A day-to-
S. R. Shrestha | SEBON Journal - V (2011) 79-95

85
R1 = daily stock returns = LnP1
Pt - 1( (
day price change is calculated using the natural log of the ratio of a stock’s price (P) from the current day (t) to the previous day (t-1) as:
Where, PtPt represents the closing price of individual shares for the period t; t is the time in days. Pt - 1 Pt - 1 is the closing price of individual shares for the period of t-1; Ln (.) is the natural logarithm operator. All returns are expressed in local currencies and are not adjusted for dividends.
3.4 Methods of analysisRegression analysisThe Ordinary Least Square (OLS) regression equation is estimated for this study to test whether there is association between stock returns and trading volume. The trading volume and stock returns relationship is tested by following two regressions introduced by Karpoff (1987).
Vt = a0 + a1 R1 + εt ....... (1)
Vt = b0 + b1 | R1 | + εt ....... (2)
Where, dependent variable Vt is the log of daily trading volume, the independent variable is Rt , log of return for equation (1) and |Rt|, log of absolute value of returns for equation (2) and εt is random error term.In addition, this paper tests the symmetric V shaped relationship estimate the following model;
Vt = b0 + b1 Rt (+) + b2Rt
(–) + εt ....... (3)Where,
)(+tR =
>
otherwiseORifR tt 0
)(−tR =
<
otherwiseORifR tt 0
Unit root testUnit root tests are important in time series analysis as the choice of the techniques and procedure for further analysis and modeling of series depends on their order of integration. Without taking into account the presence of unit root in the variables, the analysis may produce spurious results. According to
S. R. Shrestha | SEBON Journal - V (2011) 79-95

86
Nelson and Plosser (1982), there exists a unit root in most stock price time series. While dealings with time series, it is necessary to analyze whether the series are stationary or not. Since regression of non-stationary series on other non-stationary series leads to what is known is spurious regression causing inconsistency of parameter estimate (Engle and Yoo, 1987). The most popular of these tests are the Augmented Dickey-Fuller (ADF) test and the Phillips-Perron (PP) tests. ADF test will be considered for this study because ADF tests use a parametric autoregressive structure to capture serial correlation. The test is based on the regression:
DYt = m + y Yt - 1 _ St = 1 d t D Yt-1 + ε t (7)
Where, Y stands for stock returns, absolute stock returns and trading volume, respectively, μ, γ and δ are model parameters and εt is a white noise variable. The lag lengths r for the ADF test are determined by applying Akaike Information Criterion (AIC).
The unit root test is carried out by testing the null hypothesis γ = 0 against the one sided alternative γ < 0. Unfortunately the t-Student-statistic of the estimated parameter γ does not have a conventional t-distribution under the null hypothesis of a unit root. Instead the study uses probability value and lag length.
3.5 Limitations of the studyThere are a large number of non-listed companies contributing to the dynamics of Nepalese economy; they are not included in the study due to data problems. The results relating to relationship between stock returns and trading volume in this study is based on regression analysis using available daily stock returns and trading volume data series.
4. Estimation and results The purpose of this section is to provide the empirical results of relationship between stock returns and trading volume in Nepalese stock market. The analysis consist of: (i) descriptive statistics of variables, (ii) Correlation Analysis, (iii) Unit root test and (iv) Results of regression equation to test relationship between stock returns and trading volume.
4.1 Descriptive statisticsThe study started investigation with some basic descriptive statistics of time series of stock returns and trading volume from pooled daily data of fifty five sample firms for the period of 2001.1.1 to 2009.12.31. It provides an insight into the average size and deviation from mean value of the variable. The descriptive
S. R. Shrestha | SEBON Journal - V (2011) 79-95

87
statistics for the variables are presented in table 3.As seen from above table the mean value of daily stock returns over the
period for all sample is -0.0004 with standard deviation of 0.0418.The maximum and minimum returns observed are 1.76.41 and –1.1239 respectively. Significant Jarque-Bera statistics clearly rejects the hypothesis, which implies that pattern of all variables does not conform to normal distribution, which is the precondition for any market to be efficient in the weak form (Fama (1965), Stevenson and Bear (1970), Reddy (1997), Kamath (1998) and Mahajan and Singh (2008). Further, skewness and excess kurtosis preserve the evidence of the nature of departure from normality because the skewness and kurtosis value of stock returns are 8.2356 and 275.8367 respectively. The skewness coefficient in excess of unity is generally taken to be fairly extreme. In a Gaussian distribution, one would expect these data to have a kurtosis coefficient of 2.902. Kurtosis generally either much higher or lower indicates extreme leptokurtic or extreme platykurtic (Parkinson, 1987). Thus, daily stock returns series are not normally distributed.
Table 3Descriptive statistics for pooled data of all sample firms
The data for this table are collected and compiled from the 55 sample firms listed at Nepal Stock Exchange Limited for the period 2001 to 2009 with 41843 pooled data. The table contains stock returns and trading volume series. The daily trading volume is calculated by multiplying number of shares traded times closing share price. The log difference of daily trading volume has been used for volume (Vt ). The daily stock returns are calculated by natural log of current closing stock price divided by lagged closing stock price,
i.e. daily stock returns (Rt ) = LN . In the table, N represents number of
observations and mean, maximum and minimum for average, maximum and minimum returns respectively for the period. SD stands for standard deviation of the returns. SK is a measure of skewness and KURT represents kurtosis. The Jarque-Bera (JB) test of normality is the test of the joint hypothesis that SK and KURT are 0 and 3, respectively. In that case, the value of the
JB statistic is expected to be zero. JB is defined as JB=
Any p-value
less than 0.05 indicate that the distribution is not normal. The JB – statistic with ** indicates that the distribution is significantly different from normal distribution at 1% level of significant.
Mean Max Min SD SK KURT JB Stat. N
-0.0004 1.7641 -1.1239 0.0418 8.2356 275.8367 130000000** 418430.0004 9.0000 -8.6764 1.6582 -0.0120 4.5096 3968.75** 41787
S. R. Shrestha | SEBON Journal - V (2011) 79-95
(Rt) = LN ( )Pt
Pt - 1
s2
6+ n[ ](k-3)2
24s2
6+[ ](k-3)2
24n

88
The detrended trading volume series were used in this study. The trading volume series are detrended by transforming trading volume series into log differenced value. The mean value of trading volume is 0.0004 with standard deviation of 1.6582. The value of the trading volume series ranged from 9.0 to -8.2356. The JB statistic is statistically significant. It indicates that trading volume series are not normally distributed. The skewness and Kurtosis value is -0.0120 and 4.5096 respectively.
4.2 Correlation analysisThe correlation analysis between stock returns and trading volume provide direction of movement of stock returns and trading volume. The correlation coefficient 0.0357 has been observed between trading volume and stock returns. The correlation coefficient is at 1 percent level. Prior studies generally do not find a contemporaneous relation between trading volume and stock returns (Karpoff (1987), Lee and Rui (2002) and Ciner (2002)). 4.3 Unit root testThe time series variables such as stock returns and trading volume should be stationary for the analysis of time series statistics. The unit root test helps to test whether the times series variable is stationary or not.
Table 4Summary result of unit root test
This table reports the results of the ADF test and PP test for unit roots. The lag length (p) is
chosen based on AIC. The empirical model; where
tY∆ is the first difference of the time series variable and i is the lag order of the autoregressive process. A constantµ and the coefficient on a time trend γ are also incorporated in the model to account for the different possibilities of the unit root process. If 0µ = and 0γ = , it
corresponds to a random walk model and if only 0γ = , it equals to modeling a random walk with drift. The ADF critical value for t-statistics at 5 per cent (1 per cent) level for the model with the constant is -2.86 (-3.43) respectively.
Data series Lags
Augmented Dickey-Fuller Test Philips-Perron Test
test Statistic with intercept
test Statistic with intercept and trend
test Statistic with intercept
test Statistic with intercept and
trend 18 -45.536** -45.541** -208.077** -208.077**
54 -38.404** -38.413** -2460.633 -2470.859
Note: *** -1% or less, ** up to 5%, * up to 10% level significant.
S. R. Shrestha | SEBON Journal - V (2011) 79-95
11
m
t t j t i ti
Y Y Y tµ δ a γ ε− −=
∆ = + + ∆ + +∑

89
The test results presented in table 4 show that parameters are negative for ADF statistics as well as the PP statistic. The statistics are inferior to the McKinnon critical value at 10% level. This indicates that the null hypothesis of unit root is rejected for the stock returns and trading volume series. Hence, times series variables of the study can be considered as stationary and will be used for remaining estimations.
4.4 Regression analysisThe study used regression analysis to further investigate the contemporaneous relation between trading volume and stock returns. First, the trading volume is regressed on signed stock returns. Then, the trading volume is regressed on absolute stock returns. Finally, the trading volume is regressed on positive stock returns and negative stock returns to analyze the symmetric V-shaped relationship between stock returns and trading volume.
Table 5Regression for contemporaneous relationship between stock returns
and trading volume (2001.01.01 to 2009.12.31)
The table provides the coefficient estimates from regression of volume against returns. Panels A, B and C present the results for signed return, absolute return and positive return and negative returns respectively for pool daily data of 55 sample firms over the period of 2001.01.01 to 2009.12.31 with 41843 observations. In Panel A,
ttt RV εaa ++= 10, where
tV is detrended
trading volume (i.e. log diff trading volume) at time t , tR is stock returns, at day
t and tε = a random error term, In Panel B, ttt RV εββ ++= 10 where,
tR is absolute
value of stock returns at day t. In Panel C, tttt RRV εβββ +++= −+ )(2
)(10 , where, )(+
tR
is positive stock returns, >
otherwiseORifR tt 0 and )(−
tR is negative returns, <
otherwiseORifR tt 0 .
Panel AModel : 1 Variable Co-
efficientStd.
Errort -
StatisticP -
value. F - Stat R2 DW stat
ttt RV εaa ++= 10
Constant -0.0010 0.0081 -0.1245 0.9009 54.7188 0.0013 2.9257
tR 0.0070 0.0009 7.3972 0.0000 0.0000
S. R. Shrestha | SEBON Journal - V (2011) 79-95
LnPt
Pt - 1( )

90
Panel BModel : 1 Variable Co-
efficientStd.
Errort -
StatisticP -
value. F - Stat R2 DW
stat
ttt RV εββ ++= 10
Constant -0.0040 0.0083 -0.4749 0.6348 5.0700 0.0001 2.9242
tR 0.0022 0.0010 2.2517 0.0243 0.0243
Panel CModel : 1 Variable Co -
efficientStd.
Errort -
StatisticP -
value. F - Stat R2 DW
stat
tttt RRV εβββ +++= −+ )(2
)(10
Constant 0.0089 0.0085 1.0544 0.2917 5.0700 0.0001 2.9242
)(+tR 0.0053 0.0010 5.0333 0.0000 0.0243
)(−tR 0.0163 0.0025 6.5907 0.0000
Wald test (1β =
2β ) 16.5099*** Wald test ( 1β =- 2β ) 66.1707***
Table 5 shows the results of regression equation (1), (2) and (3) in panels A, B and C respectively. In panel A, the regression coefficient of stock returns is positive and statistically significant at 1 percent level. In panel B, the regression coefficient of regressing absolute returns on trading volume is statistically significant at 5 percent level. In panel C, the estimation result of equation (7) shows that coefficients of both positive and negative stock returns are significant at 1 percent level. Therefore, there exists some evidence for the presence of asymmetry in relation between trading volume and stock returns. Also value of coefficient of negative stock returns is greater than coefficient of positive stock returns thereby suggesting a strong relation between trading volume and negative stock returns. The result of Wald test for the null hypothesis, 1β = 2β and 1β=- 2β both are statistically significant, hence rejecting both restrictions. Thus, the relationship between trading volume and stock returns is asymmetrically V-shaped for Nepalese stock market.
5. FindingsThe proper understanding of stock returns and trading volume helps to understand the portfolio management and investment management services. The relationship between stock returns and trading volume form the basis of profitable trading strategies, and this affects the efficiency of market. Stock returns and trading volume are two major pillars, around which entire stock market revolves. Based on the analysis of data, the major findings of the study are as summarized as follows:
S. R. Shrestha | SEBON Journal - V (2011) 79-95

91
• The Jarque-Bera statistic of stock returns and trading volume data series are significant. Thus, the stock returns, trading volume and return volatility data series are not normally distributed.
• Augmented Dickey-Fuller statistics and Philips-Perron test reported that the stock returns, trading volume and volatility series are considered as stationary. This series need not be subjected to be co integration analysis.
• There is a positive contemporaneous relationship between stock returns and trading volume.
• There is an asymmetric V-shaped relationship between positive and negative stock returns and trading volume.
The findings are consistent with the findings of Ying (1966), Tauchen and Pitts (1983), Moosa and Al-Loughani (1995), Chen, Firth and Rui (2001), Kamath (2008). The results of the present study help to increase the understanding regarding the relationship between trading volume and stock returns, particularly for the NEPSE. These findings also indicate that any study of trading volume and returns is necessarily relating to information flow and possibly to identify a better proxy for information flow.
References Andersen, T. G., 1996, Return volatility and trading volume: an information flow interpretation
of stochastic volatility. Journal of Finance 51,1, 169-204.Basci, E., K. Ozyildirim, and K. Aydogan, 1996, A note on price-volume dynamics in an
emerging stock market. Journal of Banking and Finance, 20, 389-400.Campbell, J. Y., S. J. Grossman, and J. Wang, 1993, Trading volume and serial correlation in
stock returns. Quarterly Journal of Economics, 108, 905–939.Chen, G., M. Firth, and O. Rui, 2001, The dynamic relation between stock returns, trading
volume, and volatility. Financial Review, 36, 153-174.Ciner, C., 2002, Information content of volume: an investigation of Tokyo commodity futures
and markets, Pacific Basin Finance Journal , 10, 201-215.Clark, P. K., 1973, A subordinated stochastic process model with finite variance for speculative
prices, Econometrica, 41, 135-155.Conrad, J., A. Hameed, and C. Niden, 1994, Volume and auto covariance in short horizon
individual security returns, The Journal of Finance 49, 4, 1305-1329.Copeland, T. E., 1976, A model of asset trading under the assumption of sequential information
arrival, Journal of Finance 31, 1149–1168.Crouch, R.,1970, The volume of transactions and price changes on the New York Stock
Exchange, Financial Analysts Journal, 26, 104-109.Deo, M., K.Srinivasn, and K. Devandhen, 2008, The empirical relationship between stock
returns, trading volume and volatility: evidence from selected Asia-Pacific stock market, European Journal of Economics, Finance and Administrative Sciences, 12, 58-68.
S. R. Shrestha | SEBON Journal - V (2011) 79-95

92
Engle, R., and B. Yoo, 1987, Forecasting and testing in co-integrated systems, Journal of Econometrics, 35, 143-328.
Epps, T. W., and M. L. Epps, 1976, The stochastic dependence of security price changes and transaction volumes: implications for the mixture-of- distribution hypothesis, Econometrica , 44, 305–321.
Fama, E.,1965, The behavior of stock-market prices, The Journal of Business 38, 1, 34-105.Fan, X., N. Groenwold, and Y. Wu, 2003, The stock return-volume relation and policy effects:
the case of the energy Sector, Proceedings of the 15th Annual Conference of the Association for Chinese Economics Studies Australia (ACESA).
Gallant, A. R., P. E. Rossi, and G. Tauchen, 1992, Stock prices and volume, The Review of Financial Studies, 5, 199–242.
Godfrey, M. D., C. W. Granger, and O. Morgenstern, 1964, The random walk hypothesis of stock marker behavior, Kyklos , 17, 1-30.
Granger, C. W., and O. Morgenstern, 1963, Spectral analysis of New York stock market prices, Kyklos, 16, 1–27.
Gurgul, H., P. Majdosz, and R. Mestel, 2005, Joint dynamics of price and trading volume on the Polish stock market, Managing Global Transactions 3, 2, 139-156.
Hiemstra, C., and J. Jones, 1994, Testing for linear and non-linear Granger causality in the stock price-volume relation, Journal of Finance, 49, 1639–1664.
Jain, P., and G. Joh, 1986, The dependence between hourly prices and trading volume, The Journal of Financial and Quantitative Analysis 23, 3, 269-283.
James, C., and R. Edmister, 1983, The relation between common stock returns trading activities and market value, Journal of Finance, 38, 1075–1086.
Jennings, R. H., L. T. Starks and J. C. Fellingham, 1981, An equilibrium model of asset trading with sequential information arrival, Journal of Finance, 36, 143-161.
Kamath, R., 2008, Return distribution and the day-of-the-week effects in the stock exchange of Thailand, Journal of Economics and Finance 22, 2-3, 97-106.
_____, and Wang., 2006, The Causality between stock returns and volumes in the Asain equity markets. Journal of International Business Research 5, 3, 63-74.
Kamath, R., J. Sharma, and J. Chusanachoti, 2005, The stock return-volume relationship in emerging stock markets, Journal of International Finance and Economics, 1, 30-35.
Karpoff, J., 1987, The relation between price changes and trading volume: a survey, Journal of Financial Quantitative Analysis, 22, 109–126.
Kocagil, A. E., and Y. Shachmurove, 1998, Return-volume dynamics in futures markets, The Journal of Futures Market 18, 4, 399-426.
Lamoureux, C., and W. Lastrapes, 1994, Endogenous trading volume and momentum in stock return volatility. Journal of Business and Economic Statistics 12, 2, 253-260.
Lamourex, C., and W. Lastrapes, 1990, Heteroskedasticity in stock return data:volume versus GARCH efects, The Journal of Finance 45, 1, 21-229.
LeBaron, B., 1992, Some relations between volatility and serial correlation in stock market returns. Journal of Business, 65, 199-219.
Lee, B., and O. Rui, 2002, The dynamic relationship between stock returns and trading volume: domestic and cross-country evidence, Journal of Banking and Finance 26, 1, 51-78.
Lo, A., and J. Wang, 2001, Trading volume: Implications of an intertemporal capital asset pricing model, Working Paper No. 8565, NBER.
S. R. Shrestha | SEBON Journal - V (2011) 79-95

93
Mahajan, S., and B. Singh, 2008, An empirical analysis of stock price-volume relationship in Indian stock market, Vision 12, 3, 1-13.
McCarthy, J., and M. Najand, 1993, State space modeling of price and volume dependence: evidence from currency futures, The Journal of FuturesMarkets, 13, 335–344.
Mestel, R., H. Gurgul, and P. Majdooz, 2003, The empirical relationship between stock returns, return volatility and trading volume on the Austrian stock market, www.charttricks.com/Resources/Articles/volume_volatility_Mestel.pdf .
Moosa, I., and N. Al-Loughani, 1995, Testing the price-volume relation in emerging Asian stock markets, Journal of Asian Economic , 6, 407-422.
Morgan, I. G., 1976, Stock prices and heteroskedasticity. Journal of Business, 49, 496–508.Nelson, C., and C. Plosser, 1982, Trends and random walks in macroeconomics time series:
Some evidence and implications, Journal of Monetary Economics, 10, 139-162.Osborne, M.F.M., 1959, Brownian motion in the stock market, Operations Research, 7,145-173.Parkinson, J. M., 1987, The EMH and the CAPM on the Nairobi stock exchange, East African
Economic Review, 3, 105-110.Reddy, S., 1997, Efficiency of Indian stock markets: An empirical analysis of weak-form EMH
of the BSE, UTI Indian Capital Market Conference, 91-115.Rogalski, R. J., 1978, The dependence of prices and volume, The Review of Economics and
Statistics, 36, 268–274.Smirlock, M., and L. Starks, 1985, A further examination of stock price changes and transaction
volume. The Journal of Financial Research, 8, 217-225.Stevenson, A., and M. Bear, 1970, Commodity futures: Trends or random walks? The Journal
of Finance 25 , 1, 65-81.Tambi, M. K., 2005, An empirical study of return-volume relationship for Indian market,
129.3.20.41/eps/fin/papers/0504/0504013.pdf .Tauchen, G., and M. Pitts, 1983, The price variability-volume relationship on speculative markets,
Econometrica, 59, 371–396.Westerfield, R.,1977, The distribution of common stock price changes: An application of
transactions time and subordinated stochastic models, Journal of Financial and Quantitative Analysis, 12, 743–765.
Ying, C., 1966, Stock market prices and volume of sales, Econometrica 34, 3, 676-686.
S. R. Shrestha | SEBON Journal - V (2011) 79-95

94
AnnexureDetails of sample firms and number of observations
The table provides the sample firms with study period and number of observations. There are 55 sample firms. The study period covered from 2001.01.01 to 2009.12.31. The pooled data included 41843 daily data
SN Sector CODE Firms Start Date End Date Obs.1
1
102 Nabil Bank Ltd. 02.1.2001 31.12.2009 18772 103 Nepal Investment Bank Ltd. 05.1.2001 31.12.2009 17103 104 Standard Chartered Bank Ltd. 03.1.2001 31.12.2009 18334 105 Himalayan Bank Ltd. 02.1.2001 31.12.2009 17625 106 Nepal SBI Bank Limited 02.1.2001 31.12.2009 18466 107 Nepal Bangladesh Bank Ltd. 01.1.2001 31.12.2009 19797 108 Everest Bank Ltd 03.1.2001 31.12.2009 19068 109 Bank of Kathmandu 01.1.2001 31.12.2009 20579 113 Kumari Bank Ltd 11.8.2004 31.12.2009 119710 116 Siddhartha Bank Limited 17.1.2005 31.12.2009 86711 117 NMB Bank Ltd. 25.1.2001 31.12.2009 138812 118 DCBL Bank Ltd. 02.7.2002 31.12.2009 143813 120 KIST Bank Limited 31.1.2005 31.12.2009 643 Total 2050314 2 219 Uniliver Nepal Ltd. 22.7.2002 10.9.2009 303 Total 30315 3 303 Taragaon Regency Hotel 05.1.2001 16.7.2009 44916 304 Oriental Hotel Ltd. 30.10.2001 14.12.2009 768 Total 121717 5 502 Bishal Bazar Co. Ltd. 28.3.2001 17.12.2009 249 Total 24918
6
601 Nepal Insurance Co. Ltd. 04.1.2001 08.11.2009 22619 602 Rastriya Beema Sansthan 01.1.2001 29.12.2009 27320 603 National Life Insu. Co. Ltd. 08.1.2001 23.11.2009 31621 604 Himalayan Gen.Insu. Co. Ltd. 09.1.2001 29.12.2009 232
22 605 United Insurance Co. (Nepal) Ltd. 03.1.2001 08.11.2009 1180
23 606 Everest Insurance Co. Ltd. 01.1.2001 25.11.2009 46724 607 Premier Insurance co. Ltd. 02.1.2001 09.12.2009 45425 608 Neck Insurance Co. 05.1.2001 22.11.2009 339
26 609 Alliance Insurance Co. Limited 09.1.2001 11.10.2009 252
27 610 Sagarmatha Insurance Co. Ltd 16.3.2001 29.12.2009 67328 612 Nepal Life Insurance Co. Ltd. 05.2.2003 31.12.2009 97829 613 Life Insurance Co. Nepal 16.4.2003 31.12.2009 990 Total 6380
S. R. Shrestha | SEBON Journal - V (2011) 79-95

95
30
7
701 Nepal Finance and Saving Co. Ltd. 09.8.2002 29.12.2009 262
31 702 NIDC Capital Markets Ltd. 01.1.2001 31.12.2009 55532 703 National Finance Co. Ltd. 02.1.2001 25.11.2007 69933 704 Nepal Share Markets Ltd. 02.1.2001 27.12.2009 64734 706 Kathmandu Finance Limited. 05.2.2001 20.12.2009 39835 707 Peoples Finance Limited. 03.1.2001 31.12.2009 56436 709 Citizen Investment Trust 05.2.2001 31.12.2009 250
37 710 Nepal Aawas Bikas Beeta Co. Ltd. 03.1.2001 23.12.2009 615
38 715 Gorkha Finance Ltd. 09.1.2001 09.12.2009 43939 717 Universal Finance Ltd. 04.1.2001 31.12.2009 31140 721 Lalitpur Finance Ltd. 05.1.2001 28.12.2009 34541 722 Goodwill Finance Co. Ltd. 07.3.2001 31.12.2009 34842 725 Lumbini Finance Ltd. 10.1.2001 31.12.2009 658
43 728 Alpic Everest Finance Company Limited 06.7.2001 17.12.2009 678
44 731 International Leasing And Fin. Co. 13.1.2003 31.12.2009 1006
45 732 Shree Investment Finance Co. Ltd 06.3.2003 31.12.2009 529
46 733 Central Finance Co. Ltd. 04.4.2003 27.12.2009 486
47 734 Nepal Shree Lanka Merchant Bank 26.5.2003 11.12.2007 417
48 735 Premier Finance Co. Ltd 13.6.2003 12.11.2009 30349 736 Nava Durga Finance Co. Ltd. 22.8.2003 31.12.2009 20550 739 Standard Finance Ltd. 17.3.2004 31.12.2009 52751 741 Cosmic Mer.Bank And Fin. Ltd 18.5.2004 24.11.2009 36152 746 Capital Mer. Bank And Fin. Ltd 13.1.2005 30.11.2009 326 Total 1092953 8 802 Nepal Development Bank Ltd 28.1.2002 02.6.2009 1131 Total 113154 9 902 Butwal Power Co. Ltd. 04.1.2005 17.12.2009 40255 903 Chilime Hydro power Co. Ltd 06.4.2005 31.12.2009 729 Total 1131 Grand Total 41843
Source: Nepal Stock Exchange Ltd.
S. R. Shrestha | SEBON Journal - V (2011) 79-95

96
Stock price movements in Nepal
Jeeban AmgainSecurities Board of Nepal
Bigyan ShresthaNational Life Insurance Company Ltd.
AbstractThis paper examines the movements of stock price in Nepalese market. Daily stock prices are used to test the independence of changes in stock prices by applying the Augmented Dickey Fuller (ADF), and Phillips-Perron (PP) unit root test. The results obtained from these tests imply that Nepalese stock market follows random walk model. It means the future stock prices cannot be predicted in advance from the past observed stock prices and hence there is no scope for traders to make abnormal profits from modeling the past observed stock prices.
Keywords: Random walk; unit root; weak-form market efficiency; stock market; stock price
1. IntroductionRandom walk theory implies that stock price changes have the same distribution and are independent of each other, so the past movement or trend of a stock price or market cannot be used to predict its future movement. Random walk hypothesis assumes the randomness of the stock price that present price is not the determinant of future price. The changes in stock price are independent of past trend and information and future prices are unpredictable at any instance. Hence, there is little scope for investor making the profit from the analysis of past data.
Theoretically, the value of stock is the present value of all the future earnings of the stock over the life of that stock. Hence, the value of stock depends on the future cash flow generated by stock and should incorporate all the information about the future cash flows at the current time. It is widely believed that the competitive pricing of the stock in market ensures the premium for all the information present and hence is equal to the theoretical price of the stock. It is also called the weak form of efficient market hypothesis of stock pricing.
Random walk hypothesis is compatible with weak-form of the efficient market hypothesis. As weak form efficiency hypothesis claims unpredictability of stock prices, random walk hypothesis indicates the randomness of price movements. The random walk hypothesis asserts that stock price movements
97
will not follow any patterns or trends and that past price fluctuations cannot be used to predict future price changes. As a result, changes of securities prices cannot be predicted from previous path of stock prices. In other words, in efficient market, random walk is observed in stock price changes. At any time, value of the stock is equal to the present value of future cash flows. If there are any changes in expected future values, the price of the stock also changes. The changes in stock prices cannot be predicted unless the expectation of future cash flow changes. As all the information is contained in current market prices, there is no scope for changes in future cash flows reflecting in the stock price. Hence, stock price follow random walk in efficient stock market.
Statistically, stock price can be modeled as
Rt = a + bt + gRt - 1 + εt
Where α is intercept, β is trend, γ is coefficient of variable, and ε is the error term in a model. If α=0, the model is without intercept and β=0 implies the model without trend value.
The changes in stock price is given by
DRt = R - Rt - 1 = a + bt + (g - 1) Rt - 1 + εt
Random walk model is that where DRt is independent and cannot be predicted from past observed value of stock market prices.
In recent years, stock prices in Nepal have several ups and downs. Large fluctuations have been observed in the current stock prices. More people are concerned whether the stock prices follow the historical pattern or not. The market capitalisation of listed stock increased up to Rs. 376,871.37 million on 15 July 2010 as compared to only Rs. 35,162.70 million on 17 July 2003. The wide fluctuation over Nepse index was observed during last few years. The overall Nepseindex increased up to 477.73 on 15 July 2010 from 204.41 on 17 July 2003. For the said period from 17 July 2003 to 15 July 2010, the maximum Nepse index observed was 1,175.38 on 31st August 2008 and the lowest index observed was 195.14 on 1st April 2004.The fluctuations in stock prices that appeared during 2004 to 2010 motivated to test whether the stock price shows random behaviour or not.
This study uses the Augmented Dickey-Fuller (ADF) test and Phillips and Perron (PP) unit root test to investigate the weak-form of stock market efficiency in Nepal. The main purpose is to determine whether there is any
J. Amgain / B. Shrestha | SEBON Journal - V (2011) 96-108

98
influence of past trend of observed stock index on occurrence of future stock index in Nepalese stock market. The hypothesis is that changes in stock index are independent over the time.
The remainder of the paper is divided into five main sections. The literature of weak-form efficiency is summarised in section 2. Section 3 presents a description and preliminary analysis of the data used for analysis. Section 4 states the methodology employed for the study. The results are discussed in section 5 and paper ends with some conclusion in section 6.
2. Review of literatureIn international perspective, a large number of studies have been carried out to test whether the stock prices show random behaviour or not. The majority of studies have focused on developed economies where the weak-form efficiency tests have hardly been rejected (Kendall (1953) and Fama,(1970)). Despite some studies have witnessed predictability of future price changes in these markets (Poterba and Summers (1988);Hudson, Dempsey and Keasy (1996)), no evidence of profitable trading strategies based on that predictability has been shown. Hence, developed financial markets as a whole have proved to be weak-form efficient.
In contrast, evidence from emerging countries is controversial. Most of the research conducted on emerging markets has examined Asian and Latin American stock markets produced mixed results. Sharma and Kennedy (1977) tested randomness on Bombay stock exchange and proved it as a weak-form efficient market. The same result has been obtained by Barnes (1986) on the Kuala Lumpur stock exchange. The Taiwan Stock Exchange is also weak-form efficient as shown by Chang et al. (1999) and Chang and Ting (2000). Alam et al. (1999), by performing variance ratio tests, could not reject the hypothesis of weak-form efficiency for Hong Kong, Malaysia, Taiwan and Bangladesh, whereas it was rejected for Sri Lanka, which was also confirmed by Abeysekera (2001). On the other hand, for Sangai and Shenzen stock exchanges, the null hypothesis of weak-form efficiency is rejected by Mokerjee and Yu (1999) and Groenewold et al.((2003)). Argentina, Brazil, Chile and Mexico were proved tobe weak-form efficient (Errunza and Losq. (1985)) and the results for Argentina and Brazil were also confirmed by Karamera et al. ((1999)) but not for Chile and Mexico, which was eventually inefficient. In addition, Urrutia (1995) provided contradictory evidence for Argentina, Brazil, Chilli and Mexico. Grieb and Reyes (1999) also demonstrated that Brazil and Mexico are not weak-form efficient.
Evidence from European emerging markets and Middle-East is also mixed.The behaviour of the equity markets in Czech Republic, Hungary, Poland and Slovakia is proved to follow a random walk process (Dockery and Vergari
J. Amgain / B. Shrestha | SEBON Journal - V (2011) 96-108

99
(1997); Filer and Hanousek (1996)), whereas Smith and Ryoo (2003) and Gilmore and Mac Manus (2003) rejected the random walk behaviour of prices changes for these markets. Gandhi et al. (1980) could not find evidence to support the random walk hypothesis for the Kuwait stock exchange while Al- Loughani’s (1995) results also confirm that. Dahel and Labaas (1998), by performing unit root and variance ratio test on stock price indexfrom Bahrain, Kuwait, Oman and Saudi Arabia, showed that only the Kuwait market is weak-form efficient.Omran and Farrar (2005), by applying a range of statistical techniques on the returns series from Egypt, Israel, Jordan, Morocco and Turkey, rejected the null hypothesis of random walk for all markets, except Israel.
Vitali and Mollah (2010) investigated the weak-form of market efficiency in Africa by testing the Random Walk Hypothesis (RWH) through multi-approach specifically unit root, auto- correlation, runs and variance ratio tests on the daily price index of Egypt, Kenya, Morocco, Nigeria, South Africa and Tunisia over the period 1999-2009. The empirical results rejected the RWH for all stock markets index over the whole sample period with the exception of South Africa over the second sub-period (2007-2009).
Some of previous studies have attempted alternative methods and have employed unit root test to examine the stock price movements. Chaudhuri and Wu (2003) used the Zivot and Andrews (1992) endogenous one structural break test to examine the randomness of the stock price behaviour in seventeen emerging markets. In a study of ten markets, they rejected the random walk hypothesis. Narayan andSmyth (2004) showed that stock prices in South Korea were characterised by a unit root and they concluded that South Korea stock market was weak-form efficient. Cooray and Wickremasingle (2005) examined the weak-form efficiency in the stock market of India, Sri Lanka, Pakistanand Bangladesh. Using the Augmented Dicky Fuller (ADF), the Phillip-Perron (PP), the Dicky-Fuller Generalized Least Square (DF-GLS) and Elliot-Rothenber-stock (ERS) tests, they found that Stock markets of India Sri Lanka and Pakistan were weak-form efficient, whereas weak-form efficiency was not supported for Bangladesh by the DF-GLS and ERS tests.
Early studies revealed that stock prices move randomly indicating that successive prices are independent of historical prices. Later, there are evidences of some predictable patterns in the share price movements (Bhatta (2010)). The result of small and emerging markets has shown mixed results in terms of randomness in stock markets. Most of the studies in both developed and developing markets used traditional models such as serial correlation and runs test to identify the behaviour of share prices. Some studies, however, used dynamic time series model such as unit roots, autoregressive integrated moving average (ARIMA) and generalized auto-regressive conditional heteroscedasticity
J. Amgain / B. Shrestha | SEBON Journal - V (2011) 96-108

100
(GARCH) models to examine the random walk behaviour in different countries.Regarding the Nepalese stock market, few studies have already been
conducted on the random walk hypothesis. These studies used conventional econometric models such as autocorrelation test and runs test. Pradhan and Upadhyay (2006) investigated the random walk model in Nepalese context. The results of the study do not support the independence assumption of random walk modeli.e. the Nepalese stock market may not be termed as weak-form efficient in pricing of shares. The study also revealed that Nepalese investors are not indifferent towards making or non-making of information to public. Among others, the company information, lack of profitability of the company, market operation system and government policy regarding investment are appeared to be the major causes of deficiency in the Nepalese stock market. Similarly, Bhatta (2010) examined the issue of market efficiency and stock price behaviour in Nepal. The runs test along with auto correlation tests were used to test the randomness of the stock market prices from the data set of daily, weekly and monthly stock prices. The results showed that stock prices in Nepal are not moving independently confirming the Nepalese stock market is not weak-form efficient.The findings implied that the stock prices in Nepal showed a systematic pattern that is valuable for observing the behaviour of past price movements to predict future price.
A study by Pradhan and KC (2010) on the efficient market hypothesis and behaviour of share prices revealed that the time series of changes in Nepse index are independent to each other. The study was based on the secondary sources and included 26 actively traded listed securities during the mid-July 2005 to mid-July 2008 among the 147 enterprises listed in Nepal Stock Exchange Limited. Autocorrelation test and runs test were used to test the random walk hypothesis and results clearly showed that random walk hypothesis does not hold good is not true for frequently traded companies and is only good for less frequently traded companies.
Previous studies have not used overall index to examine the random walk model in Nepalese stock market.The previous studies have resulted in non-occurrence of random walk hypothesis based upon stock prices of selective companies.However, overall studies made about this hypothesis to different countries proved that small economy shows mixed results.The present study uses overall Nepse index to examine the randomness of stock prices in Nepalese stock market using unit root test.
3. MethodologyTest of independence of the stock price can be carried through unit root test. A unit root test is a statistical test for the proposition that in an autoregressive
J. Amgain / B. Shrestha | SEBON Journal - V (2011) 96-108

101
statistical model of a time series, the autoregressive parameter is one. In a data series y (t), modeled by:
Yt = aYt - 1 + other term
Where α is an unknown constant, unit root test would be a test of the hypothesis that α =1, usually against the alternative that | α | is less than 1.
There are different tools for testing the stationarity of the observed data over the time period. The Augmented Dickey- Fuller Test and Phillips - Perron test for unit root test has been applied in current study.The Augmented Dickey - Fuller test (ADF) has following model
Dpt = a + bt + g pt - 1 + ... ... ... ... ... + di D pt - i + εt
Where α is a constant, β the coefficient on a time trend and i the lag order of the autoregressive process. Imposing the constraints α = 0 and β = 0 corresponds to modelling a random walk and using the constraint β = 0 corresponds to modelling a random walk with a drift. In case carries the value g <1, the variable Y is stationary. If the value of is zero the variable Y is non- stationary. Hence, the unit root null hypothesis is:
H0:g = 0 Or
Ho: Variable under study is non-stationary (Dependent over past observed values)H1: Variable under study is stationary (Independent of past observed values)
Phillips and Perron (1988) propose an alternative (non-parametric) method of controlling for serial correlation when testing for a unit root by estimating the non-augmented Dickey-Fuller test equation and modifying the test statistic so that its asymptotic distribution is unaffected by serial correlation. The PP method estimates the non-augmented DF test equation and modifies the t-ratio of the γ coefficient so that serial correlation does not affect the asymptotic distribution of the test statistic. The PP test is based on the statistic:
J. Amgain / B. Shrestha | SEBON Journal - V (2011) 96-108

102
Where is the estimate, and is the t-ratio of α, is the coefficient standard error, and s is the standard error of the test regression. In addition, is a consistent estimate of the error variance in the model (Calculated as (T-k) S2 /T). The remaining term f0 is an estimator of the residual spectrum at frequency zero.
4. Data and preliminary analysisData taken for this study is the daily stock market index of Nepal Stock Exchange from 17 July 2003 to 05 May 2011. The unit root test is applied for separate group of companies and overall Nepse index for which index is measured and published by Nepse in its annual reports and daily overall index. The sample period includes 1810 observations over the period of study for which transaction took place in Nepse market.
Figure 1 shows the chart of daily Nepseindexover the period of study. The trend of stock prices shows the fluctuating pattern during the study period. The period from 26 October 2006 to 31 August 2008 is the booming stock market during which period stock price increased from index of 400 to maximum index of 1,175.38. Stock market again fell with more or less continuous pattern to reach 339.54 on 5 May 2011.
Figure 1Nepse Index and LogNepse
0
200
400
600
800
1000
1200
250 500 750 1000 1250 1500 1750
NEPSE_INDEX
J. Amgain / B. Shrestha | SEBON Journal - V (2011) 96-108

103
5.2
5.6
6.0
6.4
6.8
7.2
250 500 750 1000 1250 1500 1750
LOGNEPSE
Summary statistics of Nepseindex are presented in figure 2.
Figure 2Summary statistics of Nepse
0
100
200
300
400
200 400 600 800 1000 1200
Series: NEPSE_INDEXSample 1 1810Observations 1810
Mean 478.4471Median 419.2900Maximum 1175.380Minimum 195.1400Std. Dev. 232.6440Skewness 0.736967Kurtosis 2.634967
Jarque-Bera 173.8903Probability 0.000000
Positive skewness shows the right tailed distribution and kurtosis of less than 3 shows the slightly flat distribution (Platykratic). The calculated Jarque-Bera statistics and corresponding p-values in table 1 are used to test the null hypotheses that the daily distribution of stock price index is normally distributed. P - values is smaller than the .01 level of significance suggesting the null hypothesis can be rejected. Therefore the stock price index series is not well approximated by the normal distribution.
5. Results and discussionThe observed data over the study period is analysed using the e-views software. The logarithm of observed Nepseindexare taken as variable for analysis. The
J. Amgain / B. Shrestha | SEBON Journal - V (2011) 96-108

104
unit root tests were carried out in the E-views software using Augmented Dickey Fuller (ADF) and Phillips-Perron (PP) unit root test model. The result of the outcome is presented and analysed below.
The result of ADF test on Logarithm of Nepseindex at the levelin the presence of constant, constant and linear trend and without taking any constant and linear trend is given in table 1. The test gives the acceptance or rejection of hypothesis of non-stationary (dependence) of the logarithm of Nepseindex over the period of study based upon the observed t-statistics and its corresponding p-values.
The observed p-values of the test show that null hypothesis cannot be rejected at 1 percent, 5 percent and even at 50 percent significance level. Hence, null hypothesis of non-stationarity cannot be rejected at the level. Logarithm of Nepse Index is dependent over the study period.
Table 1ADF test result on logarithm of Nepse index at the level variable:
logarithm of Nepse indexThe table1 shows the t-statistics obtained from the Augmented Dickey Fuller and Phillips- Perron unit root test. The symbol ‘none’ in the table implies that the regression line contains no intercepts term and whose corresponding t-statistics is the coefficient of exogenous variable. ‘Constant’ means the regression line is fitted with intercept term. The ‘constant and linear trend’ means the regression line is fitted with intercept and time trend. P- values provide the probability of obtaining a value of the test statistics as much as or greater than that obtained. In another word, P-value is the lowest significance level at which a null hypothesis can be rejected. The Logarithm of Nepse index is taken to minimize the variation. Stationary implies the independence of the variable.
Exogenous variable t-statistics Critical value
1 percentCritical value
5 percentp -
values Inference
None 0.714979 -2.566242 -1.940999 0.8694 Do not reject null hypothesis
Constant -1.457775 -3.433767 -2.862936 0.5550 Do not reject null hypothesis
Constant and linear trend 0.623091 -3.963129 -3.412297 0.9996 Do not reject
null hypothesis
The result of PP unit roottest on Logarithm of Nepseindex at the levelis presented in table 2.
J. Amgain / B. Shrestha | SEBON Journal - V (2011) 96-108

105
Table 2PP unit root test result on logarithm of Nepse index at the levelvariable:
logarithm of Nepse indexThe table 2 shows the t-statics obtained from the Augmented Dickey Fuller and Phillips- Perron unit root test. The symbol ‘none’ in the table implies that the regression line contains no intercept term and whose corresponding t-statistics is the coefficient of exogenous variable. ‘Constant’ means the regression line is fitted with intercept term. The ‘constant and linear trend’ means the regression line is fitted with intercept and time trend. P- values provide the probability of obtaining a value of the test statistics as much as or greater than that obtained. In another word, P-value is the lowest significance level at which a null hypothesis can be rejected. The Logarithm of Nepse index is taken to minimize the variation. Stationary implies the independence of the variable.
Exogenous variable t - statistics
Critical value
1 percent
Critical value
5 percentp -
values Inference
None 0.684304 -2.566242 -1.940999 0.8634 Do not reject null hypothesis
Constant -1.439099 -3.433767 -2.862936 0.5644 Do not reject null hypothesis
Constant and linear trend 0.660418 -3.963129 -3.412297 0.9996 Do not reject null
hypothesis
The PP test results also favors the result of ADF test. And hence, the null hypothesis of non stationarity of logarithm of Nepse index cannot be rejected at 1 percent and 5 percent level of significance. Hence the Nepse index are dependent over time.
Table 3ADF unit root test result on logarithm of Nepse index at first difference
level variable: first difference of logarithm of Nepse indexThe table 3 shows the t-statics obtained from the Augmented Dickey Fuller and Phillips- Perron unit root test. The symbol ‘none’ in the table implies that the regression line contains no intercepts term and whose corresponding t-statistics is the coefficient of exogenous variable. ‘Constant’ means the regression line is fitted with intercept term. The ‘constant and linear trend’ means the regression line is fitted with intercept and time trend. P- values provide the probability of obtaining a value of the test statistics as much as or greater than that obtained. In another word, P-value is the lowest significance level at which a null hypothesis can be rejected. The Logarithm of Nepse index is taken to minimize the variation. Stationary implies the independence of the variable.
J. Amgain / B. Shrestha | SEBON Journal - V (2011) 96-108

106
Exogenous variable t - statistics Critical value
1 percentCritical value
5 percentp - values Inference
None -26.47744 -2.566242 -1.940999 0.0000 Reject null hypothesis
Constant -26.48837 -3.433767 -2.862936 0.0000 Reject null hypothesis
Constant and linear trend -26.67706 -3.963129 -3.412297 0.0000 Reject null
hypothesis
Next test is carried out in difference of logarithm of Nepse index variable using ADF and PP unit root test model. The result of ADF test on logarithm of Nepseindex over the study period conducted at the First Difference level in the presence of constant, constant and linear trend and without taking any constant and linear is given in table 3.
Test result is significant at 5 percent and 1 percent level of significance as suggested by p-values less than 0.05 and 0.01. Null hypothesis of non-stationarity can be rejected. Hence, the logarithm of Nepseindex is stationary at the first difference level. This implies the independence of changes in logarithm of Nepseindex over the period of study.Table 4 shows the results of PP test at the first difference level of logarithm of Nepseindex.
Table 4PP unit root test result on logarithm of Nepse index at first difference
level variable: first difference of logarithm of Nepse indexThe table 4 shows the t-statics obtained from the Augmented Dickey Fuller and Phillips- Perron unit root test. The symbol ‘none’ in the table implies that the regression line contains no intercept term and whose corresponding t-statistics is the coefficient of exogenous variable. ‘Constant’ means the regression line is fitted with intercept term. The ‘constant and linear trend’ means the regression line is fitted with intercept and time trend. P- values provide the probability of obtaining a value of the test statistics as much as or greater than that obtained. In other words, P-value is the lowest significance level at which a null hypothesis can be rejected. The Logarithm of Nepse index is taken to minimize the variation. Stationary implies the independence of the variable.
Exogenous variable t - statistics
Critical value
1 percent
Critical value
5 percentp - values Inference
None -29.96110 -2.566242 -1.940999 0.0000 Reject null hypothesis
Constant -29.96507 -3.433767 -2.862936 0.0000 Reject null hypothesis
Trend and intercept -30.06637 -3.963129 -3.412297 0.0000 Reject null
hypothesis
J. Amgain / B. Shrestha | SEBON Journal - V (2011) 96-108

107
The observed p-values of PP unit root test on logarithm of Nepse index at first difference level also gives the highly significant result for rejecting null hypothesis of non-stationarity of the logarithm of Nepse index at first difference level. Null hypothesis of non-stationarity of the variable can be rejected at 5 percent and 1 percent level of significance. The changes in the stock prices are inde pendent over the period of time. Both the tests applied on Logarithm of Nepse index give the same result. Logarithm of Nepse index isnon-stationary or dependent at level and stationary or independent at first level. Hence, the observed result support the weak form of efficient market hypothesis. The changes in stock market prices are independent and future change cannot be predicted from past observed values. Overall, random walk is observed in Nepalese stock market.
6. ConclusionThis paper analyses the pricing behaviour in Nepalese stock market by applying Augmented Dickey Fuller and Philip-Perron unit root test model. The result revealed that observed Nepse index over the period of study is not stationary at the level and stationary at the first difference level, which supports the independence of changes in stock market index as suggested by weak form of stock market efficiency. In Nepalese stock market, past movement in stock prices cannot be used to predict their future changes and investors cannot devise various trading rules or techniques to make abnormal returns from transactions.
ReferencesAbrahm, A., J. Fazal, and A. Sulaiman, 2002, Testing the random walk behaviour and efficiency
of the Gulf stock markets, The Financial Review 37, 3, 469-480.Alam, M. I., T.Hasan, and P-R.Kadapakkam, 1999, An application of variance ratio test of five
Asian stock markets, Review of Pacific Basin Financial Markets and Policies 2, 3, 301-315.Ball, R., 1994, The development, accomplishments and limitations of the theory of stock market
efficiency, Managerial Finance 20, 2, 3-48. Bhatta, Gopal Prasad, 2010, Does Nepalese stock market follow random walk? SEBON Journal,
4, 18-58.Bundoo, S. K., 2000, The Mauritius stock exchange: An assessment,Social Sciences and Humanities
and Law and Management Research Journal, 3, 67-80. Campbell, J. Y., A. W. Lo,and A. C. MacKinlay, 1997, The Econometrics of Financial Markets.
Second Edition. Princeton: Princeton University Press. Chang, T., W. Fang, C.Fawson,, and T.F. Glover, 1996, The weak-form efficiency of the Taiwan
share market, Applied Economics Letters, 3, 663-667.
J. Amgain / B. Shrestha | SEBON Journal - V (2011) 96-108

108
Dahel, R., and B. Labaas, 1999, The behavior of stock prices in the GCC markets, Working Paper No. 9917, Economic Research Forum.
Dickinson, J. P., and Muragu, K.,1994, Market efficiency In developing countries: A case study of the Nairobi stock exchange, Journal of Business Finance and Accounting 21, 1, 133-150.
Errunza, V. R., and E. Losq, 1985, The behavior of stock prices on LCD markets. Journal of Banking and Finance 9, 4, 561-575.
Fama, E. F., 1965, The behavior of stock-market prices, Journal of Business 38, 1, 34-105. _____, 1970, Efficient capital markets: A review of theory and empirical work, Journal of
Finance 25, 2, 383-417.Gilmore, C. G. and G.M. McManus, 2003, Random-walk and efficiency tests of central European
equity markets, Managerial Finance 29, 4, 42-61. Jefferis, K., and G. Smith, 2005, The changing efficiency of African stock markets, South African
Journal of Economics, 73, 54-67. Kim, J. H., and A. Shamsuddin, 2008, Are Asian stock markets efficient? Evidence from new
multiple variance ratio tests, Journal of Empirical Finance, 15, 518-532. Magnusson, M. A., and B. Wydick, 2002, How efficient are Africa’s emerging stock markets? The
Journal of Development Studies 38, 4, 141-156. Mlambo, C., and N. Biekpe, 2005, Thin trading on African stock markets: Implications for
market efficiency testing, Investment Analysts Journal, 61, 29-40. Mobarek, A., and K. Keasey, 2002, Weak-form market efficiency of an emerging market: Evidence
from Dhaka stock market of Bangladesh, Paper presented at the ENBS conference held in Oslo,
May 2000, Available at: http://e-m-h.org/MoKe00.pdf.Oskooe, S.P., H. Li, and A. Shamsavari, 2010, The random walk hypothesis in emerging stock
market, International Research Journal of Finance and Economics,50,14-22.Pradhan, Radhe S. and B.D. Upadhyay, 2006, The efficient market hypothesis and the behaviour of
share prices in Nepal, Available at SSRN: http://ssrn.com._____, and Sarswati K.C., 2010, Efficient market hypothesis and behaviour of share prices: The
Nepalese evidence, SEBON Journal, 4, 104-117.Joshi, N. and FattaBahadur K.C., 2005, The Nepalese stock market: efficiency and calendar
anomalies, MPRA, Available at: http//mpra.ub.uni-muenchen.de/26999/.Vitali,F. and S. Mollah, 2010, Stock market efficiency in Africa: Evidence from random walk
hypothesis, Journal of Banking and Finance, 19,1-32.Uddin, G.S and N. Khoda, 2009, An empirical examination of random walk hypothesis for Dhaka
stock exchange: Evidence from pharmaceutical sector of Bangladesh, International Research Journal of Finance and Economics, 33, 87-100.
J. Amgain / B. Shrestha | SEBON Journal - V (2011) 96-108