employee recognition and performance - a field … reciprocity of employees, and conformity...
TRANSCRIPT
Employee Recognition and Performance -A Field Experiment
Christiane Bradler∗, Robert Dur†, Susanne Neckermann‡, Arjan Non§
Preliminary draft, October 2011
Abstract
Recognition for a job well done is commonly considered as an important management tool
for motivating employees. Existing empirical studies show strong positive correlations
between the provision of recognition and employee performance, but often fail to establish
causality. This paper contributes to filling this gap by conducting a field experiment in
a natural working environment. We hired more than 400 students for a three-hour job.
Participants worked individually on a data entry task in groups of eight. We randomized
the unannounced provision of recognition (in the form of handing out a thank-you card)
after two hours of work. We find that the provision of recognition to all workers in a group
increases subsequent performance only weakly. In contrast, scarce recognition that is only
provided to the best performers in a group raises subsequent perfomance substantially.
Remarkably, workers who did not receive recognition are responsible for this performance
increase. These results are consistent with workers having preferences for conformity
and being reciprocal at the same time. All effects vanish completely when the reward is
announced.
JEL Classification: C93, M52Key words: employee motivation, recognition, reciprocity, conformity, field experiment
∗ZEW Centre for European Economic Research Mannheim†Erasmus University Rotterdam‡ZEW Centre for European Economic Research and University of Mannheim§University of Maastricht
1

1 Introduction
Recent years have seen a surge in popular business books on the importance of recognition foremployee motivation. A prominent book in this field is Bob Nelson’s 1001 Ways to Reward
Employees. He starts his book by stating that a number of surveys “confirm what almost everyemployee already knows: that recognition for a job well done is the top motivator of employeeperformance.”1 Other questionnaire studies reveal similar views among practitioners, see amongothers Kovach (1995) and Wiley (1997).
The academic literature provides surprisingly little sound evidence for the effects of employeerecognition on work performance. Most existing studies rely on correlations between theprovision of recognition and employee performance (e.g. Rhoades and Eisenberger 2002,Cropanzano and Mitchell 2005, and Wagner and Harter, 2006). However, as these studiesrecognize, correlation does not prove causation. For instance, and quite naturally, goodperformance also causes recognition, making it difficult to detect a possible causal effect ofrecognition on performance using observational data.
(Quasi-)experimental studies improve on this by exploiting random variation in the type and/oramount of recognition provided to employees (Neckermann et al., 2010). Experimental studiesare very scarce, though, particularly those conducted in a natural work environment and with areasonable sample size.2
This paper contributes to fill this important gap in the literature by conducting a large-scale fieldexperiment in a natural working environment. Over the course of November 2010 to May 2011,we hired more than 400 people (mainly students) for a three-hour data entry job. We created awork environment where eight workers shared the same room, but worked individually. Workerswere paid a flat wage of 25 Euro and were not aware that they took part in an experiment. Arandom sample of workers received recognition after two hours of work. Recognition consistedof a thank-you card, personally signed by the head of the research institute and handed out by aresearch assistant. Thus, provision of recognition did not involve any material reward but clearlyshowed the management’s appreciation for workers’ effort. Importantly (and most naturally),
1 He continues with “yet most managers do not understand or use the potential power of recognition and rewards[...] while money is important to employees, research shows that what motivates them really to perform [...] is thethoughtful, personal kind of recognition that signifies true appreciation for a job well done.”
2 An early lab experiment is by Deci (1971), who showed that provision of praise increases students’ willingnessto work on a puzzle. Stajkovic and Luthans (2003) give an overview of field-experimental studies on the effectof social recognition on employees’ performance. These studies typically randomize over a handful of plantsand do not correct standard errors for clustering at the plant level. Other field studies have experimentallyexamined the effects of recognition on employee absenteeism (Markham et al., 2002) and on parents’ willingnessto volunteer for their kids’ soccer club (Fisher and Ackerman, 1998). Most recently, Neckermann et al. (2010)analyze firm-level data to compare the behavior of employees receiving an award with observationally similaremployees not receiving an award. They find that award recipients significantly increase performance as comparedto non-recipients.
1

in most of the treatments possible provision of recognition was not announced at the start of thethree-hour working period. Moreover, from the way the thank-you card was presented, workerscould deduct that no further recognition would be provided in the remainder of the workingperiod.
A key feature of our experiment is that we vary the scarcity of recognition over differenttreatments. In one treatment, all workers in a work group receive the thank-you card. In othertreatments, the thank-you card is given only to the best performer or to the best three performersof a work group, and this is publicly announced when handing out the thank-you cards.
Our main focus is on how the provision of the thank-you card affects subsequent performanceof workers. We argue that three behavioral mechanisms may be operational: signaling by theemployer, reciprocity of employees, and conformity preferences of employees. As we shallsee, our results are consistent with employees having preferences for conformity and beingreciprocal at the same time.
The paper proceeds as follows. In the next section, we draw on existing behavioral theoriesto develop hypotheses on the effects of different forms of recognition. Next, we describe theexperimental set-up in detail in Section 3. Section 4 lays out the empirical strategy and presentsthe results of our experiments. Section 5 concludes.
2 Theory
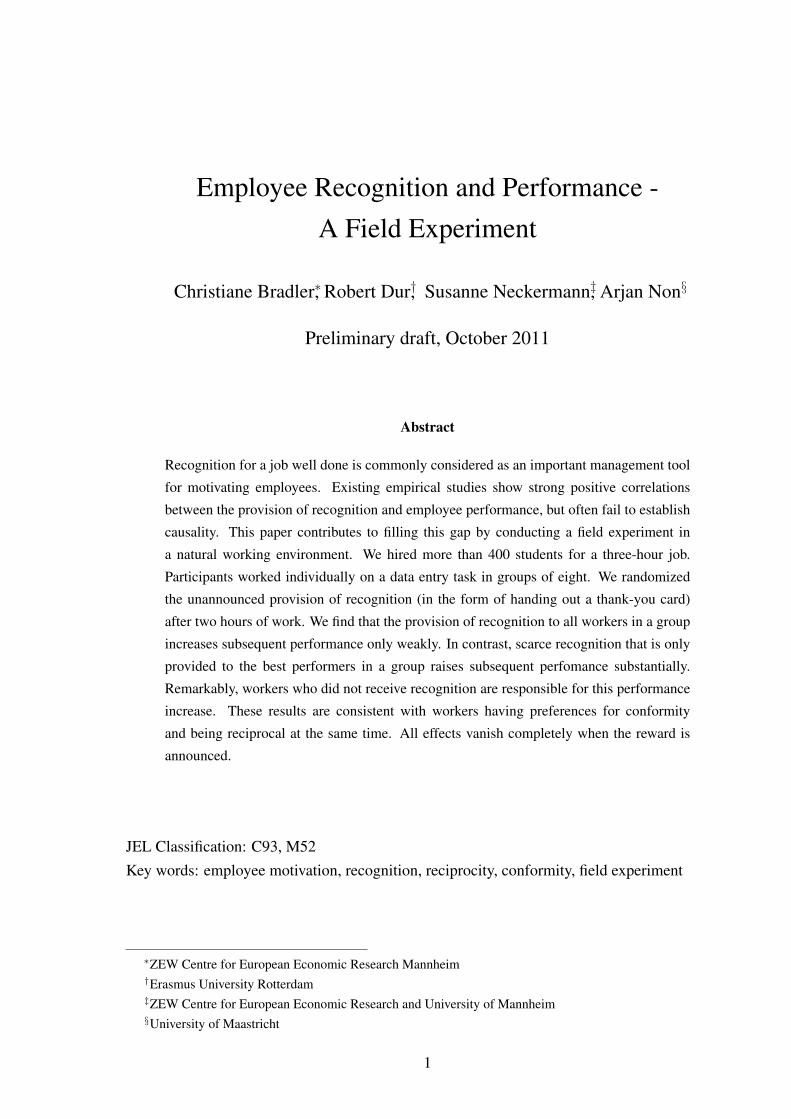
Why might the provision of a thank-you-card that was not announced affect subsequent effortof workers? And does it matter whether all workers or only the best performing workers ina session receive a thank-you card? We can think of three plausible behavioral mechanismsthrough which a thank-you card may affect subsequent effort.
First, workers may consider the thank-you card as a gift from the employer and feel inclinedto reciprocate. A natural way to reciprocate is to increase effort in the remainder of thesession. Following the seminal paper by Akerlof (1982) and the influential experimentalwork by Fehr et al. (1993), reciprocity has become a firmly established concept in economics.Most studies in economics have focused on wages as the employer’s means of exchange inreciprocal relationships with workers. An exception is Kube et al. (2011) who show thatnon-pecuniary gifts increase subsequent work effort. Other social sciences have also consideredsocio-emotional gifts that address “social and esteem needs (and are often symbolic andparticularistic)”(Cropanzano and Mitchell, 2005, p. 881). The thank-you card which is centralto our treatments, clearly falls into this latter category. In treatments where only a subset ofworkers receive a thank-you card, we only expect recipients to respond. Moreover, scarcitymay affect the perceived value of the card, implying a stronger response of recipients when the
2
number of recipients decreases.
A second reason for why the thank-you card may affect effort is that the card provides a signalto the workers about the employer’s type. For instance, the thank-you card may signal theemployer’s kindness or care for the workers, which may in turn make workers care more forthe employer and hence increase their effort (Levine, 1998; Dur, 2009). Alternatively, thethank you card may affect workers’ beliefs about how important their effort is to the employer.According to these signaling theories, the thank-you card should affect effort of recipients andnon-recipients identically as all workers receive the signal (the cards are handed out in public).However, the strength of the response may differ between treatments. In particular, providingjust a single card may be seen as a weaker signal of kindness or care for output than providingall workers with a thank-you card.
Third and last, in the treatments where only the best-performing workers receive a thank-youcard, preferences for conformity may give rise to behavioral responses. Recipients in thesetreatments learn that their performance belongs to the top within their group. Likewise,non-recipients learn that they belong to the lower ends of the performance distribution. Ifworkers have a preference for conformity (as in Bernheim, 1994, and Sliwka, 2007) , we expectnon-recipients to increase effort while recipients reduce effort. The effect on non-recipientsshould be less pronounced when the thank-you card is provided to very few workers, as lessinformation is provided about one’s standing. Thus, we expect smaller effects for non-recipientsin the treatment where only a single thank-you-card is provided as compared to the treatmentwhere the three best-performing workers receive a thank-you card. Conversely, recipients ofthe card should respond more strongly when fewer thank-you cards are provided. Lastly,conformity preferences predict no treatment effect in the treatment where all workers areprovided with a thank-you card, as no information about one’s relative performance is revealed.3
Table 1 summarizes our theoretical predictions.
3 The effect of relative performance feedback on performance has recently been studied in a variety of contexts,ranging from student test scores (Bandiera and Larcinese, 2009; Azmat and Iriberri, 2010; Tran and Zeckhauser,2011), contributions to an online community (Chen et al., 2010), real-effort in the lab (Charness et al., 2010;Freeman and Gelber, 2010; Kuhnen and Tymula, 2011), to workers’ performance in a real working environment(Falk, 2006; Delfgaauw, 2009; Blanes i Vidal, 2011; Barankay, 2011a, 2011b) . With the noteworthy exceptionof Barankay (2011a,2011b) , all of these papers find that relative performance feedback has on average a positiveeffect on performance. A subset of these papers also look at where in the performance distribution people are mostresponsive to feedback; results tend to be mixed in this respect.
3
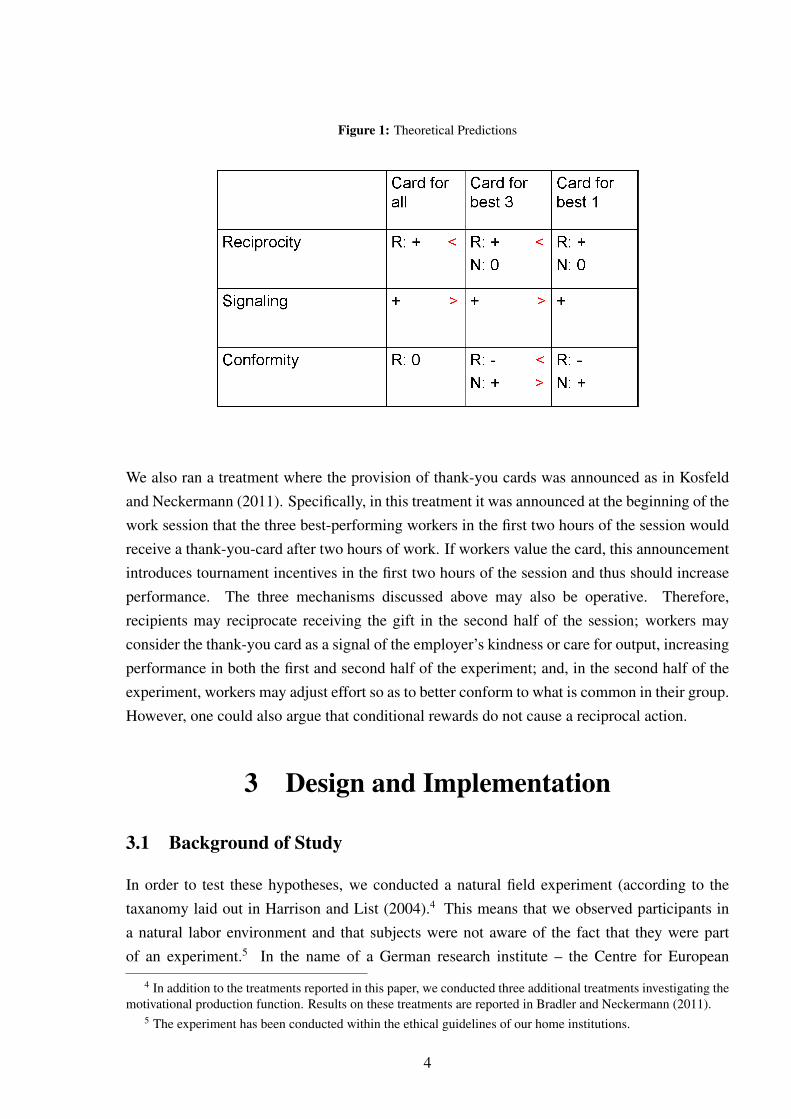
Figure 1: Theoretical Predictions
We also ran a treatment where the provision of thank-you cards was announced as in Kosfeldand Neckermann (2011). Specifically, in this treatment it was announced at the beginning of thework session that the three best-performing workers in the first two hours of the session wouldreceive a thank-you-card after two hours of work. If workers value the card, this announcementintroduces tournament incentives in the first two hours of the session and thus should increaseperformance. The three mechanisms discussed above may also be operative. Therefore,recipients may reciprocate receiving the gift in the second half of the session; workers mayconsider the thank-you card as a signal of the employer’s kindness or care for output, increasingperformance in both the first and second half of the experiment; and, in the second half of theexperiment, workers may adjust effort so as to better conform to what is common in their group.However, one could also argue that conditional rewards do not cause a reciprocal action.
3 Design and Implementation
3.1 Background of Study
In order to test these hypotheses, we conducted a natural field experiment (according to thetaxanomy laid out in Harrison and List (2004).4 This means that we observed participants ina natural labor environment and that subjects were not aware of the fact that they were partof an experiment.5 In the name of a German research institute – the Centre for European
4 In addition to the treatments reported in this paper, we conducted three additional treatments investigating themotivational production function. Results on these treatments are reported in Bradler and Neckermann (2011).
5 The experiment has been conducted within the ethical guidelines of our home institutions.
4
Economic Research (ZEW) – we hired students for a one-time data entry job between November2010 and May 2011. The institute had just received several hundreds of surveys that couldnot be processed automatically, which made manual entry into a database necessary. Forthis job, we hired students from different universities in and around Mannheim via studentjob centers, flyers, and notes on bulletin boards. The announcement informed subjects thatthe research center needed short-term student helpers for a three-hour data entry job and thatsubjects would earn 25 Euro fixed wage in total.6. Students could sign up for the job onlineand were subsequently contacted via phone to arrange date and time. We minimized reputationconcerns as much as possible by informing participants that the job was one-time, a secondparticipation was not possible due to taxed-based reasons7, and that no permanently employedresearch assistants were needed at the moment for either this or other projects. We invitedsubjects in groups of eight. Sessions took place in the morning, at noon, and in the afternoon.8
We implemented recognition by handing out thank-you cards (see Figure 2 in the Appendix) tosubjects. Depending on the treatment, these thank-you cards were either announced or came asa suprise after two hours of work; they were given to all participants or only to the best three orthe best one in the work session.
3.2 Implementation
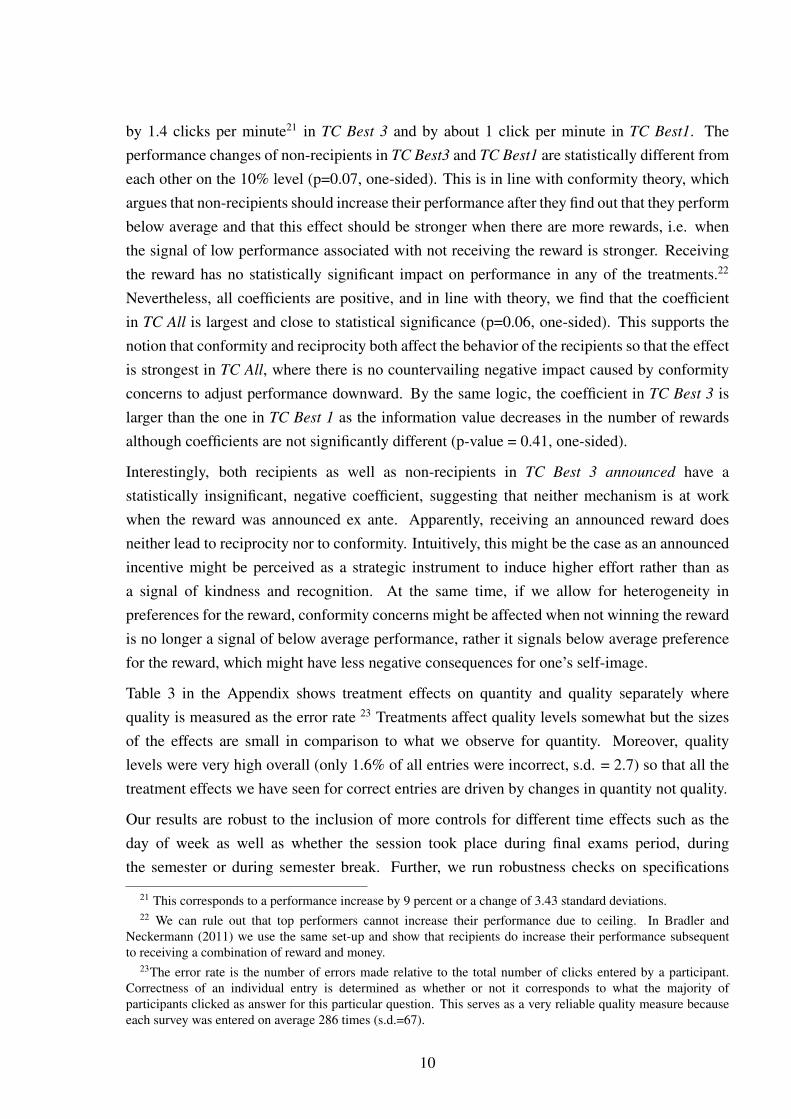
Upon arrival, participants were seated in front of a workstation. The workspaces werearranged in a U-shape and with sufficient space between individuals to ensure that subjectsfelt unobserved. Then, all formalities (privacy policy, wage agreement) were taken care of andthe 25 Euro were paid in advance. This conveyed the fact that payment was made independentof the following work performance. Subsequently, the participants received a short introductionto their employer (ZEW) and to the project the questionnaires were to be filled for. Thequestionnaires were part of an evaluation project in the educational context and involved surveysfrom several hundred students on their school and career preferences. Additionally, a shortbriefing was given on how to file the answers from the questionnaires into the database. Thedata were filed via a web interface; hence, access to the internet was visible and possible atany time. The interface was set up like an online version of the surveys that the participantshad in front of them in paper format.9 On the screen subjects needed to transfer the answers
6The fixed wage was chosen according to hourly wage rates of student research assistants7In case of a second participation, partcipants would exceed the threshold of earnings beyond which tax-based
informations needs to be collected. This would cause substantial administrative expenses for fiscal reporting8 The field experiment was carried out in two locations, at the Centre of Economic Research in Mannheim and
at the Ruprecht-Karls University of Heidelberg. In the regressions we control for time of day as well as for day ofweek and for location effects, but these do not affect the results. All sessions were conducted by the same researchassistant.
9 For screen exemplary see Figure 3 in the Appendix.
5

the participants of the questionnaire study had marked in each of the multiple choice questions.For a few questions information from free text fields of the survey had to be entered. Thiswas among others one main reason why the decision was made to enter surveys by hand. Thequestionnaires were stacked in a high, non-transparent box in front of the participants, with asecond identical box next to it to deposit the completed ones. This prevented the participantsfrom comparing their work with each other. The research assistant then left the room, informingparticipants that she was working outside and was available for queries at any time and thatsubjects could take breaks whenever necessary. These measures (individual breaks, paymentin advance, internet access, absence of supervisor) were taken to give participants substantialleeway in how much time they spend on filling the questionnaires. Furthermore, a collectivebreak was avoided to minimize possible group effects and communication between participants.The task was exhausting and monotonous, and we do not assume that there was much intrinsicmotivation involved in completing the task. In fact, participants commented that the filling wasvery monotonous and boring.
Eight participants were assigned to each working session. However, the average number ofparticipants per session was 7.15 (s.d. = 0.89) due to participants who were invited but did notshow up.10 The timeline was as follows: the introduction lasted for about 20 minutes on average.Then, subjects worked on the task for roughly 100 minutes.11 We refer to this first phase asworking period 1. Subsequent to working period 1 (i.e. two hours after participants’ officialstart of work), the research assistant entered the room and told subjects that the IT-departmentof the institute had just confirmed that the data was submitted correctly from each computer tothe central data base.12 As part of this interruption, the intervention depending on the treatmentfollowed. Subsequently, subjects worked for approximately one additional hour – which werefer to as working period 2.13 Working period 1 was longer than working period 2 to allow forvariation in introductory period and for learning. After the second working period, feedbackforms were handed out, which asked for improvement suggestions and comments on how wehandled the short-term employment.
10 Detailed statistics on the number of participants per session and treatment can be found in Table 1 in theAppendix.
11 The standard deviation of the introductory period is 5 minutes (Min. = 9.25 min, Max. = 26.3). Differencesin length are due to delays in arrivals of participants or different amount of questions which were raised duringthe introduction. The standard deviation of the duration of working period 1 is 6.4 min (Min. = 85.7 and Max. =115.3). Differences in the length of working periods are due to delays in the introduction period.
12 We chose this wording to ensure that in control as well as in the treatment sessions, subjects were aware of thefact that we could link data entered to the respective work station. This way, the perceived degree of monitoringwas held constant across sessions as much as possible.
13 The mean of working period 2 is 52,8 min with a standard deviation of 3.75 min (Min.: 40 and Max.: 55). Weaccount for differences in the length of working periods in the statistical analysis by using productivity per minuteof working time as the dependent variable.
6

3.3 Treatments
We implemented the following five treatments in the study. The different scripts can be found inthe Appendix. In all treatments including the control treatment, the research assistant informedsubjects that the data were transmitted correctly from all computers to our central server andtold them that everything worked as planned. Nothing else happened in the Control group sothat we can measure the development of productivity without rewards (learning, fatigue).
In treatments involving thank-you cards, she continued that the research team together with thepresident of the institute had created thank-you cards for all participants of the data entry job asa symbol for the institute’s thankfulness and appreciation of the participants’ support in enteringthe data. Therefore, the head of the institute, president Professor Franz, had personally signedeach card. This allowed us to give a signal of appreciation, which is as salient as possiblein such a short-time employment. In the treatment “Thank-you card for all”(TC All), theresearch assistant then handed a card to each participant. This treatment allows us to measurethe response to a general appreciation and recognition. In the treatment “Thank-you card forthe best 3”(TC Best3) subjects were informed that the research assistant only had three cardsavailable and spontaneously decided to hand these out to those three persons who had performedbest up until then.14
The scarcity of cards was explained by the fact that the president had not had enough time to signa card for each participant of this short-term employment. This also ensured that participants didnot expect additional cards at the very end of the employment period. As there were fewer thaneight students in some sessions, we adjusted the number of cards in accordance to the actualgroup size to keep the percentage of rewarded subjects comparable.15 TC Best3 adds scarcityand, hence, status and feedback to general recognition. The treatment “Thank-you card for thebest 1”(TC Best1) was identical to TC Best3 apart from the fact that there was only one recipientof a thank-you card. Finally, in the treatment “Thank-you card for the best 3 announced”(TC
Best3 announced), we announced at the beginning of working period 1 that thank-you cardswould be handed out later on for the three participants who would have performed best upto this point of time. Subjects were informed that rewards would be handed out during anIT check after roughly two hours. We showed the card to the subjects in advance to ensurecommon knowledge about what the card looked like and to ensure that subjects understood thatthere was no material value to the reward. This treatment checks for incentive effects and for
14 We measured performance in terms of the number of finished questionnaires in the first working period.Subjects were told that IT provided logins to the research assistant of the three persons that had performed best.The wording was chosen in order to convey the notion that the research assistant could not perfectly monitoreveryone’s performance.
15 For a group size of 7-8 persons we assigned three TCs, and for a group size of 5-6 persons we assigned twoTCs. Obviously, the percentage of rewarded subjects is not kept constant by this variation. We control for groupsize in all regressions but this does not affect the results.
7
whether ex-post effects depend on the rewards being announced or spontaneous.16
4 Results
We regress the productivity in working period 2 on the treatment dummies and different controlvariables for baseline productivity in working period 1, demographics such as gender and fieldof study, time of day, and groupsize. The sample contains 414 observations, 81 in control,87 in TC All, 95 in TC Best3, 69 in TC Best3 announced and 82 in TC Best1. 17 Table 1reports the sample means by treatment group for pre-treatment characteristics and for baselineachievement in our sample. The table reports differences between treatment and control groupmeans. There are no statistically significant differences in baseline performance and only afew statistically significant differences in other variables. A higher proportion of TC Best3, TC
Best3 and TC Best1 were conducted in Mannheim due to a insufficient amount of applicantsin Heidelberg. More sessions of TC All and TC Best1 than of Control were conducted in theafternoon. There are some weakly significant effects for Best1 with respect to the frequency ofecon majors and sessions conducted in the morning. As shown below, including controls forpre-treatment characteristics as well as baseline performance does not alter the results.
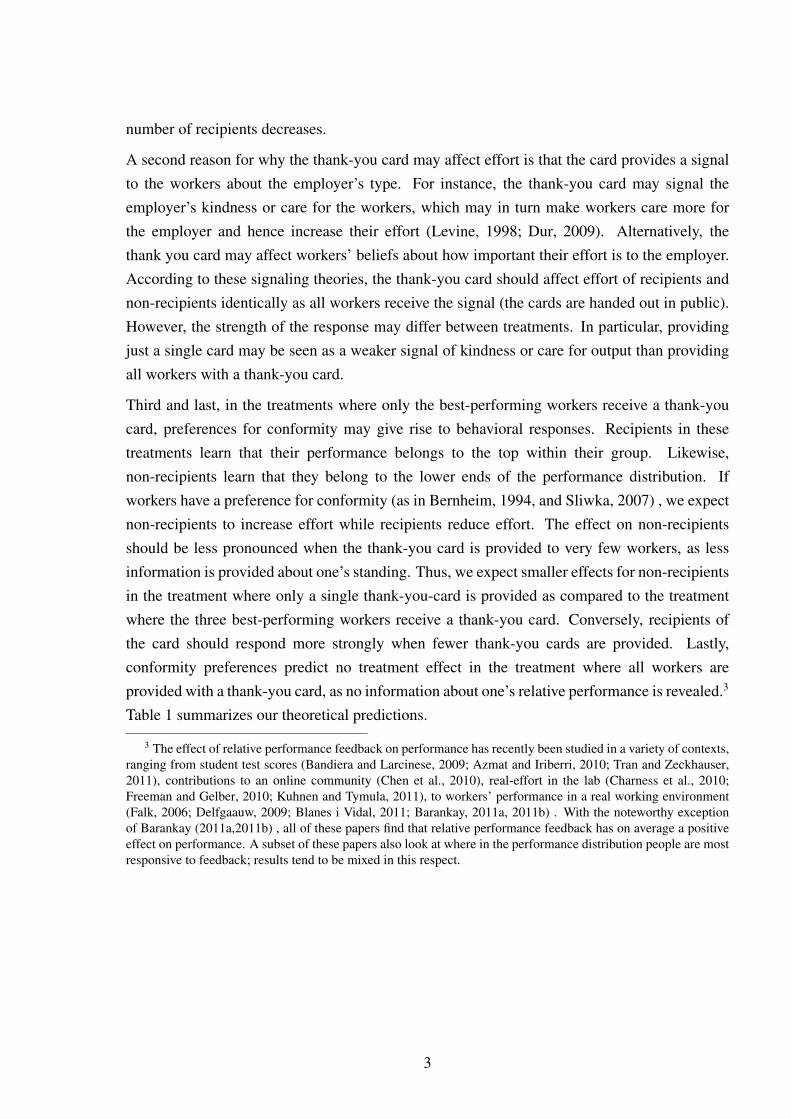
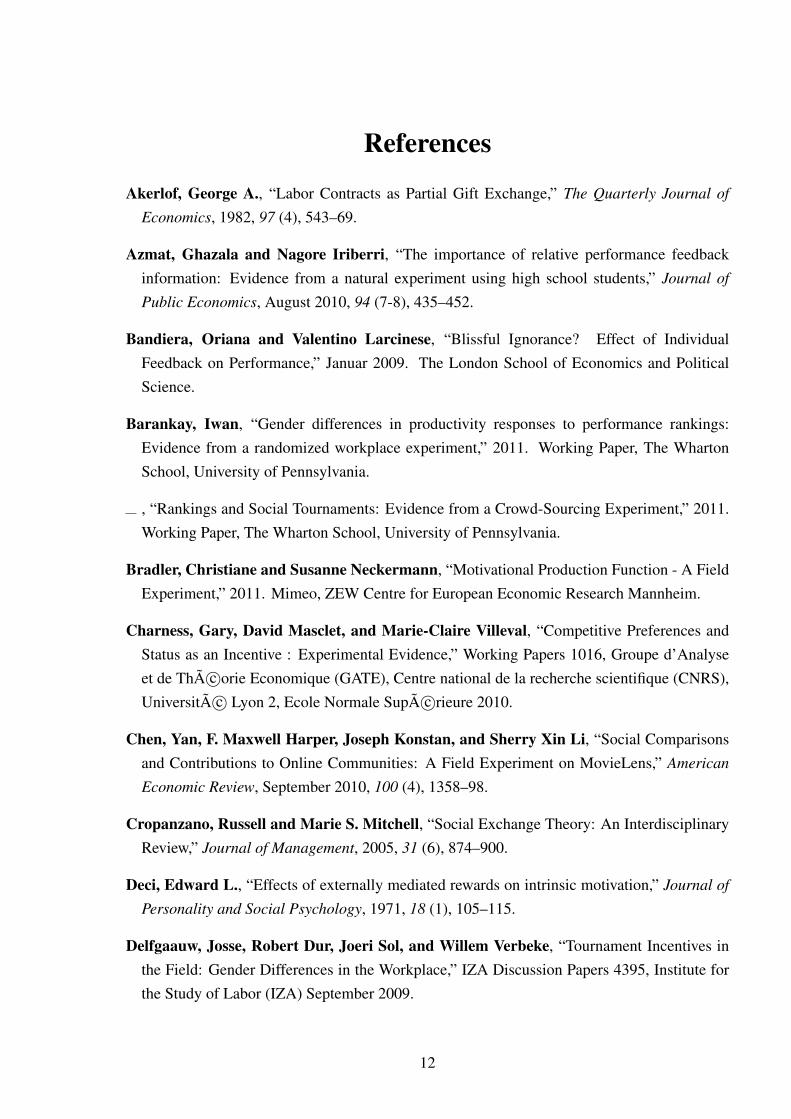
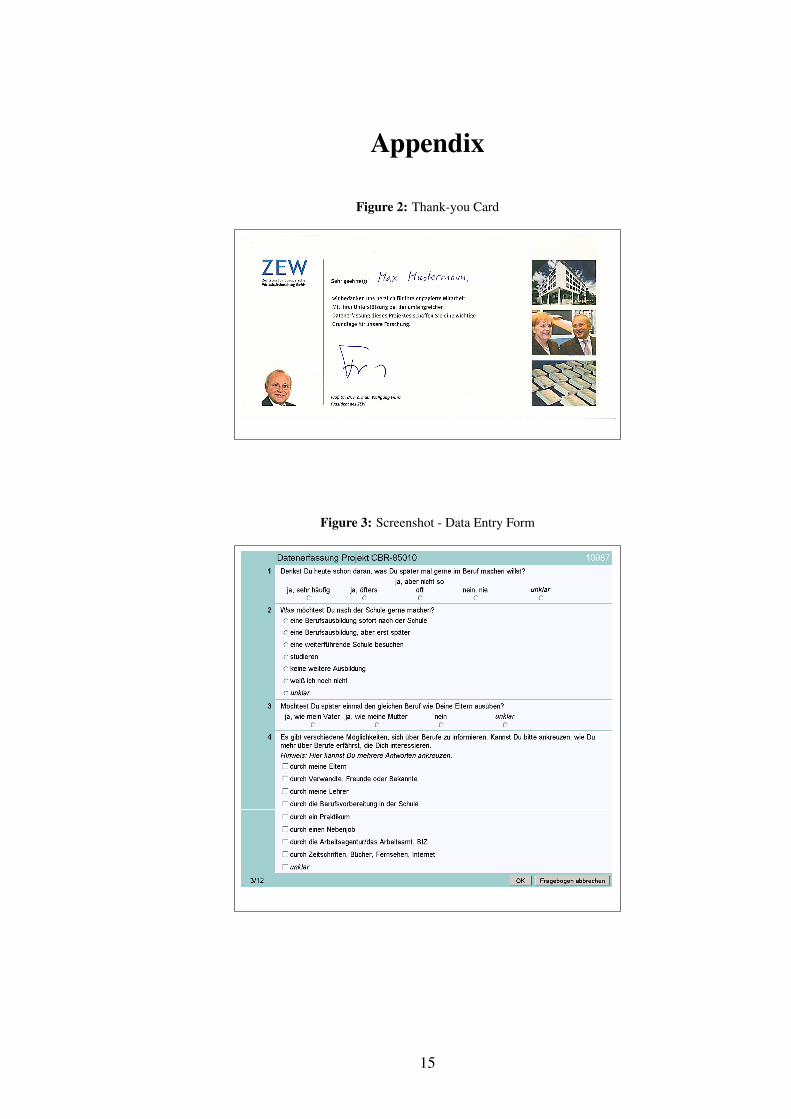
Figures 4 and 5 display the average improvement in performance between working periods1 and 2. Performance refers to the number of correct clicks entered per minute. Figure4 displays the main treatment effects. The Control group shows almost no difference inperformance in the second period compared to the first. After an announced reward is assignedin TC Best3 announced, participants slack off. In contrast, all treatments with recognitionshow positive performance increases. In particular, when the reward is scarce, as is the casein TC Best3 and TC Best1, participants improve strongly. TC Best3 yields the strongestperformance improvement. Figure 5 splits the sample up into recipients and non-recipients.Recipients of a thank-you card increase performance by half a click per minute in all treatmentswhere the reward came as a surprise. Recipients in the announced treatment show lowerperformance in comparison to Control. Non-recipients of unannounced rewards also increasetheir performance. This increase is substantially larger than that of recipients and is the largestwhen the number of non-recipients is relatively small. Interestingly, the announced reward doesnot cause a performance increase. Taken together, the graphs suggest that an unannounced
16 Even though we do not think that this is likely, we cannot rule out that word spread and that participants in latersessions expected certain interventions. Therefore, the more salient treatments (TC Best3, TC Best3 announced,TC Best1) were conducted subsequent to the less salient treatments (Control, TC All) to make sure that we onlypositively surprised but not disappointed subjects with the intervention they received.
17 In total, 430 persons participated. Three sessions (two of Control and one of TC All had to be droppedfrom the analysis due to severe server breakdowns during working time. Moreover, two participants had to beexcluded from the analysis; one participant was visually impaired, and an older participant was not able to work ata computer.
8

reward has positive effects on both recipients as well as non-recipients. Interestingly, the effectis larger for non-recipients than for recipients and larger when there are relatively many rewards.Moreover, all effects vanish and even reverse when the card is announced.
For our main analysis, we use productivity measured as the number of correct entries per minuteof worktime as the dependent variable. Specifically, we use correct entries as the outcome ofinterest since this is the variable the employer was most interested in.18
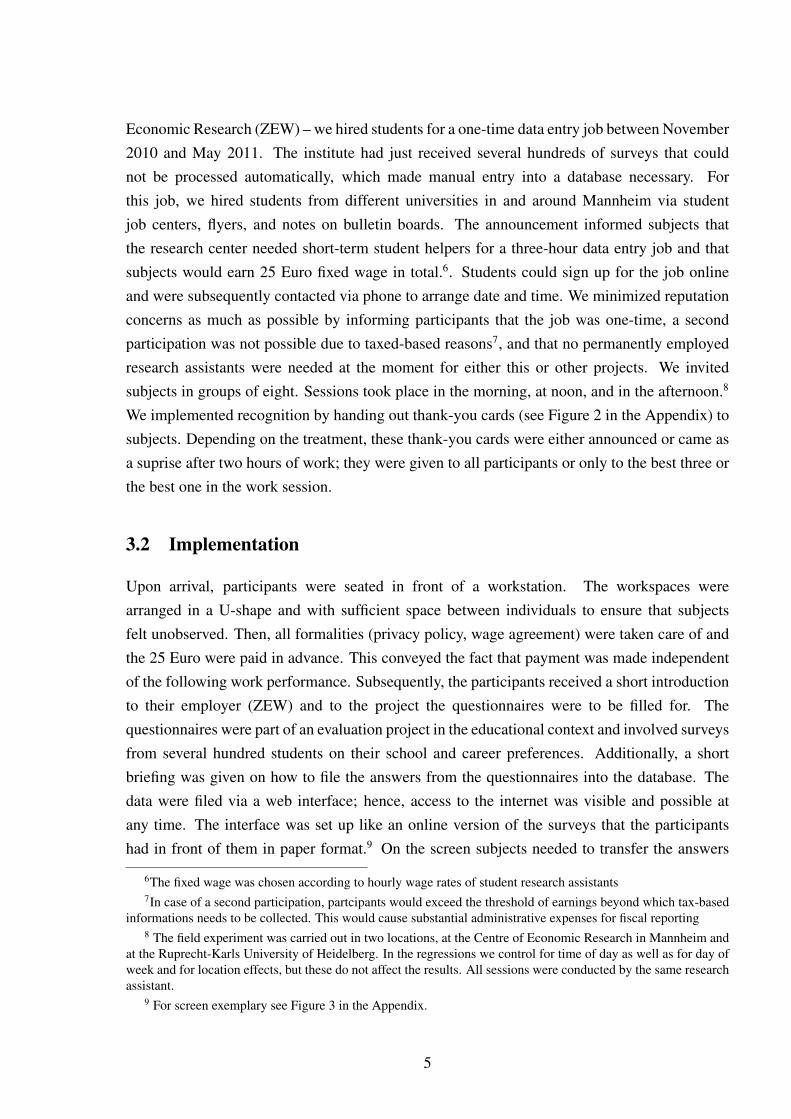
Table 2 presents the main results, i.e. regressions on number of correct entries per minute inworking period 2. Standard errors are clusterd on the session-level. We control for baselineperformance by including productivity in working period 1 in all regressions to make sure thatwe only compare individuals with similar baseline performance.19 Column I presents the overalltreatment effects, column II additionally includes controls. Columns III and IV show the resultssplit up by recipients and non-recipients. Scarce rewards (TC Best3 and TC Best1) have astatistically significant, positive effect on performance. TC Best3 increases performance by 1.1clicks per minute, which corresponds to a performance increase by 7 % or a change of 2.66standard deviations. In line with theory the increase in performance in TC Best 1 is smallerthan the one in TC Best3 albeit not statistically significant (p=0.27, one sided). Handing areward to all participants also increases performance, albeit less so than scarce rewards. Whilethe effect is not statistically significant at conventional levels, it is significant at the 10 percentlevel in a one-sided test (p=0.06). Announced rewards have no overall effect on second periodperformance. As we control for baseline performance in all regressions, this could be driven bya relatively higher working period 1 effort so that participants had less room than in the othertreatments to improve their performance.
However, in contrast to Kosfeld and Neckermann (2011), we do not find an incentive effect of anannounced non-material reward. A t-test on the difference in total productivity (quantity effect),the announcement of the thank-you card increases performance on the 10% level (p=0.08) incomparison to the control treatment. But this difference becomes insignificant when comparedwith first period performance in all other treatments, including control (p=0.34). 20
Hence, materially worthless rewards have a positive effect on overall work performance, butonly when handed out spontaneously. Effect sizes are bigger for scarce than for non-scarcerewards, and relatively smaller when the reward is extremely scarce.
As we hypothesized that the treatments will have different effects on recipients andnon-recipients, we next turn to an analysis that looks at the different subgroups separately. Theresults are displayed in columns III and IV of Table 2 and show that the effects discussed abovestem entirely from the non-recipients. Non-recipients in TC Best3 increase their performance
18For a separate analysis of treatment effects on total quantity and quality output see further below in this section.19We also include baseline performance squared and cubic).20 This is also the case if we run OLS regressions on performance in period 1 including control variables.
9
by 1.4 clicks per minute21 in TC Best 3 and by about 1 click per minute in TC Best1. Theperformance changes of non-recipients in TC Best3 and TC Best1 are statistically different fromeach other on the 10% level (p=0.07, one-sided). This is in line with conformity theory, whichargues that non-recipients should increase their performance after they find out that they performbelow average and that this effect should be stronger when there are more rewards, i.e. whenthe signal of low performance associated with not receiving the reward is stronger. Receivingthe reward has no statistically significant impact on performance in any of the treatments.22
Nevertheless, all coefficients are positive, and in line with theory, we find that the coefficientin TC All is largest and close to statistical significance (p=0.06, one-sided). This supports thenotion that conformity and reciprocity both affect the behavior of the recipients so that the effectis strongest in TC All, where there is no countervailing negative impact caused by conformityconcerns to adjust performance downward. By the same logic, the coefficient in TC Best 3 islarger than the one in TC Best 1 as the information value decreases in the number of rewardsalthough coefficients are not significantly different (p-value = 0.41, one-sided).
Interestingly, both recipients as well as non-recipients in TC Best 3 announced have astatistically insignificant, negative coefficient, suggesting that neither mechanism is at workwhen the reward was announced ex ante. Apparently, receiving an announced reward doesneither lead to reciprocity nor to conformity. Intuitively, this might be the case as an announcedincentive might be perceived as a strategic instrument to induce higher effort rather than asa signal of kindness and recognition. At the same time, if we allow for heterogeneity inpreferences for the reward, conformity concerns might be affected when not winning the rewardis no longer a signal of below average performance, rather it signals below average preferencefor the reward, which might have less negative consequences for one’s self-image.
Table 3 in the Appendix shows treatment effects on quantity and quality separately wherequality is measured as the error rate 23 Treatments affect quality levels somewhat but the sizesof the effects are small in comparison to what we observe for quantity. Moreover, qualitylevels were very high overall (only 1.6% of all entries were incorrect, s.d. = 2.7) so that all thetreatment effects we have seen for correct entries are driven by changes in quantity not quality.
Our results are robust to the inclusion of more controls for different time effects such as theday of week as well as whether the session took place during final exams period, duringthe semester or during semester break. Further, we run robustness checks on specifications
21 This corresponds to a performance increase by 9 percent or a change of 3.43 standard deviations.22 We can rule out that top performers cannot increase their performance due to ceiling. In Bradler and
Neckermann (2011) we use the same set-up and show that recipients do increase their performance subsequentto receiving a combination of reward and money.
23The error rate is the number of errors made relative to the total number of clicks entered by a participant.Correctness of an individual entry is determined as whether or not it corresponds to what the majority ofparticipants clicked as answer for this particular question. This serves as a very reliable quality measure becauseeach survey was entered on average 286 times (s.d.=67).
10

including interaction terms of treatments with gender. The results stay qualitatively similar anddepending on the specification coefficients even get slightly larger.
5 Conclusion
This paper presents a natural field experiment to test ex-post effects of recognition. Wecontribute to the literature by studying the effect of recognition in a work setting and by lookingat ex-post effects of rewards. We find that materially worthless rewards have a statisticallysignificant impact on performance. Specifically, non-recipients increase their subsequentperformance in response to scarce rewards. In line with conformity models that predict thatsubjects adjust their performance to correspond to average performance, this effect is largerwhen there is a relatively large number of recipients. We conclude that it is important to takeex-post effects of rewards into account and that channels like conformity produce unexpectedeffects that should be investigated further. Limitations of this study are the student sample, theshort-term employment (no established relationship between employer and employees) and theshort duration of the work. Future work should address these issues.
11
References
Akerlof, George A., “Labor Contracts as Partial Gift Exchange,” The Quarterly Journal of
Economics, 1982, 97 (4), 543–69.
Azmat, Ghazala and Nagore Iriberri, “The importance of relative performance feedbackinformation: Evidence from a natural experiment using high school students,” Journal of
Public Economics, August 2010, 94 (7-8), 435–452.
Bandiera, Oriana and Valentino Larcinese, “Blissful Ignorance? Effect of IndividualFeedback on Performance,” Januar 2009. The London School of Economics and PoliticalScience.
Barankay, Iwan, “Gender differences in productivity responses to performance rankings:Evidence from a randomized workplace experiment,” 2011. Working Paper, The WhartonSchool, University of Pennsylvania.
, “Rankings and Social Tournaments: Evidence from a Crowd-Sourcing Experiment,” 2011.Working Paper, The Wharton School, University of Pennsylvania.
Bradler, Christiane and Susanne Neckermann, “Motivational Production Function - A FieldExperiment,” 2011. Mimeo, ZEW Centre for European Economic Research Mannheim.
Charness, Gary, David Masclet, and Marie-Claire Villeval, “Competitive Preferences andStatus as an Incentive : Experimental Evidence,” Working Papers 1016, Groupe d’Analyseet de Thà c©orie Economique (GATE), Centre national de la recherche scientifique (CNRS),Università c© Lyon 2, Ecole Normale Supà c©rieure 2010.
Chen, Yan, F. Maxwell Harper, Joseph Konstan, and Sherry Xin Li, “Social Comparisonsand Contributions to Online Communities: A Field Experiment on MovieLens,” American
Economic Review, September 2010, 100 (4), 1358–98.
Cropanzano, Russell and Marie S. Mitchell, “Social Exchange Theory: An InterdisciplinaryReview,” Journal of Management, 2005, 31 (6), 874–900.
Deci, Edward L., “Effects of externally mediated rewards on intrinsic motivation,” Journal of
Personality and Social Psychology, 1971, 18 (1), 105–115.
Delfgaauw, Josse, Robert Dur, Joeri Sol, and Willem Verbeke, “Tournament Incentives inthe Field: Gender Differences in the Workplace,” IZA Discussion Papers 4395, Institute forthe Study of Labor (IZA) September 2009.
12

Dur, Robert, “Gift Exchange in the Workplace: Money or Attention?,” Journal of the European
Economic Association, 2009, 7 (2-3), 550–560.
Falk, Armin and Andrea Ichino, “Clean Evidence on Peer Effects,” Journal of Labor
Economics, January 2006, 24 (1), 39–58.
Fehr, Ernst, Georg Kirchsteiger, and Arno Riedl, “Does Fairness Prevent Market Clearing?An Experimental Investigation,” The Quarterly Journal of Economics, 1993, 108 (2), 437–59.
Fisher, Robert J and David Ackerman, “The Effects of Recognition and Group Need onVolunteerism: A Social Norm Perspective,” Journal of Consumer Research, December 1998,25 (3), 262–75.
Freeman, Richard B. and Alexander M. Gelber, “Prize Structure and Information inTournaments: Experimental Evidence,” American Economic Journal: Applied Economics,January 2010, 2 (1), 149–64.
Harrison, George W. and John A. List, “Field Experiments,” Journal of Economic Literature,2004, 42, 1009 – 1055.
i Vidal, Jordi Blanes and Mareike Nossol, “Tournaments without Prizes: Evidence fromPersonnel Recordsbaran,” Management Science, Oktober 2011, 57 (10), 1721–1736.
Kosfeld, Michael and Susanne Neckermann, “Getting More Work for Nothing? SymbolicAwards and Worker Performance,” American Economic Journal: Microeconomics, 2011, 3,1 – 16.
Kovach, Kenneth A., “Employee motivation: Addressing a crucial factor in your organization’sperformance,” Employment Relations Today, 1995, 22 (2), 93–107.
Kube, Sebastian, Michel André Maréchal, and Clemens Puppe, “The currency ofreciprocity - gift-exchange in the workplace,” Working Paper Series in Economics 25,Karlsruhe Institute of Technology (KIT), Department of Economics and BusinessEngineering 2011.
Kuhnen, Camelia M. and Agnieszka Tymula, “Feedback, Self-Esteem and Performancein Organizations,” 2011. Management Science, forthcoming Published online before printAugust 12, 2011.
Levine, David K., “Modeling Altruism and Spitefulness in Experiment,” Review of Economic
Dynamics, July 1998, 1 (3), 593–622.
13

Markham, Steven E., K. Dow Scott, and Gail H. McKee, “Recognizing Good Attendance:A Longitudinal, Quasi-Experimental Field Study,” Personnel Psychology, 2002, 55 (3),639–660.
Neckermann, Susanne, Reto Cueni, and Bruno S. Frey, “Awards at work,” IEW - WorkingPapers iewwp411, Institute for Empirical Research in Economics - University of Zurich May2010.
Nelson, Bob, 1001 Ways to Reward your Employees, Vol. 2, New York: Workman PublishingCompany, 2005.
Rhoades, Linda and Robert Eisenberger, “Perceived organizational support: A review of theliterature,” Journal of Applied Psychology, August 2002, 87 (4), 698–714.
Sliwka, Dirk, “Trust as a Signal of a Social Norm and the Hidden Costs of Incentive Schemes,”American Economic Review, 2007, 97 (3), 999–1012.
Stajkovic, Alexander D. and Fred Luthans, “Behavioral Management and Task Performancein Organizations: Conceptual Background, Meta-Analysis, and Test of Alternative Models,”Personnel Psychology, 2003, 56 (1), 155–194.
Tran, Anh and Richard Zeckhauser, “Rank as an Incentive: Evidence from a FieldExperiment,” 2011. Mimeo, Harvard University.
Wagner, Rodd and James K. Harter, 12: The Elements of Great Managing, New York:Gallup Press, 2006.
Wiley, Carolyn, “What motivates employees What Motivates Employees According to Over40 Years of Motivation Surveys,” International Journal of Manpower, 1997, 18 (3), 263 –280.
14
Appendix
Figure 2: Thank-you Card
Figure 3: Screenshot - Data Entry Form
15
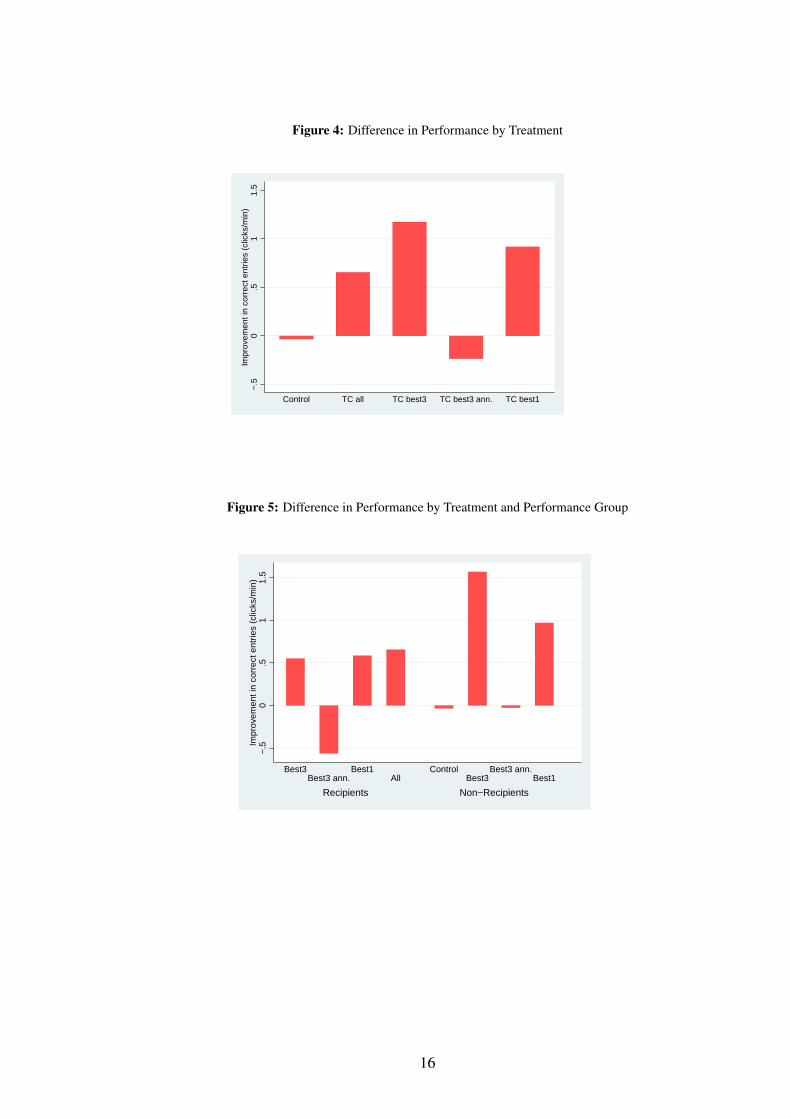
Figure 4: Difference in Performance by Treatment
−.5
0.5
11.
5Im
prov
emen
t in
corr
ect e
ntrie
s (c
licks
/min
)
Control TC all TC best3 TC best3 ann. TC best1
Figure 5: Difference in Performance by Treatment and Performance Group
−.5
0.5
11.
5Im
prov
emen
t in
corr
ect e
ntrie
s (c
licks
/min
)
Recipients Non−Recipients
Best3Best3 ann.
Best1All
ControlBest3
Best3 ann.Best1
16
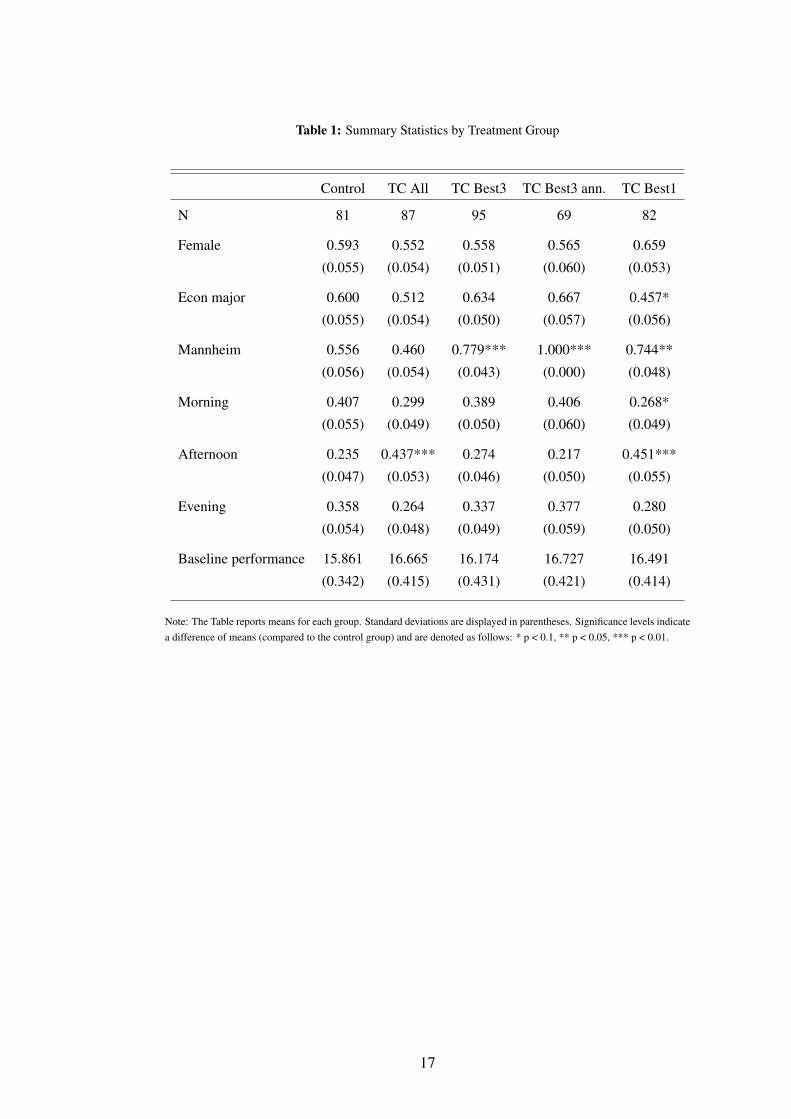
Table 1: Summary Statistics by Treatment Group
Control TC All TC Best3 TC Best3 ann. TC Best1
N 81 87 95 69 82
Female 0.593 0.552 0.558 0.565 0.659
(0.055) (0.054) (0.051) (0.060) (0.053)
Econ major 0.600 0.512 0.634 0.667 0.457*
(0.055) (0.054) (0.050) (0.057) (0.056)
Mannheim 0.556 0.460 0.779*** 1.000*** 0.744**
(0.056) (0.054) (0.043) (0.000) (0.048)
Morning 0.407 0.299 0.389 0.406 0.268*
(0.055) (0.049) (0.050) (0.060) (0.049)
Afternoon 0.235 0.437*** 0.274 0.217 0.451***
(0.047) (0.053) (0.046) (0.050) (0.055)
Evening 0.358 0.264 0.337 0.377 0.280
(0.054) (0.048) (0.049) (0.059) (0.050)
Baseline performance 15.861 16.665 16.174 16.727 16.491
(0.342) (0.415) (0.431) (0.421) (0.414)
Note: The Table reports means for each group. Standard deviations are displayed in parentheses. Significance levels indicatea difference of means (compared to the control group) and are denoted as follows: * p < 0.1, ** p < 0.05, *** p < 0.01.
17

Table 2: Treatment Effects on Productivity in Working Period 2
I II III IV
TC All 0.708 0.792 0.677 0.757(0.478) (0.500) (0.477) (0.501)
TC Best3 1.146*** 1.048***(0.384) (0.390)
TC Best1 0.968** 0.957**(0.398) (0.406)
TC Best3 announced -0.133 -0.255(0.478) (0.490)
TC Best3 - 0.573 0.557Recipients (0.515) (0.520)
TC Best3 - 1.479*** 1.374***Non-Recipients (0.399) (0.412)
TC Best1 - 0.388 0.511Recipients (0.791) (0.839)
TC Best1 - 1.029*** 1.015**Non-Recipients (0.385) (0.406)
TC Best3 announced - -0.323 -0.372Recipients (0.785) (0.791)
TC Best3 announced - -0.061 -0.172Non-Recipients (0.484) (0.495)
Constant 2.834 1.834 2.927 2.001(2.698) (2.817) (2.836) (2.929)
ControlsBaseline Performance Yes Yes Yes YesDemographics Yes YesOther Controls Yes Yes
Observations 414 409 414 409Sessions 59 59 59 59R2 0.742 0.741 0.745 0.743
Note: This table reports OLS coefficient estimates (standard errors clustered by session are reported in parentheses). The dependent variableis productivity in working period 2 measured by correct clicks per minute where one click refers to checking a box on the computer screen totransfer the choice of survey participants into the database. Correct clicks are total clicks entered minus all errors made by the participant. TCAll represents a thank-you card for all subjects. TC Best3 refers to sessions where three thank-you cards were assigned to the best three subjects.TC Best1 indicates sessions where only one thank-you card was given to the best subject. TC Best3 announced represents sessions where threethank-you cards have ben announced prior to working period 1. Treatment Control is omitted and serves as the reference category. ColumnI shows overall treatments effects with control for baseline performance where the latter is the productivity in working period 1. Further, wecontrol for baseline performance squared and cubic. Column II includes controls for demographics such as gender and field of study as well asother controls such as location, time of day and groupsize. Column III and IV allow for a separate analysis for recipients and non-recipients ofthank-you cards. Column IV additionally includes all control variables. Significance levels are denoted as follows: * p < 0.1, ** p < 0.05, ***p < 0.01.
18

Table 3: Treatment effects on Total Productivity and Error Rates in Working Period 2
I II III IV V VIDep. Variable Total Clicks Total Clicks Total Clicks Total Clicks Error Rate Error Rate
TC All 0.593 0.668 0.559 0.628 -0.171 -0.171(0.466) (0.487) (0.467) (0.489) (0.191) (0.191)
TC Best3 1.232*** 1.149*** 0.242(0.393) (0.396) (0.209)
TC Best1 0.994** 1.003** -0.154(0.405) (0.411) (0.224)
TC Best3 ann. -0.042 -0.145 0.671(0.480) (0.492) (0.500)
TC Best3 - 0.559 0.558 0.220Recipients (0.528) (0.528) (0.204)TC Best3 - 1.633*** 1.552*** 0.257Non-Recipients (0.408) (0.418) (0.278)TC Best1 - 0.451 0.587 -0.170Recipients (0.814) (0.864) (0.249)TC Best1 - 1.051*** 1.061** -0.151Non-Recipients (0.391) (0.408) (0.236)TC Best3 ann. - -0.233 -0.264 0.633Recipients (0.794) (0.798) (0.463)TC Best3 ann. - 0.027 -0.054 0.695Non-Recipients (0.475) (0.486) (0.738)Constant -2.881 -3.833 -3.139 -4.033 1.686 1.688
(3.581) (4.186) (3.504) (4.051) (1.527) (1.534)ControlsBaseline Yes Yes Yes Yes Yes YesPerformanceDemographics Yes Yes Yes YesOther Controls Yes Yes Yes Yes
Observations 414 409 414 409 409 409Sessions 59 59 59 59 59 59R2 0.742 0.741 0.746 0.744 0.077 0.077
Note: This table reports OLS coefficient estimates (standard errors clustered by session are reported in parentheses). In Columns I-IV, thedependent variable is the total number of clicks entered in the second working period where one click refers to checking a box on the computerscreen to transfer the choice of survey participants into the database. In Columns V and VI, the dependent variable is the error rate in workingperiod 2. The latter is calculated by total errors divided by total clicks entered. Detailed explanations on treatment dummies TC All, TC Best3,TC Best3 announced, TC Best1 can be found in Table 2. Treatment Control is omitted and serves as the reference category. All columnsshow treatments effects with control for baseline performance where the latter is the total productivity in working period 1 (with control forsquared and cubic baseline performance) in columns I-IV, and respectively the error rate in working period 1 in columns V and VI. In ColumnI,II,IV and VI include controls for demographics such as gender and field of study as well as other controls such as location, time of day andgroupsize. Column II, V and VI allow for a separate analysis for recipients and non-recipients of thank-you cards. Significance levels aredenoted as follows: * p < 0.1, ** p < 0.05, *** p < 0.01.
19

Instructions
Control:May I bother you a moment? I just talked to our IT-specialists. They did a brief check on ourserver. The data have been correctly transmitted from all computers so far.
Thank-you card for all (TC All):May I bother you a moment? I just talked to our IT-specialists. They did a brief checkon our server. The data have been correctly transmitted from all computers so far. We areglad that everything is going well, and would like to take the opportunity to thank you. Inpreparation for this data entry job, our president, Wolfgang Franz and we have decided to giveeveryone this thank-you card as a symbol of our appreciation and thankfulness for your support.
Thank-you card for best 3 (TC Best3):May I bother you a moment? I just talked to our IT-specialists. They did a brief check onour server. The data have been correctly transmitted from all computers so far. We are gladthat everything is going well, and we would like to take the opportunity to thank you. OurIT-specialists have told us that logins X, Y, and Z have transmitted most data so far. Accordingto my notes, this should be Mr. /Mrs. X, Y, and Z, correct? In preparation for this data entryjob, our president, Wolfgang Franz and we have decided to give everyone this thank-you cardas a symbol of our appreciation and thankfulness for your support. However, Prof. Franz wasonly able to sign a small number of cards personally. Therefore, we have decided just now tohand these cards to those of you, who have shown particular commitment.
Thank-you card for best 1 (TC Best1):May I bother you a moment? I just talked to our IT-specialists. They did a brief check onour server. The data have been correctly transmitted from all computers so far. We are gladthat everything is going well, and we would like to take the opportunity to thank you. OurIT-specialists have told us that login X has transmitted most data so far. According to mynotes, this should be Mr. /Mrs. X, correct? In preparation for this data entry job, our president,Wolfgang Franz and we have decided to give everyone this thank-you card as a symbol of ourappreciation and thankfulness for your support. However, Prof. Franz was only able to sign asmall number of cards personally. Therefore, we have decided just now to hand the card to thatperson who has shown particular commitment.
20
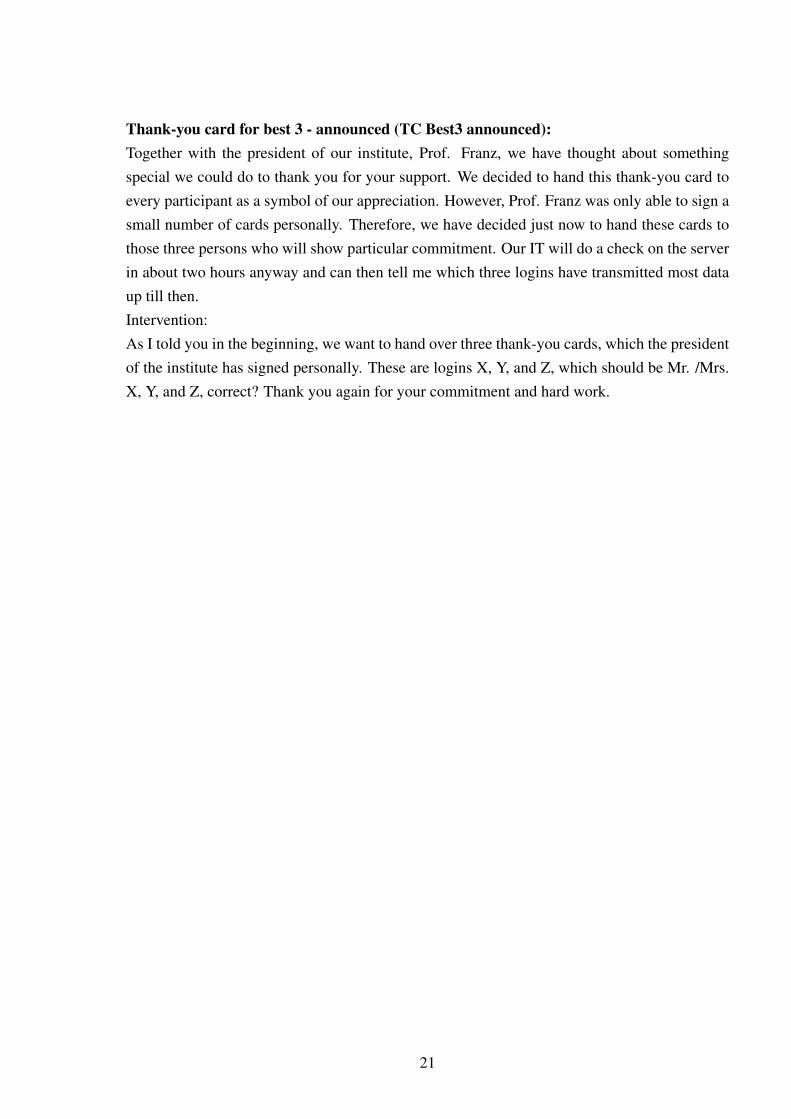
Thank-you card for best 3 - announced (TC Best3 announced):Together with the president of our institute, Prof. Franz, we have thought about somethingspecial we could do to thank you for your support. We decided to hand this thank-you card toevery participant as a symbol of our appreciation. However, Prof. Franz was only able to sign asmall number of cards personally. Therefore, we have decided just now to hand these cards tothose three persons who will show particular commitment. Our IT will do a check on the serverin about two hours anyway and can then tell me which three logins have transmitted most dataup till then.Intervention:As I told you in the beginning, we want to hand over three thank-you cards, which the presidentof the institute has signed personally. These are logins X, Y, and Z, which should be Mr. /Mrs.X, Y, and Z, correct? Thank you again for your commitment and hard work.
21