employee progression - ippr · translates more quickly into opportunities for promotion into...
TRANSCRIPT

Institute for Public Policy Research
Spencer Thompson and Izzy Hatfield
February 2015 © IPPR 2015
REPORT
EMPLOYEE PROGRESSION IN EUROPEAN LABOUR MARKETS

IDEAS to CHANGE LIVES
ABOUT IPPRIPPR, the Institute for Public Policy Research, is the UK’s leading progressive thinktank. We are an independent charitable organisation with more than 40 staff members, paid interns and visiting fellows. Our main office is in London, with IPPR North, IPPR’s dedicated thinktank for the North of England, operating out of offices in Newcastle and Manchester.
The purpose of our work is to conduct and publish the results of research into and promote public education in the economic, social and political sciences, and in science and technology, including the effect of moral, social, political and scientific factors on public policy and on the living standards of all sections of the community.
IPPR 4th Floor 14 Buckingham Street London WC2N 6DF T: +44 (0)20 7470 6100 E: [email protected] www.ippr.org Registered charity no. 800065
This paper was first published in February 2015. © 2015
ABOUT THE PROGRAMMEThe JPMorgan Chase New Skills at Work programme aims to identify strategies and support solutions that help improve labour market infrastructure and develop the skilled workforce globally. The initiative brings together leading policymakers, academics, business leaders, educators, training providers and nonprofits with the goal of connecting labour market policy with practice, supply with demand and employers with the workforce – all to strengthen the global economy.
ABOUT JPMORGAN CHASEJPMorgan Chase & Co (NYSE: JPM) is a leading global financial services firm with assets of $2.5 trillion and operations worldwide. The firm is a leader in investment banking, financial services for consumers and small businesses, commercial banking, financial transaction processing, asset management and private equity. More information is available at www.jpmorganchase.com.
While this report has been supported by the JPMorgan Chase Foundation, the contents and opinions in this paper are those of IPPR alone and do not reflect the views of the JPMorgan Chase Foundation, JPMorgan Chase & Co, or any of its affiliates.
CONTENTS
Summary ............................................................................................................1
1. Introduction ....................................................................................................4
1.1 Changing labour markets in Europe ................................................................. 4
1.2 The importance of labour market progression .................................................. 5
1.3 Analysing progression rates ............................................................................. 5
2. Occupational progression ..............................................................................7
2.1 Patterns by gender, qualifications and age ....................................................... 9
2.2 Occupational structure ................................................................................... 11
2.3 Industrial structure ........................................................................................ 13
2.4 Education and training systems ..................................................................... 14
2.5 Promotion opportunities within firms .............................................................. 16
Conclusion .......................................................................................................... 17
3. Earnings progression ................................................................................... 19
3.1 Earnings deciles and earnings groups ............................................................ 19
3.2 Low pay ........................................................................................................ 21
Conclusion .......................................................................................................... 22
4. Hours and contract progression .................................................................. 23
4.1 Hours ............................................................................................................ 23
4.2 Temporary employment ................................................................................. 25
Conclusion .......................................................................................................... 27
5. Conclusion and implications ........................................................................ 28
References ....................................................................................................... 30
Appendix .......................................................................................................... 32

ABOUT THE AUTHORSSpencer Thompson is a senior economic analyst at IPPR.
Izzy Hatfield is a researcher at IPPR.
ACKNOWLEDGMENTSThe authors would like to thank IPPR colleagues Tony Dolphin, Dalia Ben-Galim and Nick Pearce for their support and input into this paper.
DownloadThis document is available to download as a free PDF and in other formats at: http://www.ippr.org/publications/employee-progression-in-european-labour-markets
CitationIf you are using this document in your own writing, our preferred citation is:
Thompson S and Hatfield I (2015) Employee progression in European labour markets, IPPR. http://www.ippr.org/publications/employee-progression-in-european-labour-markets
Permission to shareThis document is published under a creative commons licence: Attribution-NonCommercial-NoDerivs 2.0 UK http://creativecommons.org/licenses/by-nc-nd/2.0/uk/ For commercial use, please contact [email protected]

IPPR | Employee progression in European labour markets1
SUMMARY
Economic recovery in Europe remains a far-off prospect. GDP growth has eased substantially in the EU and turned flat in the eurozone, with leading indicators suggesting that even once-resilient economies such as Germany may fall into negative growth. This is reflected in the EU’s labour market performance: the unemployment rate is higher now than it was two years ago, and the most recent data shows that the working-age employment rate has dropped.
Europe’s labour market has deep underlying issues. Several decades of globalisation and technological change, which the institutions governing the labour market have struggled to catch up with, have hollowed-out middle-income jobs and created a disconnect between overall productivity growth and wages. Low pay, in-work poverty and job insecurity are widespread, while at the same time employers are struggling to fill many highly-skilled vacancies.
Understanding in-work progression in Europe is vital to finding a solution to these problems. Improving individuals’ prospects for promotion and advancement offers a route out of in-work poverty for those workers stuck on low pay. Furthermore, if Europe’s skills needs are to be met, the existing workforce needs more and better in-work training and lifelong learning, and the skills of entry-level workers must likewise be improved. Finally, the impact of job insecurity and involuntary underemployment can be mitigated if individuals are able to progress into permanent and full-time jobs.
This paper explores how rates of in-work progression vary across European economies, using comparable international data for the period 2004–2011. In it, we focus on four dimensions of in-work progression.
1. Occupational progressionLooking at the structure of career pathways in European countries, we found that relatively few workers are able to ‘leapfrog’ the middle of the occupational skill distribution: in most European countries fewer than 5 per cent of low-skilled workers move into a highly-skilled occupation over a four-year period. Most workers progress into higher-skilled occupations incrementally, moving from low-skilled jobs to those in the middle of the distribution, and from the middle to highly-skilled jobs.
We found evidence that men are more likely to progress than women, which confirms the findings of existing research which has suggested that women face considerable barriers to career progression. A lack of flexible working provision alongside insufficient public support for childcare means that many women are forced to take lower-skilled positions, often on a part-time basis, with fewer opportunities for advancement.
Our findings also show that, in most European countries, progression rates fall as individuals age. Older workers tend to place a higher premium on job security, whereas for younger workers the accumulation of labour market experience translates more quickly into opportunities for promotion into higher-skilled work.
There is considerable variation in rates of progression across countries, due to a variety of factors. Countries differ in terms of occupational structure. Some countries, such as Belgium, have high rates of progression supported by an even spread of jobs across skill levels, whereas in others, such as the

IPPR | Employee progression in European labour markets2
UK, a relatively small share of jobs fall into the middle of the skill distribution, which feeds into lower progression rates.
Since middle-skilled jobs tend to be most prevalent in the manufacturing industry, the relative size of that sector is likely to be important. However, our findings show that the occupational distribution within sectors also varies between countries. For example, not only does Belgium have a relatively large manufacturing sector, but Belgian manufacturing firms also tend to employ more mid-skilled workers. A similar pattern can be observed in the business services, retail and hospitality sectors. This implies that the international disparity in progression rates is not entirely due to differences in the industrial mixes of each country, but also reflects differences in business models and human resources practices at the sub-sector and firm level. We found that in many countries with high rates of occupational progression, employees reported favourable promotion prospects, and individuals were more likely to progress while staying with their current employers. This suggests that human resource practices such as the design of career pathways may be important factors in determining occupational progression rates.
2. Earnings progressionMovement up the earnings distribution is important, as it mitigates the effects of income inequality and allows individuals and families to escape low pay and working poverty. We found that earnings progression rates tend to be higher than occupational progression rates. However, progression does appear to slow down towards the top – workers are considerably more likely to move from the bottom to the middle of the earnings distribution than from the middle to the top.
Earnings mobility is closely linked to individuals’ other labour market characteristics, such as their ability to increase their hours or to move to a higher-paying job through promotion or by changing employers.
3. Hours progressionProgression from part- to full-time hours is an important means by which workers can increase their earnings, but it tends to occur less often in those countries where part-time work is more prevalent, particularly northern European countries and the UK.
This is not necessarily a bad thing: these countries’ labour markets are more inclusive, particularly in terms of having higher part-time employment rates among women, who are less likely to progress into full-time work than men. There appears to be a trade-off between gender equality in employment and hours progression.
However, rates of hours progression are also linked to institutional factors. For instance, greater support for meeting family care commitments through publicly funded or provided childcare, and more flexible working opportunities, would help families who want to increase their hours to do so. The way in which second earners are treated in the tax and benefit system also has a large impact on families’ – and particularly women’s – hours preferences.
4. Contract progressionIn many European countries, particularly those in southern Europe, temporary contracts were growing more prevalent before the recession, and their rise has continued since. This has fed in to the ‘dual labour market’ phenomenon, wherein many workers find themselves cycling between fixed-term positions as they are unable to secure a permanent and stable position. This has been linked to the relatively strict protections that employment legislation affords to permanent employees in southern Europe, which may have caused many employers to turn to temporary contracts as a means of building flexibility into their workforce.
IPPR | Employee progression in European labour markets3
Our analysis supports this hypothesis. We found the lowest rates of progression from temporary to permanent positions in southern European countries such as Greece and Spain, as well as in France and the Netherlands. By contrast, for those in eastern and northern Europe, temporary work is more likely to offer a stepping-stone into regular employment: in many of these countries, more than half of temporary employees moved into a permanent job over a four-year period.
Conclusion and implicationsThere are already signs that despite Europe’s faltering recovery, demand for highly-skilled labour is outstripping supply. This is especially true in many specific, highly-specialised occupational groups such as ICT professionals. At the same time, the number of jobs in the middle of the occupational distribution is shrinking, a trend which is expected to continue. This is likely to have an effect on career pathways, and if it is left unchecked it may exacerbate existing skills shortages.
Employers will therefore have to adapt in order to fill highly-skilled vacancies. They must pursue a combination of:
• engagement with the education and training system, in order to equip labour market entrants with those skills in demand
• greater provision of in-work training to their current workforce, and
• designing career pathways so that individuals can progress within and across employers from a wider variety of starting occupations.
Forthcoming IPPR research within the New Skills at Work Programme will look at progression at the firm level, outlining current best practice in human resources in relation to occupational progression.
National governments must also play their role by designing labour market institutions to support progression. These must pursue the objectives of:
• breaking down the dual labour markets of southern Europe to facilitate transitions into permanent positions
• encouraging the adoption of flexible work practices across industries and occupations, and
• designing training, childcare and in-work benefit systems that foster labour market inclusion and progression.

IPPR | Employee progression in European labour markets4
1. INTRODUCTION
1.1 Changing labour markets in EuropeEurope’s recovery is far from secure. Although GDP growth in the EU was positive in the first three quarters of 2014, it eased in Q2 and Q3 (Eurostat 2014a). While the EU28 unemployment rate fell throughout 2014, by the end of that year it remained around three percentage points higher than its pre-crisis level (Eurostat 2015). Furthermore, within these overall figures we must consider the persistently weak position of particular sub-groups, especially young people, and the large disparities in economic and labour market performance both between and within countries (Dolphin et al 2014).
However, Europe faces deeper underlying issues with its economy and labour market. At the headline level, only a third of unemployment is ‘cyclical’ and therefore expected to disappear following a recovery (ibid). The disruptive economic forces of technological change and globalisation have, over several decades, eroded substantial segments of the economy and fundamentally altered patterns of job creation. Most European countries have followed a pattern of occupational polarisation, with increases in the number of low-skilled, low-paid jobs as well as highly-skilled ones, but contraction in the middle of the occupational distribution. Between 2000 and 2010 the number of low-skilled jobs rose by over 10 per cent, and the number of highly-skilled jobs by over 15 per cent, while the number of mid-skilled roles shrunk by 2 per cent (ibid). Many routine manual and clerical positions in the middle of the skills distribution have either been rendered obsolete by technology or outsourced to countries with lower labour costs.
This process of polarisation has had two impacts. Firstly, the proliferation of low-skilled work has contributed to persistent levels of low pay and in-work poverty. In 2004, 9.7 per cent of those in employment in the EU27 group of countries lived in poverty; this rate rose to 10.5 per cent in 2007, and then to 11.9 per cent in 2012 (Eurostat 2014b). This has been accompanied by growing insecurity at the bottom of the labour market: in 2007, 17.5 per cent of employees in EU27 countries wanted to work more hours, up from 15.8 per cent in 2000 (Eurostat 2014c). Similarly, the proportion of workers employed on a temporary basis rose from 12 per cent in 2000 to almost 15 per cent in 2007 (ibid). While this trend towards low pay, weak wage growth and economic insecurity has worsened considerably since the start of the recession, it is important to note that the situation of workers at the bottom of the labour market was deteriorating long before Europe’s current economic crisis.
Second, and in contrast, demand for highly-skilled labour is fierce. While university graduation rates have increased, demand for graduate labour may have outpaced supply. This has led to rising earnings at the top, increasing already high levels of pay inequality. Just as concerning is the possibility that, over time, the lack of a sufficient supply of high-level skills in Europe may cause many employers to look to other global regions. The European Centre for the Development of Vocational Training (CEDEFOP) has made forecasts of how demand for skills in the EU will evolve over coming years, and expects demand for highly skilled workers to rise by a quarter between 2010 and 2020 (CEDEFOP 2010). This trend is expected to be most acute in a range of specific, highly-specialised occupations. For example, the European Commission has projected that between 700,000 and 1.3 million vacancies in ICT occupations

IPPR | Employee progression in European labour markets5
in the EU will be unfilled by 2020 due to a lack of sufficiently qualified and experienced workers (Gareis et al 2014).
1.2 The importance of labour market progressionLabour market progression is one means by which these challenges can be mitigated. While definitions of it vary, ‘progression’ is generally taken to describe improvements in the labour market position of individual workers. While this can include movements from unemployment or economic inactivity into work, in this paper we focus on the transitions of those who are already in employment. For this group, progression can refer to a variety of different transitions: to higher rates of pay, to more highly-skilled work, or from temporary to permanent or part- to full-time work. It could also refer to an increase in job satisfaction, or to a worker being afforded greater autonomy or flexibility.
For those in low-skilled, low-paid work, progression offers a way to escape working poverty and gain greater economic security. Furthermore, our concerns about income inequality may be partly assuaged if opportunities for those at the bottom of the income distribution to progress upwards over the course of their careers are widely available.
Progression can help to ensure that the demand for highly-skilled labour is met, by up-skilling the existing workforce so that they can be better matched to available vacancies. This complements other skill pipelines such as entry-level work and migration.
However, there are longstanding barriers to progression. Many Individual organisations are structured in a way that makes them unable to offer many promotion opportunities to their staff. For example, smaller firms will by nature have fewer openings at all levels. Similarly, bigger organisations that rely on a large number of low-skilled workers relative to a much smaller group of highly-skilled managers (such as most large retail businesses) will similarly have fewer openings at the top relative to the size of their workforces. If these patterns are common throughout a sector or an economy, they have the effect of limiting aggregate levels of progression.
Furthermore, barriers at the household and individual levels may curtail advancement for many workers. Those with extensive caring commitments – parents of new children, for example – may not be able to access the opportunities and support they need in order to progress in work. Similarly, those with work-limiting disabilities and health conditions often find it difficult to increase their hours or move up career ladders.
These difficulties are likely to have been exacerbated by structural changes to the labour market which may have decreased opportunities for occupational and pay progression. The hollowing out of middle-skilled jobs may have closed some of the routes that those in low-skilled work were once able to advance into and through, and the increasingly specialised nature of many highly-skilled occupations may have acted to limit progression from the middle to the top.
1.3 Analysing progression ratesThis paper attempts to fill a significant knowledge gap by providing an assessment of how rates of progression vary across European countries. To do this we use the EU Statistics on Incomes and Living Conditions (EU-SILC) dataset, covering the years 2004–2011. The EU-SILC is a longitudinal household survey, carried out in the majority of European countries, which surveys households annually in four-year cohorts – that is, cohorts that span the years 2004–2007, 2005–2008, 2006–2009, 2007–2010 and 2008–2011. In this paper we refer to each year in which households were surveyed as a ‘wave’ – so, for instance, ‘the first wave of

IPPR | Employee progression in European labour markets6
the 2004 cohort’ refers to 2004, the ‘second wave’ of that cohort refers to 2005, and so on. The survey provides information on employment and incomes at a household and individual level.1
In this report we focus on four measures of labour market progression.
• Occupational progression: the proportion of employees who move up the occupational distribution (ranked within countries by median hourly pay) from low- or middle-paying occupations to middle- or higher-paying occupations. In this measure, hourly pay is used as a proxy measure for skill, since remuneration is closely linked to productivity.
• Employment earnings: the proportion of full-time, full-year employees who move from low to high pay, and up the decile distribution of employee earnings.2
• Hours: the proportion of part-time employees who progress to full-time hours.
• Contracts: the proportion of temporary employees who progress to a permanent position.
In each case, we focus on those individuals who were in employment at both the beginning and end of the four-year period over which they were surveyed, and assess whether their circumstances changed. This omits those who fell out of employment and did not return within that four-year survey period – a sizable group, particularly since the onset of the European economic crisis. However, the central employment challenge facing this latter group of workers is less linked to progression, and has more to do with securing attachment to the labour market.
While the evidence presented in this paper is purely descriptive, we refer throughout to existing evidence that helps explain why these rates of progression vary between countries, and provide further evidence by breaking-down rates of progression by age, gender, and other individual-level factors. We also summarise some of the national economic and institutional-level factors that act to promote or limit progression opportunities within countries.
1 All data in this report is taken or derived from the EU-SILC (Eurostat 2013a), unless stated otherwise.2 Data on the incomes of the self-employed is significantly more complex than, and difficult to compare
with, that on employees, and so is excluded from the analysis in this paper. However, IPPR analysis of self-employment across Europe can be found in Hatfield (2015).

IPPR | Employee progression in European labour markets7
2. OCCUPATIONAL PROGRESSION
Occupational progression – the movement of workers to higher-skilled work – is important for several reasons. First, the skill-level of work is linked to pay, as highly-skilled occupations tend to be characterised by a higher level of labour-productivity, which is a key determinant of pay.3 Moving into a higher-skilled occupation is therefore a key means of increasing employment earnings. Second, higher-skilled work is regularly linked to other positive employment characteristics, such as work autonomy, job satisfaction and security.4 This chapter describes how occupational progression varies between European countries and across demographic groups, and then discusses some of the key national-level factors that underlie these differences.
First we look at the proportion of continuously employed workers who moved to a higher-skilled occupation within a four-year period, compared with those who either stayed in the same occupation or moved into one that is lower-skilled.5 The countries shown in figure 2.1 are those for which the EU-SILC dataset has usable occupational data, so some countries, such as Germany and Greece, are not included.
Figure 2.1Rates of occupational progression (%) in EU countries, 2004–2011
0%
5%
10%
15%
20%
25%
Belgium
Estonia
Czech
Rep
.
Latvi
aUK
Sweden
Portug
al
Spain
Hunga
ry
Finlan
d
Poland
Netherl
ands
Slovak
ia
Lithu
ania
Fran
ce
Bulgari
a
Norway
Cypru
s
Luxe
mbour
gIta
ly
Source: IPPR calculations using Eurostat (2013a) and Eurostat (2013b) Note: Shows the proportion of workers employed in waves one and four of each cohort of the EU-SILC (from 2004–2007 to 2008–2011) who moved up the occupational distribution (27 occupational categories ranked by median hourly pay).
3 It should be noted that the existence of a link between occupations, productivity and pay is contested in the literature. Kampelmann and Rycx (2011), for example, used Belgian data and found that while occupations are linked to earnings, there is little evidence of a link between occupations and productivity.
4 Gallie and Zhou (2013) found that professionals and managers across the EU have significantly more control over their jobs and work tasks than those in lower-skilled sales, service and routine manufacturing roles.
5 The appendix of this report describes how we have defined occupations according to skill levels.

IPPR | Employee progression in European labour markets8
Figure 2.1 shows that occupational progression is highest in Belgium, where more than one in five continuously employed workers attained a higher-skilled occupation over a four-year period. In Sweden, the UK, Luxembourg, the Czech Republic and Estonia there are also encouraging levels of occupational progression, with between 15 and 20 per cent managing to secure higher-skilled work. The poorest performers are Italy, Luxembourg, Cyprus and Norway, where fewer than 5 per cent of the continuously employed managed to progress.
By dividing the 27 occupations included in the EU-SILC into three groups of nine – low-skilled, mid-skilled and high-skilled – we can also discern how progression rates vary according to where an individual starts on the occupational distribution (see figure 2.2).
Figure 2.2Rates of occupational progression (%) by occupational groups, in EU countries, 2004–2011
0%
5%
10%
15%
20%
25%
30%
Belgium
Estonia
Czech
Rep
.
Portug
al
Spain
SwedenUK
Netherl
ands
Latvi
a
Finlan
d
Hunga
ry
Poland
Slovak
ia
Fran
ce
Bulgari
a
Lithu
ania
Luxe
mbour
g
Cypru
s
NorwayIta
ly
Low to middle
Low to high
Middle to high
Source: IPPR calculations using Eurostat 2013a and 2013b Note: Chart shows the proportion of workers in employment in waves one and four of each cohort of the EU-SILC (from 2004–2007 to 2008–2011) who moved up the occupational distribution (27 occupational categories grouped into three groups of nine and ranked by median hourly pay).
While the scale of progression varies between countries, as figure 2.1 shows, the pattern of progression by starting position in the occupational distribution is strikingly similar across countries. Generally, there are higher progression rates among low-skilled workers moving to the middle of the distribution than there are among low-skilled workers moving into the top third of occupations. There is a similar differential, albeit smaller, between rates of progression among those moving from the middle to the top and those moving from the bottom to the top. In all countries other than the Netherlands, the UK and Sweden, no more than 5 per cent of low-skilled workers progress to highly-skilled work over a four-year period.
This suggests that the availability of jobs in the middle of the occupational distribution is key to fostering progression. Given that in most European countries the number of jobs in the middle of the skill distribution is expected to continue to shrink (Dolphin et al 2014), we should be concerned that occupational progression may also be limited going forwards. Of course, there is a possibility that career pathways will adapt as

IPPR | Employee progression in European labour markets9
the middle shrinks, but if highly-skilled vacancies are to be filled this would have to be accompanied by a significant reconfiguration of the way in which businesses recruit.
This pattern is not true of all countries; Lithuania and Bulgaria, for example, show greater progression from low to high than from the middle to the top. Furthermore, in three countries, Finland, the UK and Latvia, progression from low to middle is lower than from middle to high.
2.1 Patterns by gender, qualifications and ageAn important consideration is how the patterns of occupational progression shown above vary between different groups of individuals, since other factors besides someone’s starting occupation determine their ability to progress.
In terms of gender, in most of the countries that we analysed we found progression rates to be higher for men than for women (see figure 2.3). In Belgium, for example, 24 per cent of male continuously-employed workers moved into a higher-skilled occupation, whereas only 21 per cent of females did so. However, in some countries women are more likely to progress than men. In Portugal and Estonia, for example, occupational progression rates for women are more than 2 percentage points higher than those of men.
Figure 2.3Rates of occupational progression (%) by gender in EU countries, 2004–2011
0%
5%
10%
15%
20%
25%
Belgium
Estonia
Latvi
a
Czech
Rep
.UK
Sweden
Spain
Hunga
ry
Portug
al
Finlan
d
Poland
Netherl
ands
Lithu
ania
Bulgari
a
Slovak
ia
Fran
ce
Cypru
s
NorwayIta
lyLu
x.
Male
Female
Source: IPPR calculations using Eurostat 2013a and 2013b
The higher rates of progression among men in most countries reflects the barriers to career progression that women face, and which have been identified in European labour market research. It has been found that women are often underemployed, working in occupations below their level of educational attainment, and employed on a part-time basis (Silim and Stirling 2014); furthermore, part-time work is often only available in lower-skilled and lower-paying occupations (Manning and Petrongolo 2006). These barriers to progression are exacerbated by the career breaks often brought about by motherhood, and by the link that exists between part-time working and reduced opportunities for advancement (McIntosh et al 2012). If employers were to provide greater opportunities for flexible and part-time work in a wider range of occupations,

IPPR | Employee progression in European labour markets10
and if public support for childcare were used to reduce the length of involuntary career breaks, fewer women would face these barriers to progression (Silim and Stirling 2014).
Turning to occupational progression across age groups, we see that in most countries progression tends to be highest in the 25–44 age group, and lowest for those workers aged between 55 and 64 (see figure 2.4). Two notable exceptions are the UK, where progression rates are similar across the age distribution at around 15 per cent, and in Belgium, where progression in the 25–44 age group is around four percentage points lower than it is for both younger and older workers. Our overall finding of relatively higher rates of progression among 25–44-year-olds is supported by other research: studies using data from West Germany (Manzoni et al 2014) and Sweden (Härkönen and Bihagen 2011) found that progression tends to be highest in the first 10 or so years following labour market entry, and starts to decrease in later years. This is because younger workers accumulate labour market experience in the early years of their careers, whereas a higher proportion of 45–64-year-old workers are already in highly-skilled occupations with less scope for further progression; older workers also tend to value job stability more highly, and are less likely to change positions (Lam et al 2012).
Figure 2.4Rates of occupational progression (%) by age group in EU countries, 2004–2011
0%
5%
10%
15%
20%
25%
Estonia
Latvi
a
Czech
Rep
.
Belgium
Spain
Sweden
Poland
Finlan
d
Hunga
ryUK
Portug
al
Lithu
ania
Fran
ce
Slovak
ia
Netherl
ands
Cypru
s
Bulgari
aIta
ly
Luxe
mbour
g
Norway
16–24
25–44
45–54
55–64
Source: IPPR calculations using Eurostat 2013a and 2013b
Finally, looking at how occupational progression varies by level of educational attainment, we can discern surprisingly similar rates across qualification groupings. Where there is a sizable differential – as there is in Bulgaria, Finland, Hungary and Estonia – workers with fewer qualifications tend to be the ones who progress faster. This may illustrate the way in which returns, in terms of occupational status, from labour market experience versus educational attainment vary. We would expect those who enter the labour market with high-level qualifications to find work in highly-skilled occupations more quickly. Those with lower-level qualifications, on the other hand, may initially be at a disadvantage in terms of securing highly-skilled employment, but

IPPR | Employee progression in European labour markets11
over time they will gain labour market experience which will allow them to progress. This is not, however, the pattern observed in the majority of countries.
Figure 2.5Rates of occupational progression (%) by highest qualification in EU countries, 2004–2011
0%
5%
10%
15%
20%
25%
Belgium
Estonia
Czech
Rep
.
Latvi
aUK
Sweden
Portug
al
Spain
Hunga
ry
Lithu
ania
Finlan
d
Poland
Slovak
ia
Netherl
ands
Fran
ce
Bulgari
a
NorwayIta
ly
Cypru
sLu
x.
ISCED 0–2
ISCED 3–4
ISCED 5–6
Source: IPPR calculations using Eurostat 2013a and 2013b
What factors lie behind these very different occupational progression rates across European countries? The rest of this section highlights several key national-level factors that are important in determining overall progression rates.
2.2 Occupational structureThe number of positions available at different points in the occupational distribution influence the ability of individuals to progress. We have seen that rates of progression from the bottom to the top portions of the distribution are considerably lower than the rates for bottom-to-middle and, to a lesser extent, middle-to-top, progression, and that this holds true for most European countries (see figure 2.2). It seems that relatively few workers are able to ‘leapfrog’ the middle of the occupational distribution, with current patterns of progression relying on a large and healthy middle tier of jobs for workers to progress into and then out of.
Figure 2.6 illustrates how the occupational distribution varies between three economies with varying rates of progression: Belgium, which in the previous section was shown to have very high levels of progression; the UK, which sits towards the middle of the surveyed countries; and France, an economy with low levels of progression. Each bar in figure 2.6 records the share of total employee jobs in that occupation, with each occupation group ranked along the horizontal axis in terms of hourly pay (with ‘8’ being the highest paid). Therefore if jobs were evenly distributed between each occupation the bars would be a similar height.6
6 The occupational groups used here are based on the nine major occupational groups as defined in the 1988 International Standard Classification of Occupations (ISCO-88), with the exception of agricultural workers, for whom the sample size was too small to present useful data.

IPPR | Employee progression in European labour markets12
The graph shows that in Belgium a greater share of employee jobs are in the middle of the income distribution – over 40 per cent of them are located in the ‘3’, ‘4’, ‘5’ and ‘6’ occupational categories. In the UK the equivalent figure is around 25 per cent, and in France it is slightly lower. In the UK there is a greater concentration in both the bottom and top than in the middle, whereas in Belgium a larger share of jobs are found further up the distribution relative to the bottom (with the exception of the top occupational category). France is interesting in that while the share of jobs in the top three occupational categories is actually higher than it is in the UK or Belgium, its progression rates into the top tier of occupations are much lower. Clearly other factors are at play in determining the low level of progression in France, particularly progression from the middle to the top.
Figure 2.6Share of total employee jobs (%) by occupational skill distribution in Belgium, France and the UK, 2006
Belgium France UK
0%
5%
10%
15%
20%
25%
87654321
Source: IPPR calculations using Eurostat 2013b Note: One broad occupational group, agricultural workers, has been excluded due to low sample sizes.
Looking forward, it is likely that the trend in occupational change that has prevailed over the past decade – a shrinking middle accompanied by growth at both the bottom and the top ends of the skill distribution – will continue (Dolphin et al 2014). This is concerning, as it may have an impact on progression rates going forward, as the shrinking middle will limit the opportunities for those in the lowest-skilled occupations to advance in work.
However, as we noted earlier, these patterns of occupational change will not necessarily dampen progression patterns – business may adapt to a lack of labour supply from those occupations they traditionally recruited from. They can do this in one of three ways: by recruiting more workers from overseas; by recruiting from lower-skilled occupations; or by working with the education and training system to ensure that more people entering the labour market are equipped with the knowledge and experience necessary to move straight into higher-skilled occupations.
Furthermore, analysing net changes in occupational shares, as we have done, does not account for the large number of workers who retire each year, leaving vacant roles which need to be filled without pushing up net demand for workers. This ‘replacement demand’ is significant, and often pulls in the opposite direction to net demand. CEDEFOP, who monitor trends in the demand for skills across the EU, actually forecast

IPPR | Employee progression in European labour markets13
positive gross demand for occupations in the middle of the occupational distribution in many European countries over the next 10 years (CEDEFOP 2010).
2.3 Industrial structure Different sectors in the economy have diverse occupational profiles. Retail and wholesale businesses, for example, are characterised by relatively large pools of low-skilled, low-paid workers, and a far smaller number of roles in managerial or professional occupations, compared to other sectors such as manufacturing and business services. In purely quantitative terms, progression within retail is therefore less likely than it is in other sectors. If these patterns are true across countries, then the share of a nation’s economy that is accounted for by these ‘low-skilled’ sectors can have an impact on the national occupational structure and therefore on aggregate levels of progression across the economy.
To illustrate this point, figure 2.7 shows the 2013 occupational distribution in the manufacturing and utilities, retail and hospitality, and business services sectors in Belgium, Spain, France and the UK. These sectors account for around half of total employment in each of these countries. Of the remaining half, between a quarter and a third is accounted for by public services, including education and health, and the remainder is split fairly equally between construction, other services, and transport and communications (Eurostat 2014c).
Figure 2.7Occupational distribution in manufacturing and utilities, retail and wholesale, and business services sectors in Belgium, Spain, France and the UK, 2013Space b/w right edge of x-axis
text and left edge of graph
Low Medium High
0%10%20%30%40%50%60%70%80%90%
100%
UKFranceSpainBelgium
Manufacturing/utilities
0%10%20%30%40%50%60%70%80%90%
100%
UKFranceSpainBelgium
Retail/hospitality
UKFranceSpainBelgium
Business services
0%10%20%30%40%50%60%70%80%90%
100%
Source: Eurostat 2014c Note: Occupational groups are calculated by combining ISCO-88 groups 1–3 (high-skilled), groups 6–8 and 4 (mid-skilled) and groups 5 and 9 (low-skilled); see the appendix.

IPPR | Employee progression in European labour markets14
Generally, a similar occupational distribution holds in each sector across countries, with low-skilled jobs representing over 50 per cent of employment in retail, high-skilled jobs accounting for a similar share of those in business services, and mid-skilled occupations comprising the largest grouping in manufacturing (ibid).
However, there are important differences between the same sectors in different countries. In the UK and France, mid-skilled work accounts for 45 per cent of employment in the manufacturing and utilities sector employment, whereas the same figures are 57 per cent in Belgium and 63 per cent in Spain. The retail and wholesale sector also accounts for a greater proportion of mid-skilled positions in Belgium than it does in the other three countries (ibid).
What this tells us is that it is not just the industrial mix of a given country that determines the occupational structure, and therefore opportunities for progression: variations in the structure of businesses – including the sub-sector make-up of industries, as well as differences in the business models adopted by firms in a given industry – are also important.
2.4 Education and training systemsWhile individuals participate in, and employers provide, training opportunities for a variety of reasons, lifelong learning, education and training beyond initial compulsory and post-compulsory education is associated with career progression. For example, Jenkins et al (2003), using UK data, found that lifelong learning is linked to positive employment effects and, when it is used to attain a formal higher-level qualification such as a degree, has an impact on individuals’ wages (though little evidence was found of a general impact on wages from lifelong learning). Similar UK research (Blanden et al 2012), which used a different data source, found that women do gain an earnings return from lifelong learning, in the region of 10 per cent of hourly wages. However, for men any effect on subsequent earnings is cancelled out once account is taken of the fact that those who undertake lifelong learning tend to have higher qualifications in the first place (ibid).
Rates of participation in lifelong learning and training vary considerably between countries. Figure 2.8 demonstrates that the Nordic countries have among the highest participation rates, with 25 per cent or more of the working-age population engaged in lifelong learning (slightly less in Norway). At 3 per cent, Slovakia, Greece and Hungary have the lowest rates. The proportion of employers that offer training opportunities to their staff also differs significantly across countries (see figure 2.9).
It is important not to overstate the link between lifelong learning and an individual’s subsequent chances of progression. Firstly, some in-work learning, such as induction training, is designed to teach individuals how to carry out their current job well, or to comply with corporate policy or regulatory requirements. It is unclear whether these types of training materially increase individuals’ promotion or progression prospects. Still, a good deal of training carried out within firms is linked to the acquisition of new skills, or with updating and refreshing existing skills, and so puts workers in good stead to move on in work.
When considering subsequent career progression, the distinction between general and vocational education is an important one. It has been widely argued that good vocational training does a better job of matching those with secondary-level educations to jobs than general education at a similar level does (Thompson 2013). This is because the skills acquired are more directly relevant to employers’ needs, and because models of vocational education such as the dual apprenticeship, which is most prevalent in Germany and Austria, foster close links between learners and individual employers (ibid).

IPPR | Employee progression in European labour markets15
Figure 2.8Proportion of 25–64 year-olds participating in lifelong learning in European countries, 2013
0%
5%
10%
15%
20%
25%
30%
35%
Denmark
Switzerl
and
Sweden
Icelan
d
Finlan
d
Norway
Fran
ce
Netherl
andsUK
Luxe
mbour
g
Austria
Estonia
Sloven
iaSpa
in
EU-28
Portug
al
Czech
Rep
.
German
y
Irelan
d
BelgiumIta
ly
Poland
Hunga
ry
Greece
Slovak
ia
Source: Eurostat 2014d Note: ‘participation’ is here defined as attendance over the last four weeks.
Figure 2.9Proportion of employers offering continuing vocational training in European countries, 2010
0%
10%
20%
30%
40%
50%
60%
70%
80%
90%
100%
Norway
Sweden
Denmark
Austria
Belgium
Fran
ceSpa
in
Netherl
ands
Finlan
d
Luxe
mbour
g
Czech
Rep
.
German
yUK
Estonia
EU28
Slovak
iaIta
ly
Portug
al
Sloven
ia
Hunga
ry
Greece
Poland
Source: Eurostat 2014d

IPPR | Employee progression in European labour markets16
However, recent research that looks at the impact of vocational versus academic education over the life-course has discovered that while this may be true at the point of labour-market entry, over the life-course the returns of vocational learning may be less than those of an academic education. Using cross-country data, Hanushek et al (2011) found that a vocational education reduced an individual’s chances of being employed in later life. They suggested that academic study may better prepare individuals to be adaptable and to change occupations, which is of particular importance given the shifts in Europe’s occupational structure over recent decades.
2.5 Promotion opportunities within firmsFigure 2.10 provides some qualitative evidence on individuals’ own perceptions of progression opportunities in their current jobs. The fifth round of the European Social Survey, carried out in 2010, asked employees across Europe whether they perceived their current job as having good opportunities for advancement. The answers varied considerably between countries, and fit with our earlier findings regarding how progression varies between countries. In Belgium, for example, more than 50 per cent of workers either agreed or agreed strongly with the statement, ‘My current job has good opportunities for advancement’, and similarly high rates were found in the Netherlands and the UK – all countries that performed well in our rankings of occupational progression. The lowest rates were observed in Eastern Europe, although France and Germany also performed poorly: in these countries, fewer than 30 per cent of employees agreed with the statement.
Figure 2.10Proportion of employees agreeing with the statement, ‘My current job has good opportunities for advancement’, in selected European countries, 2010
Agree strongly Agree Neither agree nor disagree Disagree Disagree strongly
0%
10%
20%
30%
40%
50%
60%
70%
80%
90%
100%
Estonia
Belgium
Netherl
andsUK
Sweden
Greece
Spain
Cypru
s
Finlan
d
Norway
Portug
al
German
y
Bulgari
a
Fran
ce
Poland
Lithu
ania
Slovak
ia
Hunga
ry
Czech
Rep
.
Source: IPPR calculations using European Social Survey (2014)

IPPR | Employee progression in European labour markets17
The importance of employers providing progression routes is confirmed when we examine the ways in which workers progress. Using data drawn from the EU-SILC, we split those who had progressed up the occupational distribution into two groups: those who progress by switching employers, and those who do so while remaining with the same employer.
Figure 2.11 shows, for a selection of countries, the proportion of moves up the occupational distribution that are associated with a change in employer. In the Netherlands, more than half of occupational moves are associated with a change in employer, versus fewer than 10 per cent in Belgium. The availability of promotion opportunities may be an important factor. Belgium, for example, has high levels of overall occupational progression, but a relatively small proportion of this progression is associated with a change in employer. Data from the Organisation for Economic Co-operation and Development (OECD) suggests that Belgians tend to stay in their jobs for longer: a study of job characteristics in the EU found that Belgium had the third-highest average job tenure among the 15 European countries surveyed (OECD 2007). This may be linked to the promotion opportunities (see figure 2.10) and greater occupational progression within firms (figure 2.11) available to Belgian employees.
Figure 2.11Proportion of workers progressing via changing employers (as a percentage of all moving to a higher-skilled occupation), in selected European countries, 2004–2011
0%
10%
20%
30%
40%
50%
60%
Nether
lands
Luxe
mbo
urg
Spain
Poland
Fran
ceUKLa
tvia
Estonia
Finlan
d
Portu
gal
Czech
Rep
.
Belgium
Source: IPPR calculations using Eurostat 2013a and 2013b
ConclusionOpportunities for occupational progression are important in terms of both raising individual and household living standards, and meeting skills needs. It appears that most workers progress in a linear fashion, moving from the bottom to the middle of the skill distribution and then on to highly-skilled employment; relatively few are able to move directly from a low-skilled to a high-skilled job.
This finding is especially important given the changes to labour markets that are currently taking place in Europe. The number of mid-skilled occupations is shrinking, potentially limiting future rates of progression. As a result, employers – particular those

IPPR | Employee progression in European labour markets18
based in countries with relatively low rates of participation in training within firms – may need to adjust how they fill highly-skilled vacancies in order to ensure a healthy supply of skilled workers.
Given the prevalence of mid-skilled jobs in some sectors, particularly manufacturing, the industrial structure of an economy does determine the availability of progression opportunities to an extent. However, even within sectors we observe differences in the occupational distribution across countries. This demonstrates that other factors – and particularly rates of adult training and the structure of progression within individual firms – are also important.

IPPR | Employee progression in European labour markets19
3. EARNINGS PROGRESSION
3.1 Earnings deciles and earnings groupsOver recent decades, income inequality has increased throughout the developed world. In Europe, the Gini coefficient – the most commonly used measure of inequality – increased between the mid- 1980s and the onset of the eurozone crisis in 2008 (Fredriksen 2012). This rise in inequality has been driven by several factors, including lowered taxation on high incomes, the weakening bargaining power of workers, and the impact of globalisation and the shift towards a service economy (ibid). The latest available data indicates that, across the EU28 group of countries, the richest 20 per cent have incomes 5.1 times greater than the poorest 20 per cent (Eurostat 2014b).7
Since employment earnings are a key determinant of household disposable incomes, the ability of workers to increase their earnings over time is important. While a high rate of earnings progression does not necessarily reduce or eliminate inequality, it does at least imply mobility within the income distribution over the life-course, which is preferable to large sections of the employed being stuck on low earnings for considerable periods of time.
In order to measure how earnings progression varies across Europe using the EU-SILC for the years 2004–2011, we have used a measure of full-year, full-time employee earnings. While it would be preferable to compare hourly pay progression, as it removes the effect of hours worked on total earnings, such longitudinal data does not exist on a comparable basis for European countries.8 Figure 3.1 shows the initial findings of this calculation. By this measure, the highest rates of earnings progression are observed in Lithuania, Latvia and Bulgaria, where more than 40 per cent of continuously employed full-time workers experienced an improvement in their position in the earnings distribution over a four-year period.
Spain and Italy also showed relatively high levels of earnings progression, which is interesting given the very weak performance of their labour markets in recent years. In these three countries, just over a third of full-time, full-year workers were able to progress over a four-year period, which suggests that there are relatively good employment prospects for established workers in each of them. However, given that we are only counting those who have managed to secure continuous employment on a full-time, full-year basis, this excludes those with a more marginal attachment to the workforce, such as those on temporary contracts, and those working part-time or irregular hours. This is a sizable and important group in southern European economies, as we will discuss in the next section.
We found that the weakest performers in terms of earnings progression were Finland, Luxembourg and the Netherlands, where between 20 and 26 per cent of full-time, full-year employees progressed into a higher earnings decile.
7 Measured as a population-weighted average using equivalised disposable income. Data refers to 2012.8 The EU-SILC records various components of annual income, including earnings, and also tells us
the employment activity of individuals for each month of the year. In our calculations we took those who were employed full-time in each of the 12 months and reported employee annual earnings for both the first and last years in which they were surveyed, and then measured whether they had moved into a higher decile of full-time, full-year earnings within their country of residence.

IPPR | Employee progression in European labour markets20
Figure 3.1Proportion of full-time, full-year workers progressing to a higher earnings decile, in selected European countries, 2004–2011
0%
5%
10%
15%
20%
25%
30%
35%
40%
45%
50%
Bulgari
aLa
tvia
Lithu
ania
Poland
Belgium
Estonia
Spain
Italy
Hunga
ry
Czech
Rep
.
Fran
ce
Slovak
ia
Portug
al
Roman
iaUK
Greece
Cypru
s
Norway
Sweden
Netherl
ands
Luxe
mbour
g
Finlan
d
Netherl
ands
Luxe
mbour
g
Finlan
d
Source: IPPR calculations using Eurostat 2013a. Note: Includes those who were full year, full-time employees in both waves one and four of each cohort of the EU-SILC (from 2004–2007 to 2008–2011).
If we group earnings deciles into three categories – low (the bottom three deciles), medium (the middle four deciles), and high (the top three deciles), we find that the rate of progression from the bottom of the earnings distribution to the middle tends to be higher than progression between other earnings groups (see figure 3.2). Furthermore, rates of progression from the middle to the top of the earnings distribution are also higher than those for the bottom to the top, a pattern similar to that observed of occupational groups in the previous section (see figure 2.2). Again, these patterns vary in scale along lines similar to the previous chart, but with progression from the bottom to the middle much higher than the other two upward transition patterns. This is most apparent in Finland, Norway and Latvia, where over 60 per cent of those in the bottom earnings group moved to the middle, but only around one in five of those in the middle moved to the top, and 10 per cent or fewer moved from the bottom to the top. This perhaps implies that progression slows down for most individuals once they reach the middle of the earnings distribution.
Research from the UK which focusses specifically on low-skilled workers has found that progression in terms of promotion opportunities does not necessarily translate into significantly higher wages: employees moving into supervisory positions only saw their earnings increase marginally, despite the often considerable extra responsibilities and stress they encountered in the new position (D’Arcy and Hurrell 2014).
Comparing our broader findings illustrated in the above two charts with those for occupations described in the previous section, we find that earnings progression in terms of deciles occurs at a faster rate than occupational progression. For example, 30 per cent of continuously employed workers in the UK moved to a higher earnings decile over a four-year period (figure 3.1), but only 15 per cent moved into a higher-skilled occupation. This suggests that many are able to increase their earnings in the same or similarly-skilled jobs, without having to move up into a middle- or highly-skilled position.

IPPR | Employee progression in European labour markets21
Figure 3.2Rates of progression (%) across earnings groups,* in selected European countries, 2004–2011
0%
10%
20%
30%
40%
50%
60%
70%
80%
Latvi
a
Norway
Finlan
dSpa
in
Belgium
Netherl
andsIta
ly
Hunga
ry
Fran
ce
Bulgari
a
Sweden
Poland
Lithu
aniaUK
Greece
Estonia
Slovak
ia
Portug
al
Czech
Rep
.
Roman
ia
Low to middle
Low to high
Middle to high
Source: IPPR calculations using Eurostat 2013a. Note: Includes those who were full-year, full-time employees in both waves one and four of each cohort of the EU-SILC (from 2004–2007 to 2008–2011). *The three earnings groups shown are ‘low’ (which consists of the bottom three earnings deciles), ‘medium’ (the middle four deciles), and high (the top three deciles).
3.2 Low payAside from pay progression in general, a specific labour market issue relating to earnings is low pay. Although its incidence varies across countries, low pay is endemic throughout Europe. The standard definition of low pay is hourly earnings that are less than two-thirds of the national median. However, because of the limitations in data availability outlined above, calculating and comparing hourly earnings across Europe is difficult. Most comparative studies on low pay in Europe therefore use a different definition: instead of hourly pay, two-thirds of median annual income is used as a threshold below which individuals are identified as being low paid. The measure of median annual income is usually derived from the income of all employees, or from those that are full-time, full-year workers. We have used the latter definition for this paper. In 2007, between 10 and 25 per cent of workers in most EU countries fell below this full-time, full-year low-pay threshold (although rates of low pay in both Lithuania and Luxembourg were slightly higher) (Marx and Nolan 2012).
We calculated the proportion of continuously employed full-year, full-time workers who were low-paid in wave one of the survey that had escaped low pay by wave four (see figure 3.3). By this measure, we found the highest rates of progression in Belgium, Sweden and Norway, where more than 65 per cent left low pay. The lowest rates of escape from low pay – less than 40 per cent of workers – were in Luxembourg, the Netherlands, Cyprus, Lithuania and the UK.

IPPR | Employee progression in European labour markets22
Figure 3.3Progression rates (%) out of low pay among full-year, full-time workers in selected European countries, 2004–2011
0%
10%
20%
30%
40%
50%
60%
70%
80%
Belgium
Sweden
Norway
Slovak
iaSpa
in
Portug
al
Bulgari
a
Greece
Fran
ce
PolandIta
ly
Hunga
ry
Finlan
d
Czech
Rep
.
Latvi
a
Roman
ia
Estonia
Netherl
andsUK
Lithu
ania
Cypru
sLu
x.
Source: IPPR calculations using Eurostat 2013a. Note: Includes those who were full-year, full-time employees in both year one and year four of the EU-SILC. ‘Low pay’ was defined in each country as two thirds of median earnings for full-year, full-time employees.
ConclusionMobility across the earnings distribution and out of low pay is important, as it mitigates the effects of inequality and affords families the opportunity to escape from working poverty. Our findings indicate high levels of mobility across the pay distribution for workers employed on a full-time basis. Particularly encouraging is the high rate of movement from the bottom three earnings deciles to the middle of the distribution. However, further mobility beyond that point is noticeably curtailed: the rate of progression from the middle to the top of the distribution is half that of bottom-to-middle progression in many countries.
Earnings mobility is ultimately linked to the other measures of progression explored in this paper – workers gain higher incomes by moving up the career ladder to a higher-skilled position, increasing their hours or finding a permanent position. However, we have found that rates of earnings progression are higher than rates of occupational progression in most countries, which suggests that many employees are able to advance their position in the earnings distribution without moving into a higher-skilled occupation.
IPPR | Employee progression in European labour markets23
4. HOURS AND CONTRACT PROGRESSION
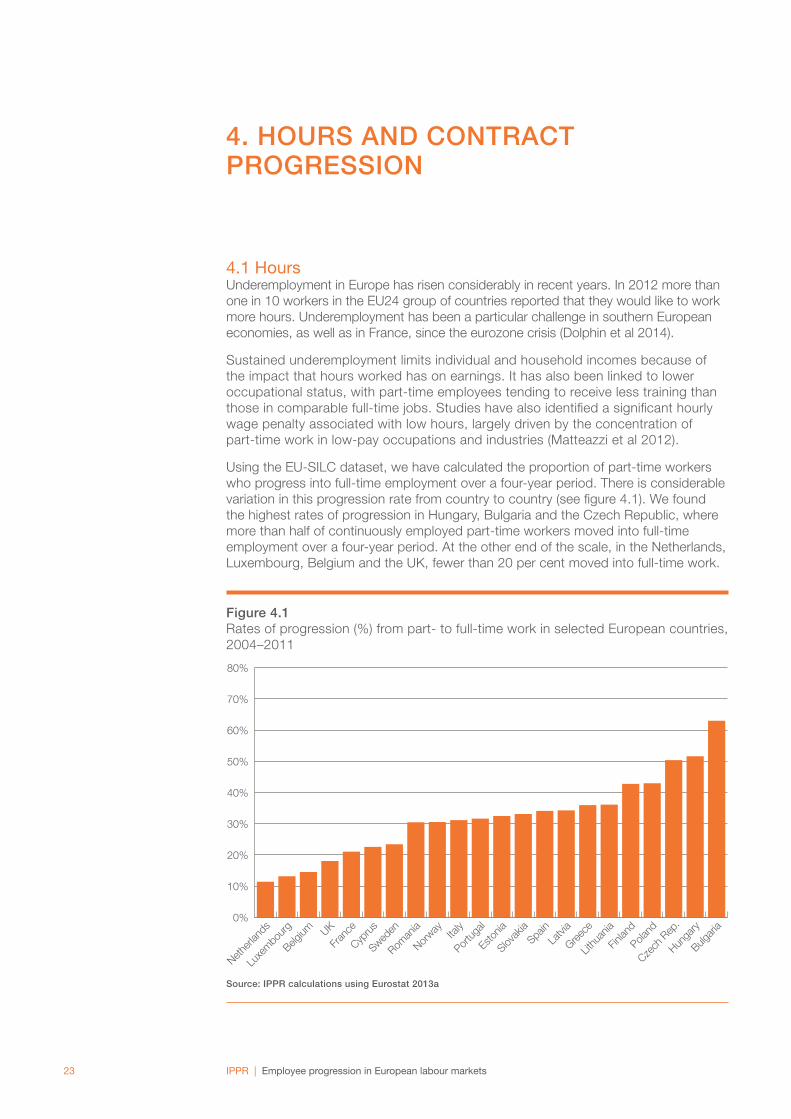
4.1 HoursUnderemployment in Europe has risen considerably in recent years. In 2012 more than one in 10 workers in the EU24 group of countries reported that they would like to work more hours. Underemployment has been a particular challenge in southern European economies, as well as in France, since the eurozone crisis (Dolphin et al 2014).
Sustained underemployment limits individual and household incomes because of the impact that hours worked has on earnings. It has also been linked to lower occupational status, with part-time employees tending to receive less training than those in comparable full-time jobs. Studies have also identified a significant hourly wage penalty associated with low hours, largely driven by the concentration of part-time work in low-pay occupations and industries (Matteazzi et al 2012).
Using the EU-SILC dataset, we have calculated the proportion of part-time workers who progress into full-time employment over a four-year period. There is considerable variation in this progression rate from country to country (see figure 4.1). We found the highest rates of progression in Hungary, Bulgaria and the Czech Republic, where more than half of continuously employed part-time workers moved into full-time employment over a four-year period. At the other end of the scale, in the Netherlands, Luxembourg, Belgium and the UK, fewer than 20 per cent moved into full-time work.
Figure 4.1Rates of progression (%) from part- to full-time work in selected European countries, 2004–2011
0%
10%
20%
30%
40%
50%
60%
70%
80%
Bulgari
a
Hunga
ry
Czech
Rep
.
Poland
Finlan
d
Lithu
ania
Greece
Latvi
aSpa
in
Slovak
ia
Estonia
Portug
alIta
ly
Norway
Roman
ia
Sweden
Cypru
s
Fran
ceUK
Belgium
Luxe
mbour
g
Netherl
ands
Source: IPPR calculations using Eurostat 2013a

IPPR | Employee progression in European labour markets24
The low rate of hours progression seen in countries like the Netherlands and the UK is linked to the prevalence of part-time work within the structure of employment. In the UK a quarter of workers are part-time, as are half of workers in the Netherlands – the highest rate in the EU (see figure 4.2). This compares to less than 7 per cent in the Czech Republic, Hungary and Slovakia (Eurostat 2014c).
Figure 4.2 Part-time workers as a proportion (%) of total employment, 2013
0%
10%
20%
30%
40%
50%
60%
Netherl
ands
Switzerl
and
Norway
German
y
AustriaUK
Sweden
Denmark
Belgium
Irelan
d
Icelan
dEU28
Luxe
mbour
g
Fran
ceItaly
Spain
Finlan
d
Portug
al
Sloven
ia
Estonia
Greece
Poland
Hunga
ry
Czech
Rep
.
Slovak
ia
Source: Eurostat 2014c
Generally, the highest rates of part-time employment are found in northern and western European economies, and the lowest in the south and east (see figure 5.2). This is linked to the more inclusive structure of employment in northern and western Europe – particularly higher rates of employment among women, which are often associated with more part-time work since women generally face greater family care commitments.
This does not necessarily mean that the prevalence of part-time employment among women in northern and western Europe is entirely benign – it also suggests that the available assistance for balancing work and care is generally not sufficient to support full-time work. For example, in the UK publicly provided childcare which is free at the point of use is only available for children of particular ages, and for 15 hours a week for only a portion of the year. However, the prevalence of part-time employment it is also a reflection of individual and societal attitudes towards time spent within the labour market versus providing care, with many workers choosing part-time employment either out of preference or because of a lack of other flexible work options.
These patterns are reflected in rates of progression from part- to full-time work, which vary by gender. Other than in eastern European countries, hours progression rates are higher for men than for women (see figure 4.3).

IPPR | Employee progression in European labour markets25
Figure 4.3Rates of progression from part- to full-time work, by gender, for selected European countries, 2004–2011
0%
10%
20%
30%
40%
50%
60%
70%
Bulgari
a
Czech
Rep
.
Spain
Hunga
ry
Poland
Slovak
iaIta
ly
Greece
Portug
al
Finlan
d
Lithu
ania
Roman
ia
Norway
Luxe
mbour
g
SwedenUK
Fran
ceLa
tvia
Estonia
Netherl
ands
Belgium
Cypru
s
Male
Female
Source: IPPR calculations using Eurostat 2013a
The structure of labour market institutions, particularly welfare systems, also influences both the prevalence of part-time work and individuals’ ability to progress to full-time hours. A combination of the withdrawal of in-work benefits and the payment of employee social security contributions and income tax can often mean that workers face a high marginal effective tax rate on extra hours worked, especially when they are on relatively low earnings and eligible for family benefits (OECD 2014). There are other institutional incentives to remain on low hours in some countries. In Germany, for instance, the specific form of employment referred to as ‘mini-jobs’ allows a second earner to work on low hours and earnings while enjoying the health insurance coverage of a full-time partner, but this is withdrawn should they work longer hours or gain higher earnings (Hufner and Klein 2012). In the UK some out-of-work benefits allow claimants to work a low number of hours without losing eligibility, which can act to limit increases in hours.
4.2 Temporary employmentNon-permanent employment is increasingly widespread in European labour markets, and, as noted in the introduction to this paper, the proportion of workers employed on a temporary basis has been rising for many years, both before and since the economic crisis.
The debate about temporary contracts in Europe largely centres on the extent to which they function as ‘stepping-stones’ into permanent positions, rather than as a peripheral labour market in which many workers are stuck cycling between short-term positions. Particularly for those transitioning into work either from the education system or out of unemployment or economic inactivity, temporary employment provides experience of a particular occupation and of work in general, and so aids any subsequent search for a permanent position. On the other hand, repeated spells of temporary employment may act as a negative signal to potential

IPPR | Employee progression in European labour markets26
employers, and those employed on a non-permanent basis are generally less likely to receive employer-sponsored training (OECD 2014).
Mirroring our analysis of part-time work, we calculated the proportion of continuously employed workers who were employed on a temporary basis in the first year of the EU-SILC survey, but had moved to a permanent position by its fourth year. Figure 4.4 demonstrates that the fastest rates of progression from temporary to permanent contracts are found in eastern and northern European economies, with more than half progressing in this way in Sweden, Norway, Lithuania and Romania, compared with a third or lower in France, Greece and the Netherlands. Given that most temporary contracts span periods of a year or less, this suggests that in many countries either a majority or a substantial minority of the temporarily employed are stuck cycling between non-permanent positions.
Figure 4.4Rates of progression (%) from temporary to permanent contracts in selected European countries, 2004–2011
0%
10%
20%
30%
40%
50%
60%
70%
80%
Roman
ia
Lithu
ania
Bulgari
a
Norway
Sweden
Finlan
dLa
tvia
Luxe
mbour
g
Estonia
Belgium
Slovak
ia
Czech
Rep
.UK
Hunga
ryIta
ly
Poland
Portug
al
Spain
Cypru
s
Netherl
ands
Greece
Fran
ce
Source: IPPR calculations using Eurostat 2013a
A clue as to why rates of progression from temporary to permanent positions vary to the extent that they do is the differential treatment of permanent and temporary staff within the employment laws of particular countries. In the UK, for example, neither permanent nor temporary contracts offer significant protections to workers in the event that they are made redundant or laid off. By contrast, in Spanish employment law, for example, permanent workers have traditionally enjoyed a high level of protection. This is true of most southern European countries, and it has led employers in the region to build flexibility into their workforce by making greater use of temporary contracts. In those countries where protections are very low for both permanent and temporary employees, such as the UK, there is less incentive for employers to make use of temporary contracts. A recent study by the OECD which looked at this issue found that temporary employees perceived greater job insecurity in those countries with either strict employment protection legislation for both types of position, or lax protection for temporary workers but strict regulation of permanent contracts (OECD 2014).

IPPR | Employee progression in European labour markets27
ConclusionThe increasing prevalence of both part-time work and temporary contracts is a sign of rising economic insecurity, and of the increasingly inclusive labour markets in most, but not all, European countries.
Part-time employment is most widespread in those countries where the overall employment rate tends to be higher. While this is a strength of these economies, in many of them more needs to be done to offer flexible work opportunities and support for care-giving so that workers have greater choice over how many hours they can work. We found that rates of progression from part- to full-time work are very low in some of these countries, particularly the Netherlands and the UK. Attention needs to be paid to how the number of hours worked interacts with the tax and benefit system – it must be ensured that some part-time workers, particularly second earners, do not face a disincentive to take on more hours should they want or need to earn more.
Far from being a short-lived stepping-stone to secure and stable employment, our findings suggest that many of those on temporary contracts are still in the same position three years later. While many workers welcome this arrangement, many are stuck in a cycle of temporary contracts and an ever-present risk of worklessness. While recent efforts to water-down employment protection legislation in southern Europe may help to open up permanent employment to some in this group, it is just as important to provide them with greater access to training and lifelong learning opportunities.
IPPR | Employee progression in European labour markets28
5. CONCLUSION AND IMPLICATIONS
This paper has examined how rates of in-work progression have varied across Europe in recent years, and explored the individual and national-level factors that underlie these patterns. While we would expect higher rates of progression in countries that have demonstrated greater commitment to stable, secure employment and skills development – as expressed by high rates of lifelong learning and high participation in training among firms, this is not necessarily the case. Sweden and Norway, for example, score well on these measures but fare considerably worse in terms of occupational progression rates. Conversely, those countries with more insecure employment but flexible labour markets, such as the Netherlands and the UK, perform towards the middle of the pack in terms of progression. This implies that the trade-off between highly flexible labour markets and employer investment in training and lifelong learning may not have a particularly large impact on progression rates. We did find some evidence of a link between rates of progression and a country’s occupational and industrial distributions, but differences in the progression routes available within similar sectors are also important.
There are also two caveats worth mentioning. Firstly, we have not measured the proportion of workers who left employment, and some countries that have experienced considerable job losses over the period studied score fairly well on progression measures. Spain, for example, has experienced a deep economic downturn since 2008 and, consequently, a persistently high unemployment rate, but nonetheless it has outperformed many other countries on our measure of occupational progression. Since we know that the job losses in Spain were heavily concentrated in the peripheral labour market, particularly among those with temporary contracts, this surprising finding may be explained by the fact that those workers who managed to hold onto jobs were in more secure positions with better promotion prospects.
The second caveat is that there may be a trade-off between inclusive labour markets and high rates of progression. Those countries with higher employment rates will generally also have higher rates of part-time working, and many of the countries with the most inclusive labour markets, such as Sweden and Norway, perform fairly poorly on measures of progression. This may be partly due to a combination of fewer opportunities for flexible working across the occupational distribution, and high rates of employment among groups that tend to work part-time – new mothers and others with caring responsibilities, for example, and those with health conditions or disabilities that limit or constrain their hours of work. As outlined by Silim and Stirling (2014), continuing to expand opportunities for part-time working, particularly in highly skilled occupations, will allow more workers to progress to higher-skilled occupations while retaining the flexibility they need.
Looking forward, and with these caveats in mind, there are three key reasons why employers and policymakers should be concerned about current patterns of progression.
1. Supporting the skills supplyThe current dominant model of occupational progression in Europe is one of workers progressing up the skill distribution incrementally. This will need to adapt as Europe’s occupational structure continues to polarise, with numbers of low- and highly-skilled jobs increasing while positions in the middle of the

IPPR | Employee progression in European labour markets29
skill distribution continue to dwindle. Employers will need to reappraise both how they recruit into vacant highly-skilled posts, and their own internal training and progression frameworks; they must also do more to open up highly-skilled positions to a broader range of applicants by offering more flexible working arrangements.9 On the other hand, stakeholders in the education and training system, including employers and the state, will need to ensure that the qualification supply becomes better matched to demand in the labour market.
2. Providing a route out of low-skilled, low-paid workThe polarisation of occupations is related to another concerning development in European labour markets: increasing rates of low pay and working poverty both before and since the recession. This can be mitigated by strengthening in-work benefits or mandating higher minimum wages, for example. However, low pay can also be tackled by offering greater opportunities and support for in-work progression, including the provision and funding of lifelong learning opportunities for those in low-skilled jobs, who are less likely than those in higher-skilled occupations to be offered employer-sponsored training.
3. Reducing labour market insecurityBeyond rising rates of low pay, there has also been a long-term increase in rates of insecure employment across Europe, concentrated at the bottom of the labour market. Workers on temporary contracts face a higher risk of job loss, as well as other disadvantages such as little access to training and lower hourly pay. Ensuring that more temporary employees are able to transition into permanent positions is therefore important. This requires action on the part of the state to tackle the incentives that encourage employers to make greater use of temporary contracts, particularly in southern Europe’s ‘dual’ labour markets. Reducing the structural barriers faced by individuals looking to increase their hours of employment – such as insufficient support for care commitments, inflexible work arrangements and work disincentives in tax and benefit systems – will also help many workers gain both higher earnings and a more secure foothold in the labour market. Although not covered in detail here, the self-employed tend to have very low rates of participation in training, so in those countries with rising rates of self-employment, particularly the UK, more could be done to support those who work for themselves but are on low earnings to access the skills system (Hatfield 2015).
In many of the examples set out above there are excellent opportunities for countries to learn from one another. The Nordic countries have encouraging rates of lifelong learning, for example, and the very positive occupational progression rates and promotion opportunities observed in Belgium warrant closer inspection. The huge differences in progression between European countries indicate that many have room for improvement.
9 This paper will be followed by further research by IPPR, as part of the New Skills at Work programme, which will use detailed case studies to analyse how progression takes place at the level of the firm, outlining current best practice in human resources in relation to occupational progression.

IPPR | Employee progression in European labour markets30
REFERENCES
Blanden J, Buscha F, Sturgis P and Urwin P (2012) ‘Measuring the earnings return to lifelong learning in the UK’, Economics of Education Review 31(4): 501–514
The European Centre for the Development of Vocational Training [CEDEFOP] (2010) Skills Supply and Demand in Europe: Medium-term forecast up to 2020, Publications Office of the European Union
D’Arcy C and Hurrell A (2014) Escape Plan: Understanding who progresses from low pay and who gets stuck, Resolution Foundation. http://www.resolutionfoundation.org/publications/escape-plan-understanding-who-progresses-from-low-pay-and-who-gets-stuck/
Dolphin T, Gottfried G, Raikes L, Silim A and Thompson S (2014) European Jobs and Skills: A comprehensive review, IPPR. http://www.ippr.org/publications/european-jobs-and-skills-a-comprehensive-review,-2014
European Social Survey (2014) ESS5 - 2010 Documentation Report, Edition 3.1, European Social Survey Data Archive, Norwegian Social Science Data Services.
Eurostat (2013a) ‘European Union Survey on Incomes and Living Conditions Microdata, 2004–2011’. http://ec.europa.eu/eurostat/cache/metadata/en/ilc_esms.htm
Eurostat (2013b) ‘Structure of Earnings Survey Microdata, 2006’. http://ec.europa.eu/eurostat/web/microdata/structure_of_earnings_survey
Eurostat (2014a) ‘GDP up by 0.2% in the euro area and up by 0.3% in the EU28’, press release, 5 December 2014. http://ec.europa.eu/dgs/eurostat/contingency/2-05122014-AP-EN.PDF
Eurostat (2014b) ‘Income Distribution Statistics’, accessed 1 September 2014. http://ec.europa.eu/eurostat/statistics-explained/index.php?title=Income_distribution_statistics&oldid=203146
Eurostat (2014c) ‘Labour Market Database’, accessed 1 September 2014. http://ec.europa.eu/eurostat/web/euro-indicators/labour-market
Eurostat (2014d) ‘Education and Training Database’, accessed 1 September 2014. http://ec.europa.eu/eurostat/web/education-and-training/data/database
Eurostat (2015) ‘November 2014: Euro area unemployment rate at 11.5%: EU28 at 10.0%’, press release, 7 January 2015. http://ec.europa.eu/eurostat/documents/2995521/6454659/3-07012015-AP-EN.pdf/f4d2866e-0562-49f5-8f29-67e1be16f50a
Fredriksen K B (2012) ‘Income Inequality in the European Union’, OECD Economics Department working paper 952, Organisation for Economic Co-operation and Development. http://www.oecd-ilibrary.org/docserver/download/5k9bdt47q5zt.pdf?expires=1421082439&id=id&accname=guest&checksum=0C507AB81F50F6B080FFB1912CC9C123
Gallie D and Zhou Y (2013) ‘Job Control, Work Intensity, and Work Stress’, in Gallie D (ed) Economic Crisis, Quality of Work, and Social Integration: The European Experience, Oxford University Press
Gareis K, Hüsing T, Birov S, Bludova I, Schulz C and Korte W B (2014) e-Skills for Jobs in Europe: Measuring progress and moving ahead: Final report, European Commission. http://ec.europa.eu/DocsRoom/documents/4398/attachments/1/translations/en/renditions/native

IPPR | Employee progression in European labour markets31
Hanushek E A, Woessmann L and Zhang L (2011) ‘General Education, Vocational Education and Labor-Market Outcomes over the Life-Cycle’, NBER working paper 17504, National Bureau of Economic Research. http://www.nber.org/papers/w17504
Härkönen J and Bihagen E (2011) ‘Occupational Attainment and Career Progression in Sweden’, European Societies 13(3): 451–479
Hatfield I (2015) Self-employment in Europe, IPPR. http://www.ippr.org/publications/self-employment-in-europe
Hufner F and Klein C (2012) ‘The German Labour Market: Preparing for the Future’, OECD Economics Department working paper 983, Organisation for Economic Co-operation and Development
Jenkins A, Vignoles A, Wolf A and Galindo-Rueda F (2003) ‘The Determinants and Labour Market Effects of Lifelong Learning’, Applied Economics 35(16): 1711–1721
Kampelmann S and Rycx F (2011) ‘Are occupations paid what they are worth? An econometric study of occupational wage inequality and productivity’, Forschungsinstitut zur Zukunft der Arbeit (Institute for the Study of Labor)
Lam S, Ng T and Feldman D (2012) ‘The relationship between external job mobility and salary attainment across career stages’, Journal of Vocational Behaviour 80(1): 129–136
Manning A and Petrongolo B (2006) ‘The Part-time Pay Penalty for Women in Britain’, Forschungsinstitut zur Zukunft der Arbeit (Institute for the Study of Labor)
Manzoni A, Härkönen J and Mayer K (2014) ‘Moving On? A Growth-Curve Analysis of Occupational Attainment and Career Progression Patterns in West Germany’, Social Forces 92(4)
Marx I and Nolan B (2012) ‘In-Work Poverty’, GINI discussion paper 51, GINI project. http://www.gini-research.org/system/uploads/386/original/DP_51_-_Marx_Nolan.pdf?1348044753
Matteazzi E, Pailhe A and Solaz A (2012) ‘Part-time wage penalties in Europe: a matter of selection or segregation?’, ECINEQ working paper 2012–250, Society for the Study of Economic Inequality. http://www.ecineq.org/milano/WP/ECINEQ2012-250.pdf
McIntosh B, McQuaid R, Munro A and Dabir-Alai P (2012) ‘Motherhood and its impact on career progression’, Gender in Management: An International Journal 27(5)
Organisation for Economic Co-operation and Development [OECD] (2007) Economic Survey of the European Union. http://www.oecd.org/eco/surveys/economicsurveyoftheeuropeanunion2007.htm
Organisation for Economic Co-operation and Development [OECD] (2014) OECD Employment Outlook 2014. http://www.oecd-ilibrary.org/employment/oecd-employment-outlook-2014_empl_outlook-2014-en
Silim A and Stirling A (2014) Women and flexible working: Improving female employment outcomes in Europe, IPPR. http://www.ippr.org/publications/women-and-flexible-working-improving-female-employment-outcomes-in-europe
Thompson S (2013) States of uncertainty: Youth unemployment in Europe, IPPR. http://www.ippr.org/publications/states-of-uncertainty-youth-unemployment-in-europe

IPPR | Employee progression in European labour markets32
APPENDIXDEFINING OCCUPATIONAL SKILL LEVELS
In chapter 2 of this paper we presented findings on the proportion of continuously employed employees who moved into higher-skilled occupations over a four-year period. In order to do this we needed to rank occupations according to their skill level.
‘Skills’ are a complicated concept, combining several characteristics of individuals and their work. Three particularly important factors are:
• educational attainment, including qualifications gained from regular education and through professional development and lifelong learning
• general and occupationally specific labour market experience
• the content of the tasks carried out at work.
The skill level of an occupation is perhaps most related to the last of these points – we would expect the skill content of the work tasks of an architect or engineer to be higher than those of a cashier or waiter, for example. The first two are related more to an individual’s ability to be matched to jobs by demonstrating they can carry out its associated work tasks, whereas the last determines the skill level of work actually conducted on the job.
The difficulty of assessing the tasks required in a particular occupation using a survey such as the EU-SILC made it necessary to approximate the skill content of work using a different source. In order to link occupational categories to skill levels, we used data for 2006 from the EU’s Structure of Earnings Survey (Eurostat 2014b). This dataset tells us the median hourly pay of occupational groups across countries, defined using the International Standard Classification of Occupations (ISCO-88). We ranked these occupational categories within countries according to median hourly pay, giving us 27 groups for each country. We then used this to define the skill distribution of occupations, under the assumption that hourly pay is closely linked to labour productivity and therefore to human capital and skills.