employee engagement - university of south africa · page 2 fact sheet . october 2014 emploee...
TRANSCRIPT
PAGE 1
FACT SHEET . OCTOBER 2014
EMPLOYEE ENGAGEMENT .
EMPLOYEE ENGAGEMENTThis Fact Sheet looks at current gaps in employee engagement approaches; some of the theoretical background to employee engagement; considers best ways to measure it; and suggests some ideas on how to improve the state of engagement in an organisation. The Fact Sheet draws extensively from two main sources: the CIPD’S Fact Sheet on Employee Engagement and the research on which it is based; and the literature review and work to build a theoretical measurement framework and instrument by Professor Nico Martins and Hester Nienaber of UNISA.
FACT SHEETOCTObEr 2014 . NUMBER 2014/9
PAGE 2
FACT SHEET . OCTOBER 2014
EMPLOYEE ENGAGEMENT .
INTrODUCTIONEmployee Engagement is a very important concept for HR practitioners, because it is an outcome indicator which provides evidence on the health of the leadership climate and evidence of how well various components of the organisation’s processes, including HR processes, are functioning in relation to employees’ perceptions around the psychological contract between each employee and the organisation.
The impact of higher or lower levels of engagement of the workforce can be tremendous, and range in effect from productivity; customer service; innovation; cost management; and ethical behaviour (including fraud and corruption); as well as having great impact on the success or otherwise of the talent management strategy. A strong business case can be built to invest in improving employee engagement.
The theoretical concepts underlying the umbrella term “employee engagement” are complex and contested – there are many streams of academic thought, some of them conflicting. Employee engagement is also a rich field for consulting work, with most of the large global and local consultancies having their own model and consulting practice on employee engagement. The lack of consensus in these two fields – the academic and consulting – on what employee engagement actually is, how to measure it and how to develop programmes to improve it, leads to a lack of comparable benchmarking.
The SABPP will be addressing this lack of standard practice and benchmarking through developing a Professional Practice Standard on Employee Engagement over the period October 2014 through to end of 2015. Deriving from that, the SABPP will build a benchmarking database against which organisations can compare their levels of engagement.
“Always treat your employees exactly as you want them to treat your best customers.” -Stephen R. Covey
“Engaged employees stay for what they give (they like their work); disengaged employees stay for what they get (favorable job conditions, growth opportunities, job security).”-Blessing White’s The State of Employee Engagement 2008
“business and human endeavors are systems… we tend to focus on snapshots of isolated parts of the system. And wonder why our deepest problems never get solved.”- Peter Senge, author of The Fifth Discipline: The Art & Practice of the Learning Organization
PAGE 3
FACT SHEET . OCTOBER 2014
EMPLOYEE ENGAGEMENT .
2. CUrrENT GAPS IN EMPLOYEE ENGAGEMENT APPrOACHESAs mentioned in the introduction, there is a lot of work being done on employee engagement. However, a range of issues and challenges can be identified in this work, leading to some important gaps in approaches. A list of these issues and challenges includes, but is probably not limited to:
• Vastly different academic, consulting and organisational approaches to and methodologies for working with employee engagement;
• A shortage of proper research / benchmarking on what drives employee engagement;• The inability of HR departments to influence line management to take responsibility for
employee engagement;• Inadequate / conflicting / confusing definitions and the use of related terms such as employee
satisfaction / commitment / organisation climate / organisation culture / trust / work ethic;• A lack of leadership commitment to employee engagement;• Insufficient measurement instruments on employee engagement;• Poor alignment / integration of people management or HR practices which drive employee
engagement;• Uncertainty about the impact of national or regional cultures on employee engagement;• Failure to act within the organisation on employee engagement surveys.
PAGE 4
FACT SHEET . OCTOBER 2014
EMPLOYEE ENGAGEMENT .
3. THEOrIES OF EMPLOYEE ENGAGEMENTThe literature reviews of academic work on employee engagement conducted by both the CIPD1 and UNISA2 show that various theories have been advanced to the effect that employee engagement:
• May be emotional or transactional;• May be concerned with the relationship between the employee and the work itself, the team,
the immediate manager and/or the organisation;• May be a psychological state or a set of behaviours;• May be affected by the attitudes and traits of the individual employee;• May be influenced by a number of different factors within and/or external to the organisation.
The CIPD’s definition of engagement is based on the idea that engagement is a mental state which produces certain behaviours:
These definitions are both academically sound and practical in nature. Examination of the most well-known consulting models of employee engagement shows that the models are more or less compatible with these definitions. Some popular models are shown below:
The definition adopted by the UNISA study is:
“Employee engagement is being positively present during the performance of work by willingly contributing intellectual effort, experiencing positive emotions and meaningful connections to others.”
“Employee engagement refers to “engaged employees” at both the individual and organisational level, who are fully absorbed by and enthusiastic about their work, and so take positive action to further the organisation’s reputation and interests.
An organisation with ‘high’ employee engagement might therefore be expected to outperform those with ‘low’ employee engagement, all else being equal. “
Employee Engagement. CIPD Fact Sheet. Updated August 2013. Developing an employee engagement measurement instrument for a South African context. Nienaber, H., Martins, N. Submitted for publication, SA Journal of Industrial Psychology. 2014
1
2
PAGE 5
FACT SHEET . OCTOBER 2014
EMPLOYEE ENGAGEMENT .
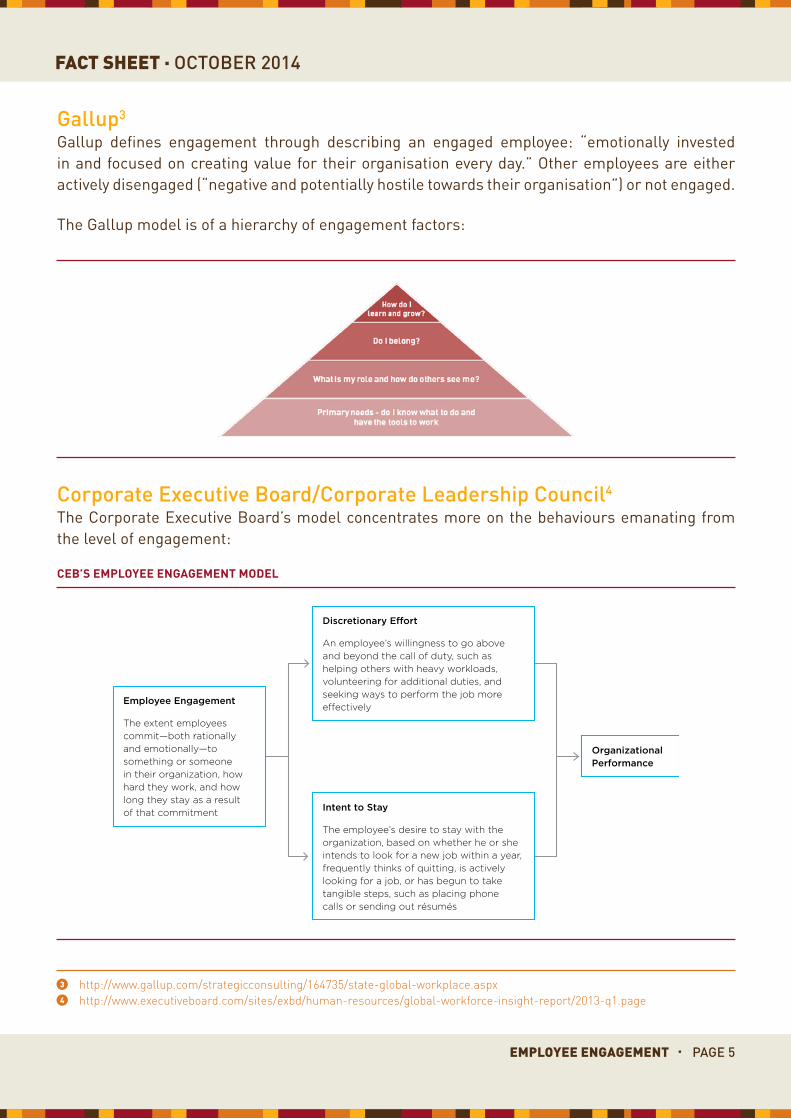
Gallup3
Gallup defines engagement through describing an engaged employee: “emotionally invested in and focused on creating value for their organisation every day.” Other employees are either actively disengaged (“negative and potentially hostile towards their organisation”) or not engaged.
The Gallup model is of a hierarchy of engagement factors:
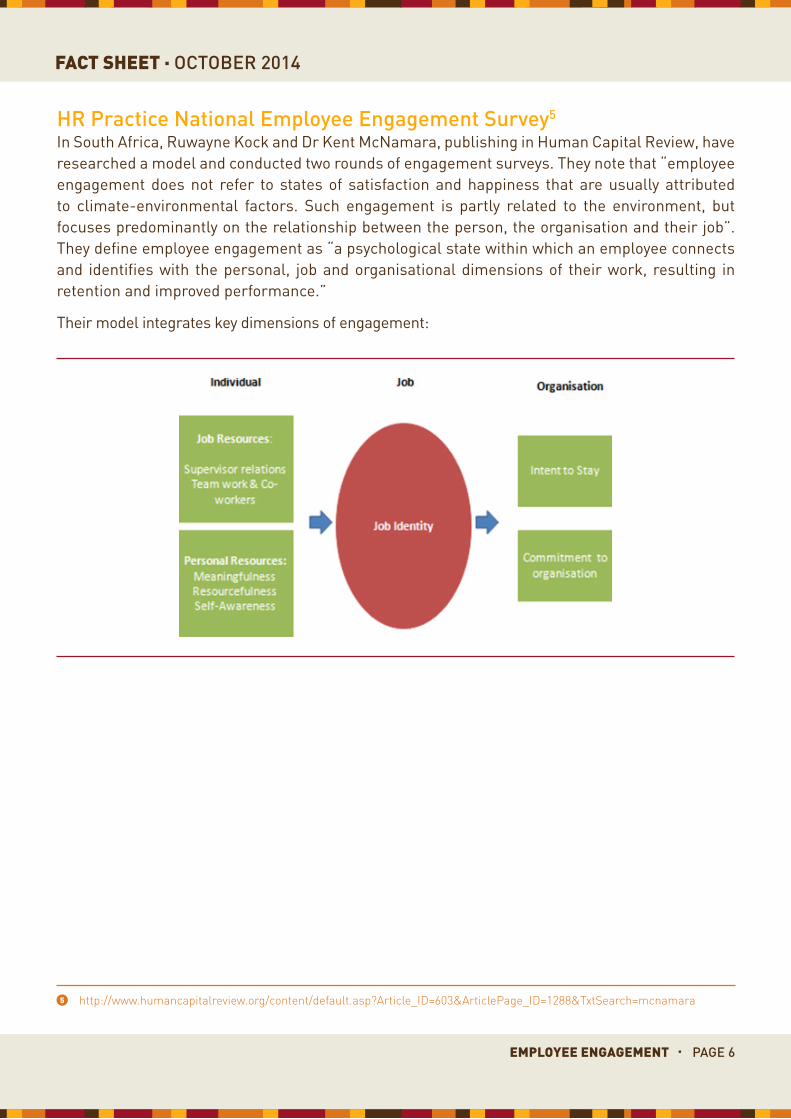
Corporate Executive Board/Corporate Leadership Council4
The Corporate Executive Board’s model concentrates more on the behaviours emanating from the level of engagement:
http://www.gallup.com/strategicconsulting/164735/state-global-workplace.aspxhttp://www.executiveboard.com/sites/exbd/human-resources/global-workforce-insight-report/2013-q1.page
3
4
CEB’s EmployEE EngagEmEnt modEl
14© 2014 CEB. All rights reserved. CLC9612114SYN
Our employee engagement model links two key talent outcomes—discretionary effort and intent to stay—to organizational performance.
■ The engagement metrics in this section of the report are based on the percentage of employees who display high or very high levels of discretionary effort and intent to stay.
Additional Insight
Visit the EngagementTopic Center for guidance on measuring and managing employee engagement at your organization.
DERF 13 0595
Catalog # CLC4853313SYN
Title BR CHRO Insight_Q1
EMPLOYEE ENGAGEMENT DRIVES PERFORMANCE
CEB’s Employee Engagement Model
Employee Engagement
The extent employees commit—both rationally and emotionally—to something or someone in their organization, how hard they work, and how long they stay as a result of that commitment
Organizational Performance
Discretionary Effort
An employee’s willingness to go above and beyond the call of duty, such as helping others with heavy workloads, volunteering for additional duties, and seeking ways to perform the job more effectively
Intent to Stay
The employee’s desire to stay with the organization, based on whether he or she intends to look for a new job within a year, frequently thinks of quitting, is actively looking for a job, or has begun to take tangible steps, such as placing phone calls or sending out résumés
Source: CEB analysis.
CO
MP
EN
SA
TIO
N
TR
EN
DS
AT
TR
ITIO
N
TR
EN
DS
EN
GA
GE
ME
NT
T
RE
ND
SA
TT
RA
CT
ION
T
RE
ND
SE
XE
CU
TIV
E
OU
TLO
OK
PAGE 6
FACT SHEET . OCTOBER 2014
EMPLOYEE ENGAGEMENT .
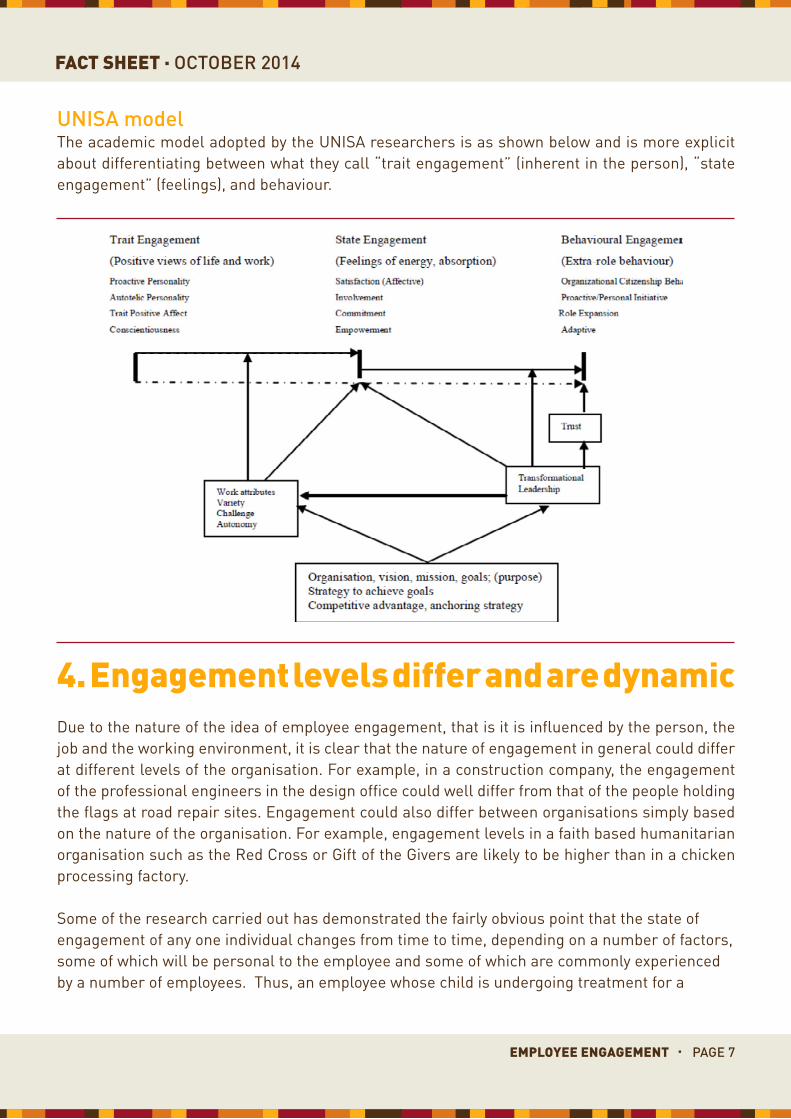
HR Practice National Employee Engagement Survey5
In South Africa, Ruwayne Kock and Dr Kent McNamara, publishing in Human Capital Review, have researched a model and conducted two rounds of engagement surveys. They note that “employee engagement does not refer to states of satisfaction and happiness that are usually attributed to climate-environmental factors. Such engagement is partly related to the environment, but focuses predominantly on the relationship between the person, the organisation and their job”. They define employee engagement as “a psychological state within which an employee connects and identifies with the personal, job and organisational dimensions of their work, resulting in retention and improved performance.”
Their model integrates key dimensions of engagement:
http://www.humancapitalreview.org/content/default.asp?Article_ID=603&ArticlePage_ID=1288&TxtSearch=mcnamara5
PAGE 7
FACT SHEET . OCTOBER 2014
EMPLOYEE ENGAGEMENT .
4. Engagement levels differ and are dynamicDue to the nature of the idea of employee engagement, that is it is influenced by the person, the job and the working environment, it is clear that the nature of engagement in general could differ at different levels of the organisation. For example, in a construction company, the engagement of the professional engineers in the design office could well differ from that of the people holding the flags at road repair sites. Engagement could also differ between organisations simply based on the nature of the organisation. For example, engagement levels in a faith based humanitarian organisation such as the Red Cross or Gift of the Givers are likely to be higher than in a chicken processing factory.
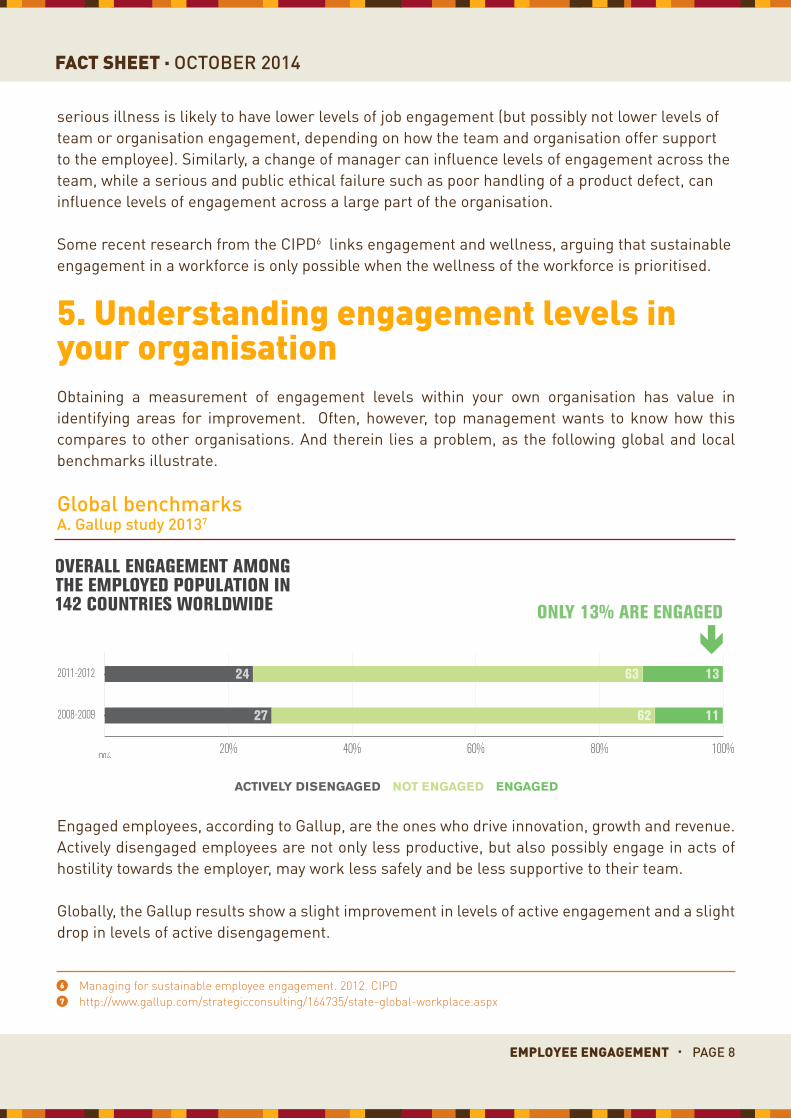
Some of the research carried out has demonstrated the fairly obvious point that the state of engagement of any one individual changes from time to time, depending on a number of factors, some of which will be personal to the employee and some of which are commonly experienced by a number of employees. Thus, an employee whose child is undergoing treatment for a
UNISA modelThe academic model adopted by the UNISA researchers is as shown below and is more explicit about differentiating between what they call “trait engagement” (inherent in the person), “state engagement” (feelings), and behaviour.
PAGE 8
FACT SHEET . OCTOBER 2014
EMPLOYEE ENGAGEMENT .
Engaged employees, according to Gallup, are the ones who drive innovation, growth and revenue. Actively disengaged employees are not only less productive, but also possibly engage in acts of hostility towards the employer, may work less safely and be less supportive to their team.
Globally, the Gallup results show a slight improvement in levels of active engagement and a slight drop in levels of active disengagement.
Managing for sustainable employee engagement. 2012. CIPDhttp://www.gallup.com/strategicconsulting/164735/state-global-workplace.aspx
serious illness is likely to have lower levels of job engagement (but possibly not lower levels of team or organisation engagement, depending on how the team and organisation offer support to the employee). Similarly, a change of manager can influence levels of engagement across the team, while a serious and public ethical failure such as poor handling of a product defect, can influence levels of engagement across a large part of the organisation.
Some recent research from the CIPD6 links engagement and wellness, arguing that sustainable engagement in a workforce is only possible when the wellness of the workforce is prioritised.
5. Understanding engagement levels in your organisationObtaining a measurement of engagement levels within your own organisation has value in identifying areas for improvement. Often, however, top management wants to know how this compares to other organisations. And therein lies a problem, as the following global and local benchmarks illustrate.
Global benchmarksA. Gallup study 20137
Vital to maintaining high-productivity workplaces is organizations’ ability to engage their employees. Gallup’s extensive research shows that employee engagement is strongly connected to business outcomes — such as productivity, profitability, and customer satisfaction — that are essential to an organization’s financial success.
To provide an outlook on employee engagement and why it matters for global organizations, for the first time in 2009 and 2010, Gallup gathered engagement results from employed workers worldwide for its 2010 State of the Global Workplace report. This current report provides an update of the previous results using data gathered in 2011 and 2012 from nearly 230,000 full-time and part-time employees in 142 countries. Gallup finds that the proportion of employees worldwide who are “engaged” in their jobs has ticked upward from 11% to 13%, while the proportion who are “actively disengaged” has fallen slightly from 27% to 24%. This slight improvement notwithstanding, low levels of engagement among global workers continue to hinder gains in economic productivity and life quality in much of the world.
Engaged employees are those who are involved in, enthusiastic about, and committed to their work and who contribute to their organization in a positive manner. Engaged employees are the ones who are most likely to drive innovation, growth, and revenue that their companies desperately need. These engaged workers build new products and services, generate new ideas, create new customers, and ultimately help spur the economy — generating more good jobs.
According to Gallup’s latest findings, 87% of workers are “not engaged” or “actively disengaged” and are emotionally disconnected from their workplaces and less likely to be productive. The proportion of actively disengaged employees has decreased from 27% to 24%. But, actively disengaged employees continue to outnumber engaged employees by nearly 2-to-1 — implying that at the global level, work is more often a source of frustration than one of fulfillment. It also means countless workplaces worldwide are less productive and less safe than they could be and are less likely to create badly needed new jobs.
actively DiSenGaGeD not enGaGeD enGaGeD
0%20% 40% 60% 80% 100%
13
11
63
62
24
272008-2009
2011-2012
overall engagement among the employed population in 142 CountrieS WorldWide only 13% are engaged
12 13W O R L D W I D E , O N LY 1 3 % O F E M P L O Y E E S A R E E N G A G E D AT W O R K
6
7
PAGE 9
FACT SHEET . OCTOBER 2014
EMPLOYEE ENGAGEMENT .
C. Towers Perrin Global Workforce Report 20129
This global study, however, shows a very different picture, with 35% of employees being highly engaged.
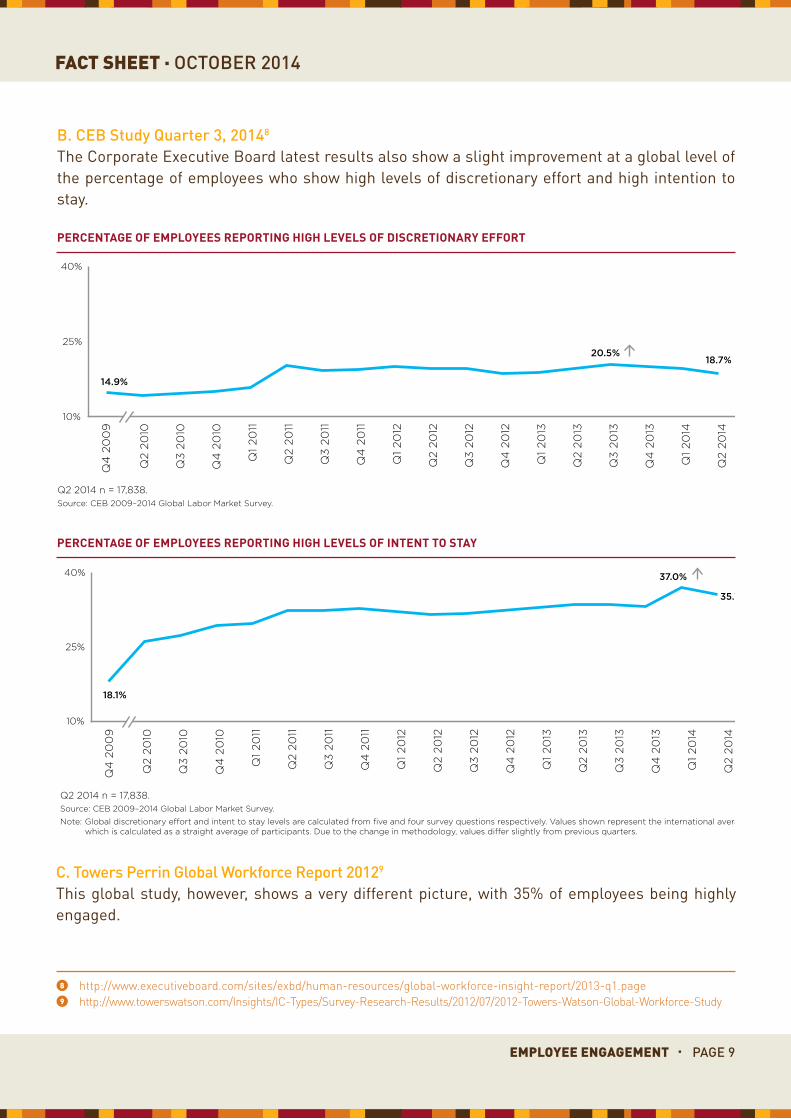
B. CEB Study Quarter 3, 20148
The Corporate Executive Board latest results also show a slight improvement at a global level of the percentage of employees who show high levels of discretionary effort and high intention to stay.
pErCEntagE of EmployEEs rEporting HigH lEvEls of disCrEtionary Effort
15© 2014 CEB. All rights reserved. CLC9612114SYN
Additional Insight
Learn more about how we can help you run a customized engagement initiative at your organization with CEB Workforce Surveys and Analytics, here. (Additional fees apply.)
Discretionary effort levels have decreased over the last year, from a high of 20.5% in Q3 2013 to 18.7% this quarter.
■ Intent-to-stay levels remain higher than they were a year ago, despite the slight drop-off in Q2, because of the dramatic increase the previous quarter.
■ Both metrics have trended positively since lows in 2009 to the current levels in 2014.
CO
MP
EN
SA
TIO
N
TR
EN
DS
AT
TR
ITIO
N
TR
EN
DS
EN
GA
GE
ME
NT
T
RE
ND
SA
TT
RA
CT
ION
T
RE
ND
SE
XE
CU
TIV
E
OU
TLO
OK
Q4
20
09
Q2
2010
Q3
2010
Q4
20
10
Q1
2011
Q2
2011
Q3
2011
Q4
20
11
Q1
2012
Q2
2012
Q3
2012
Q4
20
12
Q1
2013
Q2
2013
Q3
2013
Q4
20
13
Q1
2014
Q2
2014
10%
25%
40%
Q4
20
09
Q2
2010
Q3
2010
Q4
20
10
Q1
2011
Q2
2011
Q3
2011
Q4
20
11
Q1
2012
Q2
2012
Q3
2012
Q4
20
12
Q1
2013
Q2
2013
Q3
2013
Q4
20
13
Q1
2014
Q2
2014
10%
25%
40%
DISCRETIONARY EFFORT LEVELS ARE DECLINING
Percentage of Employees Reporting High Levels of Discretionary Effort
Percentage of Employees Reporting High Levels of Intent to Stay
35.7%
18.1%
14.9%
18.7%
40%
25%
10%
40%
25%
10%
Q2 2014 n = 17,838.Source: CEB 2009–2014 Global Labor Market Survey.
Q4
20
09
Q4
20
09
Q2
2010
Q2
2010
Q3
20
10Q
3 2
010
Q4
20
10Q
4 2
010
Q1
2011
Q1
2011
Q2
2011
Q2
2011
Q3
20
11Q
3 2
011
Q4
20
11Q
4 2
011
Q1
2012
Q1
2012
Q2
2012
Q2
2012
Q3
20
12Q
3 2
012
Q4
20
12Q
4 2
012
Q1
2013
Q1
2013
Q2
2013
Q2
2013
Q3
20
13Q
3 2
013
Q4
20
13Q
4 2
013
Q1
2014
Q2
2014
Q1
2014
Q2
2014
Q2 2014 n = 17,838.Source: CEB 2009–2014 Global Labor Market Survey.
Note: Global discretionary effort and intent to stay levels are calculated from five and four survey questions respectively. Values shown represent the international average, which is calculated as a straight average of participants. Due to the change in methodology, values differ slightly from previous quarters.
20.5%
37.0%
pErCEntagE of EmployEEs rEporting HigH lEvEls of intEnt to stay
http://www.executiveboard.com/sites/exbd/human-resources/global-workforce-insight-report/2013-q1.page http://www.towerswatson.com/Insights/IC-Types/Survey-Research-Results/2012/07/2012-Towers-Watson-Global-Workforce-Study
8
9
PAGE 10
FACT SHEET . OCTOBER 2014
EMPLOYEE ENGAGEMENT .
4 towerswatson.com
The first gap is effectively enabling workers with internal support, resources and tools, which can take a variety of forms. Think of the helpful supervisor who prioritizes and organizes work, regardless of whether the employee is in front of him or her, or 1,000 miles away working at home or in a remote office. Think of efficient technology that works (and a helpful help desk when it doesn’t). Think of a collegial work team ready to jump in to help. Or of online tools and processes that give remote or contract workers access to information and guidance to make good job-related decisions in real time.
None of this happens by magic — or simply through people’s good will. It develops as part of an organization’s culture and work environment, and must be created and continually nurtured through a focus on training, performance management, communication and visible leadership. Employee enablement is an element of the work environment that’s easy to underestimate and even ignore in flush times, but one that can drive down performance and make it difficult for employees to do their jobs effectively. It’s also an element ripe for innovation as the trends shaping the future of work begin to affect people more directly and more rapidly. Enabling large and dispersed groups of workers who come together for various, often short-lived projects, across different time zones, speaking
different languages, and with different skills, work styles and expectations requires very different tools, approaches and managerial skills than does enabling people who sit together in a common physical space.
The second gap is creating an environment that’s energizing to work in because it promotes physical, emotional and social well-being. In such an environment, you can see and feel the pulse of activity — the intense discussions, lively video- or phone conferences, the groups working a project plan on an online whiteboard in real time. There’s stress, but it’s often what we call positive stress because it’s intellectually and emotionally rewarding and exciting. Again, this kind of work experience doesn’t happen by itself or because a company tries to select people with high energy. It must also be embedded in a culture that focuses on workers’ health, safety and security, both physical and emotional. Currently, many employers are pursuing a variety of wellness efforts, typically focused on giving incentives or penalties to people who embrace healthy behaviors like exercise, good diet or effective management of a chronic illness. These are important, but to sustain energy, employers have to think beyond these core programs and embrace the notion of workplace energy on a far broader plane.
Our current study brings into sharp relief the importance of enablement and energy in maintaining high levels of performance over time. In a world where people are widely dispersed and working longer hours with fewer resources in areas requiring new skills, focusing on the well-established drivers of traditional engagement, while important, isn’t enough.
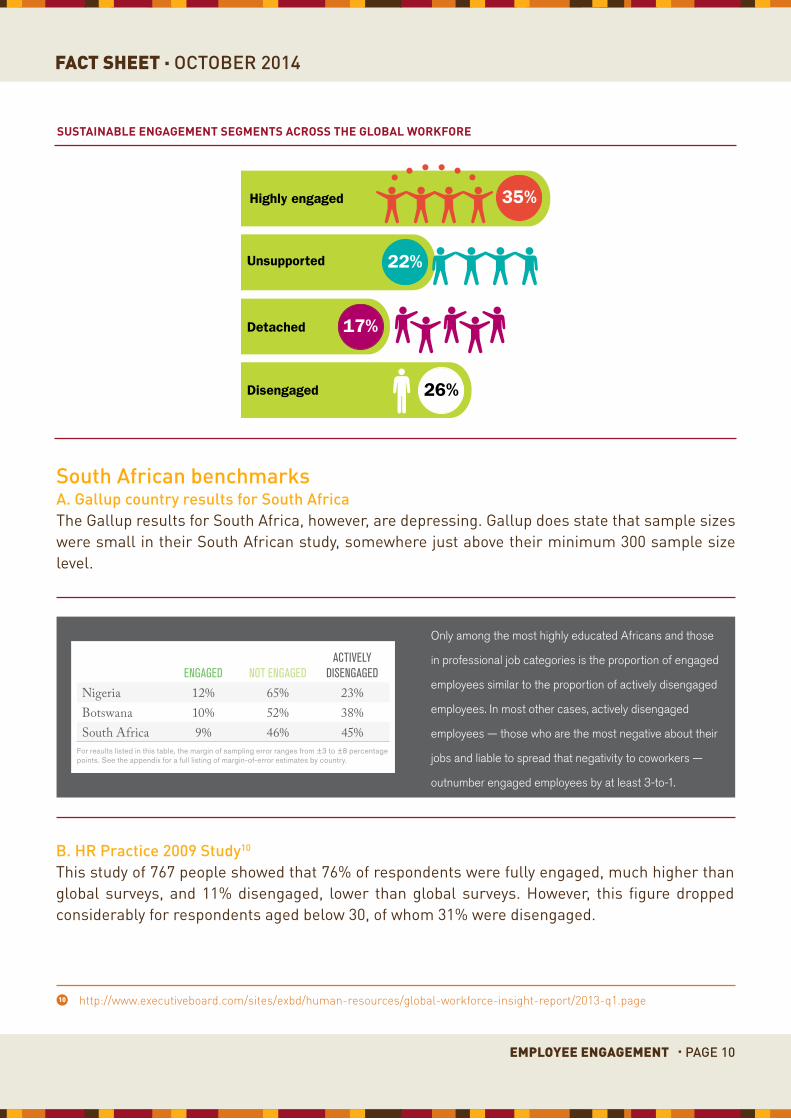
A look at how our global respondents stratify among four sustainable engagement segments is perhaps the best illustration of the extent of the challenge that employers face today. (See Inside Sustainable Engagement, page 5, for an explanation of our methodology and definitions.) With two-fifths of workers unsupported or detached, and a quarter completely disengaged, the risk to an organization’s productivity and performance goals is real.
Closing Gaps in the traditional engagement model
Highly engaged 35%
Unsupported 22%
Detached 17%
Disengaged 26%
Figure 1. Sustainable engagement segmentsacross the global workforce
sustainaBlE EngagEmEnt sEgmEnts aCross tHE gloBal workforE
South African benchmarksA. Gallup country results for South AfricaThe Gallup results for South Africa, however, are depressing. Gallup does state that sample sizes were small in their South African study, somewhere just above their minimum 300 sample size level.
EngagEd not EngagEdactivEly
disEngagEd
Nigeria 12% 65% 23%Botswana 10% 52% 38%South Africa 9% 46% 45%
For results listed in this table, the margin of sampling error ranges from ±3 to ±8 percentage points. See the appendix for a full listing of margin-of-error estimates by country.
In most sub-Saharan African countries, formal employment
for an employer is still relatively rare; many residents work
at subsistence farming or in some other form of small-
scale self-employment. Among 26 countries and territories
in sub-Saharan Africa included in Gallup’s 2011 to 2012
employee study, 19% of respondents overall indicate they
work for an employer, the lowest proportion among all
global regions. Among employees, 10% are engaged, while
57% are not engaged and 33% are actively disengaged.
The last figure is on par with the Middle East and North
Africa region for the highest in the world.
In only three countries — Botswana, Nigeria, and South
Africa — did the surveys capture enough respondents who
worked for an employer to report country-level engagement
results. South Africa has one of the highest percentages
of actively disengaged employees in the world. The mining
industry, an important source of employment in South
Africa, has been plagued by violent and destabilizing labor
unrest in recent years.
Sub-Saharan africacountries included: Benin, Botswana, Burkina Faso, Cameroon, Chad, Comoros, Congo (Brazzaville), Congo (Kinshasa), Gabon, Ghana, Guinea, Kenya, Madagascar, Malawi, Mali, Mauritania, Niger, Nigeria, Rwanda, Senegal, Somaliland (an autonomous region of Somalia), South Africa, Tanzania, Uganda, Zambia, and Zimbabwe
R E G I O N
Only among the most highly educated Africans and those
in professional job categories is the proportion of engaged
employees similar to the proportion of actively disengaged
employees. In most other cases, actively disengaged
employees — those who are the most negative about their
jobs and liable to spread that negativity to coworkers —
outnumber engaged employees by at least 3-to-1.
56
EngagEd not EngagEdactivEly
disEngagEd
Nigeria 12% 65% 23%Botswana 10% 52% 38%South Africa 9% 46% 45%
For results listed in this table, the margin of sampling error ranges from ±3 to ±8 percentage points. See the appendix for a full listing of margin-of-error estimates by country.
In most sub-Saharan African countries, formal employment
for an employer is still relatively rare; many residents work
at subsistence farming or in some other form of small-
scale self-employment. Among 26 countries and territories
in sub-Saharan Africa included in Gallup’s 2011 to 2012
employee study, 19% of respondents overall indicate they
work for an employer, the lowest proportion among all
global regions. Among employees, 10% are engaged, while
57% are not engaged and 33% are actively disengaged.
The last figure is on par with the Middle East and North
Africa region for the highest in the world.
In only three countries — Botswana, Nigeria, and South
Africa — did the surveys capture enough respondents who
worked for an employer to report country-level engagement
results. South Africa has one of the highest percentages
of actively disengaged employees in the world. The mining
industry, an important source of employment in South
Africa, has been plagued by violent and destabilizing labor
unrest in recent years.
Sub-Saharan africacountries included: Benin, Botswana, Burkina Faso, Cameroon, Chad, Comoros, Congo (Brazzaville), Congo (Kinshasa), Gabon, Ghana, Guinea, Kenya, Madagascar, Malawi, Mali, Mauritania, Niger, Nigeria, Rwanda, Senegal, Somaliland (an autonomous region of Somalia), South Africa, Tanzania, Uganda, Zambia, and Zimbabwe
R E G I O N
Only among the most highly educated Africans and those
in professional job categories is the proportion of engaged
employees similar to the proportion of actively disengaged
employees. In most other cases, actively disengaged
employees — those who are the most negative about their
jobs and liable to spread that negativity to coworkers —
outnumber engaged employees by at least 3-to-1.
56http://www.executiveboard.com/sites/exbd/human-resources/global-workforce-insight-report/2013-q1.page 10
B. HR Practice 2009 Study10 This study of 767 people showed that 76% of respondents were fully engaged, much higher than global surveys, and 11% disengaged, lower than global surveys. However, this figure dropped considerably for respondents aged below 30, of whom 31% were disengaged.
PAGE 11
FACT SHEET . OCTOBER 2014
EMPLOYEE ENGAGEMENT .
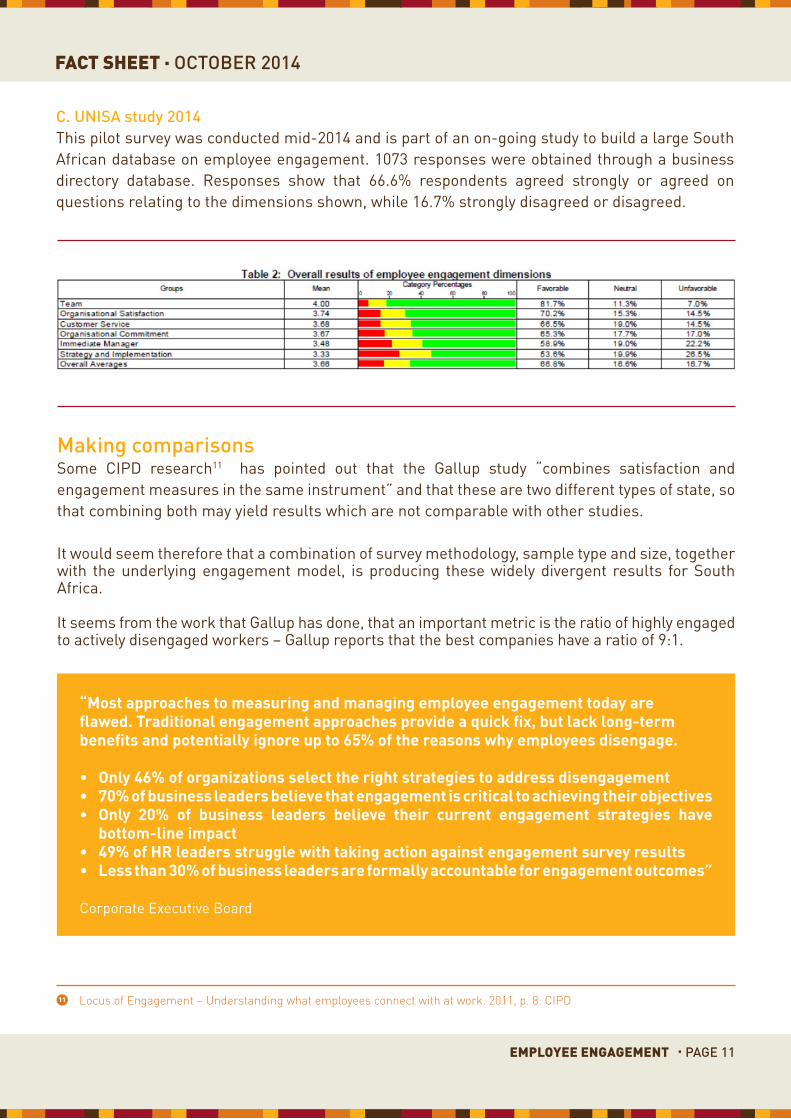
Making comparisonsSome CIPD research11 has pointed out that the Gallup study “combines satisfaction and engagement measures in the same instrument” and that these are two different types of state, so that combining both may yield results which are not comparable with other studies.
It would seem therefore that a combination of survey methodology, sample type and size, together with the underlying engagement model, is producing these widely divergent results for South Africa.
It seems from the work that Gallup has done, that an important metric is the ratio of highly engaged to actively disengaged workers – Gallup reports that the best companies have a ratio of 9:1.
“most approaches to measuring and managing employee engagement today areflawed. traditional engagement approaches provide a quick fix, but lack long-term benefits and potentially ignore up to 65% of the reasons why employees disengage.
• only 46% of organizations select the right strategies to address disengagement• 70% of business leaders believe that engagement is critical to achieving their objectives• only 20% of business leaders believe their current engagement strategies have
bottom-line impact• 49% of Hr leaders struggle with taking action against engagement survey results• less than 30% of business leaders are formally accountable for engagement outcomes”
Corporate Executive Board
C. UNISA study 2014This pilot survey was conducted mid-2014 and is part of an on-going study to build a large South African database on employee engagement. 1073 responses were obtained through a business directory database. Responses show that 66.6% respondents agreed strongly or agreed on questions relating to the dimensions shown, while 16.7% strongly disagreed or disagreed.
Locus of Engagement – Understanding what employees connect with at work. 2011, p. 8. CIPD11
PAGE 12
FACT SHEET . OCTOBER 2014
EMPLOYEE ENGAGEMENT .
Employee engagement levels in your organisation can be measured, for example by using any of the above surveys. It is recommended that a deeper understanding of drivers of and barrier to engagement be investigated through focus groups and through harnessing the use of social media.
However, as a strong cautionary note: do not start to measure employee engagement levels if top management is not prepared to treat the results seriously and take appropriate actions to address problem areas. Survey fatigue and cynicism are quick to develop among employees who are subjected regularly to “climate surveys” and see nothing happening as a result, or, worse, a witch hunt to find those employees who dare to criticize. Conducting internal research into employee engagement is an organisational development exercise in its own right and should be strategized, planned and implemented accordingly.
Engagement with the jobWhere employees are strongly engaged with the work they are actually doing (job engagement), research12 shows that this produces high performance, high levels of support to the team and low levels of deviant behaviour. This seems to mean that, while most engagement interventions seek to build organisational engagement, it might be better to look at interventions to make work more meaningful for employees and/or to work harder on the person/job fit.
Engagement with the organisationGood practice in this area requires total buy-in and visible leadership and commitment for all levels of managers. Many of the issues which directly impact on the engagement of employees reside with managers and their behaviour and treatment of employees. HR practitioners’ roles are to diagnose, support and coach management on those issues and to review, redesign and implement HR specific programmes including learning and development, performance management and reward management.
6. Working to improve your engagement levels
Locus of Engagement – Understanding what employees connect with at work. 2011, p. 8. CIPD12
PAGE 13
FACT SHEET . OCTOBER 2014
EMPLOYEE ENGAGEMENT .
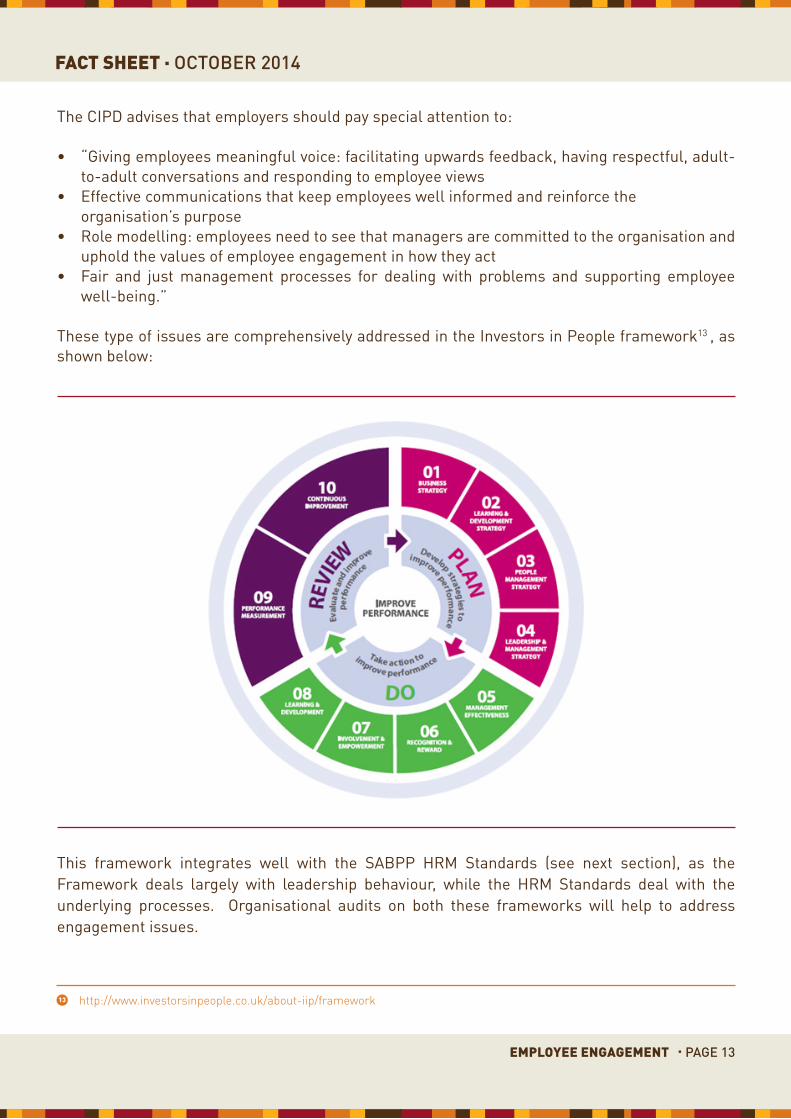
This framework integrates well with the SABPP HRM Standards (see next section), as the Framework deals largely with leadership behaviour, while the HRM Standards deal with the underlying processes. Organisational audits on both these frameworks will help to address engagement issues.
The CIPD advises that employers should pay special attention to:
• “Giving employees meaningful voice: facilitating upwards feedback, having respectful, adult-to-adult conversations and responding to employee views
• Effective communications that keep employees well informed and reinforce the organisation’s purpose
• Role modelling: employees need to see that managers are committed to the organisation and uphold the values of employee engagement in how they act
• Fair and just management processes for dealing with problems and supporting employee well-being.”
These type of issues are comprehensively addressed in the Investors in People framework13 , as shown below:
http://www.investorsinpeople.co.uk/about-iip/framework13
PAGE 14
FACT SHEET . OCTOBER 2014
EMPLOYEE ENGAGEMENT .
Hr managEmEnt systEm standards modEl
HR
Com
pete
ncie
s
Prep
are
Impl
emen
tR
evie
w
Impr
ove
Business Strategy, HR Business alignment
HR Delivery & Value Platform
HR Metrics
HR Architecture
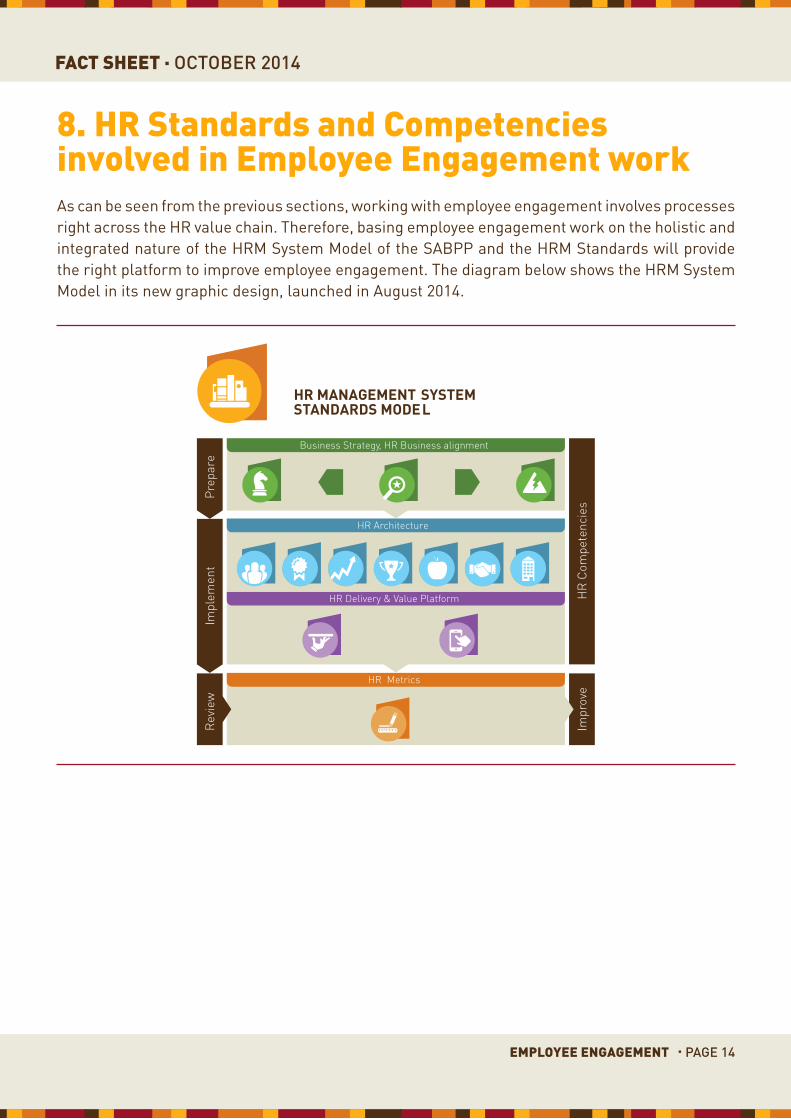
8. Hr Standards and Competencies involved in Employee Engagement workAs can be seen from the previous sections, working with employee engagement involves processes right across the HR value chain. Therefore, basing employee engagement work on the holistic and integrated nature of the HRM System Model of the SABPP and the HRM Standards will provide the right platform to improve employee engagement. The diagram below shows the HRM System Model in its new graphic design, launched in August 2014.
PAGE 15
FACT SHEET . OCTOBER 2014
EMPLOYEE ENGAGEMENT .
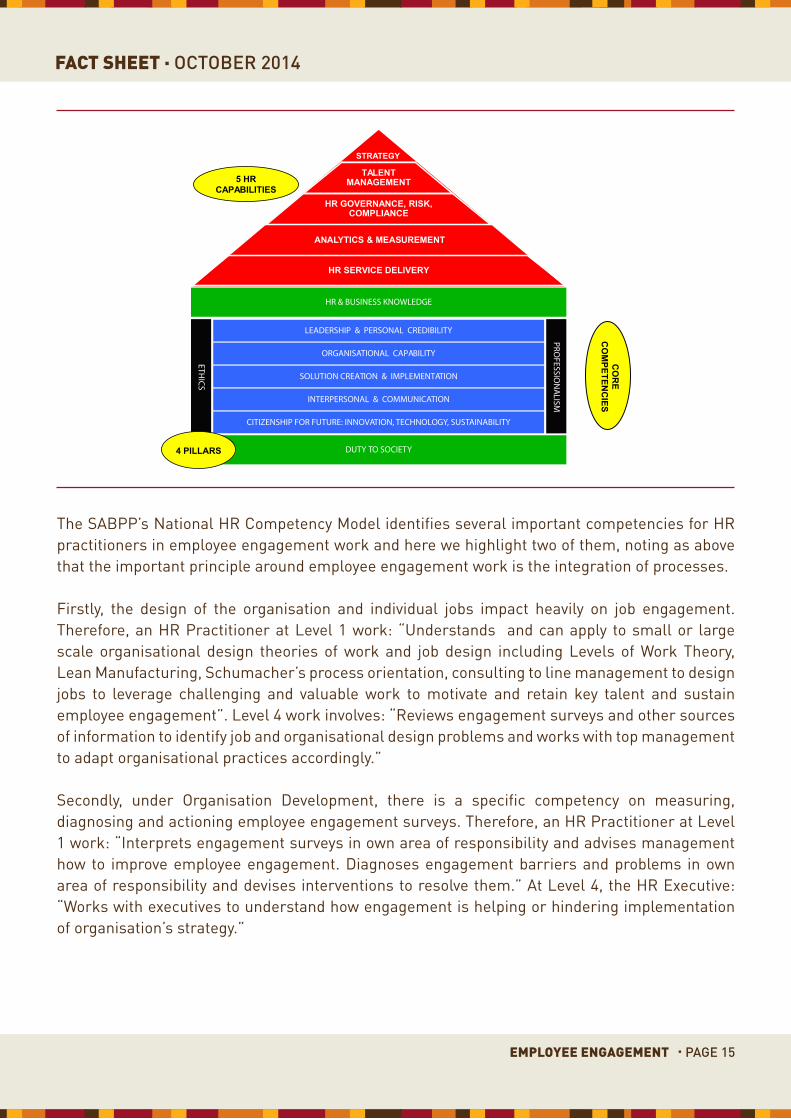
The SABPP’s National HR Competency Model identifies several important competencies for HR practitioners in employee engagement work and here we highlight two of them, noting as above that the important principle around employee engagement work is the integration of processes.
Firstly, the design of the organisation and individual jobs impact heavily on job engagement. Therefore, an HR Practitioner at Level 1 work: “Understands and can apply to small or large scale organisational design theories of work and job design including Levels of Work Theory, Lean Manufacturing, Schumacher’s process orientation, consulting to line management to design jobs to leverage challenging and valuable work to motivate and retain key talent and sustain employee engagement”. Level 4 work involves: “Reviews engagement surveys and other sources of information to identify job and organisational design problems and works with top management to adapt organisational practices accordingly.”
Secondly, under Organisation Development, there is a specific competency on measuring, diagnosing and actioning employee engagement surveys. Therefore, an HR Practitioner at Level 1 work: “Interprets engagement surveys in own area of responsibility and advises management how to improve employee engagement. Diagnoses engagement barriers and problems in own area of responsibility and devises interventions to resolve them.” At Level 4, the HR Executive: “Works with executives to understand how engagement is helping or hindering implementation of organisation’s strategy.”
STRATEGY
TALENT
MANAGEMENT
HR GOVERNANCE, RISK, COMPLIANCE
ANALYTICS & MEASUREMENT
HR SERVICE DELIVERY
5 HR
CAPABILITIES
HR & BUSINESS KNOWLEDGE
DUTY TO SOCIETY
LEADERSHIP & PERSONAL CREDIBILITY
ORGANISATIONAL CAPABILITY
INTERPERSONAL & COMMUNICATION
SOLUTION CREATION & IMPLEMENTATION
CITIZENSHIP FOR FUTURE: INNOVATION, TECHNOLOGY, SUSTAINABILITY
ETHICS
PROFESSIO
NALISM
4 PILLARS
CO
RE
CO
MPETEN
CIES
PAGE 16
FACT SHEET . OCTOBER 2014
EMPLOYEE ENGAGEMENT .
CONCLUSIONThe different methodologies employed in the different surveys on employee engagement make it difficult for an HR practitioner to establish a useful benchmark for his or her own organisation. It seems therefore that the effort to build a large, national and researchable database on a model which incorporates latest thinking on the subject will yield further insights of use to organisations because the database can then be “sliced and diced” according to various organisational demographics.
In the meantime, there is sufficient good practice established around working to improve employee engagement levels to provide some good guidelines for HR practitioners. The SABPP’s Employee Engagement Professional Practice Standard (to be developed) will make an invaluable contribution in this regard.
The last word on this subject goes to the Gallup report section on South Africa:
This Fact Sheet has been prepared by Penny Abbott, Head of the HR Research Initiative at the SABPP. Suggestions and requests for specific Fact Sheet topics can be sent to [email protected].
“While the South African economy faces many structural challenges, there are nevertheless opportunities for savvy businesses to reap the dividends of positive employee-management relations. Gallup’s assessment of many South African workplaces finds a fundamental breakdown of trust between employees and organisation leadership. Fewer than one in five South African employees strongly agree that their opinions count at work or that their supervisors encourage their development. Trust and transparent communication are essential for talent management and retention, particularly in the midst of a turbulent economy, organisational leaders should not overlook their impact.”
“Engagement is a multi-layered concept that requires real depth of understanding to be influenced successfully.”
Emotional or transactional engagement- does it matter?CIPD Research Paper, 2012, p. 3
PAGE 17
FACT SHEET . OCTOBER 2014
EMPLOYEE ENGAGEMENT .
DATE NUMbEr SUbJECT
2013February 1 GAINING Hr QUALIFICATIONS
March 2 ETHICS, FrAUD AND COrrUPTION
April 3 NATIONAL DEVELOPMENT PLAN
May 4 bArGAINING COUNCILS
June 5 EMPLOYMENT EQUITY
July 6 Hr COMPETENCIES
August 7 Hr MANAGEMENT STANDArDS
September 8 PAY EQUITY
October 9 COACHING AND MENTOrING
November 10 HIV/AIDS IN THE WOrKPLACE
2014February 1 EMPLOYING FIrST-TIME JOb MArKET ENTrANTS
March 2 PrOTECTION OF PErSONAL INFOrMATION ACT
April 3 QUALITY COUNCIL FOr TrADES AND OCCUPATIONS
May 4 WOrK-INTEGrATED LEArNING
June 5 rECrUITMENT – SCrEENING OF CANDIDATES
July 6 Hr rISK MANAGEMENT
August 7 bASIC Hr rEPOrTING (1)
September 8 bASIC Hr rEPOrTING (2)
October 9 EMPLOYEE ENGAGEMENT
FACT SHEET
for more information about saBpp, visit our website www.sabpp.co.za or blog www.hrtoday.me or follow us on twitter @saBpp1 for daily Hr information.
OCTObEr 2014 . NUMBER 2014/9