empirical study of the effects of professional development on improving mathematics and science...
TRANSCRIPT

Empirical Study of the Effects of Professional Development on Improving
Mathematics and Science InstructionMSP Goal 3 NSF/RETA
Study Website: http://www.ccsso.org/msppdstudy
PI, Rolf K. Blank, [email protected] Council of Chief State School Officers
Co-PI, Kwang Suk Yoon, Bea Birman, Mike [email protected] ; American Institutes for ResearchCo-PI, John Smithson, [email protected]
Wisconsin Center for Education Research
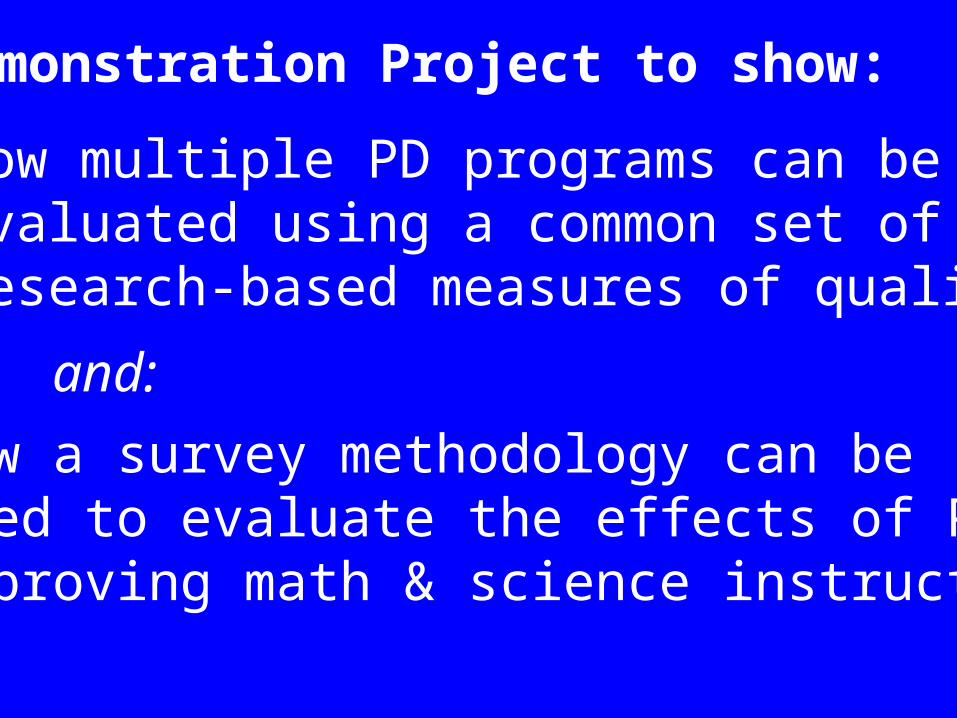
Demonstration Project to show:
how multiple PD programs can be evaluated using a common set ofresearch-based measures of quality
and:
how a survey methodology can beused to evaluate the effects of PD inimproving math & science instruction

An evaluation study to determine:
1) whether PD activities supported by MSP programs are consistent with research-based definitions of quality PD
2) The effects of PD on mathematics/science instructional practices and content
3) How MSP programs use studyfindings to improve PD effectiveness
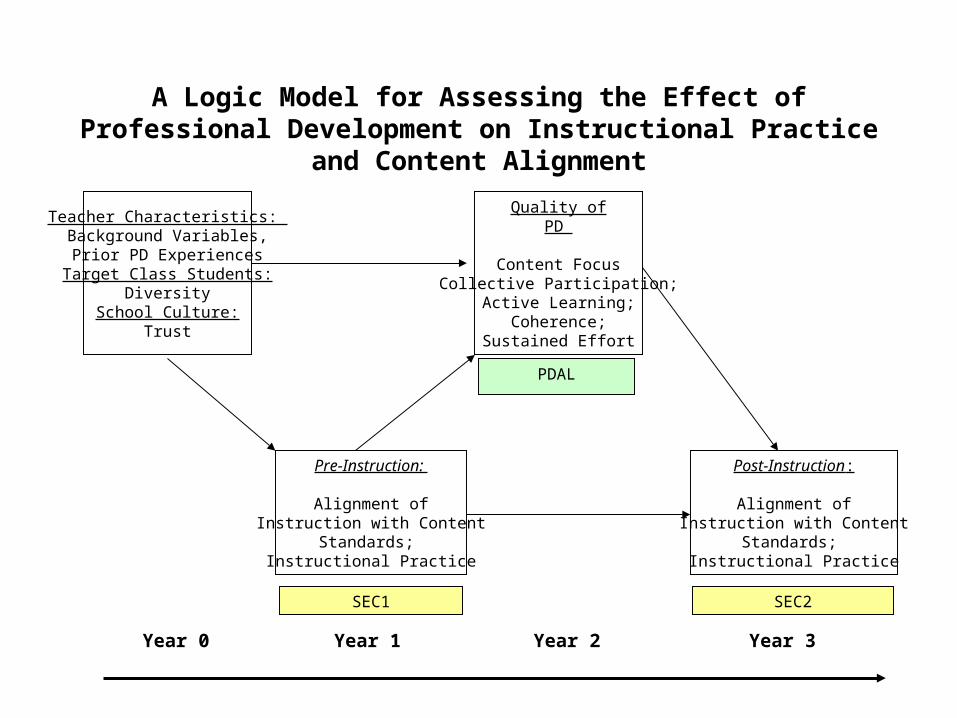
Quality ofPD
Content FocusCollective Participation;
Active Learning;Coherence;
Sustained Effort
Pre-Instruction:
Alignment ofInstruction with Content
Standards; Instructional Practice
Teacher Characteristics: Background Variables,Prior PD ExperiencesTarget Class Students:
DiversitySchool Culture:
Trust
Post-Instruction:
Alignment ofInstruction with Content
Standards; Instructional Practice
Year 1 Year 2 Year 3Year 0
PDAL
SEC1 SEC2
A Logic Model for Assessing the Effect of Professional Development on Instructional Practice and Content Alignment

Study Sample
• MSP Sites (N= 5: Cleveland, New Jersey, Brockport-SUNY, El Paso, Corpus Christi, TX)– Voluntary participation, Data feedback to sites
• School Districts (N= 23)– Urban/Rural, Size varies
• Schools (N= 79)– Treatment vs. Control (based on MSP PD cohort)
• Teachers (N= 570)– Middle Grades Math and Science
• Target Class – Data analysis one class/teacher

InstructionalContent
Topics by Cognitive Demand
Instructional Practices
&Teacher
Characteristics
Multi-purpose
indicatorsof curriculumpractice andprofessionaldevelopment
opportunities.

InstructionalContent
Topics by Cognitive Demand
Instructional Practices
&Teacher
Characteristics
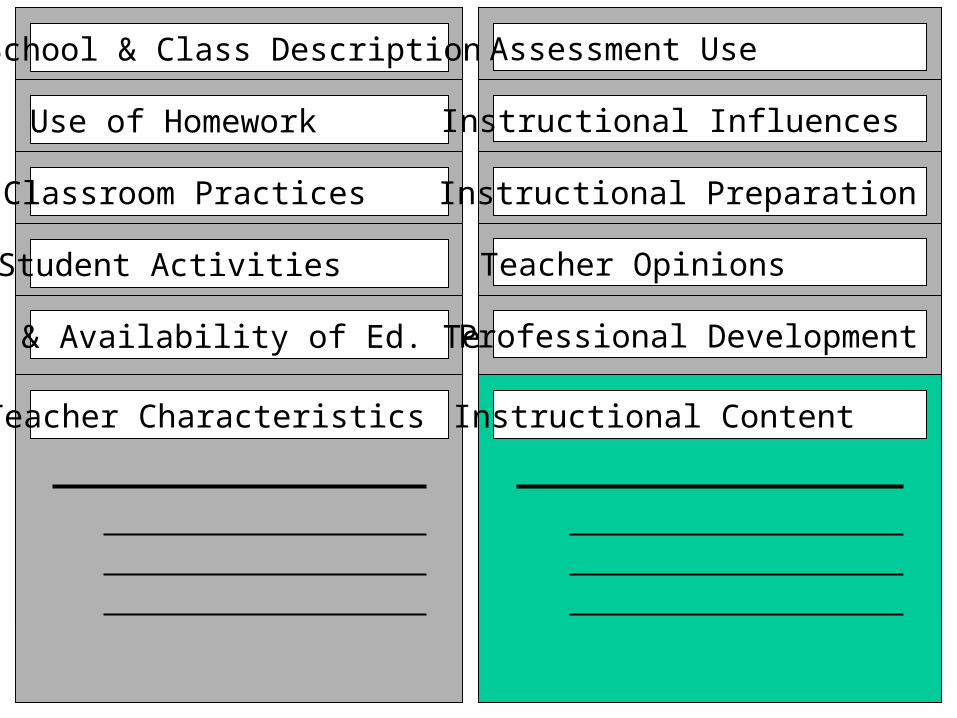
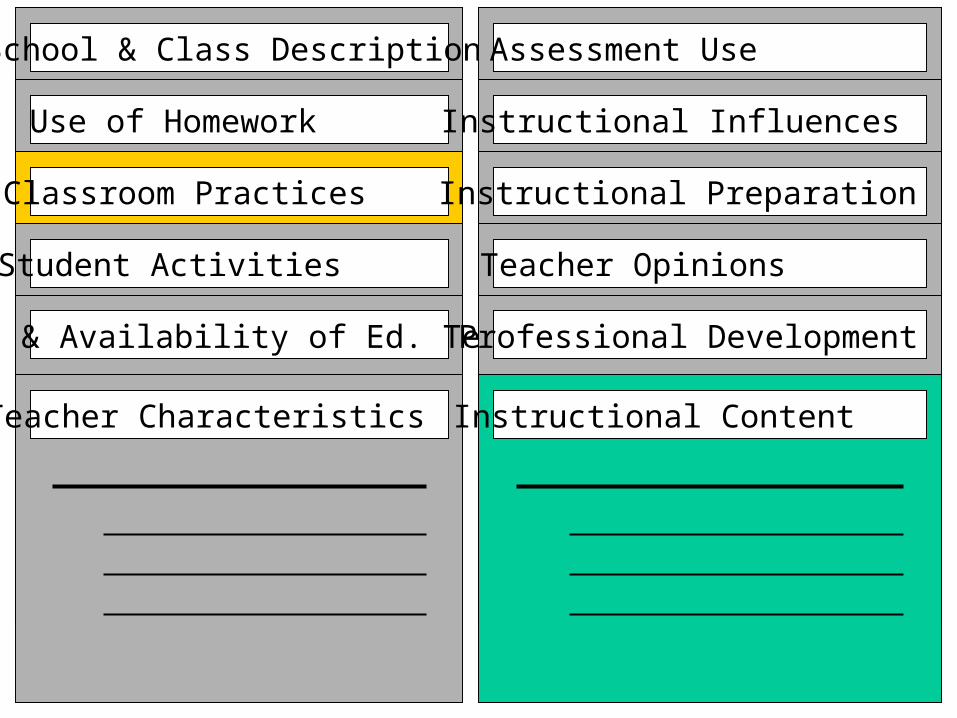
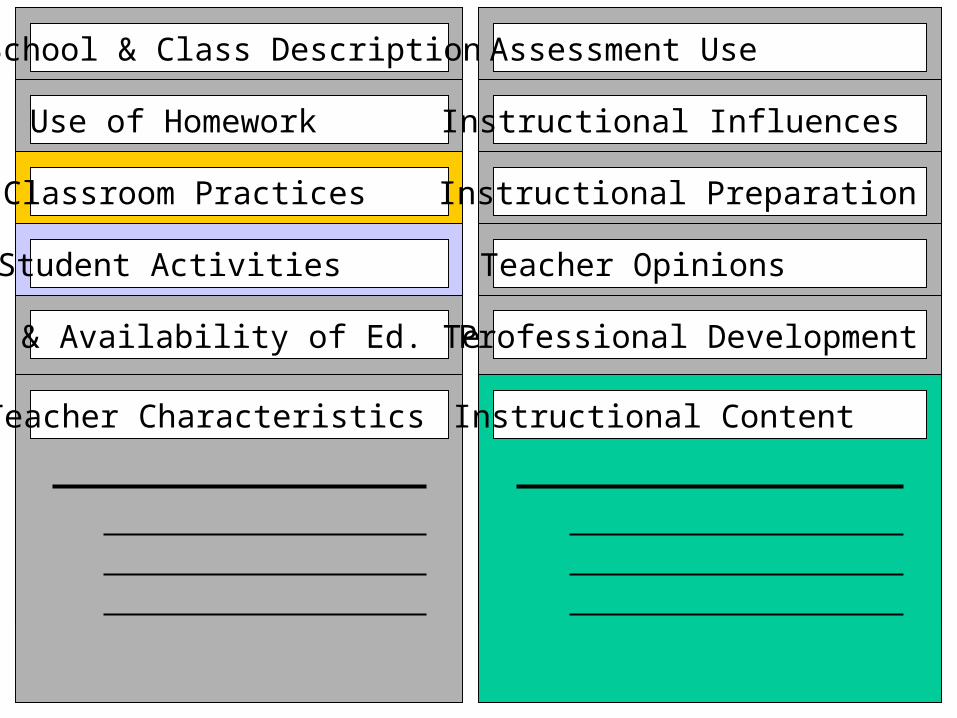
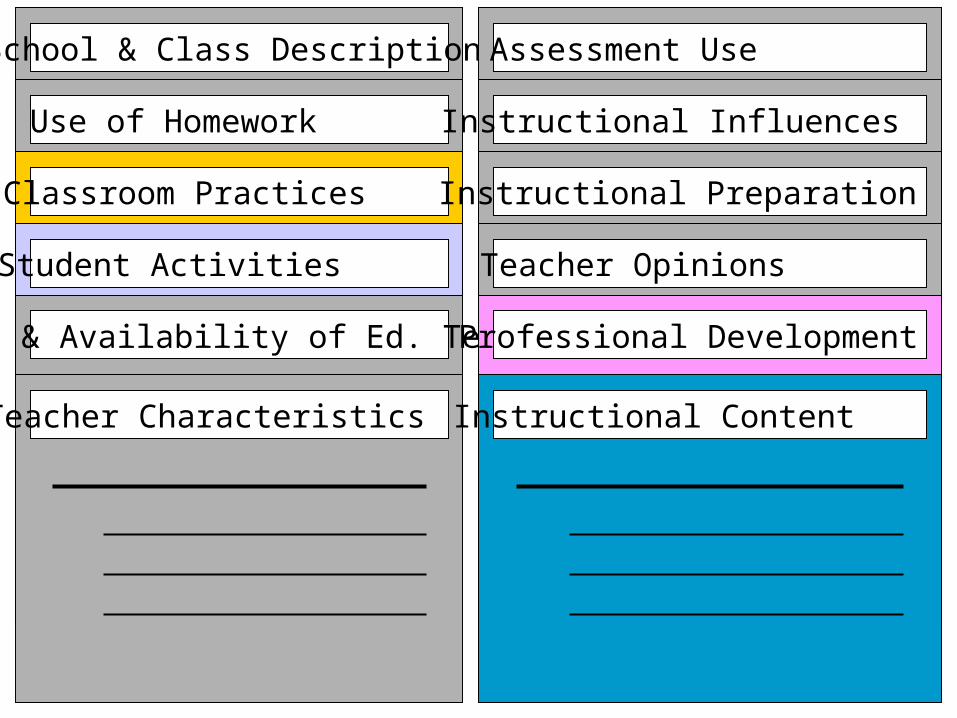
School & Class Description
Use of Homework
Classroom Practices
Student Activities
Use & Availability of Ed. Tech.
Assessment Use
Instructional Influences
Instructional Preparation
Teacher Opinions
Professional Development
Teacher Characteristics Instructional Content
School & Class Description
Use of Homework
Student Activities
Use & Availability of Ed. Tech.
Assessment Use
Instructional Influences
Instructional Preparation
Teacher Opinions
Professional Development
Teacher Characteristics Instructional Content
Classroom Practices
School & Class Description
Use of Homework
Classroom Practices
Student Activities
Use & Availability of Ed. Tech.
Assessment Use
Instructional Influences
Instructional Preparation
Teacher Opinions
Professional Development
Teacher Characteristics Instructional Content

School & Class Description
Use of Homework
Classroom Practices
Student Activities
Use & Availability of Ed. Tech.
Assessment Use
Instructional Influences
Instructional Preparation
Teacher Opinions
Professional Development
Teacher Characteristics Instructional Content
School & Class Description
Use of Homework
Classroom Practices
Student Activities
Use & Availability of Ed. Tech.
Assessment Use
Instructional Influences
Instructional Preparation
Teacher Opinions
Professional Development
Teacher Characteristics Instructional Content
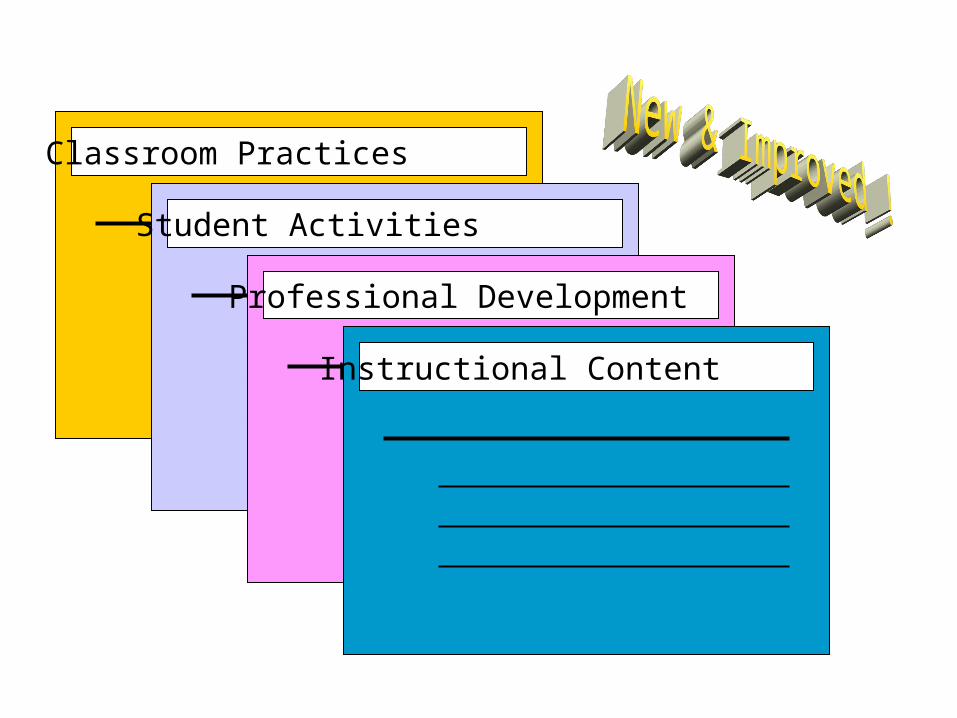
Classroom Practices
Student Activities
Professional Development
Instructional Content

PDAL
Classroom Practices
Student Activities
Professional Development
Instructional Content
Classroom Practices
Student Activities
Professional Development
Instructional Content

PDAL
Instructional Practices
Student ActivitiesProfessional Development
Instructional Content
Summer2003
Summer2005
Instructional Practices
Student ActivitiesProfessional Development
Instructional Content

Year 1 Data Collection TimelineYear 1 Data Collection TimelineApril 2003
May 2003
June 2003
P D Activity Logs
Survey orientationTeacher IncentivesAdmin. Training
Survey AdministrationSite CoordinatorsGroup Admin.
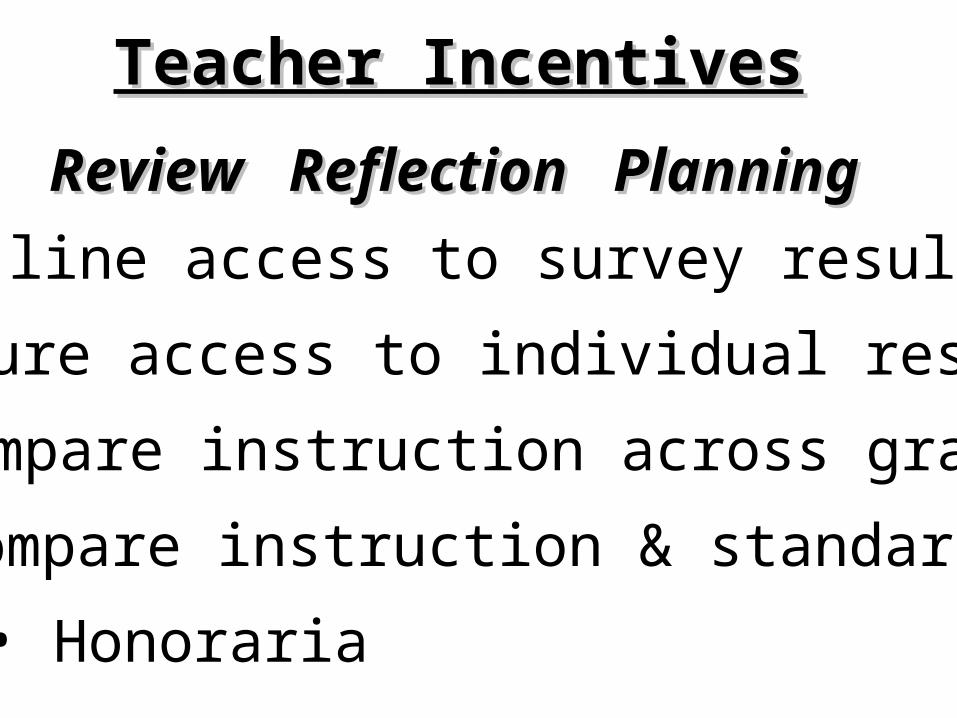
Teacher IncentivesTeacher Incentives
Review Reflection PlanningReview Reflection Planning
• On-line access to survey results
• Secure access to individual results
• Compare instruction across grades
• Compare instruction & standards
• Honoraria
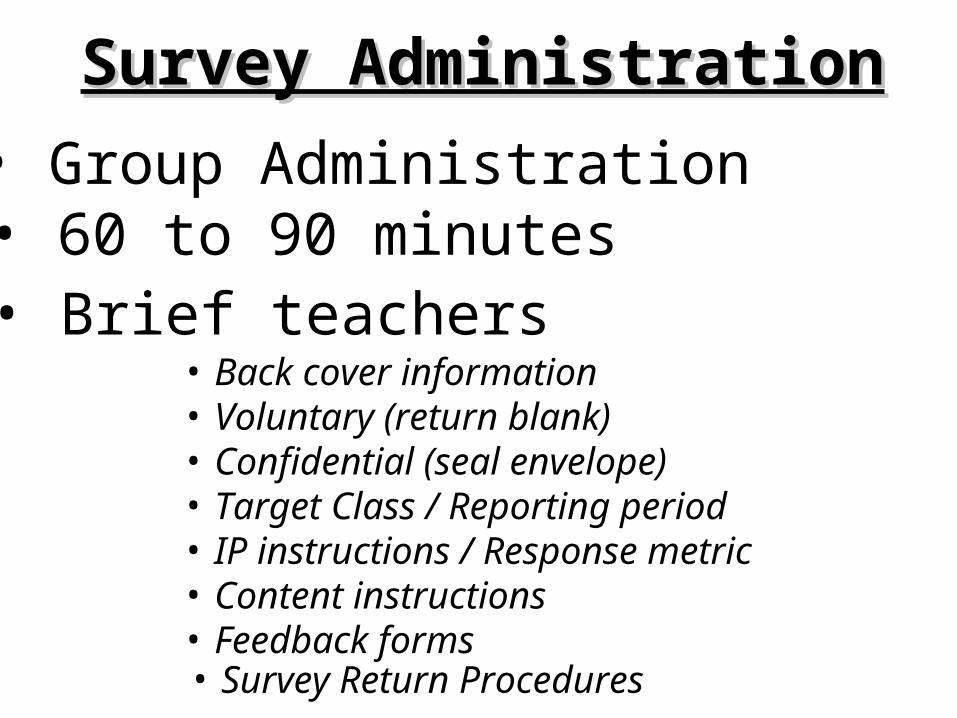
Survey AdministrationSurvey Administration
• Group Administration• 60 to 90 minutes• Brief teachers
• Survey Return Procedures
• Back cover information• Voluntary (return blank)• Confidential (seal envelope)• Target Class / Reporting period• IP instructions / Response metric• Content instructions• Feedback forms
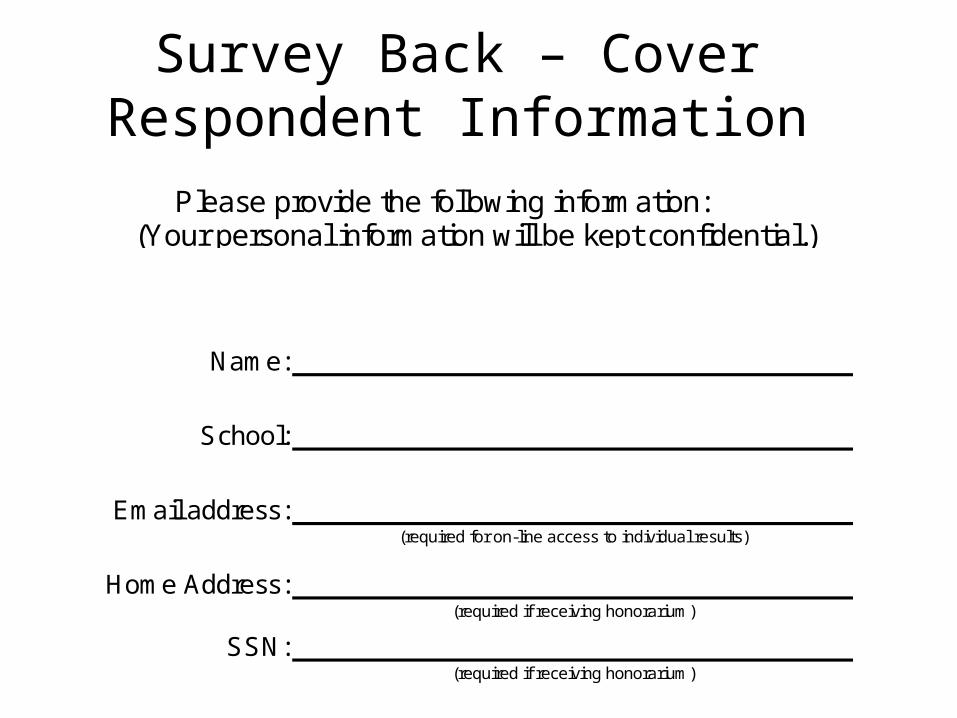
Survey Back – CoverRespondent Information
Please provide the following information:(Your personal information will be kept confidential.)
Name:
School:
Email address:
Home Address:
SSN:(required if receiving honorarium)
(required if receiving honorarium)
(required for on-line access to individual results)
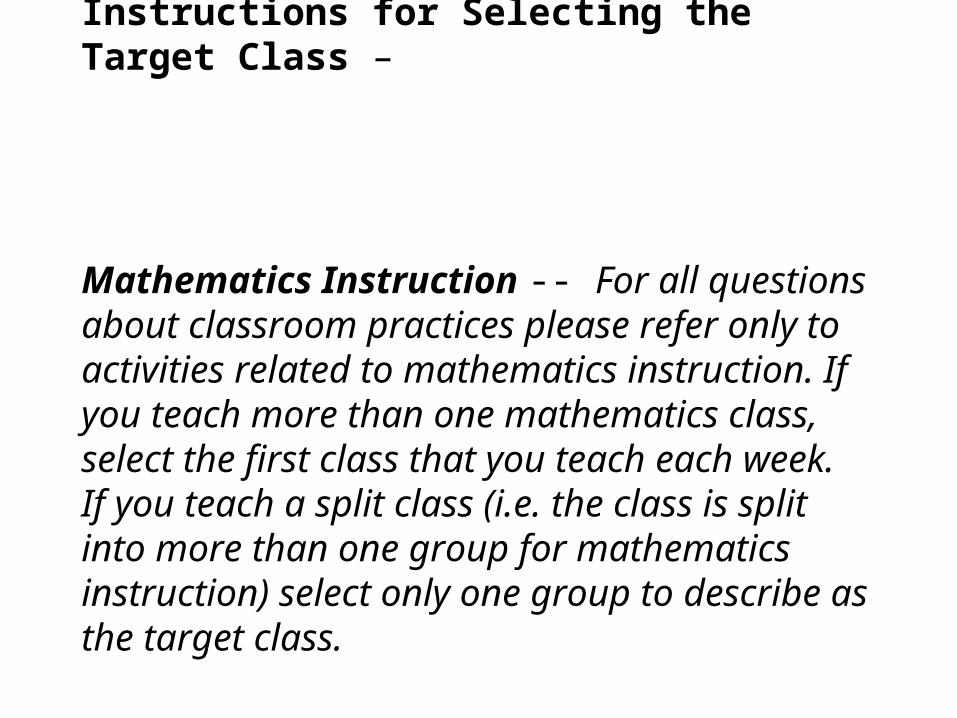
Instructions for Selecting the Target Class – Mathematics Instruction -- For all questions about classroom practices please refer only to activities related to mathematics instruction. If you teach more than one mathematics class, select the first class that you teach each week. If you teach a split class (i.e. the class is split into more than one group for mathematics instruction) select only one group to describe as the target class.

INSTRUCTIONAL ACTIVITIES IN MATHEMATICS
0 - None1 - A little (10% or less of instructional time for the school year)2 - Some (11-25 % of instructional time for the school year)3 - A moderate amount (26-50% of instructional time for the school year)
4 - Considerable (51-75% of instructional time for the school year)5 - Almost all (more than 75% of instructional time for the school year)
25 Watch the teacher demonstrate how to do a procedure or solve a problem
26 Read about mathematics in books, magazines, or articles
Almost all
Listed below are questions about the types of activities that students in the target class engage in during mathematics instruction. For each activity, you are asked to estimate the relative amount of time a typical student will spend engaged in that activity over the course of a school year. Note that your estimates do not need to total 100%. It is understood that many of these activities occur in combination with one another. Consider each activity on its own, estimating the range that bests indicates the relative amount of mathematics instructional time that a typical student spends over the course of a school year engaged in that activity.
RESPONSE OPTIONS
None Little
Over the course of the current school year, what amount of mathematics instructional time in the target class do students:
Some ModerateConsider-
able

Step 2; Indicate amount of time spent on each topic covered in this class.
Examine the list of topics a second time. This time note the amount of coverage devoted toeach topic by filling in the appropriately numbered circle in the “Time on Topic” column,based upon the following codes:
0 = None, not covered1 = Slight coverage (less than one class/lesson)2 = Moderate coverage (one to five classes/lessons)3 = Sustained coverage (more than five classes/lessons)
Step 1; Indicate topics not covered in this class.
Begin by reviewing the entire list of topics identified in the topics column of each table, notinghow topics are grouped. After reviewing each topic within a given grouping, if none of thetopics listed within that group receive any instructional coverage, circle the “<none>” in the“Time on Topic” column for that group. For any individual topic which is not covered in thisscience class, fill-in the circled “zero” in the “Time on Topic” column. (Not necessary forthose groups with “<none>” circled.) Any topics or topic groups so identified will not requirefurther response. [Note, for example, that the class described in the example below did notcover any topics under “Instructional Technology” and so “<none>” is circled.]

Middle School Mathematics Topics
<none> 1 Number sense / Properties / RelationshipsMemorize Facts,
Definitions, Formulas
Perform Procedures
101 Place value
102 Whole numbers
103 Operations
Step 1 104 Fractions
105 Decimals
106 Percents
107 Ratio, proportion
108 Patterns
109 Real numbers
110 Exponents, scientific notation
111 Factors, multiples, divisibility
112 Odds, evens, primes, composites
113 Estimation
114 Order of operations
115 Relationships between operations
116 Mathematical properties (e.g., distributive property)
<none> 6 Instructional TechnologyMemorize Facts,
Definitions, Formulas
Perform Procedures
601 Use of calculators
602 Graphing calculators
603 Computers and internet
Time on Topic Expectations for Students in Mathematics
Step 2

Step 3; Indicate relative emphases of each student expectation for every topic taught.
The final step in completing this section of the survey concerns your expectations for whatstudents should know and be able to do. For each topic area, please provide information aboutthe relative amount to instructional time spent on work designed to help students reach each ofthe listed expectations by filling in the appropriately numbered circle using the response codeslisted below. (Note: To the left of each content sheet you will find a list of descriptors for eachof the five expectations for students.)
0 = No emphasis (Not an expectation for this topic.)1 = Slight emphasis (Accounts for less than 25% of the time spent on this topic.)2 = Moderate emphasis (Accounts for 25% to 33% of the time spent on this topic.)3 = Sustained emphasis (Accounts for more than 33% of the time spent on this topic.)
Note: A code of “3" should typically be given for only one, and no more than two expectationcategories within any given topic. No expectation codes should be filled-in for thosetopics for which no coverage is provided (i.e. circled “0" or “<none>”).
Middle School Mathematics Topics
Number sense / Properties / RelationshipsMemorize Facts,
Definitions, Formulas
Perform Procedures
Demonstrate Understanding of
Mathematical Ideas
Conjecture, Generalize, Prove
Place value
Whole numbers
Expectations for Students in Mathematics
Step 3
c
c
c c c
c c c

Conjecture/ Generalize/ ProveRecite basic mathematics factsRecall mathematics terms & definitionsRecall formulas and computational procedures Write formal or informal proofs
Recognize, generate or create patternsPerform Procedures
Use numbers to count, order, denoteDo computational procedures or algorithms Make and investigate mathematical conjectures
Follow procedures/instructions Identify faulty arguments or misrepresentations of data
Solve equations/formulas/routine word problems Reason inductively or deductivelyOrganize or display data
Read or produce graphs and tables
Execute geometric constructions
Demonstrate Understanding Solve Non-routine Problems/ of Mathematical Ideas Make Connections
Communicate mathematical ideasUse representations to model mathematical ideas
Explain findings and results from data analysis strategies Apply mathematics in contexts outside of mathematicsDevelop/explain relationships between concepts Analyze data, recognize patterns
Synthesize content and ideas from several sources
0 = None (not covered) 0 = No emphasis (Not a performance goal for this topic)
1 = Slight coverage (less than one class/lesson) 1 = Slight emphasis (Less than 25% of time on this topic)
2 = Moderate coverage (one to five classes/lessons) 2 = Moderate emphasis (25% to 33% of time on this topic)
3 =
Expectations for Students in Mathematics
Determine the truth of a mathematical pattern or proposition
Apply and adapt a variety of appropriate strategies to solve non-routine problems
Find a mathematical rule to generate a pattern or number sequence
Memorize Facts/ Definitions/ Formulas
3 = Sustained coverage (more than five classes/lessons)Sustained emphasis (more than 33% of time on this topic)
Show or explain relationships between models, diagrams, and/or other representations
Response CodesExpectations for Students
Response CodesTime on Topic
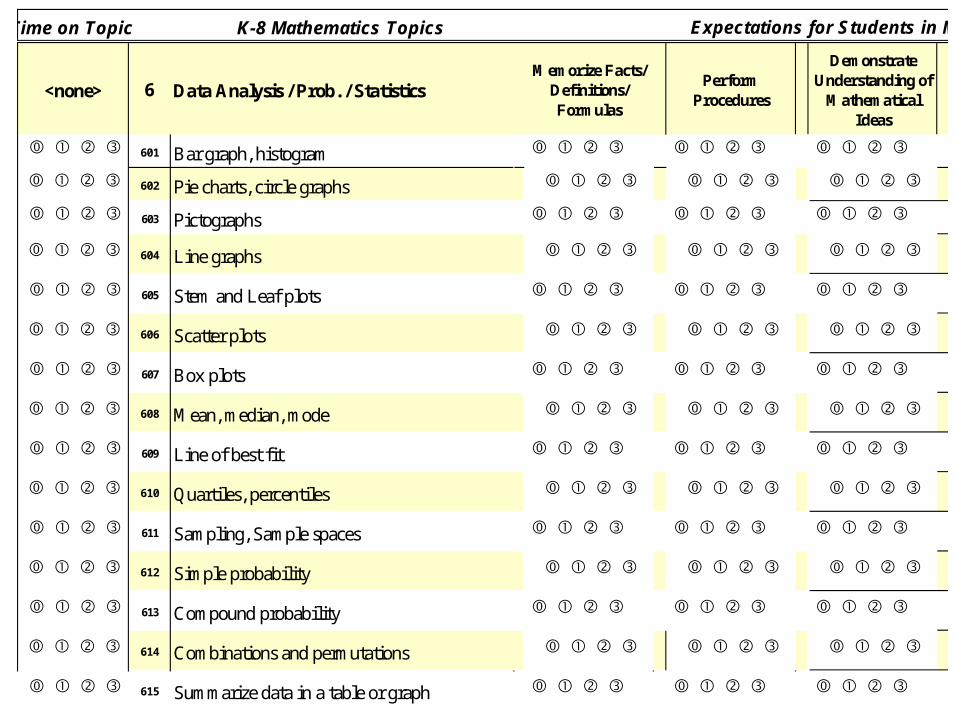
Time on Topic K-8 Mathematics Topics
<none> 6 Data Analysis / Prob. / StatisticsMemorize Facts/
Definitions/ Formulas
Perform Procedures
Demonstrate Understanding of
Mathematical Ideas
601 Bar graph, histogram
602 Pie charts, circle graphs
603 Pictographs
604 Line graphs
605 Stem and Leaf plots
606 Scatter plots
607 Box plots
608 Mean, median, mode
609 Line of best fit
610 Quartiles, percentiles
611 Sampling, Sample spaces
612 Simple probability
613 Compound probability
614 Combinations and permutations
615 Summarize data in a table or graph
Expectations for Students in Mathematics
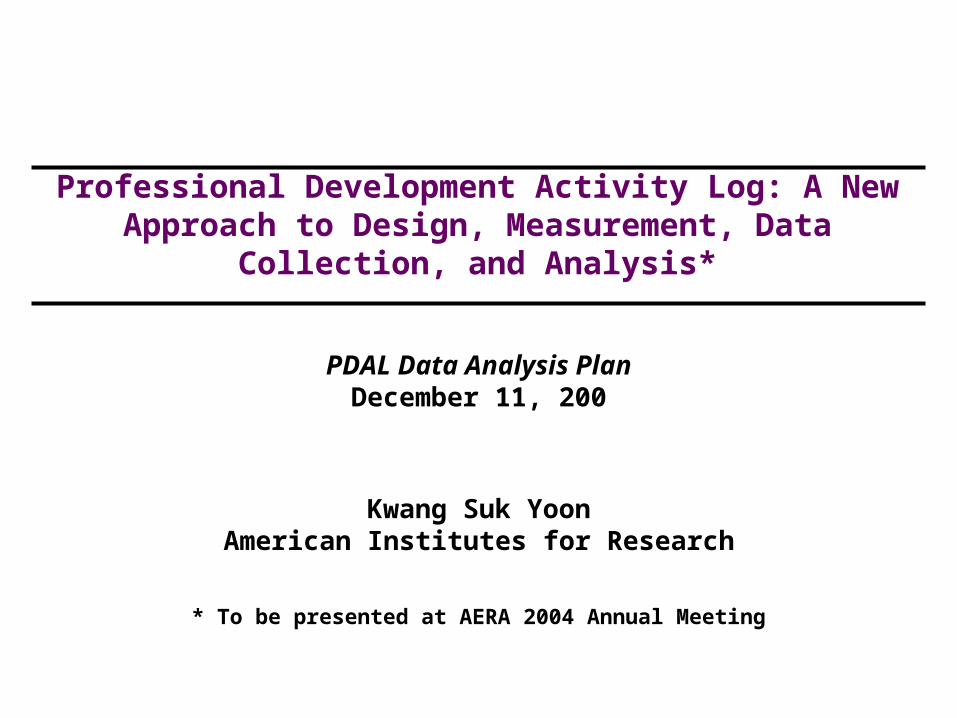
PDAL Data Analysis PlanDecember 11, 200
Kwang Suk YoonAmerican Institutes for Research
Professional Development Activity Log: A New Approach to Design, Measurement, Data Collection, and Analysis*
* To be presented at AERA 2004 Annual Meeting
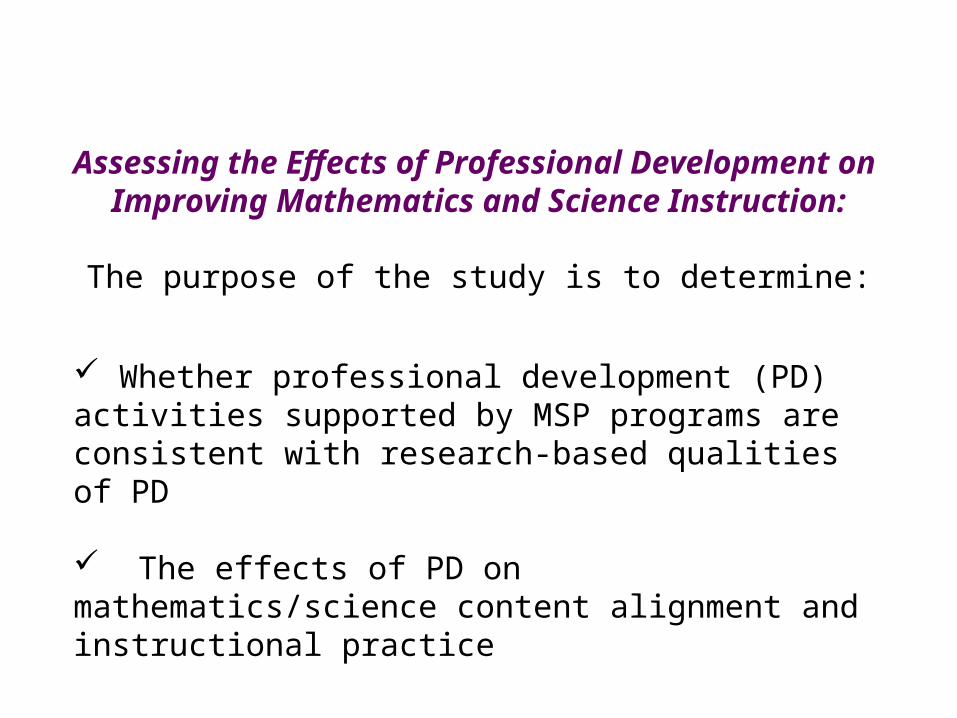
Whether professional development (PD) activities supported by MSP programs are consistent with research-based qualities of PD
The effects of PD on mathematics/science content alignment and instructional practice
The purpose of the study is to determine:
Assessing the Effects of Professional Development on Improving Mathematics and Science Instruction:
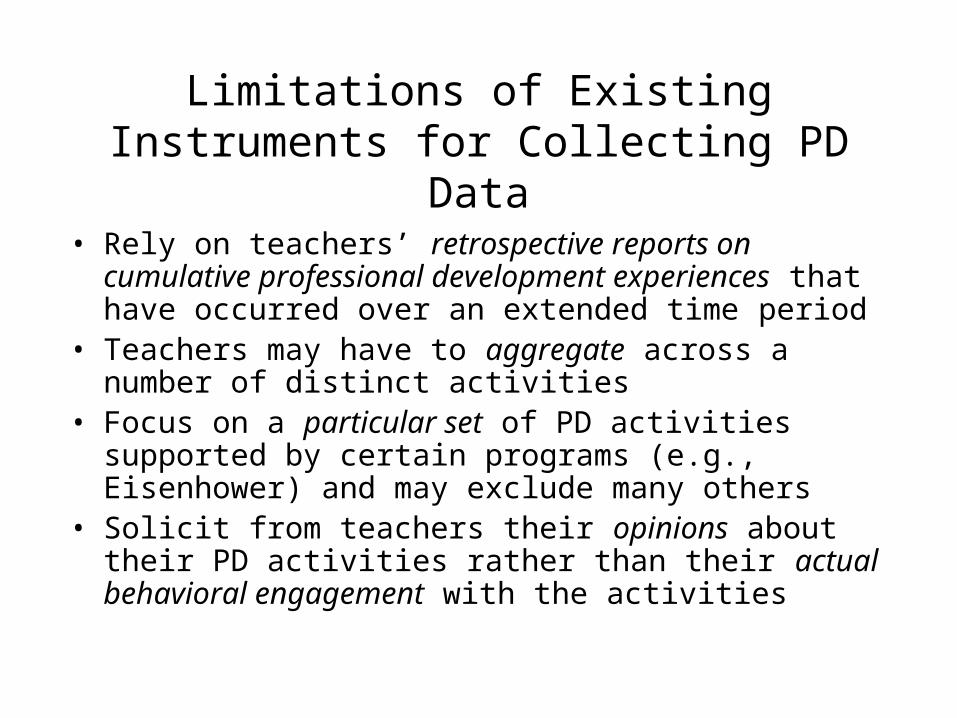
Limitations of Existing Instruments for Collecting PD Data
• Rely on teachers’ retrospective reports on cumulative professional development experiences that have occurred over an extended time period
• Teachers may have to aggregate across a number of distinct activities
• Focus on a particular set of PD activities supported by certain programs (e.g., Eisenhower) and may exclude many others
• Solicit from teachers their opinions about their PD activities rather than their actual behavioral engagement with the activities
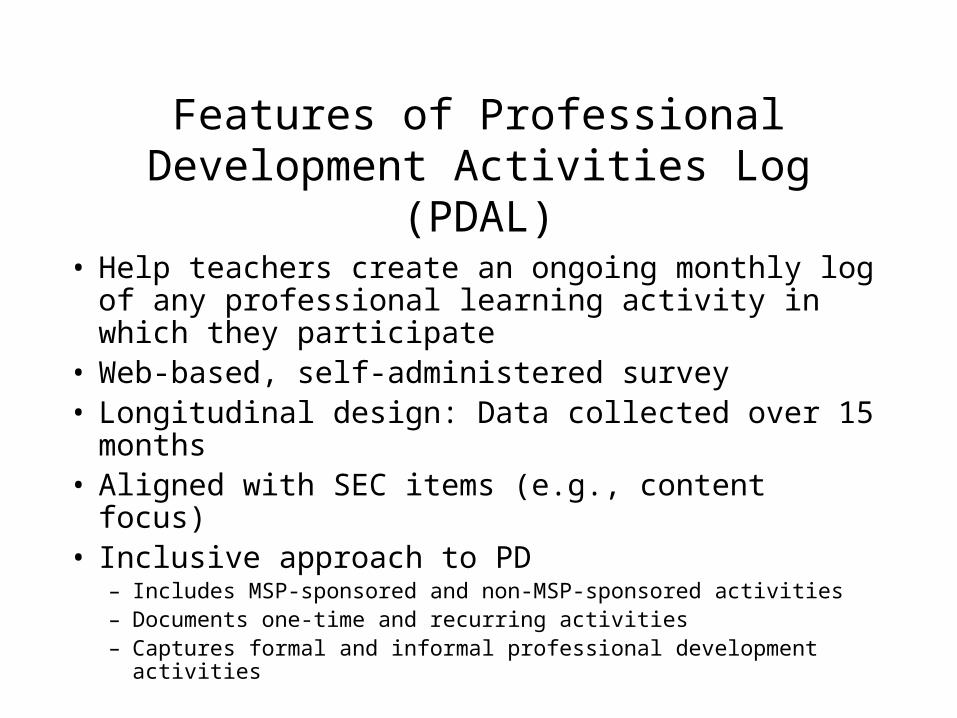
Features of Professional Development Activities Log (PDAL)
• Help teachers create an ongoing monthly log of any professional learning activity in which they participate
• Web-based, self-administered survey • Longitudinal design: Data collected over 15 months• Aligned with SEC items (e.g., content focus)• Inclusive approach to PD
– Includes MSP-sponsored and non-MSP-sponsored activities– Documents one-time and recurring activities– Captures formal and informal professional development activities
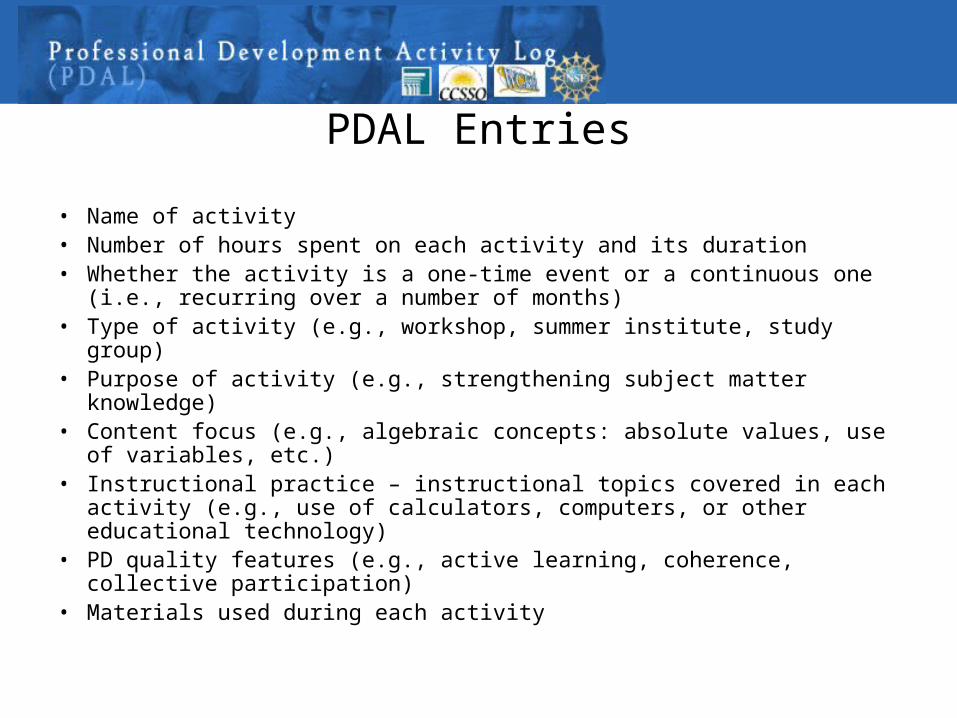
PDAL Entries
• Name of activity• Number of hours spent on each activity and its duration • Whether the activity is a one-time event or a continuous one (i.e., recurring
over a number of months)• Type of activity (e.g., workshop, summer institute, study group)• Purpose of activity (e.g., strengthening subject matter knowledge)• Content focus (e.g., algebraic concepts: absolute values, use of variables,
etc.)• Instructional practice – instructional topics covered in each activity (e.g.,
use of calculators, computers, or other educational technology)• PD quality features (e.g., active learning, coherence, collective
participation)• Materials used during each activity

Advantages of PDAL
• Collects disaggregate information about specific PD activities – Reduces bias introduced by gross data aggregation
• Gathers accurate, time-sensitive information; Minimizes recall problem with retrospective reports
• Allows teachers to review their own logs – Teachers can reflect on their own PD experiences
• Generates context sensitive questions
• Alleviates teachers’ response burden
• Minimizes data entry errors
• Be able to tailor technical assistance to teachers based on their response patterns
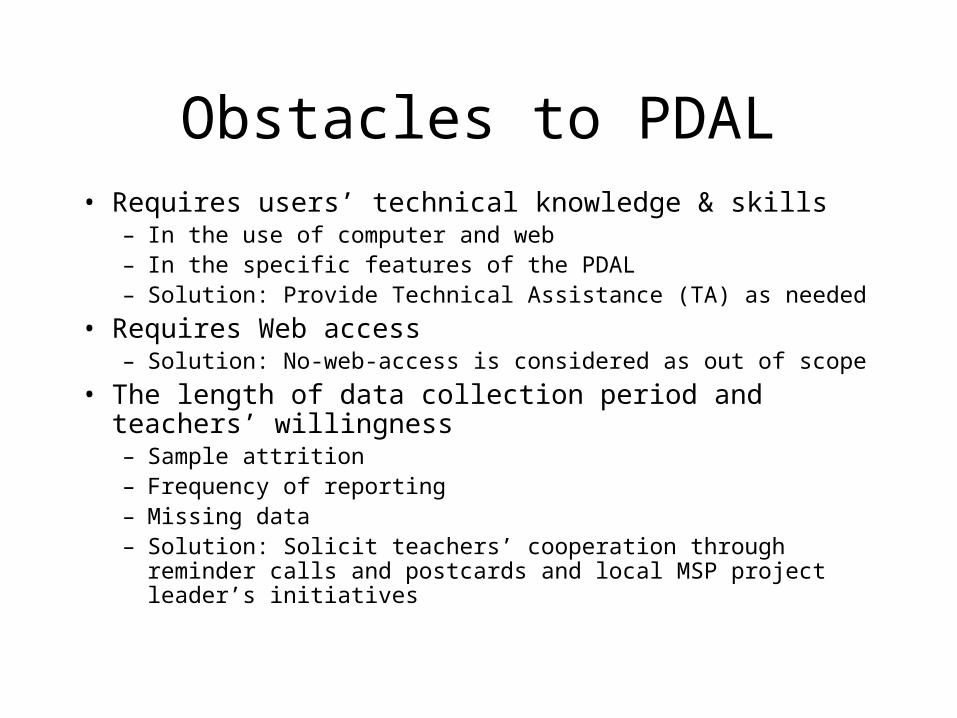
Obstacles to PDAL• Requires users’ technical knowledge & skills
– In the use of computer and web– In the specific features of the PDAL– Solution: Provide Technical Assistance (TA) as needed
• Requires Web access– Solution: No-web-access is considered as out of scope
• The length of data collection period and teachers’ willingness– Sample attrition– Frequency of reporting– Missing data– Solution: Solicit teachers’ cooperation through reminder calls and
postcards and local MSP project leader’s initiatives

Sample and Multi-level Contexts
• MSP Sites (N=4-5)– Treatment vs. Control, Nature of partnership
• School Districts (N=16-23)– Content Standards, Urban/Rural, Size
• Schools (N=67-79)– SES, School Culture – Trust
• Teachers (N=450-570)– Subject, Gender, Teaching Experience, Credential
• Target Class– Content Alignment; Content Match; Student Diversity (Minority,
Achievement Levels)
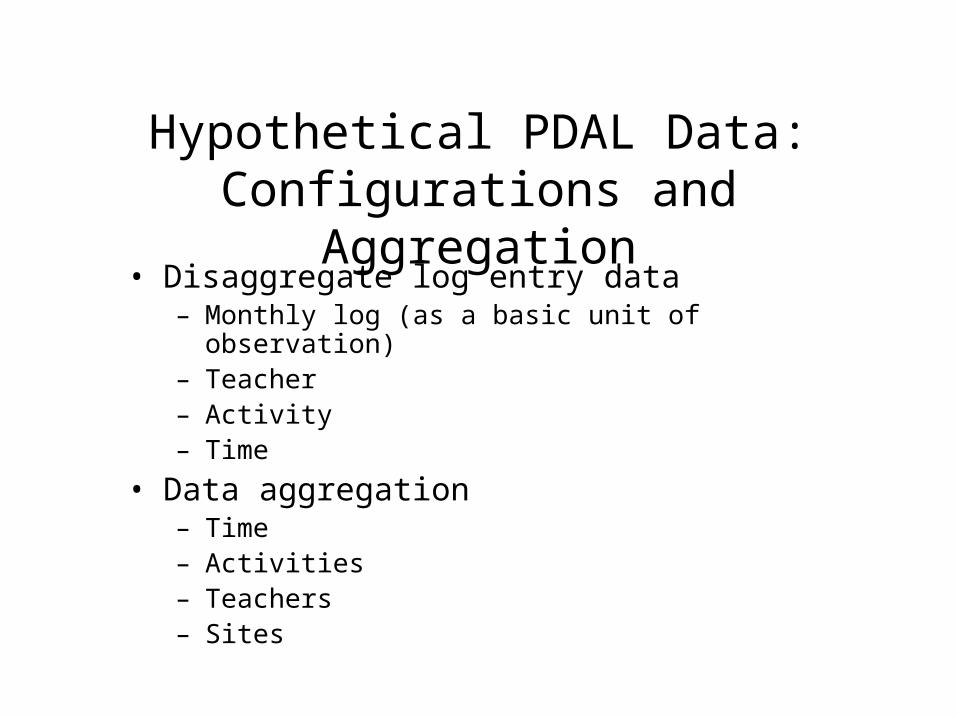
Hypothetical PDAL Data:Configurations and Aggregation
• Disaggregate log entry data– Monthly log (as a basic unit of observation)– Teacher– Activity– Time
• Data aggregation– Time– Activities – Teachers– Sites
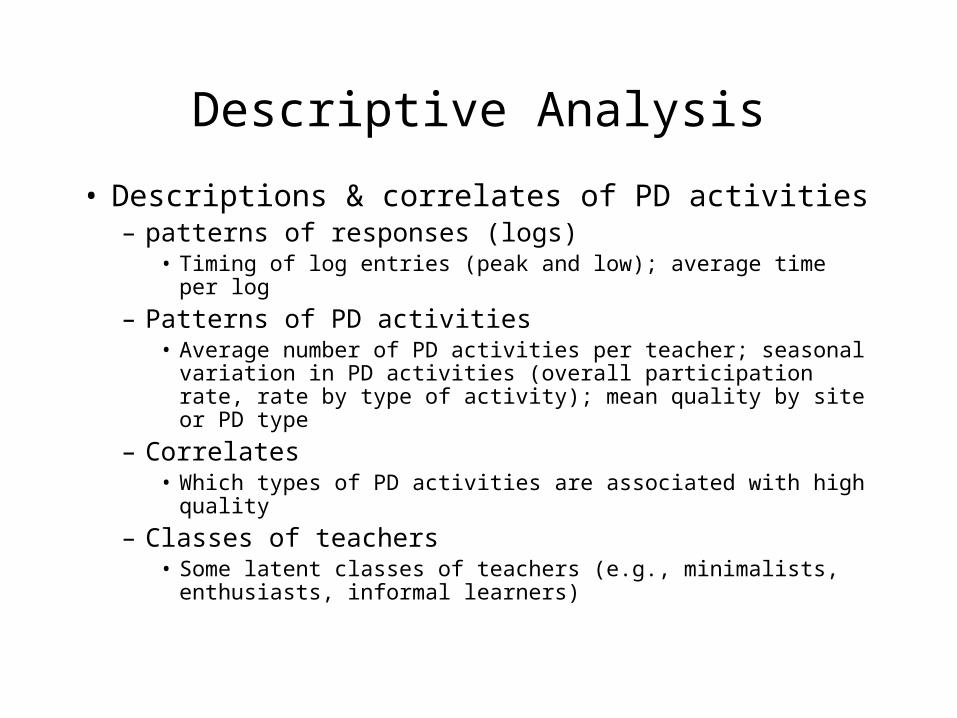
Descriptive Analysis
• Descriptions & correlates of PD activities– patterns of responses (logs)
• Timing of log entries (peak and low); average time per log
– Patterns of PD activities• Average number of PD activities per teacher; seasonal
variation in PD activities (overall participation rate, rate by type of activity); mean quality by site or PD type
– Correlates• Which types of PD activities are associated with high quality
– Classes of teachers• Some latent classes of teachers (e.g., minimalists, enthusiasts,
informal learners)

Impact Analysis
• Main Outcome Variables of PDAL Analysis– Quantity and Quality of PD
• Main Outcome Variables of SEC Analysis– Change or Stability in Content Alignment– Change or Stability in Instructional Practice
• Linking PD Variables to Instructional Outcomes
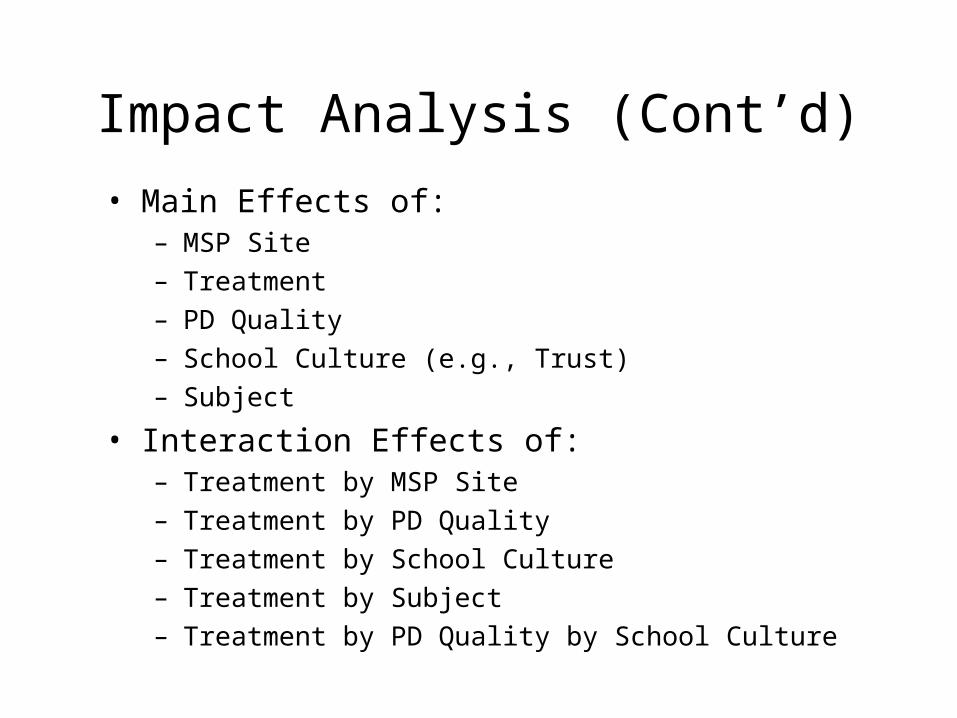
Impact Analysis (Cont’d)
• Main Effects of:– MSP Site
– Treatment
– PD Quality
– School Culture (e.g., Trust)
– Subject
• Interaction Effects of:– Treatment by MSP Site
– Treatment by PD Quality
– Treatment by School Culture
– Treatment by Subject
– Treatment by PD Quality by School Culture

Example of Interaction Effect: The Effect of Treatment on the Use of Instructional Practice Moderated by School Culture
(Trust)
0
1
2
3
4
5
Year 1 Year 3
The U
se o
f In
stru
ctio
nal Pra
ctic
e
(Fre
quency
)
Control - LowTrust
Control - HighTrust
Treatment - LowTrust
Treatment - HighTrust

Effects of Professional Development on Change in Teacher’s Effects of Professional Development on Change in Teacher’s Instructional Practice: By PD Activity’s Focus on Specific Instructional Practice: By PD Activity’s Focus on Specific
Instructional Strategy, PD Quality, and School CultureInstructional Strategy, PD Quality, and School Culture
0
0.5
1
1.5
2
No focus on strategy, Lowquality
Focus on strategy, Low quality Focus on strategy, High quality
Characteristics of professional development activity
Te
ac
he
r's
Us
e o
f In
str
uc
tio
na
l Str
ate
gy
Negative SchoolCulture
Positive SchoolCulture