emotional attachment to social media by rebecca …
TRANSCRIPT

OF “LIKES” AND “PINS”: MEASURING CONSUMERS’
EMOTIONAL ATTACHMENT TO SOCIAL MEDIA
by
REBECCA A.VANMETER
Presented to the Faculty of the Graduate School of
The University of Texas at Arlington in Partial Fulfillment
of the Requirements
for the Degree of
DOCTOR OF PHILOSOPHY
THE UNIVERSITY OF TEXAS AT ARLINGTON
May 2014

ii
Copyright © by Rebecca A. VanMeter 2014
All Rights Reserved

iii
Acknowledgements
I would like to extend my deepest appreciation to my dissertation committee. I
sincerely thank Doug Grisaffe, Larry Chonko, Ritesh Saini, Traci Freling and Marcus
Butts for all the time, energy, expertise, guidance, support, and patience you have given
me throughout this process.
I express heartfelt gratitude to my unofficial committee member, Wendy Casper.
Thank you for your guidance, encouragement, and reassurance that I could accomplish
this goal at every step along the way.
I have been extremely lucky to have gone through my doctoral program with
some very intelligent people, who I feel privileged to call friends. Carla Buss, Emily Goad,
Amy Holmes, Janet Jones, Devin Lunt, and Jenny Manegold thank you for your
encouragement, support, guidance, feedback, and a sense of collective accomplishment
as we progressed through our studies. You all have made this journey a lot more
enjoyable and I thank each and every one of you sincerely.
I would also like to thank the Camp Gladiator (CG) nation for providing me with
the much needed stress reliever of a difficult workout. Anyone who has ever been an
athlete knows how much a very difficult workout can set your mind right. So I would really
like to thank all the trainers who take the time to develop difficult and creative workouts,
you are positively impacting so many people’s lives and wellbeing!
Last, but certainly not least, without my family, this would not have been possible.
My parents instilled in me a work ethic that allowed me to attack tenaciously my
coursework and dissertation. For that I will always be grateful. I treasure parents, sister
and niece Adelynn who provided me comic relief, telephone breaks and a listening ear
throughout this process. Finally, to some of my best friends, Taylor Begley, Varonica
Clouse, Lauren Colley, the Haigood sisters, and Anna Ignatenko thank you for your

iv
unwavering love, support, encouragement and the proverbial shoulder to cry on… very
important things in doctoral studies! You all have been my foundation throughout this
process, thank you for reminding me what is important.
March 03, 2014

v
Abstract
OF “LIKES” AND “PINS”: MEASURING CONSUMERS’
EMOTIONAL ATTACHMENT TO SOCIAL MEDIA
Rebecca VanMeter, PhD
The University of Texas at Arlington, 2014
Supervising Professors: Douglas B. Grisaffe and Larry B. Chonko
Researchers have demonstrated the useful applicability of psychological
attachment theory to a variety of marketing contexts, exploring how individual become
attached to special possessions, places, brands, and services. Emotional attachment to
these varied focal targets has been reliably and validly shown to influence important
marketing related behaviors. This dissertation examines social media as a new target of
emotional attachment, which is then linked to marketing related social media behaviors.
To date research has not developed or tested conceptualization or operationalization of
this construct. This dissertation undertakes two specific lines of research activities across
multiple studies. After providing a foundational definition of emotional attachment to
social media, seven studies are conducted to develop a measure that meets desired
reliability and validity standards. The validated measure is then tested to assess its
empirical usefulness in predicting social media behaviors in three different life domains;
social, consumer, and work. Results indicate that the emotional attachment to social
media (EASM) construct is related to proximity maintenance, safe haven, emotional
security, and separation distress, four specific psychological behaviors historically
indicative of attachment. The EASM scale presented here also helps to explain

vi
phenomena such as the amount of time spent on social media platforms and social
media activities in social, work, and consumer domains.

vii
Table of Contents
Acknowledgements .............................................................................................................iii
Abstract ............................................................................................................................... v
List of Illustrations .............................................................................................................. xi
List of Tables ......................................................................................................................xii
Chapter 1 Introduction......................................................................................................... 1
1.1 Overview ................................................................................................................... 1
1.2 Research Purpose .................................................................................................... 5
1.2.1 Objective 1 ......................................................................................................... 5
1.2.2 Objective 2 ......................................................................................................... 5
1.2.3 Objective 3 ......................................................................................................... 6
1.3 Organization of the Dissertation ............................................................................... 6
Chapter 2 A Theoretical Framework for Understanding Attachment to Social
Media................................................................................................................................... 8
2.1 Overview ................................................................................................................... 8
2.2 Social Media ............................................................................................................. 9
2.3 Attachment .............................................................................................................. 11
2.3.1 Individual’s Relationship with an Object .......................................................... 14
2.3.2 Attachment Behaviors ..................................................................................... 14
2.4 Attachment and Social Media ................................................................................. 16
2.5 Forward ................................................................................................................... 17
Chapter 3 Methodology ..................................................................................................... 18
3.1 Overview ................................................................................................................. 18
3.2 Background ............................................................................................................. 18
3.3 Construct Definition ................................................................................................ 19
3.4 Item Generation ...................................................................................................... 20

viii
3.4.1 Exploratory Qualitative Item Generation ......................................................... 20
3.4.2 Literature Review Item Generation.................................................................. 20
3.4.3 Pretesting and Exploratory Examination of Item Pool ..................................... 21
3.5 Item Purification ...................................................................................................... 21
3.6 Assessment of the Measurement Model ................................................................ 23
3.7 Content Validity....................................................................................................... 25
3.8 Internal Reliability ................................................................................................... 26
3.8.1 Cronbach’s Alpha ............................................................................................ 26
3.8.2 Test-Retest Reliability ..................................................................................... 26
3.9 Convergent Validity ................................................................................................ 27
3.10 Criterion-Related Validity ...................................................................................... 28
3.10.1 Concurrent-Related Validity .......................................................................... 28
3.10.2 Predictive Validity .......................................................................................... 29
3.11 Discriminant Validity ............................................................................................. 29
3.12 Nomological Validity ............................................................................................. 33
3.13 Summary .............................................................................................................. 37
3.14 Foreword ............................................................................................................... 37
Chapter 4 Analysis and Results ........................................................................................ 38
4.1 Overview ................................................................................................................. 38
4.2 Study 1 .................................................................................................................... 38
4.2.1 Participants and Design .................................................................................. 38
4.2.2 Item Generation ............................................................................................... 39
4.3 Study 2 .................................................................................................................... 41
4.3.1 Participants and Design .................................................................................. 41
4.3.2 Measures ......................................................................................................... 42
ix
4.3.3 Results ............................................................................................................. 43
4.3.3.1 Initial Sample: Factor Analysis ................................................................. 43
4.3.3.2 Initial Sample: Internal Reliability ............................................................. 43
4.3.3.3 Replication and Verification ..................................................................... 45
4.3.4 Discussion ....................................................................................................... 48
4.4 Study 3 .................................................................................................................... 49
4.4.1 Participants and Design .................................................................................. 49
4.4.2 Measures ......................................................................................................... 50
4.4.3 Results ............................................................................................................. 51
4.4.3.1 Evidence for the Second-Order EASM Measurement Model .................. 51
4.4.3.2 Convergent and Discriminant Validity with Adapted Measures ............... 56
4.4.3.3 Convergent and Criterion-Related Validity with Proximal
Attachment Outcomes.......................................................................................... 58
4.4.4 Discussion ....................................................................................................... 59
4.5 Study 4 .................................................................................................................... 60
4.5.1 Participants and Design .................................................................................. 60
4.5.2 Results ............................................................................................................. 61
4.6 Study 5 .................................................................................................................... 63
4.6.1 Participants and Design .................................................................................. 63
4.6.2 Results ............................................................................................................. 63
4.7 Study 6 .................................................................................................................... 64
4.7.1 Study 6a: Participants and Design .................................................................. 64
4.7.2 Study 6a: Measures ........................................................................................ 64
4.7.3 Study 6a: Results ............................................................................................ 65
4.7.3.1 Initial Evidence for Criterion-Related Validity ........................................... 65

x
4.7.3.2 Evidence for Discriminant Validity ........................................................... 65
4.7.4 Study 6b: Participants and Design .................................................................. 71
4.7.5 Study 6b: Measures ........................................................................................ 71
4.7.6 Study 6b: Evidence for Discriminant Validity ................................................... 72
4.7.7 Discussion ....................................................................................................... 73
4.8 Study 7 .................................................................................................................... 73
4.8.1 Participants and Design .................................................................................. 73
4.8.2 Measures ......................................................................................................... 74
4.8.3 Results ............................................................................................................. 75
4.8.4 Discussion ....................................................................................................... 76
4.9 Forward ................................................................................................................... 76
Chapter 5 Conclusions and Future Research ................................................................... 77
5.1 Overview ................................................................................................................. 77
5.2 Overall Research Findings ..................................................................................... 77
5.3 Managerial Implications .......................................................................................... 78
5.4 Limitations ............................................................................................................... 79
5.5 Future Research ..................................................................................................... 81
Appendix A Social Media Social Behaviors ...................................................................... 83
Appendix B Social Media Work Behaviors........................................................................ 85
Appendix C Social Media Consumer Behaviors ............................................................... 87
References ........................................................................................................................ 89
Biographical Information ................................................................................................. 103

xi
List of Illustrations
Figure 4-1 EASM Measurement Model ............................................................................. 52
Figure 4-2 EASM Single Latent Factor ............................................................................ 55
Figure 4-3 EASM Alternative Second Order Factor Structure .......................................... 55
Figure 4-4 EASM Convergent Validity with Adapted Measures ....................................... 57
Figure 4-5 EASM Discriminant Validity with Adapted Measures ...................................... 57
Figure 4-6 EASM Related to Attachment Outcomes ........................................................ 59
Figure 4-7 Nomological Validity ........................................................................................ 75

xii
List of Tables
Table 4-1 Initial List of Items ............................................................................................. 40
Table 4-2 Exploratory Factor Analysis Results and Internal Reliabilities ......................... 43
Table 4-3 Replication and Verification of Results ............................................................. 46
Table 4-4 Attachment Outcome Items .............................................................................. 50
Table 4-5 Factor Loadings for Measurement Model ......................................................... 53
Table 4-6 Factor Intercorrelations ..................................................................................... 54
Table 4-7 Assessment of Competing Models ................................................................... 54
Table 4-8 Content Validity ................................................................................................. 62
Table 4-9 Total Hours: Model Summary ........................................................................... 67
Table 4-10 Total Hours: ANOVA ....................................................................................... 67
Table 4-11 Total Hours: Coefficients ................................................................................ 67
Table 4-12 Separation Distress: Model Summary ............................................................ 68
Table 4-13 Separation Distress: ANOVA .......................................................................... 68
Table 4-14 Separation Distress: Coefficients.................................................................... 69
Table 4-15 Relative Weights Analysis Results ................................................................. 71
Table 4-16 Correlations with Discriminant Variables ........................................................ 72

1
Chapter 1
Introduction
1.1 Overview
Just a few years ago, we were all talking about the information
revolution today; we are witnessing a social media revolution. For
businesses, it’s a double-edged sword. On one hand, one influencer can
drive thousands of potential customers (or more) to a website or store.
On the other hand, that same influencer can spread his or her
dissatisfaction and erode both your brand equity and profitability.(Jim
Davis, Sr. Vice President & CMO SAS, Harvard Business Review, 2010)
In the past decade, individuals have begun to use the internet in entirely different
ways than was the case over the previous twenty years. Social media has emerged onto
the scene and become a cultural, social, and economic phenomenon that has changed
how individuals engage in interpersonal relationships and interact with companies and
brands. In fact, social media’s deep penetration into many consumers’ everyday lives is
so pervasive that, “all the rituals and rites in which individuals and groups in society
participate… [now] play out on social media platforms” (Chui et al., 2012, pg.1).
Communication about a brand and/or an organization is no longer limited to the
information an organization creates and controls. Social media provides a means for any
individual to create, publish, share, and consume content. This means the
communications that occur surrounding a brand and/or company are not solely broadcast
by marketers to consumers. Rather, consumers are now also generating the content.
This occurs with or without the organization’s approval… a distinctly different experience
than that to which marketing professionals have traditionally been accustomed.

2
Never before have companies had the opportunity to talk to millions of customers, send out messages, get fast feedback, and experiment with offers at relatively low costs. And never before have millions of consumers had the ability to talk to each other, criticizing or recommending products—without the knowledge or input from a company. “Conventional marketing wisdom long held that a dissatisfied customer tells ten individual. But…in the new age of social media, he or she has the tools to tell ten million, says Paul Gillin, author of The New Influencers (Harvard Business Review, 2010, pg.2).
The following facts illustrate the pervasiveness of social media:
It took television 13 years to reach 50 million households and internet
service providers three years to sign their 50 millionth subscriber.
However, it only took Facebook one year to attract 50 million users and
Twitter only nine months (Chui et al., 2012).
By the end of 2012, approximately 67% of all online adults with an online
presence used social media sites. Facebook is now the largest social
media site in the world, currently hosting over 1.2 billion usersa
number that continues to grow. Each day, Facebook processes 2.7
billion “Likes,” 300 million photo uploads, and 2.5 billion status updates
and check-ins (Vance, 2012).
Since its beginning in 2006, Twitter has become the second largest
social media site with over 500 million active users as of 2012.Twitter
generates over 340 million tweets daily and handles over 1.6 billion
search queries per day (Luden, 2012).
Pinterest, the third largest social media site, was launched in March
2010, and by January 2012 had 11.7 million unique users. This makes
Pinterest the fastest site in history to garner 10 million unique visitors
(Constine, 2012).

3
Between 2008 and 2011, the average amount of time spent on social
networking sites more than doubled, as approximately 80% of the world’s
online population used social networks on a regular basis (Chui et al.,
2012).
According to Ipsos (2013), the typical American spends about 3.2 hours
a day… an average of 22.4 hours a week on social networking sites.
The typical global user spends an average of 25.2 hours a week.
Individuals under 35 years of age spend more than a full day (26.6
hours) of their week, on average, on social media sites, while those 35-
49 years of age and 50-64 years of age spend an average of 21 hours
and 17 hours a week, respectively, on social media.
Naturally, the trends have piqued the interest of both marketing researchers and
practitioners, who wish to understand the challenges and opportunities associated with
social media (e.g., Kaplan and Haenlein, 2010; Lapointe, 2012). A groundswell of white
papers and academic articles address different aspects of social media. While some
examine the personality traits of social media users (cf. Ehrenberg et al., 2008; Correa,
Hinsley, and De Zuniga, 2010), others explore how social media usages impacts
individuals (cf. Valkenburg, Peter, and Schouten, 2006) including consumers’ purchase
intentions (cf. Wang, Yu, and Wei, 2012) and brand perceptions (cf. Naylor, Lamberton,
and West, 2012; Stokes, 2012). Still others explore how social media affects selling
environments (cf. Marshall et al., 2012) and the company’s ROI (cf. Fisher, 2009;
Hoffman and Fodor, 2010).
Social media has also become a focal point in the marketing strategies of many
companies. A report by the Social Media Marketing Industry in January of 2013 indicated
4
that 97% of businesses use social media to market their offerings, yet only about one-
third of these businesses believe that they are effectively using the tool (Stelzner, 2013).
This suggests a lamentable disconnect between what marketing managers wish to
accomplish with social media and how well they are utilizing social media. An effective
marketing strategy concentrates resources on optimal opportunities to increase sales and
create a sustainable competitive advantage (Aaker, 2008). While most marketers are
devoting resources to develop effective social media strategies, clear benefits of doing so
are difficult to understand and demonstrate. In general there is a lack of clarity about
what exactly drives consumers’ social media usage and how this affects consumer
behavior. That is, “despite their growing popularity and increasing frequent usage, a
systematic understanding of how social network use affects consumer behavior remains
elusive” (Wilcox and Stephen, 2013, pg.90). A theoretical explanation of the mass affinity
for social media and how this relates to marketing continues to elude scholarly
researchers and mangers (VanMeter and Grisaffe, 2013).
In the current research, attachment theory is applied to social media as a
framework for understanding individuals’ connection to social media and developing a
new construct: emotional attachment to social media (EASM). A series of studies is
conducted to develop and validate a measure EASM. After demonstrating the
psychometric properties of this measure, I demonstrate its power in predicting several
outcomes and behaviors relevant to marketing.
This dissertation, then, aims to achieve three important objectives: (1)
understanding the nature and structure of EASM, (2) developing a scale that reflects this
structure and measures emotional attachment to social media in a reliable, valid, and
generalizable manner, and, (3) examining marketing relevant outcomes which EASM is

5
hypothesized to influence. In the sections that follow, these objectives are discussed in
greater detail.
1.2 Research Purpose
1.2.1 Objective 1
The first objective of this research is to gain a conceptual understanding of the
nature and structure of the emotional attachment to social media construct. I define
emotional attachment to social media (EASM) as an emotion-laden bond between a
person and social media, characterized by affective and cognitive connections with
others and oneself facilitated by social media. In order to accomplish this first objective I
draw on research in psychology to demonstrate that individuals develop attachments to
objects, events, and activities, including engaging in social media.
1.2.2 Objective 2
The second objective of this research is to employ a rigorous scale development
process in order to (1) develop a psychometrically reliable measure of the strength of
consumers’ EASM and (2) demonstrate the scale’s validity. Towards this end, I follow
procedures recommended by Churchill (1979) and DeVellis (2003) to create the EASM
scale.
First, the scale is constructed on the basis of both affective and cognitive terms
that reflect the strength of consumers’ attachments to social media. Convergent validity is
then demonstrated, showing that the EASM measure maps onto adapted versions of two
previously published and highly cited measures of emotional attachment to brands
(Thomson, MacInnis and Park, 2005; Park et al., 2010). Additionally, convergent validity
is assessed in relation to measures of proximity maintenance, safe haven, emotional
security, and separation distress (Bowlby, 1980; Hazan and Zeifman, 1999; Thomson,
MacInnis and Park, 2005). Next, discriminant validity is established by showing that the

6
EASM measure is empirically distinct from measures of sociability, social comparison,
and information credibility. Finally, predictive validity of the EASM scale is assessed
revealing that the scale predicts outcomes such as time spent on social media and
behaviors across three different life domains.
1.2.3 Objective 3
The third objective of this research is to develop a theoretically-based model that
tests outcomes of EASM. Because attachment theory has been shown to have an
association with related behaviors (e.g., proximity maintenance), an attachment-based
approach to understanding social media phenomena is expected to show a tie to related
social media behaviors that are of interest to marketers. That is, I undertake an
attachment-based exploration of the affinity for social media and explore behavioral
consequences of that attachment including time spent on social media platforms and
engaging with brands and companies.
1.3 Organization of the Dissertation
The remainder of the dissertation is broadly organized as follows. In Chapter 2,
the theoretical foundations of social media and the attachment literature are reviewed,
followed by the theoretical motivations that suggest why a subset of individuals develops
an emotional attachment to social media.
Chapter 3 describes the nature and structure of emotional attachment to social
media and outlines the development of the emotional attachment to social media (EASM)
scale that measures this structure. Items reflecting the EASM construct are generated
and reduced to a parsimonious set based on the results from multiple measure-
development studies. In Study 1, item generation occurs. In Study 2 the EASM measure
is validated and replicated with two additional samples (one comprised of students and
the other one of non-students). Study 3 confirms the structure of EASM using

7
confirmatory factor analysis (CFA); and assesses convergent validity and discriminant
validity by examining how the scale relates to existing measures of emotional attachment
to brands adapted to reflect emotional attachment to social media. This entails assessing
the scales convergent and criterion-related validity. Study 4 demonstrates the content
validity of the scale, and Study 5 establishes the stability of the EASM scale over time
(i.e., test-retest reliability). Then, Study 6 demonstrates the criterion-related, convergent,
and discriminant validity of the measure. Finally, Study 7 assesses the nomological
network and predictive validity of EASM by examining the extent to which the scale
predicts outcomes purported to emerge from strong emotional attachment, such as using
social media across various life domains (social, consumer, and work related).
In Chapter 4, results are discussed in detail. The eight-factors (“Connecting,”
“Nostalgia,” “Informed,” “Enjoyment,” “Advice,” “Affirmation,” “Enhances My Life,” and
“Influence)” reflecting EASM are described and explained and results demonstrating the
reliability and validity of the scale are presented.
The dissertation concludes with Chapter 5, where the contribution of the current
research to the literature is presented and the limitations of the research identified.
Finally, the theoretical and practical implications of this research are reviewed and
directions for future research are discussed.

8
Chapter 2
A Theoretical Framework for Understanding Attachment to Social Media
2.1 Overview
Over the past two decades interest in relationship marketing has flourished
among academicians and practitioners. Marketing managers strive to develop
relationships with consumers hoping this will enable their organizations to establish
enduring, stable, and profitable interactions with consumers (cf. Sheth and Parvatiyar,
1995). While building such relationships is associated with clear economic benefits, it
requires that organizations understand the nature of their consumers and the drivers of
relationships with them. Complicating matters is the fact that today’s consumers are more
empowered than ever before (Harvard Business Review, 2010), with a host of social
media and digital devices that allow them to connect with one another to discuss brands
and products, as well as interact with brands easily and in real time. For these reasons,
“those that use social media strategically have an opportunity to deepen connections with
their consumers, building affinity and loyalty” (Powers et al., 2012, pg.480).
Social media is defined as, “interactive platforms via which individuals and
communities create and share user-generated content” (Kietzmann et al., 2011). Given
marketers’ desire to form relationships with consumers and consumers’ prolific use of
social media, the use of theory about relationship formation provides a foundation to
investigate consumers’ social media behaviors. Attachment theory represents a
substantial research tradition that has been instrumental in advancing knowledge about a
variety of emotionally-laden relationships. Consequently, attachment theory presents a
logical framework for investigating the way individuals interact and use social media, and
how this impacts consumer behavior. Research utilizing attachment theory has shown
that “strong attachments develop over time and are often based on interactions between

9
an individual and an attached object” (Baldwin et al., 1996). The interactions individuals
have with a given attached object encourage the development of meaning and can
invoke strong emotions in reference to the object (Thomson, MacInnis and Park, 2005).
Consumers may be emotionally attached to any number of objects and the attachment is
generally regarded as profound and significant (cf. Ball and Tasaki, 1992; Richins,
1994a). Just as individuals develop emotional attachments to other people, places, and
brands, I propose that individuals may also develop emotional attachment to social
media.
In the section that follows I review the literature pertaining to social media.
Following this, I review various perspectives on attachment theory and how this affects
behavior. Finally, I describe how attachment theory maps onto and social media usage
and how this influences behavior. The objective of this selective literature review is to
develop a theoretical foundation for the scale development process described in Chapter
3.
2.2 Social Media
According to Wilcox and Stephen (2013), “despite their growing popularity and
increasingly frequent usage, a systematic understanding of how social network use
affects consumer behavior remains elusive” (pg.90). Social media has become a cultural
and social phenomenon that has changed the way millions of individual and businesses
connect and communicate. A little more than a decade ago, AOL began allowing users to
communicate with one another online through instant messenger and chat rooms
centered on topics of interest. Soon thereafter Friendster, MySpace and LinkedIn were
created allowing users to connect with others and to create and share personal
information. Next, came Facebook, which combined the functions of several of the
existing social networking sites. These social media platforms provide a means through

10
which individual can share photos, connect, and communicate. It is no surprise that
academic researchers and practitioners in marketing alike are interested in this new form
of communication, and wish to understand the challenges and opportunities associated
with social media (e.g., Kaplan and Haenlein, 2010; Lapointe, 2012)
Research about social media users is burgeoning. Studies have shown that there
is a relationship between an individual’s social media usage and one’s personality traits…
including, extraversion, neuroticism, emotional stability, and openness to experiences
and (Ross et al., 2009; Zywica and Danowski, 2008; Ehrenberg et al., 2008; Correa et.al.,
2010). Other extant literature has shown social media helps individuals to stay connected
with others (Raacke and Bonds-Raacke, 2008), to create and maintain social capital
(Ellison, Steinfield, and Lampe, 2007), and to enhance their self-esteem and well-being
(Valkenburg, Peter, and Schouten, 2006). Consumer behaviorists have discovered that
social media usage causes individuals to have increased self-esteem, leading to a
decrease in self-control (Wilcox and Stephen, 2013).
Other research focuses on understanding how using social media impacts
marketing-related outcomes and phenomena, such as consumers’ purchase intentions
(Wang, Yu, and Wei, 2012), brand perceptions (Naylor, Lamberton, and West, 2012;
Stokes, 2012), the selling environment (Marshall et al., 2012), and company ROI (Fisher,
2009; Hoffman and Fodor, 2010). Exploration in this area shows that consumers use
Facebook as a venue to reflect their actual and ideal selves by creating brand
connections on their personal page(s)1 (Hollenbeck and Kaikati, 2012). Other research
suggests that social media impacts the selling environment (Marshall et al., 2012), sales
1The word "post" is used here to refer to the general ability to share content, with the
understanding that for different social media platforms, the action of creating content is referred to differently (e.g., Tweet for Twitter, Pin for Pinterest, and Post or Like for Facebook)."Page" refers to the general platform or account (Facebook page, Twitter feed, and Pinterest board, etc.).

11
elasticity (Stephen and Galak, 2012), and influences the diffusion process for consumer
new products (Katona, Zubcsek, and Sarvary, 2011). Research also demonstrates that
consumers’ brand evaluations and purchase intentions are influenced by the mere
presence of other users’ demographic characteristics displayed on a brand’s social media
page (Naylor, Lamberton, and West, 2012).
Another area of investigation focuses on how social media can/should be
integrated into an organization’s marketing strategy, given that consumers now use social
media to gain knowledge about companies and their brands (Hanna, Rohm, and
Crittenden, 2011; Goldenberg, Oestreicher-Singer, and Reichman, 2012; Kietzmann et
al., 2011; Lapointe, 2012). Researchers generally agree that organizations should not
only integrate social media into their marketing strategies (Hanna, Rohm, and Crittenden,
2011; Hennig-Thurau et al., 2010; Kaplan and Haenlein, 2010; Andzulis, Panagopoulos,
and Rapp, 2012; Kaplan, 2012), but should also utilize social media to facilitate customer
value co-creation (Trainor, 2012; Agnihotri et al., 2012). All of these activities necessitate
the development of meaningful relationships between organizations and consumers via
social media, which is informed by an understanding of attachment theory.
2.3 Attachment
Although attachment theory, was initially developed to explain the parent-infant
relationship, it is now is believed to be an important component of human experience
“from the cradle to the grave” (Bowlby, 1979, pg.129). Attachment is defined as an
emotion-laden parent-infant bond (Bowlby, 1979; 1980) where each party manifests
intense pleasure in the other’s company. The attached individual is especially content
when the other expresses affection, whereas distance and expressions of rejection are
regarded as disagreeable or painful. Disconnection from the attachment figure produces
anxiety and distress (Bowlby, 1969; 1979; 1980; Ainsworth and Bell, 1970). Emotional

12
attachment to others satisfies a basic human need, hence the strong desire to maintain
proximity to the attachment figure. When an individual experiences stress in the external
environment, that person often seeks physical and psychological protection provided by
the attachment figure (Thomson, MacInnis, and Park, 2005). Although attachment begins
as a child’s attachment to their parent, it continues through to adult relationships with
friends and siblings (Trinke and Bartholomew, 1997), same-sex or opposite-sex peers
(Asendorpf and Wilpers, 2000), romantic partners (Hazan and Shaver, 1994), elder
children and men who are “buddies” (Weiss, 1988), teachers, coaches, religious leaders
or psychotherapists (Colin, 1996), as well as celebrities (Perse and Rubin, 1989; Adams-
Price and Greene, 1990; Alperstein, 1991; Thomson, 2006).
More recently, attachment has been examined from two different perspectives:
(1) an interpersonal attachment style (i.e., an individual difference trait); or, (2) as an
individual’s relationship with an object. While both approaches ultimately manifest
themselves in attachment behaviors, there are key differences in the individual-object
versus the trait perspective (Park, MacInnis, and Priester, 2007). In the trait perspective,
attachment is viewed as an individual difference variable characterizing one’s systematic
style of connection across relationships (i.e., secure, dismissing, preoccupied, and
fearful). With the individual-object perspective, attachment involves the strength of the
cognitive and affective link between a consumer and an object; denoted as a
psychological state of mind (Thomson, MacInnis and Park, 2005). I adopt the latter
treatment of attachment, examining the links between consumers and social media.
According to attachment theory, an individual’s more contextualized and
relationship-specific models are “subordinate” to their more highly generalized and
abstracted attachment models (Collins and Read, 1994; Crittenden, 1990; Overall et al.,
2003; Pierce and Lydon, 2001). More generalized attachments form over time as a result

13
of familial relationships early on, and in peer relationships later in a person’s life (e.g.,
Bowlby, 1969). As individuals mature and expand their network of relationships, these
general attachments then influence the more contextualized attachments that develop for
the specific relationship(s) the individual forms (Collins and Read, 1994). Specifically, in
response to significant attachment experiences, individuals’ relationship-specific
attachments are likely to change. These in turn, influence their more abstract and
generalized attachments, particularly if the experiences happened in a vital attachment
relationship. Recent research substantiates that relationship-specific attachments are
much more powerful in shaping general attachments over time than general attachments
are in shaping relationship-specific attachments (Pierce and Lydon, 2001). Thus far,
attachment research has shown that general and relationship-specific attachments are
indeed related (Cozzarelli et al., 2000; Overall et al., 2003; Pierce and Lydon, 2001),
although little is known about which type of relationship-specific attachments are most
strongly predictive general attachments (Klohnen et al., 2005).
While this dissertation draws upon individual-object attachments, a brief history
of the trait perspective is provided. Research in marketing suggests that one’s
attachment style predicts a person’s pattern of commitment, involvement, and satisfaction
when that individual is in a consumption relationship with a brand or service provider
(Thomson and Johnson, 2006; Mende and Bolton, 2012). Similarly, an individual’s
attachment style predicts brand choice based on preference for certain brand personality
types (Swaminathan, Stilley, and Ahluwalia, 2009), as well as repurchase and word-of-
mouth intentions (Mende, Bolton, and Bitner, 2009). Although knowledge about general
attachment style provides valuable insights, this does not explain how consumers relate
to specific objects. “It is now well established that individuals develop a multitude of
attachment styles that are organized hierarchically from general to relationship-specific

14
attachment styles” (Mende, Bolton, and Bitner, 2012, pg.127). Thus, an individual’s
attachment style can materialize as relationship-specific, which may or may not be
consistent with the person’s general or higher-level style (Klohnen et al., 2005).
2.3.1 Individual’s Relationship with an Object
Although attachment research initially focused on parent-child relationships,
more contemporary theoretical conceptualizations encompass a wider array of
relationships and contexts. More recent work demonstrates that individuals not only form
emotional attachments to other individuals, but also to a variety of objects, including pets
(Hirschman, 1994; Sable, 1995), places (Rubinstein and Parmelee, 1992; Hill and
Stamey, 1990), religious symbols and ideals (Kirkpatrick, 1995), gifts (Mick and DeMoss,
1990), collectables (Slater, 2000), brands (Greyer et al., 1991; Schouten and
McAlexander, 1995; Fournier and Yao, 1997; Thomson, MacInnis, and Park, 2005; Park
et al., 2010), other special objects (Ball and Tasaki, 1992; Kleine, Kleine, and Allen,
1995; Price, Arnould, and Curasi, 2000; Richins, 1994a; 1994b; Wallendorf and Arnould,
1988; Grayson and Shulman, 2000; Kleine and Baker, 2004), and firms and service
employees (Mende and Bolton 2011; Mende, Bolton, and Bitner, 2012). Extending these
research findings, it seems reasonable to propose that individuals can also develop an
emotional attachment to social media as another kind of object or activity. A broader
definition is offered by Thomson, MacInnis, and Park (2005) who view attachment as an
emotion-laden, target-specific bond between a person and a specific object. As the
attachment phenomenon became more popular, attachment has been determined to vary
in strength (Aron and Westbay, 1996; Baldwin et al., 1996).
2.3.2 Attachment Behaviors
Individuals who are attached to an object or individual typically engage in specific
behaviors, including: distress upon separation, seeking a safe haven, seeking emotional

15
security, and proximity maintenance (Bowlby, 1980; Hazan and Shaver, 1994; Hazan and
Zeifanman, 1999). A person who is intensely attached to an object is concerned with (1)
attaining or retaining proximity to the target of one’s attachment. That proximity fosters (2)
a sense of emotional security that allows the individual to function successfully in his or
her environment. When one experiences stress in the external environment, s/he will
seek (3) a safe haven in the form of physical or psychological protection provided by their
attachment object. Finally, if the individual experiences real or threatened separation from
the attachment object, (4) distress results in the form of negative emotions (e.g., anger,
frustration, and sadness).
In past research attachment has been assessed by presence of these four
attachment behaviors. That is, one’s bond is inferred from the person’s behavior with
respect to the target object. The more distress an individual demonstrates when the
target object is removed, the more that person is assumed to be intensely attached to the
object (Berman and Sperling, 1994; Weiss, 1988; 1982). This approach was pioneered
by Bowlby (1980), whose research focused on infants and children subjects who are
incapable of clearly articulating their feelings towards an attachment object. More recent
attachment research on adults (Thomson, 2006; Thomson, MacInnis, and Park, 2005)
employs self-report measures of emotional attachment. Regardless of measurement
approaches, researchers generally concur that attached individuals behave in specific
ways with respect to the attachment object. Given this I offer the following predictions:
H1: Separation Distress: Individuals who are more highly emotionally attached to social media will experience more distress when separated from social media than those who are less emotionally attached to social media. H2: Safe Haven: Individuals who are more emotionally attached to social media will use social media as a safe haven more than those who are less emotionally attached to social media.

16
H3: Emotional Security: Individuals who are more emotionally attached to social media will use social media for emotional security more than those who are less emotionally attached to social media. H4: Proximity Maintenance: Individuals who are more emotionally attached to social media will maintain proximity to social media more than those who are less emotionally attached to social media.
2.4 Attachment and Social Media
With the emergence of social media, consumers not only have the ability to
share, connect, and interact with each other, but also with brands, companies, and
organizations. This represents a notable change from past company-consumer
interactions, when the marketers controlled communications, that were largely
unidirectional. Social media usage among consumers is motivated by different factors,
including fulfillment of an individual’s social needs; affiliation, self-expression, self-
presentation, self-esteem, increasing social capital, and receiving support (Back et al.,
2010; Gonzales and Hancock, 2011; Valkenburg et al., 2006). If interaction with social
media does indeed provide an avenue by which intrinsic human needs are fulfilled, it
seems reasonable to suggest that individuals could become emotionally attached to
social media. Assessment of this potentiality necessitates the development of a scale that
measures the extent to which individuals can/do become attached to social media.
As mentioned previously, past researchers have operationalized attachment
theory in the context of brands, places, and objects, and have assessed the degree of
attachment by observing behaviors and using self-report measures. However no one has
described a way to measure an individual’s attachment to social media. Heavy users of
social media log on to their preferred social media platforms dailysometimes multiple
times per day for a variety of purposes. Individuals potentially can use social media in
variety of ways. For example, a student is who attends college out-of-state could use
social media to stay in touch with her friends that attend other universities around the

17
country using social media for social connections. She could also use social media to
learn about sales events her favorite retailer is having that week and enter the retailer’s
contestusing social media to stay informed and connected to the retailer. Further, she
could use social media to communicate with coworkers and promote online coupons for
the local sandwich shop that she works at part-time using social media for work
purposes to influence those in her social network. The development of an emotional
attachment to social media (EASM) measure will allow researchers to gain a deeper
understanding of individual’s social media behaviors across different life domains and to
gauge how each is related to EASM. Based on this, I offer the following hypotheses
about how social media pervades one’s different life domains:
H5: Social Behaviors: Individuals who are more highly emotionally attached to social media will be more active socially within social media than those who are less emotionally attached to social media. H6: Consumer Behaviors: Individuals who are more highly emotionally attached to social media will be more active as consumers within social media than those who are less emotionally attached to social media. H7: Work Behaviors: Individuals who are more highly emotionally attached to social media will be more active with work within social media than those who are less emotionally attached to social media.
2.5 Forward
The next chapter outlines the development of the emotional attachment
to social media scale. The scale development process follows accepted academic
procedures to ensure a valid and reliable scale is established. Subsequently, a
description of the data that allows for the testing of the hypotheses and the results will be
reported and discussed.

18
Chapter 3
Methodology
3.1 Overview
This chapter presents an overview of the methodology used in developing a
scale to measure consumers’ emotional attachment to social media (EASM). The scale
development procedures are described with a description of the analytic procedures used
to each step in the process. Followed by a discussion of the conceptual meaning of eight
subdimensions that I hypothesize comprise EASM, and how EASM relates to the
attachment behaviors. The chapter concludes with a description of the analytic
procedures used to investigate EASM’s relationship with social, consumer, and work
behaviors.
3.2 Background
As explained previously, an individuals’ relationship-specific attachment to an
object predicts the outcomes in a specific relationship (Belk, 1988; Grisaffe and Nguyen,
2011) better than an individual’s general attachment style (Thomson, Whelan, and
Johnson, 2012; Thomson and Johnson, 2006; Swaminathan, Stilley, and Ahluwalia,
2009; Mende, Bolton, and Bitner, 2009, Klohnen et al., 2005). While some work has been
done to create a shortened version of the scale measuring interpersonal attachment style
(cf. ERC-S: Wei et al., 2007), others have created scales explicitly to measure
consumers’ emotional attachment to objects such as brands (cf. EAB: Thomson,
MacInnis, and Park, 2005; Park et al., 2010), service employees, and firms (Mende and
Bolton, 2012; Mende, Bolton, and Bitner, 2013). The problem with using scales like the
ERC-S is that psychological personality scales tend to measure elements of the self-
concept that are not relevant to objects and do not capture other highly relevant
elements. Further, adapting a scale that is originally intended to measure a self-concept

19
and using it to measure object-specific information might be limited in content and lack
construct validity. Instead, an individual’s specific relationship in the domain of interest
should be measured in order to maximize predictive ability and validity (Klohnen et al.,
2005). Therefore this dissertation aims to develop a reliable, valid, and generalizable
scale that measures consumers’ EASM is the main objective of this dissertation. In doing
so, I follow well-accepted procedures for the conceptual development of factor
identification (Hair et al., 2010) and the scale development process (Churchill, 1979;
Crocker and Algina, 1986; DeVellis, 2003; Gerbing and Anderson, 1988; Netemeyer,
Bearden, and Sharma, 2003; Nunnally and Bernstein, 1994). This process involves
construct definition, item generation and purification, content validity, reliability and
validity assessments.
3.3 Construct Definition
This phase of scale development requires specificity in delineating the
construct’s domain and facets, and in establishing what the construct does or does not
entail (Churchill, 1979; Zaichkowsky, 1985; Haynes, Nelson, and Blaine, 1999; Haynes,
Richard, and Kubany, 1995; Nunnally and Bernstein, 1994). The construct domain may
be specified via a literature review of related constructs and measures (Clark and
Watson, 1995; Haynes et al., 1999). Importantly, the measure for the construct must
possess content validity and be appropriate for reliably and accurately predicting
behaviors. EASM is defined here as an emotion-laden bond between a person and social
media, characterized by affective and cognitive connections with others and one’s self
facilitated by social media. As discussed in Chapter 2, when investigating relationship
outcomes, the relationship-specific attachment perspective is more appropriate than the
higher-level individual attachment approach.

20
3.4 Item Generation
Item generation involves generating a representative pool of items for each
dimension of the construct (Churchill, 1979). Often, open-ended responses are converted
into items for the different dimensions (Richins and Dawson, 1992; Shimp and Sharma,
1987). It is important to develop items that are clear, concise, and specific (Peterson,
1999; Podsakoff et al., 2003; Spector, 1992), and to purge items that are verbose,
obscure, or confusing (Angleitner and Wiggins, 1985). The extant literature is examined
to uncover additional scale items, which are then incorporated with the other items to
comprise the initial set of items (Bearden, Hardesty, and Rose, 2001). In this stage of
scale development, validity means value defined as important, interesting, or useful
(McGrath and Brinberg, 1983). To satisfy these recommendations, item generation is
conducted in the three phases that follow.
3.4.1 Exploratory Qualitative Item Generation
In order to create an understanding of the underlying dimensions of emotional
attachment to social media (EASM) and to attain items that utilize verbiage of social
media users, approximately twenty respondents provide ratings and qualitative
descriptions about the role of social media in their lives. This exercise provides qualitative
data in order to generate items. A thematic analysis is conducted on the text of qualitative
responses to classify the verbatims into the dimensions based on the natural language of
respondents.
3.4.2 Literature Review Item Generation
Other potential items are generated from the literature on attachment theory and
social media (e.g., Hollenbeck and Kaikati, 2012; Fennis, Pruyn, and Maasland, 2005;
Wilcox and Stephen, 2012; Hanna, Rohm, and Crittenden, 2011). Multiple dimensions
are expected to emerge based on the results of previous research of emotional
21
attachment (Thomson, MacInnis, and Park, 2005; Park et al., 2010), which conceptualize,
the construct as a higher-order construct with underlying subdimensions.
3.4.3 Pretesting and Exploratory Examination of Item Pool
A preliminary pool of items is developed based on qualitative research and a
review of literature. Pretests of these items are conducted and correlations, descriptive
statistics, and item analyses are examined to identify low communalities, any ambiguity in
the language used, and potential complexities in wording that might represent more than
one underlying concept in a single item. Based on these early statistical explorations and
conceptual item analyses, changes are made to the initial set of items to enhance the
starting pool and more accurately sample the domain of interest.
The key informant technique is then applied to the improved item pool as a
continuation of this exploratory research (Parasuraman, Grewal, and Krishnan, 2006).
The pool of items is sequentially presented separately to each of two industry experts,
who are asked to provide feedback on the items. The aim is to obtain a preliminary check
of face validity, content validity, and thoroughness of domain coverage. Items are
modified, created, and/or rejected based on the comments of these informants. Following
this exploratory process the remaining items are used to collect subsequent quantitative
data to explore the structure of the item pool and to undertake item purification using
accepted scale development practices.
3.5 Item Purification
Item purification is undertaken to ensure that the developing scale is measuring
what it is intended to measure and to further refine the item pool (cf. Shimp and Sharma,
1987; Bearden, Hardesty, and Rose, 2001). Factor analysis is utilized to reduce data and
refine a developing scale (Ford, MacCallum, and Tait, 1986). Items are eliminated based
on several criteria, including: factor loadings, the correlation (or regression weight) of a

22
variable with a factor, inter-item correlations, and item-to-total subscale correlations to
determine if the items have statistically high correlations with their intended dimension.
The outcome of item purification is a reduced set of items that more closely represents
the construct being evaluated.
Exploratory factor analysis (EFA) allows a researcher to discover the nature of
the constructs influencing a set of responses by statistically determining the number of
common factors sometimes called dimensionsinfluencing a scale or set of measures.
Orthogonal rotation methods assume that the factors in the analysis are uncorrelated,
while, oblique rotation methods assume that the factors are correlated (Gorsuch, 1983).
Oblique EFA determines the strength of relationship (correlation) between each construct
of interest within a scale. Factor axes are rotated in order to obtain simple and
interpretable factors (Yaremko, 1986). The objective of EFA is to maximize the percent of
variance explained by the model that it lays out. The researcher does not need to have a
model in mind at the onset of EFA; factors are derived from the data and then interpreted
by the researcher.
Exploratory factor analysis also helps determine the structure of the items.
Principal component analysis with oblique rotation is used because I believe there is a
second-order construct comprised of factors that are correlated. Any factor loading
greater than 0.5 is assumed to possess practical significance (Hair et al., 2010) any item
not demonstrating practical significance is eliminated. Item elimination also occurs if the
item demonstrates significant cross-loadings (above 0.4) between two or more factors
and non-significant loadings (less than 0.5) on any one factor. The decision of the
appropriate number of factors is based on a combination of conceptual foundation and
empirical evidence (Hair et al., 2010).

23
Although a set of subdimensions that underlie EASM as a second-order
construct have been considered, the results of EFA allow for interpretable sets of items
that group together, have some practical relevance and are empirically supported (Hair et
al., 2010). The constructs are then named and investigated further. Empirically, a solution
with more than 60% of variance explained and communalities of 0.6 or higher is deemed
appropriate. This is an iterative process, in that the loadings and communalities change
as items are eliminated. The final solution results from multiple iterations of item deletions
and analysis.
Rosenthal and Rosnow (1991) argue that "Replicability is almost universally
accepted as the most important criterion of genuine scientific knowledge" (pg.9), which
suggests that replication, is held in high regard by some scientists. Holding all other
things constant, the inability to obtain similar findings in a replication indicates the need
for further investigation. On the other hand, a successful replication promotes confidence
in the reliability of the results and suggests the need to investigate whether the findings
can be generalized to different products, geographical areas, populations, and so on
(Hubbard and Armstrong,1994). “Replications and extensions play a valuable role in
ensuring the integrity of a discipline's empirical results” (Hubbard and Armstrong, 1994,
pg.233). Once a final solution is reached, the results are replicated in a comparable
sample (students) and a more generalized sample (non-students) in order to advance the
reliability of the emotional attachment to social media measure.
3.6 Assessment of the Measurement Model
Once the initial factor structure is determined and replicated in the item
purification phase, assessing of the developing scale’s latent structure, dimensionality,
reliability, and validity is the next step (Bassi, 2011). The quality of the factor structure is
typically tested by using confirmatory factor analysis (e.g., Grégoire, Laufer, and Tripp,
24
2010), which seeks to ensure the proposed model provides the best representation of the
data and contains only appropriate dimensions with necessary items. Confirmatory factor
analysis (CFA) allows a researcher to investigate the hypothesis that a connection exists
between a set of observed variables and their higher-order latent factor(s). Here the
empirical research and/or existing knowledge within the field about the theory, allows for
the creation of a hypothesized model prior to testing it statistically.
Unlike other statistical techniques, CFA uses various measures to determine the
adequacy of fit for the model. The reported fit indices follow the commonly accepted
standards in extant literature. Because CFA can be used to demonstrate construct
validity of a measure by linking observed variables to their underlying constructs (Floyd
and Widaman, 1995), factors, and their respective items, are subjected to a CFA to
confirm the factor structure of the EASM measure. The measurement model fit assesses
the appropriateness of the multi-dimensional factor structure determined in the item
purification phase. The χ² test of significance is also assessed. Fit statistics for this model
must meet or come very close to meeting all the standard criteria (root mean square error
of approximation [RMSEA] < .06, nonnormed fit index [NNFI] > .95, comparative fit index
[CFI] > .95, standardized root mean square residual [SRMR] < .08; Hu and Bentler,
1999). Additionally, all t values associated with the items must be statistically significant
and have standardized factor loadings greater than 0.60.
Next, the multi-dimensional factor model is compared to a one-factor model, and
alternative factor models. Each of the nested models results are compared to determine if
there is a significant change in chi squared. Evidence of construct validity demonstrates
the appropriateness of the multi-dimensional measure. The analysis is conducted using
LISREL 9.0.

25
3.7 Content Validity
Content validity is the representativeness of the content of the measurement
instrument. Expert judges assess scale items iteratively in multiple stages. Items not
assigned to a dimension by the majority of the judges are eliminated. Validity at this stage
means correspondence of fit (McGrath and Brinberg, 1983). Lawshe (1975) points out
that demonstrating content validity requires an accumulation of research results and he
recommends calculating the Content Validity Ratio (CVR) for each item comprising the
scale using the following formula to determine if the item is representative of the
dimension being measured:
Ne – N/2
CVR=
N/2
*Where ne is the number of panelists that classify the item correctly and N is the total
number of judges.
The more judges who classify the item correctly, the greater the item’s degree of
content validity in measuring the scale’s dimensions. Any items that have a low or
negative CVR are eliminated from the developing scale. Next, the Content Validity Index
(CVI) for the entire scale is calculated to assess the extent to which overlap occurs
between the test items and the domain they are meant to assess (Lawshe, 1975). Item
adjustments and eliminations are made on the basis of its CVI.
Further, a benchmark of chance assignment is examined. A random sorting of
items into available dimensions produces an expected correct proportion by chance
alone. A chance-corrected test of classification reliability compares the observed correct
classification proportion in the sample against a hypothesized value of chance

26
assignment. A more stringent alpha to account for multiple item tests is applied (e.g.,
Bonferroni correction), and all tests must remain statistically significant.
3.8 Internal Reliability
Internal reliability is the degree to which items within the scale are representative
of the construct being measured (Pedhazur and Schmelkin, 1991). The objective is to
create a scale that allows for adequate sampling of the possible items representing the
concept, while also ensuring that the scale produces high levels of reliability
(Zaichkowsky, 1985). Using CFA results, reliability estimates are calculated for each
dimension based on the standardized loadings from the model that best represents the
data (identified through prior model testing) (Fornell and Larcker, 1981). Outside of CFA,
the most commonly used measures are Cronbach’s alpha (Price and Mueller, 1986) and
test-retest reliability (Churchill, 1979).
3.8.1 Cronbach’s Alpha
Once a factor solution is derived that demonstrates a distinct pattern, the
reliabilities of the construct will be assessed using Cronbach’s alpha. Cronbach’s alpha is
the average of all the possible split half correlations. Nunnally and Bernstein (1994)
recommend retaining items that collectively produce a Cronbach’s alpha of 0.7 or higher.
3.8.2 Test-Retest Reliability
Test-retest reliability shows a scale possesses “repeatability” or stability over
time, measurement occasions, and subjects (Bollen, 1989; Nunally and Bernstein, 1994).
The idea is to demonstrate that the scale truly reflects its intended construct by showing
that it elicits similar responses from the same respondents in different measurement
periods. A test-retest or “stability” coefficient is estimated by calculating the magnitude of
the correlation between the same measures (and sample) on different assessment
27
occasions (Netemeyer, Bearden, and Sharma, 2003). Reliability of the scale is enhanced
when the stability coefficient is high in magnitude (Haynes et al., 1999).
3.9 Convergent Validity
Convergent validity occurs at the item level and the construct level. At the item
level it is important the items are indicators of the latent construct and share a high
proportion of common variance or converge on the latent construct (Hair et al., 2010).
There are several ways to determine convergent validity at this level. The first method is
to examine the communalities of the items, which represents how much variation in an
item is explained by the latent factor, as discussed earlier communalities greater than .60
are desired. The second method is to calculate the average variance extracted (AVE).
This is a summary indicator and an AVE above .50 is desirable (Fornell and Larcker,
1981). AVE indicates more variance is explained by the latent structure imposed on the
measure than is explained by the error and is calculated by the sum of all squared
standardized factor loadings divided by the number of items. The third item-level
assessment of convergent validity often used at this stage of development is construct
reliability (CR), which is the squared sum of the factor loadings for each latent construct
divided by the squared sum of the factor loadings for each latent construct plus the sum
of the error variance for the latent construct (Hair et al., 2010). The rule of thumb is a CR
greater than .70 demonstrates the dependably of all items representing the latent
construct (Fornell and Larcker, 1981).
Further, at the construct level, convergent validity is the extent to which multiple
measurements of a construct are in agreement (Bagozzi, Davis, and Warshaw, 1992).
This is assessed by examining at how the EASM scale relates to existing scales that
measure consumers’ emotional attachment to brands (Thomson, MacInnis, and Park,
2005; Park et al., 2010) that have been adapted to reflect social media instead of brands.

28
High correlations would provide evidence the constructs are tapping into something
similar. However, it is not desired that the scales are too highly correlated. If the
correlation is too high, the new scale would not be adding anything new above and
beyond what the adapted existing scales are capable of assessing. Convergent validity is
assessed by running CFA with the adapted measures of emotional attachment
(Thomson, MacInnis, and Park, 2005; Park et al., 2010).
3.10 Criterion-Related Validity
Criterion-related validity involves the ability to draw inferences from test scores to
other relevant constructs. Some criteria cannot be directly measured, and it is customary
to differentiate between the two types of criterion-related validity: concurrent and
predictive (Crocker and Algina, 1986, pg.224).
3.10.1 Concurrent-Related Validity
Evidence of the measure’s validity is further examined by exploring the
relationship between EASM and a logical outcome variable measured on a different
scale. Concurrent validity is evident when the scores on the test relate to a real
behavioral variable of practical importance (Crocker and Algina, 1986) measured at the
same time. The most important aspect of criterion-related validity is the strength of the
empirical relationship between the two variables (DeVellis, 2003). To check the criterion
validity of the new EASM scale, time spent on each of the social media platforms is
collected from respondents with self-report measures. The measure of total hours is
created by summing the time reported across all platforms participants used. The
correlation between average hours spent on social media and EASM is estimated to
demonstrate concurrent validity.

29
3.10.2 Predictive Validity
Predictive validity relates to the accuracy of the developing scale and the
constructs within it and whether the scale allows the researcher to forecast measures of
another construct when there is an expected relationship (Bagozzi, Davis, and Warshaw,
1992). As discussed in the literature review of attachment theory, there are four
behaviors that are known to be related to emotional attachment: separation distress,
proximity maintenance, safe haven, and secure base. It is expected that those who are
highly emotionally attached to social media will be more likely to exhibit these attachment
behaviors than those who are less emotionally attached to social media. Structural
equation modeling is used to test the predicted relationship with the attachment
outcomes.
Additionally, EASM is expected to relate to specific behaviors within social media
across various life domains (social, work, and consumer). The ability of EASM to predict
social media behaviors is investigated using structural equation modeling. It is expected
that those who are more highly emotionally attached to social media will be more active
on social media across various life domains than those who are less emotional
attachment to social media.
3.11 Discriminant Validity
Discriminant validity is the degree to which two scales designed to measure
similar, but conceptually distinct constructs, are related (Netemeyer, Bearden, and
Sharma, 2003). A scale “discriminates” when it does not correlate too highly with
measures from which it is supposed to differ (Churchill and Iacobucci, 2002). Assessing
discriminant validity involves comparing the pairwise correlations between the
comparison measure and the dimensions of the developing scale with low to moderate
correlation providing evidence of discriminant validity (Fornell and Larcker, 1981). Thus,

30
running two CFA models, one in which EASM and the two adapted scales are perfectly
correlated and another in which EASM and the two adapted scales are free to correlate
would allow for the test of discriminant validity. If the model in which the constructs are
free fits better than the perfectly correlated models and the estimated correlation is not
too high, discriminant validity is demonstrated.
If the new measure performs differently from adapted measures, it further
justifies development of a new scale as opposed to the adaptation of an existing scale. It
is desired that EASM be more predictive of attachment behaviors than either of the two
adapted EA scales. First, to investigate if EASM alone is predictive of the attachment
behaviors, all of the behaviors will be entered as dependent variables, and EASM will be
the independent variable; a significant and positive relationship is expected for each of
the behaviors. Next, in order to test the discriminant validity of our measure with the
adapted brand measures (Thomson, MacInnis, and Park, 2005; Park et al., 2010),
hierarchical linear regression will be run to control a specific order of entry for the
independent variables. Each adapted scale is entered into a regression model with the
four attachment behaviors as the dependent variables, and then EASM is entered. It is
expected that EASM will explain significant incremental variance above either of the
existing EA scales.
In hierarchical regression analysis the independent variables are entered into the
analysis in a stepwise fashion. One of the independent variables is entered into the
model with the dependent variable (time spent on social media in this case). For each
independent variable in the hierarchical regression the previously entered independent
variable acts as a covariate for subsequent independent variables. The multiple
correlations are recomputed as each new independent variable is added to predict the
dependent variable. This allows both adapted brand scales to account for all the variance

31
they can in the criterion variable –time spent on social media. This hierarchical test will
demonstrate initial evidence for discriminant validity when compared to brand attachment
scales adapted to the social media context.
When theory testing, interpretation is very relevant as it is in this case. It is
important to understand the extent to which each variable contributes to the prediction of
the criterion. Interpretation is the primary concern in this case such that fundamental
conclusions can be drawn regarding one predictor with respect to another (Johnson and
LeBreton, 2004). To appropriately compare the strength of EASM versus the adapted
Thomson, MacInnis, and Park (2005) and Park et al.(2010) scales, relative weights
analysis (RWA) is also used (Johnson, 2000). This statistical technique is another way to
investigate the relative importance of various independent variables on the dependent
variable(s) of interest. RWA overcomes the inherent limitations of typical approaches
used to examine relative importance such as hierarchical regression (see Johnson and
LeBreton, 2004). With RWA, the original set of predictor variables are first transformed
into a new set of predictor variables that are as close to the original predictor variables as
possible yet still orthogonal to each another (see Gibson, 1962). Next, the dependent
variable(s) is regressed on to these transformed predictors. The relationship between the
new transformed variables and the dependent variable(s) is assimilated with information
on the relationship between the original predictor variables and the new predictor
variables. The result is a relative weight for each predictor variable that represents its
relative contribution to prediction of the dependent variable (for a detailed discussion see
Johnson (2000)).
To test whether the percent of variance explained was significantly different
among the three different scales, confidence intervals are computed using a bootstrap
approach to estimate standard errors (Johnson, 2004). Specifically, relative weights are
32
calculated across 500 random subsamples (taken with replacement), using the standard
deviation of differences among the three different scales to represent the standard errors.
Then, 95% confidence intervals are constructed by taking the upper and lower α/2
percentiles from the empirical distribution of those differences. The exclusion of zero from
the confidence intervals indicates a statistically significant difference between the three
different scales (Johnson, 2004). Two separate RWAs are conducted, one for each of
two dependent variables (time spent on social media and separation distress). It is
expected that EASM is the best unique contributor the explained variance in both models.
Additionally, because of the nature of social media, there are several constructs
that could be related to or be proposed as alternative explanations for interacting and
engaging in social media usage. If consumers are strongly influenced by others, using
social media would be a way to always be up to date on what others are doing.
Moreover, some consumers seek the latest trends or newest innovations and social
media provides information on the latest trends. Therefore, EASM is examined in relation
to susceptibility to interpersonal influence (Bearden, Netemeyer, and Teel, 1989) and
consumer novelty seeking (Manning, Bearden, and Madden, 1995). Inherently, some
individuals are more interdependent than others, and social media could be viewed as
facilitating communication and dependence. As a result, consumers’ self-construal
(Singelis, 1994) is investigated in relation to EASM. By testing the relationship of EASM
with related measures (consumer susceptibility to interpersonal influence, consumer
novelty seeking and self-construal) one can determine whether low to moderate
correlations emerge, which would distinguish EASM from other measures.

33
3.12 Nomological Validity
Nomological validity is the degree to which predictions from a formal theoretical
network containing the phenomenon of interest are confirmed (Campbell, 1960). A scale
possesses nomological validity when it is shown to be empirically related to constructs
(i.e., significantly correlated in the expected manner) to which it is also theoretically
related (e.g., Lewin and Sager, 2010). Demonstrating a scale's nomological validity
involves showing that it "lawfully" fits into a nomological network of theoretical constructs
and their respective measures (Cronbach and Meehl, 1955; Peter, 1981; Nunnally and
Bernstein, 1994).
A broader nomological antecedent-construct-outcome system is tested. The
outcome variables are measured more behaviorally than attitudinally, and in a
methodologically different way to alleviate concerns about common method bias. I
investigate the nomological validity of EASM by placing it between three antecedent
constructs and three social media behavioral measures across substantially varied life
domains. With regard to the social media behaviors, it is posited that individuals who are
emotionally attached to social media should logically display more behaviors on social
media platforms. Using a “check all that apply” approach, social media behaviors in the
social sphere, the work sphere, and in the consumer sphere regarding social media
activities are collected. Regarding outcomes, I sought variables with a logical conceptual
relationship to functions of social media usage. The constructs of sociability, social
comparison, and information credibility are chosen based on the nature of social media
and a review of existing literature concerning social media usage.
The internet is often used to socialize with others; sometimes with individuals that
one already knows and sometimes to expand one’s circle of friends to individuals that
one does not know. In accordance with this behavior, the first construct, sociability is

34
defined as a tendency to affiliate with others and to prefer being with others to remaining
alone (Cheek and Buss, 1981). Several researchers have investigated how various
individual and personality traits relate to social media usage (Correa, Hinsley, and de
Zuniga, 2010; Ross et al., 2009; Zywica and Danowski, 2008; Ehrenberg et al., 2008). As
a result of this research we know that those who are extraverted, neurotic, and open to
experiences tend to be drawn to social networking sites (Ross et al., 2009; Zywica and
Danowski, 2008; Ehrenberg et al., 2008), as are those who are emotionally unstable.
These effects are moderated by gender and age (Correa, Hinsley, and de Zuniga, 2010).
Therefore, in order to contribute to knowledge about social media usage, I investigate a
different construct. Sociability seems to be a logical option given the nature of social
media which allows for individuals to be in communication with others anytime and
anywhere. Thus, it is hypothesized that sociability will be positively related to emotional
attachment to social media.
The second construct, social comparison is the human drive to evaluate oneself
which is done by comparing oneself to others (Festinger, 1954). Comparison is a basic
human motive that has long been studied by social psychologists (Pettigrew, 1967). It
has been noted that it is difficult to hear an extremely intelligent person speak, see an
extremely attractive person in passing, or be in a room with an expert “without engaging
in social comparison no matter how much I would like not to” (Goethals, 1986, pg.272).
Others have touted that forced-comparison can intrude on a person, even when the
comparison is unsolicited and has a positive or negative impact on self-feelings (Allen
and Wilder, 1977; Wood, 1989). Advertising has long been criticized for portraying
images, models, and lifestyles that are unrealistic and unattainable for the majority of
consumers (Lakeoff and Scherr, 1984; Schudson, 1984; Snow and Harris, 1986). In

35
return consumers have raised comparison standards for attractiveness, and are less
satisfied with their own attractiveness as a result (Richins, 1991).
With the advent of social media, the ability to compare oneself to others has
intensified. Specifically, recent research has shown that using social networking sites
increases self-esteem (Wilcox and Stephen, 2012). However, it has also been
demonstrated that the longer a person is on Facebook the more they believe others are
happier than themselves and the less they agree that life is fair (Chou and Edge, 2012).
This leads to the hypothesis that there is a positive relationship between social
comparison and emotional attachment to social media.
The third construct, information credibility is more cognitive, relating to the
credibility of information on social media. Researchers in various fields are currently
investigating how social media can be used to spread information (Agnihotri et al., 2012),
the impact of socially earned media on sales rather than traditional media (Stephen and
Galak, 2012), and the credibility of information spread through social media networks
(Castillo, Mendoza, and Poblete, 2011). While there is extensive literature on information
credibility, the coverage of it is by no means complete. I simply provide a brief summary
of the construct and support for its’ use as part of the nomological network of EASM.
Information credibility is defined as information that offers reasonable grounds for
being believed (Castillo, Mendoza, and Poblete, 2011). The perception of users with
respect to the credibility of online news seems to be positive, in general. People trust the
Internet as a news source as much as other media, with the exception of newspapers
(Flanagin and Metzger, 2000). For example, Twitter has been used widely during
emergency situations, such as wildfires, hurricanes, floods, earthquakes, and even to
report celebrity deaths (De Longueville, Smith, and Luraschi, 2009; Earle et al., 2009;
Hughes and Palen, 2009). Therefore, it is hypothesized that the more credible an

36
individual perceives social media as an information source, the more likely s/he is to
become emotionally attached.
In order to test EASM’s nomological validity the antecedent-construct-outcome
system will be investigated. Specifically, the following hypotheses are offered for the
antecedents of emotional attachment to social media:
H8: Sociability: Individuals who value sociability more will be more highly emotionally attached to social media than those who value sociability less. H9: Social Comparison: Individuals who socially compare themselves to others more will be more highly emotionally attached to social media than those who socially compare themselves to others less. H10: Information Credibility: Individuals who view the information on social media as credible will be more highly emotionally attached to social media will than those who do not view the information on social media as credible.
The outcome hypotheses were developed in Chapter 2 and investigate respondent’s
social media behaviors in the social sphere, the work sphere, and in the consumer
sphere regarding social media activities.
The nomological validity of EASM is tested using structural equations modeling
(SEM) which allows for the examination of the relationship between constructs and is
represented empirically by the structural parameter estimates, also known as the path
estimates. SEM is a powerful statistical technique that is flexible to model relationships
among predictors and criterion variables to test a priori theoretical assumptions against
empirical data (Chin, 1998). The evaluation of the model fit is not straightforward, and
there is no single statistical significance test that identifies that the model “fits.” Thus,
multiple criteria should be taken into consideration and meet or come close to the
following criteria (RMSEA < .06, NNFI > .95, CFI > .95, SRMR < .08) (Hu and Bentler,
1999).

37
3.13 Summary
The primary objective of this chapter was the outline of a process to develop a
parsimonious, yet representative, scale that captures the strength of consumers’
emotional attachment to social media. I followed the scale development procedures
recommended (Churchill, 1979; Crocker and Algina, 1986; DeVellis, 2003; Gerbing and
Anderson, 1988; Netemeyer, Bearden, and Sharma, 2003; Nunnally and Bernstein,
1994) in order to develop a measure which validly and reliably represents emotional
attachment to social media (EASM).
3.14 Foreword
In the next chapter, a description of the analyses and results is presented. Each
of the above discussed steps of scale development is conducted and the results are
presented and discussed. Further, the hypotheses outlined in Chapter 2, and those
developed with respect to nomological validity are tested, presented, and discussed.
38
Chapter 4
Analysis and Results
4.1 Overview
Chapter 3 outlined each of the steps in developing a parsimonious scale that
captures consumers’ emotional attachment to social media based on classically accepted
psychometric procedures (e.g., Churchill, 1979; DeVellis, 2003). These steps are
implemented across a set of seven studies that are described within this chapter.
4.2 Study 1
The objective of Study 1 was to generate a broad pool of initial items that tap into
the proposed construct of emotional attachment to social media (EASM). Items are
pretested, evaluated, reviewed by expert informants, and additional items are generated.
4.2.1 Participants and Design
The item generation process began with exploratory research. I asked a group of
colleagues to contact one or more friends they felt were “heavy users” of social media to
request their participation in a short informal survey. Approximately twenty respondents
participated in this exploratory phase, providing ratings and qualitative descriptions about
the role of social media in their lives.
The following four questions on 7-point Likert-type scales were asked: (1)
“Please indicate the degree to which you consider social media to be part of your life;” (2)
“Please indicate how important social media is in your life right now;” (3) “How much
would you agree or disagree with this statement: Social Media brings meaning to my life;”
and, (4) “To what extent would you say you are emotionally attached to social media?”
Each of these questions was accompanied by a qualitative open-ended question asking

39
why a particular rating was chosen. Ultimately, a convenience sample of 21 social media
users was acquired (79% female, average age 36, age range 27-59).
4.2.2 Item Generation
Next a thematic analysis was conducted to classify verbatim responses into
dimensions based on the natural language of respondents. An initial working set of items
was generated from these coded verbatim responses. The initial pool of items was then
compared to the social media literature (e.g., Hollenbeck and Kaikati, 2012; Fennis,
Pruyn, and Maasland, 2005; Stephen and Galak, 2012; Hanna, Rohm, and Crittenden,
2011). I searched for additional themes that could be important based on the literature,
but which might not have been mentioned explicitly in the exploratory research.
A preliminary set of 53 items was generated based on the qualitative research
and literature review. I ran several pretests of these items, examining correlations,
descriptive statistics, and item analyses looking for potentially low communalities,
ambiguity in the language that was used, and potential complexities in the wording that
might represent more than one underlying concept in a single item. Based on these early
statistical explorations and conceptual item analyses, changes were made to the initial
set of items that improved the starting pool and more accurately sampled the domain of
interest.
The key informant technique was then utilized as a continuation of the
exploratory research (Parasuraman, Grewal, and Krishnan, 2006). I presented the
working item pool to two separate industry experts, asking for open-ended feedback on
the items. The objective was to obtain a preliminary check of face validity and content
validity of the pool of items and the proposed multifaceted structure, and to check the
thoroughness of the domain covered by the proposed set as a whole. Based on the
insights of these experts the wording of a few items was modified for clarity, and the

40
proposed structure was expanded to capture an additional theme one expert felt was
missing from the idea of EASM domain. In order to incorporate this additional theme, I
developed additional items using the language from his description of this domain.
Ultimately, a revised item pool consisting of 45 items (Table 4-1) was used to collect
subsequent quantitative data, to explore the structure of the item pool, and to undertake
item purification.
Table 4-1 Initial List of Items
1 It makes me feel accepted when people comment on my social media posts.
2 I use social media as a way for me to de-stress after a long day.
3 Social media is a reliable source of information.
4 If I'm unsure about an upcoming decision I get input from friends on social media.
5 I have benefited from using social media.
6 Social media is a convenient way to get information.
7 Social media allows me to look back at meaningful events, people, and places from my past.
8 Using social media makes me feel nostalgic about things that I have done in the past.
9 I seek advice for upcoming decisions using social media.
10 It makes me feel good about myself when people validate me on social media.
11 I use social media to reconnect with 'the good old days.'
12 Sometimes social media reminds me of warm memories from my past.
13 I use social media to give myself a break when I've been busy.
14 Social media makes my life a little bit better.
15 Social media enhances my life.
16 I get advice about medical questions on social media.
17 Social media is a source of entertainment for me.
18 Social media is a good source of information.
19 Social media is one of my primary sources of information about news.
20 When people respond to my posts in social media I feel like they care about me.
21 Social media allows me to stay informed about events and news.
22 When friends agree with things I've said on social media I feel supported.
23 Social media is one of one of the main ways I get information about major events.
24 I ask for the opinions of my friends on social media.
25 Social media provides a way for me to stay connected to people across distances.
26 When I am in a down mood, I use social media to make me feel better.

41
27 I use social media to interact with friends.
28 I use social media to help me keep up with what is going on.
29 Social media benefits me because it allows me to engage with other people.
30 When I am thinking through a situation I seek advice through social media.
31 I use social media because it makes staying in touch with others convenient.
32 Social media is an enjoyable way to spend time.
33 My life is a little richer because of social media.
34 Social media provides a way for me to keep in touch with others that I care about.
35 When others comment on my posts I feel affirmed.
36 I post on social media to brighten other peoples' day.
37 I post things on social media that I think will be helpful to my friends’ lives.
38 I think it is important to share things on social media so those I care about stay informed.
39 Sometimes I post content on social media with the goal of helping others with their decisions.
40 Social media allows me to give people advice about things that might be important to them.
41 I use social media to help information “go viral.”
42 Sometimes I post things just to have a positive effect on other peoples’ moods.
43 Sometimes I post things hoping to get people involved in a dialog or debate.
44 I want to inspire other people with my social media posts.
45 I “like” things on social media just so it is shared with those I care about.
4.3 Study 2
Study 2 was designed to determine the underlying structure of EASM and to
identify which items best represent the proposed multifaceted structure. In order to
determine the underlying factor structure of the data, three different samples were
collected and analyzed. The initial item purification was conducted with a (1) student
sample, then replication and verification of the initial findings were tested with (2) a
separate student sample, and (3) with a non-student sample.
4.3.1 Participants and Design
Two hundred thirty-eight undergraduate business students (47% female, average
age 24 years, age range 18-49 years of age) completed an online survey in exchange for
partial course credit. Twelve responses were dropped because they did not provide
Table 4-1—Continued

42
complete data. This initial data collection effort was used to conduct item purification
based on the pool of items generated from Study 1.The first of two replication and
verification samples was collected with 212 undergraduate students (54% female,
average age 24 years, age range 18-50 years of age) who also completed the online
survey in exchange for partial course credit. Three responses were dropped because
they did not provide complete data. The second replication and verification study was
conducted as part of an undergraduate marketing research effort. Approximately 900
faculty and staff across the university were contacted by student groups in an
undergraduate class, asking them to participate in an online survey. If the faculty and
staff member elected to participate in the survey, they were entered into a drawing for
one of seven $25 gift cards at one of five local restaurants. Of those who were contacted,
328 faculty and staff members took the survey (40% response rate). One hundred two
responses were dropped because they did not provide complete data or because the
respondent reported s/he does not use social media. As a result, 226 faculty and staff
members (67% female, average age 44 years, age range 18 - over 91 years of age)
completed the survey.
4.3.2 Measures
First, respondents were asked if they use social media. Respondents who
answered in the affirmative were asked to select the various social media platforms that
they use and to report to the average amount of time spent per week on each platform.
Next, they were instructed to indicate their level of agreement with the 27 items
measuring EASM on a 7-point Likert scale (1= “strongly disagree” to 7 = “strongly
agree”). Randomized blocks of nine to eleven items were presented to respondents.
Finally, respondents provided basic demographic information.

43
4.3.3 Results
4.3.3.1 Initial Sample: Factor Analysis
The 45 items were subjected to exploratory factor analysis (EFA). I discussed in
Chapter 3, principal components analysis using oblique rotation was used. The final
solution is a result of multiple iterations of item deletions and analysis which produced
eight interpretable dimensions containing 27 items (Table 4-2). These eight dimensions
explained 79.6% of the variance in the data with all communalities exceeding the
recommended .60 cut off (Hair et al., 2010). Correlations between the dimensions were
all positive and significant (p < .01).
4.3.3.2 Initial Sample: Internal Reliability
The alpha reliability coefficients computed for each factor ranged from .82 to .91,
well within the guidelines for scale development (Nunnally and Bernstein, 1994). Based
on previous emotional attachment scale development research (Thomson, MacInnis, and
Park, 2005; Park et al., 2010), a multi-dimensional second-order factor structure was
anticipated, therefore, an alpha reliability coefficient score across the summated scale
averages for each of the eight-factors was also computed. The second-order EASM
measure also demonstrates adequate reliability (α = .90) (Table 4-2).
Table 4-2 Exploratory Factor Analysis Results and Internal Reliabilities
Coefficient Communalities
I use social media because it makes staying in touch with others convenient.
.82 .82
Social media provides a way for me to stay connected to people across distances.
.80 .85
Social media provides a way for me to keep in touch with others that I care about.
.80 .78
I use social media to interact with friends. .70 .76
Connecting .92
Sometimes social media reminds me of warm memories from my past.
.78 .81
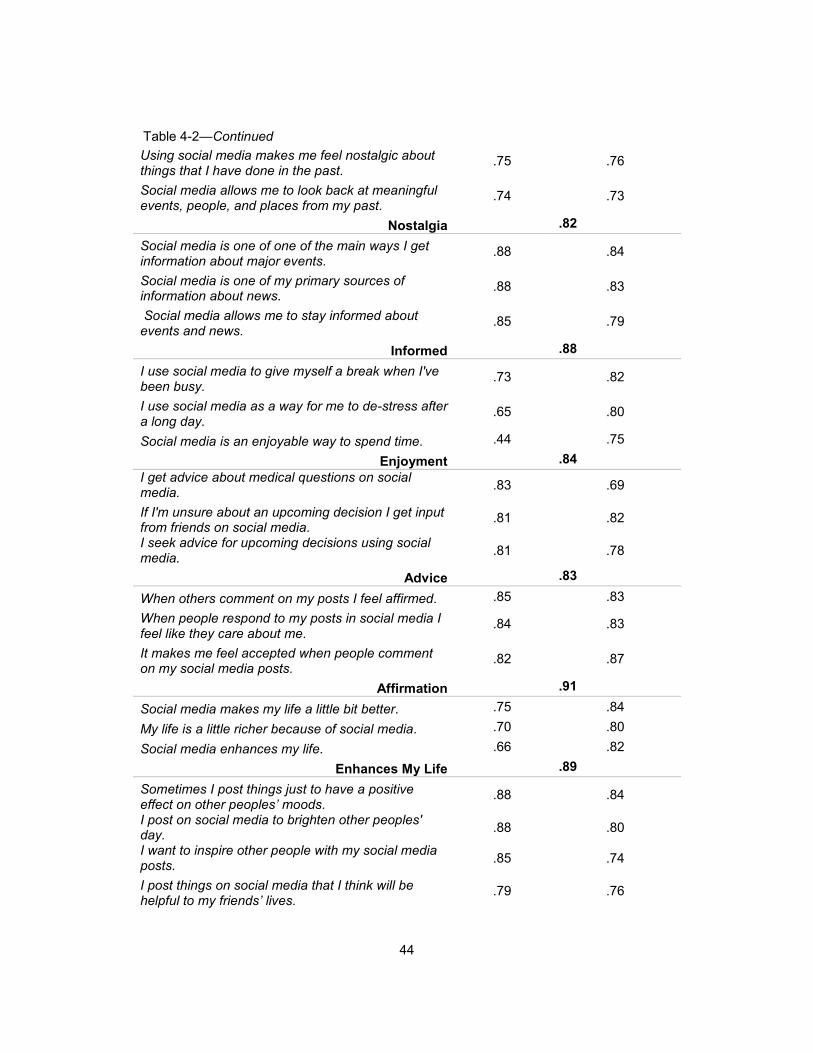
44
Using social media makes me feel nostalgic about things that I have done in the past.
.75 .76
Social media allows me to look back at meaningful events, people, and places from my past.
.74 .73
Nostalgia .82
Social media is one of one of the main ways I get information about major events.
.88 .84
Social media is one of my primary sources of information about news.
.88 .83
Social media allows me to stay informed about events and news.
.85 .79
Informed .88
I use social media to give myself a break when I've been busy.
.73 .82
I use social media as a way for me to de-stress after a long day.
.65 .80
Social media is an enjoyable way to spend time. .44 .75
Enjoyment .84
I get advice about medical questions on social media.
.83 .69
If I'm unsure about an upcoming decision I get input from friends on social media.
.81 .82
I seek advice for upcoming decisions using social media.
.81 .78
Advice .83
When others comment on my posts I feel affirmed. .85 .83
When people respond to my posts in social media I feel like they care about me.
.84 .83
It makes me feel accepted when people comment on my social media posts.
.82 .87
Affirmation .91
Social media makes my life a little bit better. .75 .84
My life is a little richer because of social media. .70 .80
Social media enhances my life. .66 .82
Enhances My Life .89
Sometimes I post things just to have a positive effect on other peoples’ moods.
.88 .84
I post on social media to brighten other peoples' day.
.88 .80
I want to inspire other people with my social media posts.
.85 .74
I post things on social media that I think will be helpful to my friends’ lives.
.79 .76
Table 4-2—Continued

45
I think it is important to share things on social media so those I care about stay informed.
.58 .71
Influence .91
Emotional Attachment to Social Media .90
*Numbers in bold are the Cronbach's alpha for the summated scale.
4.3.3.3 Replication and Verification
The factor structure emanating from the initial round of item purification was
replicated in both the student sample (n = 209) and in the non-student sample (n = 226).
The coefficients, communalities, and internal reliabilities of the 27 items with eight
subdimensions demonstrate that the pattern found in the initial testing of the items is
verifiable within both a similar sample and a more generalizable sample (Table 4-3).
These eight dimensions explain 79.9% and 88.2% of the variance in the student and non-
student data respectively, with all communalities exceeding the recommended .60 cut off
(Hair et al., 2010). The internal reliability of each of the subdimensions are all .80 or
higher, and the second-order factors also demonstrate strong internal reliability with
Cronbach’s alphas of .88 and .93, respectively.
Table 4-2—Continued

46
Table 4-3 Replication and Verification of Results
Items
Replication Sample 1 Student Sample
(n=209)
Replication Sample 2 Non-student Sample
(n=226)
Coefficients Communalities Coefficients Communalities
I use social media to interact with friends. .81 .79 .81 .84 Social media provides a way for me to stay connected to people across distances. .86 .82 .96 .88 I use social media because it makes staying in touch with others convenient. .82 .81 .87 .92 Social media provides a way for me to keep in touch with others that I care about. .79 .75 .77 .88
Connecting .91 .95
Social media allows me to look back at meaningful events, people, and places from my past. .66 .79 .75 .86 Using social media makes me feel nostalgic about things that I have done in the past. .80 .76 .83 .91 Sometimes social media reminds me of warm memories from my past. .65 .74 .71 .88
Nostalgia .82 .93
Social media is one of one of the main ways I get information about major events. .81 .83 .85 .90 Social media allows me to stay informed about events and news. .78 .82 .79 .89

47
Social media is one of my primary sources of information about news. .85 .84 .88 .89
Informed .89 .93
I use social media as a way for me to de-stress after a long day. .80 .79 .76 .86 I use social media to give myself a break when I've been busy. .63 .76 .84 .92 Social media is an enjoyable way to spend time. .67 .76 .63 .88
Enjoyment .80 .92
I seek advice for upcoming decisions using social media. .79 .82 .77 .87 I get advice about medical questions on social media. .65 .66 .89 .83 If I'm unsure about an upcoming decision I get input from friends on social media. .82 .81 .84 .89
Advice .81 .91
When others comment on my posts I feel affirmed. .80 .87 .85 .89 When people respond to my posts in social media I feel like they care about me. .82 .83 .90 .94 It makes me feel accepted when people comment on my social media posts. .91 .87 .91 .92
Affirmation .90 .95
Social media makes my life a little bit better. .74 .81 .92 .92 Social media enhances my life. .71 .80 .88 .92
My life is a little .77 .82 .92 .89
Table 4-3—Continued

48
richer because of social media.
Enhances My Life .89 .95
Sometimes I post things just to have a positive effect on other peoples’ moods. .91 .90 .72 .88 I post on social media to brighten other peoples’ day. .87 .83 .70 .88 I post things on social media that I think will be helpful to my friends’ lives. .87 .83 .68 .81 I want to inspire other people with my social media posts. .92 .82 .74 .88 I think it is important to share things on social media so those I care about stay informed. .55 .68 .50 .80
Influence .92 .94
Emotional Attachment to
Social Media .88 .93 *Numbers in bold are the Cronbach's alpha for the summated scale.
4.3.4 Discussion
Although a multifaceted structure was anticipated, the exact nature of the items
that group together was determined by the data. Eight subdimensions composed of 27
items emerged from the data representing the construct of emotional attachment to social
media (EASM). The initial findings demonstrate the dimensionality of EASM is replicated
in both a student and non-student sample. A second-order structure is supported based
on internal consistency reliability. The eight subdimensions are named and defined as
follows. The first factor, connecting, reflects respondents’ use of social media to stay
connected to others. Factor two, nostalgia, taps into respondents’ ability to use social
media in order to remember things from the past. The third factor, informed, deals with
Table 4-3—Continued

49
social media’s role in keeping the respondent informed. The fourth factor, enjoyment,
reflects social media’s role as a way for the respondent to experience relaxation and
enjoyment. Factor five, advice, reflects respondents’ ability to seek advice via social
media. The sixth factor, affirmation, taps into respondents’ ability to feel personally
affirmed from their usage of social media. The seventh factor, enhances my life,
demonstrates social media’s role in making respondents’ lives better. The final factor,
influence, taps into the ability to use social media to encourage, influence, and help
others.
4.4 Study 3
Study 3 was designed to closely follow two lines of validating analyses conducted
by Thompson, MacInnis and Park (2005) and Park et al.(2010), and to accomplish the
following objectives: (1) testing the proposed second-order structure of EASM, (2) testing
the proposed structure against competing measurement models, (3) demonstrating
EASM’s convergent and discriminant validity with respect to the adapted emotional
attachment to brands measures, and, (4) demonstrating EASM is related to traditional
attachment outcomes. As discussed in Chapter 3, the attachment literature has
established that attachment is associated with proximity maintenance, safe haven,
emotional security, and separation distress (Bowlby, 1980; Hazan and Zeifman, 1999).
Strong relationships with these outcomes demonstrate convergent and criterion-related
validity.
4.4.1 Participants and Design
Two hundred forty-six undergraduate business students (44% female, average
age 24 years, age range 19-46 years of age) completed an online survey in exchange for
partial course credit. Five responses were dropped because they did not provide

50
complete data, and 32 were dropped because respondents reported not using social
media, resulting in a final sample of 209 respondents.
4.4.2 Measures
The 27 EASM items and a set of 15 items measuring the four attachment
outcomes were randomly presented in blocks of five to ten items. EASM items were
measured on a 7-point Likert scale (1= “strongly disagree” to 7= “strongly agree”). Two
existing scales of brand attachment (Thomson, MacInnis, and Park, 2005; Park et al.,
2010) adapted to reflect attachment to social media were also included. While adapted
measures can “disturb the clarity and/or psychometric balance of the measure”
(Schriesheim et al., 1993, pg.394), these measures were included to permit a preliminary
test of convergent validity. Thomson, MacInnis, and Park’s (2005) adapted scale was
measured on a 7-point scale (1 = “not at all” to 7 = “very well”), and Park et al.’s (2010)
adapted scale was measured on an 11-point scale (0 = “not at all” to 10 = “completely”).
Measures for assessing attachment behaviors were adapted from existing scales (Hazan
and Zeifman, 1994; Fraley and Davis, 1997) to appropriately reflect a social media
context. Most of these items were also measured on 7-point scales (1= “not at all like me”
to 7= “just like me”), with the exception of two separation distress items taken from the
brand attachment literature (Park et al., 2010) that employed 11-point scales (anchored
by 0 = “not at all” and 10 = “completely”). The items are provided in Table 4-4.
Table 4-4 Attachment Outcome Items
Proximity Maintenance adapted (Hazan and Zeifman, 1994)
I like to have access to social media near me.
Throughout the day I like to have access social media.
I feel compelled to check my social media sites throughout the day.
Emotional Security adapted (Hazan and Zeifman, 1994; Fraley and Davis, 1997)
Social media helps me to take on the world.

51
Social media helps me feel emotionally secure.
I can always count on social media.
Safe Haven adapted (Hazan and Zeifman, 1994; Fraley and Davis, 1997)
When I’m feeling down, I often turn to social media.
If something upsets me, social media can make me feel better.
I like to get on social media when I am feeling upset or down.
Separation Distress (developed based on literature)
I would miss social media if I didn't have it.
Social media would be hard for me to live without.
I would be sad without social media.
Separation Distress adapted (Park et al., 2010)
To what extent would you be distressed if the social media you use were discontinued?
To what extent is it difficult to imagine life without the social media you use?
4.4.3 Results
4.4.3.1 Evidence for the Second-Order EASM Measurement Model
As a first step in analyzing the data from Study 3, confirmatory factor analysis
(CFA) was conducted to test the appropriateness of this conceptualization of EASM as a
second-order construct (Figure 4-1).All fit statistics for this model meet standard criteria
(Hu and Bentler, 1999): degrees of freedom [df] = 316; chi-squared = 638.91; root mean
square error of approximation [RMSEA] = .067; nonnormed fit index [NNFI] = .98;
comparative fit index [CFI] = .98; and standardized root mean square residual [SRMR] =
.066.Loadings for each of the items to the factors are statistically significant (p < 0.01);
factors of the higher-order EASM construct are reported in Table 4-5.The factor
Intercorrelations are provided in Table 4-6, and demonstrate that each of the factors is
unique but related to each of the other factors. Convergent validity at the item level is
also assessed at this stage of scale development. Each group of indicators meet or
Table 4-4—Continued

52
exceed the minimum accepted standards (Fornell and Larcker, 1981): communalities of
all the items exceed .60; the average variance extracted (AVE) is .69, and, the construct
reliability (CR) is .99.
Additionally, the internal reliability of each of the subdimensions and the second-
order factor should exceed a threshold of .70 (Hair et al., 2010). All of the first-order
factors exceed this threshold (Table 4-5), and the second-order factor of EASM (α = .96),
demonstrates the internal consistency of the first-order factors and the second-order
factor.
Figure 4-1 EASM Measurement Model

53
Table 4-5 Factor Loadings for Measurement Model
Loadings
Connecting .79
interact .85
connected across distances .78
convenient staying in touch .93
keep in touch .81
Nostalgia .88
look back on past .87
nostalgic .76
warm memories from past .87
Informed .71
main ways get info .88
stay informed .90
primary source of info .82
Enjoyment .90
de-stress .81
give myself a break .85
enjoyable .85
Advice .66
upcoming decision .82
advice about medical .68
unsure .90
Affirmed .81
feel affirmed .87
feel cared about .91
feel accepted .92
Enhances My Life .86
little bit better .87
enhances .89
little richer .79
Influence .70
positively affect others' moods .87
brighten others' day .84
helpful to friends' lives .89
inspire others .89
those I care about stay informed .79
*Numbers in bold are the loadings to the higher-order EASM factor

54
Table 4-6 Factor Intercorrelations
Conn. Inform. Nostal. Enjoy. EML Advic. Affirm. Influe.
Connecting 1.00
Informed 0.47 1.00
Nostalgia 0.60 0.44 1.00
Enjoyment 0.62 0.53 0.60 1.00
Enhances My Life
0.55 0.53 0.60 0.73 1.00
Advice 0.36 0.54 0.40 0.46 0.55 1.00
Affirmation 0.53 0.41 0.57 0.62 0.71 0.51 1.00
Influence 0.47 0.43 0.42 0.47 0.55 0.56 0.61 1.00
Subsequently, two competing models (Hair et al., 2010) were estimated for
comparative purposes, similar to the approach taken by Thomson, MacInnis, and Park
2005 and Park et al.2010.The first model specified all the items as loading on a single
latent factor (Figure 4-2 a). The second tested a model in which items were assigned to
their respective first-order constructs. The first-order factors were then specified as either
cognitively-oriented or affectively-oriented as demonstrated in Figure 4-2 b. The
competing models were then assessed and the results are shown in Table 4-7.The
original second-order factor model fits the data better than the two competing
specifications; providing confirmatory support for the second-order EASM model
specification, with eight first-order subdimensions.
Table 4-7 Assessment of Competing Models
χ2 df Δ χ
2 RMESA NNFI CFI SRMR
(1) One Factor 3163.93 324 0.19 0.8 0.82 0.11
(2) Two Factors 1746.57 323 1417.36 (1)* 0.17 0.9 0.91 0.01
(3) 2nd
Order 638.913 316 90.88 (20)* 0.06 0.98 0.98 0.065
(3 vs 2) 1172.44 (7)*
(3 vs 1) 2589.8 (8)* * p-value ≤ 0.000
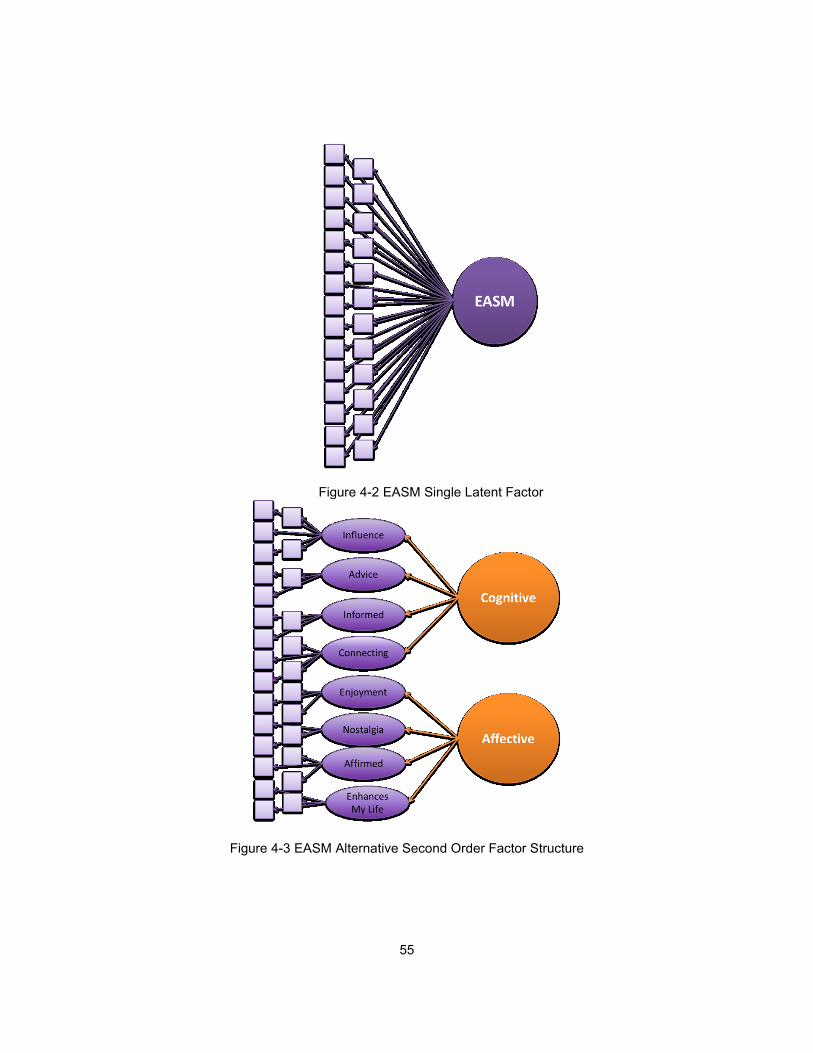
55
Figure 4-2 EASM Single Latent Factor
Figure 4-3 EASM Alternative Second Order Factor Structure

56
4.4.3.2 Convergent and Discriminant Validity with Adapted Measures
As previously discussed, two existing brand attachment scales were adapted to
reflect social media (Thomson, MacInnis, and Park, 2005; Park et al., 2010). The adapted
scales demonstrate good reliability (both with α = .95). Correlations with EASM show
favorable convergent validity for both of the emotional attachment to brands (EAB) scale
Thomson, MacInnis, and Park (2005) (r = .80; p < 0.001) and Park et al.(2010) (r = .76; p
< 0.001). Correlations of this magnitude imply approximately 60% to 50% shared
variance with the measure of EASM, meaning that the EASM scale has 40% to 50%
variance that is unique and captures something distinct.
Two structural equations models were run to further assess if EASM is similar to,
yet unique, from the adapted measure of EAB. The first model demonstrates convergent
validity by allowing for the three higher-order constructs to freely correlate with one
another (Figure 4-3). The fit statistics of the model demonstrate moderate fit, with an
RMSEA (.103) that is higher than desirable but otherwise acceptable fit statistics (df =
347; χ2 = 1,040.79; NNFI = .976; CFI = .978; SRMR = .057) (Hu and Bentler, 1999). The
second model sets the paths of the three higher-order constructs to 1.0 (Figure 4-4),
forcing them to be perfectly correlated and representative of one general factor of
emotional attachment to social media. The fit statistics of this model demonstrate poorer
fit (df = 350; χ2 = 1,187.56; RMSEA = .112; NNFI = .971; CFI = .973; SRMR = .300) (Hu
and Bentler, 1999). Ideally, the fit of the first model would be slightly better; however the
poor fit of the second model provides evidence that the constructs are somewhat related
but definitely distinct.

57
Figure 4-4 EASM Convergent Validity with Adapted Measures
Figure 4-5 EASM Discriminant Validity with Adapted Measures

58
4.4.3.3 Convergent and Criterion-Related Validity with Proximal Attachment Outcomes
Having garnered support for the second-order specification for EASM, the model
in which the relationship between EASM and the four attachment outcomes (i.e.,
proximity maintenance, safe haven, emotional security, and separation distress) was then
tested. The internal reliability of the adapted outcome measures was tested. All items had
factor loadings between .76 and .94 and acceptable reliability coefficients as well
(proximity maintenance α = .91, safe haven α = .95, emotional security α = .90 and
separation distress α = .94). This provides support for the internal reliability of the
attachment outcomes. Fit statistics for this model met all standard criteria (Hu and
Bentler, 1999): root mean square error of approximation (RMSEA) = .069, nonnormed fit
index (NNFI) = .98, comparative fit index (CFI) = .98, and standardized root mean square
residual (SRMR) = .076. The paths from EASM to the attachment outcomes are all
meaningfully large and statistically significant (Figure 4-5). As expected, the context-
specific measure of emotional attachment predicts context-adapted proximal outcomes of
attachment, providing evidence of convergent and criterion-related (concurrent and
predictive) validity.

59
Figure 4-6 EASM Related to Attachment Outcomes
The results clearly show how individuals with differing levels of emotional
attachment to social media (EASM) will also display differing levels of attachment
behaviors, supporting H1 - H4.Those who are more emotionally attached to social media
(1) report higher levels of maintaining proximity to social media, (2) use social media to
feel a sense of emotional security, (3) seek social media as a safe haven in the form
psychological protection when they are feeling upset or down, and, (4) experience
distress in the form of negative emotions (e.g., anger, frustration, and sadness) at the
threat of social media being discontinued. These results provide further evidence of the
validity of the EASM measure.
4.4.4 Discussion
Study 3 provides support for the second-order representation of EASM with its
eight subdimensions. This conceptualization fits the data better than two other plausible
competing model specifications. Finally, because EASM was found to be strongly related

60
to four key theory-based outcomes of attachment Study 3 also provides support for the
measure’s convergent validity and criterion-related validity.
4.5 Study 4
Together, the exploratory work, extant literature, input from subject matter
experts, the confirmatory second-order model and the statistically significantly
relationships to attachment outcome behaviors all provide a strong foundation for
EASM’s content and construct validity. Study 4 is a more formal and rigorous
confirmation of EASM’s content validity the degree to which items of the measurement
instrument are representative of the target construct for a particular assessment purpose
(Haynes, Richard, and Kubany, 1995).
4.5.1 Participants and Design
In Study 4, 68 undergraduate students participated in a sorting task in exchange
for partial course credit. Eight respondents entered the room at a time and were each
seated at separate tables. On the tables were four manila envelopes and a baggie with
individual scale items printed on separate strips of paper. Each labeled envelope had a
definition for a particular subdimension of the EASM scale. Each scale item printed on a
strip of paper was associated with one and only one subdimension. Participants were
instructed to read the definitions carefully and then sort each item from the baggie into
the best fitting envelope. To make the task manageable for participants, the sorting task
was limited to four dimensions per participant; however, eight different combinations of
four subdimensions were created to protect against biases. The participants were read
the instructions prior to starting the task, and were also provided a print out of the
instructions at their table.
For each of the items the participants received, one and only one envelope was
consistent with the hypothesized construct. For example, the item “sometimes social

61
media reminds me of warm memories from my past" is hypothesized to reflect nostalgia.
If a respondent placed this item in the nostalgia envelope under the definition, "to
remember previous experiences, emotions, and/or individual," the response was coded
as correct. If the item was placed in any of other envelope it was coded as incorrect. For
each item a correct choice (sort) ratio was then computed and is shown in Table 4-8.
4.5.2 Results
Note that a random sorting of items into four envelopes would produce an
expected correct proportion of .25 by chance alone. I calculated a chance-corrected test
of classification reliability by comparing the observed correct classification proportion in
the sample against a hypothesized value of .25.The observed correct classification
proportions were high (ranging from .77 to 1.0), and the tests against chance were all
statistically significant (observed alpha for all items, p < 0.001). Even using a more
stringent alpha standard to account for multiple tests (e.g., Bonferroni correction), results
were still statistically significant for all items, p < 0.001.
Thus, all items yielded correct sorting percentages between 77% – 100%
accurate, producing content validity ratios (CVR), ranging from .53 - 1.00 and a content
validity index (CVI) of 91%.Based on our participant pool, the minimum value for CVR is
between .33 and .37 (Lawshe, 1975). These results exceed the minimum accepted
standards and provide supporting evidence of EASM’s content validity. The results
suggest all 27 items should be retained in the EASM measure.

62
Table 4-8 Content Validity
Factors Items CVR % Classified
Correctly
Connecting
I use social media to interact with friends. .86 92.9%
Social media provides a way for me to stay connected to individual across distances.
.86 92.9%
I use social media because it makes staying in touch with others convenient.
.93 96.4%
Social media provides a way for me to keep in touch with others that I care about.
.93 96.4%
Nostalgia
Social media allows me to look back at meaningful events, individual, and places from my past.
1.0 100.0%
Using social media makes me feel nostalgic about things that I have done in the past.
.87 93.3%
Sometimes social media reminds me of warm memories from my past.
1.0 100.0%
Informed
Social media is one of one of the main ways I get information about major events.
1.0 100.0%
Social media allows me to stay informed about events and news. 1.0 100.0%
Social media is one of my primary sources of information about news.
1.0 100.0%
Enjoyment
I use social media as a way for me to de-stress after a long day. 1.0 100.0%
I use social media to give myself a break when I've been busy. 1.0 100.0%
Social media is an enjoyable way to spend time. .94 96.8%
Advice
I seek advice for upcoming decisions using social media. .93 96.3%
If I'm unsure about an upcoming decision I get input from friends on social media.
.85 92.6%
I get advice about medical questions on social media. 1.0 100.0%
Affirmation
When others comment on my posts I feel affirmed. .93 96.6%
When individual respond to my posts in social media I feel like they care about me.
.86 93.1%
It makes me feel accepted when individual comment on my social media posts.
.86 93.1%
Enhances My Life
My life is a little richer because of social media. .93 96.4%
Social media enhances my life. .86 92.9%
Social media makes my life a little bit better. .79 89.3%
Influence
Sometimes I post things just to have a positive effect on other individuals’ moods.
.80 90.0%
I post on social media to brighten other individuals' day. .93 96.7%
I post things on social media that I think will be helpful to my friends’ lives.
.80 90.0%
I want to inspire other individual with my social media posts. 1.0 100.0%
I think it is important to share things on social media so those I care about stay informed.
.53 76.7%
CVI 90.5%

63
4.6 Study 5
Study 5 seeks to provide additional psychometric evidence of EASM’s reliability.
While internal consistency reliability is typically assessed with data from a single cross-
sectional snapshot, another form of reliability estimation is test-retest reliability which
involves within-subjects measurement at two points in time. Meaningful and significant
correlation between the two measurements demonstrates a measure’s consistency and
stability over time (Nunnally and Bernstein, 1994). In Study 5, test-retest reliability of the
measure of emotional attachment to social media is examined.
4.6.1 Participants and Design
Ninety-two undergraduate and graduate business students were asked to take
part in a two-part online survey in exchange for partial course credit. The surveys were
sent approximately three weeks apart. Seventy-seven (84% return rate ) of those
individuals completed the survey both times (47% female, average age 24 years, age
range 18-48 years of age). The same questionnaire was used both times and contained
only the 27 EASM items with a 7-point Likert response scale (1= “strongly disagree” to 7
= “strongly agree”).
4.6.2 Results
First-order summated scale scores were computed for each of the eight EASM
dimensions. A second-order summated scale score was then computed using the eight
first-order summated scale scores. The test-retest reliability correlation for this overall
EASM score was r = .90 (p < 0.001). Additionally, each subscale was examined for time
1 – time 2 correlations. The test-retest correlations for each of the eight-factors were as
follows: connecting r = .91, nostalgia r = .76, informed r = .87, enjoyment r = .81, advice r
= .85, affirmation r = .79, enhances my life r = .88, and influence r = .83.All of these
correlations were statistically significant at (p < 0.001) and met Nunnally’s (1978) criterion

64
of correlations for .70 or higher. Study 5 demonstrates the consistent stability of the
EASM measure across time, thus providing further psychometric evidence in favor of the
reliability of the higher-order construct and its subdimensions (DeVellis, 2003).
4.7 Study 6
Study 6 was designed to accomplish multiple objectives. First, the study was
meant to demonstrate how the scale relates to a criterion measure of proximity-
maintenancea key attachment behavior. In this case self-reported time spent on social
media is used as a proxy for proximity maintenance. Secondly, Study 6 was conducted to
demonstrate the incremental validity of the emerging measure of EASM as compared to
adapted existing scales. This was done with respect to EASM predicting time spent on
social media and a second outcome used by Park et al. (2010) separation distress.
Finally, the Study 6 provides an additional test of convergent and discriminant validity of
the EASM scale by comparing it to the two existing attachment scales adapted to reflect
attachment to social media.
4.7.1 Study 6a: Participants and Design
Two hundred and eight undergraduate students (41% female, average age 25
years, age range 18-75 years of age) completed an online survey in exchange for partial
course credit. Seventeen responses were dropped because they did not provide
complete data, resulting in 191 surveys.
4.7.2 Study 6a: Measures
Respondents were asked to select the various social media platforms that they
use and to report the average amount of time they spend per week on each platform
selected. Participants indicated their level of agreement with each of the 27 EASM items
using a 7-point Likert response scale (1= “strongly disagree” to 7 = “strongly agree”).
Modifications of two existing scales of brand attachment (Thomson, MacInnis, and Park,

65
2005; Park et al., 2010) were also included, which were measured on a 7-point scale (1 =
“not at all” to 7 = “very well”), and an 11-point scale (0 = “not at all” to 10 = “completely”)
respectively. All items were randomized in blocks of nine to eleven, and were randomly
presented to respondents. Finally, respondents provided basic demographic information.
4.7.3 Study 6a: Results
4.7.3.1 Initial Evidence for Criterion-Related Validity
In order to provide further support for EASM’s criterion-related validity, total hours
spent on social media were investigated. This criterion measure was regarded as a
reflection of proximity maintenance, a key behavior historically investigated in relation to
attachment (Bowlby, 1979; Hazan and Shaver, 1994; Hazan and Zeifman, 1994). The
higher the emotional attachment, the more an individual is expected to seek to be close
in proximity to the attachment target. In this case, the more emotionally attached an
individual is to social media, the more that person is expected to seek to be close to
social media. Self-reported time spent on each of the social media platforms was
collected from respondents with self-report measures. The measure of total hours2 was
created by summing the time reported across all platforms participants used. EASM3
correlates r = 0.49 (p < 0.001) with the criterion measure of self-reported time spent on
social media platforms, providing initial evidence for criterion-related validity.
4.7.3.2 Evidence for Discriminant Validity
It is also important to demonstrate EASM’s discriminant validity to warrant its
necessity for the specific context of social media. Study 3 established that EASM is
distinct from the two adapted scales (Thompson, MacInnis, and Park 2005; Park et al.,
2 The measure of total hours spent on social media is log transformed to standardize the
measure and allow for further analyses which assume normality. 3 The α’s for the subdimension ranges from .80 (advice) to .94 (connecting).The overall
alpha for EASM was .94 demonstrating acceptable fit (Nunnally and Bernstein, 1994).

66
2010); however, it is important to understand whether this difference is also clear in
predicting outcome behaviors. Two key dependent variables are investigated here to
assess discriminant validity time spent on social media and separation distress (as
used in Park et al., 2010). In order to test the discriminant validity of EASM with the
adapted brand measures, hierarchical linear regression was used to control a specific
order of entry for the independent variables. By allowing both adapted brand scales to
account for all the variance they could in the dependent variables, discriminant validity is
then assessed by determining EASM’s ability to explain unique incremental variance
beyond what is explained by the two existing scales.
When time spent on social media is the dependent variable and Thompson,
MacInnis, and Park’s (2005) adapted emotional attachment to brands (EAB) measure is
the only measure in the model, it is significant; however, when Park et al.’s (2010) EAB
measure is entered, the 2005 EAB measure becomes non-significant. However, when
EASM is subsequently entered in the model, it explains unique, incremental variance
above and beyond the two adapted measures. Results (Table 4-9, 4-10, 4-11) show that
the amount of variance accounted for in time spent on social media by the three predictor
variables is 25%.As expected, not only does EASM significantly adds to the prediction of
time spent on social media EASM contributes unique variance, and the other two
scales become nonsignificant when it is in the model.

67
Table 4-9 Total Hours: Model Summary
Model R R
Square
Adjusted R
Square
Std. Error of
the Estimate
Change Statistics
Durbin-Watson
R Square Change
F Change df1 df2
Sig. F Change
1 .335a .112 .107 .772 .112 21.56 1 171 .000
2 .435
b .189 .179 .740 .077 16.11 1 170 .000
3 .513
c .263 .250 .707 .074 17.04 1 169 .000 2.002
a. Predictors: Constant, TMP2005; b. Predictors: Constant, TMP2005, Park 2010; c. Predictors: Constant, TMP2005, Park 2010, EASM; Dependent Variable: Log Total Hours
Table 4-10 Total Hours: ANOVA
Model
Sum of Squares
df Mean
Square F Sig.
1 Regression 12.851 1 12.851 21.557 .000a
Residual 101.942 171 .596
Total 114.793 172
2 Regression 21.673 2 10.836 19.783 .000b
Residual 93.120 170 .548
Total 114.793 172
3 Regression 30.200 3 10.067 20.112 .000c
Residual 84.592 169 .501
Total 114.793 172
a. Predictors: Constant, TMP2005; b. Predictors: Constant, TMP2005, Park 2010; c. Predictors: Constant, TMP2005, Park 2010, EASM; Dependent Variable: Log Total Hours
Table 4-11 Total Hours: Coefficients
Model
Unstandardized Coefficients
Standardized Coefficients
t Sig.
Correlations Collinearity Statistics
B Std. Error Beta Zero-order Partial Part Tolerance VIF
1 Constant 2.04 .17
12.25 .000
TMP2005 .21 .04 .335 4.64 .000 .33 .33 .33 1.00 1.00
2 Constant 1.83 .17
10.98 .000
TMP2005 .04 .06 .068 .71 .476 .33 .05 .05 .52 1.92
Park 2010 .15 .04 .384 4.01 .000 .43 .29 .28 .52 1.92
3 Constant 1.26 .21
5.92 .000
TMP2005 -.03 .06 -.042 -.44 .661 .33 -.03 -.03 .48 2.09
Park 2010 .08 .04 .204 2.01 .046 .43 .15 .13 .42 2.36
EASM .29 .07 .383 4.13 .000 .49 .30 .27 .51 1.98

68
Similar results are found when separation distress is used as the dependent
variable (Table 4-12, 4-13, 4-14). In this model 75% of the variance in separation distress
is accounted for using the three predictor variables. One departure from the previous
model is that, when separation distress is the criterion variable, the Park et al.(2010)
measure remains a significant predictor. However, EASM still explains unique,
incremental variance as a predictor. This hierarchical test demonstrates additional
evidence for EASM’s discriminant validity when compared to brand attachment scales
adapted to the social media context.
Table 4-12 Separation Distress: Model Summary
Model R R
Square
Adjusted R
Square of the
Estimate
Change Statistics
Durbin-Watson
R Square Change
F Change df1 df2
Sig. F Change
1 .688a .474 .471 1.18 .474 170.32 1 189 .000
2 .790b .624 .620 1.00 .150 74.91 1 188 .000
3 .866c .750 .746 0.82 .126 94.02 1 187 .000 2.147
: (Constant), TMP 2005 b. Predictors: (Constant), TMP2005, Park 2010 c. Predictors: (Constant), TMP 2005, Park 2010, EASM d. Dependent Variable: Separation Distress
Table 4-13 Separation Distress: ANOVA
Model Sum of Squares df
Mean Square F Sig.
1 Regression 235.8 1 235.8 170.32 .000a
Residual 261.7 189 1.4
Total 497.5 190
2 Regression 310.4 2 155.2 155.922 .000b
Residual 187.1 188 1.0
Total 497.5 190
3 Regression 373.0 3 124.3 186.723 .000c
Residual 124.5 187 0.7
Total 497.5 190
Predictors: (Constant), TMP 2005 b. Predictors: (Constant), TMP 2005, Park 2010 c. Predictors: (Constant), TMP 2005, Park 2010, EASM d. Dependent Variable: Separation Distress

69
Table 4-14 Separation Distress: Coefficients
Since these three scales are acknowledged as being correlated, relative weights
analysis (RWA) is also appropriate (Johnson, 2000) for comparing the strength of EASM
versus measures developed by Thomson, MacInnis, and Park (2005) and Park et al.
(2010). RWA is another statistical technique for investigating the relative importance of
various independent variables in explaining variance of the dependent variable(s) of
interest because it overcomes the inherent limitations of other approaches such as
hierarchical regression (see Johnson and LeBreton, 2004).
The overall amount of variance accounted is 25% for time spent on social media
(Table 4-15). EASM accounts for 53.5% of the variance accounted for in time spent on
social media, compared to the remaining 46.5% associated with the two adapted scales
combined. The confidence interval for time spent on social media does not include zero,
indicating a statistically significant difference between Thomson, MacInnis, and Park’s
(2005) adapted measure and EASM. Zero is included in the confidence interval between
EASM and Park et al.’s (2010) measure, indicating the two are not statistically different in
Model
Unstandardized Coefficients
Standardized Coefficients
T Sig.
Correlations Collinearity Statistics
B
Beta Zero-order Partial Part Tolerance VIF
1 Constant .71 .22
3.27 .001
TMP 2005 .79 .06 .688 13.05 .000 .69 .69 .69 1.00 1.00
2 Constant .34 .19
1.77 .078
TMP 2005 .29 .08 .250 3.71 .000 .69 .26 .17 .44 2.28
Park 2010 .41 .05 .585 8.66 .000 .77 .53 .39 .44 2.28
3 Constant -.72 .19
-3.81 .000
TMP 2005 .09 .07 .080 1.38 .169 .69 .10 .05 .40 2.51
Park 2010 .22 .04 .316 5.12 .000 .77 .35 .19 .35 2.85
EASM .68 .07 .543 9.70 .000 .83 .58 .36 .43 2.35

70
the unique variance they are capable of explaining. However, the majority of the evidence
indicates that EASM is a better predictor of time spent on social media, and that the
measure possesses incremental validity.
The overall amount of variance accounted is 75% for separation distress (Table
4-15). In this model the EASM measure is statistically significantly different from both of
the adapted scales and accounts for 45% of the explained variance in separation
distress, with the remaining 55% of the explained variance associated with the other two
scales combined. Confidence intervals indicate that EASM is significantly different from
both of the adapted scales in the prediction of separation distress. Again, EASM is
deemed to be a relatively better predictor of separation distress, and possesses
incremental validity.

71
Table 4-15 Relative Weights Analysis Results
DV= Ln Total Hours
Total R2 = .25 F (10.1) = 20.112, p < .001
Predictor Relative Weights Percentage TMP 2005 14.5%
Park 2010 32.0%
EASM 53.5%
Difference 95% CI Low 95% CI High
EASM vs. TMP 2005 38.9%** -26.3% -2.3% EASM vs. Park 2010 21.5% -18.9% 5.5%
DV= Separation Distress
Total R2 = .75 F (124.3) = 186.7, p < .001
Predictor Relative Weights Percentage TMP 2005 22.5% Park 2010 32.6% EASM 45.0%
Difference 95% CI Low 95% CI High
EASM vs. TMP 2005 22.5%** -26.2% -9.3%
EASM vs. Park 2010 12.4%** -17.7% -1.8%
Relative weight percentage refers to the percent of total variance accounted for by all predictors. 95% CI refers to lower and upper α/2 percentiles of the sampling distribution. Percentages may not 100% due to rounding.
**p < .01
4.7.4 Study 6b: Participants and Design
Two hundred and forty-five undergraduate students participated in a survey for
partial course credit. Fifty-two respondents provided incomplete data and were thus
eliminated. Of the 193 remaining respondents, 12 of them reported that they do not use
social media and were also eliminated. The final sample for this study was comprised of
181 respondents (54% female, average age 29 years, age range 18-42 years of age).
4.7.5 Study 6b: Measures
Respondents were asked to select the various social media platforms that they
use and to report the average amount of time they spend per week on each platform
selected. Participants provided their level of agreement with each of the 27 EASM items
using a 7-point Likert response scale (1= “strongly disagree” to 7 = “strongly agree”). To
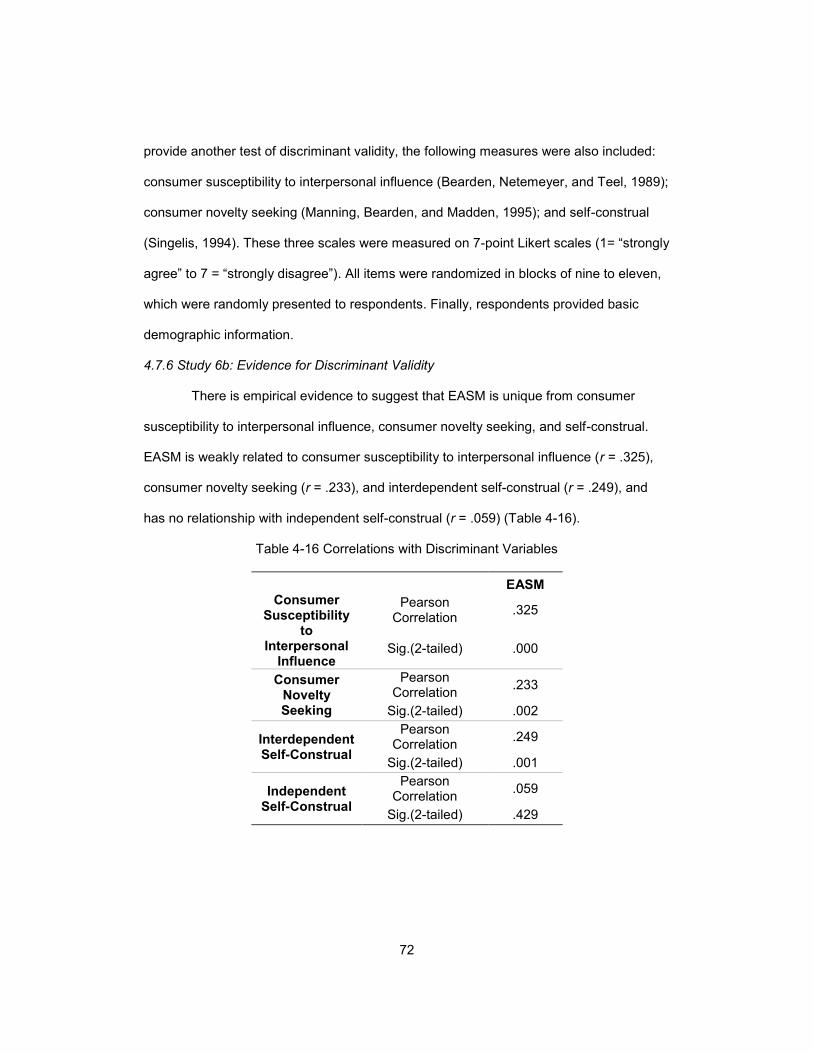
72
provide another test of discriminant validity, the following measures were also included:
consumer susceptibility to interpersonal influence (Bearden, Netemeyer, and Teel, 1989);
consumer novelty seeking (Manning, Bearden, and Madden, 1995); and self-construal
(Singelis, 1994). These three scales were measured on 7-point Likert scales (1= “strongly
agree” to 7 = “strongly disagree”). All items were randomized in blocks of nine to eleven,
which were randomly presented to respondents. Finally, respondents provided basic
demographic information.
4.7.6 Study 6b: Evidence for Discriminant Validity
There is empirical evidence to suggest that EASM is unique from consumer
susceptibility to interpersonal influence, consumer novelty seeking, and self-construal.
EASM is weakly related to consumer susceptibility to interpersonal influence (r = .325),
consumer novelty seeking (r = .233), and interdependent self-construal (r = .249), and
has no relationship with independent self-construal (r = .059) (Table 4-16).
Table 4-16 Correlations with Discriminant Variables
EASM Consumer
Susceptibility to
Interpersonal Influence
Pearson Correlation
.325
Sig.(2-tailed) .000
Consumer Novelty Seeking
Pearson Correlation
.233
Sig.(2-tailed) .002
Interdependent Self-Construal
Pearson Correlation
.249
Sig.(2-tailed) .001
Independent Self-Construal
Pearson Correlation
.059
Sig.(2-tailed) .429
73
4.7.7 Discussion
Data from Study 6 shows EASM’s criterion-related validity in predicting time
spent on social media, a representation for proximity maintenance. Results show that
EASM explains unique incremental variance and show it to have superior predictive
validity in comparison to the adapted brand scales. Finally, EASM is shown to be
distinctly different from the constructs of consumer susceptibility to interpersonal
influence, consumer novelty seeking, and self-construal.
4.8 Study 7
Study 7 tests EASM’s ability to predict additional outcome variables in three life
domains. These domains are measured more behaviorally than attitudinally, and in a
methodologically different way to alleviate concerns about common method bias. I also
introduce three antecedent constructs to be tested simultaneously as independent
variables that plausibly should relate to EASM.I examine the nomological validity of
EASM by placing it between three antecedent constructs (i.e., sociability, social
comparison, and information credibility) and three social media behavioral measures
across substantially varied life domains (i.e., social, work, and consumer).
With respect to the social media behaviors, I posited that individuals who are
emotionally attached to social media should engage in more behaviors on social media
platforms. I asked respondents to (“check all that apply”) for distinct sets of social media
behaviors in the social, work, and consumer spheres of social media activities.
4.8.1 Participants and Design
Two hundred fifty-eight undergraduate business students (41% female, average
age 24 years, age range 18-53 years of age) completed an online survey in exchange for
partial course credit. Seven responses were dropped because they did not provide
complete data.

74
4.8.2 Measures
Items for EASM were assessed on 7-point Likert scales (1= “strongly disagree” to
7 = “strongly agree”). Respondents were also asked to think about their social media
behaviors in three separate life domains: socially-related, work-related, and consumer-
related. I provided a list of actions that an individual can perform within each domain
(separately) and asked them to check all the actions they have personally done in the last
two weeks (These items are provided in Appendix A through C.) These behaviorally-
oriented self-reported measures are constrained to the very recent past. The more boxes
they checked, the more behaviorally active in social media respondents were assumed to
be in each of the life domains. A summated count of each was used as one indicator of a
three-indicator latent variable called Social Media Behavior.
The antecedents of EASM for this model were measured using the following
existing scales from the literature: sociability (Gilford, 1959) was measured on a 5-point
scale (1 = “extremely uncharacteristic” to 5 = “extremely characteristic”), social
comparison (Hill, 1987) was measured on a 5-point scale (1 = “not at all true” to 5 =
“completely true”), and information credibility (Flanagin and Metzger, 2000) was
measured on a 7-point scale (1 = “not at all” to 7 = “extremely”). A diagram of our
nomological network is shown in Figure 4-6.
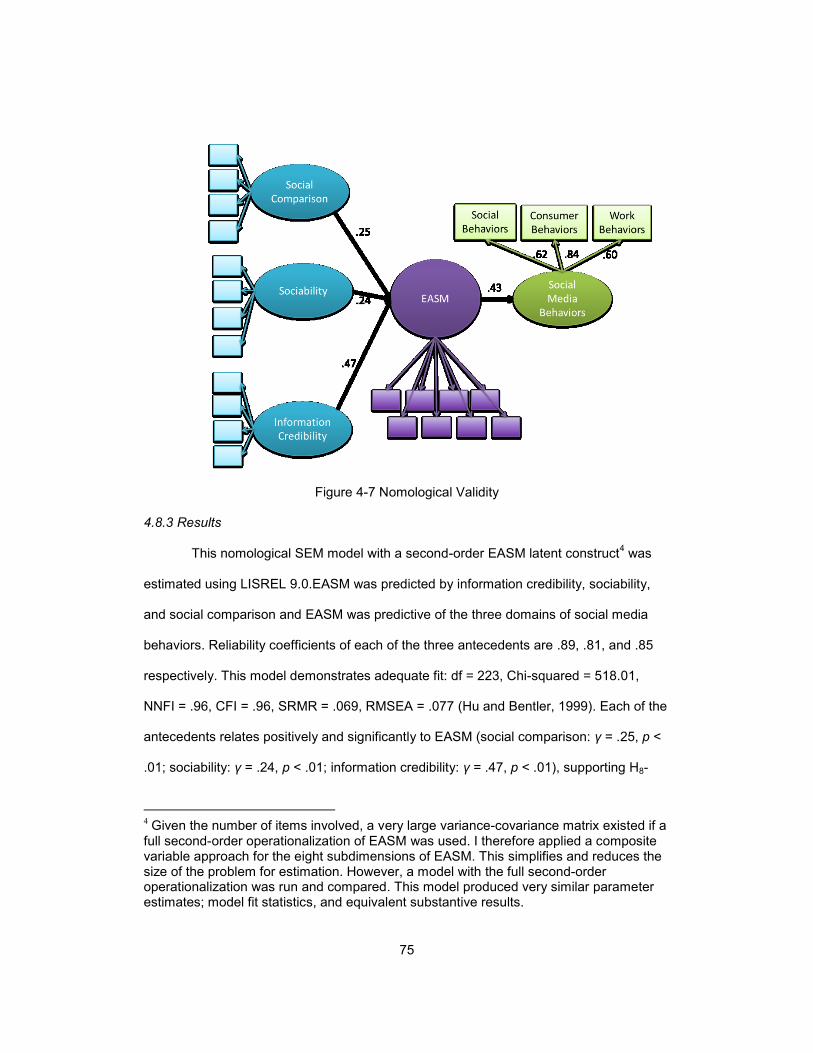
75
Figure 4-7 Nomological Validity
4.8.3 Results
This nomological SEM model with a second-order EASM latent construct4 was
estimated using LISREL 9.0.EASM was predicted by information credibility, sociability,
and social comparison and EASM was predictive of the three domains of social media
behaviors. Reliability coefficients of each of the three antecedents are .89, .81, and .85
respectively. This model demonstrates adequate fit: df = 223, Chi-squared = 518.01,
NNFI = .96, CFI = .96, SRMR = .069, RMSEA = .077 (Hu and Bentler, 1999). Each of the
antecedents relates positively and significantly to EASM (social comparison: γ = .25, p <
.01; sociability: γ = .24, p < .01; information credibility: γ = .47, p < .01), supporting H8-
4 Given the number of items involved, a very large variance-covariance matrix existed if a
full second-order operationalization of EASM was used. I therefore applied a composite variable approach for the eight subdimensions of EASM. This simplifies and reduces the size of the problem for estimation. However, a model with the full second-order operationalization was run and compared. This model produced very similar parameter estimates; model fit statistics, and equivalent substantive results.

76
H10. EASM also relates positively and significantly to each of the life domain social media
behaviors (social behaviors media: β= .43, p <.01), supporting H5-H7.
4.8.4 Discussion
Study 7 frames a nomological network for EASM in relation to three antecedents
(sociability, social comparison, and information credibility) and outcome behaviors across
three life domains where social media is prevalent. Results show that each of the
antecedents is positively and significantly related to EASM, and that EASM relates
significantly and positively to actual behaviors across three life domains (social, work,
and consumer). Individuals who are more emotionally attached to social media are
significantly more actively engaged in social, work, and consumer related social media
activities.
4.9 Forward
The next chapter of this dissertation is a discussion of the results. Subsequently,
a description of the limitations and future directions for research with EASM are also
discussed.
77
Chapter 5
Conclusions and Future Research
5.1 Overview
Results from seven studies with close to 1,700 respondents demonstrate that
some consumers are, indeed emotionally attached to social media. I provided empirical
evidence for the reliability, validity, and generalizability of a multidimensional
conceptualization and operationalization of EASM that includes eight distinct elements:
(1) connecting, use of social media to stay connected to others; (2) nostalgia, the ability
to use social media in order to remember things from the past; (3) informed, social
media’s role in keeping the respondent informed; (4) enjoyment, social media’s role as a
way for the respondent to experience relaxation and enjoyment; (5) advice, ability to seek
advice via social media; (6) affirmation, ability to feel affirmed from social media usage;
(7) enhances my life, social media’s role in enhancing life; and, (8) influence, the ability
to use social media to encourage, influence, and help others. This chapter discusses
research findings, offers managerial implications, proposes future research, and presents
the limitations of this body of work.
5.2 Overall Research Findings
Two of the objectives of this dissertation were to identify the nature and structure
of EASM and to develop a measurement scale that would represent consumers’
emotional attachment to social media in a reliable and valid way. By following scale
development procedures recommended in the literature (Nunnally and Bernstein, 1994;
DeVellis, 2003), I have achieved these objectives.
First, exploratory research with social media users and key informants was
conducted to generate a pool of items to tap into the construct of EASM. Then, based on
the factor analysis results, eight first-order factors emerged to tap into the higher-order

78
construct of emotional attachment to social media. Next, to ensure the robustness of the
factor structure across different individuals and to further test the reliability and validity of
the measure, a second measurement phase was conducted. Specifically, two additional
samples, one of students (n=209) and one of non-students (n=226), completed the same
survey described in previous studies. Results of the exploratory and confirmatory factor
analyses show strong support for the eight-factor structure. Finally, to establish the
reliability and validity of a second-order factor conceptualization of emotional attachment
to social media, analyses were conducted to demonstrate (a) convergent validity, (b)
discriminant validity, (c) criterion-related validity, (d) content validity, (e) test-retest
reliability, (f) predictive validity, and, (g) nomological validity. Results of these analysis all
showed strong support for a second-order EASM construct with eight first-order
subdimensions measured with 27-items.Importantly, the nomological model of Study 7
convincingly demonstrates that the validated, reliable EASM measure predicts social
media behaviors in the consumer realm, as well as in work and life domains.
5.3 Managerial Implications
Several managerial implications can be drawn from this dissertation. There is a
theoretical and measureable phenomenon underlying social media usage which should
help managers understand why some individuals use social media heavily and why
others do not. Not all individuals have a psychological drive to interact within various
social media platforms; however, there are some individuals who use social media for a
variety of reasons (e.g., as a way to feel connected and stay informed about news and
events). Insights from this dissertation enable managers to develop strategies for social
media, with a deeper understanding of what drives consumers’ social media behaviors.
The ability to identify individuals who have higher EASM is a useful tool for
marketing managers, because it reveals which customers are willing to interact and

79
engage on social media in their personal lives, and as consumers. With this knowledge
managers can create more effective social media strategies, and also specifically target
high EASM consumers with marketing initiatives via social media. Marketing managers
now have the ability to understand explicitly who they should target with social media
strategies, which consumers are most likely to appreciate social media information about
companies and brands, and respond in more favorable ways. By segmenting and
targeting social media users based on their EASM, companies’ social media efforts
should become more efficient and effective, allowing for managers to demonstrate
stronger ROI for marketing efforts in the social media space.
Finally, the development of the EASM scale also provides a way for companies
to make better hiring decisions for their social media teams. In the last several years
many companies have placed a greater emphasis on social media in their promotional
mix. To illustrate, in 2009, the New York Times hires a social media editor, and even the
Catholic Press Association is now offering webinars on how churches can use social
media to connect with the community. Hiring the right individual for any position is
important, and EASM allows mangers to determine if those being considered for the
social media positions possess a strong psychological connection with social media. As
Confucius said, “if you choose a job you love you’ll never have to work a day in your life.”
5.4 Limitations
The present research should be couched within the context of its limitations.
Some of which provide directions for future research. First, the development of the EASM
scale was implemented by treating social media holistically, rather than decomposing it
into specific platforms. Addressing idiosyncrasies of different social media platforms was
beyond the scope of this this dissertation; however, exploration in this area would likely
yield interesting tactical insights for mangers. The relative weight of the subdimensions

80
comprising EASM could vary across different social media platforms. Understanding how
and why individuals are differentially attached to different social media platforms, would
certainly inform marketing strategy.
Secondly, the focus of this dissertation was on the impact that EASM exerts on
consumers’ behaviors within social media. Little attention was paid to the impact of the
various platform-related attributes on consumer behaviors. This approach was taken in
order to demonstrate and understand the nature of emotional attachment in social media
holistically, without introducing a host of additional confounding factors into the models.
However, additional research is needed to explore the relationship between platform-
related attributes which might form on the basis of utilitarian attitudes, and non-platform
related attributes (e.g., attitude towards social media), which might form based on
experiences.
Finally, this research entails the identification of an eight-factor structure and the
development of a 27-item EASM scale. Every attempt was made to validate the factor
structure by using a wide variety of samples for analyses. In addition, measures of
internal reliability, test-retest reliability, content validity, criterion-related validity,
discriminant validity, convergent validity, predictive validity and nomological validity were
all provided. However, the extent to which the EASM construct relates to general
attitudes towards social media was not examined. This area needs to be explored in
future research, and might follow the precedent set by Thomson, MacInnis, and Park
(2005). More work is also needed to definitively assess the role a person’s interpersonal
attachment style may play within the EASM construct. For instance, it would be
interesting to determine if a person who is anxious or avoidant of human attachment is
more or less likely to be highly emotionally attached to social media, or if a person with a

81
secure human attachment is more likely to be highly emotionally attached to social
media.
5.5 Future Research
Exploration of social media is in its infancy in academic research. This
dissertation is the starting point for various additional research topics. A logical the next
step might be to see how emotional attachment to brands and emotional attachment to
social media interact. Does a person’s attachment to a given brand drive his/her
participation in and advocacy for the brand via social media? Does a person’s emotional
attachment to social media drive his/her attachment to brands and thus his/her
participation in and advocacy for the brand via social media? Or does some interplay
between attachment to brands and attachment to social media drive consumers to
engage with, participate in, and advocate on behalf of a brand via social media?
Academically and managerially, understanding how to increase consumer engagement,
social media participation, and advocacy both within social media would be enhanced by
answers to these questions.
Further, in this research, EASM was examined as a positive bond between social
media and the self, a view of this relationship that is supported by others (cf. Valkenburg,
Peter, and Schouten 2006). However, recent research has shown that social media
usage can have a strong, negative impact on consumers and their face-to-face/personal
relationships (cf. Corstjens and Umblijs 2012; Wilcox and Stephen 2013). In fact, there
appears to be a dark side to social media that researchers are only just beginning to
explore and understand. Future research should investigate the extent to which EASM
has the ability to negatively impact individuals’ personal relationships. Extreme EASM
might resemble an “addictive” profile, where the consequences of high EASM actually

82
interfere with healthy life function and lead individuals to neglect life events and
responsibilities in order to spend more time on social media.
Other marketing questions relevant to EASM abound. For example, how is a
consumer’s rapport with a given brand in terms of loyalty, repurchase intentions,
advocacy, and the like impacted when they are exposed to negative chatter on social
media about the company, brand, and/or products? Stakeholders certainly take note of
information on social media as evidenced in April 2013 when a Twitter hoax claimed
President Obama was injured in an explosion at the White House. Following this, the
Dow Jones Industrial Average dropped temporarily by 150 points, resulting in the loss of
$136 billion in market value (Chozick and Perlroth, 2013).
The current research does illuminate who is likely to be attending and reacting to
social media. Companies and government agencies might begin to tailor messaging
accordingly and strategically leverage this knowledge in ways that improve performance
of, or support for, organizations. Finally, subsequent research efforts could aim to
construct a “short form” version of EASM. Twenty-seven items is a fairly large number to
include in survey-based research, be it academic or practioner research. A lesser number
of the most representative items could be identified and assessed psychometrically to
create a short form instrument.

83
Appendix A
Social Media Social Behaviors
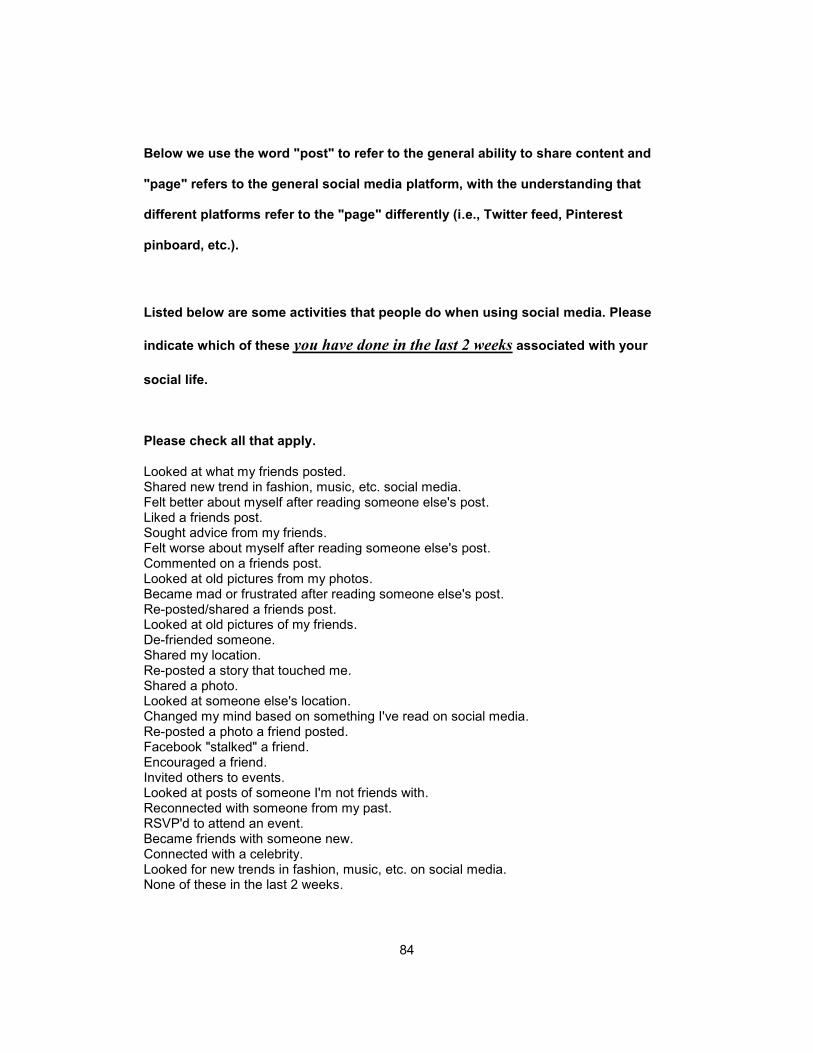
84
Below we use the word "post" to refer to the general ability to share content and
"page" refers to the general social media platform, with the understanding that
different platforms refer to the "page" differently (i.e., Twitter feed, Pinterest
pinboard, etc.).
Listed below are some activities that people do when using social media. Please
indicate which of these you have done in the last 2 weeks associated with your
social life.
Please check all that apply.
Looked at what my friends posted. Shared new trend in fashion, music, etc. social media. Felt better about myself after reading someone else's post. Liked a friends post. Sought advice from my friends. Felt worse about myself after reading someone else's post. Commented on a friends post. Looked at old pictures from my photos. Became mad or frustrated after reading someone else's post. Re-posted/shared a friends post. Looked at old pictures of my friends. De-friended someone. Shared my location. Re-posted a story that touched me. Shared a photo. Looked at someone else's location. Changed my mind based on something I've read on social media. Re-posted a photo a friend posted. Facebook "stalked" a friend. Encouraged a friend. Invited others to events. Looked at posts of someone I'm not friends with. Reconnected with someone from my past. RSVP'd to attend an event. Became friends with someone new. Connected with a celebrity. Looked for new trends in fashion, music, etc. on social media. None of these in the last 2 weeks.

85
Appendix B
Social Media Work Behaviors

86
Below are some activities that people do when using social media. Please indicate which of these you have done in the last 2 weeks associated with your work or job. Please check all that apply. Looked at my employer's page. Encouraged a co-worker/peer. Shared a job opening. Liked my company's post. Facebook "stalked" a co-worker/peer. Completed some training for my job. Commented on my company's post. Facebook "stalked" a superior. Invited others to work events. Shared my company's post. Participated in a work contest. RSVP'd to attend a work event. Looked at pictures on my company's social media page. Applied for a job on a company or organization's page. Shared a pictures on my company's social media page. Looked for job openings on a company or organization's page. None of these in the last 2 weeks.

87
Appendix C
Social Media Consumer Behaviors

88
Now we would like you to think about Brands and Companies in general. Below are some activities that people do when using social media. Please indicate which of these you have done in the last 2 weeks associated with brands and companies.
Below we use the word "post" to refer to the general ability to share content and "page" refers to the general social media platform, with the understanding that different platforms refer to the "page" differently (i.e., Twitter feed, Pinterest pinboard, etc.). Please check all that apply.
Shared when I was at a company's location. Made a positive commented on a company or brand's social media page. Shared a photo on a company or brand's social media page. Looked at a company or brands' social media page. Made a negative comment on a company or brand's social media page. Changed my mind based on something I saw on a company or brand's social media page. Learned information from a company or brand's social media page. Bashed a company or brand on my personal social media page. "Unliked" a company or brand's social media page. "Liked" a company or brand's social media page. Advocated for a company or brand on my personal social media page. Participated in a company or brand's contest. Read a company or brand's post. Asked a question on a company or brand's social media page. Bought something because of what I read on company or brand's social media page. "Liked" a company or brand's post. Looked for new trends in fashion, music, etc. on a company or brand's social media page. RSVP'd to attend a company or brand's event. Shared a company or brand's post. Looked at pictures on a company or brand's social media page. None of these in the last 2 weeks.

89
References
Aaker, David A.(2008), Strategic Market Management.9th Edition, New York: John Wiley & Sons. Adams-Price, Carolyn and A. L.Greene (1990), "Secondary attachments and adolescent self-concept," Sex Roles, 22 (3-4), 187-198. Agnihotri, Raj, Prabakar Kothandaraman, Rajiv Kashyap, and Ramendra Singh (2012), “Bringing" Social" into Sales: The Impact of Salespeople's Social Media Use on Service Behaviors and Value Creation,” Journal of Personal Selling and Sales Management, 32 (3), 333-348. Ainsworth, Mary D. Salter, and Silvia M. Bell (1970), "Attachment, Exploration, and Separation: Illustrated by the Behavior of One-Year-Olds in a Strange Situation," Child Development, 41 (1), 49-67. Allen, Vernon L., and David A. Wilder (1977), "Social comparison self-evaluation and conformity to the group," in Social Comparison Processes: Theoretical and Empirical Perspectives, ed. Jerry M. Suls and Richard L. Miller, Washington, DC: Hemisphere, pp.187-208. Alperstein, Neil M.(1991), "Imaginary social relationships with celebrities appearing in television commercials," Journal of Broadcasting and Electronic Media, 35 (1), 43-58. Andzulis, James "Mick”, Nikolaos G. Panagopoulos, and Adam Rapp (2012), “A Review of Social Media and Implications for the Sales Process,” Journal of Personal Selling and Sales Management, 3, 305-316. Angleitner, Alois and Jerry S. Wiggins (1985), Personality assessment via questionnaires: Current issues in theory and measurement, New York: Springer-Verlag. Aron, Arthur and Lori Westbay (1996), "Dimensions of the prototype of love," Journal of Personality and Social Psychology, 70 (3), 535-551. Asendorpf, Jens B. and Susanne Wilpers (2000), "Attachment security and available support: Closely linked relationship qualities," Journal of Social and Personal Relationships, 17 (1), 115-138. Back, Mitja D., Juliane M. Stopfer, Simine Vazire, Sam Gaddis, Stefan C. Schmukle, Boris Egloff, and Samuel D. Gosling (2010), "Facebook profiles reflect actual personality, not self-idealization," Psychological Science, 21 (3), 372-374. Bagozzi Richard, P.(1993), “Assessing construct validity in personality research: Applications to measures of self-esteem,” Journal of Research in Personality, 27, 49-87. Bagozzi, Richard P., Fred D. Davis, and Paul R. Warshaw (1992), “Development and test of a theory of technological learning and usage,” Human Relations, 45 (7), 659-686.

90
Baldwin, Mark W., John Patrick Richard Keelan, Beverley Fehr, Vicki Enns, and Evelyn Koh-Rangarajoo (1996), “Social-cognitive conceptualization of attachment working models: Availability and accessibility effects,” Journal of Personality and Social Psychology, 71, 94-109. Ball, Dwayne A. and Lori H. Tasaki (1992), "The role and measurement of attachment in consumer behavior," Journal of Consumer Psychology, 1 (2), 155-172. Bartholomew, Kim, and Leonard M. Horowitz (1991), “Attachment Styles Among Yung Adults: A Test of a Four-Category Model,” Journal of Personality and Social Psychology, 61 (2), 226-244. Bartz, Jennifer A. and John E. Lydon (2004), “Close Relationships and the Working-Self Concept: Implicit and Explicit Effects of Priming Attachment on Agency and Communion,” Personality and Social Psychology Bulletin, 30 (11), 1389-1401. Bassi, Francesca (2011), “Latent class analysis for marketing scale development,” International Journal of Market Research, 53 (2), 209-230.
Bearden, William O., David M. Hardesty, and Randall L. Rose (2001), “Consumer self‐confidence: refinements in conceptualization and measurement,” Journal of Consumer Research, 28 (1), 121-134. Bearden, William O., Richard G. Netemeyer, and Jesse E. Teel (1989), "Measurement of consumer susceptibility to interpersonal influence," Journal of Consumer Research, 15 (4), 473-481. Belk, Russell W.(1988), “Possessions and the extended self,” Journal of Consumer Research, 15, 139-168. Bollen, Kenneth A.(1989), Structural equations with latent variables. New York: Wiley. Bowlby, John (1969), Attachment and Loss: Attachment Vol.1, New York: Basic Books. Bowlby, John (1979), The Making and Breaking of Affectional Bonds, London: Tavistock. Bowlby, John (1980), Loss: Sadness and Depression: Vol.3.Attachment and Loss, London: Hogarth. Bowlby, John (1988), A secure base: Clinical applications of attachment theory. New York: Basic Books. Brennan, Kelly A. and Phillip R. Shaver (1995), "Dimensions of adult attachment, affect regulation, and romantic relationship functioning," Personality and Social Psychology Bulletin, 21 (3), 267-283. Brennan, Kelly A., Catherine L. Clark, and Phillip R. Shaver (1998), “Self-Report Measurement of Adult Attachment,” in Attachment Theory and Close Relationships, Jeffry A. Simpson and W. Stephen Rholes (Eds.), New York: Guilford, pp.46-76.

91
Bylsma, Wayne H., Catherine Cozzarelli, and Nebi Sumer (1997), "Relation between adult attachment styles and global self-esteem," Basic and Applied Social Psychology, 19 (1), 1-16. Campbell, Donald T.(1960), “Recommendations for APA test standards regarding construct, trait, or discriminant validity,” American Psychologist, 15, 546-553. Castillo, Carlos, Marcelo Mendoza, and Barbara Poblete (2011), "Information credibility on Twitter," Proceedings of the 20th international conference on World Wide Web. ACM, 675-684. Cheek, Jonathan M., and Arnold H. Buss (1981), "Shyness and sociability," Journal of Personality and Social Psychology, 41 (2), 330-339. Chin, Wynne W.(1998), “Issues and opinion on structural equation modeling,” MIS Quarterly, 22 (1), 7-16. Chou, Hui-Tzu Grace, and Nicholas Edge (2012), “”They are happier and having better lives than I am”: the impact of using Facebook on perceptions of others' lives," Cyberpsychology, Behavior, and Social Networking, 15(2), 117-121. Chui, Michael, James Manyika, Jacques Bughin, Richard Dobbs, Charles Roxburgh, Hugo Sarrazin, Geoffrey Sands, and Magdalena Westergren (2012), "The social economy: Unlocking value and productivity through social technologies." McKinsey Global Institute, July, 1-13. Churchill Jr, Gilbert A.(1979), “A paradigm for developing better measures of marketing constructs,” Journal of Marketing Research, 64-73. Churchill, Gilbert Dawn Iacobucci (2002), Marketing Research: Methodological Foundations.(8th Ed.), Mason: Thomson Learning. Clark, Lee Anna, and David Watson (1995), "Constructing validity: Basic issues in objective scale development," Psychological Assessment, 7 (3), 309-319. Constine, Josh (2012), “Pinterest Hits 10 Million U.S. Monthly Uniques Faster Than Any Standalone Site Ever.” Tech Crunch. Available: http://techcrunch.com/2012/02/07/pinterest-monthly-uniques/ [Accessed 30th June 2012]. Colin, Virginia L.(1996), Human Attachment, Temple University Press. Collins, Nancy and Stephen J. Read (1994), “Cognitive Representations of Attachment: The Structure and Function of Working Models,” in Attachment Processes in Adulthood, Kim Bartholomew and Daniel Perlman (Eds.), London: Jessica Kingsley Publishers, pp.53-90. Correa, Teresa, Amber Willard Hinsley, and Homero Gil de Zuniga (2010), “Who interacts on the Web?: The intersection of users’ personality and social media use,” Computers in Human Behavior, 26 (2), 247-253.

92
Corstjens, Marcel, and Andris Umblijs (2012), “The Power of Evil: The Damage of Negative Social Media Strongly Outweigh Positive Contributions,” Journal of Advertising Research, 52 (4), 433-449. Courville, Troy, and Bruce Thompson (2001), "Use of structure coefficients in published multiple regression articles: β is not enough," Educational and Psychological Measurement, 61 (2), 229-248. Cozzarelli, Catherine, Steven J. Hoekstra, and Wayne H. Bylsma (2000), "General versus specific mental models of attachment: Are they associated with different outcomes?." Personality and Social Psychology Bulletin, 26 (5), 605-618. Crittenden, Patricia M.(1990), “Internal representational models of attachment relationships." Infant Mental Health Journal, 11(3), 259-277. Crocker, Linda, and James Algina (1986), Introduction to Classical and Modern Test Theory. Holt, Rinehart and Winston, Orlando. Cronbach, Lee J., and Paul E. Meehl (1955), “Construct validity in psychological tests,” Psychological Bulletin, 52, 281-302. De Longueville, Bertrand, Robin S. Smith, and Gianluca Luraschi (2009), "OMG, from here, I can see the flames!: a use case of mining location based social networks to acquire spatiotemporal data on forest fires," in Proceedings of the 2009 International Workshop on Location Based Social Networks, ACM, 73-80. DeVellis, Robert F.(2003), Scale Development: Theory and Applications Second Edition (Applied Social Research Methods). London: Sage. Dutton, Donald G., Keith Saunders, Andrew Starzomski, and Kim Bartholomew (1994),
"Intimacy‐Anger and Insecure Attachment as Precursors of Abuse in Intimate Relationships," Journal of Applied Social Psychology, 24 (15), 1367-1386. Earle, Paul, Michelle Guy, Richard Buckmaster, Chris Ostrum, Scott Horvath, and Amy Vaughan (2010), "OMG earthquake! Can Twitter improve earthquake response?" Seismological Research Letters, 81 (2), 246-251. Ehrenberg, Alexandra, Suzanna Juckes, Katherine M. White, and Shari P. Walsh (2008), “Personality and self-esteem as predictors of young people's technology use,” CyberPsychology & Behavior, 11 (6), 739-741. Ellison, N.B., Steinfield, C., & Lampe, C.(2007), “The benefits of Facebook “Friends:” Social capital and college students’ use of online social networking sites,” Journal of Computer-Mediated Communication, 12, 1143-1168. Fennis, Bob M., Ad Th H. Pruyn, and Mascha Maasland (2005), “Revisiting the malleable self: Brand effects on consumer self-perceptions of personality traits,” Advances in Consumer Research, 32, 371-377.

93
Festinger, Leon (1954), "A theory of social comparison processes," Human Relations, 7 (2), 117-140. Fisher, Tia (2009), “ROI in Social Media: A Look at the Arguments,” Database Marketing & Customer Strategy Management, 16 (3), 189-195. Flanagin, Andrew J., and Miriam J. Metzger (2000), "Perceptions of Internet information credibility," Journalism & Mass Communication Quarterly, 77(3), 515-540. Floyd, Frank J., and Keith F. Widaman (1995), "Factor analysis in the development and refinement of clinical assessment instruments," Psychological Assessment, 7 (3), 286-299. Ford, J. Kevin, Robert C. MacCallum, and Marianne Tait (1986), “The application of exploratory factor analysis in applied psychology: A critical review and analysis,” Personnel Psychology, 39 (2), 291-314. Fornell, Claes, and David F. Larcker (1981), “Evaluating structural equation models with unobservable variables and measurement error,” Journal of Marketing Research, 18, 39-50. Fournier, Susan and Julie L. Yao (1997), "Reviving brand loyalty: a reconceptualization within the framework of consumer-brand relationships," International Journal of Research in Marketing, 14 (5), 451-472. Fraley, R. Chris and Keith E. Davis (1997), "Attachment formation and transfer in young adults’ close friendships and romantic relationships," Personal Relationships, 4 (2), 131-144. Gerbing, David W., and James C. Anderson (1988), “An updated paradigm for scale development incorporating unidimensionality and its assessment,” Journal of Marketing Research, 25 (2), 186-192. Geyer, Paul D., Michael Dotson, and Ronald H. King (1991), "Predicting brand commitment: an empirical test of Rusbult's investment model," The Mid-Atlantic Journal of Business, 27(2), 129-137. Gibson, W.A.(1962), "Orthogonal predictors: A possible resolution of the Hoffman-Ward controversy," Psychological Reports, 11 (1), 32-34. Goethals, George R.(1986), "Social Comparison Theory Psychology from the Lost and Found," Personality and Social Psychology Bulletin, 12(3), 261-278. Goldenberg, J., Oestreicher-Singer, G., & Reichman, S.(2012), “The quest for content: How user-generated links can facilitate online exploration,” Journal of Marketing Research, 49 (4), 452-468. Gonzales, Amy L., and Jeffrey T. Hancock (2011), "Mirror, mirror on my Facebook wall: Effects of exposure to Facebook on self-esteem," Cyberpsychology, Behavior, and Social Networking, 14 (1-2), 79-83.

94
Gorsuch, R.L.(1983), Factor Analysis, 2
nd ed. Hillsdale, NJ, Lawrence Erlbaum
Associates. Grayson, Kent and David Shulman (2000), "Indexicality and the verification function of irreplaceable possessions: A semiotic analysis," Journal of Consumer Research, 27 (1), 17-30. Grégoire, Yany, Daniel Laufer, and Thomas M. Tripp (2010), “A comprehensive model of customer direct and indirect revenge: understanding the effects of perceived greed and customer power,” Journal of the Academy of Marketing Science, 38 (6), 738-758. Griffin, Dale W. and Kim Bartholomew (1994), "Models of the self and other: Fundamental dimensions underlying measures of adult attachment," Journal of Personality and Social Psychology, 67 (3), 430-445. Grisaffe, Douglas B. and Nguyen, Hieu P.(2011), “Antecedents of emotional attachment to brands,” Journal of Business Research, 64 (10), 1052-1059. Hair, Joe F., Black, William C., Babin, Barry J., Anderson, Rolph E., and Ronald L. Tatham (2010), Multivariate Data Analysis, Vol.7.Upper Saddle River, Prentice Hall. Hanna, Richard, Andrew Rohm, and Victoria L. Crittenden (2011), “We’re all connected: The power of the social media ecosystem,” Business Horizons, 54 (3), 265-273. Harvard Business Review (2010). The New Conversation: Taking Social Media from Talk to Action, 1-21. Haynes, Stephen N., David Richard, and Edward S. Kubany (1995), “Content validity in psychological assessment: A functional approach to concepts and methods,” Psychological Assessment, 7(3), 238-247. Haynes, Stephen N., Karl Nelson, and Daniel D. Blaine (1999), “Psychometric issues in assessment research,” in P.C. Kendall, J.N. Butcher, G. Holmbeck (Ed.), Handbook of Research Methods in Clinical Psychology (pp.125-149). New York, NY: John Wiley & Sons Inc. Hazan, Cindy, and Phillip Shaver (1987), "Romantic love conceptualized as an attachment process," Journal of Personality and Social Psychology, 52 (3), 511-524. Hazan, Cindy and Phillip R. Shaver (1994), "Attachment as an organizational framework for research on close relationships," Psychological Inquiry, 5 (1), 1-22. Hazan, Cindy, and Debra Zeifman (1999), “Pair Bonds as Attachments,” in J. Cassidy & P.R. Shaver (Eds.), Handbook of Attachment (pp.336-354), New York: Guilford. Hennig-Thurau, Thorsten, Edward C. Malthouse, Christian Friege, Sonja Gensler, Lara Lobschat, Arvind Rangaswamy, and Bernd Skiera (2010), “The impact of new media on customer relationships,” Journal of Service Research, 13 (3), 311-330.

95
Hill, Ronald P. and Mark Stamey (1990), "The homeless in America: An examination of possessions and consumption behaviors," Journal of Consumer Research, 17, 303-321. Hirschman, Elizabeth C.(1994), "Consumers and their animal companions," Journal of Consumer Research, 20, 616-632. Hoffman, Donna L. and Marek Foder (2010), “Can You Measure the ROI of Your Social Media Marketing?,” MIT Sloan Management Review, 52 (1), 41-49. Hollenbeck, Candice R., and Andrew M. Kaikati (2012), “Consumers’ Use of Brands to Reflect Their Actual and Ideal Selves on Facebook,” International Journal of Research in Marketing, 29 (1), 395-405.
Hu, Li‐tze, and Peter M. Bentler (1999), "Cutoff criteria for fit indexes in covariance structure analysis: Conventional criteria versus new alternatives," Structural Equation Modeling: A Multidisciplinary Journal, 6 (1), 1-55. Hubbard, Raymond, and J. Scott Armstrong (1994), "Replications and extensions in marketing: Rarely published but quite contrary," International Journal of Research in Marketing, 11 (3), 233-248. Hughes, Amanda Lee, and Leysia Palen (2009), "Twitter adoption and use in mass convergence and emergency events," International Journal of Emergency Management, 6 (3), 248-260. Ipsos (2013), “Social Networking Eats Up 3+ Hours Per Day For The Average American User,” January (available at: http://www.marketingcharts.com/wp/interactive/social-networking-eats-up-3-hours-per-day-for-the-average-american-user-26049/). Johnson, Jeff W.(2000), "A heuristic method for estimating the relative weight of predictor variables in multiple regression," Multivariate Behavioral Research, 35 (1), 1-19. Johnson, Jeff W.(2004), "Factors affecting relative weights: The influence of sampling and measurement error," Organizational Research Methods, 7 (3), 283-299. Johnson, Jeff W., and James M. LeBreton (2004), "History and use of relative importance indices in organizational research," Organizational Research Methods, 7 (3), 238-257. Kaplan, Andreas M.(2012), “If you love something, let it go mobile: Mobile marketing and mobile social media 4x4,” Business Horizons, 55 (2), 129-139. Kaplan, Andreas M. and Haenlein, Michael (2010), “Users of the world, unite! The challenges and opportunities of Social Media,” Business Horizons, 53 (1), 59-68. Katona, Zlot, Peter P. Zubcsek and Miklos Sarvary (2011), “Network Effects and Personal Influences: The Diffusion of an Online Social Network,” Journal of Marketing Research, 48 (3), 425-443.

96
Kietzmann, Jan H., Kristopher Hermkens, Ian P. McCarthy, and Bruno S. Silvestre (2011), “Social media? Get serious! Understanding the functional building blocks of social media,” Business Horizons, 54 (3), 241-251. Kirkpatrick, Lee A.(1995), “Attachment and the Religious Experience,” in Handbook of Religious Experience: Theory and Practice, Ralph W. Hood Jr., ed. Birmingham: Religious Education Press. Kleine, Susan S., Robert E. Kleine III, and Chris T. Allen (1995), "How is a possession" me" or" not me"? Characterizing types and an antecedent of material possession attachment," Journal of Consumer Research, 2, 327-343. Kleine, Susan S and Stacey M. Baker (2004), "An integrative review of material possession attachment," Academy of Marketing Science Review, 1, 1-39. Klohnen, E.C., Weller, J.A., Luo, S., & Choe, M.(2005), “Organization and predictive power of general and relationship-specific attachment models: One for all, and all for one?” Personality and Social Psychology Bulletin, 31 (12), 1665-1682. Lakoff, Robin Tolmach, and Raquel L. Scherr (1984), Face value: The politics of beauty. Boston: Routledge & Kegan Paul. LaPointe, Pat (2012), “MIND OVER METRICS-Measuring Facebook's Impact on Marketing: The Proverbial Hits the Fan,” Journal of Advertising Research, 52 (3), 286-287. Lastovicka, John L., Lance A. Bettencourt, Renee Shaw Hughner, and Ronald J. Kuntze (1999), “Lifestyle of the tight and frugal: theory and measurement,” Journal of Consumer Research, 26 (1), 85-98. Lawshe, Charles H (1975), "A Quantitative Approach to Content Validity," Personnel Psychology, 28 (4), 563-575. Leclerc, France, Bernd H. Schmitt, and Laurette Dube (1995), “Waiting time and decision making: is time like money?” Journal of Consumer Research, 22 (1), 110-119. Lewin, Jeffrey E., and Jeffrey K. Sager (2010), “The Influence of Personal Characteristics and Coping Strategies on Salespersons' Turnover Intentions,” Journal of Personal Selling and Sales Management, 30 (4), 355-370. Lunden, Ingrid (2012), "Analyst: Twitter Passed 500M Users in June 2012, 140M of them in US," Jakarta ‘Biggest Tweeting’City, TechCrunch.com.http://techcrunch.com/2012/07/30/analysttwitter-passed-500m-users-in-june-2012-140m-of-them-in-us-jakarta-biggest-tweeting-city.[Accessed 30th June 2012]. Manning, Kenneth C., William O. Bearden, and Thomas J. Madden (1995), "Consumer innovativeness and the adoption process," Journal of Consumer Psychology, 4 (4), 329-345.

97
Marshall, Greg W., William C. Moncrief, John M. Rudd, and Nick Lee (2012), "Revolution in Sales: The Impact of Social Media and Related Technology on the Selling Environment," Journal of Personal Selling and Sales Management, 32 (3), 349-363. McGrath, Joseph E., and David Brinberg (1983), “External validity and the research process: A comment on the Calder/Lynch dialogue,’ Journal of Consumer Research, 10 (1), 115-124. Mende, M., Bolton, R.N., & Bitner, M.J.(2009), “Relationships Take Two: Customer Attachment Styles' Influence on Consumers' Desire for Close Relationships and Loyalty to the Firm,” Marketing Science Institute Reports, 9 (3), 23-49. Mende, Martin, and Ruth N. Bolton (2012), "Why Attachment Security Matters How Customers' Attachment Styles Influence Their Relationships With Service Firms and Service Employees," Journal of Service Research, 14 (3), 285-301. Mende, Martin, Ruth N. Bolton, and Mary Jo Bitner (2013), "Decoding Customer-Firm Relationships: How Attachment Styles Help Explain Customers' Preferences for Closeness, Repurchase Intentions, and Changes in Relationship Breadth," Journal of Marketing Research, 50 (1), 125-142. Mick, David G. and Michelle DeMoss (1990), "Self-gifts: Phenomenological insights from four contexts," Journal of Consumer Research, 17, 322-332. Mikulincer, Mario, and Phillip R. Shaver (2003), "The Attachment Behavioral System in Adulthood: Activation, Psychodynamics, and Interpersonal Processes," in Advances in Experimental Social Psychology, 35, ed. Mark P. Zanna, Burlington, MA: Elsevier, pp.53–152. Murphy, Barbara and Glen W. Bates (1997), "Adult attachment style and vulnerability to depression," Personality and Individual Differences, 22 (6), 835-844. Naylor, Rebecca, Cait Lamberton, and Patricia M. West (2012), "Beyond the “Like” Button: The Impact of Mere Virtual Presence on Brand Evaluations and Purchase Intentions in Social Media Settings," Journal of Marketing, 76 (6), 105-120. Netemeyer, Richard G., William O. Bearden, and Subhash Sharma (2003), Scaling procedures: Issues and applications. SAGE Publications, Incorporated. Nunnally, Jum C.(1978), Psychometric Theory, McGraw-Hill: New York. Nunnally, Jum C. and Ira H. Bernstein (1994), Psychometric Theory. McGraw, New York. Overall, Nickola C., Garth J. Fletcher, and Myron D. Friesen (2003), "Mapping the intimate relationship mind: Comparisons between three models of attachment representations," Personality and Social Psychology Bulletin, 29 (12), 1479-1493. Parasuraman, Arun, Dhruv Grewal, and Ramayya Krishnan (2006), Marketing Research. Cengage Learning.

98
Whan Park, C., Deborah J. MacInnis, Joseph Priester, Andreas B. Eisingerich, and Dawn Iacobucci (2010), "Brand attachment and brand attitude strength: conceptual and empirical differentiation of two critical brand equity drivers," Journal of Marketing, 74 (6), 1-17. Park, Choong Whan, Deborah MacInnis, and Joseph Priester (2007), “Brand Attachment and Management of a Strategic Brand Exemplar,” in the Handbook of the Brand and Experience Management, Bernd H. Schmitt (Ed.), Elgar Publishing. Pedhazur, Elazar J. and Liora Pedhazur Schmelkin (1991), Measurement, design, and analysis: An integrated approach. Hillsdale: Lawrence Erlbaum Associates, Inc. Perse, Elizabeth M., and Rebecca B. Rubin (1989), "Attribution in social and parasocial relationships," Communication Research, 16 (1), 59-77. Peter, J. Paul (1981), “Construct validity: A review of basic issues and marketing practices,” Journal of Marketing Research, 18 (2), 133-145. Peterson, Robert A.(1999), Constructing effective questionnaires. SAGE Publications, Incorporated. Pettigrew, Thomas F.(1967), "Social evaluation theory: convergences and applications," in Nebraska Symposium on Motivation, ed. Edavid Levine, Lincoln: University of Nebraska Press, 241-315. Pierce, Tamarha, and John E. Lydon (2001), "Global and specific relational models in the experience of social interactions," Journal of Personality and Social Psychology, 80 (4), 613-631. Pierce, Tamarha, and John Lydon (1998), “Priming Relational Schemas: Effects of Contextually Activated and Chronically Accessible Interpersonal Expectations on Responses to a Stressful Event,” Journal of Personality and Social Psychology, 75 (6), 1441-1448. Podsakoff, Philip M., Scott B. MacKenzie, Jeong-Yeon Lee, and Nathan P. Podsakoff (2003), “Common method biases in behavioral research: A critical review of the literature and recommended remedies,” Journal of Applied Psychology, 88 (5), 879-903. Portney Leslie G. and Watkins Mary P.(2008), “Statistical measures of reliability,” in Portney LG, Watkins MP, editors. Foundations of Clinical Research: Applications to Practice. New Jersey: Pearson Education Inc., pp.585–618 Powers, Todd, Dorothy Advincula, Manila S. Austin, Stacy Graiko, and Jasper Snyder (2012), “Digital and Social Media In the Purchase Decision Process: A Special Report from the Advertising Research Foundation,” Journal of Advertising Research, 52 (4), 479-489. Price, Linda L., Eric J. Arnould, and Carolyn F. Curasi (2000), "Older consumers’ disposition of special possessions," Journal of Consumer Research, 27 (2), 179-201.

99
Price, James L. and Charles W. Mueller (1986), Handbook of organizational measurement. Marshfield: Pitman. Raacke, John, and Jennifer Bonds-Raacke (2008), “MySpace and Facebook: Applying the uses and gratifications theory to exploring friend-networking sites,” CyberPsychology & Behavior, 11(2), 169-174. Richins, Marsha L.(1991), "Social comparison and the idealized images of advertising," Journal of Consumer Research, 18 (1), 71-83. Richins, Marsha L.(1994a), “Special possessions and the expression of material values.” Journal of Consumer Research, 21 (3), 522-533. Richins, Marsha L.(1994b), "Valuing things: The public and private meanings of possessions." Journal of Consumer Research, 21 (3), 504-521. Richins, Marsha L. and Scott Dawson (1992), “A consumer values orientation for materialism and its measurement: Scale development and validation,” Journal of Consumer Research, 19 (3), 303-316. Rosenthal, Robert, and Ralph L. Rosnow (1991), Essentials of behavioral research: Methods and data analysis, Vol.2, New York: McGraw-Hill. Ross, Craig, Emily S. Orr, Mia Sisic, Jaime M. Arseneault, Mary G. Simmering, and R. Robert Orr (2009), “Personality and motivations associated with Facebook use,” Computers in Human Behavior, 25 (2), 578-586. Rubinstein, Robert I. and Patricia A. Parmelee (1992), "Attachment to place and the representation of the life course by the elderly," in Place Attachment, I. Altman and S.M. Low, eds. New York, Springer, 139-163. Sable, Pat (1995), "Pets, attachment, and well-being across the life cycle," Social Work, 40 (3), 334-341. Schouten, John W. and James H. McAlexander (1995), "Subcultures of consumption: An ethnography of the new bikers," Journal of Consumer Research, 22, 43-61. Schriesheim, Chester A., Kathleen J. Powers, Terri A. Scandura, Claudia C. Gardiner, and Melenie J. Lankau (1993), "Improving construct measurement in management research: Comments and a quantitative approach for assessing the theoretical content adequacy of paper-and-pencil survey-type instruments," Journal of Management, 19 (2), 385-417. Schudson, Michael (1984), Advertising: the Uneasy Persuasion, New York, Basic Books. Sharpsteen, Don J., and Lee A. Kirkpatrick (1997), "Romantic jealousy and adult romantic attachment," Journal of Personality and Social Psychology, 72 (3), 627-640. Sheth, Jagdish N., and Atul Parvatiyar (1995), “The evolution of relationship marketing,” International Business Review, 4 (4), 397-418.

100
Shimp, Terence A., and Subhash Sharma (1987), “Consumer ethnocentrism: construction and validation of the CETSCALE,” Journal of Marketing Research, 24 (3), 280-289. Singelis, Theodore M.(1994), "The measurement of independent and interdependent self-construals," Personality and Social Psychology Bulletin, 20 (5), 580-591. Slater, Jan S.(2001), "Collecting brand loyalty: A comparative analysis of how Coca-Cola and Hallmark use collecting behavior to enhance brand loyalty," Advances in Consumer Research, 28, 362-369. Snow, Janeanne T., and Mary B. Harris (1986), "An analysis of weight and diet content in five women's interest magazines," Journal of Obesity & Weight Regulation, 5(Winter), 194-214.
Spector, Paul E.(1994), “Using self‐report questionnaires in OB research: A comment on the use of a controversial method,” Journal of Organizational Behavior, 15 (5), 385-392. Stelzner, Michael A.(2013), “How Marketers Are Using Social Media to Grow Their Businesses,” research report, Social Media Examiner (May 21). Stephen, Andrew T. and Jeff Galak (2012), “The effects of traditional and social earned media on sales: A study of a microlending marketplace,” Journal of Marketing Research, 49 (5), 624-639. Stokes, Tracy, David M. Cooperstien, Corinne Madigan, and Matthew Dernoga (2012), “How Social Media is Changing Brand Building,” Forrester, May 7, 1-13. Swaminathan, Vanitha, Karen M. Stilley, and Rohini Ahluwalia (2009), "When brand personality matters: The moderating role of attachment styles," Journal of Consumer Research, 35 (6), 985-1002. Thomson, Matthew (2006), "Human Brands: Investigating Antecedents to Consumers' Strong Attachments to Celebrities," Journal of Marketing, 70, 104-119. Thomson, Matthew and Allison R. Johnson (2006), “Marketplace and personal space: investigating the differential effects of attachment style across relationship contexts,” Psychology & Marketing, 23 (8), 711-726. Thomson, Matthew, Deborah J. MacInnis, and C. Whan Park (2005), “The ties that bind: measuring the strength of consumers' emotional attachments to brands,” Journal of Consumer Psychology, 15 (1), 77-91. Thomson, Matthew, Jodie Whelan, and Allison R. Johnson (2012), “Why brands should fear fearful consumers: How attachment style predicts retaliation,” Journal of Consumer Psychology, 22 (2), 289-298.

101
Trainor, Kevin J.(2012), “Relating social media technologies to performance: a capabilities-based perspective,” Journal of Personal Selling and Sales Management, (3), 317-331. Vance, Ashlee (2012), “Facebook: The Making of 1 Billion Users.” Bloomberg Businessweek, October 10 (available at: http://www.businessweek.com/articles/2012-10-04/facebook-the-making-of-1-billion-users) (accessed 15 October 2012). Van Lange, Paul AM, Ellen De Bruin, Wilma Otten, and Jeffrey A. Joireman (1997), “Development of prosocial, individualistic, and competitive orientations: Theory and preliminary evidence,” Journal of Personality and Social Psychology, 73 (4), 733-746. Valkenburg, Patti M., Jochen Peter, and Alexander P. Schouten (2006), “Friend networking sites and their relationship to adolescents' well-being and social self-esteem,” CyberPsychology & Behavior, 9(5), 584-590. VanMeter, Rebecca and Douglas Grisaffe (2013), “Of “Likes” and Pins: Measuring the Strength of Consumers’ Emotional Attachment to Social Media,” Society of Marketing Advances, Oct.29-Nov.2, in Hilton Head, SC. Wallendorf, Melanie and Eric J. Arnould (1988), "" My Favorite Things": A Cross-Cultural Inquiry into Object Attachment, Possessiveness, and Social Linkage," Journal of Consumer Research, 14 (4), 531-547. Wang, Xia, Chunling Yu, and Yujie Wei (2012), "Social Media Peer Communication and Impacts on Purchase Intentions: A Consumer Socialization Framework," Journal of Interactive Marketing, 26 (4), 198-208. Wei, Meifen, Daniel W. Russell, Brent Mallinckrodt, and David L. Vogel (2007), “The Experiences in Close Relationship Scale (ECR)-short form: Reliability, validity, and factor structure,” Journal of Personality Assessment, 88 (2), 187-204. Weiss, Robert S.(1982), “Attachment in adult life,” In C.M. Parkes & J.S. Hinde (Eds.), The place of attachment in human behavior (pp.171- 184). New York: Basic Books Weiss, Robert S.(1988), "Loss and recovery," Journal of Social Issues, 44 (3), 37-52. Wilcox, Keith, and Andrew T. Stephen (2013), “Are close friends the enemy? Online social networks, self-esteem, and self-control,” Journal of Consumer Research, 40 (1), 12-57. Wood, Joanne V.(1989), "Theory and research concerning social comparisons of personal attributes," Psychological Bulletin, 106 (2), 231-248. Yaremko, Robert M.(1986), ed. Handbook of research and quantitative methods in psychology: For students and professionals. Psychology Press. Zaichkowsky, Judith Lynne (1985), “Measuring the involvement construct,” Journal of Consumer Research, 12 (3), 341-352.

102
Zywica, Jolene and James Danowski (2008), “The Faces of Facebookers: Investigating Social Enhancement and Social Compensation Hypotheses; Predicting Facebook™ and
Offline Popularity from Sociability and Self‐Esteem, and Mapping the Meanings of Popularity with Semantic Networks,” Journal of Computer‐Mediated Communication, 14 (1), 1-34.

103
Biographical Information
Rebecca VanMeter is a summa cum laude graduate of the University of Pikeville
where she played collegiate volleyball. While at Pikeville Rebecca was Scholar Athlete of
the week several times as well as a First and Second Team All-American. University of
Kentucky is where she completed her Executive Masters of Business Administration as
an honors student and served as a Graduate Student Congress Representative.
Rebecca is completing her doctorate at the University of Texas at Arlington. She is
currently working on several research projects with UTA faculty. Her current research
interests include social media, employee and consumer attachment, virtual gifts, servant
leadership, and research methods. She has published in the Journal of Business Ethics
and presented papers at national conferences.
Prior to the pursuit of her doctorate, Rebecca worked at Target as an Executive
Team Leader of Human Resources Management, at State Farm as a licensed sales
representative, as a Tier Four Support Specialist with the American Board of Family
Medicine, and was a part-time instructor at Bluegrass Community and Technical College.
She was also a volleyball coach at two high schools and for various select teams while
living in Kentucky.