emma pihlakivi potential of solar energy in finland
TRANSCRIPT

Bachelor’s Thesis
Industrial Engineering and Management
2015
Emma Pihlakivi
POTENTIAL OF SOLAR ENERGY IN FINLAND
– Research for Solar Leap

BACHELOR'S THESIS | ABSTRACT
TURKU UNIVERSITY OF APPLIED SCIENCES
Industrial Engineering and Management
2015 | 57
Tero Reunanen
Emma Pihlakivi
POTENTIAL OF SOLAR ENERGY IN FINLAND
The purpose of this thesis work was to research the bottlenecks in solar energy, to calculate energy payback time and to increase solar energy in Finland. This thesis was made as part of the Solarleap project, where Turku University of Applied Sciences and Satakunta University of Applied Sciences are partners together. This thesis is the first step on this project, and there will be more researches when the project goes forward.
The theory part consists of solar energy and its effectiveness in Finland. The most common photovoltaic and thermal photovoltaic technologies are also presented. In the theory part, renewable energy sources and possibilities in Finland and also photovoltaics supply chain is discussed. The research part includes a discussion on the bottlenecks in solar energy, the investment costs of photovoltaic systems and the payback time of energy.
Solar energy has lots of potential in Finland, but solar energy’s market share is small and the knowhow could be better. Also the energy payback time is bigger than in Europe.
KEYWORDS:
Solar energy, photovoltaic, thermal solar energy, supply chain

OPINNÄYTETYÖ (AMK) | TIIVISTELMÄ
TURUN AMMATTIKORKEAKOULU
Tuotantotalous
2015 | 57
Tero Reunanen
Emma Pihlakivi
AURINKOENERGIAN KANNATTAVUUS SUOMESSA
Tämän insinöörityön tavoiteasetteluna oli tutkia aurinkoenergian pullonkauloja, käyttöönoton mahdollisuuksia sekä takaisinmaksuaikaa Suomessa Tutkimus tehtiin osana Solarleap hanketta, jossa ovat mukana Turun Ammattikorkeakoulu ja Satakunnan Ammattikorkeakoulu. Tämä tutkimus on hankkeen ensimmäinen vaihe ja hankkeen edetessä tullaan tutkimustyötä jatkamaan.
Työn teoriaosuudessa paneudutaan aurinkoenergiaan yleisesti ja Suomen säteilymääriin sekä esitellään yleisimmät aurinkopaneelivaihtoehdot. Tässä osuudessa käsitellään myös uusiutuvan energian kehitysmahdollisuuksia Suomessa sekä aurinkokennon toimitusketjun osia. Tutkimusosiossa perehdytään tarkemmin havaittuihin pullonkauloihin, laitteistojen hintoihin sekä energian takaisinmaksuaikaan, josta on esitetty myös käytännön esimerkki.
Aurinkoenergian tulevaisuuden näkymät Suomessa ovat hyvät, mutta tarvittavaa osaamista ei löydy vielä riittävästi. Myös energian takaisinmaksuaika on huomattavasti pidempi kuin muualla Euroopan maissa.
ASIASANAT:
Aurinkoenergia, aurinkokennot, aurinkokeräimet toimitusketjut

CONTENT
LIST OF ABBREVIATIONS (OR) SYMBOLS 7
1 INTRODUCTION 9
2 RENEWABLE ENERGY 11
2.1 Solar Energy 11
2.1.1 Solar radiation and effectiveness 12
2.2 Renewable and solar energy in Finland 13
2.3 European Union energy policy 17
3 PHOTOVOLTAICS 18
3.1 Silicon crystalline 18
3.2 Thin-film technology 18
3.3 Nanotechnology 19
3.4 How does the photovoltaic work 20
4 SOLAR WATER HEATING 23
4.1 Flat-plate collector 23
4.2 Evacuated tube collectors 24
4.2.1 Water-in-glass evacuated tube collector 24
4.2.2 U-type evacuated tube collector 25
4.2.3 Heat pipe evacuated tube collector 25
4.3 Hybrid solar thermal 26
5 SUPPLY CHAIN MANAGEMENT 27
5.1 Supply chain 27
5.2 Lean Manufacturing 30
5.3 Bottlenecks in supply chain management 32
6 RESEARCH 35
6.1 Bottlenecks for solar energy and photovoltaics 35
6.1.1 Feed-in tariff 39
6.2 Costs 40
6.3 Energy payback time 42
6.4 Future for renewable energy and solar energy 49

7 SUMMARY 51
REFERENCES 54
APPENDICES
Appendix 1. Appendix 2.
PICTURES
Picture 1 Yearly sum of global irradiation on horizontal and optimally inclined surface in Finland (Joint Research Centre, 2012) 15 Picture 2 Zones I-II, III and IV. (Ilmatieteenlaitos, 2015) 16 Picture 3 Behavior of light on a solar cell. (Chaar, Iamont, Zein, 2011, 2167) 21 Picture 4 Photovoltaic module (NASA, 2012) 21 Picture 5 Flat-plate solar collector (Thegreenhome, 2013) 23 Picture 6 Water-in-glass evacuated tube collector (TS solar, 2015) 24 Picture 7 U-type evacuated tube collector. (Hi-min, 2015) 25 Picture 8 Heat pipe evacuated tube collector (TS solar, 2015) 26 Picture 9 Bottleneck in supply chain (Transtutors, 2015) 33 Picture 10 Electricity price in Finland. (Fortum, 2015) 41
TABLES
Table 1 Radiation amounts, which are measured monthly from PV’s that are 45° angle. (Ilmatieteenlaitos, 2015) 16 Table 2 Radiation amounts in different cities. (Ilmatieteenlaitos, 2015) 17 Table 3 Photovoltaic supply chain (E4tech & Avalon Consulting, 2012) 28 Table 4 Photovoltaic supply chain (E4tech & Avalon Consulting, 2012) 29 Table 5 Seven key areas of waste (Leanproduction, 2013) 32 Table 6 Criticality assessment of bottlenecks in photovoltaic (E4 tech & Avalon Consulting, 2012, 15) 36 Table 7 Generation of household consumer's electricity price in 2014. (Energy Agency, 2014) 40

Table 8 Photovoltaic system prices (Fortum, 2015) 42 Table 9 Total prices for 9 panels PV system. (Fortum, 2015) 46 Table 10 Total prices for 12 panels PV system. (Fortum, 2015) 47 Table 11 Payback time for the investment if the electricity price would increase 10 %. 48 Table 12 Biigest bottlenecks in solar energy 52

LIST OF ABBREVIATIONS (OR) SYMBOLS
PV Photovoltaic
RES Renewable Energy Sources
RE Renewable Energy
IEA International Energy Agency
NREAP National Renewable Energy Action Plan
SCM Supply Chain Management
PVT Photovoltaic Thermal
TW Terawatts
KWh Kilowatts per Hour
kWp Kilowatt-Peak
IEA-RETD International Energy Agency’s Agreement on Renewa-
ble Energy Technology Deployment
DG Distributed Generation
FIT Feed-In Tariff
c-Si Silicon Crystalline
μm Micrometer
kW Kilowatt
mfg Manufacturing
CHP Combined Heat & Power
W Watt
EU European Union
CdTe Cadmium Telluride
CIS Copper Indium Selenide
CIGS Copper Indium Gallium Selenide
a-Si Amorphous Silicon
kVa Kilovolt-amps
m² square meter
AC/DC Alternating Current/Direct Current
VAT Value-Added Tax

9
TURKU UNIVERSITY OF APPLIED SCIENCES THESIS | Emma Pihlakivi
1 INTRODUCTION
Finland is one of the world’s leading users of renewable sources of energy. Re-
newable energy sources provide one fourth of Finland’s total energy consump-
tion, most important sources of energy includes bioenergy, wood-based fuels,
hydropower, wind power, ground heat and solar energy. The objective of the na-
tional energy and climate strategy is to increase the use of renewable sources of
energy. In addition to energy conversation, this is one of the most significant
means by which Finland’s climate targets can be achieved. Renewable energy
sources do not increase dioxide emissions in use, while promoting employment
and regional policy goals and enhancing security of supply.
This thesis is made for Solarleap project, which is a two-year research for finding
bottlenecks in solar energy and how to lower delivery processes and total ex-
penses. With right developing methods, the potential business for solar energy in
Finland is going to increase. The main goal is to improve the competence of com-
panies and improving education for solar energy technologies. Solarleap is a pro-
ject of Turku University of Applied Sciences and Satakunta University of Applied
Sciences. The time period for this project is from 1st January 2015 to 31st Decem-
ber 2016. This thesis concentrates finding bottlenecks in solar energy and calcu-
lating investment and energy payback time costs.
Chapter two consist of the theory part, where solar energy, solar radiation and its
effectiveness in Finland and renewable energy sources and solar energy’s pos-
sibilities in Finland are investigated.
Chapter three consists the theory of different kinds of photovoltaic technologies,
and the next chapter is about solar thermal energy. The research part includes
only examples of photovoltaic technology. Thermal energy is also mentioned in
the thesis, because it is one of the sources of solar energy.
Chapter five starts with the supply chain management theory, and in that chapter
also photovoltaics supply chain has been explained. In the same chapter has also

10
TURKU UNIVERSITY OF APPLIED SCIENCES THESIS | Emma Pihlakivi
explained Lean method and the seven key areas of waste. This method can be
used for removing obstacles from photovoltaics supply chain.
The research is presented in chapter 6. The research part discusses the bottle-
necks in solar energy and photovoltaics supply chain, investments costs and en-
ergy’s payback time. This work is the first step in the Solarleap research and more
researches are to be made when the project goes forward.
The research starts by finding bottlenecks in solar energy and Photovoltaic sup-
ply chain. In Finland the photovoltaic markets are quite small, so for this part was
used E4tech & Avalon Consulting final report, which was made to International
Energy Agency’s Agreement on Renewable Energy Technology Deployment in
2012.
In the second and third part of this research, investment costs and energy pay-
back time were studied. There are two example calculations in both chapters and
one energy supplier is used to make these calculations.
Last part consist renewable energy’s future and how is it going to change.
11
TURKU UNIVERSITY OF APPLIED SCIENCES THESIS | Emma Pihlakivi
2 RENEWABLE ENERGY
Renewable energy sources can be defined as “energy obtained from the contin-
uous or repetitive currents of energy recurring in the natural environment” or as
“energy flows which are replenished at the same rate as they are used”. (Chaar,
Iamount, Zein, 2011, 2166) The global use of fossil fuels has caused grave envi-
ronmental crises including energy depletion and pollution and is projected to in-
crease by more than one-third by 2035. To combat this, there has been growing
interest in new renewable energy (NRE). According to the ‘Medium-Term Renew-
able Energy market report 2012’, global renewable energy generation will in-
crease by 40% over the period from 2011 to 2017. Regarding the global energy
and environmental issue, solar energy is recognized as playing an important role
in renewable and sustainable development. Especially, given the continuous
downward trend in the cost of photovoltaic (PV) systems, it is expected that the
PV market would be expanded to achieve the net-zero energy buildings and the
carbon emissions reduction target. (Hong, Koo, Park, 2013, 190-191)
2.1 Solar Energy
Solar energy is the cleanest and most abundant renewable energy source avail-
able (Solar Energy Industries Association, 2015). It has the potential to contribute
a major proportion of the renewable energy sources (RES) in the future. Solar
energy has many advantages: it cannot be monopolized by handful of countries;
it has neither excessive maintenance and management costs nor the conversion
mechanisms producing troublesome emissions, and it can easily be integrated
into both public and private buildings without external environmental impacts. Ac-
cording to the International Energy Agency (IEA), solar energy could be the larg-
est source of electricity by 2050. (Haukkala 2015, 50)

12
TURKU UNIVERSITY OF APPLIED SCIENCES THESIS | Emma Pihlakivi
There are three primary technologies by which solar energy is commonly har-
nessed: photovoltaics (PV), which directly convert light to electricity; concentrat-
ing solar power (CSP), which uses heat from the sun (thermal energy) to drive
utility-scale, electric turbines; and heating and cooling systems, which collect
thermal energy to provide hot water and air conditioning. Solar energy can be
deployed through distributed generation (DG), whereby the equipment is located
on rooftops or ground-mounted arrays close to where the energy is used. Some
solar technologies can also be built at utility-scale to produce energy as a central
power plant. Modern technology can harness solar energy for a variety of uses,
including generating electricity, providing light or a comfortable interior environ-
ment, and heating water for domestic, commercial, or industrial use. (Solar En-
ergy Industries Association, 2015)
2.1.1 Solar radiation and effectiveness
All the earth’s renewable energy sources are generated from solar radiations,
which can be converted directly or indirectly to energy using various technologies
such as photovoltaic. The radiation that comes from sunlight is perceived as white
light since it spans a wide spectrum of wavelengths, from the short-wave infrared
to ultraviolet. This radiation is a major player in generating electricity, either pro-
ducing high temperature heat to power an engine mechanical energy which in
turn drives an electrical generator or by directly converting it to electricity by
means of the photovoltaic (PV) effect. (Chaar, Iamont, Zein, 2011, 2166)
The amount of energy that comes from solar radiation is enormously large. The
Earth receives about 170 000 terawatts (TW) of incoming radiation at the upper
atmosphere, but the amount of energy that can be used is very small. Restrictions
for solar energy are costs, number of places where the heat generating technol-
ogies are used and radiation amounts by the time of the year. (Energiateollisuus,
2015)

13
TURKU UNIVERSITY OF APPLIED SCIENCES THESIS | Emma Pihlakivi
Because the Earth is round, the sun strikes the surface at different angles, rang-
ing from 0° (just above the horizon) to 90° (directly overhead). When the sun’s
rays are vertical, the Earth’s surface gets all the energy possible. The more
slanted the suns’ ray are, the longer they travel through the atmosphere, becom-
ing more scattered and diffuse. The Earth revolves around the sun in an elliptical
orbit and is closer to the sun during part of the year. When the sun is nearer the
Earth, the Earth’s surface receives a little more solar energy. (Energiateollisuus,
2015)
As sunlight passes through the atmosphere, some of it absorbed, scattered, and
reflected by example from air molecules, water vapor, clouds, dust and pollutants.
This is called diffuse solar radiation. The solar radiation that reaches the Earth’s
surface without being diffused is called direct beam solar radiation. The sum of
the diffuse and direct solar radiation is called global solar radiation. Atmospheric
conditions can reduce direct beam radiation by 10 % on clear, dry days and by
100% during thick, cloudy days. (EnergyGov, 2015)
Solar radiation incident on the atmosphere from the direction of the sun is the
solar extraterrestrial beam radiation. Beneath the atmosphere, at the Earth’s sur-
face, the radiation will be observable from the direction of the sun’s disc in the
direct beam, and also from the directions as diffuse radiation. Even on cloudless,
clear day, there is always at least 10 % diffuse radiation irradiance from the mol-
ecules in the atmosphere. (Twidell & Weir, 2006, 87)
2.2 Renewable and solar energy in Finland
Finland is one of the few countries in the EU that has taken hardly any direct
subsidies into use for solar energy. At the same time, the transition to renewables
is crucial in mitigating climate change. Finland’s irradiation is almost the same as
that of Germany, a country that is one of the top markets for photovoltaics in the
world, also due to its successful support policy. The use of solar energy in Finland
has been relatively limited compared to other RES. “In the 1970s and 1980s was
an initial boom in solar energy, but the experiments were too radical at the time
14
TURKU UNIVERSITY OF APPLIED SCIENCES THESIS | Emma Pihlakivi
and it “did not take off” thinks Teresa Haukkala in her article. According to the
National Renewable Energy Action Plan (NREAP), the use of RES is to be in-
creased in Finland by 9.5 % from the 2005 to 2020, when it should be 38 % from
the energy consumption. This applies also to solar energy. At this moment, the
share of solar energy is about 0.01 percent. (Haukkala, 2014, 50-51)
The renewable energy sector in Finland has many key elements for successful
export, such as advanced innovation systems, strong traditional competences in
the bioenergy sector, and versatile research and development activities and re-
lated policies. The strengths of Finland in the wind and solar energy sector lies in
more narrow segments. Highly qualified component manufacturing and technol-
ogy knowhow built on R&D intensive ICT sector forms strong technological com-
petences also for wind power and other RE, as well as for development of future
smart grids and smart energy systems. Finland has also implemented several
policy measures to promote energy efficiency and RE, such as obligation scheme
for RE 2010, investment grants, and technology programmers related to RE by
the Finnish Funding Agency for Technology and Innovation (Tekes, 2015).
The amount of solar energy is about the same in Finland as in Central Europe,
but most of the radiation (1170 kWh/m² per year) is generated in the southern
part of Finland during May to August. (VTT, 43, 2015)
In Finland, there is more diffuse radiation than direct radiation. Diffuse radiation
is more effecting, because in southern Finland half of the radiation is diffuse ra-
diation. Diffuse radiation means that the sunlight has been scattered by mole-
cules and particles at the atmosphere, but has still made it down to the surface
of the earth. Solar irradiation is lower in northern Europe than in central or south-
ern Europe. The average daily irradiation in Finland is about 900 kWh/m². Finnish
Meteorological Institute announced in June, 2014 radiation amounts in horizon-
tally and optimally inclined surfaces in Finland, and the results are shown in pic-
ture 1 and table 2. The results were in Helsinki around 980 kWh/m² and in So-
dankylä around 790 kWh/m². (Motiva, 2014)

15
TURKU UNIVERSITY OF APPLIED SCIENCES THESIS | Emma Pihlakivi
Picture 1 represent yearly sum of global irradiation on horizontal and optimally
inclined surface. All data in the photo are given as kWh/m². The same color rep-
resents also potential solar electricity (kWh/kWp) generated by a 1 kWp system
per year with photovoltaic modules mounted at an optimum inclination and as-
suming system performance ratio 0.75. (Motiva, 2014)
Table 1 shows measurement from Helsinki which covers also zone I and II
(shown in picture 2 below). In the table the collected data are from PV’s that are
in 45° angle and facing south. Data has been collected monthly, and the table
shows that greatest amount of radiation is in summer time. (Ilmatieteenlaitos,
2015)
Picture 1 Yearly sum of global irradiation on horizontal and optimally inclined surface in Finland (Joint Research Centre, 2012)

16
TURKU UNIVERSITY OF APPLIED SCIENCES THESIS | Emma Pihlakivi
0
50
100
150
200
1 2 3 4 5 6 7 8 9 10 11 12
kW
h/m
2
Picture 2 Zones I-II, III and IV. (Ilmatieteenlaitos, 2015)
Table 1 Radiation amounts, which are measured monthly from PV’s that are 45° angle. (Ilmatieteenlaitos, 2015)

17
TURKU UNIVERSITY OF APPLIED SCIENCES THESIS | Emma Pihlakivi
Table 2 shows radiation in all three regions in Finland. Used by same measure-
ment as in table 1. The table shows that radiation in south is more powerful than
in northern Finland. (Ilmatieteenlaitos, 2015)
2.3 European Union energy policy
The EU’s energy policy is going to have huge challenges and changes in the
future. The operational environment of energy policy is facing challenges be-
cause of the climate change. The founders of the European Community realized
the meaning of energy to the society, that it can secure the of energy’s supply
and also act as an engine for political integration. The EU’s energy policy has
three main aims: sustainable development, maintaining competiveness and en-
suring security of energy supply. (Finnish Energy Industries, 2015)
Helsinki Jyväskylä Sodankylä
Sarja1 1211 1127,5 1032,3
900
950
1000
1050
1100
1150
1200
1250
kW
h/m
2
Table 2 Radiation amounts in different cities. (Ilmatieteenlaitos, 2015)

18
TURKU UNIVERSITY OF APPLIED SCIENCES THESIS | Emma Pihlakivi
3 PHOTOVOLTAICS
Photovoltaic (PV) devices provide an effective way to generate electricity from
the sunlight. It is accepted that PV is the simplest technology to design and install,
but it is still one of the most expensive renewable technologies. However its ad-
vantage will lie in the fact that it is environmentally friendly non-pollutant low
maintenance energy source. The competiveness of PV’s are increasing: accord-
ing to Pew Charitable Trusts, in 2013, for the first time in more than a decade,
solar outpaced all other clean energy technologies in terms of new generating
capacity installed with an increase of 29 % compared with 2012. (Haukkala 2015,
50)
3.1 Silicon crystalline
Crystalline silicon cells (c-Si) are the most common type PV; it can be of many
semiconductor materials. Each material has unique strengths and characteristic
that influence its suitability for specific applications. Silicon crystalline PV cells
are made of silicon atoms that are connected to one another to form a structure
called a crystal lattice. It comprises the solid material that form the PV cells sem-
iconductor. This comprises the solid material that focus the PV cells semiconduc-
tors. In crystalline solar cells, pieces of semiconductors are sandwiched between
glass panels to create modules. Crystalline silicon cells thickness is between 150-
300 μm, and it has dominated the PV markets for very long time. (Chaar, Iamont,
Zein, 2011, 2168)
3.2 Thin-film technology
Thin film technology holds the promise of reducing the PV arrays costs by lower-
ing material and manufacturing without jeopardizing the cells lifetime. Unlike crys-
talline cells, putting thin layers of certain materials on glass or stainless steel sub-

19
TURKU UNIVERSITY OF APPLIED SCIENCES THESIS | Emma Pihlakivi
strates makes thin film panels. The advantage is that the thickness of the depos-
ited layers are barely a few micron thick (5-20 μm), example compared to the
crystalline wafers, which tend to be several hundred micron thick. Depositing lay-
ers to stainless steel sheets, it allows the creation of flexible PV modules. Tech-
nically when the layers are thinner, PV’s material to absorb incoming solar radia-
tion, hence the efficiencies are lower than crystalline modules, and the ability to
deposit many different materials and alloys has allowed improvements in efficien-
cies. There are four kinds of thin film cells; the amorphous silicon (a-Si) cell (mul-
tiple-junction structure), thin poly-crystalline silicon on a low cost substrate, the
copper indium selenide (CIS), copper indium gallium selenide (CIGS) and the
cadmium telluride (CdTe) cell. (Chaar, Iamont, Zein, 2011, 2168-2169).
3.3 Nanotechnology
“Making solar cells ultra-thin reduces their material costs, but often at the expense
of their efficiency. Researches have summarized the most effective ways that
nanostructures can improve the efficiency and lower costs of PV solar cells in a
recent analysis. Sculpting ultra-thin solar cell surfaces at the Nano-scale has
been found to effectively boost their efficiency”. (European Commission, 2015)
According to European Commission nanostructures can increase the amount of
light entering the PV module by reducing reflections from its surface. A polished
silicon wafer reflects more than 30 % of the light that it receives. Densely packed
nanostructures can be used to create thin anti-reflective coatings, which work
across a wide range of wavelengths and angles of light. (European Commission,
2015)
European Commission also studied in their research that how nanostructures can
be used trapping the light depending on the location of the new ultra-thin film PV’s
that uses silicon films that are between nanometers and tens of micrometers
thick. (European Commission, 2015)

20
TURKU UNIVERSITY OF APPLIED SCIENCES THESIS | Emma Pihlakivi
3.4 How does the photovoltaic work
Photovoltaic (PV) is the direct conversion of the light into electricity at the atomic
level. Photovoltaic devices generate electricity via an electronic process that oc-
curs naturally in certain types of material, called semiconductors. Electronics in
these materials are freed by solar energy and can be induced to travel through
an electrical circuit, powering electrical devices or sending electricity to the grid.
(New Renewable Energy Systems Group, 2015)
Photovoltaic consist of small solar cells, which are combined together. Solar ra-
diation consist photons. Photons strike and ionize semiconductor material on the
solar panel. The energy of the photon transfers itself to the positive and negative
charge carriers, which can move freely at the cell. Photovoltaic consist of two-
semiconductor materials that are almost the same (p- and n-material), only dif-
ference is that the stored charge distribution of the atoms. These small differ-
ences develop electric field inside the solar cell, which takes the positive and
negative charge carriers opposite directions inside the solar cell. Charge carriers
are transported to the external circle, where they can be used, for example light-
ning an electric light bulb. (New Renewable Energy Systems Group, 2015)
Different PV materials have different energy band gaps. Photons with energy
equal to the band gap energy are absorbed to create free electrons. Photons with
less energy than the band gap energy pass through the material. (Energy.Gov,
2015)
Photo 3 is a typical crystalline silicon solar cell. To make this type of cell, wafers
of high-purity silicone are “doped” with various impurities and fused together. The
resulting structure creates a pathway for electrical current within between the so-
lar cells. (Solar Energy Industries Association, 2015)
21
TURKU UNIVERSITY OF APPLIED SCIENCES THESIS | Emma Pihlakivi
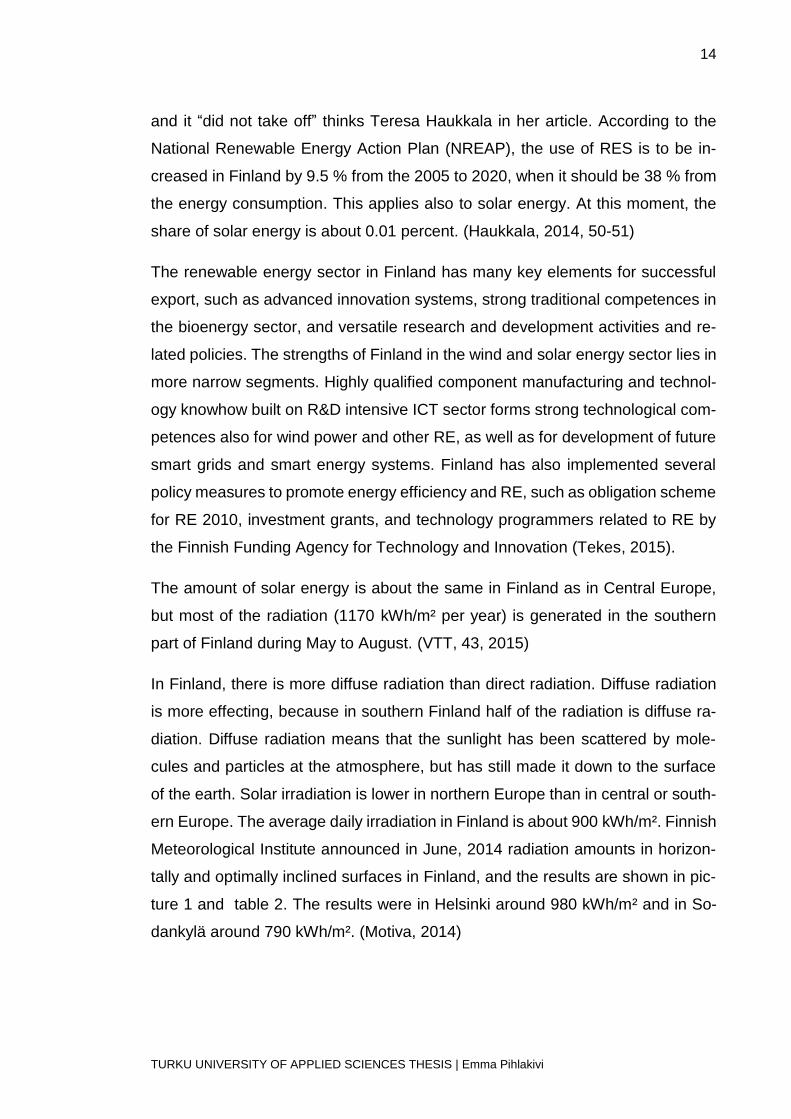
A number of solar cells electrically connected to each other and mounted in a
support or frame are called a photovoltaic module (photo 3). Modules are de-
signed to supply electricity at a certain voltage, such as a common 12 volts sys-
tem. Multiple modules can be wired together to form an array. In general, the
larger the area of a module or array, the more electricity can be produced. Pho-
tovoltaic modules produce direct-current electricity. (NASA, 2002)
Picture 3 Behavior of light on a solar cell. (Chaar, Iamont, Zein, 2011, 2167)
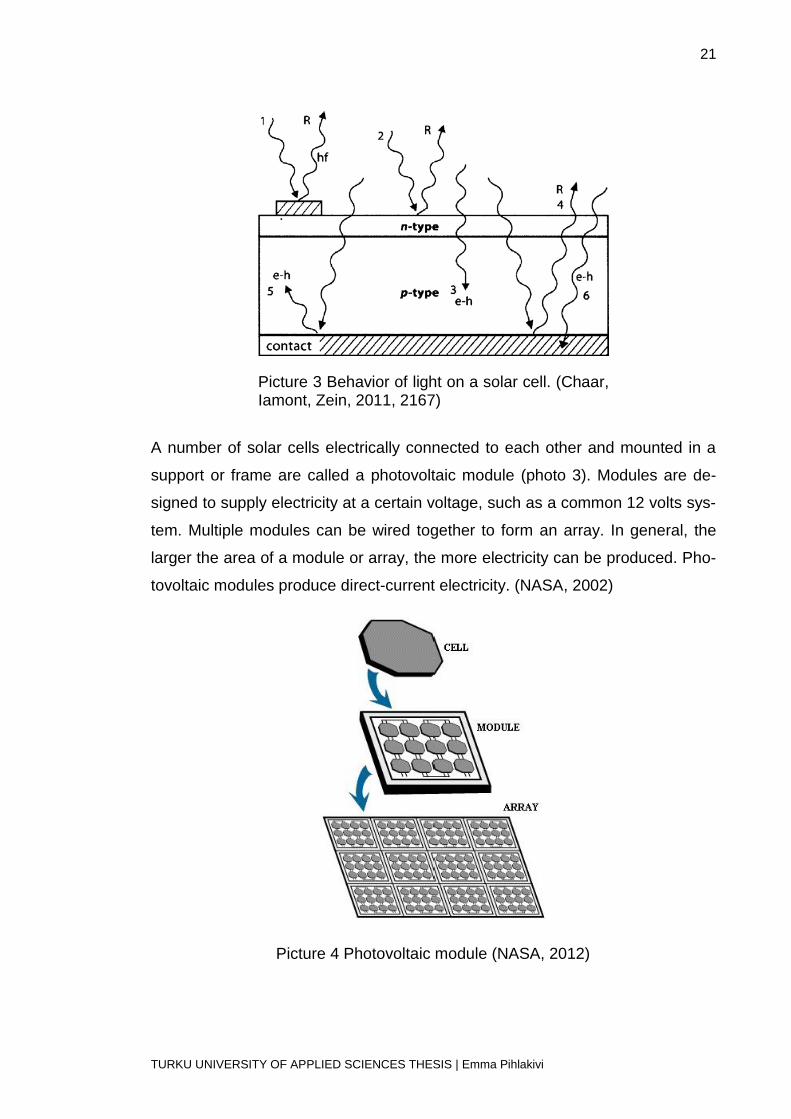
Picture 4 Photovoltaic module (NASA, 2012)

22
TURKU UNIVERSITY OF APPLIED SCIENCES THESIS | Emma Pihlakivi
Picture 4 shows typical photovoltaic module and photovoltaic array, which consist
many photovoltaic modules attached to each other. (NASA, 2002)
In Finland most of the radiation comes from diffuse radiation, which means that
locating and finding the right position for PV’s affects the amount how much en-
ergy the system can collect. Example snow, water and shiny rooftops can in-
crease the radiation for a moment nearly 20 percent. Yearly amount stays still
normally at 2 percent. The efficiency of traditional PV panels increases in lower
temperature, so the real production difference between Nordic and central Euro-
pean countries can be even lower. (Motiva, 2014)
23
TURKU UNIVERSITY OF APPLIED SCIENCES THESIS | Emma Pihlakivi
4 SOLAR WATER HEATING
Solar thermal energy technology is to produce heat from solar energy. Solar ther-
mal energy is collected by the solar collectors, which absorb the sun’s ray and
convert them to heat. The major applications for solar thermal energy are for
heating swimming pools, water for domestic use and buildings. The difference to
solar photovoltaic is that the system generates heat rather than electricity. (Sun
water solar, 2015)
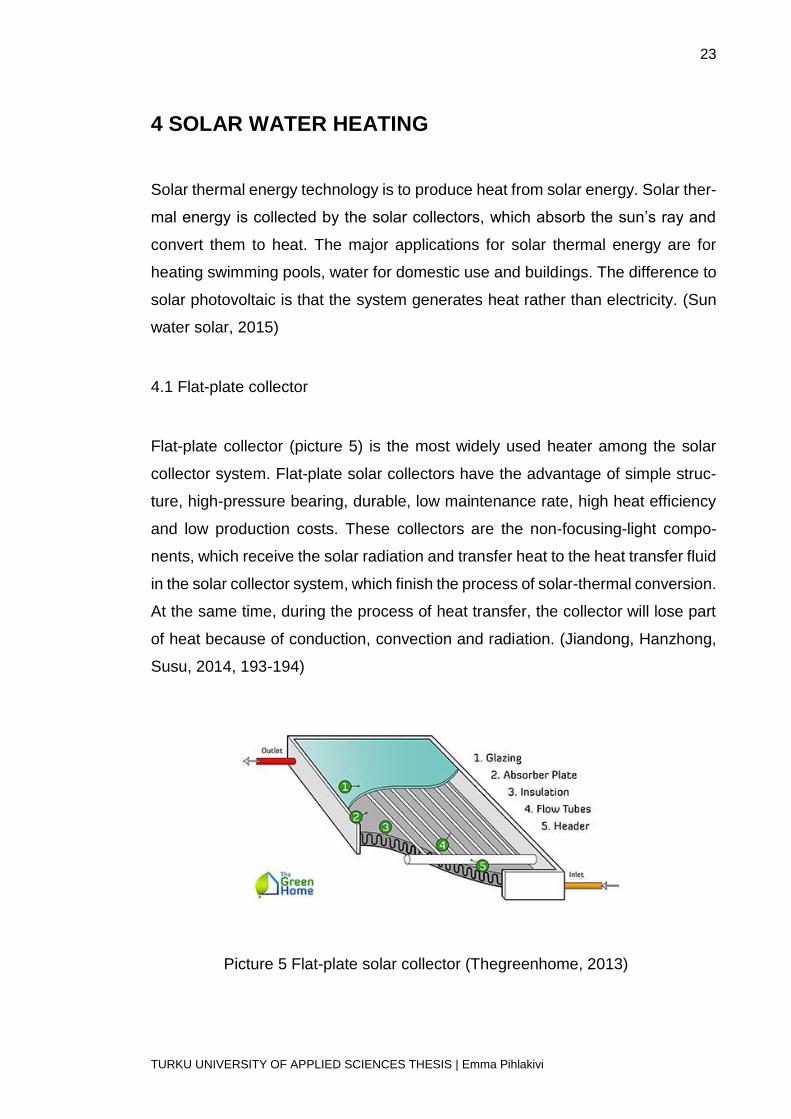
4.1 Flat-plate collector
Flat-plate collector (picture 5) is the most widely used heater among the solar
collector system. Flat-plate solar collectors have the advantage of simple struc-
ture, high-pressure bearing, durable, low maintenance rate, high heat efficiency
and low production costs. These collectors are the non-focusing-light compo-
nents, which receive the solar radiation and transfer heat to the heat transfer fluid
in the solar collector system, which finish the process of solar-thermal conversion.
At the same time, during the process of heat transfer, the collector will lose part
of heat because of conduction, convection and radiation. (Jiandong, Hanzhong,
Susu, 2014, 193-194)
Picture 5 Flat-plate solar collector (Thegreenhome, 2013)

24
TURKU UNIVERSITY OF APPLIED SCIENCES THESIS | Emma Pihlakivi
4.2 Evacuated tube collectors
There are three types of evacuated tube collectors: water-in-glass evacuated
tube solar collector, U-type evacuated tube solar collector and heat pipe evacu-
ated tube solar collector. (Mishra & Saikhedkar, 2014, 33)
4.2.1 Water-in-glass evacuated tube collector
Water-in-glass collector (picture 6) contains two concentric glass tubes con-
nected to a manifold. The tubes have an empty space between them where air is
evacuated at a pressure below the atmospheric value. The inner tubes are filled
with water and the outside wall of each inner tube is treated with an absorbent
selective coating. The coated wall tube is exposed to the solar radiation in order
to receive the necessary heat flux to increase the water temperature of the inner
tubes and subsequently the temperature at the outlet of the solar collector.
(Mishra & Saikhedkar, 2014, 33-34)
Picture 6 Water-in-glass evacuated tube collector (TS solar, 2015)

25
TURKU UNIVERSITY OF APPLIED SCIENCES THESIS | Emma Pihlakivi
4.2.2 U-type evacuated tube collector
The construction of evacuated U-type tube collector (picture 7) is almost the same
than water-in-glass collector, expect a circular fin to store heat and conduct col-
lected heat and a U-type tube of copper elements. Solar water heater is based
on a natural circulation of water within the system. (Mishra, Saikhedkar, 2014,
34)
4.2.3 Heat pipe evacuated tube collector
A heat pipe tube collector (picture 8) consists of a heat pipe inside the evacuated
tube. The vacuum envelope retards convection losses greatly and conduction
losses which helps it to operate a higher temperature. Heat pipe consist of a hol-
low copper pipe and it is of liquid water is added into the hear pipe and it is heated
from the absorbed to the water. (Mishra, Saikhedkar, 2014, 34)
Picture 7 U-type evacuated tube collector. (Hi-min, 2015)

26
TURKU UNIVERSITY OF APPLIED SCIENCES THESIS | Emma Pihlakivi
4.3 Hybrid solar thermal
Solar photovoltaic and thermal applications appear to be one of the potential so-
lutions for current energy needs and greenhouse gas emissions. The technology
of Photovoltaic thermal (PVT) allows productions of electrical and thermal energy
at the same time, using the solar radiation. The operating principle is that the
generation of electricity while transferring the thermal energy absorbed by the
photovoltaic cells to a fluid, enabling its subsequent use. The hybrid PVT water
system allows removal of a part of the thermal fraction of solar radiation collected
by PV cells which is not converted into electricity bur used for example hot water.
The thermal fracture is transferred from PV cells to the fluid through a channeled
plate, which is connected to the cells. The total conversion efficiency of solar en-
ergy into electricity and heat is the main parameter that characterizes the perfor-
mance of a hybrid PVT collector. (Liang, Zhang, Ma, Li, 2014, 487-490)
Picture 8 Heat pipe evacuated tube collector (TS solar, 2015)

27
TURKU UNIVERSITY OF APPLIED SCIENCES THESIS | Emma Pihlakivi
5 SUPPLY CHAIN MANAGEMENT
A Supply chain consists of the series of activities and organizations that materials
move through on their journey from initial suppliers to final customers. (Waters
2009, 9) A supply chain consists of all parties involved, directly or indirectly, for
accomplishing a customer request. It consists manufacturers and suppliers,
transporters, warehouses, retailers, and customers. Within each organization,
such as manufacturer, the supply chain includes all functions involved in receiv-
ing and filling customer request. These functions include, but are not limited to,
new product development, marketing, operations, distribution, finance, and cus-
tomer service. (Sunil Chopra & Peter Meindi 2010, 20)
5.1 Supply chain
Every product has its own unique supply chain, and how long and complicated
the chain is, depends on the specific product. The supply chain describes the
total journey of materials as they move. Logistics are responsible for the flow of
materials through supply chain. The overall aim of the logistics is to achieve high
customer satisfaction. It must provide a high quality service with low – or accepta-
ble – costs. The supply chain describes the total journey of materials as they
move from beginning to the end. Easiest and simplest way to look a supply chain
is a view a single product moving through a series of organizations, which each
somehow adds value for the product. There are two points of view looking one
organization, activities that are before (moving materials inwards from original
suppliers) are called upstream; and those that are after the organization (moving
materials outwards to final customers) are called downstream. (Waters, 2009, 8-
9)

28
TURKU UNIVERSITY OF APPLIED SCIENCES THESIS | Emma Pihlakivi
In table 3 is shown most common supply chain for PV’s.
Table 3 Photovoltaic supply chain (E4tech & Avalon Consulting, 2012)
The steps on entire supply chain of PV, from raw materials to end-of-life are
shown in table 3 and 4. Different PV technologies are manufactured in different
ways, but the chain in table 3 and 4 is still onto the same generic supply chain.
Disposal & Recycling
Opertation & Maintenance
On-site integration installation
Transport & Distribution
Component manufacturing & Integration
Raw material

29
TURKU UNIVERSITY OF APPLIED SCIENCES THESIS | Emma Pihlakivi
Table 4 Photovoltaic supply chain (E4tech & Avalon Consulting, 2012)
Raw material Module level: aluminum, copper, steel, polymers
Wafer: silver, solar grade silicon
CdTe: cadmium, tellurium
CIS/CIGS: copper, indium, gallium, selenium, cadmium sulphide
a-Si: silicon
Component manufacturing & Integration
Upstream products: float glass, sealing materials, back sheet
Cell/module mfg: front contact, texturing, metallization, anti-reflective coating
Balance of system mfg: frame, fittings, tracking system, DC/AC inverter, wiring, surge protection and electirc meter
Transport & Distribution
Modules & balance of system equipment
On-site integration installation
Installation
Grid Installation
Operation & Maintenance
Reactive maintenance
Preventive maintenance
Disposal & Recycling
Reverse logistics and recycling technology

30
TURKU UNIVERSITY OF APPLIED SCIENCES THESIS | Emma Pihlakivi
Raw materials consist different components, depends on the photovoltaic type.
In the table 4 above is listed typical PV panels and the raw materials that are
used for making these PV panels systems.
The difference between reactive maintenance and preventive maintenance are
that, preventive maintenance includes routine inspections and servicing of equip-
ment to prevent breakdowns and production losses. Reactive maintenance in
other hands addresses equipment breakdowns after the occurrences. Reactive
maintenance has low upfront costs, but bears the risk of unplanned downtime
and higher costs in the end. (Scott Madden, 2010)
Reverse logistics and recycling technologies in PV supply chain means after the
sale. In other words it is called aftermarket logistics, and it includes example cus-
tomer service (helpdesk), fulfillment services and warranty management. (Re-
verse Logistics Association, 2015)
5.2 Lean Manufacturing
The word “lean” refers to lean manufacturing or lean production as it uses less of
everything, compared to mass production. It only uses half of the human effort in
the factory, half of the manufacturing space, half of the investment in tools and
half of the engineering hours to develop a new product on half the time. (Wahab,
Mukhtar, Sulamain 2013, 1293)
“In order to improve efficiency, effectiveness, and profitability, focus relentlessly
on eliminating all aspects of manufacturing process that add no value from cus-
tomer perspective”. (Leanproduction, 2013) The aims of a lean strategy are to do
every operation using less of each resource – people, space, stock, equipment,
and time and so on. It organizes the efficient flow of materials to eliminate waste,
give the shortest lead-time, minimum stocks and minimum total cost. (Waters
2003, 66)

31
TURKU UNIVERSITY OF APPLIED SCIENCES THESIS | Emma Pihlakivi
Lean method is to minimize the total costs of logistics, while ensuring acceptable
levels of customer care, and to make it as cheap as possible. Toyota Motor Com-
pany was one the first companies who work on lean operations. The method was
considered good, and it spread into other areas, eventually developing a lean
enterprise. (Waters 2003, 66-67)
“Why not make the work easier and more interesting so that people do not have
to sweat? The Toyota style is not to create results by working hard. It is a system
that says there is no limit to people’s creativity. People do not go to Toyota to
‘work’ they go there to ‘think’.” – Taiichi Ohno (Lean5)
Principles of lean are:
Value – designing a product that has value from a customer’s perspective
Value stream – designing the best process to make the product
Value flow – managing the flow of materials through the supply chain
Pull – only making products when there is customer demand
Aim of perfection – looking for continuous improvements to get closer to
the aim of perfect operations. (Waters, 2003, 66-67)
Basic idea for lean is to eliminate anything and everything that does not add value
from perspective for customer. Another way to look at lean manufacturing is as a
collection of tips, tools and, techniques that have been proven effective for driving
waste out of the manufacturing process. (Leanproduction, 2013)
“All organizations are at least 50 % waste – waste people, waste effort, waste
space and waste time” – Robert Townsend (Waters, 2013, 67)

32
TURKU UNIVERSITY OF APPLIED SCIENCES THESIS | Emma Pihlakivi
Lean identifies seven key areas of waste that adds cost or time without adding
any value:
Table 5 Seven key areas of waste (Leanproduction, 2013)
The Lean method is a good way for the photovoltaics supply chain. When identi-
fying the bottlenecks in solar energy, the seven key methods can be used for
“cleaning the waste areas away”.
5.3 Bottlenecks in supply chain management
Bottleneck is the part of a supply chain that limits throughput because it has the
smallest individual capacity. A supply chain does not have a constant capacity
along its length, but each operation has a different capacity. Bottleneck is formed
Waiting Time when work-in-process is waiting for the next step in production (no value is being added)
Overproduction Making something before it is truly required
Defects Production that is scraped or requires rework
Motion Unnecessary movement of people (movement that does not add value)
Over processing
More processinf than is needed to produce what customer requires
Inventory Product (raw material, work-in-process, or finished goods) quantities that go beyond supporting the immediate need
Transport Unnecessary movement of raw materials, work-in-process of finished goods

33
TURKU UNIVERSITY OF APPLIED SCIENCES THESIS | Emma Pihlakivi
by the resource or facility that limit the overall throughput of the chain. The bot-
tleneck limits the overall capacity of a supply chain, which means that the specific
part is working at full capacity. The more unbalanced a chain is, the more unused
capacity it has away from the bottleneck. Only way to increase the overall capac-
ity is by adding more capacity at the bottleneck. (Waters, 2009, 235-237)
Identifying the most important limiting factor that stands in the way of achieving a
goal and then systematically improving that constraint until it is no longer the lim-
iting factor. In manufacturing, it is also referred as a bottleneck. Every process
has a bottleneck and focusing improvement efforts that constraint is the fastest
and most effective path to improved profitability. Eliminating bottlenecks means
there will be less work-in process. (Waters, 2009, 235-237)
“I say an hour lost at a bottleneck is an hour out of the entire system. I say an
hour saved at a non-bottleneck is worthless. Bottlenecks govern both throughput
and inventory.” – Eliyahu Goldratt (Lean5)
Picture 9 Bottleneck in supply chain (Transtutors, 2015)

34
TURKU UNIVERSITY OF APPLIED SCIENCES THESIS | Emma Pihlakivi
In picture 9 is shown the typical image how bottlenecks effects the throughput
when manufacturing products.
Bottleneck is the main cause for the low material flow from the upstream to the
downstream. Bottleneck can also be named as constraint.

35
TURKU UNIVERSITY OF APPLIED SCIENCES THESIS | Emma Pihlakivi
6 RESEARCH
This research part consist finding bottlenecks from solar energy and photovolta-
ics supply chain, investments costs and energy’s payback time.
In the payback time section all the numbers that are used are from Fortum and
the panels that are used in the example are made up for complete the case study
Fortum was picked for this research, because it offers complete PV systems, in-
cluding installations. And Fortum also provides electricity and buys the surplus
electricity from consumers.
For the calculation part are used two different examples, order to show some
calculations and more information how much is the investment price for PV sys-
tem and how much is the energy payback time nowadays.
In the examples all the PV system assumptions are made for detached houses,
and all the panels are installed on rooftop facing south in 45° angle.
6.1 Bottlenecks for solar energy and photovoltaics
A bottleneck is considered to be any constraint along the entire physical supply
chain of PV technologies, from the source of raw materials all the way to end-of-
life. PV is nowadays likely to be constrained by a range of bottlenecks, many of
these are related to supply-demand differences, while some are due to absolute
constraints on materials. (E4tech&Avalon, 10)
International Energy Agency’s Implementing Agreement on Renewable Energy
Technology Deployment (IEA-RETD) made a research in November 2012, where
they studies bottlenecks in solar energy and they identified 25 bottlenecks across
the wind and PV sectors. (E4tech&Avalon, 10-11)
In this chapter just few of the bottlenecks that were identified in the IEA-RETD
final report are shown in this this research. In Finland, almost all the PV technol-
ogy systems and grids are coming from abroad. China is nowadays the biggest

36
TURKU UNIVERSITY OF APPLIED SCIENCES THESIS | Emma Pihlakivi
supplier in PV sector. (Holmberg, 2015) That is the reason why in this research
do not handle more about the bottlenecks in raw materials supply chain, where
lies many of the bottlenecks according to the final report. Some of these bottle-
necks are shown in table 6. (E4tech & Avalon Consulting, 2012)
According to the IEA-RETD final report the main issue is that grid connections
are holding back PV deployment and it is going to have a severe connection is-
sues and administrative and regulatory barriers. Regulations to ease PV connec-
tion and enforce the upgrading of grids at fair return on investment are needed,
in conjunction with widespread smart grid infrastructure. (E4 tech & Avalon Con-
sulting, 2012, 15)
- Insufficient silver availa-bility for c-Si PV - Insufficient tellurium availability for CdTe PV - Insufficient indium availa-bility for thin film PV
- Capital intensity of solar grade silicon production for c-Si PV - Potential restrictions on CdTe PV from hazardous substances regulations
- Technical, commercial and regulatory barriers to grid access for PV projects
- Lack of distribution chan-nel for PV in future growth markets
- Insufficient skilled per-sonnel for installation - Time consuming and un-certain permitting proce-dures for PV projects
- Insufficient PV module take-back schemes and re-cycling processes
- Lack of appropriate solu-tions for dust removal from PV modules
Table 6 Criticality assessment of bottlenecks in photovoltaic (E4 tech & Avalon Consulting, 2012, 15)

37
TURKU UNIVERSITY OF APPLIED SCIENCES THESIS | Emma Pihlakivi
Table 6 shows the IEA-RETD identified critical bottlenecks in PV technology. The
parts that are in red color are considered high criticality level, orange color is
considered medium criticality, and the yellow part is considered low criticality.
A question of critical materials for cells is important in developing solar technol-
ogy. These materials are silver (used in c-Si panels), tellurium (used for thin films)
and indium. These materials are considered as bottlenecks according to E4tech
& Avalon Consulting’s final report to IEA-RETD in November 2012.
Time consuming and uncertain permitting procedures are delaying the deploy-
ment of PV projects in some countries and there is scope for transferring lessons
learned in permitting across PV markets. Insufficient skilled personnel are avail-
able for PV installation, especially as PV moves to markets where sunshine levels
are high but skill levels are often lower. This requires careful skills planning and
knowledge transfer by companies, supported by national education policies and
PV industry associations. At industry level, there is a need to integrate skills con-
siderations in product design, in particular through provision of simpler PV system
(ideally ‘plug and play’). The absence of product distribution infrastructure may
hamper deployment particularly in developing countries. Long terms planning and
collaboration between policymakers and industry would allow this to be avoided.
Vertical integration downstream from distribution down to planning and installa-
tion is one way for module manufacturers to also gain better control over the
channel to market. (E4 tech & Avalon Consulting, 2012, 15-16)
From supplier’s point of view the biggest issues are trained human resources,
and the knowhow knowledge for the PV technology. Most suppliers in Finland
order their grid connections and panels from elsewhere example from Germany.
In Finland the knowhow is more in marketing, designing, delivery and installing
the photovoltaic systems and grids. The system deliveries in Finland are around
of ten companies, which most of them bring solar grids from abroad. (Holmberg,
2015)

38
TURKU UNIVERSITY OF APPLIED SCIENCES THESIS | Emma Pihlakivi
From consumer’s point of view the biggest bottlenecks lies in the energy payback
time and investment costs of the PV systems. The payback time depends on the
size of the solar system and sun’s irradiation. In Finland the best time for sun’s
irradiation is summer time. Other issue that was pointed is that there is not
enough information about solar panels, and its efficiency. (Holmberg, 2015)
Pöyry Management Consulting says in their energy markets success story that
“As everyone knows, there is a problem with relying wind and sun to generate
power. Sometimes the wind does not blow and the sun does not shine. Investors,
energy companies and policy makers need robust and detailed market analysis
that guides investments”.
Solar irradiation is lower in northern Europe than in central or southern Europe,
but the difference is not as large as in believed. The average daily irradiation in
Finland is slightly over 900 kWh/m² it is almost the same than in northern Ger-
many or Belgium. The efficiency of PV panels increases in lower temperature. In
Germany for higher PV capacity is because the feed-in tariff system, and not the
actual difference in irradiation. The lower use of solar energy in northern countries
seems to be the lower or even non-existing financial support. (Motiva, 2015)
The challenge for Finland is that the solar energy market share is small. However,
renewables should be seen as affecting energy systems, which is why future
business opportunities are looking better. (Holmberg, 2015)
Tekes organized summer seminar at 2014 where they spoke about future of the
solar energy. In that seminar one of the topics were: what are the things that are
slowing down the development solar energy technology in Finland and what
would make the growth easier. Solar energy is used at summer cottages all
around Finland, so the technology is familiar. But still many of the people are not
aware the possibilities for solar energy technology. Tekes named custom for the
biggest bottleneck, because all the consumers have to register to custom and
pay the taxes for consuming electricity. Except consumer does not have to pay
electricity taxes, if the produce is less than 50 kVa. (Tekes, 2015)

39
TURKU UNIVERSITY OF APPLIED SCIENCES THESIS | Emma Pihlakivi
Fortum’s CFO Timo Karttinen says in the press release at 2 March, 2015 that in
fortum’s view, the key issues in the electricity markets are related to assessing
generation adequacy, securing sufficient investments in generation and transmis-
sion, increasing renewable energy, better utilization of hydropower, and develop-
ing the retail markets. (Fortum, 2015)
6.1.1 Feed-in tariff
The feed-in tariff (FIT) system has been designed for increasing the use of re-
newable energy sources in electricity production. The EU has set requirements
to achieve an increase in renewable energies whereby they will account for 38 %
of final consumption by the end of 2020. The FIT paid in Finland comprises a
state subsidy granted by the Energy Authority. Electricity producers that receive
FIT are responsible for the sale of the electricity produced and for any arising net
energy costs. In Finland a FIT is available only for: new wind power plants new
biogas power plants, new wood-fuelled power plants and for timber chip power
plants.
For solar energy, the FIT is not available, but for example Germany uses feed-in
tariffs, and the solar energy markets are livelier than in Finland. Feed-in tariff
came to Finland at 2011, and the latest increase for the system was wind power
plants.
For example the German Renewable Energy Act stipulates the level of the IFT
and grants priority to the feeding in of solar power. The purpose of the FIT is to
give investors a reasonable return on investment. Since the beginning of 2012,
newly installed, small rooftop installation also has achieved grid parity. (Fraunho-
fer, 2015)
In Finland the government should support more solar energy technologies. Now
the support goes to other RE technologies such as wind power.

40
TURKU UNIVERSITY OF APPLIED SCIENCES THESIS | Emma Pihlakivi
6.2 Costs
In this chapter all the prices that are used for calculate PV systems are Fortum’s
prices. These prices are trendsetting prices; PV system prices can be different
with other suppliers. Also the total price for the PV system depends if the panels
are ordered separately from abroad. Fortum sell only PV system packages, and
all the needed equipment’s came with the package price. In this research are
shown two example calculations for PV systems and all the panels are installed
to detached house rooftop.
Energy Agency made an annual report from the year 2014, where is shown eve-
rything that is happened in the RES field. It is shown that in January 1st 2015, the
generation of household consumer’s electricity price was 15.57 €/kWh. Picture 4
is shows how the market shares are divided in Finland.
27 %
10 %
27 %
2 %
15 %
19 %
Purchase
Sales
Distribution network
Transmission systemoperator
Electricity tax
Value added tax
Table 7 Generation of household consumer's electricity price in 2014. (Energy Agency, 2014)

41
TURKU UNIVERSITY OF APPLIED SCIENCES THESIS | Emma Pihlakivi
In the diagram (table 7) 37 % of the electricity price consist sales, 29 % transmis-
sion and 34 % of taxes. (Energy Agency, 2014)
Electricity price now is 2.62 €/kWh (30th May, 2015, Fortum), in picture 10 is
shown the development of electricity price from 09/2013 to 05/2015. As shown
the markets are for the electricity price is lowering rapidly. But still it is hard to
predict the price for electricity for the future. (Fortum, 2015)
Solar energy is more and more profitable renewable energy source in Finland. It
market share is increased more in last years. Karoliina Auvinen point out in Fin-
solar project that the PV system installed to a commercial property makes it to 6-
euro cents per kWh for the next 25 years. (Finsolar, 2015)
As a rapidly developing technology, assumptions about solar PV technology in-
clude significant reductions in investment costs. The Technical Research Centre
of Finland (VTT) made in end of 2012 report where they compared different costs
Picture 10 Electricity price in Finland. (Fortum, 2015)

42
TURKU UNIVERSITY OF APPLIED SCIENCES THESIS | Emma Pihlakivi
development. In 2010 the investments costs were 5.0 €/W, and in the most opti-
mistic view of point in 2050 the costs would be 0.25 €/W and the PV systems
would drop 60 % by 2020. More realistic point of view the PV systems would drop
40 % and the investments cost would be more likely around 0.5 €/W. In this sce-
nario, it would be still 90% lower than the cost level in 2010. (VTT, 2015)
The photovoltaic systems are from 5000 to 20 000 euros in Finland. The price
depends on the system area, smallest systems consist 6 panels (rated power 1.5
kWp) and the biggest systems are made for 36 panels (rated power 9.0 kWp).
(Fortum, 2015)
In this case example are shown two calculations, were both systems are installed
to rooftop for detached house. The prices for these PV systems are shown in
table 8.
Solar system size
(kWp, rated power)
Solar system Installation work Total price
(Includes VAT 24 %)
9 panels
(2,25 kWp)
4 750 € 1 870 € 6 620 €
12 panels
(3,0 kWp)
5 675 € 2 335 € 8 010 €
Table 8 Photovoltaic system prices (Fortum, 2015)
The total solar system package includes: panels, inverter, rooftop brackets, elec-
trical equipment’s, consultation at home, installation, and help with the system
introduction. (Fortum, 2015)
6.3 Energy payback time
As the solar energy and PV markets grows, it is important to understand the en-
ergy performance. PV systems have a long useful lifetime estimated around 30
years.

43
TURKU UNIVERSITY OF APPLIED SCIENCES THESIS | Emma Pihlakivi
Energy payback time (EPBT) is the time it takes for the panel to generate the
same amount of energy that was required for its manufacture. The EPBT is de-
fined as the years required for a PV system to generate a certain amount of en-
ergy for compensation of the energy consumption over its life cycle. The EPBT
includes: manufacturing, assembly, transportation, system installation, operation
and maintenance and system decommissioning or recycling.
The exact payback period depends on a various number of different factors:
The amount of clean energy that the PV installation generates. Output de-
pends on the amount of direct irradiation
The price of a PV system
The total cost of installation, including taxes
Unsubsidized residential PV systems in Finland had payback times of more than
40 years. The production-based support for PV generation needs to be two to
three times the buying price of electricity, to make it possible to pay back the initial
investment in 20 years. Low capacity systems with more than 50 % self-consump-
tion (under 3 kW) were favored by self-consumption incentives, while high capac-
ity systems with less than 40 % self-consumption (over 5 kW) were favored by
the FIT-type support schemes. (Indoor Environment, 2015)
Defining the EPBT for investments can be difficult, because it is hard to predict
the future price for purchased electricity. Karoliina Auvinen says on her Finsolar
report 16th of May 2015 that the energy payback time is not a good method to
use, because it does not give the right image for the investment. PV’s (and also
solar thermal systems) lifetime cycle is around 30 years, and these systems are
technically very reliable. In EPBT calculations the investments holding time, out-
standing taxes and interests. For individual investment the EPBT can be defend
only, if the limitation risk is outstanding. Device risks in PV systems before the
EPBT closes down are very small and also the maintenance and services are
slightly small. (Finsolar, 2015)
PV’s technical lifetime-cycle can be even over 30 years, and almost all the sup-
plier’s gives 25 years guarantee for the systems. The guarantee make sure that

44
TURKU UNIVERSITY OF APPLIED SCIENCES THESIS | Emma Pihlakivi
the panels will give the rated power first 10 years with 90 % efficiency from the
amount that the supplier announces. And for the 25 years 80 % efficiency from
rated power that supplier promises. (Motiva, 2015)
For calculations are used the case study example, with that we can estimate the
energy payback time and see if the PV system is profitable. All the calculations
and numbers are Fotum’s prices, which are available in the Internet.
With this example is used southern Finland’s irradiation, which is around 900
kWh/m²/year, and the PV’s are facing south in 45° angle.
Example 1, the PV systems consist 9 panels, and the total area is about 14 m².
One panel is 1.5 m². The maximum output is around 2025 kWh/year. Rated power
is 2.25 kWp, which is 225 Wp.
One panel produces 225 kWh/year, which can be calculated:
𝑝 =𝑥
𝑛 p = Produce (kWh/year)
x = Maximum output (kWh/year)
n = Number of panels
𝑝 =2025 𝑘𝑊ℎ/𝑦𝑒𝑎𝑟
9= 225 𝑘𝑊ℎ/𝑦𝑒𝑎𝑟
Efficiency of the panels is,
𝑡 = 𝑎 × 𝑥 t = produce of one panel (kWh/m²)
a= Area (m²)
x = amount of radiation/year

45
TURKU UNIVERSITY OF APPLIED SCIENCES THESIS | Emma Pihlakivi
𝜂 =𝑝
𝑡× 100 % 𝜂 = Efficiency (%)
p = Produce (kWh/year)
t = produce of one panel (kWh/m²)
𝑡 = 1,5 𝑚2 × 900 𝑘𝑊ℎ
𝑘𝑊ℎ𝑚²
𝑦𝑒𝑎𝑟= 1350 𝑘𝑊ℎ/𝑦𝑒𝑎𝑟
𝜂 =225 𝑘𝑊ℎ
𝑘𝑊ℎ
𝑚²/𝑦𝑒𝑎𝑟
1350 𝑘𝑊ℎ𝑘𝑊ℎ
𝑚²/𝑦𝑒𝑎𝑟
× 100 % = 16,7 %
The formulas for calculating EPBT:
𝐸𝑃𝐵𝑇 =𝑥
𝑦 EPBT = energy payback time (years)
X = price of the solar panel system (€)
Y = system return (€/years)
𝐸𝑃𝐵𝑇 =6 620 €
228 €= 30 𝑦𝑒𝑎𝑟𝑠

46
TURKU UNIVERSITY OF APPLIED SCIENCES THESIS | Emma Pihlakivi
The results are, that in example 1 the EPBT is around 30 years. The System
return price 228 € is given in the calculation that Fortum shows in table 9. In the
appendix 1 is shown the screenshot from Fortum’s website, where is the same
calculation than in table 9.
Own power generation
Amount of the panels 9 panels
Yearly estimated electricity produce About 1775 kWh
Estimated annual savings
Estimated annual savings 228 €
Costs
Photovoltaic system 5 280 €
Installation work 1 340 €
TOTAL 6 620 €
Estimated domestic help 503 €
Table 9 Total prices for 9 panels PV system. (Fortum, 2015)
Example 2, the PV solar system consist 12 panels, and the total area is around
19 m². The one panel area is the same than in example 1. The maximum output
is around 1700 kWh/year. And the rated power is 3 kWp = 300 Wp. The produce
amount is also same 225 kWh than in example 1 and the efficiency for the panels
are 16.7 %. In the appendix 2 is shown the screenshot from Fortum’s website,
where is the same calculation than in table 10.

47
TURKU UNIVERSITY OF APPLIED SCIENCES THESIS | Emma Pihlakivi
The EPBT for these example calculations are 26 years.
Own power generation
Amount of the panels 12 panels
Yearly estimates electricity produce * About 2340 kWh
Estimated annual savings
Estimated annual savings ** 304 €
Costs
Photovoltaic system 6 460 €
Installation work 1 550 €
TOTAL 8 010 €
Estimated domestic help *** 597 €
Table 10 Total prices for 12 panels PV system. (Fortum, 2015)
* All the electricity production amounts are estimated, because there are many
factors that affect, for example the amount of the sun’s irradiation, temperatures,
installation angles and possible obstacles that can block the PV panels.
** For estimating annual savings, there are used electricity price 0.13 €/kWh,
which includes transfer of the sales and taxes. It is also estimated that the pro-
duced electricity are used for own power generation.
*** For PV installation work can apply domestic help. The amount in 2012 were
45 % of the total work, or up to 2000 €/person. (Fortum, 2015)

48
TURKU UNIVERSITY OF APPLIED SCIENCES THESIS | Emma Pihlakivi
If the price of the electricity would increase example 10 % a year, the payback
time would be smaller. In table 11 is shown example if the prices would increase
10 %.
Year Investment Annual savings
1 6620 228
2 6392 251
3 6141 276
4 5865 303
5 5562 334
6 5228 367
7 4861 404
8 4457 444
9 4013 489
10 3524 538
11 2986 591
12 2395 651
13 1744 716
14 1029 787
15 242 866
16 0 952
Table 11 Payback time for the investment if the electricity price would increase 10 %.
If the electricity price would increase 10 % yearly, the EPBT would be around 16
years.
There is also possibility to sell the surplus electricity for Electricity Company for
example Fortum. Fortum has announced that they also buy any surplus electricity
produced by the consumers. (Fortum, 2015)
Fortum pays from the surplus electricity the price that is shown in the Nord Pool
Spot. Fortum takes only 0.24 €/kWh for brokerage. And consumer’s produce is
exclusive from VAT. (Fortum, 2015)

49
TURKU UNIVERSITY OF APPLIED SCIENCES THESIS | Emma Pihlakivi
Nord Pool Spot is the leading power market in Europe; it offers day-ahead and
intraday markets to customers. Nord Pool Spot AS is licensed by the Norwegian
Water Resources and Energy Directorate to organize and operate a market place
for trading power, and by the Norwegian Ministry of Petroleum and Energy to
facilitate the power market with foreign countries. (Nordpoolspot, 2015)
6.4 Future for renewable energy and solar energy
“The sun could be the world’s largest source of electricity by 2050, ahead of fossil
fuels, wind, hydro and nuclear”, says IEA in their press release at September
2014.
IEA made roadmaps to show how solar photovoltaic systems could generate up
to 16% of the world’s electricity by 2050 while solar thermal electricity from con-
centrating solar power plant could provide an additional 11 %.
“The rapid cost decrease of photovoltaic modules and systems in the last few
years has opened new perspective for using solar energy as a major source of
electricity in the coming years and decades. However, both technologies are very
capital intensive: almost all expenditures are made upfront. Lowering the cost of
capital is thus of primary importance for achieving the vision in these roadmaps”.
(viittaus IEA, Maria van der Hoeven, 29 September 2014, Paris)
In the future the importance of electricity use will increase. In passive houses,
very low energy houses, overall electricity use is between 30-40 % of the total
energy use of the building. For new buildings, the EU has set the target close to
zero energy buildings by 2020. In order to achieve the zero energy buildings tar-
gets, interaction between different parts of the infrastructure is crucial, and com-
munications are needed between energy supply and consumption. (VTT, 26)
In the future, solar energy may be both electricity and heat in the same cell, called
multijunction cells. Viewpoints for technology developments and for the future of
solar energy:

50
TURKU UNIVERSITY OF APPLIED SCIENCES THESIS | Emma Pihlakivi
Thin film solar cells; the life-cycle in outdoor use must be longer; thin-film
wallpaper for artificial light
Energy storage at northerly latitudes will be solved. Advances batteries
(Example Tesla’s new battery), hydrogen, compressed air storage etc.
Solar cell CHP material development is needed
Solar energy improves process efficiency and economy in traditional CHP
plant Solar cooling technology applications
Solar technology integrated into building envelope elements and rapid
connections
Solar microbial-synthesis processes for energy production (VTT, 47)
Finland has the conditions for increasing emission-free renewable energy in a
way that is sustainable for the environment. Increasing the RE sources the na-
tional economy and employment benefits from that. (TEM, 2014)

51
TURKU UNIVERSITY OF APPLIED SCIENCES THESIS | Emma Pihlakivi
7 SUMMARY
This thesis was a pilot search and it was part of the Solarleap project. The work
starts with solar energy theory and the effectiveness in Finland. There were not
so many sources to use, because the use of solar energy in Finland has not been
so extensive, but the use and need for solar energy is increasing. On the theory
part, the supply chain and Lean method for photovoltaics were explained. The
research part studied existing bottlenecks in solar energy, and what is the effec-
tiveness to the consumers and suppliers. On the research part were also calcu-
lated investment costs and payback time of energy by using two different exam-
ples. Those calculation could tell that the energy payback time in Finland is quite
long, if compared, for example, to Germany.
There is also a possibility not to order the whole photovoltaic system and all the
panels from one supplier. Research and articles tell that people order photovol-
taic systems from abroad, because it is cheaper and a supplier is used only for
the installation work in Finland. In the research was shown that removing the
obstacles from the identified bottlenecks can help lowering the solar energy’s de-
livery process in the future. In Finland the biggest challenge is that the energy
market share in small, but it is increasing all the time and future is looking better.
When the know-how increases, the market share will rise and the future goals
are achieved more easily. Many reports have been made about the year 2050,
and it is predicted that the solar energy could then be the largest source of elec-
tricity. Finland has also its own goals for renewable energy’s usage for 2025 and
2050.
Many considered bottlenecks in solar energy were found, and many of them were
in raw materials. But the lack of knowledge in Finland were pointed out on this
research, and not the challenges for raw materials. Also the Lean method was
mentioned in the theory part. The Lean method’s base idea is to remove all the
waste, so using that in the photovoltaics supply chain can help to lower the costs
and unnecessary steps. Lean identifies in the seven key areas that unnecessary
movement of raw materials and transportation increases waste in the supply

52
TURKU UNIVERSITY OF APPLIED SCIENCES THESIS | Emma Pihlakivi
chain and for the delivery process. Bringing the know-how to Finland could re-
move this waste form the supply chain and it brings also more job positions when
all the manufacturing would happen in the same place and same country. And
this could also remove the bottleneck for the know-how section, which means
that Finland could use more solar energy as the renewable energy source. The
goal for the future is net-zero energy buildings, this can only be achieved by in-
creasing photovoltaic technology and know-how in Finland. In table 12 is shown
the biggest bottlenecks in solar energy and the suggestion how to remove these
obstacles are shown.
Bottleneck How to remove
Know-how
More education to increase the know-how
Photovoltaic sys-tem delivery from abroad
Lean method/transport: Removing unneces-sary movement
Energy payback time
Depending energy price, government should support more, feed-in tar-iff.
Raw materials
Incresing recycling
Table 12 Biggest bottlenecks in solar energy

53
TURKU UNIVERSITY OF APPLIED SCIENCES THESIS | Emma Pihlakivi
On April 30th, 2015 Tesla announced that their new Powerwall home battery that
charges using electricity generated from solar panels, or when utility rates are
low. With this the energy harvested form the photovoltaic panels can be used in
the evening, when sun is not shining (anymore). With this development, the con-
sumer does not have to sell the energy surplus to electricity companies. There
are batteries for photovoltaic systems, and those batteries are used more often
in summer cottages than in detached houses. But with this new battery improve-
ment more energy from the sun could be harvested by keeping it on the battery.
The opportunities for solar energy are good in Finland. Finland is large and grow-
ing country, which means that the benefits for improving the efficiency of renew-
able energy use is good. Technology knowledge, product development and com-
petence will be helpful when the future goal is to increase solar energy and its
efficiency.

54
TURKU UNIVERSITY OF APPLIED SCIENCES THESIS | Emma Pihlakivi
REFERENCES
A study and Theoretical Analysis of Evacuated Tube Collectors as Solar Energy Conversion De-vice for Water Heating. Dilip Mishra & N. K. Saikhedkar. 2014. India: Faculty Member, The ICFAI University. http://www.slideshare.net/DilipMishra10/a-study-and-theoretical-analysis-of-evacu-ated-tube-collectors-as-solar-energy-conversion-device-for-water-heating
Aarnio P. Miten aurinkokenno toimii. New & Renewable energy systems group. http://tfy.tkk.fi/aes/AES/projects/renew/pv/pv-toiminta.html. Reference 20.4.2015.
Alfaro-Ayala J., Martinez-Rodriguez G., Picon-Nunez M., Uribe-Ramirez A., Gallegos-Munoz, A. 2015. Numerical study of a low temperature water-in-glass evacuated tube solar collector. Mex-ico: Department of Chemical Engineering, University if Guanajuato. Elsevier. Reference 20.5.2015. http://www.sciencedirect.com.ezproxy.turkuamk.fi/science/arti-cle/pii/S0196890415001053
BlueGreen Alliance by Stone & Associates. January, 2011. Reference 4.5.2015. http://www.thecemc.org/body/Solar-Overview-for-BGA-Final-Jan-2011.pdf
Broderick L., Albert B., Pearson B., Kimerling L., Michel J. 2014. Design for energy: Modeling of spectrum, temperature and device structure dependences of solar cell energy production. USA: Massachusetts Institute of Technology. Reference 10.5.2015. http://www.sciencedi-rect.com.ezproxy.turkuamk.fi/science/article/pii/S0927024814006813 . Elsevier.
Chopra S. & Meindi P. 2010. Supply Chain Management- Strategy, Planning, and Operation. 4th edition. Pearson Education Inc., New Jersey.
El Chaar L., Iamont L.A.,El Zein N. . 2011. Review of photovoltaic technologies. United Arab Emirates, Abu Dhabi. USA, Chicago. Reference 20.4.2015. http://www.sciencedi-rect.com.ezproxy.turkuamk.fi/science/article/pii/S1364032111000050 . Elsevier.
Energiateollisuus. Aurinkoenergia. Reference 5.5.2015. http://energia.fi/energia-ja-ymparisto/en-ergialahteet/aurinkoenergia
Energy Authority. 2014. Reference 30.5.2015. http://www.e-julkaisu.fi/energiavirasto/fair_en-ergy_annual_report_2014/
Energy.Gov. 21.8.2013. Solar Energy Resources Basics. Reference 15.5.2015. http://en-ergy.gov/eere/energybasics/articles/solar-energy-resource-basics
European commission. February 2015. Science for Environment Policy, Nanotechnology cuts costs and improves efficiency of photovoltaic cells. Reference 15.5.2015. http://ec.europa.eu/en-vironment/integration/research/newsalert/pdf/nanotechnology_cuts_costs_and_improves_pho-tovoltaic_cell_efficiency_48si6_en.pdf
Finnish Energy Industries. European Union energy policy. Reference 16.5.2015. http://ener-gia.fi/en/eu-affairs/european-union-energy-policy
Finsolar. 16.5.2015. Aurinkoenergiainvestointien kannattavuuden arviointi. Reference: 30.5.2015. http://www.finsolar.net/?page_id=1365

55
TURKU UNIVERSITY OF APPLIED SCIENCES THESIS | Emma Pihlakivi
Fortum. 2.3.2015. Fortum’s Energy Review: Nordic electricity market in transition. Reference 30.5.2015. https://www.fortum.fi/en/mediaroom/Pages/fortums-energy-review-nordic-electricity-market-in-transition.aspx
Fortum. 21.8.2013. Making progress in solar energy. Reference 31.5.2015. http://www.for-tum.com/en/mediaroom/in-focus/articles/pages/making-progress-in-solar-energy.aspx
Fortum. 25.5.2015. Fortum aurinkopaketti. Reference 30.5.2015. http://www.fortum.com/coun-tries/fi/energiansaasto-ja-ratkaisut/aurinkopaneelit-aurinkopaketti/pages/default.aspx
Fraunhofer. 19.5.2015. Recent Facts about Photovoltaic in Germany. Reference 30.5.2015. http://www.ise.fraunhofer.de/en/publications/veroeffentlichungen-pdf-dateien-en/studien-und-konzeptpapiere/recent-facts-about-photovoltaics-in-germany.pdf
Haukkala T. 2015. Does the sun shine in the High North? Vested interests as a barrier to solar energy deployment in Finland?. Finland: Aalto University. Reference 6.5.2015. http://www.sci-encedirect.com.ezproxy.turkuamk.fi/science/article/pii/S2214629614001339 . Elsevier.
Hi-min. 2015. U-Type Solar collector. Reference 8.6.2015. http://english.himin.com/News/Show-Article.asp?ArticleID=33
Hong T., Koo C., Park j., Park H.S. 2013. A GIS (geographic information system)-based optimi-zation model for estimating the electricity generation of the rooftop PV (photovoltaic) system. Re-public of Korea: Seoul. http://www.sciencedirect.com.ezproxy.turkuamk.fi/science/arti-cle/pii/S0360544213010529 . Elsevier.
http://www.bluegreenalliance.org/cemc
Ilmatieteenlaitos. Energialaskennan testivuodet nykyilmastossa. Reference 5.5.2015. http://ilmat-ieteenlaitos.fi/energialaskennan-testivuodet-nyky
Indoor Environment. 23.3.2015. Renewable energy production support schemes for residential-scale solar photovoltaic systems in Nordic conditions. Reference. Reference 31.5.2015. http://in-doorenvironment.org/renewable-energy-production-support-schemes-for-residential-scale-solar-photovoltaic-systems-in-nordic-conditions/
International Energy Agency. Renewable Energy, Medium-Term Market Report 2012. Reference 15.5.2015. https://www.iea.org/publications/freepublications/publication/MTrenew2012_web.pdf
Jiandong Z., Hanzhong T., Susu C. 2015. Numerical simulation for structural parameters of flat-plate solar collector. China: The College of Energy, Nanjing Tech University. Elsevier. Reference 20.5.2015. http://www.sciencedirect.com.ezproxy.turkuamk.fi/science/arti-cle/pii/S0038092X15002157
Joint research centre. 10.2.2012. Reference 5.5.2015. http://re.jrc.ec.eu-ropa.eu/pvgis/cmaps/eu_cmsaf_opt/G_opt_FI.png
Holmber J. Sw-Energia. http://www.swenergia.fi/. Interview 26.5.2015.
Knier G. 2002. How Do Photovoltaics Work? NASA, Science News. Reference 20.4.2015. http://science.nasa.gov/science-news/science-at-nasa/2002/solarcells/
Kohl J., Loikkanen T., Hernesniemi H., Simons M., Koljonen T., Nikulainen T., Valovirta V., Talja H. & Similä L. June 2012. Näkymiä Suomen mahdollisuuksista uusiutuvan energiaan liittyvässä globaalissa liiketoiminnassa. Työ- ja elinkeinoministeriö, Edita Publishing Oy.

56
TURKU UNIVERSITY OF APPLIED SCIENCES THESIS | Emma Pihlakivi
Leanproduction.com. Into to Lean. Reference 25.4.2015. http://www.leanproduction.com/intro-to-lean.html
Liang R., Zhang J., Ma L., Li Y. 2014. Performance evaluation of new type hybrid photovol-taic/thermal solar collector by experimental study. China: Dalian University of Technology. Else-vier. Reference 15.5.2015. http://www.sciencedirect.com.ezproxy.turkuamk.fi/science/arti-cle/pii/S135943111400859X
Ministry of Employment and Economy. 16.10.2014. Energy and Climate Roadmap 2050. Refer-ence 31.5.2015. https://www.tem.fi/files/41483/Energy_and_Climate_Roadmap_2050.pdf
Motiva. 19.12.2014. Syöttötariffi. Reference 28.5.2015. http://www.motiva.fi/toimialueet/uusiu-tuva_energia/uusiutuva_energia_suomessa/uusiutuvan_energian_tuet/syottotariffi
Motiva.10.4.2015. Aurinkoenergia. Reference 20.4.2015. http://www.motiva.fi/toimialueet/uusi-utuva_energia/aurinkoenergia
Nord Pool Spot. Reference 31.5.2015.http://www.nordpoolspot.com/About-us/
Office of Energy Efficiency & Renewable Energy. August 19, 2013. Reference 7.5.2015. http://en-ergy.gov/eere/energybasics/articles/crystalline-silicon-photovolatic-cell-basics
Reverse Logistics Association. What is reverse logistics? Reference 9.6.2015. http://www.re-verselogisticstrends.com/reverse-logistics
Scott Madden Management Consultants. Solar Photovoltaic Plant Operating and Maintenance Costs. September, 2010. Reference 9.6.2015. https://www.google.fi/url?sa=t&rct=j&q=&esrc=s&source=web&cd=2&cad=rja&uact=8&ved=0CCsQFjAB&url=http%3A%2F%2Fwww.scottmad-den.com%2F%3Fa%3Dstrm%26aid%3D407&ei=1op2VZcjhObJA4yfgIAO&usg=AFQjCNFOOBj-qkV_2YBDHWp2pUb_YwduYA&bvm=bv.95039771,d.bGQ
Securing the supply chain for wind and solar energy (RE-SUPPLY). November 2012. Franz Lehner, Ankur Rastogi, Subhabtra Sengupta, François Vuille, Sabine Ziem. E4tech and Avalon Consulting. http://iea-retd.org/wp-content/uploads/2012/11/RE-SUPPLY-final-report.pdf
Solar Energy Industries Association. Photovoltaic. Reference 17.5.2015. http://www.seia.org/pol-icy/solar-technology/photovoltaic-solar-electric
Solar Energy Industries Association. Solar technology. Reference 17.5.2015. http://www.seia.org/policy/solar-technology
Solar Tube Company. Reference 8.6.2015.http://www.solartubecompany.co.uk/solar-water-heat-ing/
Sun Water Solar. Solar Thermal. Reference 15.5.2015. http://sunwatersolar.com/solar-ther-mal/what-is-solar-thermal
Tesla. 30.4.2015. Powerwall Tesla home Battery. Reference 28.5.2015. http://www.tes-lamotors.com/powerwall
The Green Home. 12.8.2013. Reference 8.6.2015.http://thegreenhome.co.uk/heating-renewa-bles/solar-panels/flat-plate-solar-thermal-collectors-overview/

57
TURKU UNIVERSITY OF APPLIED SCIENCES THESIS | Emma Pihlakivi
TS Solar power system. Reference 8.6.2015. http://tssolarpowersystem.com/solarevc.htm
Tulli.12.2.2015. Energiavero. Reference 28.5.2015. http://www.tulli.fi/fi/yrityksille/verotus/valmis-teverotettavat/energia/index.jsp
Twidell J. & Weir t. 2006. Renewable energy resources. 2nd edition. Taylor & Francis, Abingdon.
Wahab A., Mukhtar M., Sulamain R. The 4th International Conference on Electrical Engineering and Informatics (ICEEI 2013). 2013. Malaysia: Universiti Kebangsaan Malaysia. Reference 20.5.2015. http://www.sciencedirect.com.ezproxy.turkuamk.fi/science/arti-cle/pii/S2212017313004817 . Elsevier.
Waters D. 2003. Logistics – An Introduction to Supply Chain Management. USA: New York: Pal-grave Macmillian.
Waters D. 2009. Supply Chain Management, an Introduction to Logistics. 2nd edition. USA: New York: Palgrave McMillian.
Vollmann T., Berry W., Whybark D. & Jacobs F. 2005. Manufacturing Planning and Control Sys-tems for Supply Chain Management. 5th edition. McGraw-Hill, New York.

Appendix 1
TURKU UNIVERSITY OF APPLIED SCIENCES THESIS | Emma Pihlakivi

Appendix 2
TURKU UNIVERSITY OF APPLIED SCIENCES THESIS | Emma Pihlakivi

TURKU UNIVERSITY OF APPLIED SCIENCES THESIS | Emma Pihlakivi