emissions of no, no and pm from inland shipping · emissions of no, no 2 and pm from inland...
TRANSCRIPT

Atmos. Chem. Phys., 16, 14285–14295, 2016www.atmos-chem-phys.net/16/14285/2016/doi:10.5194/acp-16-14285-2016© Author(s) 2016. CC Attribution 3.0 License.
Emissions of NO, NO2 and PM from inland shippingRalf Kurtenbach, Kai Vaupel, Jörg Kleffmann, Ulrich Klenk, Eberhard Schmidt, and Peter WiesenBergische Universität Wuppertal, Institute for Atmospheric and Environmental Research, 42097 Wuppertal, Germany
Correspondence to: Ralf Kurtenbach ([email protected])
Received: 6 July 2016 – Published in Atmos. Chem. Phys. Discuss.: 22 July 2016Revised: 4 October 2016 – Accepted: 20 October 2016 – Published: 16 November 2016
Abstract. Particulate matter (PM) and nitrogen oxides NOx(NOx =NO2+NO) are key species for urban air quality inEurope and are emitted by mobile sources. According toEuropean recommendations, a significant fraction of roadfreight should be shifted to waterborne transport in the fu-ture. In order to better consider this emission change pat-tern in future emission inventories, in the present study in-land water transport emissions of NOx , CO2 and PM wereinvestigated under real world conditions on the river Rhine,Germany, in 2013. An average NO2 /NOx emission ratio of0.08± 0.02 was obtained, which is indicative of ship dieselengines without exhaust gas aftertreatment systems. For allmeasured motor ship types and operation conditions, over-all weighted average emission indices (EIs), as emitted massof pollutant per kg burnt fuel of EINOx = 54± 4 g kg−1 and alower limit EIPM1 ≥ 2.0± 0.3 g kg−1, were obtained. EIs forNOx and PM1 were found to be in the range of 20–161 and≥ 0.2–8.1 g kg−1 respectively. A comparison with thresholdvalues of national German guidelines shows that the NOxemissions of all investigated motor ship types are above thethreshold values, while the obtained lower limit PM1 emis-sions are just under. To reduce NOx emissions to acceptablevalues, implementation of exhaust gas aftertreatment systemsis recommended.
1 Introduction
Particulate matter (PM) and nitrogen dioxide (NO2) are keyspecies for urban air quality in Europe. Whereas the ex-ceedance of PM limiting values has attracted considerablepublic attention during the last decade, NO2 is a topical prob-lem, which became prominent through the introduction ofnew European limiting values in January 2010.
The reduction of nitrogen oxide (NOx = nitrogen monox-ide (NO)+NO2) emissions has historically been one ofthe key objectives for improving air quality in Europe.NOx emissions have started to decrease considerably sincethe mid 1980s in many European areas. However, emis-sions from mobile sources are still important contributors toair pollution, in particular NOx . Together with NOx , non-methane volatile organic compounds (NMVOCs) undergophotochemical reactions that produce secondary pollutantssuch as ozone (O3), peroxyacetyl nitrate (PAN) and others(Chameides et al., 1997; Atkinson, 2000).
According to the European Commission’s White Pa-per (2011), 30 % of road freight transported over more than300 km distance should shift to other transport modes suchas waterborne or rail transport by 2030, and more than 50 %by 2050 (European Commission, 2011). Accordingly, such ashift will result in an increase of emissions from inland watertransportation in the next years.
In Germany today, the contribution of inland navigation tothe total freight traffic is about 12 % (BDA, 2015a). In theRhine corridor the contribution is 16–18 % (BDA, 2015b).With respect to the goods categories “coal, crude oil andpetroleum gas”; “ores, industrial rocks and minerals, andother mining products” and “coking plant and petroleumproducts”, inland water navigation is the most importanttransportation mode. In comparison to road transport, inlandnavigation has a contribution of 72 % for these goods cate-gories and 52 % for container transport. Inland water naviga-tion is a competitive alternative to road and rail transport be-cause the energy consumption per km and ton of transportedgoods is only approximately 17 % of road and 50 % of railtransport (ECT, 2015). As a consequence of the lower en-ergy consumption, inland water transportation emits signifi-cantly less CO2 and, therefore, has a direct impact on climatechange.
Published by Copernicus Publications on behalf of the European Geosciences Union.
14286 R. Kurtenbach et al.: Emissions of NO, NO2, and PM from inland shipping
In the European Union the emission of NOx , VOC, PMand CO from road and rail transport decreased from 1990to 2000, whereas emissions from inland navigation remainedmore or less constant and emissions from sea transport in-creased slightly (Trends, 2003). However, in the Netherlandsa slight reduction in inland shipping emissions was observedin the same time period when modern engines were intro-duced into the fleet (CTRC, 2003).
It has also been conclusively demonstrated that the fuel hasan important impact on the emissions. Using liquid naturalgas (LNG) as fuel for inland water vessels leads to substantialemission reductions, i.e. 75 % for NOx , 97 % for PM and10 % for CO2 (Van der Werf, 2013).
The emissions from inland water transportation are regu-lated by several national and international guidelines. In 2005the German national guideline “Binnenschiffabgasverord-nung, BinSchAbgasV” was implemented for national wa-terways, which defines engine-dependent emission indices,i.e. emitted mass of pollutant per kg burnt fuel, for NOx andPM of EINOx : 30–42 and EIPM: 1.2–2.4 g kg−1 respectively(BinSchAbgasV, 2005). In 2011 an international guidelinefor the Rhine river, “RhineSchUO”, was implemented withengine-dependent EINOx : 28–36 g kg−1 and an EIPM: 0.9–3.1 g kg−1 (RheinSchUO, 2011). In addition, for river–seaships the MARPOL guideline (International Convention forthe Prevention of Pollution from Ships) (IMO, 2012) hasto be applied. For example, for marine diesel engine witha medium speed of 720 min−1, NOx-emission indices of58 g kg−1 since 2000 (Tier I), 56 g kg−1 since 2011 (Tier II)and 11 g kg−1 since 2016 (Tier III) have been introduced.
The correct determination of emission indices (EI) is pre-requisite for establishing and developing emission invento-ries (VBD, 2001; Klimont et al., 2002; Browning and Bailey,2006; Rohacs and Simongati, 2007; TNO, 2008; CBS, 2009;UBA, 2013). Up to now, several studies have been publishedin which NO, NO2, SO2 and PM emissions from sea ships(Sinha et al., 2003; Chen et al., 2005; Eyring et al., 2005;Petzold et al., 2008; Moldanova et al., 2009; Murphy et al.,2009; Schrooten et al., 2009; Williams et al., 2009; Eyringet al., 2010; Beecken et al., 2014; Jonsson et al., 2011; Lacket al., 2011; Alfödy et al., 2013) and, in particular, from seaferries (Cooper et al., 1996, 1999; Copper, 2001, 2003; Cop-per and Ekström, 2005; Tzannatos, 2010; Pirjola et al., 2014)were investigated. Motor test-bed studies can also be used forthe determination of EIs from single ship engines (Petzold etal., 2008). However, up to now only a few studies have re-ported on inland water transportation emissions (Trozzi andVaccaro, 1998; Kesgin and Vardar, 2001; Schweighofer andBlaauw, 2009; Van der Gon and Hulskotte, 2010)
In the present study, inland water transport emissions wereinvestigated under real world conditions along the riversideof the river Rhine in Germany, during a field campaign from20 to 22 February 2013.
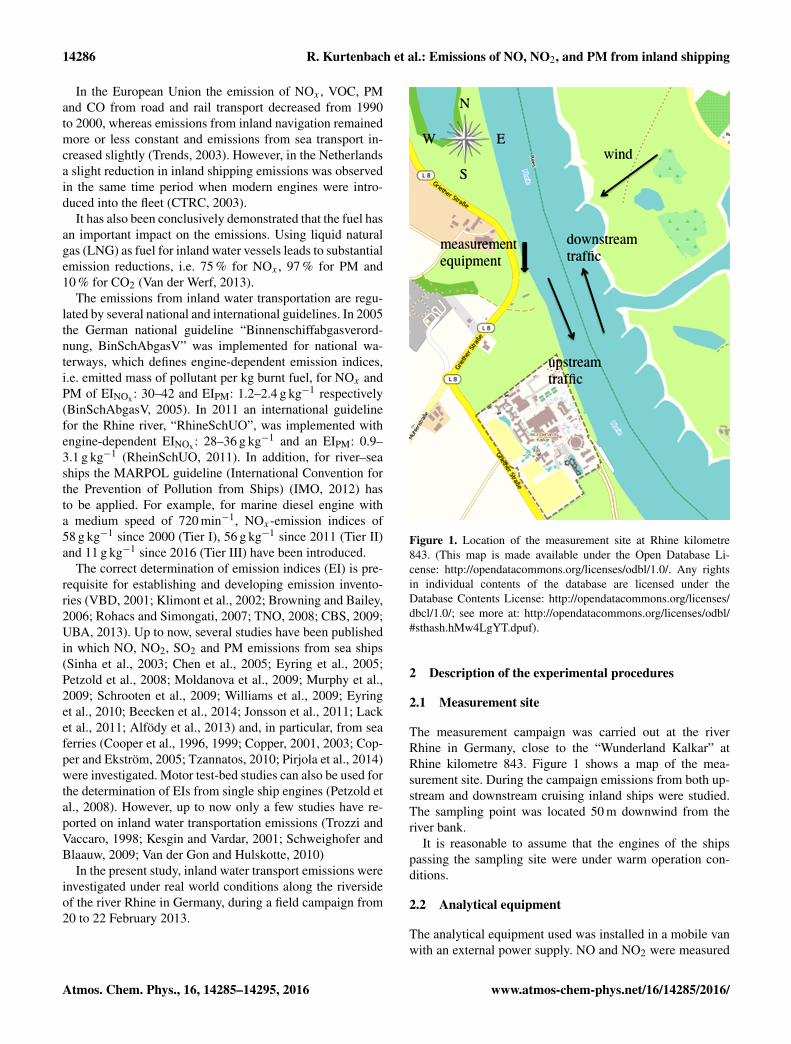
Figure 1. Location of the measurement site at Rhine kilometre843. (This map is made available under the Open Database Li-cense: http://opendatacommons.org/licenses/odbl/1.0/. Any rightsin individual contents of the database are licensed under theDatabase Contents License: http://opendatacommons.org/licenses/dbcl/1.0/; see more at: http://opendatacommons.org/licenses/odbl/#sthash.hMw4LgYT.dpuf).
2 Description of the experimental procedures
2.1 Measurement site
The measurement campaign was carried out at the riverRhine in Germany, close to the “Wunderland Kalkar” atRhine kilometre 843. Figure 1 shows a map of the mea-surement site. During the campaign emissions from both up-stream and downstream cruising inland ships were studied.The sampling point was located 50 m downwind from theriver bank.
It is reasonable to assume that the engines of the shipspassing the sampling site were under warm operation con-ditions.
2.2 Analytical equipment
The analytical equipment used was installed in a mobile vanwith an external power supply. NO and NO2 were measured
Atmos. Chem. Phys., 16, 14285–14295, 2016 www.atmos-chem-phys.net/16/14285/2016/

R. Kurtenbach et al.: Emissions of NO, NO2, and PM from inland shipping 14287
Figure 2. Temporal variation of the NO, NO2, O3 and CO2 concentration at the measurement site on 20 February 2013 from 11:30 to14:00 LT from different ship types (G= goods ship, T= petroleum tanker, PT= push–tow) and at different operation parameters (L= loaded,U= unloaded, A= upstream and D= downstream).
Figure 3. Plot of Ox vs. NOx .
online with a commercial NOx chemiluminescence analyser(Environnemental, AC 31M with molybdenum converter).The time resolution was 10 s and the detection limit, whichwas calculated from the variation of the zero signal, was2 ppbv for NO and 3 ppbv for NO2. The NO channel of in-strument was directly calibrated by diluted standard NO cal-ibration mixtures (Messer, stated accuracy 5 %). The NO2channel was calibrated by using a NO titration unit (Envi-ronnemental, GPT). NO2 was produced by the reaction of
NO with O3 in a flow reactor leading to the quantitative con-version of the calibrated NO (1NO=1NO2).
Ozone (O3) was measured online with a commercial O3monitor (Environnemental, O3 41M with UV absorption).The time resolution was 10 s and the detection limit, whichwas calculated from the variation of zero measurements, was1 ppbv. O3 was calibrated by using an O3 calibration unit(Environnemental; K-O3, accuracy 10 %). O3 was producedby the photolysis of synthetic air in a flow reactor, leading tothe quantitative formation of O3.
www.atmos-chem-phys.net/16/14285/2016/ Atmos. Chem. Phys., 16, 14285–14295, 2016

14288 R. Kurtenbach et al.: Emissions of NO, NO2, and PM from inland shipping
Figure 4. Temporal variation of CO2, PM10 and PM1 at the measurement site on 20 February 2013 from 11:50 to 12:10 LT for differ-ent ship types (G= goods ship, T= petroleum tanker) and different operation parameters (L= loaded, U= unloaded, A= upstream andD= downstream).
407
411
415
120
160
200
O2
[pp
mv]
[pp
bv]
; P
M1
[g
m-3
]
NO
NO2
T, L, A
CO2 = 161,100 ppbv s
G, L, A
T, U, D
G, L,
T, L, A
NO = 2,850 ppbv s
G, L, A
T, U, D
G, L, A
395
399
403
0
40
80
11:50 11:55 12:00 12:05 12:10
CO
NO
an
d N
O2
Time [hh:mm]
NO2
PM1 * 5
CO2
PM1 = 157 g m-3 s
NO2 = 650 ppbv s
Figure 5. Temporal variation of the NO, NO2, CO2 and PM1 concentration and the integrated emission peaks at 1NO, 1NO2, 1CO2 and1PM1 peak area at the measurement site on 20 February 2013 from 11:50 to 12:10 LT for goods-ship (G) under-loaded (L) and upstream(A) conditions.
Atmos. Chem. Phys., 16, 14285–14295, 2016 www.atmos-chem-phys.net/16/14285/2016/
R. Kurtenbach et al.: Emissions of NO, NO2, and PM from inland shipping 14289
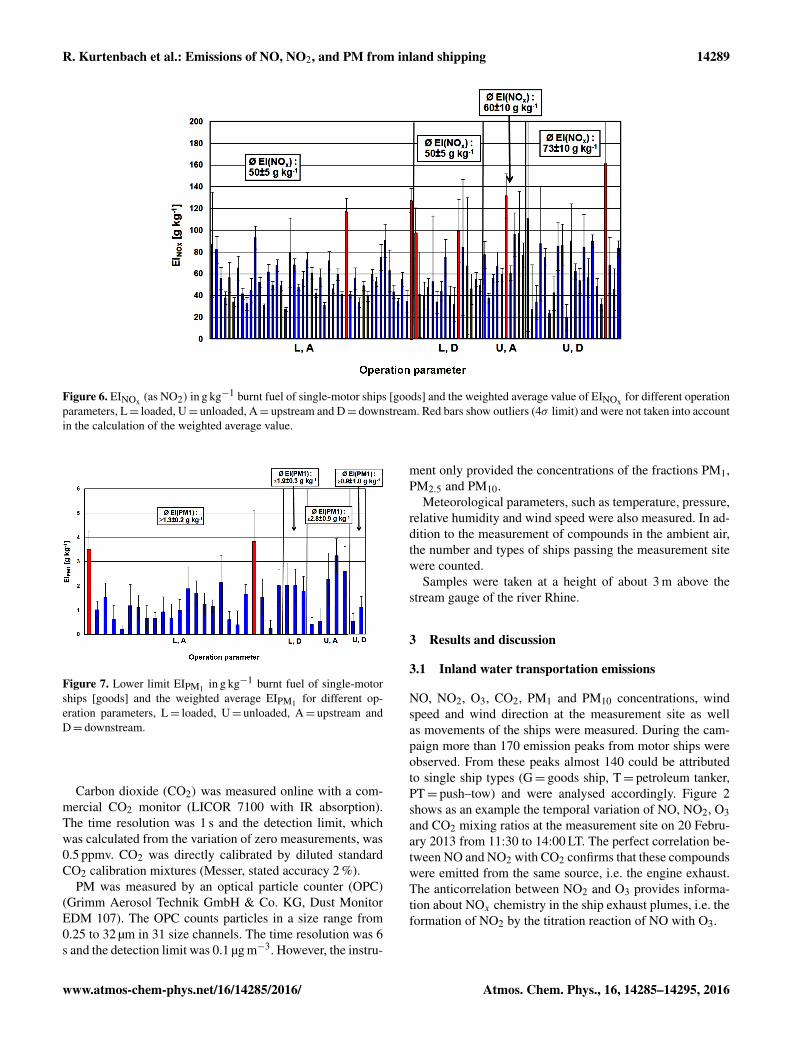
Figure 6. EINOx (as NO2) in g kg−1 burnt fuel of single-motor ships [goods] and the weighted average value of EINOx for different operationparameters, L= loaded, U= unloaded, A= upstream and D= downstream. Red bars show outliers (4σ limit) and were not taken into accountin the calculation of the weighted average value.
Figure 7. Lower limit EIPM1 in g kg−1 burnt fuel of single-motorships [goods] and the weighted average EIPM1 for different op-eration parameters, L= loaded, U= unloaded, A= upstream andD= downstream.
Carbon dioxide (CO2) was measured online with a com-mercial CO2 monitor (LICOR 7100 with IR absorption).The time resolution was 1 s and the detection limit, whichwas calculated from the variation of zero measurements, was0.5 ppmv. CO2 was directly calibrated by diluted standardCO2 calibration mixtures (Messer, stated accuracy 2 %).
PM was measured by an optical particle counter (OPC)(Grimm Aerosol Technik GmbH & Co. KG, Dust MonitorEDM 107). The OPC counts particles in a size range from0.25 to 32 µm in 31 size channels. The time resolution was 6s and the detection limit was 0.1 µg m−3. However, the instru-
ment only provided the concentrations of the fractions PM1,PM2.5 and PM10.
Meteorological parameters, such as temperature, pressure,relative humidity and wind speed were also measured. In ad-dition to the measurement of compounds in the ambient air,the number and types of ships passing the measurement sitewere counted.
Samples were taken at a height of about 3 m above thestream gauge of the river Rhine.
3 Results and discussion
3.1 Inland water transportation emissions
NO, NO2, O3, CO2, PM1 and PM10 concentrations, windspeed and wind direction at the measurement site as wellas movements of the ships were measured. During the cam-paign more than 170 emission peaks from motor ships wereobserved. From these peaks almost 140 could be attributedto single ship types (G= goods ship, T= petroleum tanker,PT= push–tow) and were analysed accordingly. Figure 2shows as an example the temporal variation of NO, NO2, O3and CO2 mixing ratios at the measurement site on 20 Febru-ary 2013 from 11:30 to 14:00 LT. The perfect correlation be-tween NO and NO2 with CO2 confirms that these compoundswere emitted from the same source, i.e. the engine exhaust.The anticorrelation between NO2 and O3 provides informa-tion about NOx chemistry in the ship exhaust plumes, i.e. theformation of NO2 by the titration reaction of NO with O3.
www.atmos-chem-phys.net/16/14285/2016/ Atmos. Chem. Phys., 16, 14285–14295, 2016

14290 R. Kurtenbach et al.: Emissions of NO, NO2, and PM from inland shipping
Figure 8. Weighted average emission index for NOx (EINOx) in g kg−1 burnt fuel for different motor ship types (G= goods, T= tankerand PT= push–tow) at different operation parameters (L= loaded, U= unloaded, A= upstream and D= downstream), in comparison withGerman guidelines (BinSchAbgasV, 2005 (yellow) and RheinSchUO, 2011 (green)).
3.2 NO2 / NOx emission ratio
The NO2 /NOx ratio in the exhaust plume is an importantparameter in obtaining information about the ship enginetypes and estimating the impact of ship emissions on ozoneformation. It is well known that diesel engines without af-tertreatment systems show NO2 /NOx ratios of 0.10–0.12for road traffic (Kurtenbach et al., 2001; Kousoulidou et al.,2008; Carslaw and Rhys-Tyler, 2013) and 0.14± 0.04 fornavigation (Cooper, 2001; Grice et al., 2009). In contrast,the NO2 /NOx ratio from road traffic diesel engines with af-tertreatment systems, such as oxidation catalyst or PM fil-ter systems, are in the range of 0.25–0.30. The NO2 /NOxemission ratio from navigation diesel engines with selec-tive catalytic NOx reduction systems (SCR) is 0.009± 0.003(Cooper, 2001).
To obtain the correct NO2 /NOx emission ratio from themeasurements it is important to distinguish between primar-ily emitted NO2 and NO2, which is formed by the reaction ofNO with ozone in the exhaust plume. The correct NO2 /NOxratio is obtained by plotting Ox , which is the sum of NO2 andO3 vs. the measured NOx concentration as shown in Fig. 3(Clapp and Jenkin, 2001). The NO2 /NOx emission ratioand the local O3 background mixing ratio are obtained fromthe slope and intercept of the regression line respectively.From the data shown in Fig. 3 a NO2 /NOx emission ratioof 0.08± 0.02 and a local ozone background volume mixingratio of 23± 2 ppbv were obtained. The obtained NO2 /NOxratio indicates that the ships passing the measurement site
were equipped with conventional diesel engines without ex-haust gas aftertreatment.
3.3 PM1 and PM10 emissions
Figure 4 shows the temporal variation of CO2, PM10 andPM1 concentrations at the measurement site on 20 Febru-ary 2013 from 11:50 to 12:10 LT. Some PM1 peaks are wellcorrelated with those of CO2 mixing ratios and therefore withship plumes. In contrast, some PM10 peaks showed no cor-relation with ship emissions. This indicates that the mainPM emissions from ships with diesel engines are in the PM1range. This result is in good agreement with other studies e.g.from the United States EPA (1996), Petzold et al. (2008),Beecken et al. (2014), Pirjola et al. (2014) and Westerlundet al. (2015). Therefore, in the present study particle shipemissions are defined as PM1. According to Westerlund etal. (2015) the maximum in the particle number size distribu-tion was observed at about 10 nm and the maximum particlemass distribution at 250 nm. Therefore, the optical particlecounter (OPC) used detects only a lower limit of the emittedparticle mass.
3.4 Emission indices
From the measurement data, emission indices (EIs) for NOx(NO calculated as NO2) and PM1 (unit: mass per kg burntfuel) were calculated. In Fig. 5 the integrated emission peak(peak area) for NO, NO2, CO2 and PM1 as 1NO, 1NO2,1CO2 and 1PM1 are shown as an example for a single-motor ship. If one assumes that the increase of NO, NO2,
Atmos. Chem. Phys., 16, 14285–14295, 2016 www.atmos-chem-phys.net/16/14285/2016/

R. Kurtenbach et al.: Emissions of NO, NO2, and PM from inland shipping 14291
PM1 and CO2 in the plume is proportional to the emis-sion strength of the ship engine, an emission ratio to CO2,e.g. 1NOx /1CO2, can be easily calculated (Petzold et al.,2008). In addition, the1NO,1NO2,1CO2 and1PM1 werealso calculated using the difference between background andplume mixing ratios (Schlager et al., 2008) and consideringthe precision errors of the background data, which are typ-ically ±2, ±4, ±2 ppbv, ±1 ppmv and ±2 µg m−3 for NO,NO2, O3, CO2 and PM1 respectively.
Both approaches were used to calculate the emissionindices and were in good agreement, in general betterthan± 6 %. Caused by the slightly different time responsesof the instruments, the integrated peaks results were finallyspecified. Elementary analysis of a typical ship diesel fuelyielded: 86 wt % carbon and 14 wt % hydrogen (Cooper,2001). From the wt % carbon and under the assumption thatall fuel is burnt to the final end product, CO2, an emission in-dex EI (CO2) of 3150 g CO2 per kg burnt fuel was calculatedand further used to calculate the corresponding emission in-dex (EI) for the ship engines. The emission index (EI) is cal-culated by the following equation (1) (Petzold et al., 2008):
EI(X)= EI(CO2)×M(X)
M(CO2)×
1(X)
1(CO2), (1)
where M denotes the molecular weight and 1 the peakarea, mixing ratios, column densities, etc. of the species.The subsequent calculations usedM (CO2) with 44 g mol−1,M (NOx) with 46 g mol−1 and NOx as NO2. Table S1 ofthe Supplement summarizes the calculated EIs of the differ-ent ship types and operation conditions. Errors were calcu-lated using error propagation for the different measured com-pounds.
As an example, Fig. 6 shows the emission index forNOx (as NO2) (EINOx) of single-motor ships [goods] andthe weighted average EINOx for different operation pa-rameters, i.e. L= loaded, U= unloaded, A= upstream andD= downstream.
As an example, Fig. 7 shows the obtained lower limitPM1 emission index (EIPM1) for single-motor ships [goods]and the weighted average EIPM1 for different operation pa-rameters, i.e. L= loaded, U= unloaded, A= upstream andD= downstream. Red bars show outliers (4σ limit) and werenot taken into account in the calculation of the weighted av-erage value. Values are lower limits because of the detectionrange of the OPC system.
Although Figs. 6 and 7 show a large variation in the EIs forNOx and PM1, the average data exhibit that the EINOx are al-most independent of engine operation parameters within thegiven error limits. The same was found for tankers and push–tows; see weighted average emission index in Figs. 8 and 9.
Figure 8 exhibits that the NOx emission indices of allmotor ship types investigated are above the engine rota-tion speed-dependent limit values of the German guide-lines, which are 29–37 g kg−1 for the RheinSchUO and 36–46 g kg−1 for the BinSchAbgasV guidelines.
Figure 9 exhibits that the obtained lower limit PM1 emis-sions values for almost all motor ship types are just withinthe limit values of the German guide lines, which are 0.9–3.1 g kg−1 for the RheinSchUO and 1.2–2.4 g kg−1 for theBinSchAbgasV guidelines, depending on the engine rotationspeed.
For comparison with literature data, uncertainty(2σ)-weighted averaged EINOx and EIPM1 were calculated forall motor ship types and operation condition investigated.An EINOx of 52± 3 g kg−1 and a lower limit EIPM1 of≥ 1.9± 0.3 g kg−1 were obtained. Minimum and maximumEIs for NOx and PM1 were found to be in the range of 20–161 and ≥ 0.2–8.1 g kg−1 respectively. Table 1 shows theemission indices for NOx and PM1 in g kg−1 fuel calculatedfrom the measured values in comparison with different liter-ature data. Errors were calculated using error propagation forthe different measured compounds.
Between 1998 and 2013 only a few studies reported EINOx
and EIPM1 from inland water navigation (Trozzi and Vac-caro, 1998; Kesgin and Vardar, 2001; Schweighofer andBlaauw, 2009; Van der Gon and Hulskotte, 2010) in therange 39–57 and 0.7–1.9 g kg−1 respectively; see Table 1.The uncertainty(2σ)-weighted averaged EINOx and EIPM1
were 48± 4 and 1.3± 0.2 g kg−1 respectively, which are ingood agreement with the present study.
Emission indices for NOx and PM1 from inland waternavigation were used in emission inventories by Klimontet al. (2002), Rohacs and Simongati (2007), Van der Gonand Hulskotte (2010), CBS (2009) and UBA (2013). Theauthors reported EINOx and EIPM1 in the range 46–51 and1.5–4.0 g kg−1 respectively (see Table 1). From these datauncertainty(2σ)-weighted average values for EINOx of 48± 2and EIPM1 2.7± 1.2 g kg−1 were derived, which are in a goodagreement with the present study.
In order to comply with the limit values of the currentRheinSchUO guideline for inland water navigation for NOxwith 29–37 g kg−1, a further significant reduction of NOxemission is necessary. This can be achieved by using ex-haust gas aftertreatment systems, whose functional capa-bility have been demonstrated in recent studies (Cooper,2001; Schweighofer and Blaauw, 2009; BMVBS, 2012; Fu-ture Carrier, 2012; Hallquist et al., 2013; Pirjola et al.,2014). For example, the European project “Cleanest Ship”(Schweighofer and Blaauw, 2009) shows that NOx and PMemissions of a ship diesel engine equipped with an SCR (se-lective catalytic reduction) system and particle filter can bereduced to 4 and 0.02 g kg−1 respectively.
4 Summary and conclusion
The present study shows that the measurement site on theRhine river provided representative real world emission datafrom inland navigation. Emissions of NO, NO2, CO2 andparticulate matter from a large number of individual ships
www.atmos-chem-phys.net/16/14285/2016/ Atmos. Chem. Phys., 16, 14285–14295, 2016

14292 R. Kurtenbach et al.: Emissions of NO, NO2, and PM from inland shipping
Figure 9. Weighted average lower limit emission index for PM1 (EIPM1) in g kg−1 burnt fuel for different motor ship types (G= goods,T= tanker and PT= push–tow) at different operation parameters (L= loaded, U= unloaded, A= upstream and D= downstream), in com-parison with German guidelines (BinSchAbgasV, 2005 (yellow) and RheinSchUO, 2011 (green)).
Table 1. Emission indices NOx and PM1 in g kg−1 burnt fuel calculated from the measured values in comparison with different literaturedata from inland water transportation.
Reference Location Sampling EINOx EIPM1 Ship typesperiod (g kg−1) (g kg−1)
(a) field measurements (inland, engine without exhaust gas aftertreatment system)
This study Germany, Rhine (in-land)
2013 54± 4 ≥ 2.0± 0.3 different
Kesgin and Vardar (2001) Turkey, Bosporus (in-land)
1998 57 1.2 domestic passengerships (a)
Trozzi and Vaccaro (1998) Italy, Tyrrhenian Sea(inland)
1998 51 1.2 domestic passengerships (a)
Van der Gon and Hulskotte (2010) Netherlands (inland) 2010 45 1.9 differentSchweighofer and Blaauw (2009) inland 2009 39 0.73 research vessel (b)
(b) field measurements (inland, engine with exhaust gas aftertreatment system)
BMVBS (2012) inland 2011 n.d. 0.08–0.48 research vesselFutura Carrier (2010) inland 2009 n.d. 0.29± 0.01 research vesselSchweighofer and Blaauw (2009) inland 2009 11–39 0.02 research vessel (c)
(c) inventories
Rohacs and Simongati (2007) Average EU (inland) 2007 47 3.2 inventoryVan der Gon and Hulskotte (2010), CBS (2009) Netherlands (inland) 2008–2009 46 1.9 inventoryKlimont et al. (2002) RAINS, EU (inland) 2002 51 4.0 inventoryUBA (2013) TREMOD, Germany
(Inland)2013 49± 6 1.5± 0.2 inventory
Remarks: n.d. is no data, (a) domestic passenger ships with diesel engine (medium speed), (b) without exhaust gas aftertreatment system, (c) with exhaust gas aftertreatment system.
were monitored and analysed. Particulate emissions mea-sured in the ship plumes were dominated by PM1. An av-
erage NO2 /NOx emission ratio of 0.08± 0.02 was ob-tained, which is typical for ship diesel engines without af-
Atmos. Chem. Phys., 16, 14285–14295, 2016 www.atmos-chem-phys.net/16/14285/2016/

R. Kurtenbach et al.: Emissions of NO, NO2, and PM from inland shipping 14293
tertreatment systems such as oxidation catalysts or PM fil-ter systems. The emission indices for emitted mass of pol-lutant per kg burnt fuel for NOx (EINOx) and PM1 (EIPM1),which were determined for different motor ship types (goods,petroleum tanker and push–tow) and for different opera-tion parameters (L= loaded, U= unloaded, A= upstreamand D= downstream), exhibited a large variation and werealmost independent of the ship types and operation parame-ters. For the motor ship types and operation conditions inves-tigated, a weighted average EINOx of 54± 4 g kg−1 and lowerlimit EIPM1 of ≥ 2.0± 0.3 g kg−1 were obtained with mini-mum and maximum values ranging from 20 to 161 g kg−1 forNOx and≥ 0.2 to 8.1 g kg−1 for PM1 respectively. The EINOx
and EIPM1 from the present study are in a good agreementwith literature data. The comparison of emission indicesfor NOx and PM1 with limit values of the German guide-lines (BinSchAbgasV, 2005; RheinSchUO, 2011) showedthat NOx emissions of all motor ship types investigated wereabove the limit values, whereas the obtained lower limit PM1emissions for almost all motor ship types were just within thelimit values. In order to meet the limit values for NOx andPM, the NOx emissions in particular have to be reduced sig-nificantly, e.g. by the introduction of specific exhaust gas af-tertreatment systems, some of which have proven to be veryeffective.
Future campaigns should include PM size distributionand also CO, SO2 and NMVOC measurements. Campaignsshould be carried out different seasons to study a potentialimpact of water level and river streaming on the emissions.
5 Data availability
All data are available upon request to the authors.
The Supplement related to this article is available onlineat doi:10.5194/acp-16-14285-2016-supplement.
Edited by: A. PetzoldReviewed by: P. Sturm and one anonymous referee
References
Alföldy, B., Lööv, J. B., Lagler, F., Mellqvist, J., Berg, N., Beecken,J., Weststrate, H., Duyzer, J., Bencs, L., Horemans, B., Cav-alli, F., Putaud, J.-P., Janssens-Maenhout, G., Csordás, A. P.,Van Grieken, R., Borowiak, A., and Hjorth, J.: Measurementsof air pollution emission factors for marine transportation inSECA, Atmos. Meas. Tech., 6, 1777–1791, doi:10.5194/amt-6-1777-2013, 2013.
Atkinson, R.: Atmospheric chemistry of VOCs and NOx ., Atmos.Environ., 34, 2063–2101, 2000.
Beecken, J., Mellqvist, J., Salo, K., Ekhol, J., and Jalkanen, J.-P.: Airborne emission measurements of SO2, NOx and particlesfrom individual ships using a sniffer technique, Atmos. Meas.Tech., 7, 1957–1968, doi:10.5194/amt-7-1957-2014, 2014.
Binnenschifffahrt Abgasverordnung (BinSchAbgasV9, 2005):Richtlinie EU2004/26/EG, http://eur-lex.europa.eu/LexUriServ/LexUriServ.do?uri=OJ:L:2004:225:0003:0107:DE:PDF (lastaccess: 4 November 2016) 2005.
BMVBS: Bundesministerium für Verkehr, Bau und Stadtentwick-lung: Erprobung von Partikelfilter für den Einsatz in der Binnen-schifffahrt, Projektbericht, http://www.bmvbs.de (last excess: 4November 2016), Berlin, Germany, 2012.
Browning, L. and Bailey, K.: Current Methodolgies and Best Prac-tices for Preparing Port Emission Inventories, ICF Consultingand EPA, Fairfax, Virginia, USA, Final Report for US, 2006.
Bundesverband der Deutschen Binnenschifffahrt e.V. (BDA):Daten und Fakten 2014/2015, http://binnenschiff.de/content/wp-content/uploads/2015/08/150827-Daten-Fakten-2014-2015.pdf (last excess: 4 November 2016), Duisburg, Germany, 2015a.
Bundesverband der Deutschen Binnenschifffahrt e.V. (BDA):Pressemitteilung http://bdbev.de/aktuell/2015/150205_Binnenschifffahrt_boomt_im_Rheinkorridor.pdf (last excess: 4November 2016), Duisburg, Germany, 2015b.
Carslaw, D. C. and Rhys-Tyler, G.: New insights from comprehen-sive on-road measurements of NOx , NO2 and NH3 from vehicleemissions remote sensing in London, UK, Atmos. Environ., 81,339–347, 2013.
CBS, StatLine.: Luchtverontreinigung, emission naar luct, CBS,Den Haag/Heerlen, the Netherlands, 2009.
Chameides, W. L., Fehsenfeld, F., Rodgers, M. O., Cardelino, C.,Martinez, J., Parrish, D., Lonneman, W., Lawson, D. R., Ras-mussen, R. A., Zimmerman, P., Greenberg, J., Middleton, P., andWang, T.: Ozone Precursor Relationships in the Ambient Atmo-sphere, J. Geophys. Res., 97, 6037–6055, 1992.
Chen, G., Huey, L. G., Trainer, M., Nicks, D., Corbett, J., Ryerson,T., Parrish, D., Neuman, J. A., Nowak, J., Tanner, D., Holoway,J., Brock, C., Crawford, J., Olson, J. R., Sullivan, A., Weber,R., Schauffler, S., Donnelly, S., Atlas, E., Roberts, J., Flocke, F.,Hübler, G., and Fehsenfeld, F.: An investigation of the chemistryof ship emission plumes during ITCT 2002, J. Geophys. Res.,110, D10S90, doi:10.1029/2004JD005236, 2005.
Clapp, L. J. and Jenkin, M. E.: Analysis of the relationship betweenambient levels of O3, NO2 and NO as a function of NOx in UK,Atmos. Environ., 35, 6391–6405, 2001.
Cooper, D. A.: Exhaust emissions from high speed passenger fer-ries, Atmos. Environ., 35, 4189–4200, 2001.
Cooper, A. D.: Exhaust emissions from ships at berth, Atmos. Env-iron., 37, 3817–3830, 2003.
Cooper, D. A. and Andreasson, K.: Predictive NOx emission mon-itoring on board a passenger ferry, Atmos. Environ., 33, 4637–4650, 1999.
Cooper, D. A. and Ekström, M.: Applicability of the PEMS tech-nique for simplified NOx monitoring on board ships, Atmos. En-viron., 39, 127–137, 2005.
Cooper, D. A., Peterson, K., and Simpson, D.: Hydrocarbon, PAHand PCB emissions from ferries: a case study in the Skagerak-Kattegatt-Oresund region, Atmos. Environ., 30, 2463–2473,1996.
www.atmos-chem-phys.net/16/14285/2016/ Atmos. Chem. Phys., 16, 14285–14295, 2016

14294 R. Kurtenbach et al.: Emissions of NO, NO2, and PM from inland shipping
Dutch Transport Research Centre (DTRC): Inland Shipping Emis-sions Protocol, EMS-protocol – emissies door de binnenvaart:verbrandingsmototren versie 3, Rotterdam 22 November 2003,the Netherlands, 2003.
European Commission: White paper 2011, 52011DC0144:Roadmap to a Single European Transport Area – Towards a com-petitive and resource efficient transport system, SEC(2011)391final, http://eur-lex.europa.eu/legal-content/EN/TXT/?qid=1433420196688&uri=CELEX:52011DC0144 (last access: 4November 2016), 2011.
European Commission Transport (ECT): Inland waterways, Whatdo we want to achieve?, http://ec.europa.eu/transport/modes/inland/index_en.html (last access 4 November 2016), 2015.
Eyring, V., Köhler, H. W., van Aadenne, J., and Lauer, A.: Emis-sions from international shipping: 1. The last 50 years, J. Geo-phys. Res., 110, D17305, doi:10.1029/2004JD005619, 2005.
Eyring, V., Isaksen, I. S. A., Berntsen, T., Collins, W. J., Corbett,J. J., Endresen, O., Grainger, R. G., Moldanova, J., Schlager, H.,and Stevenson, D. S.: Transport impact on atmosphere and cli-mate: Shipping, Atmos. Environ., 44, 4735–4771, 2010.
FUTURE Carrier: New Logistics® GmbH: http://www.new-logistics.de/new-logistics/pdf/uebersichtsbroschuere.pdf(last access: 2 November 2015), 2012.
Grice, S., Stedman, J., Kent, A., Hobson, M., Norris, J., Abbott, J.,and Cooke, S.: Recent trends and projections of primary NO2emissions in Europe, Atmos. Environ., 43, 2154–2167, 2009.
Hallquist, A. M., Fridell, E., Westerlund, J., and Hallquist, M.:Onboard Measurements of Nanoparticles from a SCR-EquippedMarine Diesel Engine, Environ. Sci. Technol., 47, 773–780,2013.
International Maritime Organisation (IMO): Nitrogen Oxides –Regulation 13, http://www.imo.org/en/OurWork/Environment/PollutionPrevention/AirPollution/Pages/Nitrogen-oxides-(NOx)-%E2%80%93-Regulation-13.aspx (last access: 4 November2016), London, United Kingdom, 2012.
Jonsson A. M., Westerlund, J., and Hallquist, M.: Size-resolved par-ticle emission factors for individual ships, Geophys. Res. Lett.,38, L13809, doi:1029/2011GL047672, 2011.
Kesgin, U. and Vardar, N.: A study on exhaust gas emissions fromships in Turkish Straints, Atmos. Environ., 35, 1863–1870, 2001.
Klimont Z., Cofala, J., Bertok, I., Aman, M., Heyes, C., and Gyat-fas, F.: Modelling Particulate Emissions in Europe, A Frameworkto Estimate Reduction Potential and Control Costs, Intermin Re-port IR-02-076, IIASA, Laxenburg, 2002.
Kousoulidou, M., Nitziachristos, L., Mellios, G., and Samaras, Z.:Road-transport emission projections to 2020 in European urbanenvironmentals, Atmos. Environ., 42, 7465–7475, 2008.
Kurtenbach, R., Becker, K. H., Gomes, J. A. G., Kleffmann, J.,Lörzer, J. C., Spittler, M, Wiesen, P., Ackermann, R., Geyer,A., and Platt, U.: Investigations of Emissions and HeterogeneousFormation of HONO in a Road Traffic Tunnel, Atmos. Environ.,35, 3385–3394, 2001.
Lack, D. A., Cappa, Ch. D., Langridge, J., Bahreini, R., Buf-faloe, G., Brock, Ch., Cerully, K., Coffman, D., Hyden, K., Hol-loway, J., Lerner, B., Massoli, P., Li, Sh.-M., Middlebrook, A.N., Moore, R., Nenes, A., Nuaaman, I., Onasch, Th. B., Peischl,J., Perring, A., Quinn, P. K., Ryerson, T., Schwartz, J. P., Spack-man, R., W. St. C., Worsnop, D., Xiang, B., and Williams, E.: Im-pact of Fuel Quality Regulation and Speed Reductions on Ship-
ping Emission: Implications for Climate and Air Quality, Envi-ron. Sci. Technol., 45, 9052–9060, 2011.
Moldanova, J., Fridell, E., Popovicheva, O., Demirdjian, B.,Tishkova, V., Faccinetto, A., and Focsa, C.: Characterisation ofparticulate matter and gaseous from a large ship diesel engine,Atmos. Environ., 43, 2632–2641, 2009. Murphy, S. H., Agrawal,H., Sorooshian, A., Padro, L. t., Gates, H., Hersey, S., Welch, W.A., Jung, H., Miller, J. W., Cocher III, D. R., Nenes, A., Jonsson,H., Flagan, R. C., and Seinfeld, J. H.: Comprehensive Simulta-neous Shipboard and Airbore Characterization of Exhaust from aModern Container Ship at Sea, Environ. Sci. Technol., 43, 4626–4640, 2009.
Petzold, A., Hasselbach, J., Lauer, P., Baumann, R., Franke, K.,Gurk, C., Schlager, H., and Weingartner, E.: Experimental stud-ies on particle emissions from cruising ship, their characteris-tic properties, transformation and atmospheric lifetime in themarine boundary layer, Atmos. Chem. Phys., 8, 2387–2403,doi:10.5194/acp-8-2387-2008, 2008.
Pirjola, L., Pajunoja, A., Walden, J., Jalkanen, J.-P., Rönkkö, T.,Kousa, A., and Koskentalo, T.: Mobile measurements of shipemissions in two harbour areas in Finland, Atmos. Meas. Tech.,7, 149–161, doi:10.5194/amt-7-149-2014, 2014.
RheinSchUO: Zentralkommission für die Rheinschifffahrt:http://www.ccr-zkr.org/files/documents/reglementRV/rv1a_122015.pdf#search=%22Emissionsgrenzwerte%20NOx%22(last access 4 November 2016), Strasbourg, France, 2011.
Rohacs, J. and Simongati, G.: The role of inland water navigation ina sustainable transport system, TRANSPORT – 2007, Vol XXII,148–153, doi:10.1080/16484142.2007.9638117, 2007.
Schlager, H., Baumann, R., Lichtenstern, M. Petzold, A., Arnold, F.,Speidel, M., Gurk, C., and Fischer, H.: Aircraft-based trace gasmeasurements in a primary European corridor, in: Proceedingsof the International Conference on Transport, Atmosphere andClimate (TAC), Oxford, UK, 83–88, 2008.
Schrooten, L., De Vlieger, I., Panis, L. I., Chiffi, C., and Pastori, E.:Emission of maritime transport: A European reference system,Sci. Total Environ., 408, 318–323, 2009.
Schweighofer, J. and Blaauw, H.: The Cleanest Ship, Final Report,Österreichische Wasserstraße GmbH and Maritime ResearchInstitute Netherlands, https://www.researchgate.net/publication/273447753_FINAL_REPORT_THE_CLEANEST_SHIP_PROJECT (last access 4 November 2016), Wageningen, theNetherlands, 2009.
Sinha, P., Hobbs, P. V., Yokelson, R. J., Christian, T. J., Kirchstetter,T. W., and Bruintjes, R.: Emissions of trace gases and particlesfrom two ships in southern Atlantic Ocean, Atmos. Environ., 37,2139–2148, 2003.
Trends: Calculation of indicators of environmental pressure causedby transport: main report. European Commission, Office forOfficinal Publications of European Communities, Luxembourg,2003.
Trozzi, C. and Vaccaro, R.: Methodologies for estimating air pol-lutant emissions from ships, Technical Report MEET. (Method-ologies for Estimating Air Pollutant Emissions from Transport)RF98, European Community, 1998.
Tzannatos, E.: Ship emissions and their externalities for the port ofPiraeus – Greece, Atmos. Environ., 44, 400–407, 2010.
Atmos. Chem. Phys., 16, 14285–14295, 2016 www.atmos-chem-phys.net/16/14285/2016/
R. Kurtenbach et al.: Emissions of NO, NO2, and PM from inland shipping 14295
UBA: Aktualisierung der Emissionsberechnung für die Binnen-schifffahrt und Übertragung der Daten in TREMOD, Umwelt-bundesamt, Endbericht, 371145105, Berlin, Germany, 2013.
US Environmental Pretection Agency: Compilation of air pollu-tant emission factors-AP42, 5th Edn. (Chapter 3.4 Large Sta-tionary Diesel Engines) Office of the Federal Register NationalArchives and Records Aministration, US Government PrintingOffice, Washington, DC, USA, 1996.
Van der Gon, H. D. and Hulskotte, J.: Methodologies for estimat-ing shipping emissions in the Netherlands, A documentation ofcurrently used emission factors and related activity data, BOP re-port, Netherlands Environmental Assessment Agency, Bilthoven,the Netherlands, 2010.
Van der Werf, H.: LNG as Fuel in Inland Navigation. Secre-tary General. Central Commission for the Navigation of theRhine (CCNR), http://www.mariko-leer.de/cms_uploads/files/hans-van-der-werf-zkr.pdf (last access 4 November 2016), Stras-bourg, France, 2013.
Versuchsanstalt für Binnenschifffahrt e. V. (VBD): Emissio-nen luftverunreinigender Stoffe durch den Schiffverkehr inNordrhein-Westfalen – Ein Modell zur Berechnung der Schad-stoffverteilung auf Wasserstraßen, in Schleusen und Häfen, 2001.
Westerlund, J., Hallquist M., and Hallquist A. S.: Characterizationof fleet emissions from ships through multi individual determina-tion of size-resolved particle emissions in a coastal area, Atmos.Environ., 112, 159–166, 2015.
Williams, E. J., Lerner, B. M., Murphy, P. C., Herdon, S. C.,and Zahniser, M. S.: Emissions of NOx , SO2, CO, and HCHOfrom commercial marine shipping during Texas Air Qual-ity Study (TexAQS) 2006, J. Geophys. Res., 114, D21306,doi:10.1029/2009JD012094, 2009.
www.atmos-chem-phys.net/16/14285/2016/ Atmos. Chem. Phys., 16, 14285–14295, 2016